Submitted:
06 January 2026
Posted:
07 January 2026
You are already at the latest version
Abstract
Two major global trends shaping 21st-century society are population aging and urbanization. Consequently, the living conditions of older adults have become an increasing focus of societal attention. Social interaction plays a crucial role in the mental health, emotional well-being, and social identity of older adults. Urban streets, as key sites for walking and social activity among older adults, can be seen as extensions of their homes—places where they regularly interact with neighbors and build new connections. Compared to built environments often termed "gray spaces," exposure to green spaces has been shown to offer greater benefits to residents' well-being. Among streetscape features, the Spatial Openness Level is closely associated with the psychological well-being of elderly individuals. The Gray-Green space Exposure Ratio (GER) and Spatial Openness Level(SOL) serve as key indicators for evaluating streetscape quality. In this study, conducted in Wuhan City, objective physiological monitoring of brainwave activity was employed to examine the responses of older adults to variations in GER and SOL. The results indicate that both GER and SOL significantly influence the emotional states of older adults.(correlation coefficient R² = 0.6062, p < 0.01) .These findings can inform human-centered urban design criteria, thereby promoting social interaction among older adults. Future research should incorporate additional environmental factors to establish a more comprehensive assessment framework for age-friendly urban spaces.
Keywords:
older adults
; the Gray-Green space Exposure Ratio (GER)
; Spatial Openness Level(SOL)
; EEG
; social interaction
1. Introduction
Social interaction plays a crucial role in the mental health, emotional well-being, and social identity of older adults.[1] It serves not only as a channel for emotional exchange and support but also as a foundation for an individual’s sense of belonging and social identity. [2]With rapid social development and urbanization, particularly in East Asian regions such as China, Japan, and South Korea, a distinct “aging society” phenomenon has emerged.[3] The lifestyles, psychological states, and social behaviors of older adults have thus attracted widespread attention and research.[3]
Two major global trends shaping the 21st century are population aging and urbanization.[4] The age distribution of the world’s population is undergoing profound change. [5]As mortality and fertility rates decline, the population structure is gradually shifting toward older age groups. Over the next 45 years, the global population aged 60 and above is projected to double. [6]By 2050, one-third of Europe’s population will be over 60 years old. [5]In low- and middle-income countries, the growth rate of the older population is even faster than in high-income countries.[5] According to the latest 2020 census in China, the proportion of the population aged 65 and above has reached nearly 14%, indicating that China is entering an aging society.[6]
The World Health Organization (WHO) emphasizes the street as an indispensable space for local aging, as most active living behaviors among older adults revolve around and depend on urban streets. [7]Active behaviors such as walking and cycling, as well as social interaction, are widely recognized as beneficial to the physical and mental health of older adults. [8]Increased social interaction among older adults can reduce feelings of isolation and lower the risks of depression, anxiety, and chronic diseases. Urban streets, as key sites for walking and social activity among older adults, can be seen as extensions of their homes—places where they regularly interact with neighbors and build new connections.[9] In densely populated cities, especially in China, streets play an even more vital role in promoting social interaction and physical activity among older adults, thereby significantly contributing to their overall well-being. [9]Therefore, how to plan and designing urban streets to enhance their vibrancy and appeal is essential for fostering active lifestyles among older adults.
The quality of the physical street environment, including its built and natural elements, directly influences residents’ walking preferences.[10] Urban gray space, defined as areas composed of non-natural surfaces such as built-up areas, is where residents are primarily exposed to negative environmental factors, including air pollution resulting from urbanization driven by land-use changes, human settlement patterns, and behavioral practices. [11]Streets, serving as the primary public spaces for outdoor activities in cities, are a key representation of urban gray space. [12]In contrast, green space, characterized by natural elements such as vegetation, can mitigate the negative effects of exposure to gray environments and provide residents with a sense of well-being and other positive benefits. [13]Land partially or fully covered by grass, trees, shrubs, or other vegetation is generally classified as green space. [14]Over the past three decades, a substantial body of research, though not entirely conclusive, suggests that exposure to green spaces has positive effects on human health and well-being.[15]
Existing studies often use the Gray-Green space Exposure Ratio (GER) to assess street quality, while Spatial Openness Level(SOL) serves as another important metric. [11]Spatial Openness Level, measured by sky visibility, determines ambient brightness and significantly affects visual perception.[16] For instance, Li et al. evaluated Spatial Openness Level (SOL) using sky view factor. Enhancing Spatial Openness Level can increase the attractiveness of street scenes and improve the comfort of public activities.[17]Areas with low SOL are typically surrounded by buildings, corresponding to central business districts and other urban cores. [18]Both the GER and SOL can quantify urban street quality by reflecting the relative exposure to artificial versus natural spaces and their imbalanced relationship—a measure that may reveal whether older adults face reduced access to natural environments amid rapid urbanization.[19]
Previous research has employed population-weighted exposure assessment methods to quantify Chinese urban residents’ exposure to gray and green spaces in the early 21st century (2000–2019).[11] This approach effectively accounts for spatial heterogeneity in environmental supply and demand, as well as uneven population distribution, thereby accurately reflecting the actual exposure levels of large populations. Based on a survey assessing environmental conditions and interactive behaviors among older adults in the Netherlands, participatory video research has been shown to yield rich data on the age-friendliness of cities and the experiences, preferences, and needs of older residents, confirming the link between urban landscapes and the lived experience of aging. [20]By combining the KJ method and CFA, one study concluded that lower residential density, better aesthetic quality, and higher street connectivity encourage older adults to walk more frequently.[21]However, few studies have concurrently analyzed the relationship between the Gray-Green space Exposure Ratio (GER) and Spatial Openness Level(SOL), nor have they used emotional responses of older adults to evaluate street quality.
Electroencephalography (EEG) has been widely applied in architectural and environmental design research, offering significant advantages. For example, Zhang et al. [22] used EEG to identify user preferences for architectural design images, assisting designers in evaluating design proposals. Erkan [23] employed VR and EEG to investigate factors influencing users’ wayfinding behavior in buildings. One of the earliest EEG-based emotion recognition methods was proposed by Musha et al. [24], who defined an emotion matrix to transform EEG features into quaternion emotion vectors corresponding to four basic emotions, enabling real-time emotion analysis with a maximum temporal resolution of 0.64 seconds. Karandinou et al. [25] explored the relationship between physical attributes around buildings and participants’ brain activity through synchronized EEG and video recording. Relevant neuroscience studies indicate that current EEG devices can analyze brainwaves across frequencies such as δ, θ, α, β, and γ, with the α/β ratio considered a suitable indicator for environmental responsiveness [22]. Bové used α and β band analysis to assess the attractiveness of public landscapes, highlighting the importance of fragmentation scale in evaluating visual richness, building density, or urban composition.[26] Chen Z applied EEG technology in multi-scene experiments, comparing psychological changes in urban versus natural environments using EEG, and preliminarily established an experimental framework for identifying cognitive patterns during landscape traversal.[27]
Despite growing evidence underscoring the importance of street environments in supporting active lifestyles, few studies have explored the relationship between EEG variations and social interaction among older adults living in these environments. [28,30]Although substantial research exists on the benefits of urban streets and social interaction for older adults, few investigations have quantitatively examined the relationship between the Gray-Green space Exposure Ratio (GER), Spatial Openness Level(SOL), and their specific effects on older adults—particularly in terms of environmental attractiveness and emotional impact—from an EEG perspective. This study employs EEG monitoring to analyze fluctuations in emotional responses among older adults to changes in GER and SOL, thereby contributing to the promotion of healthy aging and the planning of age-friendly cities.
This study aims to investigate the effects of the Gray-Green space Exposure Ratio (GER) and Spatial Openness Level(SOL) in urban streets on emotional interactions among older adults, and to understand how street landscapes can be linked to their psychological well-being to maximize benefits. Its goal is to provide a more scientific basis for the planning and design of urban streets, enhance the well-being of older adults, and address mental health concerns. Based on this, the specific scientific issues explored in this paper are as follows:
• (1) Is there an association between the Gray-Green space Exposure Ratio (GER), Spatial Openness Level(SOL), and the positive emotions of older adults during social interaction?
• (2) Does the Gray-Green space Exposure Ratio (GER) significantly influence emotional variations in older adults?
• (3) Does Spatial Openness Level(SOL) significantly affect the emotions of older adults?
2. Methods
This study employed a within-subjects experimental design to examine how urban public spaces influence the emotional perception of older adults. The experiment combined electroencephalographic (EEG) monitoring and subjective psychological assessment. Data were collected from January to June 2025, with older adults recruited from 20 communities in Wuhan, Hubei Province.
2.1. Study Area and Pathways
The research path of this study specifically consists of three aspects: identifying the object of study, data acquisition and processing, and analysis of the experimental procedures. The flowchart is shown in Figure 1.
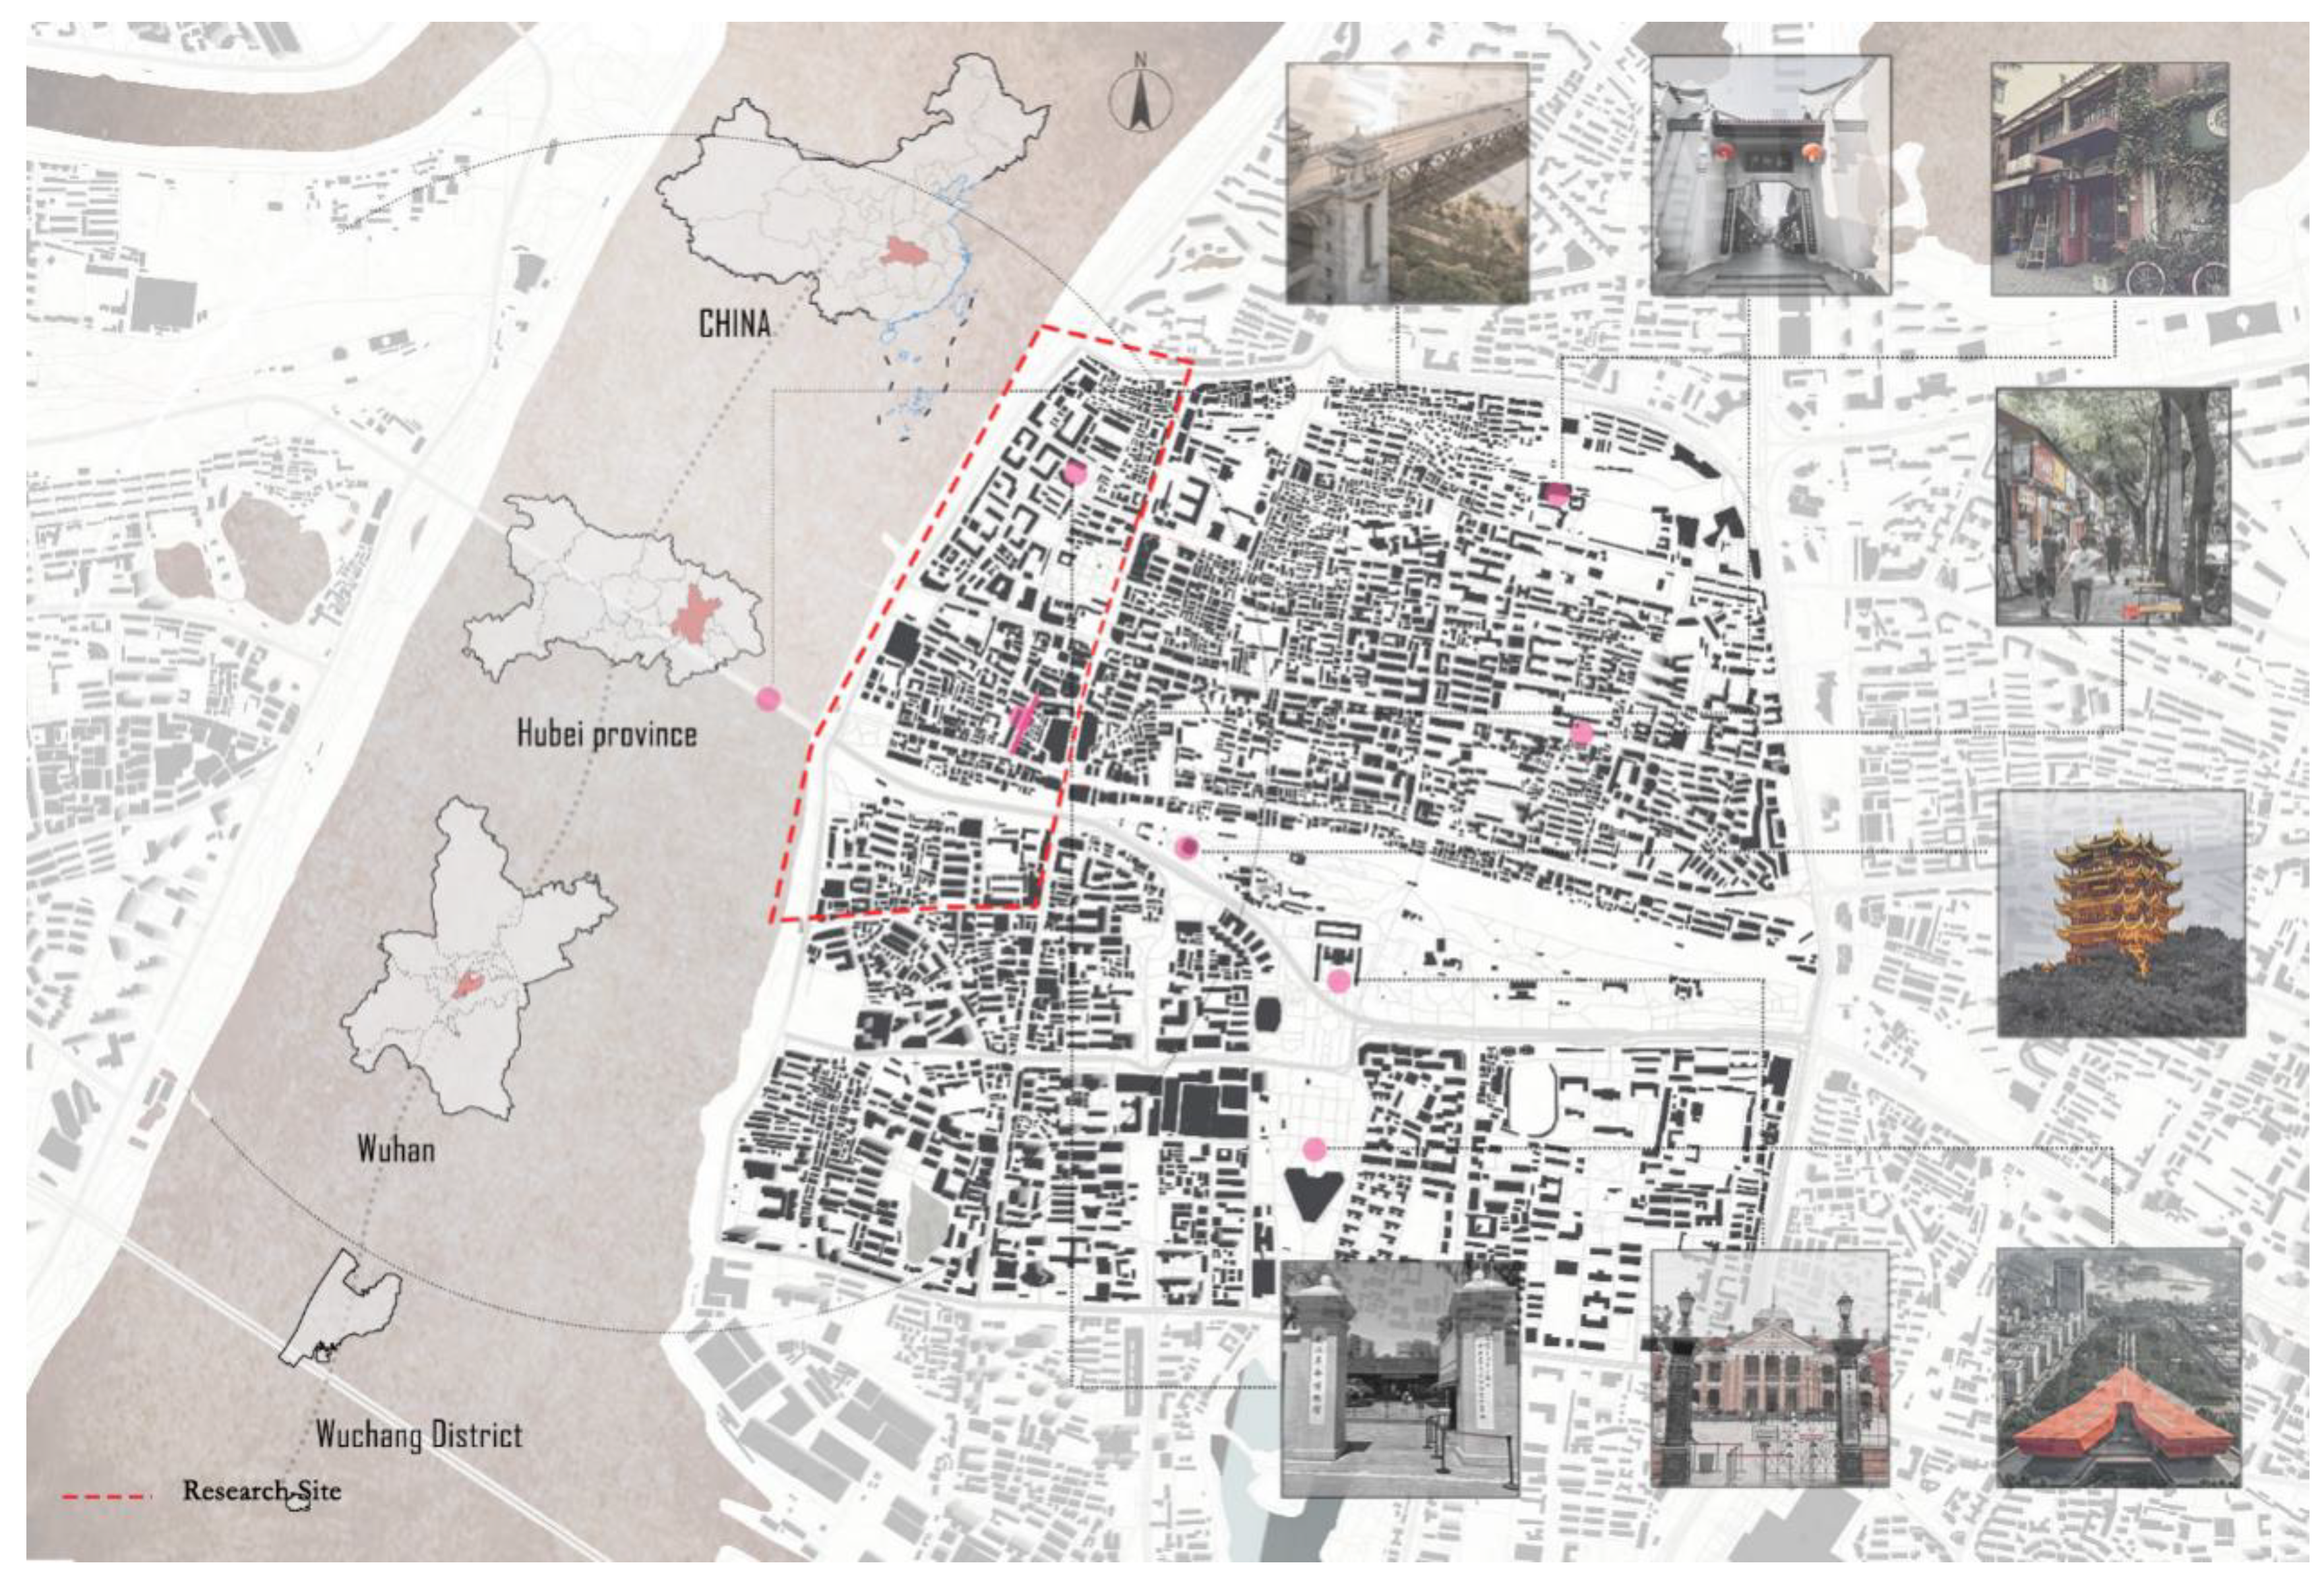
Wuhan, the capital city of Hubei Province, China, has a population of approximately 10 million and covers an area of about 8,500 square kilometers. From economic, cultural, and historical perspectives, it serves as a central hub in central China and is recognized as an International Wetland City. [29]In Wuhan, the population aged 65 and above is around 1.6 million, classifying the city overall as moderately aging. From 2005 to 2025, the level of urban greening in Wuhan grew rapidly, significantly exceeding the national average; furthermore, the per capita growth rate of park green space in Wuhan is also higher than the national average. These conditions make the levels of the Gray-Green space Exposure Ratio (GER) and Spatial Openness Level(SOL) in Wuhan’s urban streets worthy of investigation and analysis. Based on the above context, this study focuses on older adults aged 60 and above in Wuhan, with the GER and SOL of more than 20 streets selected as research samples.
Figure 2.
Research Site.
2.2. Study Subjects
The research team selected experimental sites from over 40 streets in Wuhan, Hubei Province, based on two key spatial elements: Spatial Openness Level(SOL) and the Gray-Green space Exposure Ratio (GER).SOL was categorized into three types according to spatial enclosure characteristics: open space, semi-open space, and closed space. The classification was defined based on the presence of buildings within specific radii from the camera’s central point: a space was defined as closed if buildings surrounded the area within a 5-meter radius; as semi-open if buildings were present within a 5- to 10-meter radius; and as open if no buildings were present within a 10-meter radius.[31]The Gray-Green space Exposure Ratio (GER) was categorized by comparing the proportional areas of buildings versus vegetation in the visual field, resulting in three types: grey space, semi-grey and semi-green space, and green space. Following predefined environmental variable criteria and visual element composition ratios.[11](Table 1)
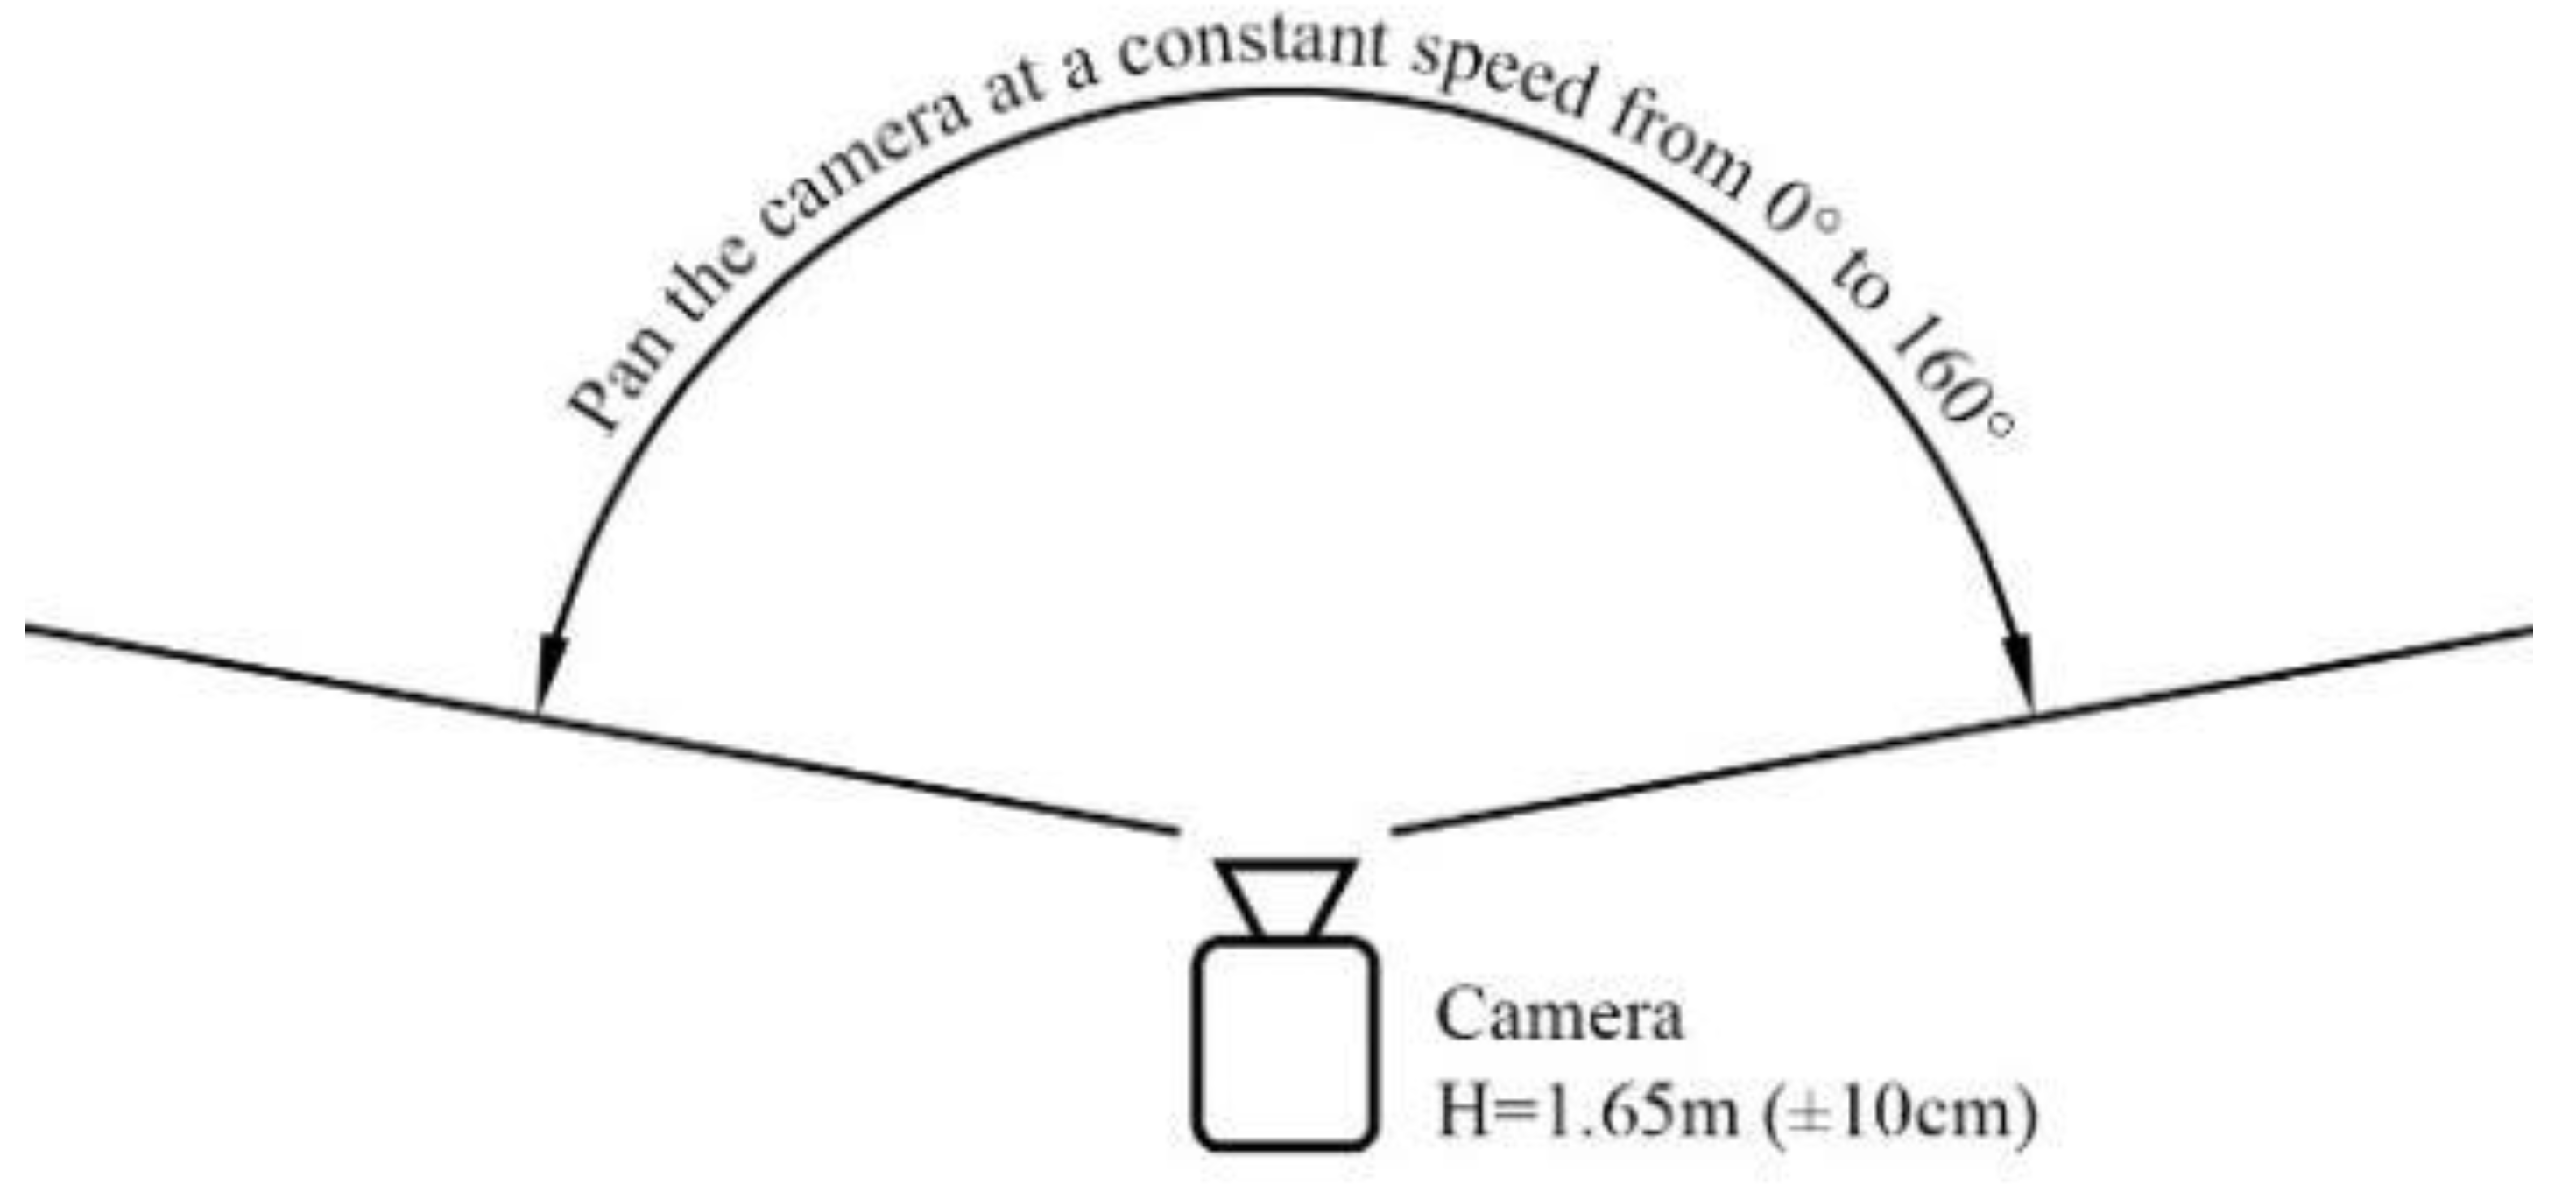
Figure 3.
Framing Angle Illustration.
2.3. Participant Recruitment Criteria
To ensure sufficient statistical significance and test power, the sample size for this study was estimated using G*Power software (version 3.1). The calculation was based on an effect size of 0.25, a significance level (α) of 0.05, and a test power (1-β) of 0.80 for an independent samples t-test. The result indicated a minimum requirement of 28 participants per group. Accordingly, 30 participants were ultimately recruited, meeting the sample size requirement and providing adequate data support for subsequent analyses.
All participants were aged between 60 and 85 years, aligning with the internationally recognized definition of older adults. [32]They were recruited through community outreach between March and April 2024. A self-reported health screening questionnaire was administered during recruitment to ensure that candidates met basic health criteria. Before the experiment, all participants were instructed to abstain from vigorous physical activity, staying up late, and the consumption of nicotine or alcohol for at least 24 hours, and to avoid caffeinated beverages for at least 2 hours beforehand.
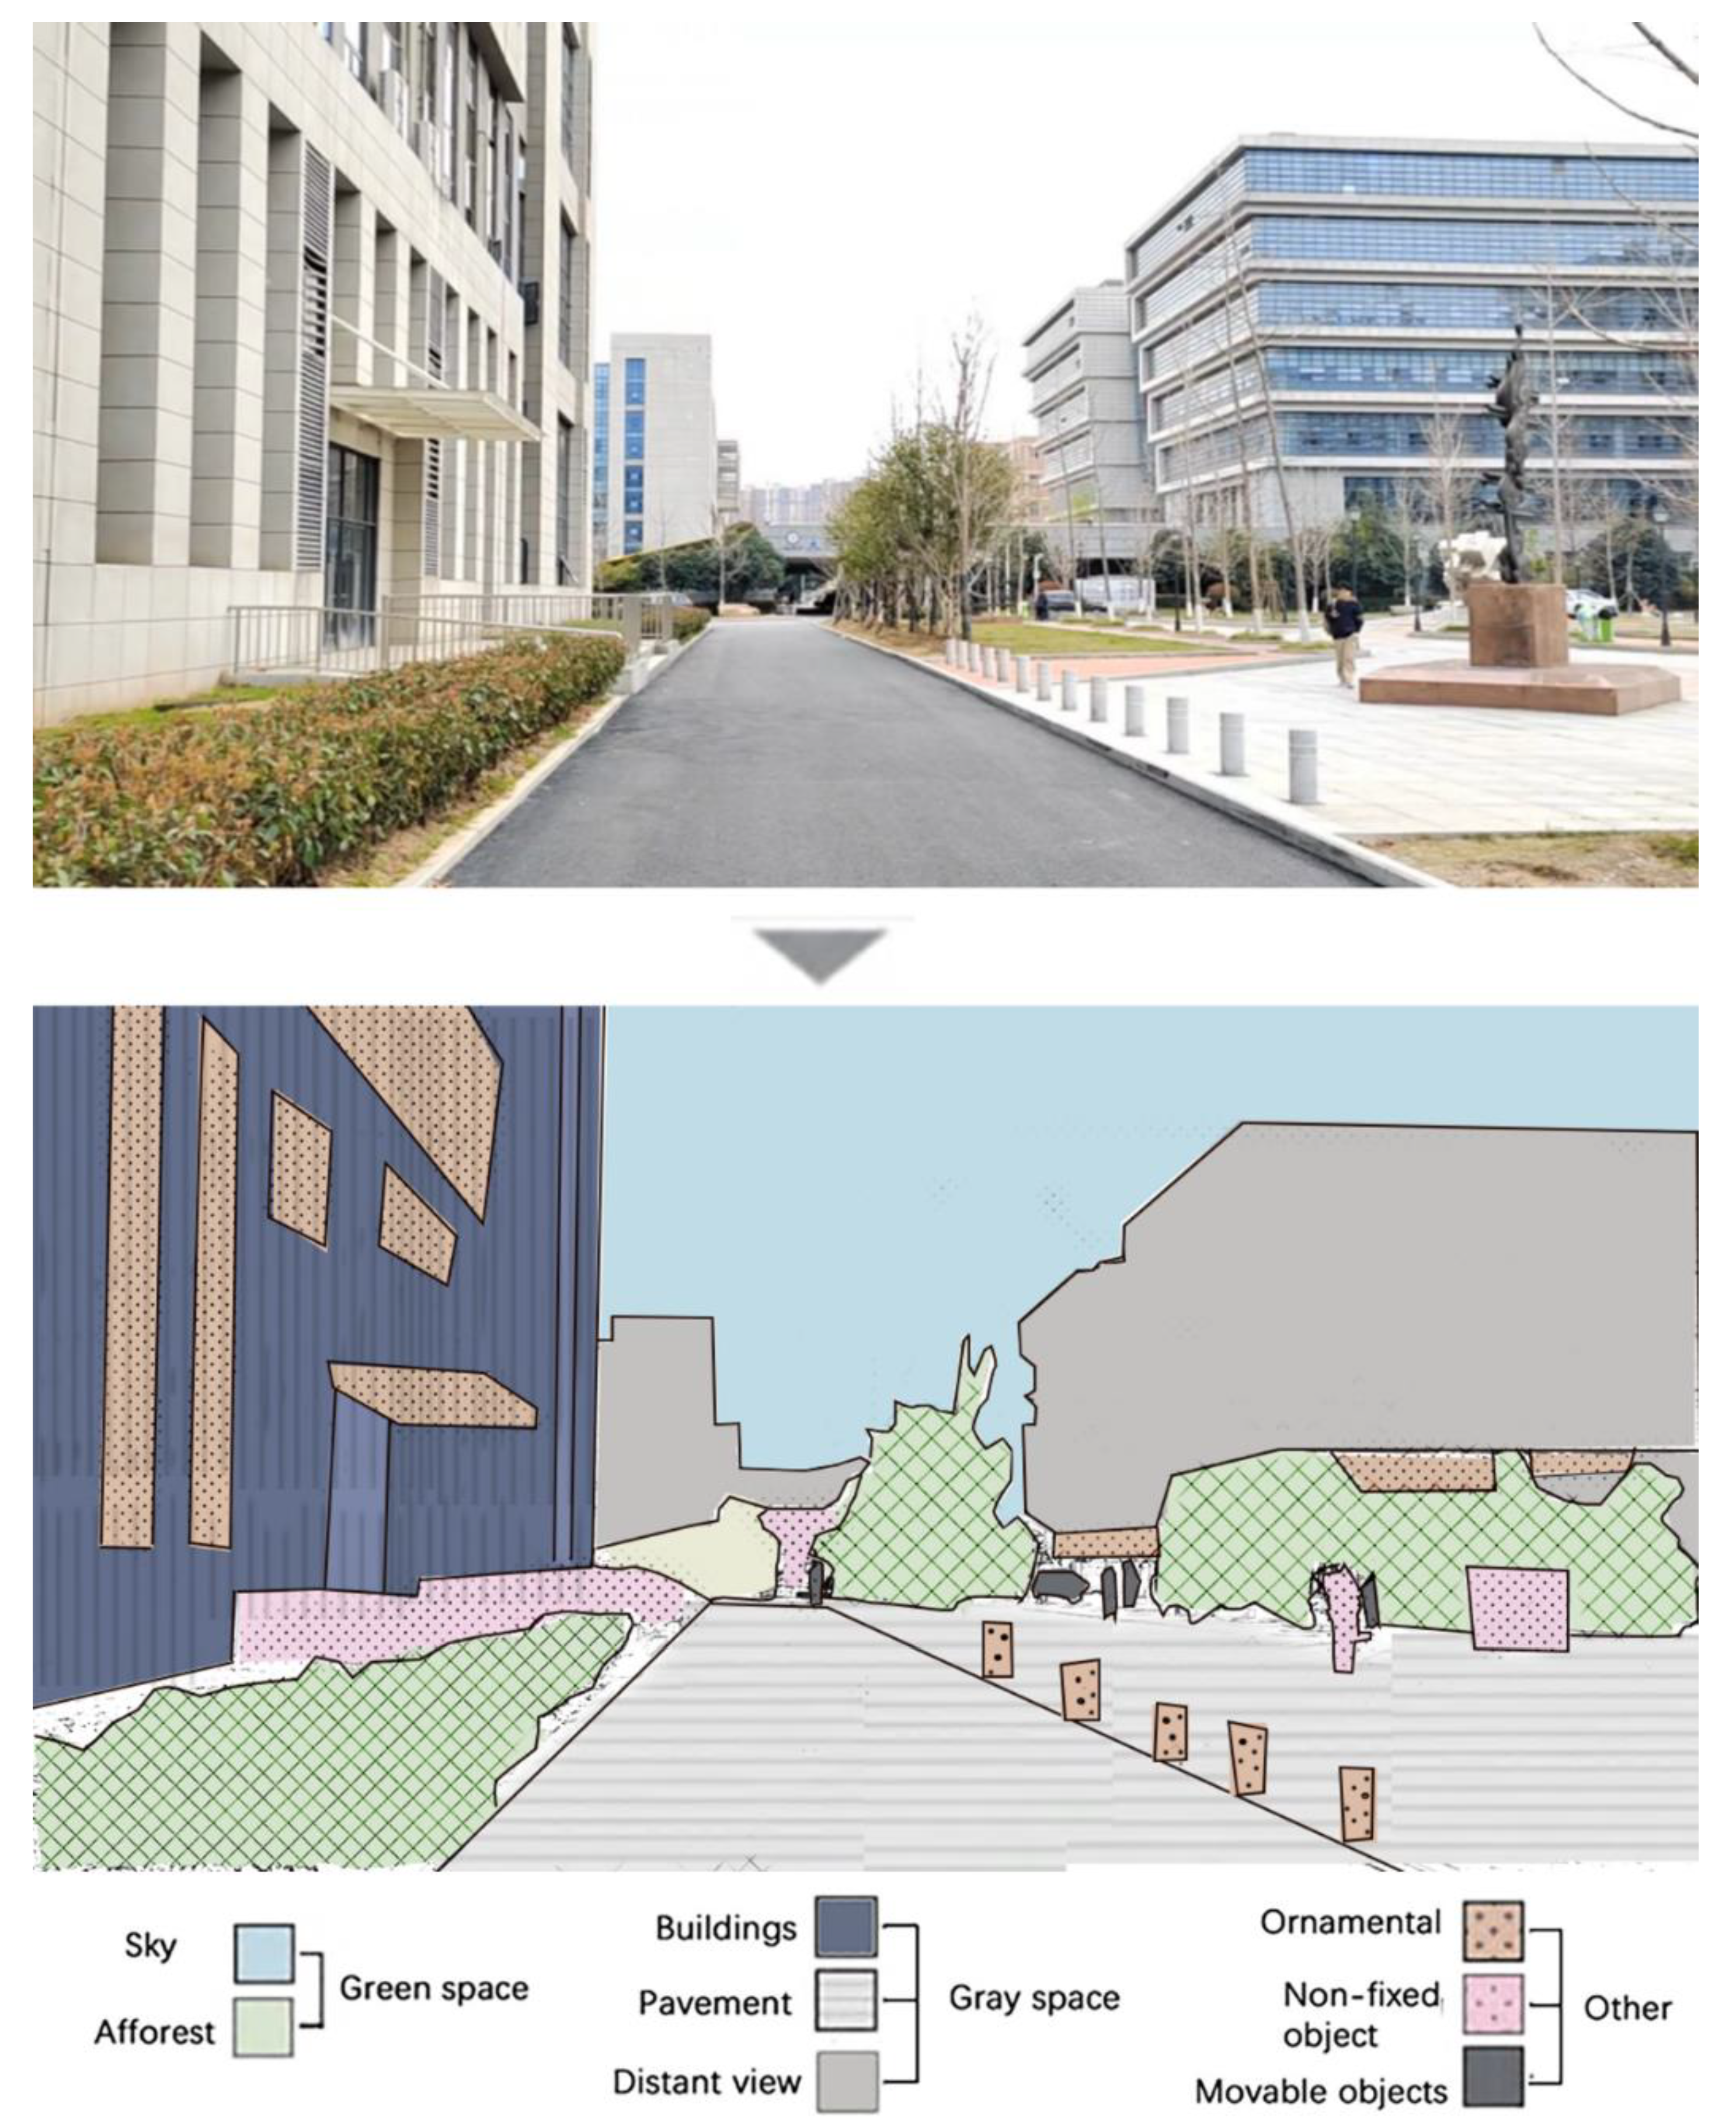
2.3.1. Semantic Segmentation Processing
The Fully Convolutional Network (FCN) model was applied to perform semantic segmentation on the scene images, assigning a semantic category label to each pixel. [33,34]Based on the Gray-Green space Exposure Ratio (GER) and Spatial Openness Level(SOL), the experimental scenes were categorized into nine types. Building surfaces, sidewalks, and roads were classified as grey space, representing areas within the urban environment that lack natural elements.[11] Vegetation, trees, lawns, and green areas were classified as green space, referring to natural or semi-natural vegetated areas. [12]GER was calculated by comparing the proportional area of buildings to that of green elements within the visual field, leading to the classification of spaces as grey space, semi-grey and semi-green space, or green space. The specific formula is as follows:
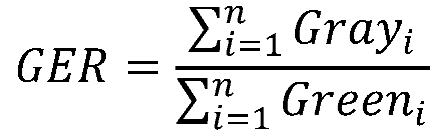
Grayi denotes the grey space coverage ratio within a 10-meter radius of the i-th grid, while Greeni represents the green space coverage ratio within the same spatial extent.
Figure 4.
Nine video scenarios were used for the experiment.
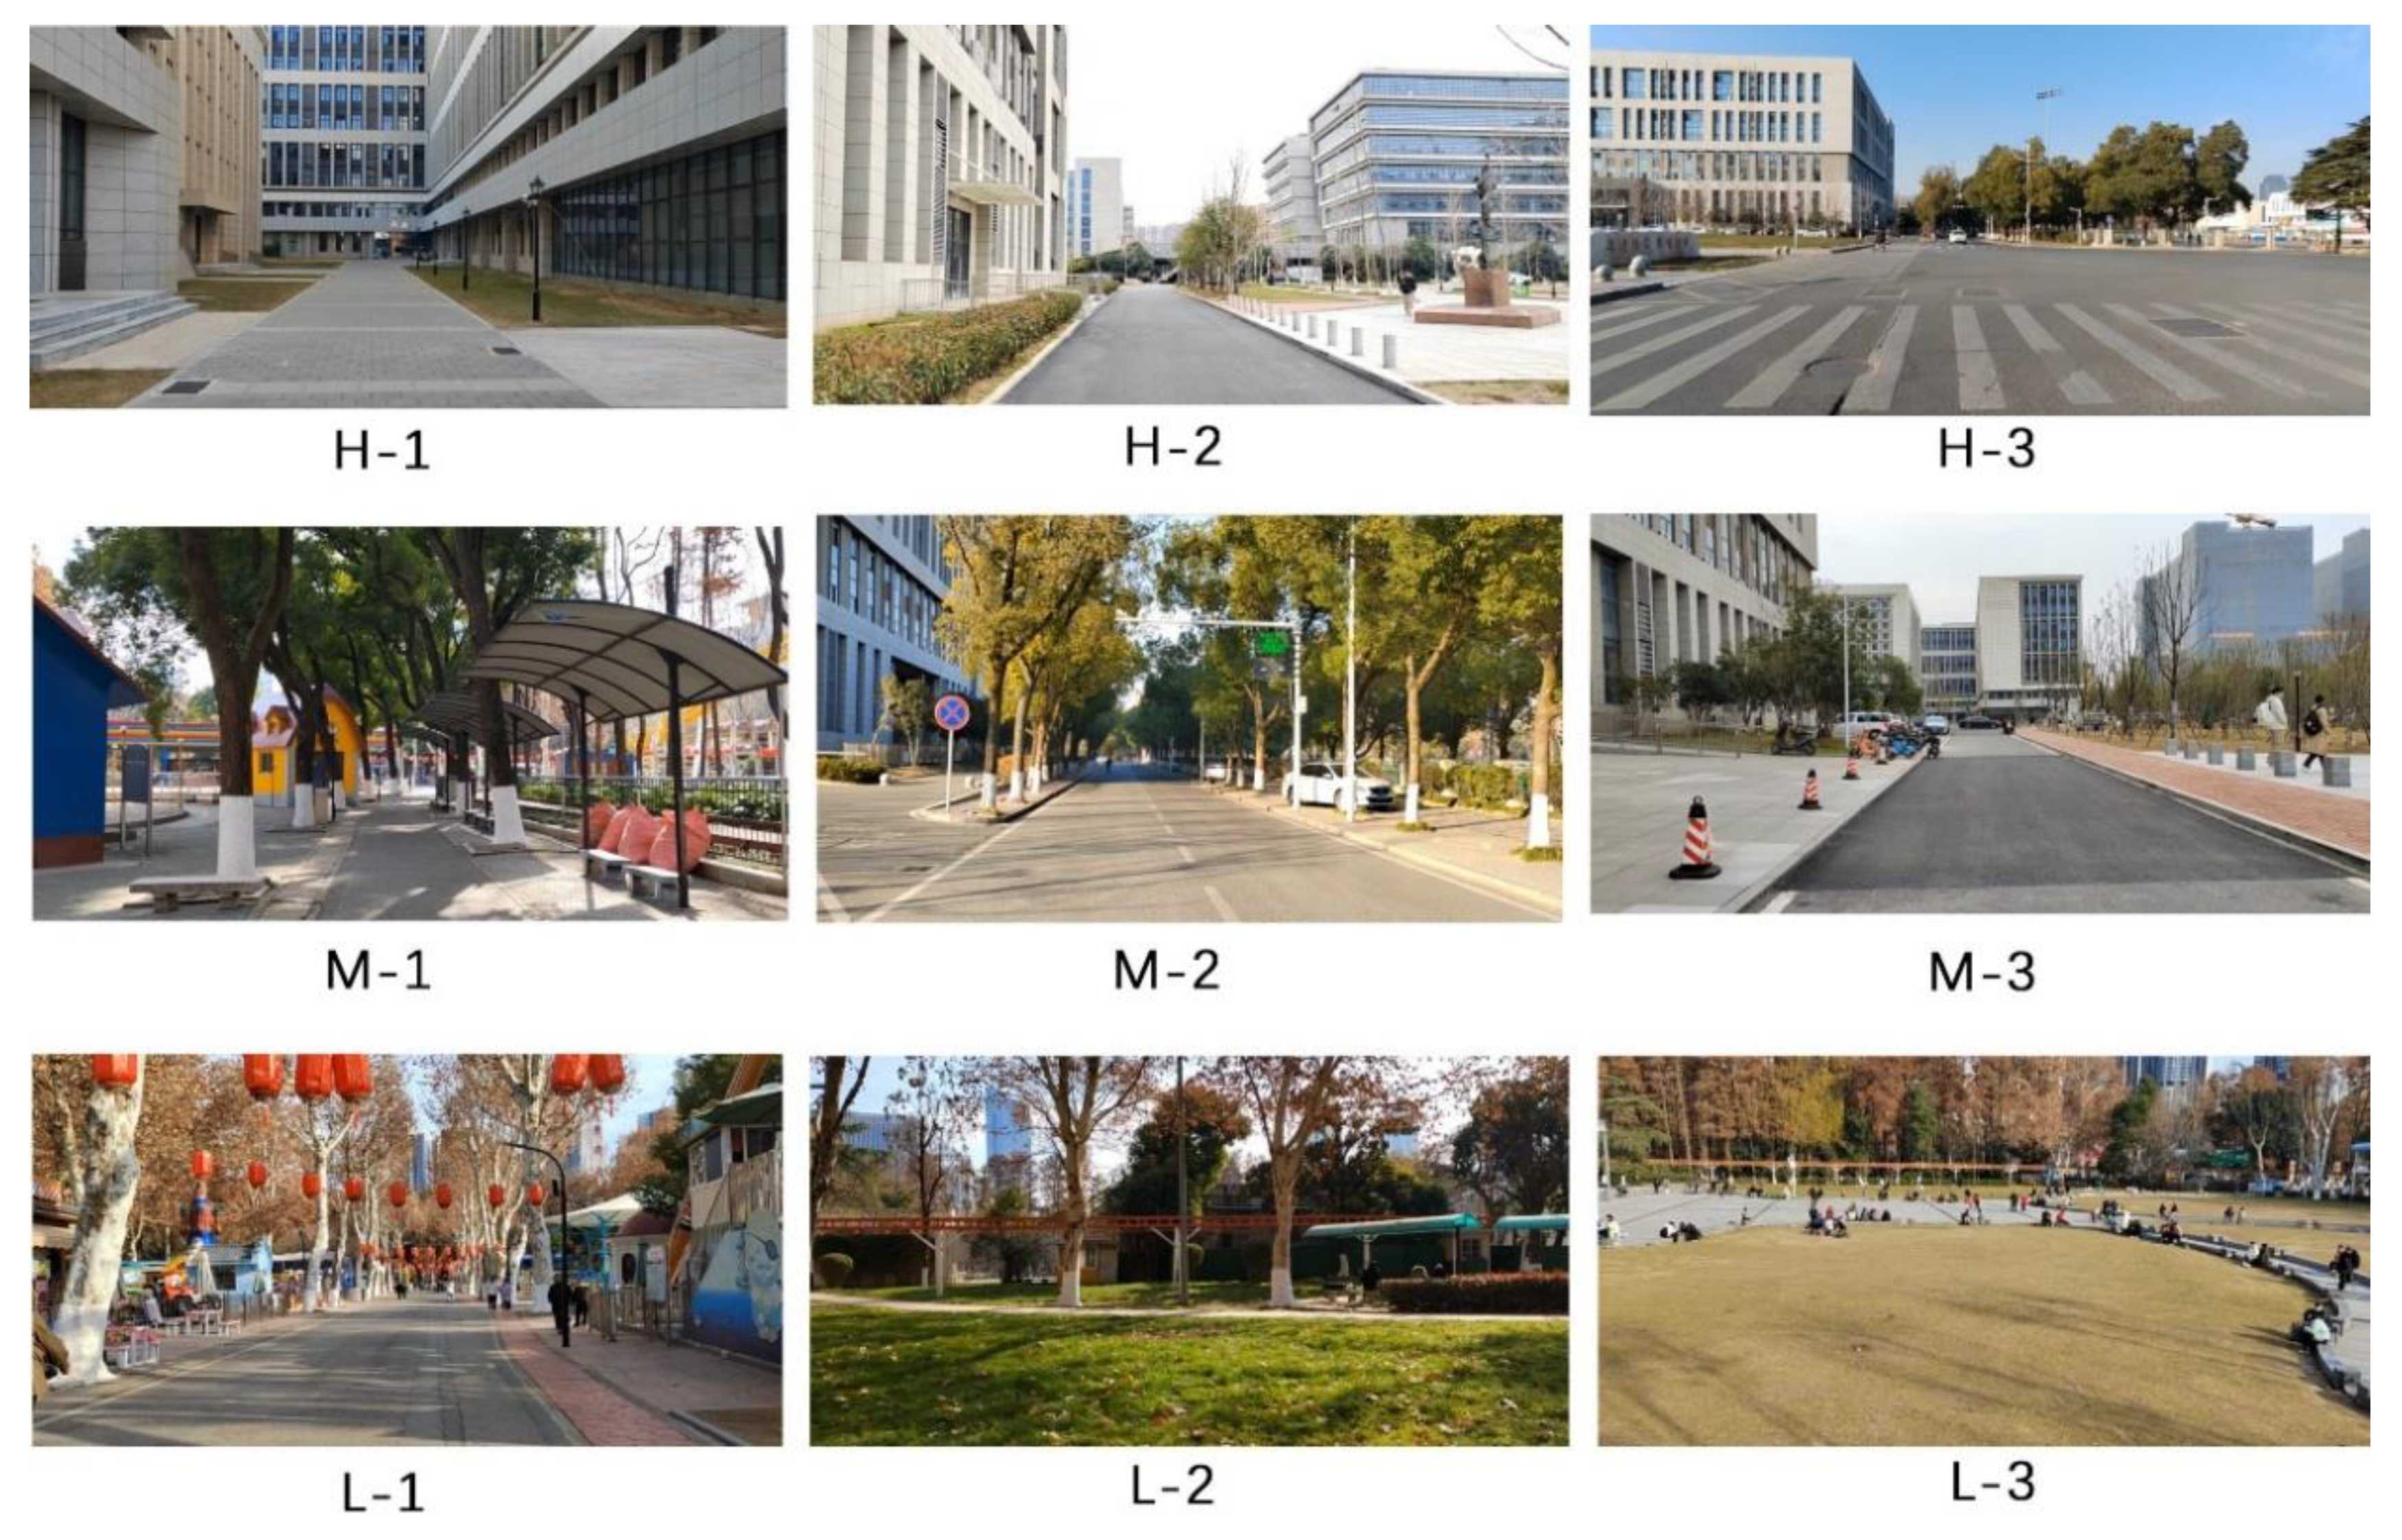

Table 2.
Semantic Segmentation Labels.
| Scene | Element | Tag |
|---|---|---|
| H-1 | enclosed on three sides, resulting in a low degree of openness, sidewalks, street lights, and small patches of grass. | Gray space, Closed space |
| H-2 | enclosed on two sides, sidewalks, ornamental trees, and pedestrians. |
Gray space, Semi-open space |
| H-3 | enclosed only on one side, abundant vegetation, trees, | Gray space, Open space |
| M-1 | enclosed on three sides, pedestrians, trees, seating areas, and exposed sky views. | Semi-grey and semi-green spaces, Closed space |
| M-2 | enclosed on two sides, sidewalks, ornamental trees, and pedestrians. |
Semi-grey and semi-green spaces, Semi-open space |
| M-3 | enclosed on two sides, Movable objects, trees, pavement, distant view | Semi-grey and semi-green spaces, Open space |
| L-1 | enclosed on two sides, ornamental, trees, movable objects, pavement |
Green space, Closed space |
| L-2 | enclosed only on one side, abundant vegetation, and trees | Green space, Semi-open space |
| L-3 | Open space, abundant vegetation, pavement |
Green space, Open space |
Table 3.
Scene Classification Based on Visual-Spatial Proportions.
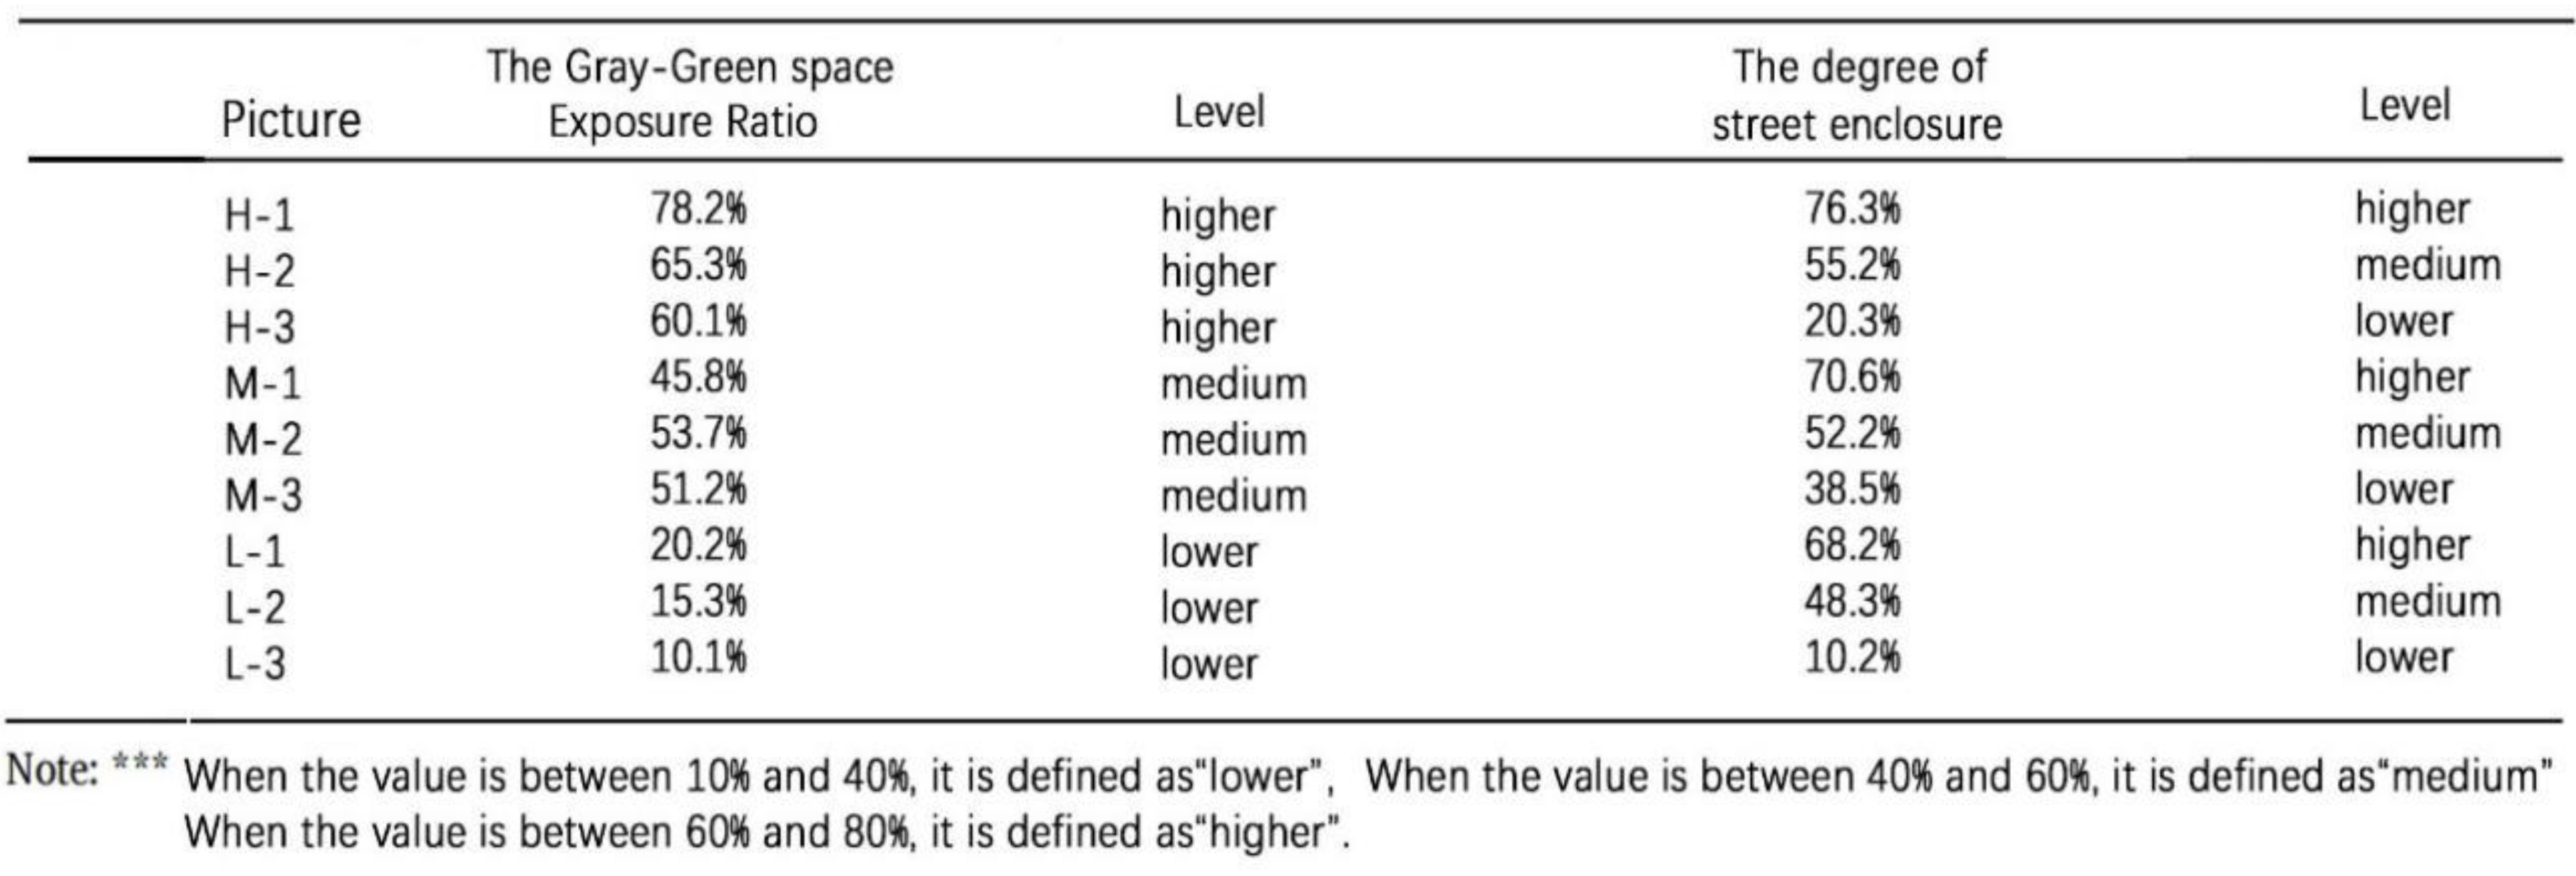 |
Figure 5.
The proportion of each element.
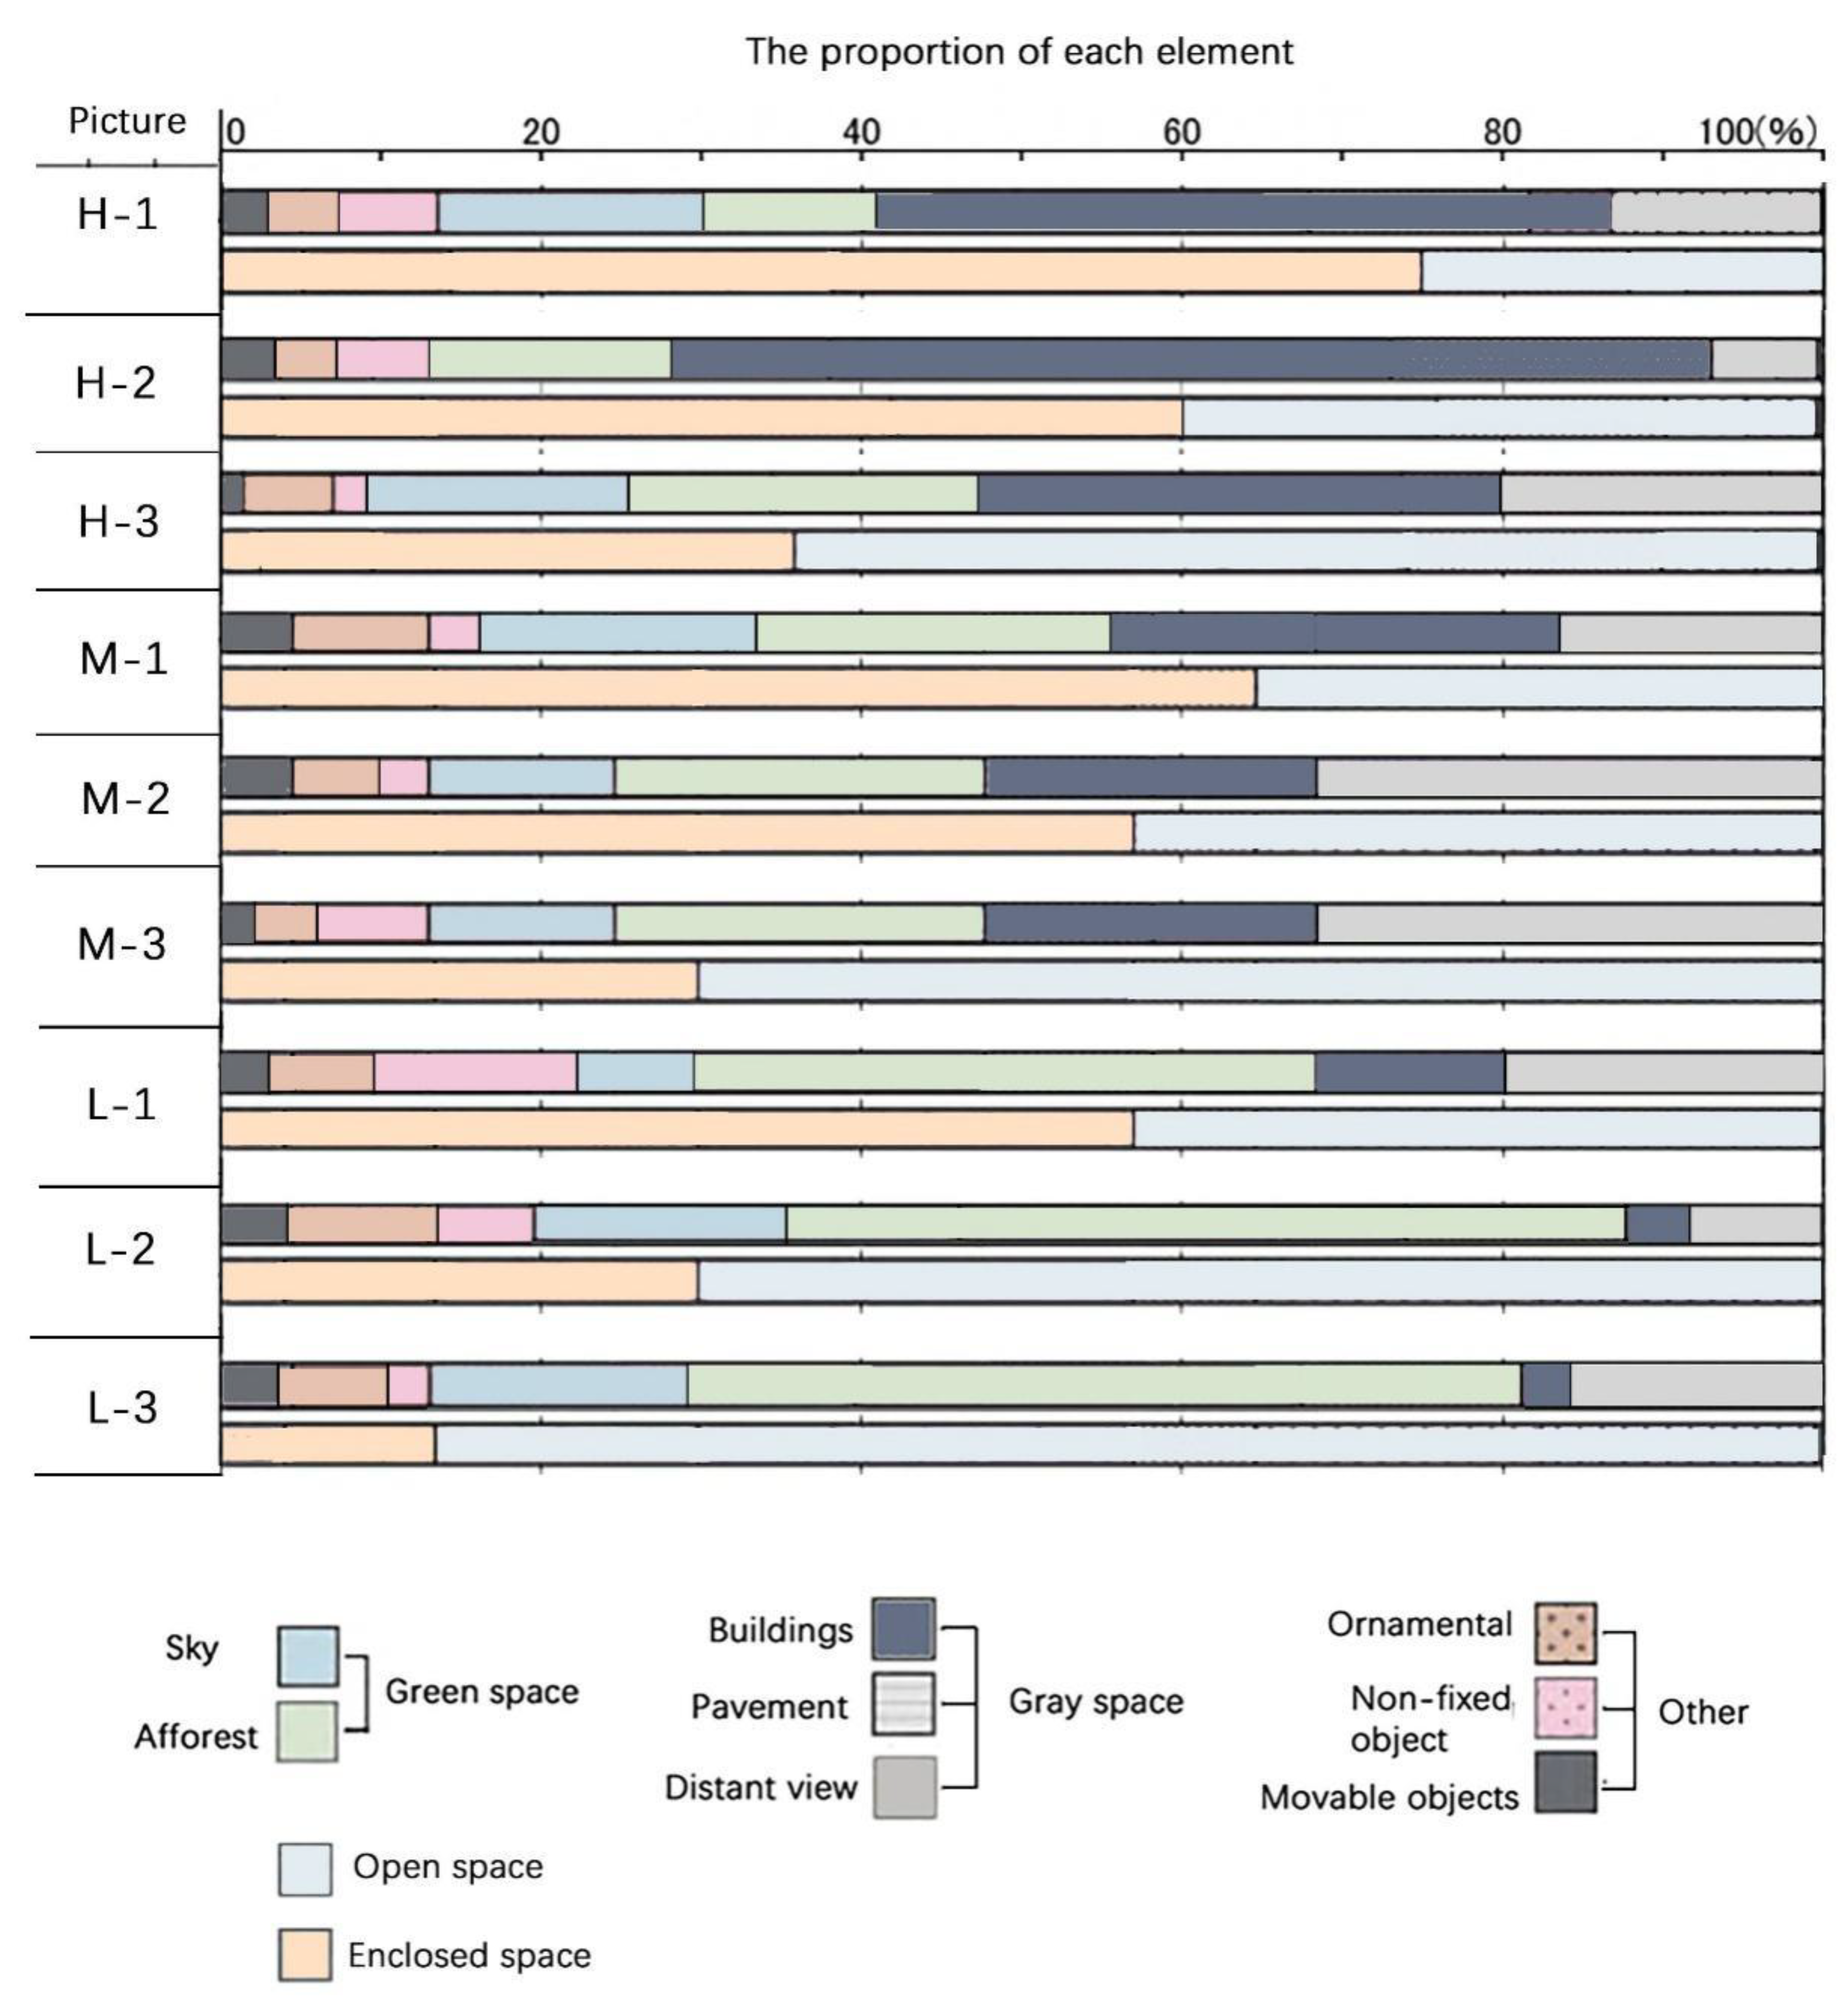
Figure 6.
Example of Extracting SOL.

Figure 7.
Example of Extracting the Gray-Green Space Exposure Ratio Elements.
2.3.2. Video Recording
Based on environmental variable criteria and the proportional composition of visual-spatial elements (Table 1), the research team evaluated and selected nine representative sampling points. Video recording and image capture were performed using a DJI Osmo Pocket 2 camera (DJI Innovations Inc., Shenzhen, Guangdong, China). Equipped with a three-axis mechanical gimbal, the device assists in recording stable footage by minimizing shake and vibration.
To standardize conditions, all recordings were conducted during clear daytime weather. For each of the nine points, videos were captured representing three levels of the GER and three levels of SOL. To approximate a natural human perspective, the camera was positioned at a height of approximately 1.65 meters. A slow, continuous panning motion was employed within a 160° field of view. After filming, all footage was reviewed and edited. Since this study focuses solely on the influence of visual perception on emotional states, all audio tracks were removed during editing. The final experimental material consisted of nine one-minute video clips—one for each unique condition across the nine sampling points.
2.3.3. EEG Measurement
This study employed a portable EEG device equipped with the TGAM microchip (manufactured by NeuroSky) for data collection. The device recorded brainwave signals at a sampling rate of 512 Hz. Advanced noise-filtering technology was integrated to effectively minimize interference from ambient noise and electrical sources. Collected raw EEG signals were converted from the time domain to power spectra across different frequency bands using a Fast Fourier Transform (FFT) algorithm, and the processed data were then transmitted to a computer via Bluetooth. All participants provided written informed consent prior to the experiment and were asked to follow a detailed “artifact minimization protocol.” During the recordings, participants were instructed to remain physically still, avoid frequent blinking, swallowing, and facial muscle movements, and the experiment was conducted in a quiet, low-electromagnetic-interference environment. The reliability and validity of this device in EEG research have been established in previous studies. [35,36]Research using power ratios of EEG frequency bands has indicated that α/β and θ/β ratios are negatively correlated with stress levels.[37,38] In this study, the emotional indicator was derived from the ratio of α-wave to β-wave power, calculated using the following formula:
2.4. Experimental Procedure
The experiment was conducted entirely in an empty classroom. To minimize the potential influence of temperature fluctuations on participants’ emotional states (Juan & Chen, 2022), the room temperature was maintained at a constant 25 °C using air conditioning throughout the experimental sessions. Furthermore, to reduce potential dizziness and eliminate interference from external light sources on participants’ perception, a darkroom environment measuring 1 m × 1 m × 2 m was constructed within the classroom. The darkroom was equipped with a desk, a chair, and a display screen. The experimental procedure consisted of three phases: pre-experiment preparation, perception of urban scenes, and viewing a 15-minute video. A single experimental session lasted approximately 20 minutes.
Figure 8.
Scene Layout Diagram.
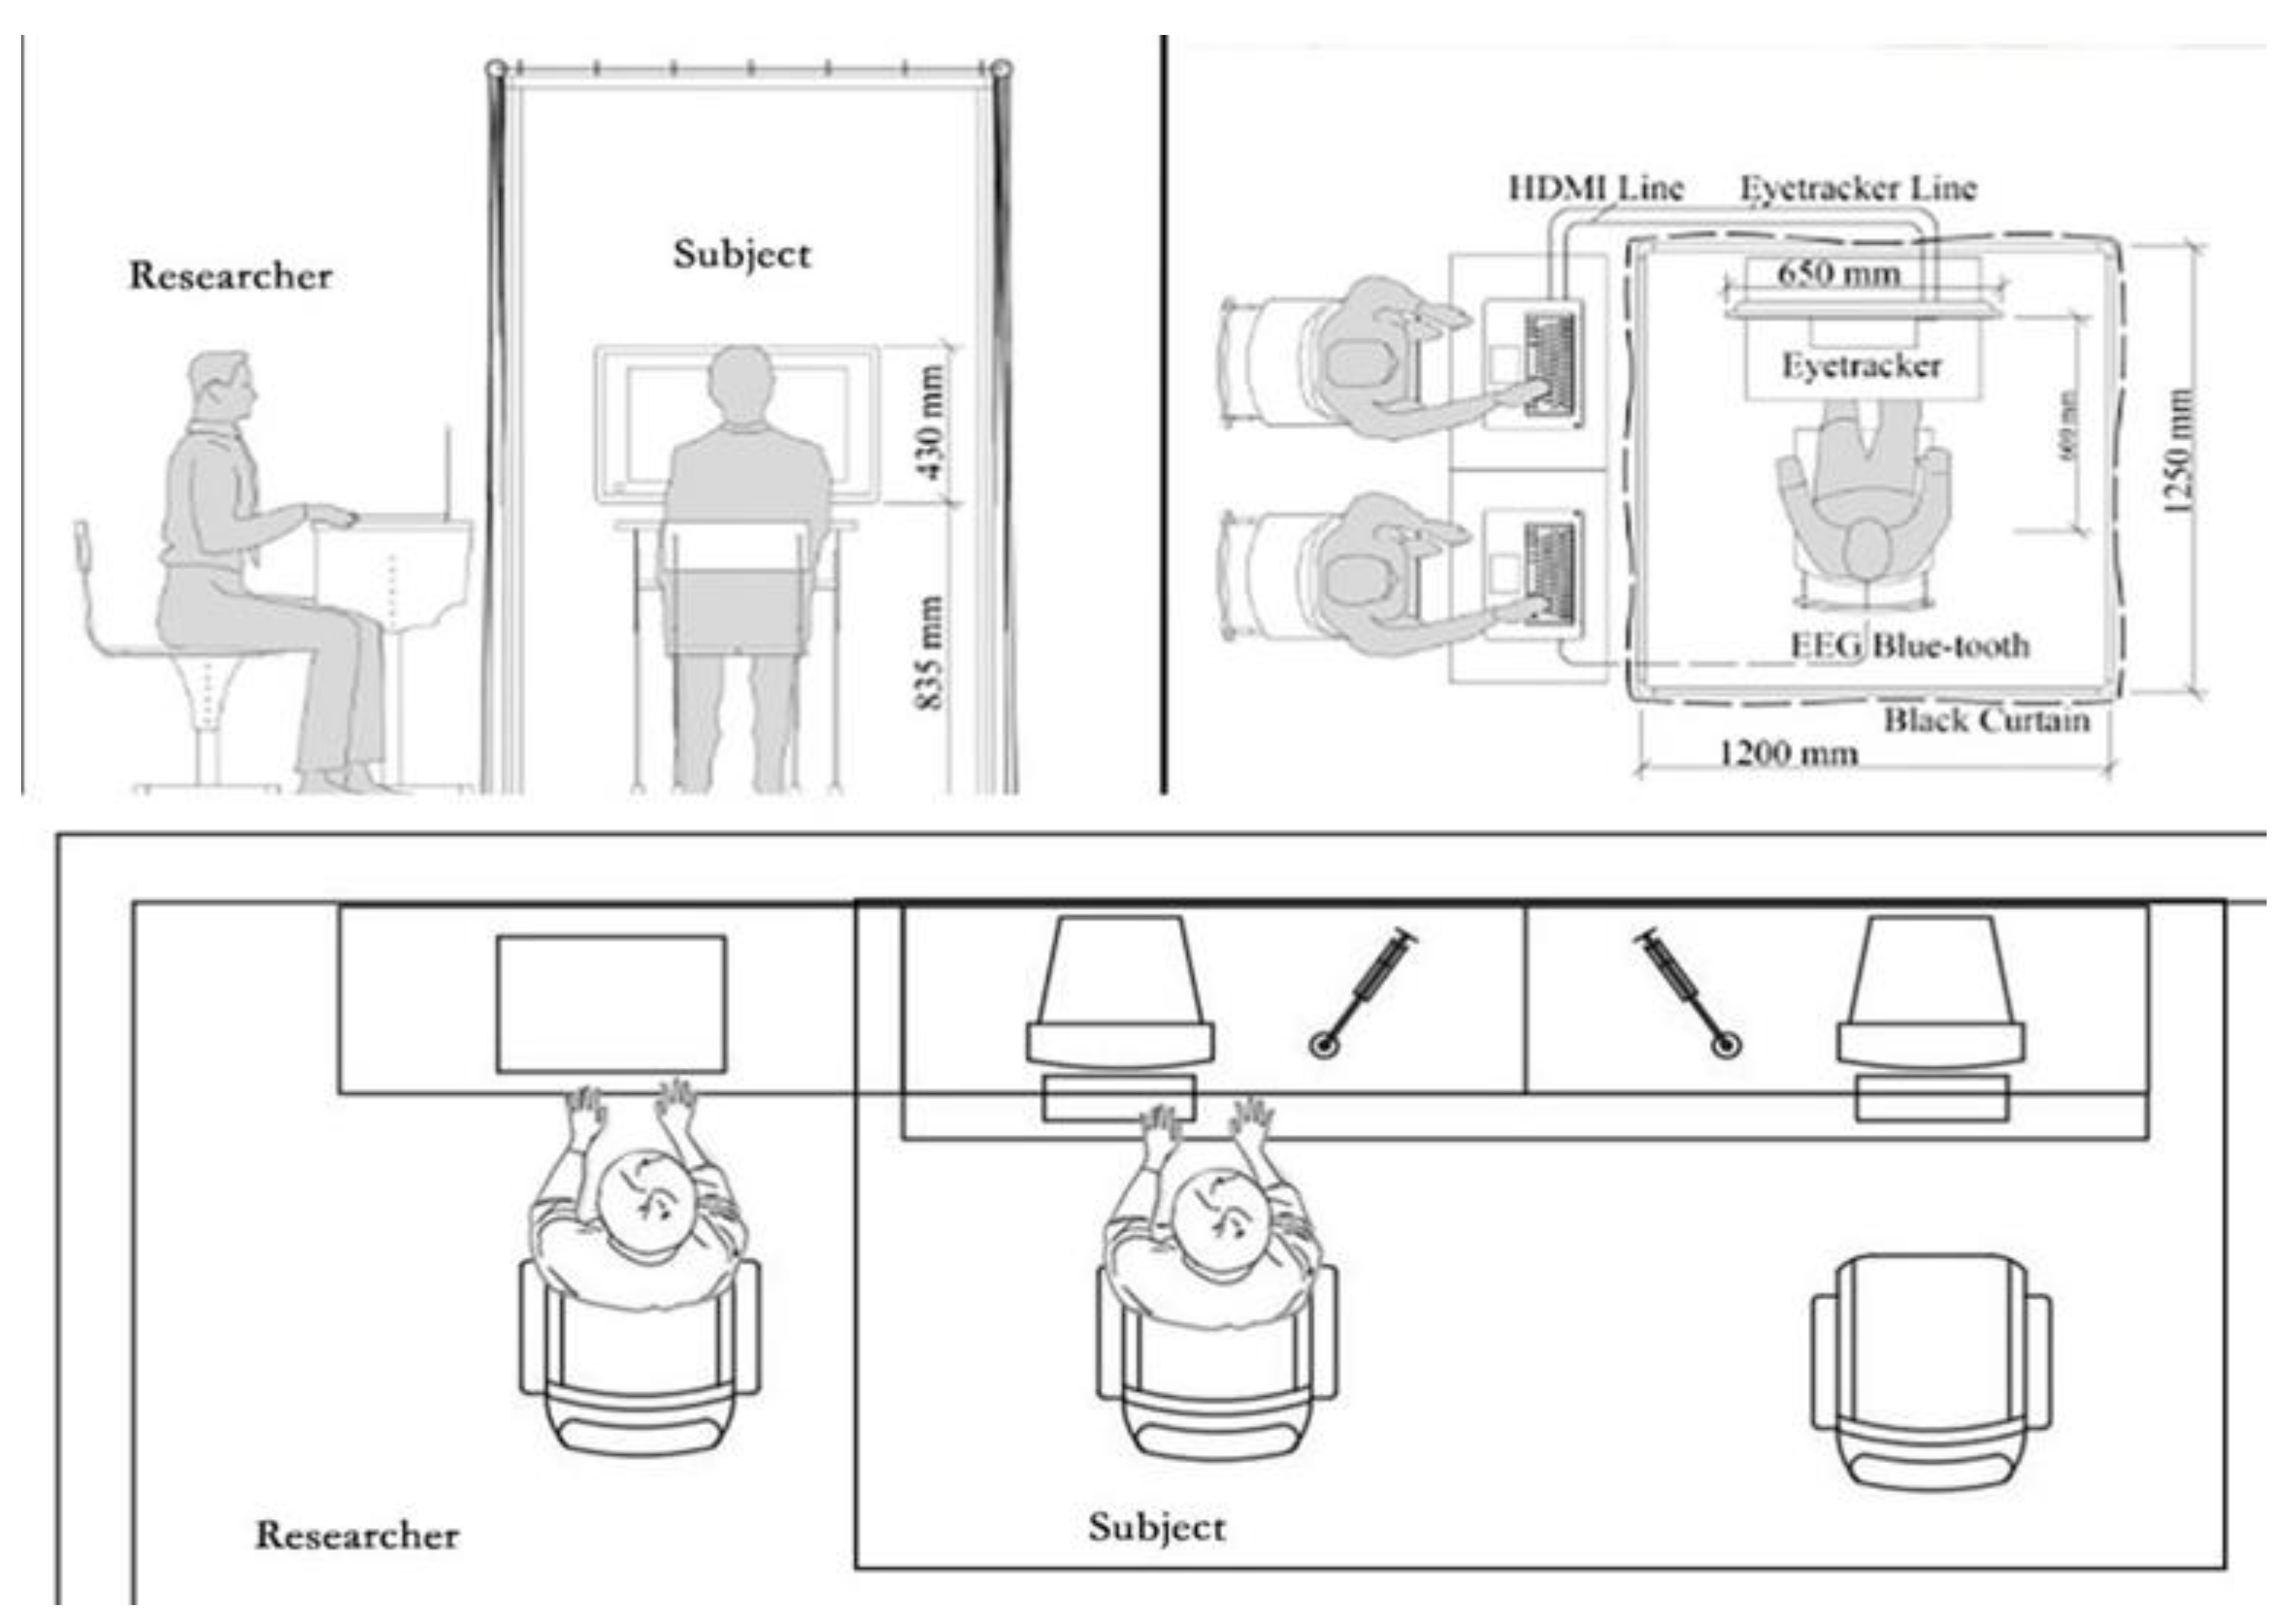
Prior to the experiment, participants were guided into the testing environment and seated approximately 60 cm away from a Dell monitor (Dell Technologies Inc., Round Rock, Texas, USA). After being informed about the non-invasive and safe nature of the EEG equipment and other experimental guidelines, participants were instructed to carefully read and sign an informed consent form. They were then asked to review and adhere to a detailed “artifact minimization protocol.” Subsequently, a 2-minute eyes-open resting-state recording was performed, followed by a 2-minute eyes-closed resting-state recording. The eyes-closed resting data were used later to verify whether the device could detect the expected increase in alpha wave (8–13 Hz) power, serving as a physiological check of proper device function.
Participants then completed a basic demographic questionnaire. Following this, they were fitted with a portable EEG headband (NeuroSky Inc., San Jose, California, USA) and Sony WH-1000XM4 noise-canceling headphones (Sony Corporation, Tokyo, Japan). Once all equipment was properly adjusted, the researcher confirmed the start of the experiment with the participant and turned off all lights.
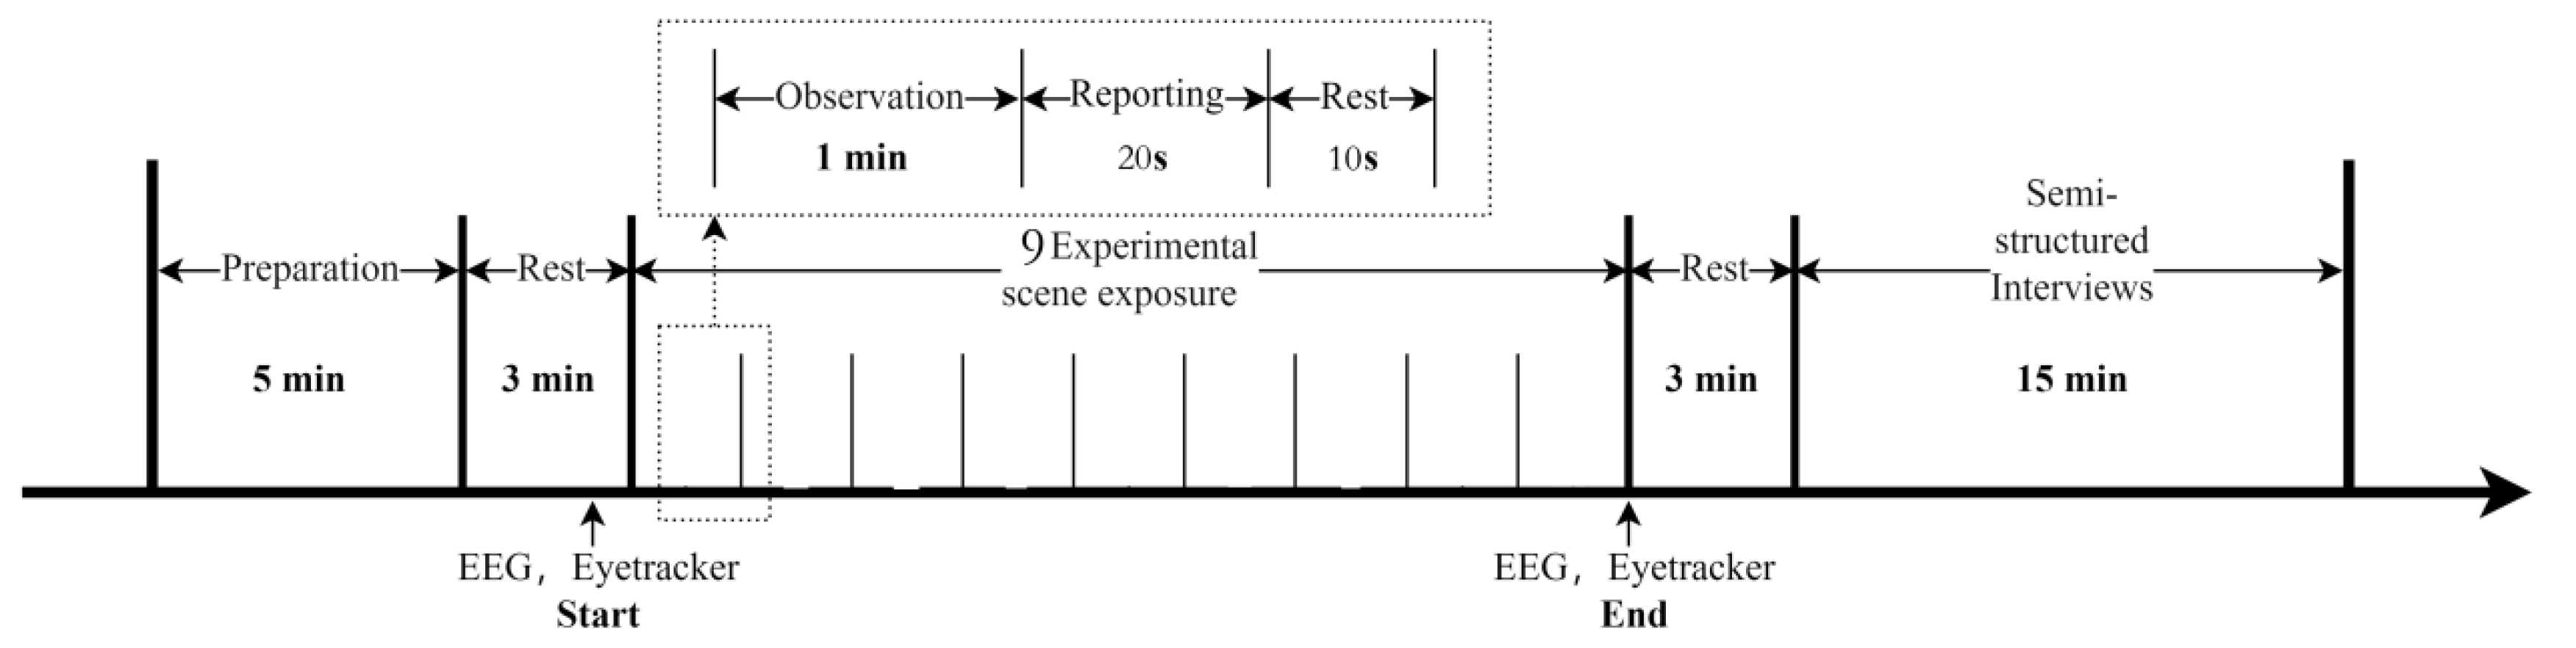
In the urban scene perception task, participants were required to watch nine pre-recorded experimental videos consecutively. The presentation order of the videos was randomized for each participant using a computer-generated sequence to counterbalance potential order or fatigue effects. Before the formal task began, participants rested in the darkroom environment for 3 minutes to acclimatize. During the final minute of this adaptation period, the recording port of the portable EEG device was activated to record baseline data. The experimental videos were then played according to the randomized sequence. After each video, a 10-second black screen was shown as a rest interval before proceeding to the next video. This procedure was repeated until all nine videos had been presented.
Upon completion of the experiment, the researcher removed the EEG headband and headphones from the participant. After a brief rest period, basic post-experiment information was registered, and the process was documented using a DJI Osmo Pocket 2 camera. After confirming the completeness of the collected data, all equipment was cleaned and disinfected for subsequent experimental sessions.
Figure 9.
Experimental Procedure.
3. Results
3.1. Descriptive Statistical Analysis of Results
Table 4 presents the descriptive statistics of the participants, experimental scenes, and measurement results. This study enrolled a total of 30 participants, evenly distributed by gender (15 males [50%] and 15 females [50%]). The age of participants ranged from 60 to 80 years, with a specific distribution as follows: 14 participants (47%) were aged 60–70 years, and 16 participants (53%) were aged 71–80 years. Regarding educational background, 14 participants (47%) had completed high school education, and 16 participants (53%) had completed junior high school education. According to post-experiment questionnaire results, all participants (N = 30) ranked the degree of spatial openness in a manner consistent with the experimental site categorization, indicating no cognitive discrepancy between participants and researchers regarding spatial scale. The experiment yielded one type of outcome metric: the RAB (Relative Alpha/Beta power ratio). The total sample size for the results was derived from the product of the number of participants and the total number of scenes (N = 270).
3.2. Analysis of the Correlations Between GER, SOL, and RAB
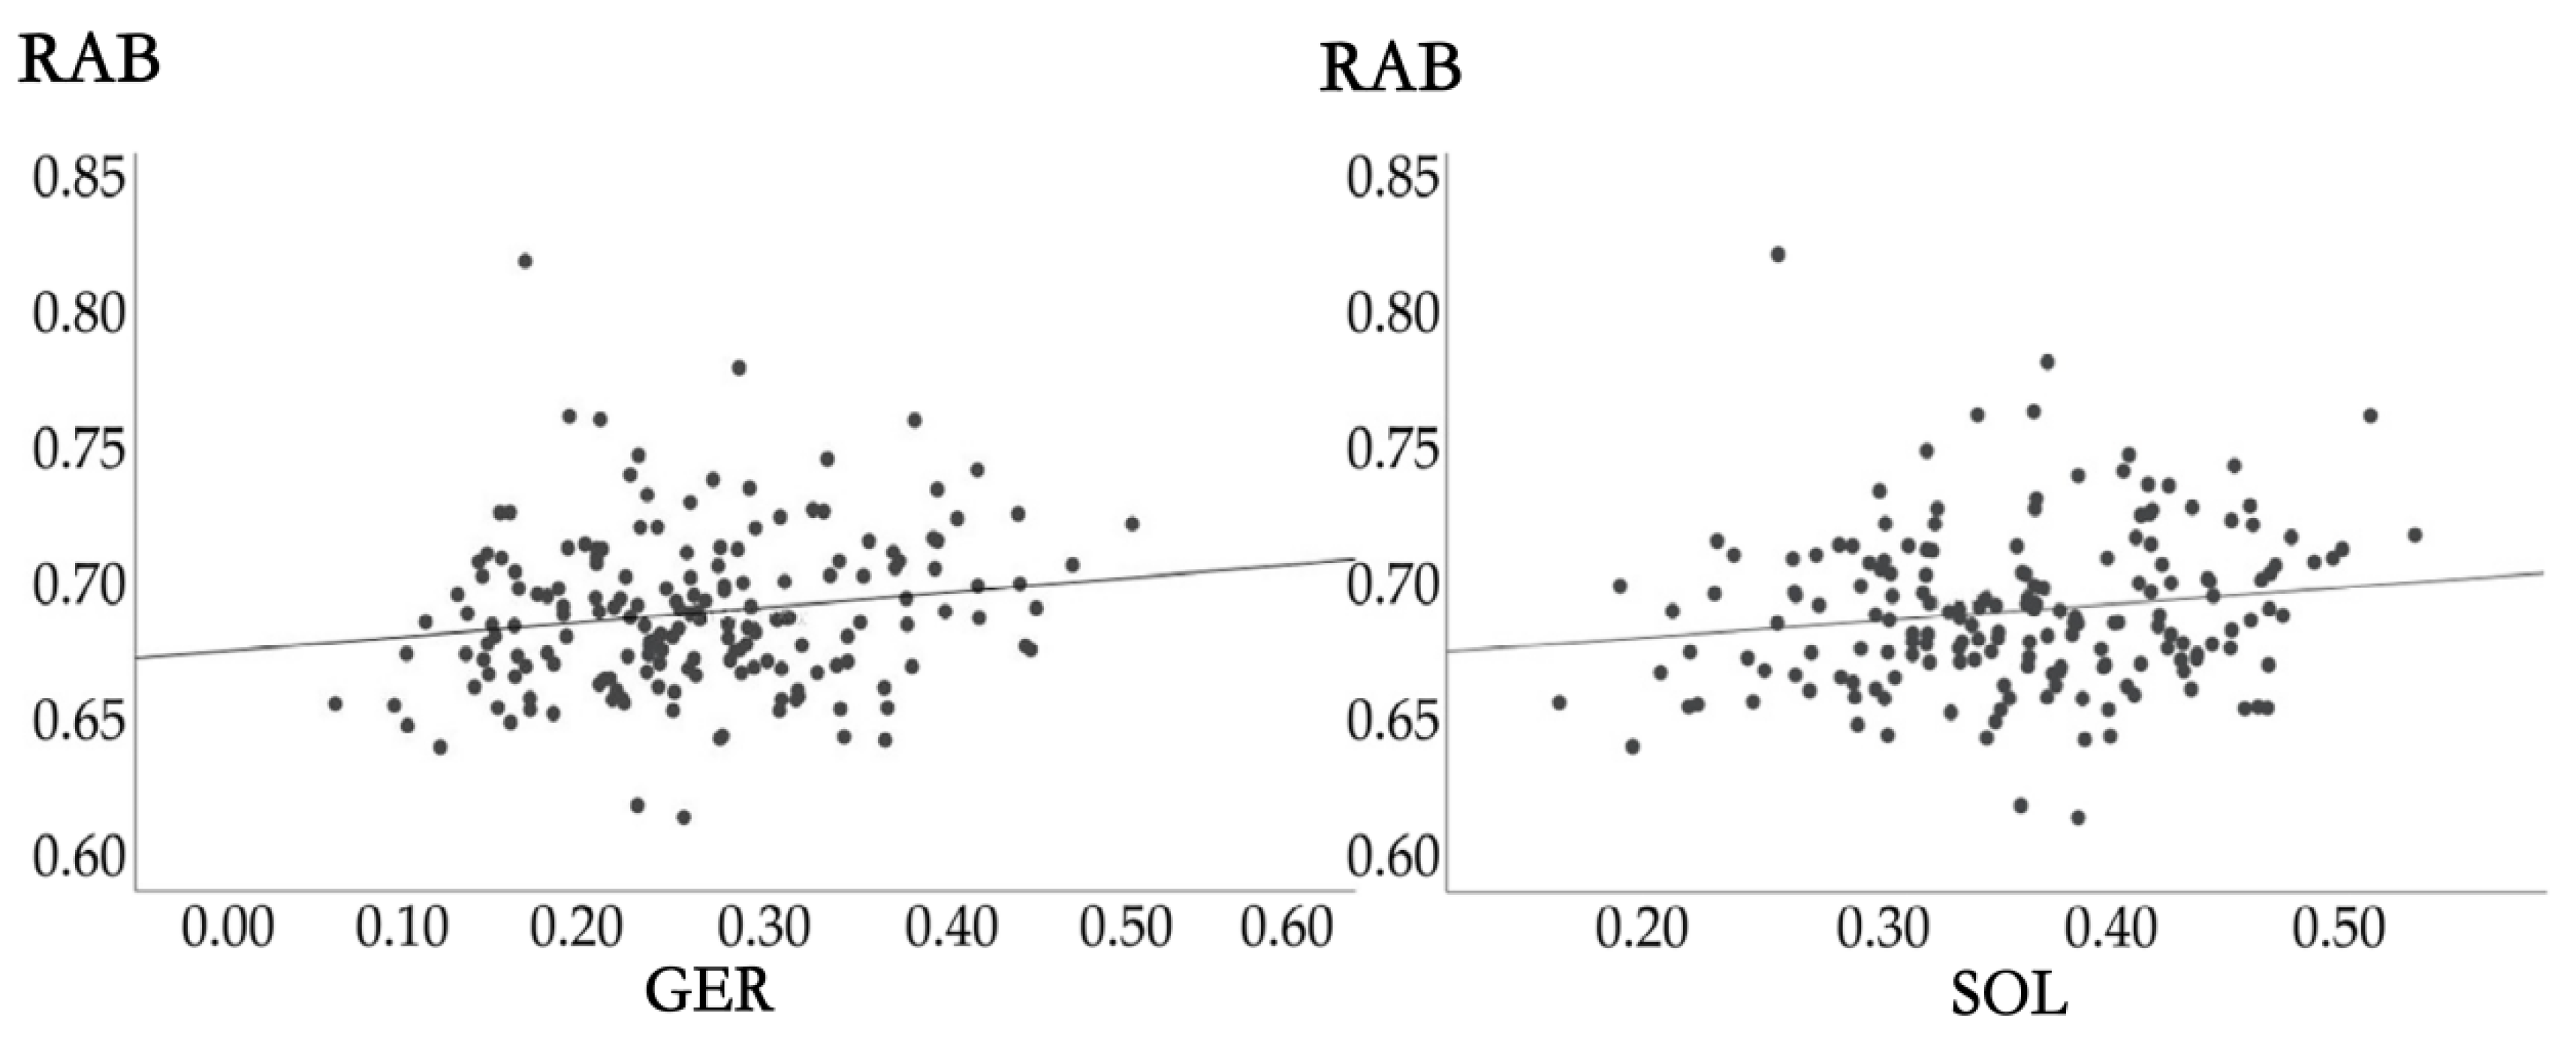
To visualize the relationship between the nine experimental scenes and the EEG-based emotional responses of older adults, the experimental data were analyzed using SPSS 27 statistical software and random forest regression analysis to examine the effects of SOL and Gray-Green space Exposure Ratio (GER) on the physiological-emotional index RAB (Relative Alpha/Beta ratio) in older individuals. Scatter plots of the relevant data were generated using SPSS 27. The horizontal coordinates represent GER and SOL, while the vertical coordinate represents the RAB (α/β ratio). As indicated by the baseline trend in the figure, an approximate linear correlation exists between GER, SOL, and the EEG-based ratio in older adults.
Figure 10.
Scatterplot analysis of the relationship between GER,SOL and positive emotions of older adults(RAB).
Figure 10.
Scatterplot analysis of the relationship between GER,SOL and positive emotions of older adults(RAB).
A multifactorial analysis of variance (ANOVA) was performed on the RAB data across different groups, with the results presented in Table 5.
Table 5.
ANOVA of RAB data.
| Item | SS | df | MS | F | p | η²_partial |
| GENDER | 0.037 | 1 | 0.037 | 6.823 | 0.009** | 0.013 |
| SOL | 0.054 | 2 | 0.027 | 5.001 | 0.007** | 0.019 |
| GER | 7.137E-5 | 1 | 7.137E-5 | 0.013 | 0.908 | 0.000 |
Note: **p<0.01.
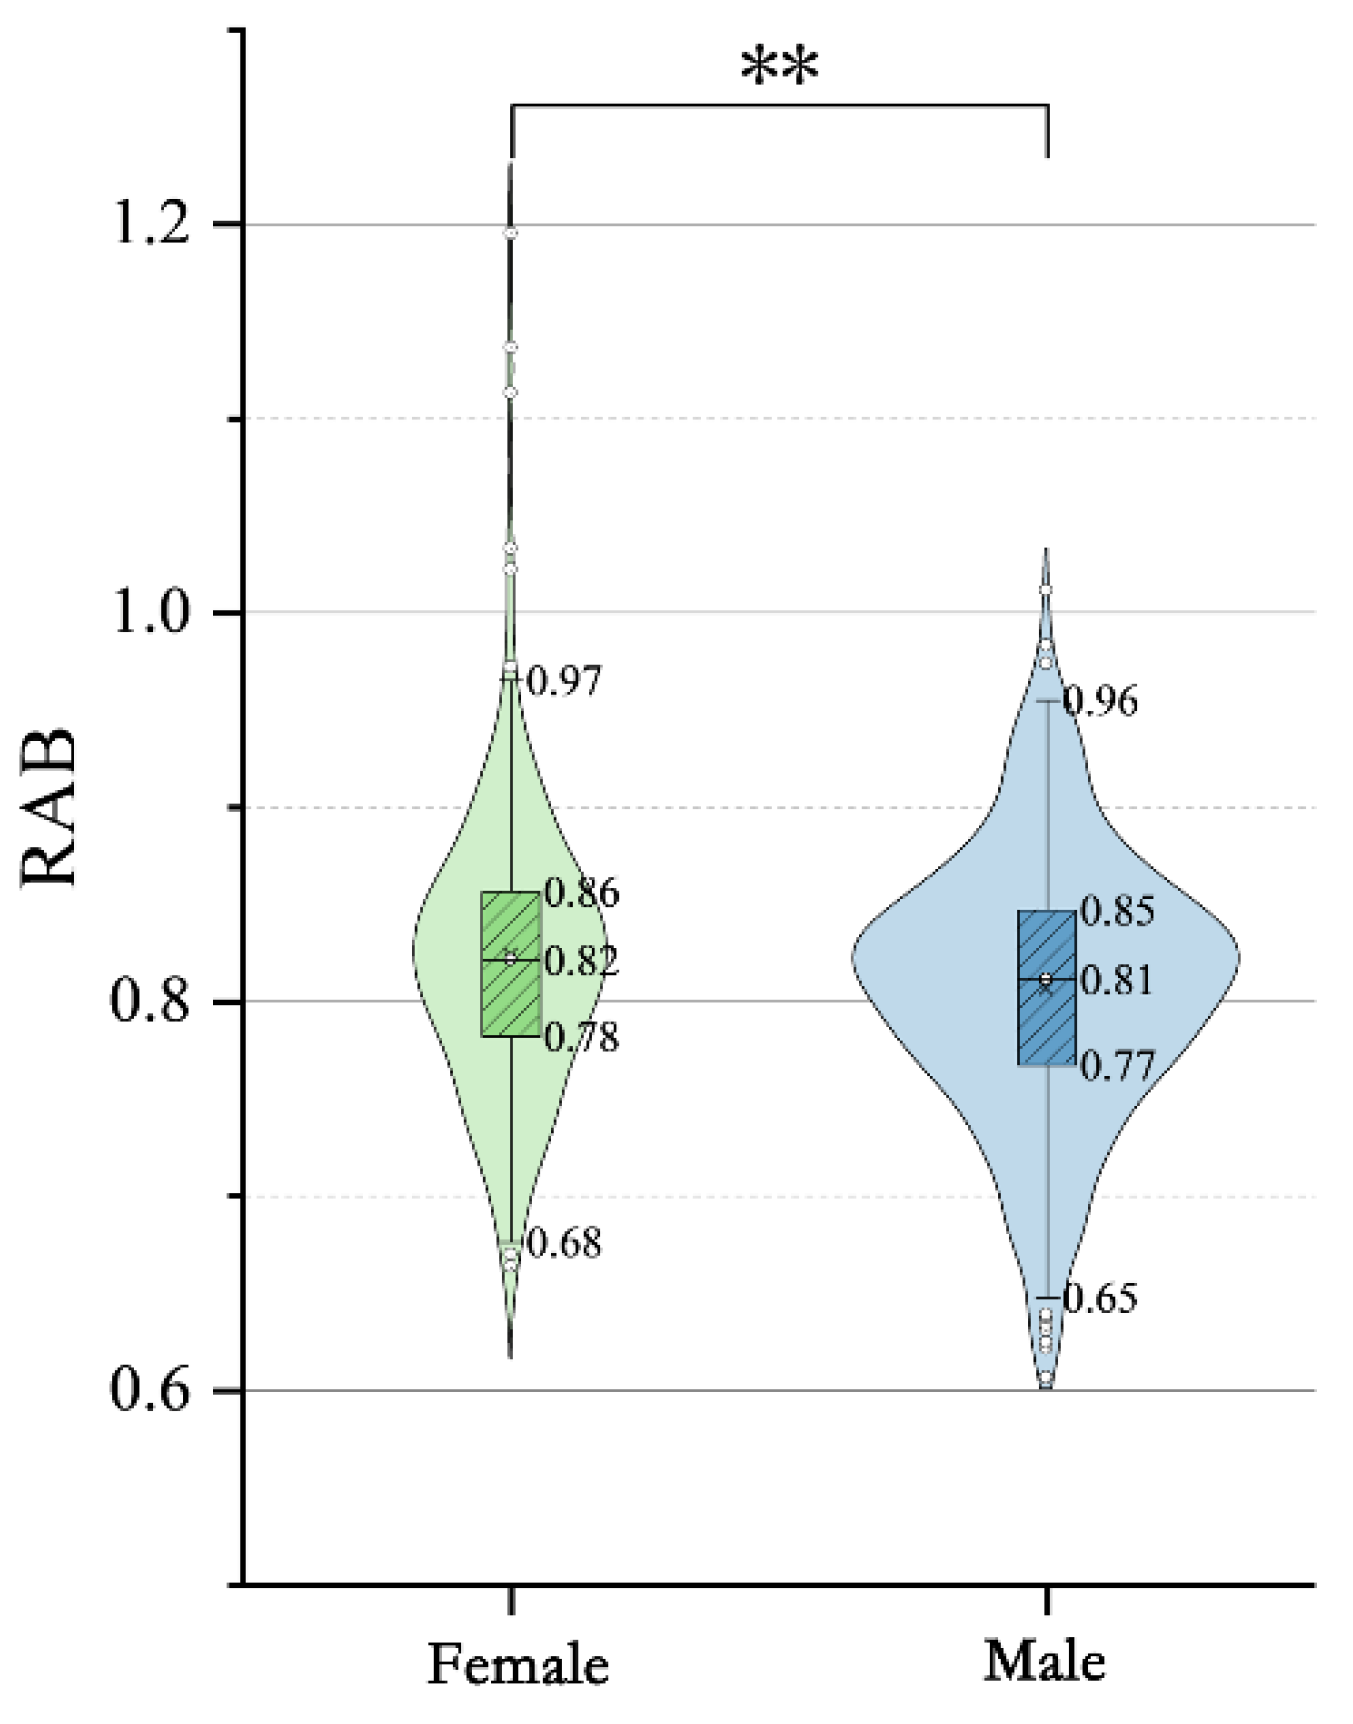
The analysis indicated a statistically significant difference in emotional responses between males and females across various environments (p < 0.01). As shown in Figure 11, the mean RAB value for females (M = 0.82) was higher than that for males (M = 0.81), a pattern that was consistently observed across all three levels of environmental openness. Furthermore, the results demonstrated that the degree of spatial openness had a significant effect on the participants’ emotional states (p < 0.01). As illustrated in Figure 13, the highest mean RAB value was recorded in open spaces (M = 0.83), followed by semi-open spaces (M = 0.81), while closed spaces yielded the lowest mean RAB value (M = 0.80). However, in the ANOVA of the EEG data, no significant differences were found for either SOL or GER (p > 0.05).
Figure 11.
RAB Score of Different Gender.
3.3. GER Correlation Analysis
Through a multifactorial analysis of variance (ANOVA) conducted on the EEG-derived values, the research team found that different levels of the Gray-Green space Exposure Ratio (GER) had a significant effect on the participants’ emotional states (p < 0.001). Research Hypothesis 2 was therefore supported. As shown in Figure X, the mean RAB was highest in areas with a high GER (M = 0.76), followed by semi-grey semi-green spaces (M = 0.73), and lowest in areas with the lowest GER (M = 0.72).
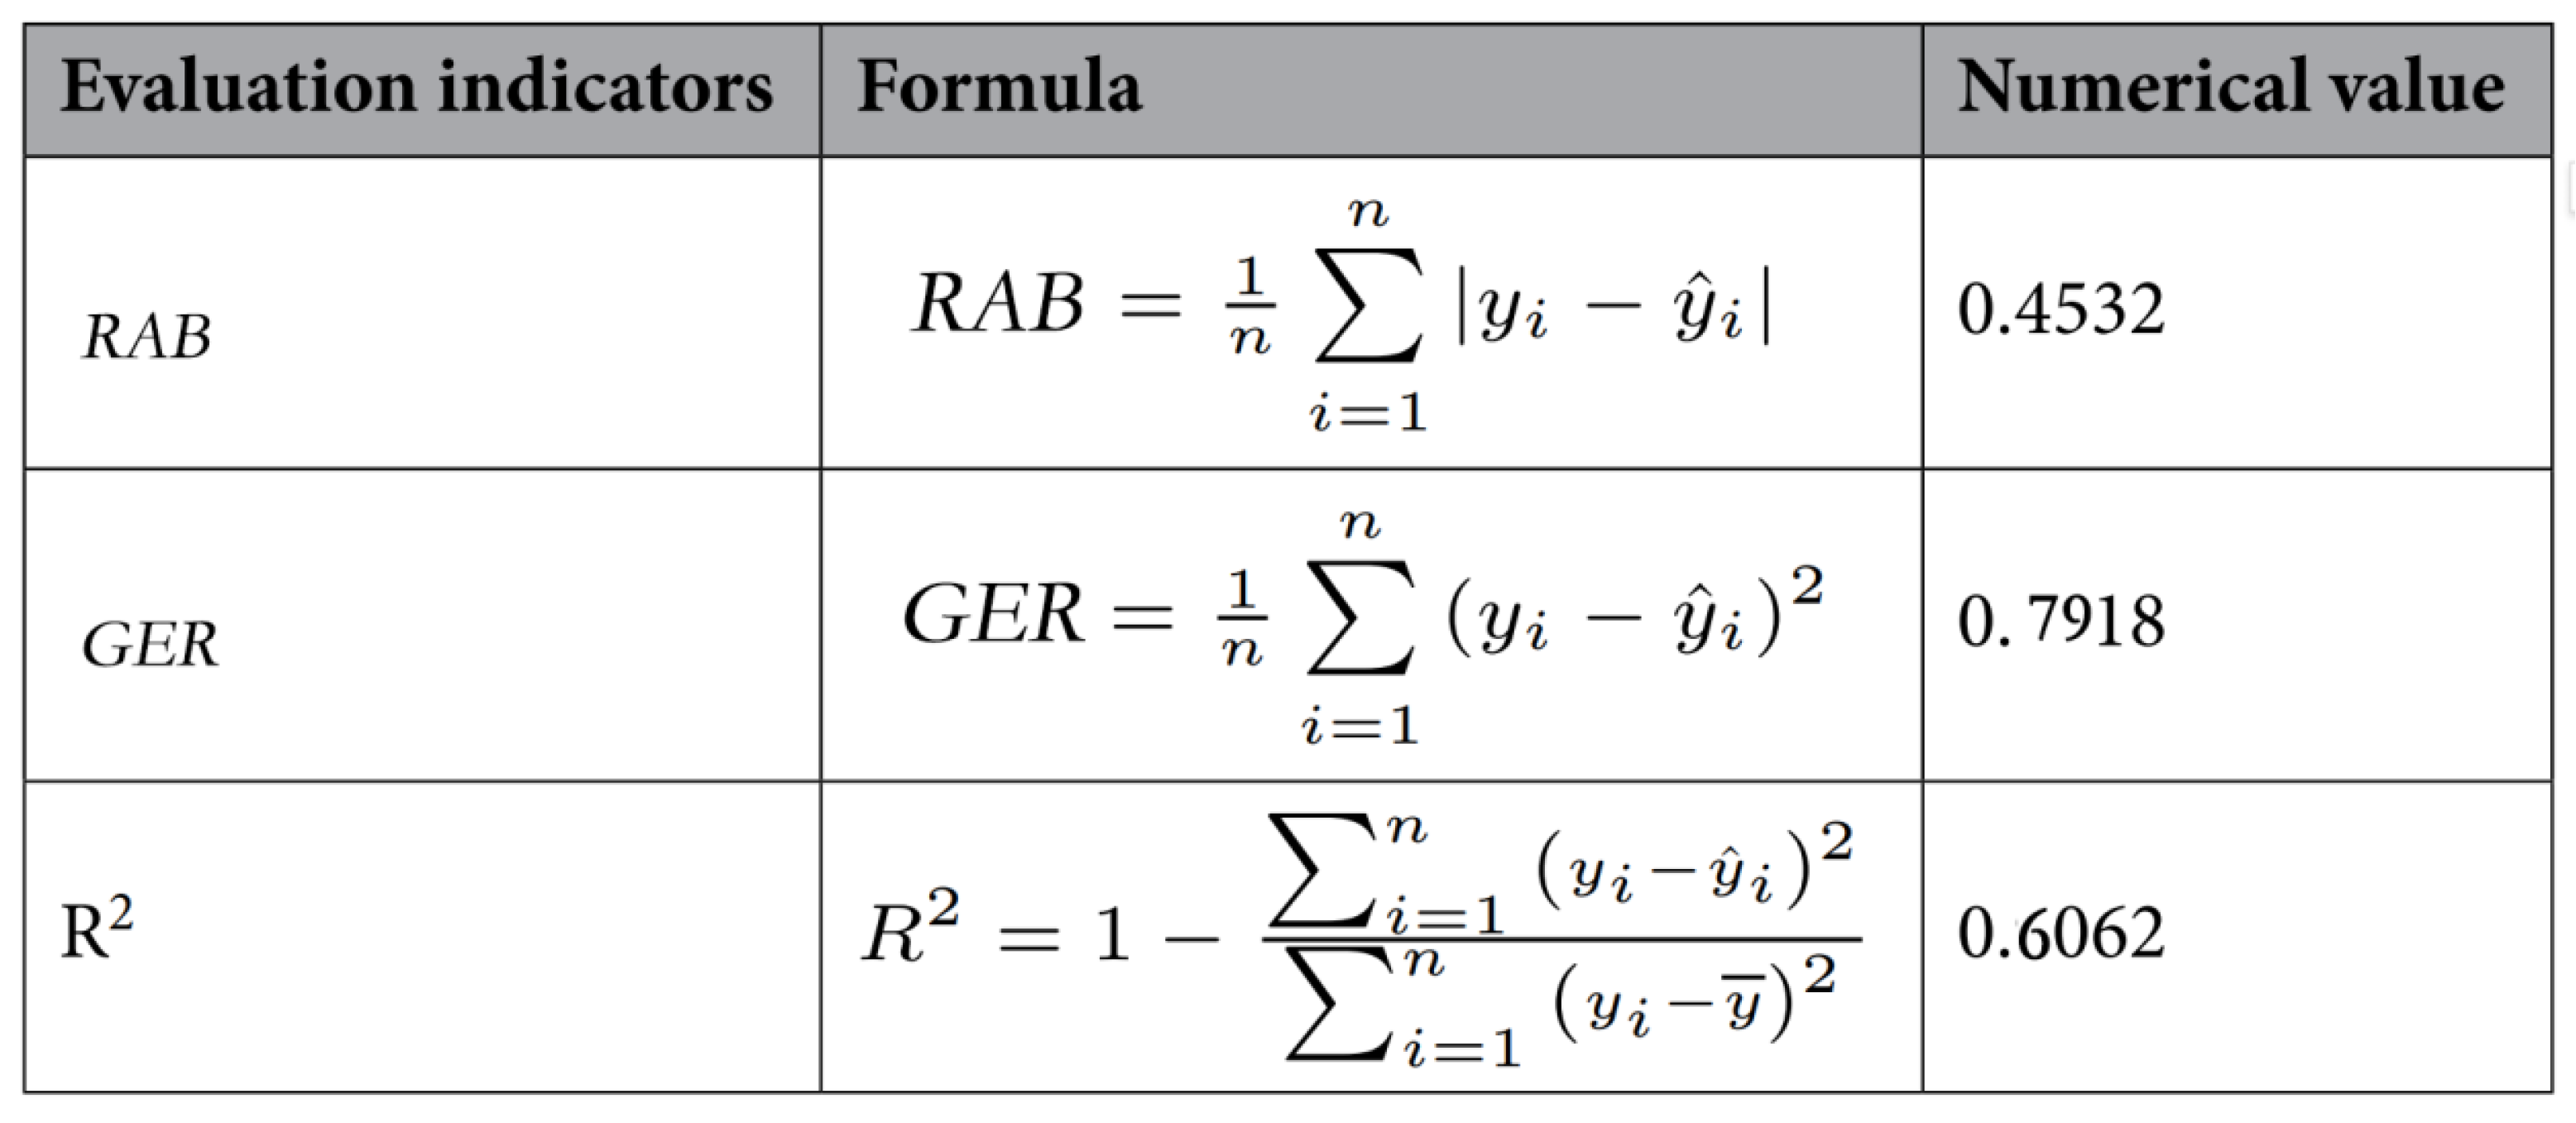
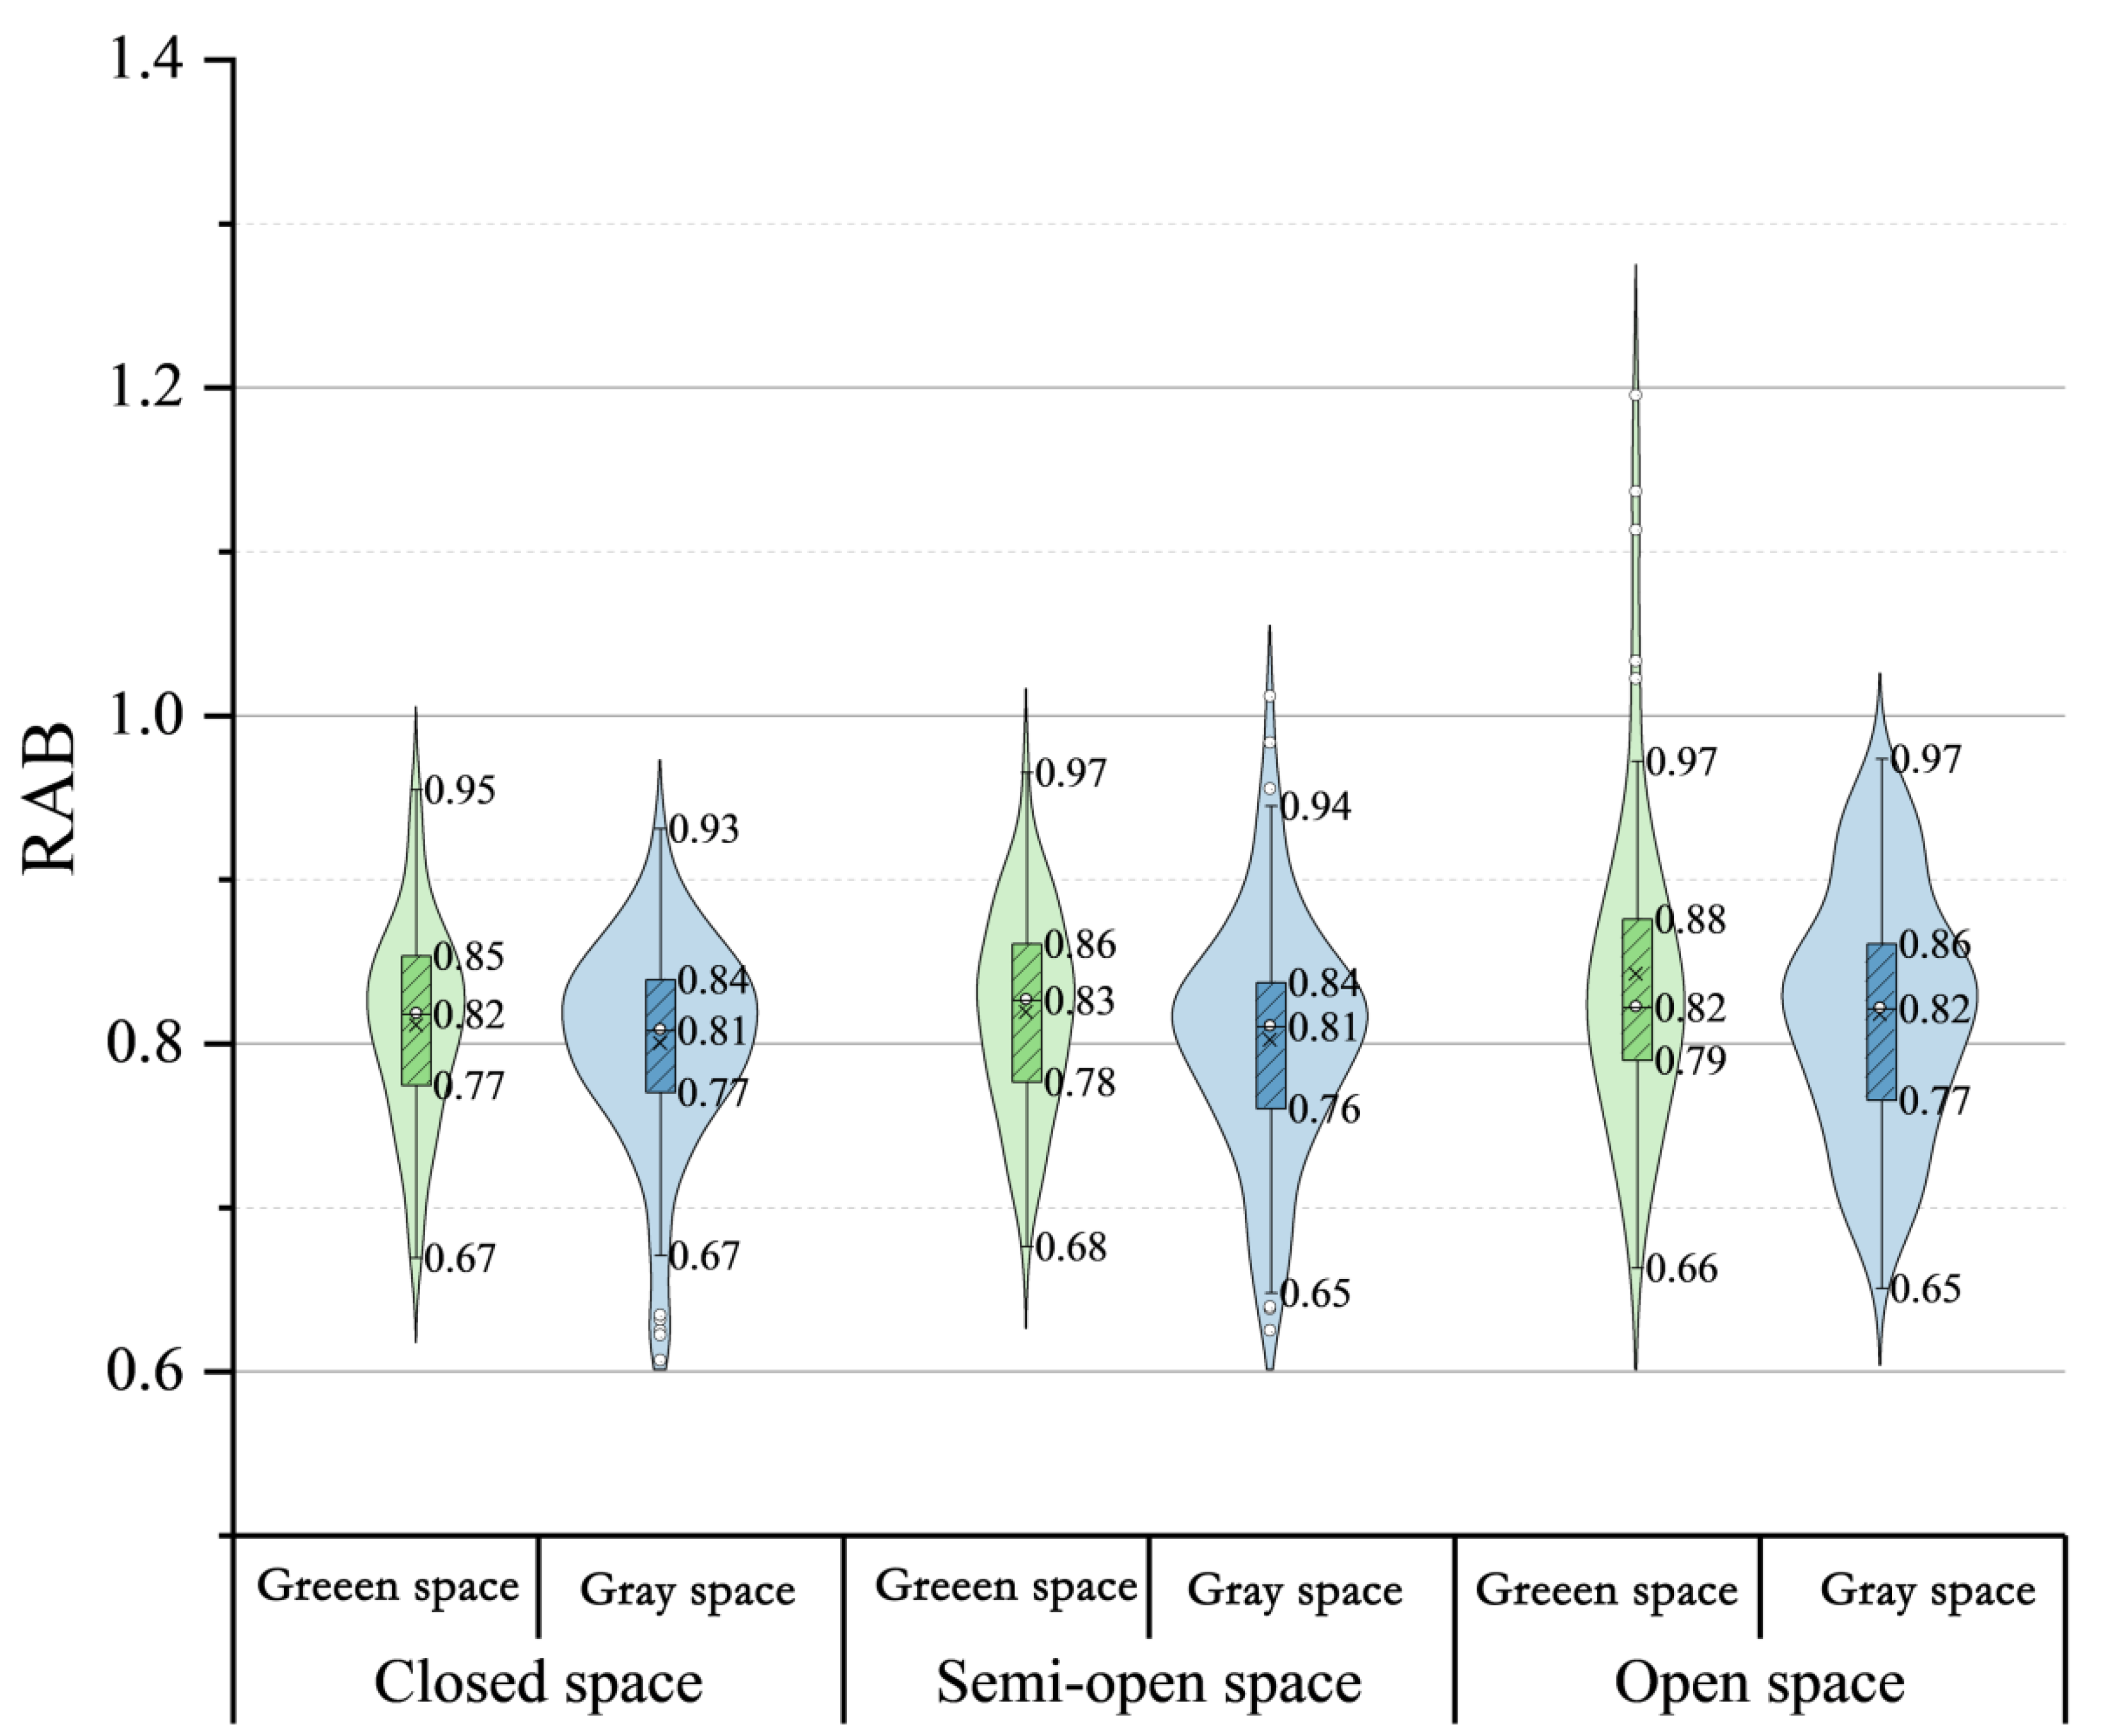
Furthermore, the results indicated that different visual-spatial grey-green compositions significantly influenced emotional states (p < 0.001). As illustrated in Figure 12, the mean RAB in green spaces (M = 0.72) was significantly lower than that in grey spaces (M = 0.74). This finding was consistent across experiments conducted in environments with different SOL (Figure 14). A significant positive correlation was observed between the GER and the emotional states of older adults (correlation coefficient R² = 0.6062, p < 0.01).
Table 6.
Random forest evaluation parameters.
 |
3.4. SOL Correlation Analysis
A significant positive correlation was observed between the degree of openness and the emotional states of older adults (correlation coefficient R² = 0.7262, p < 0.01). Among the tested conditions, open spaces yielded the highest mean RAB. The results of the data model indicated no significant difference compared to the model for the Gray-Green space Exposure Ratio (GER), though the goodness-of-fit, regression coefficients, and correlation showed a slight improvement.
Regarding the emotional responses of older adults to varying degrees of spatial openness, specifically, the goodness-of-fit R² for the GER regression model was 0.6818, indicating a positive relationship. Both GER and SOL showed significant positive correlations with the positive emotions of older adults at the 0.01 and 0.05 levels (p = 0.023 and p = 0.001, respectively). Furthermore, the magnitude of influence of these two indicators on positive emotions was similar: a one-unit increase in the SOL score was associated with a 0.305-unit increase in positive emotion, while a one-unit increase in the GER score corresponded to a 0.275-unit increase.
Compared to the regression results for the GER data, the R² value in the openness (SOL) regression model increased by approximately 0.2, and the model’s predictive performance also improved. This comparison suggests that the positive influence of spatial openness on the positive emotions of older adults was more pronounced.
Table 7.
Random forest evaluation parameters.
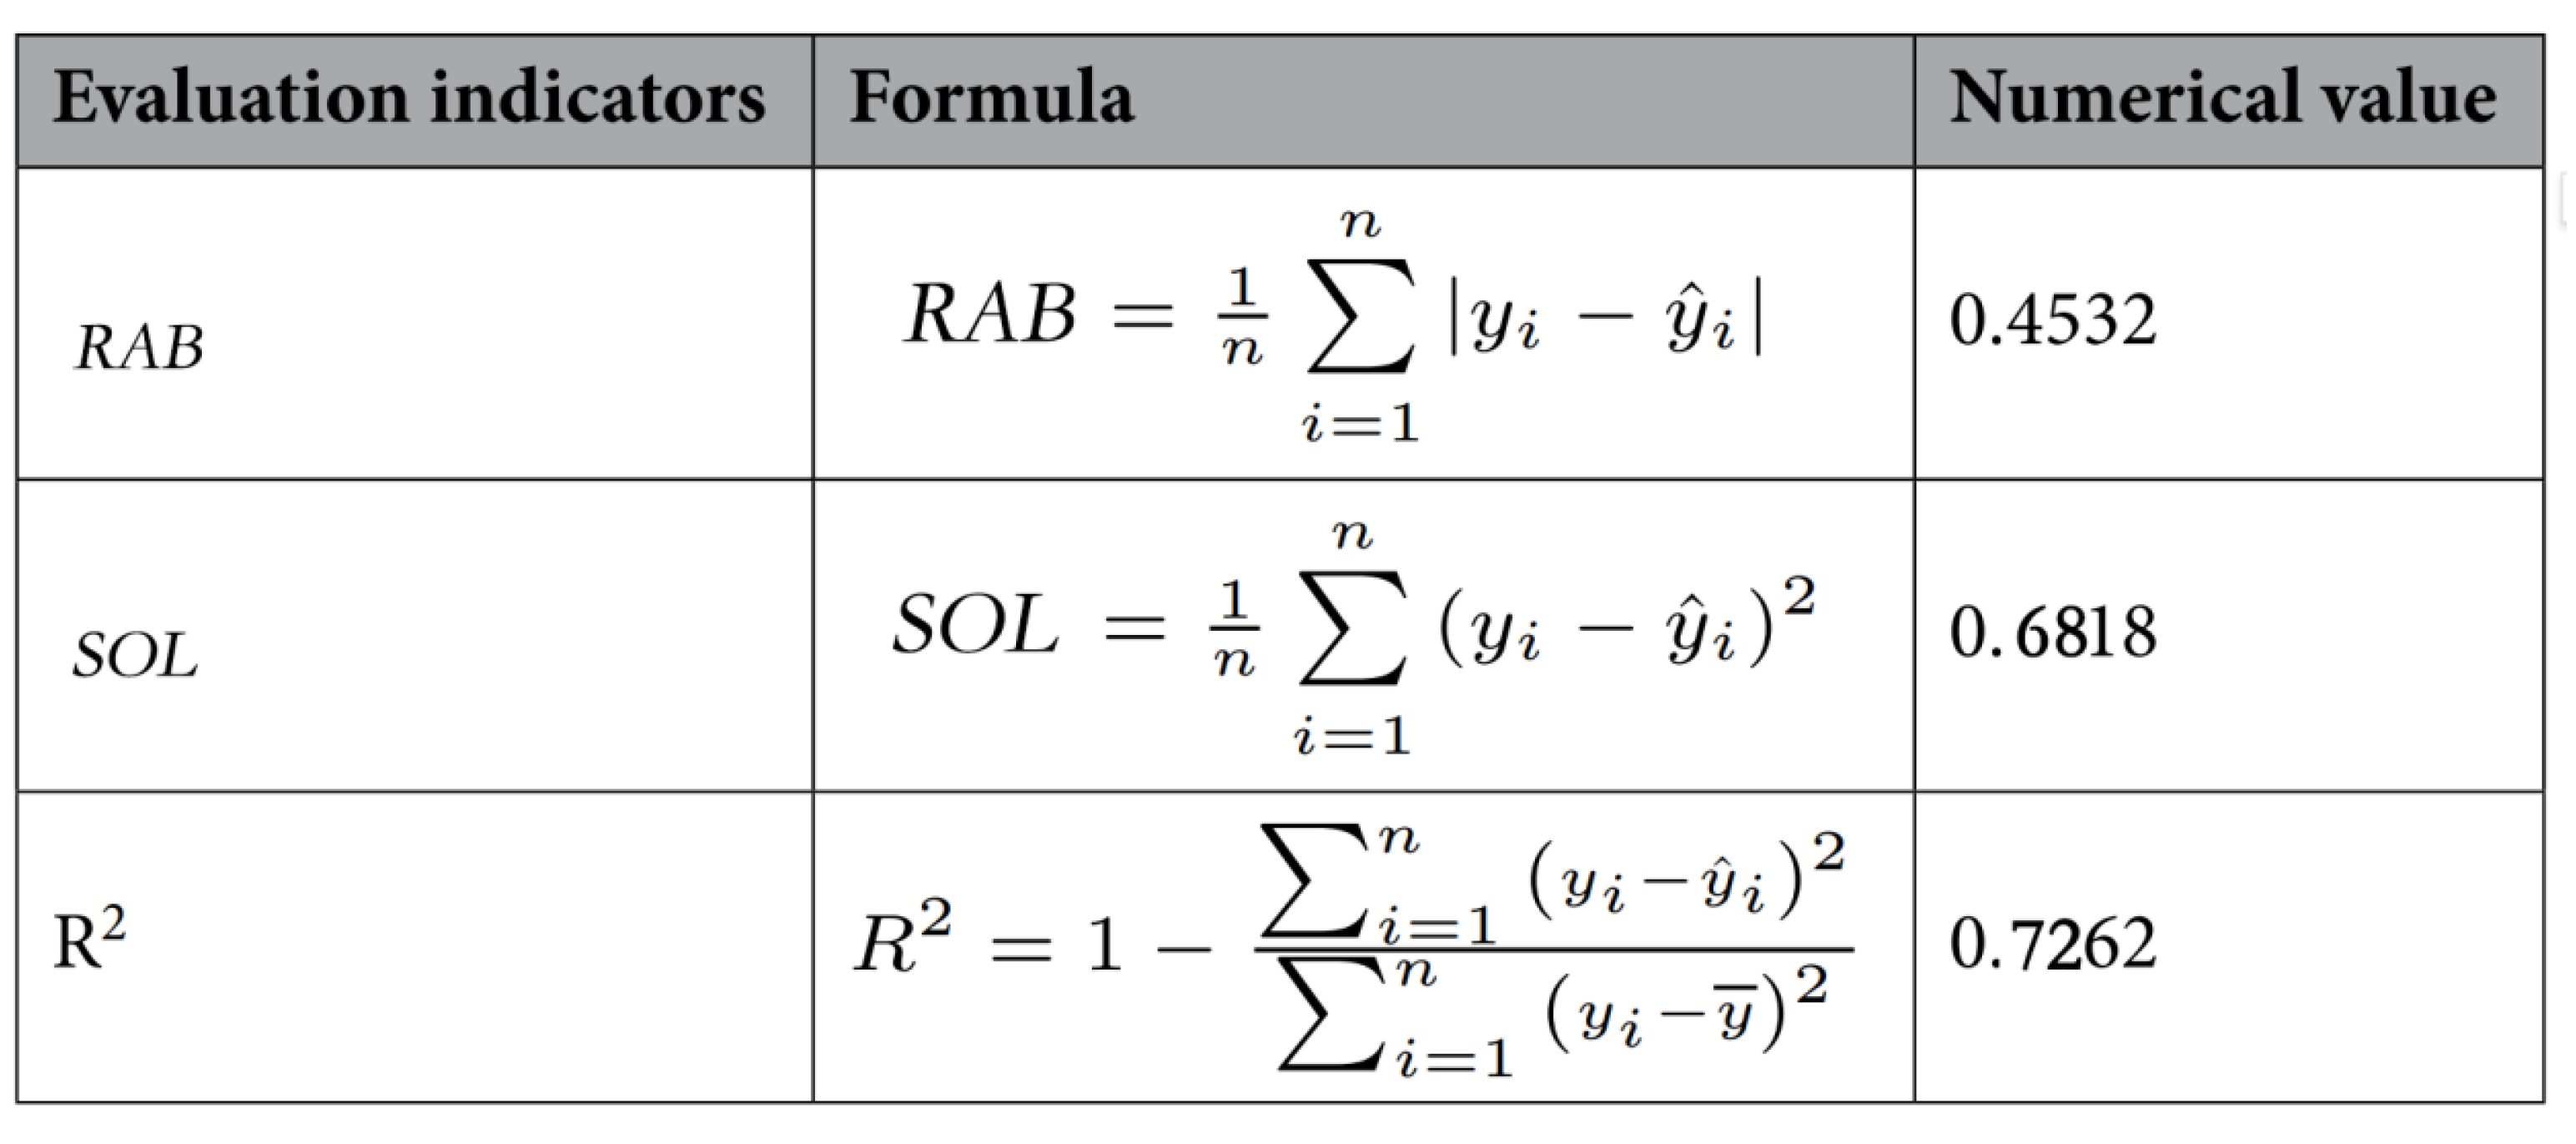 |
Figure 13.
RAB Score in Spaces with Different SOL.
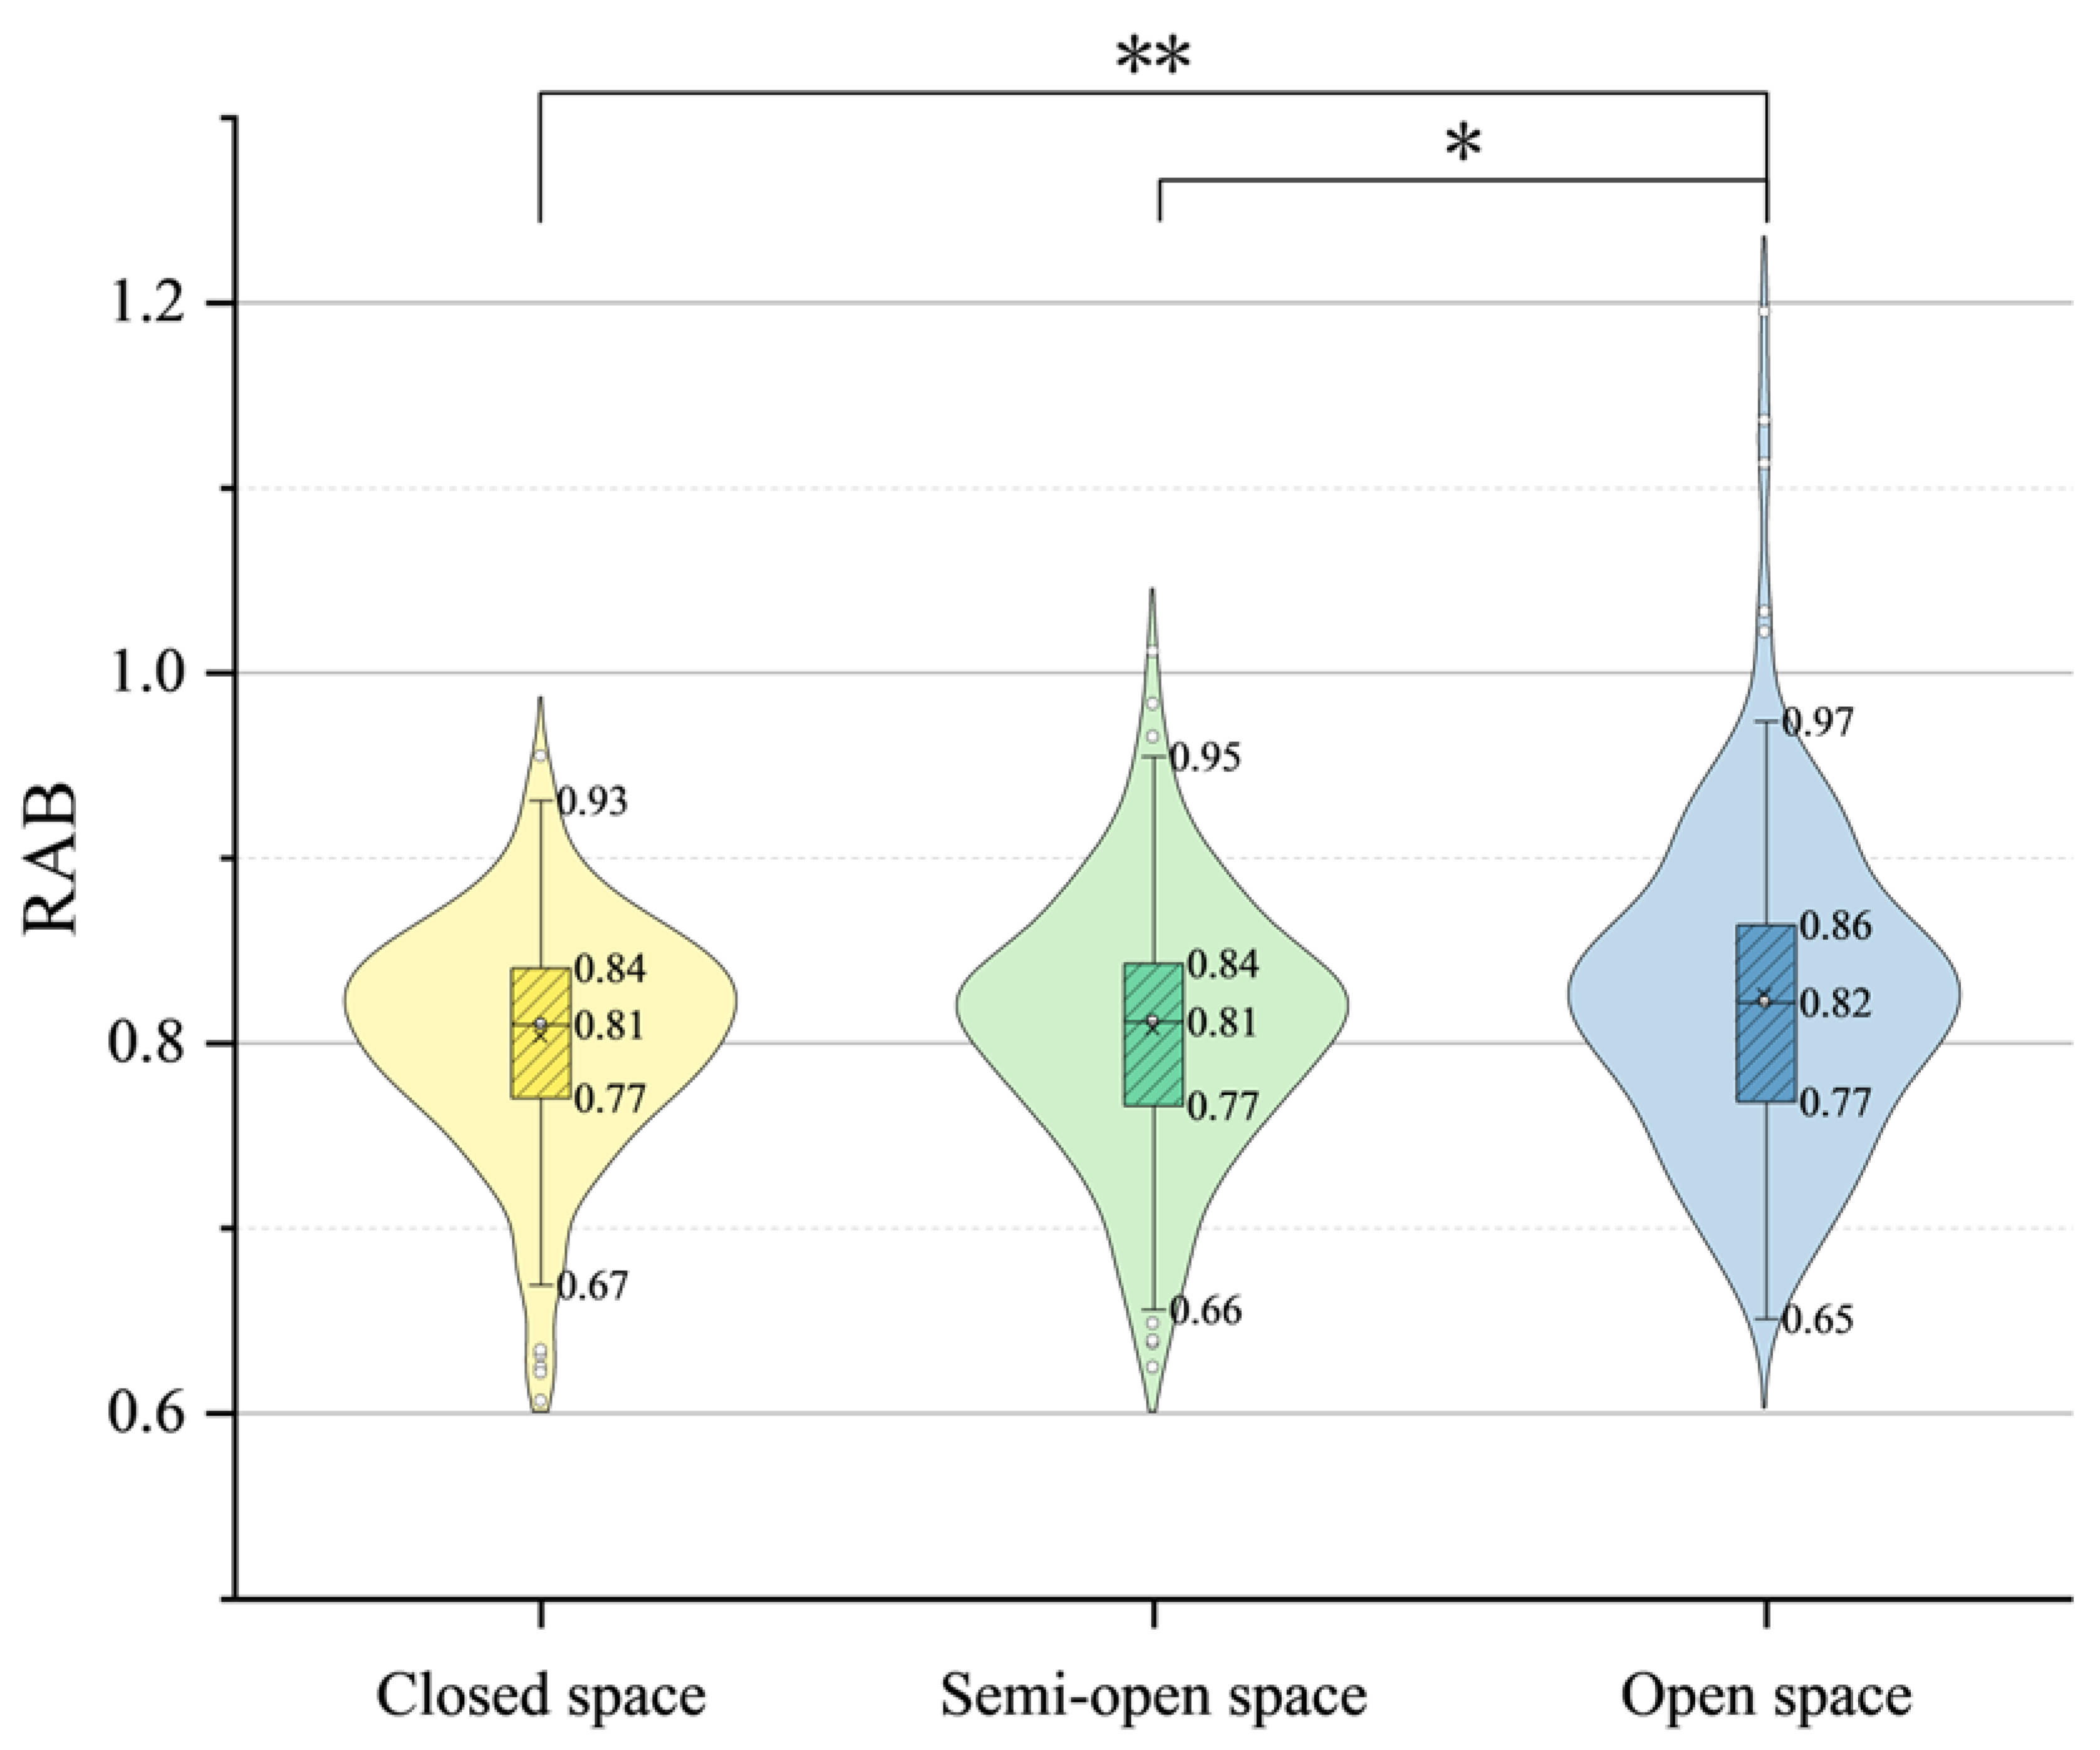
Figure 14.
RAB Scores in Spaces with Different SOL and GER.
4. Discussion
4.1. The Correlation Between Age and Gender
The findings indicate that older adults’ perception of street environments and their emotional responses are associated with both gender and age, primarily due to differences in social roles, behavioral patterns, and perceptual preferences. When the Gray-Green space Exposure Ratio (GER) was held constant, the RAB scores of males and females diverged across different Spatial Openness Level(SOL). The data suggest that women are more sensitive to changes in GER than men, exhibiting a 2% greater amplitude in emotional variation. This observation aligns with broader evidence indicating that women often demonstrate heightened sensitivity and distinct attentional foci toward environmental attributes such as safety, complexity, and social potential [51].
For instance, when street conditions changed (e.g., widened pavement, reduced enclosure), the decline in concentration was more pronounced among women than men. Older women tend to engage in more socially oriented activities, frequently utilizing green spaces such as community gardens and pocket parks for socializing, conversation, and childcare. Consequently, the quality of the “social space” in low-GER environments—including the provision of comfortable seating and perceived safety—is particularly critical for them. Older women generally exhibit greater sensitivity to environmental security [50]. In summary, women show a preference for spaces that balance visibility and enclosure, offering both safety and social comfort, whereas men more frequently occupy open activity and fitness zones, reflecting greater tolerance for exposure and more flexible spatial use patterns [51]. Therefore, a green space with a low GER, even if its nominal greening rate is high, may significantly deter use by older women if poorly designed—for example, with overly dense vegetation (limiting visibility), inadequate lighting, and low pedestrian activity [52]. Older men, by contrast, are less concerned with such factors.
Regarding age, the study found that adults aged 60–70 are generally more sensitive to GER variations than those aged 71–80. Shifts in physical capability, health status, and life priorities lead to differing dependencies and demands on the GER environment. A functional distinction often emerges around age 75, roughly separating the “young-old” from the “old-old.” For the latter group, green space use often shifts from dynamic activity to static engagement. Their needs center on safe, comfortable, shaded resting points where they can sit and observe others. The benefits of green spaces for them transition from promoting physical exercise more toward stress relief, sensory stimulation, cognitive maintenance, and social participation through passive observation—helping to alleviate loneliness and depression. The younger cohort, being relatively healthier and more physically active during their “active aging” phase, tends to use green spaces more for leisure, exercise, and active socialization.
4.2. Significance and Value of the Study
Using video-based street scene imagery, this study investigates the relationship between the Gray-Green space Exposure Ratio (GER), Spatial Openness Level(SOL), and the psychological perception of older adults, revealing a correlation between visual-spatial characteristics and their psychological and emotional states. By applying brainwave measurement techniques to street scene evaluation, a framework of urban visual-spatial characteristics and corresponding metrics was developed. Using these visual-spatial metrics as independent variables, a semantic segmentation analysis was performed on nine categories of street perception. Statistical analysis confirmed that these visual indicators significantly influence psychological perception.
Electroencephalography (EEG) testing revealed a positive correlation between the degree of street enclosure and residents’ perceived safety. This finding aligns with Naik et al., who reported that well-enclosed streets enhance the sense of security and foster social interaction opportunities [48]. Similarly, Cai and Wang observed a higher sense of security among residents in urban centers in China [31]. Spatial Openness Level(SOL) is closely associated with the density of surrounding buildings and trees. Highly enclosed streets are typically characterized by tall buildings and mature trees, often corresponding to urban cores. For moderately enclosed streets, we recommend activating building frontages by encouraging ground-floor public functions—such as retail, cafes, and community service centers—and increasing the proportion of transparent façades (e.g., glass storefronts). These active interfaces provide continuous natural surveillance, significantly enhancing perceived safety for older adults. Furthermore, visually engaging streetscapes can stimulate walking interest and mitigate feelings of loneliness.
The study also found that dense green spaces can effectively alleviate depressive feelings, though they may simultaneously increase stress responses and reduce perceived safety. This suggests that a lower GER is not invariably preferable. Given the limited cognitive resources—such as attention and working memory—in older adults, complex street environments can impose a heavy cognitive load. Conversely, increased road width was associated with heightened anticipation of upcoming street segments, leading to brainwave patterns indicative of greater relaxation. This aligns with Van Hessel and De Vries, who demonstrated that urban greening enhances pleasure and emotional well-being [39], and with Tang and Long, who found that street openness improves landscape attractiveness and activity comfort [40,44].
Prolonged exposure to negative interfaces—such as blank walls, dilapidated façades, or parking garage entrances—along primary pedestrian routes was associated with significantly increased tension among older adults [41,42,43]. Where such interfaces are unavoidable, mitigation through vertical greening, mural art, or informational displays is recommended [45,46,47].
Integrating GER and SOL analysis, the study identifies traditional tree-lined arcade streets as the most favorable model for older adults. Enclosure provides spatial definition and a sense of security, while ample greenery improves microclimate and visual quality. Active street-level interfaces—such as shops—combined with comfortable walking environments encourage spontaneous lingering and social conversation [48,49]. Spatial enclosure supplies the structural framework and psychological boundaries necessary for social behavior, determining a space’s stayability. GER fills this framework, supplying the physical comfort, sensory stimulation, and conversational content that determine a space’s attractiveness and comfort.
4.3. Limitations and Future Research
Several limitations of this study should be acknowledged, which also inform avenues for future research. First, predicting urban perception solely through visual indicators is inherently limited, as it cannot fully encapsulate the multidimensional influences of geographical context, individual psychological states, and building typologies. Second, since the street sample was drawn exclusively from the central urban area of Wuhan, extending the findings to a broader spatial scope would require analysis across multiple urban districts. We have subsequently collected street view imagery from diverse districts in Wuhan to facilitate such extended analysis. Third, dynamic elements and ambient sound within street environments also shape the perceptual experiences of older adults. Future work will therefore incorporate audio analysis from video recordings to examine its correlation with psychological responses, comparing these results with the present visually-driven model. Fourth, while the street-view semantic segmentation method provides objective and consistent measurements at the environmental level, it does not capture inter-individual differences in subjective perception. Subsequent research will focus on analyzing cognitive variations among older adult subgroups, stratified by factors such as age, occupation, and income.
In light of these findings, we propose the following street design principles to support the psychological well-being of older adults in urban settings:
Guiding Transitions at Key Nodes: Approaching important street nodes, deliberate variation in path width can be used to form pre-nodal spaces that serve a guiding function. For example, a gradual transition from a narrower to a wider section can build visual and psychological anticipation for the area ahead.
Alleviating Confinement in Old Neighborhoods: In the renovation of older residential areas, appropriately widening street sections and providing dedicated zones for non-motorized vehicle parking can mitigate the sense of disorder and isolation associated with excessively narrow corridors.
Strategic Greening and Openness: To reduce oppressive feelings and enhance well-being, urban interventions should prioritize increasing green space proportions and enhancing visual openness in targeted areas. Implementing vertical greening along community streets, for instance, could be an effective strategy to alleviate depressive moods and improve neighborhood livability.
Finally, two methodological considerations warrant mention. Although the computational extraction of GER and SOL enhances objectivity, it depends on the accuracy of the underlying semantic segmentation model. Despite using a state-of-the-art model with verification, misclassification of complex urban elements (e.g., glass façades, green walls) may introduce minor measurement errors. Furthermore, as noted in the Methods, the current laboratory-based analysis does not account for potential geographic spatial autocorrelation between sampling points, as the primary focus was on the universal effect of visual features rather than location-specific patterns.
5. Conclusion
The primary contribution of this study lies in its methodological integration of objective physiological monitoring (EEG) to capture participant responses across varying levels of the Gray-Green space Exposure Ratio (GER) and Spatial Openness Level (SOL). The findings demonstrate that both GER and SOL significantly influence the emotional states of older adults, as evidenced by systematic variations in relaxation levels and concentration under different environmental conditions.
The analysis yielded several key results. Environments with high green coverage and greater openness are associated with increased happiness and reduced depressive feelings among residents. Both tree density and spatial openness positively correlate with perceived happiness and vitality. Green, open settings enhance aesthetic appreciation while mitigating negative psychological states. Furthermore, dense street layouts were found to enhance urban vitality, and an appropriate SOL promotes a sense of security. Additional visual-spatial indicators also shape perception; for instance, visible sky (“blue space”) alleviates depression by reducing the sense of enclosure—a finding consistent with prior research on the mental health benefits of green space exposure for older adults [50,51,52]. Gender differences were also evident, with women showing greater sensitivity to SOL than to GER, and highly enclosed spaces proving less conducive to social interaction among women and older adults.
Building on these findings, future research should incorporate a broader range of factors and examine GER and SOL from multidimensional perspectives to further elucidate their relationship with the psychological well-being of older urban residents. In practical terms, the results can inform human-centered urban design guidelines aimed at fostering social interaction. For instance, the introduction of pocket parks in built-up areas, the development of small-scale and vertical greening in elderly communities, and the strategic integration of greenery around commercial and office buildings can create more engaging outdoor spaces. Such interventions not only encourage pedestrians to linger—thereby enhancing neighborhood commercial diversity—but may also establish a positive feedback loop between foot traffic and local business vitality.
Author Contributions
Lu Min was responsible for the experimental design, data collection, data analysis, and the initial drafting of the paper. Wei Shang is responsible for providing the research concept, supervising the entire project, guiding the data analysis, making crucial revisions, and finalizing the draft of the paper.
Funding
This paper was funded by the Key Laboratory of Intelligent Health Perception and Ecological Restoration of Rivers and Lakes, Ministry of Education, Hubei University of Technology. This paper was funded by the Innovation Demonstration Base of Ecological Environment Geotechnical and Ecological Restoration of Rivers and Lakes (2020EJB004).
Institutional Review Board Statement
This study strictly adhered to the Helsinki Declaration and relevant ethical regulations. This experimental plan has been approved by the Research Ethics and Science and Technology Safety Committee of Hubei University of Technology. Approval Number: HBUT20250053,Date of Approval: 5 March 2025.
Informed Consent Statement
All participants were volunteers and signed written informed consent forms before the experiment. The data will be anonymized and will not be used for commercial purposes. Written informed consent has been obtained from the patient(s) to publish this paper.
Data Availability
Data is provided within the manuscript or supplementary information files.
Acknowledgments
This paper was funded by the Innovation Demonstration Base of Ecological Environment Geotechnical and Ecological Restoration of Rivers and Lakes (2020EJB004).
Competing Interests
The authors declare no competing interests.
Additional Information
Correspondence and requests for materials should be addressed to W.S.
References
- Xia Z, Wang X, Wang H, et al. Age-Friendly Street Construction: The Synergy of the Physical Environment in Old Urban Communities in Suzhou[J]. Buildings (2075-5309), 2024, 14(11).
- Bzdok, D., & Dunbar, R. I. M. (2022). Social isolation and the brain in the pandemic era. Nature Human Behaviour, 6(10), Article 10. [CrossRef]
- Von dem Knesebeck O. Health inequalities in ageing societies[J]. International journal of public health, 2010, 55(6): 523-524. [CrossRef]
- Y., Yu, L. Productive engagement patterns and their association with life satisfaction among the elderly sandwich generation. Sci Rep 15, 37266 (2025). [CrossRef]
- Reutter L, Kushner K E.‘Health equity through action on the social determinants of health: taking up the challenge in nursing[J]. Nursing inquiry, 2010, 17(3): 269-280. [CrossRef]
- Wang, Z., Han, P. & Chen, W. Unravelling the combination of medical and elderly care in China: a comprehensive policy analysis. Humanit Soc Sci Commun 12, 1463 (2025). [CrossRef]
- World Health Organization (WHO). Global Age-Friendly Cities: A Guide; 2007; Available online: https://www.who.int/publications/i/item/9789241547307 (accessed on 5 October 2007).
- Wang, Z.; Ettema, D.; Helbich, M. Age as effect modifier of the associations between the physical environment and adults’ neighborhood walking in the Netherlands. Cities 2023, 135, 104194.
- Yang, H.; Zhang, Q.; Helbich, M.; Lü, Y.; He, D.; Ettema, D.; Chen, L. Examining non-linear associations between built environments around workplace and adults’ walking behaviour in Shanghai, China. Transp. Res. Part A Policy Pract. 2022, 155, 234–246.
- Bempong, A.E.; Asiamah, N. Neighbourhood walkability as a moderator of the associations between older Ghanaians’ social activity, and the frequency of walking for transportation: A cross-sectional study with sensitivity analyses. Arch. Gerontol. Geriatr. 2022, 100, 104660.
- Hu J, Zhang F, Qiu B, et al. Green-gray imbalance: Rapid urbanization reduces the probability of green space exposure in early 21st-century China[J]. Science of the Total Environment, 2024, 933: 173168. [CrossRef]
- Martinez, A.D.L.I., Labib, S.M., 2023. Demystifying normalized difference vegetation index (NDVI) for greenness exposure assessments and policy interventions in urban greening. Environ. Res. 220, 115155. [CrossRef]
- Ma X, Ma C, Wu C, et al. Measuring human perceptions of streetscapes to better inform urban renewal: A perspective of scene semantic parsing[J]. Cities, 2021, 110: 103086. [CrossRef]
- Chen, J., Kinoshita, T., Li, H., Luo, S., Su, D., Yang, X., Hu, Y., 2023. Toward green equity: an extensive study on urban form and green space equity for shrinking cities. Sustain. Cities Soc. 90, 104395 . [CrossRef]
- Chen Y, Huang X, White M. A study on street walkability for older adults with different mobility abilities combining street view image recognition and deep learning-The case of Chengxianjie Community in Nan**g (China)[J]. Computers, Environment and Urban Systems, 2024, 112: 102151. [CrossRef]
- Tang J, Long Y. Measuring visual quality of street space and its temporal variation: Methodology and its application in the Hutong area in Beijing[J]. Landscape and Urban Planning, 2019, 191: 103436. [CrossRef]
- Chen, J., Li, H., Luo, S., Su, D., Xie, J., Zang, T., Kinoshita, T., 2024. Estimating changes in inequality of ecosystem services provided by green exposure: from a human health perspective. Sci. Total Environ. 908, 168265. [CrossRef]
- Park K, Ewing R, Sabouri S, et al. Street life and the built environment in an auto-oriented US region[J]. Cities, 2019, 88: 243-251. [CrossRef]
- Jia, J., Zlatanova, S., Liu, H., Aleksandrov, M., Zhang, K., 2023. A design-support framework to assess urban green spaces for human wellbeing. Sustain. Cities Soc. 98, 104779 . [CrossRef]
- von Faber M, Tavy Z, van der Pas S. Engaging older people in age-friendly cities through participatory video design[J]. International Journal of Environmental Research and Public Health, 2020, 17(23): 8977. [CrossRef]
- Dai L, Zheng C, Dong Z, et al. Analyzing the correlation between visual space and residents’ psychology in Wuhan, China, using street-view images and a deep-learning technique[J]. City and Environment Interactions, 2021, 11: 100069. [CrossRef]
- Khosla A, Khandnor P, Chand T. A comparative analysis of signal processing and classification methods for different applications based on EEG signals[J]. Journal of Biocybernetics and Biomedical Engineering, 2020, 40(2): 649-690.
- Erkan, İ. Examining Wayfinding Behaviours in Architectural Spaces Using Brain Imaging with Electroencephalography (EEG). Archit. Sci. Rev. 2018, 61, 410–428.
- Musha, T.; Terasaki, Y.; Haque, H.A.; Ivanitsky, G.A. Feature Extraction from EEGs Associated with Emotions. Artif. Life Robot. 1997, 1, 15–19.
- Karandinou, A.; Turner, L. Architecture and Neuroscience; What Can the EEG Recording of Brain Activity Reveal about a Walk through Everyday Spaces? Int. J. Parallel Emergent Distrib. Syst. 2017, 32, S54–S65.
- Chen Z, He Y J, Yu Y G. Enhanced functional connectivity properties of human brains during insitu nature experience[J]. Peer J, 2016(4): e2210.
- Khushaba R N, Greenacre L, Kodagoda S, et al. Choice modeling and the brain: A study on the Electroencephalogram (EEG) of preferences[J]. Expert Systems with Applications, 2012, 39(16): 12378-12388.
- Paikan, Esmat, Mohammad Reza Pourjafar, and Ehsan Ranjbar. “The Effects of Physical-Spatial Measures of Urban Streets on Pedestrians’ Emotional Responses Using EEG.” Motaleate Shahri 11.44 (2022): 47-62. [CrossRef]
- Dai L, Zheng C, Dong Z, et al. Analyzing the correlation between visual space and residents’ psychology in Wuhan, China, using street-view images and a deep-learning technique[J]. City and Environment Interactions, 2021, 11: 100069. [CrossRef]
- von Faber M, Tavy Z, van der Pas S. Engaging older people in age-friendly cities through participatory video design[J]. International Journal of Environmental Research and Public Health, 2020, 17(23): 8977. [CrossRef]
- Wang R, Helbich M, Yao Y, et al. Urban greenery and mental well-being in adults: Cross-sectional mediation analyses on multiple pathways across different greenery measures[J]. Environmental research, 2019, 176: 108535. [CrossRef]
- Wang R, Lu Y, Zhang J, et al. The relationship between visual enclosure for neighbourhood street walkability and elders’ mental health in China: Using street view images[J]. Journal of transport & health, 2019, 13: 90-102. [CrossRef]
- Lu Y, Chen Y, Zhao D, et al. Graph-FCN for image semantic segmentation[C]//International symposium on neural networks. Cham: Springer International Publishing, 2019: 97-105.
- Ma X, Ma C, Wu C, et al. Measuring human perceptions of streetscapes to better inform urban renewal: A perspective of scene semantic parsing[J]. Cities, 2021, 110: 103086. [CrossRef]
- Deng, L., Li, X., Luo, H., Fu, E.-K., Ma, J., Sun, L.-X., Huang, Z., Cai, S.-Z., & Jia, Y. (2020). Empirical study of landscape types, landscape elements and landscape components of the urban park promoting physiological and psychological restoration. Urban Forestry & Urban Greening, 48, 126488. [CrossRef]
- Little, Simon, et al. “Beta band stability over time correlates with Parkinsonian rigidity and bradykinesia.” Experimental neurology 236.2 (2012): 383-388. [CrossRef]
- Yi Wen, T., & Mohd Aris, S. A. (2020). Electroencephalogram (EEG) stress analysis on alpha/beta ratio and theta/beta ratio. Indonesian Journal of Electrical Engineering and Computer Science, 17(1), 175. [CrossRef]
- Babiloni, Claudio, et al. “Measures of resting state EEG rhythms for clinical trials in Alzheimer’s disease: recommendations of an expert panel.” Alzheimer’s & Dementia 17.9 (2021): 1528-1553. [CrossRef]
- Van Hoof, J.; Dikken, J.; Buttigieg, S.C.; van den Hoven, R.; Kroon, E.; Martson, H.R. Age-friendly cities in the Netherlands: An explorative study of facilitators and hindrances in the built environment and ageism in design. Indoor Built Environ. 2020, 29, 417–437.
- Tang J, Long Y. Measuring visual quality of street space and its temporal variation: Methodology and its application in the Hutong area in Bei**g[J]. Landscape and Urban Planning, 2019, 191: 103436. [CrossRef]
- Wu S, Wu S, Chen J, et al. An Interpretable Machine Learning Approach to Studying Environmental Safety Perception Among Elderly Residents in Pocket Parks[J]. Buildings, 2025, 15(18): 3411. [CrossRef]
- Li F, Wang R, Paulussen J, et al. Comprehensive concept planning of urban greening based on ecological principles: a case study in Bei**g, China[J]. Landscape and urban planning, 2005, 72(4): 325-336. [CrossRef]
- Chen, J., Kinoshita, T., Li, H., Luo, S., Su, D., Yang, X., Hu, Y., 2023. Toward green equity: an extensive study on urban form and green space equity for shrinking cities. Sustain. Cities Soc. 90, 104395 . [CrossRef]
- Ewing R, Handy S. Measuring the unmeasurable: urban design qualities related to walkability, J[J]. Journal of Urban Design, 2009, 14(1): 65-84. [CrossRef]
- Jiang B, Larsen L, Deal B, et al. A dose–response curve describing the relationship between tree cover density and landscape preference[J]. Landscape and urban planning, 2015, 139: 16-25. [CrossRef]
- Dong, J., Guo, R., Guo, F., Guo, X., Zhang, Z., 2023. Pocket parks—a systematic literature review. Environ. Res. Lett. 18 (8), 083003 . [CrossRef]
- Bai, X., Yu, Z., Wang, B., Zhang, Y., Zhou, S., Sha, X., Li, S., Yao, X., Geng, X., 2024. Quantifying threshold and scale response of urban air and surface temperature to surrounding landscapes under extreme heat. Build. Environ. 247, 111029 https:// doi.org/10.1016/j.buildenv.2023.111029.
- Naik N, Kominers S D, Raskar R, et al. Do people shape cities, or do cities shape people? The co-evolution of physical, social, and economic change in five major US cities[R]. National Bureau of Economic Research, 2015. [CrossRef]
- Li M, Luo J. Investigating Women’s Preferences for Urban Green Spaces by Using the Fuzzy-Set Quantitative Comparative Analysis Method: The Case of Chengdu, China[J]. Land, 2025, 14(4): 716. [CrossRef]
- Zhang Z, Tan Y, Shi B, et al. Spatiotemporal Variation in Spatial Vitality Reveals Gender Differences in Park Usage: An Empirical Study from Dalian, China[J]. Land, 2025, 14(11): 2186. [CrossRef]
- Wang A, Meng Z, Zhao B, et al. Using Social Media Data to Research the Impact of Campus Green Spaces on Students’ Emotions: A Case Study of Nanjing Campuses[J]. Sustainability, 2024, 16(2): 691. [CrossRef]
Figure 1.
Flowchart of the research process.
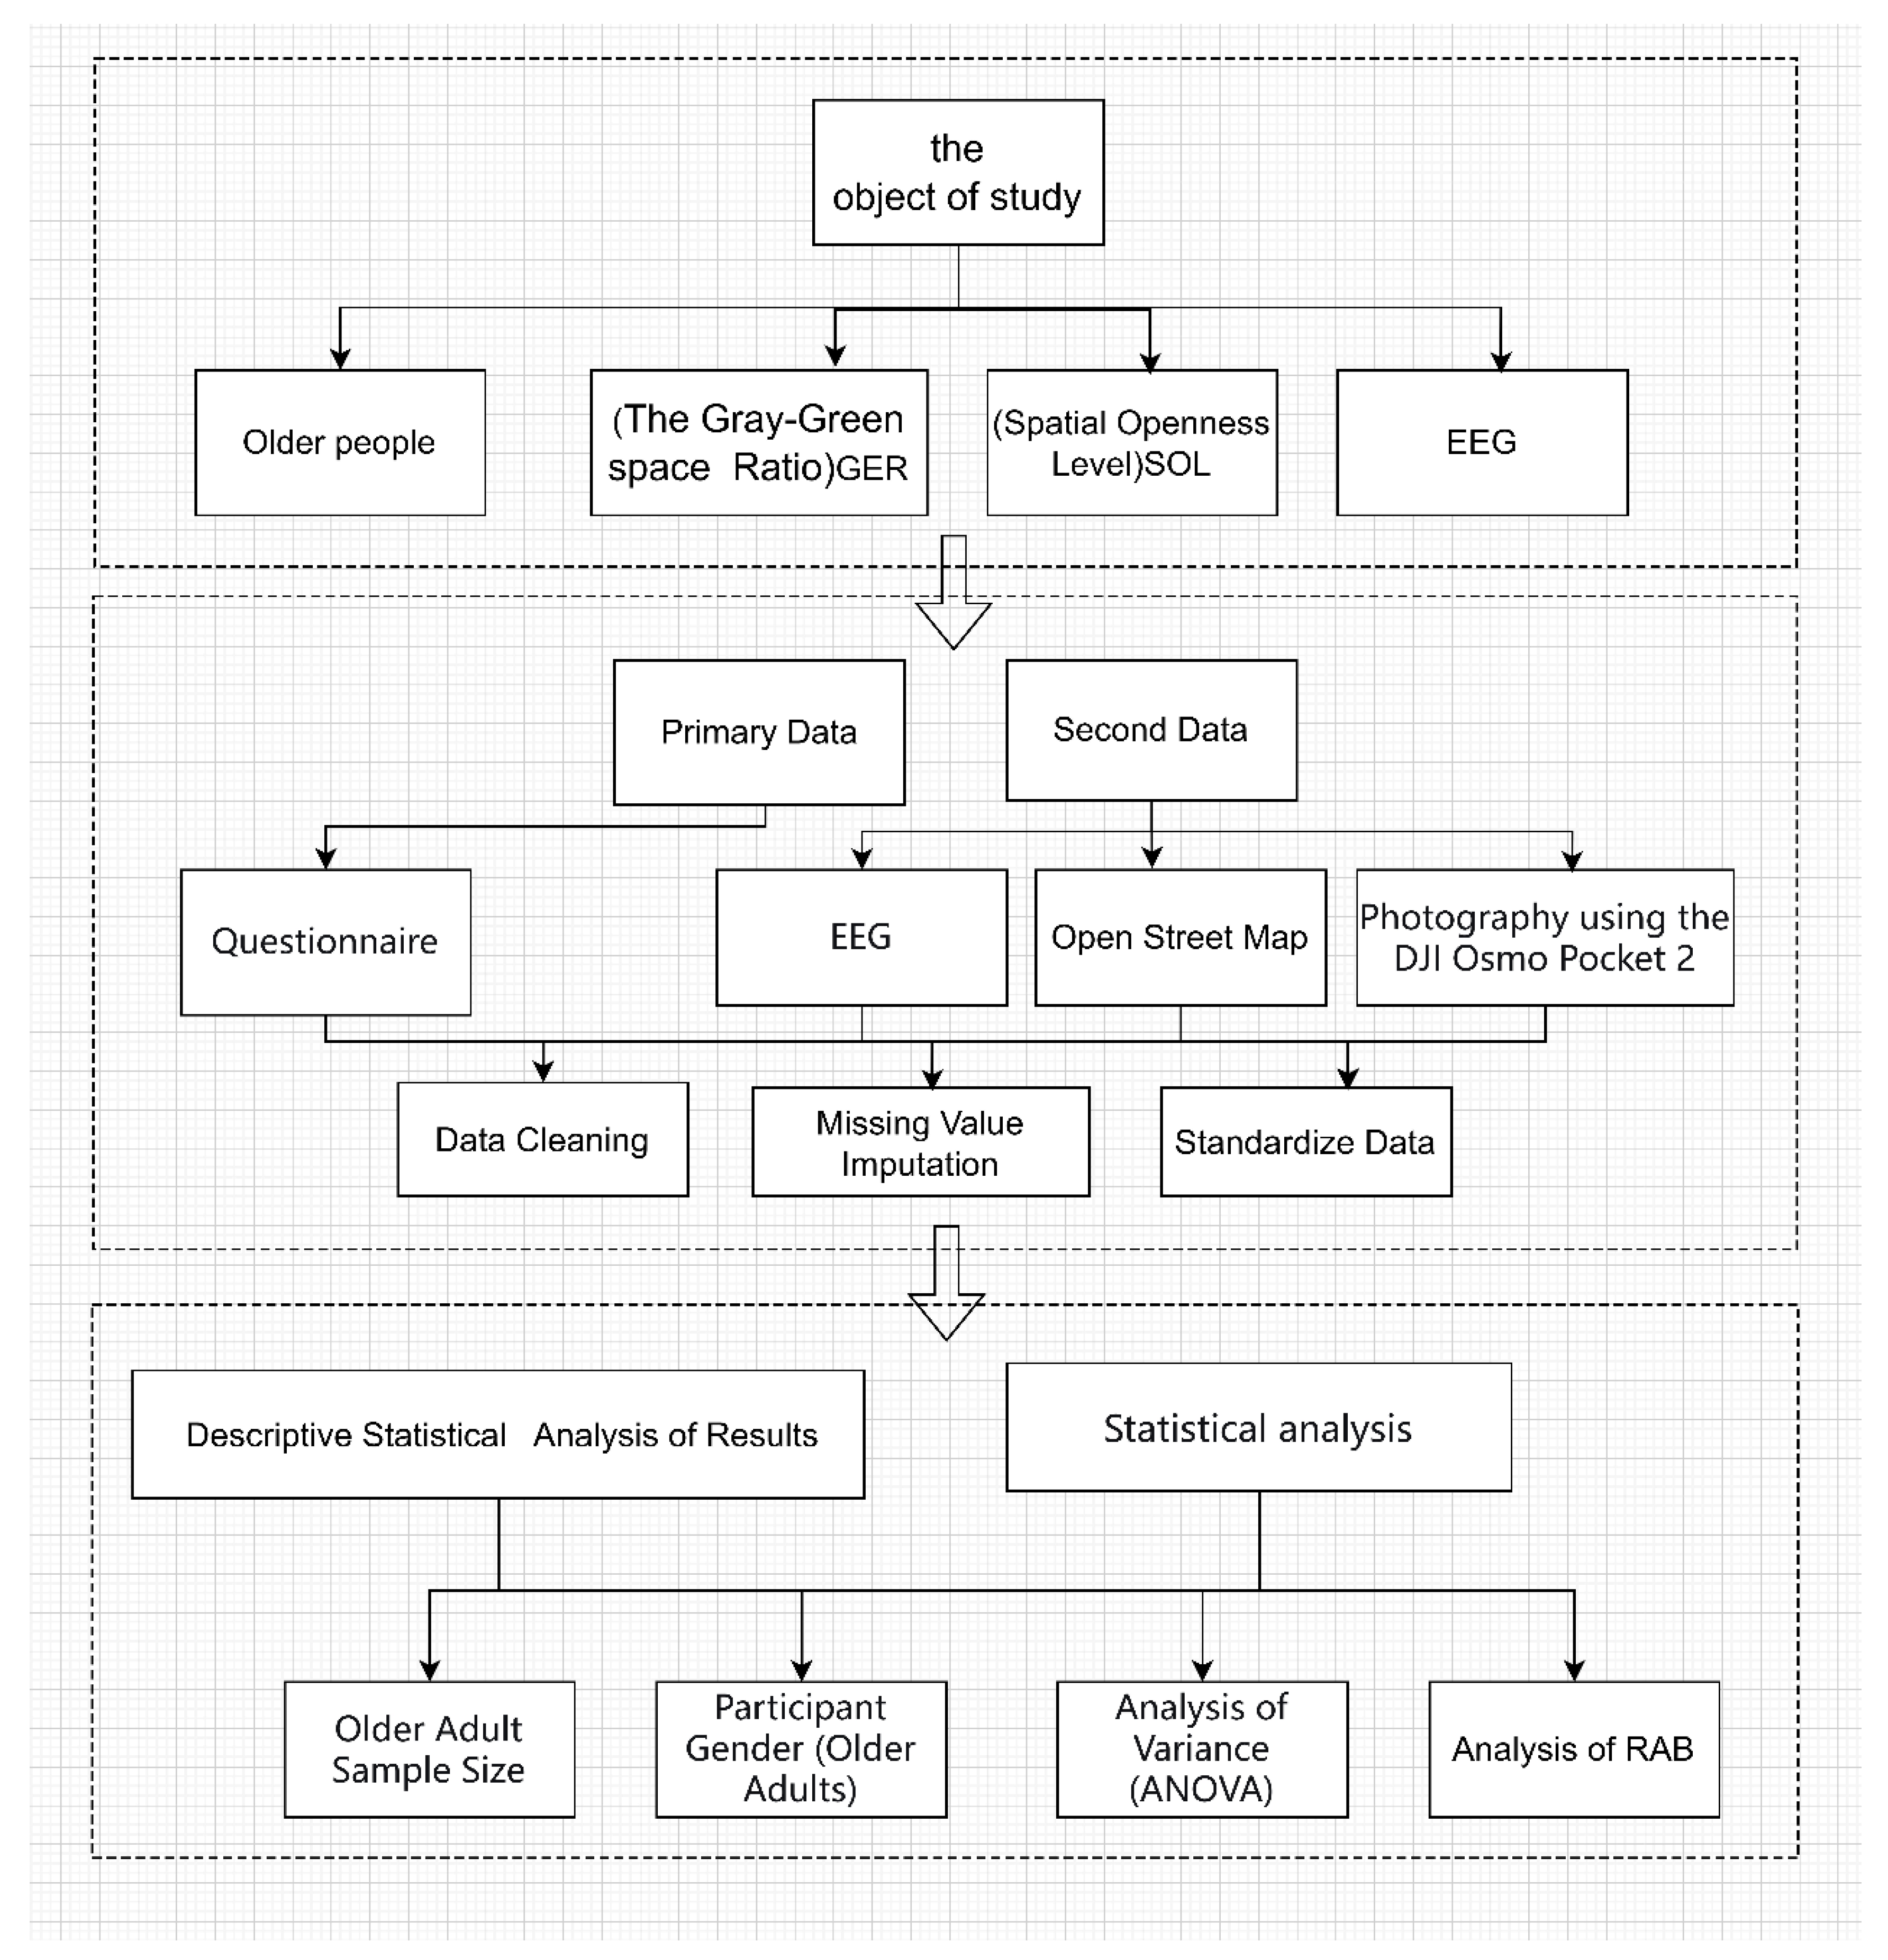
Figure 12.
RAB Scores Across Scenarios with Varying GER.
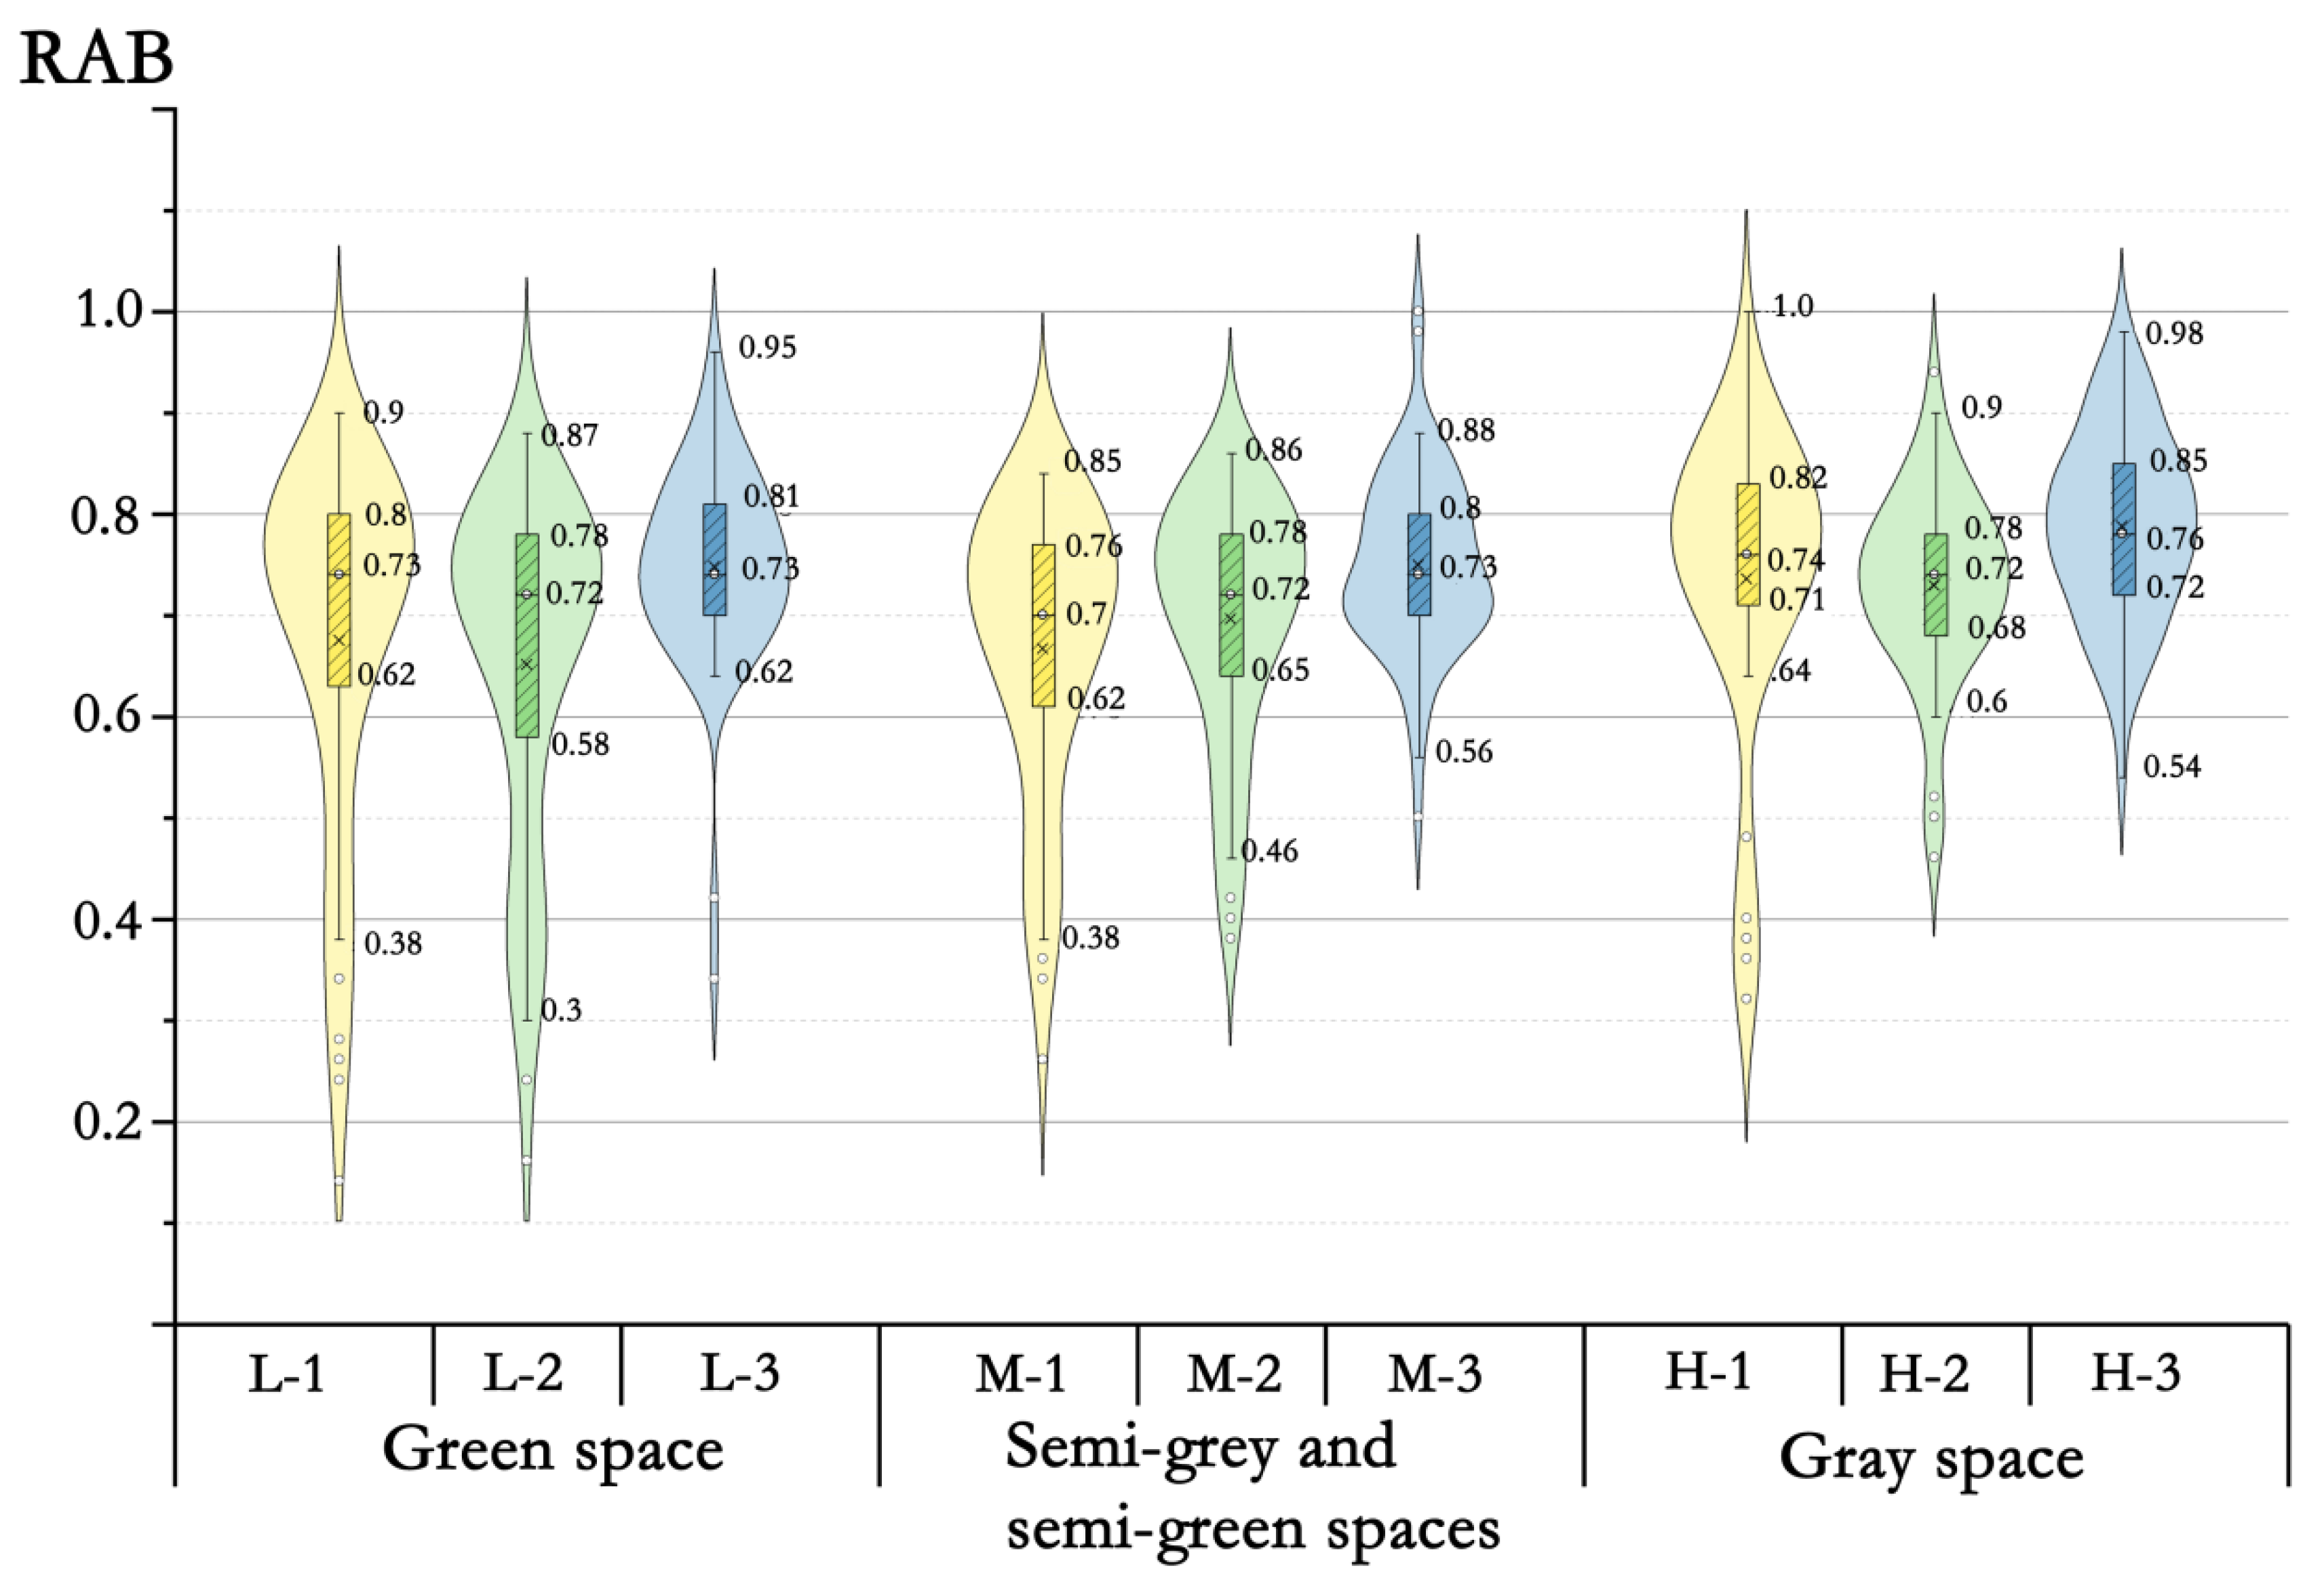
Table 1.
predefined environmental variable criteria.
| Category | Variable name | Description |
| Spatial Openness Level | ||
| Closed space | SOL (=1) | A space enclosed by buildings within a 5-meter radius. |
| Semi-open space | SOL (=2) | A space enclosed by buildings within a 5 to 10-meter radius. |
| Open space | SOL (=3) | A space without building enclosures within a 10-meter radius. |
| Gray-Green Space Exposure Ratio | ||
| Green space Semi-grey and semi-green spaces |
GER (=1) GER (=0) |
The proportion of buildings in the visual space is smaller than that of plants. The proportion of buildings in the visual space is equal to that of plants. |
| Gray space | GER (=-1) | The proportion of buildings in the visual space is greater than that of plants. |
Table 4.
Characteristics of the study population, scenes, and outcome measurements.
| Category | Variable name | Mean ± S.D. or n (%) |
|---|---|---|
| Characteristics of participants (N = 30) | ||
| Gender | ||
| Male | Gender (=1) | 15 (50) |
| Female | Gender (=0) | 15 (50) |
| Age | ||
| 60-70 | Age (=1) | 14 (47) |
| 71-80 | Age (=2) | 16 (53) |
| Education Background | ||
| High School Degree | Education (=1) | 14 (47) |
| Junior High School Degree | Education (=2) | 16 (53) |
| Characteristics of the 9 scenes | ||
| Spatial Openness Level | ||
| Closed space | SOL (=1) | 6 (33) |
| Semi-open space | SOL (=2) | 6 (33) |
| Open space | SOL (=3) | 6 (33) |
| Gray-Green Ratio | ||
| Green space Semi-grey and semi-green spaces |
GER (=1) GER (=0) |
9 (33) 9 (33) |
| Gray space | GGR (=-1) | 9 (33) |
| Characteristics of outcome measurements | ||
| Electroencephalography (EEG) (N=270) | ||
| α waves (8-13 Hz) | α | 32.02 ± 2.247 |
| β waves (14-30 Hz) | β | 39.57 ± 2.184 |
| The ratio of α waves to β waves | RAB | 0.81 ± 0.07 |
Disclaimer/Publisher’s Note: The statements, opinions and data contained in all publications are solely those of the individual author(s) and contributor(s) and not of MDPI and/or the editor(s). MDPI and/or the editor(s) disclaim responsibility for any injury to people or property resulting from any ideas, methods, instructions or products referred to in the content. |
© 2026 by the authors. Licensee MDPI, Basel, Switzerland. This article is an open access article distributed under the terms and conditions of the Creative Commons Attribution (CC BY) license (http://creativecommons.org/licenses/by/4.0/).
Copyright: This open access article is published under a Creative Commons CC BY 4.0 license, which permit the free download, distribution, and reuse, provided that the author and preprint are cited in any reuse.


