
Submitted:
04 January 2026
Posted:
06 January 2026
You are already at the latest version
Abstract
Indonesia’s long-term climate strategy targets net-zero emissions by 2060; in this context, this paper develops a simulation for the Java–Madura–Bali (Jamali) grid to quantify the joint impact of electric-vehicle (EV) uptake and rooftop photovoltaic (PV) “negative load” on system performance over 2025–2060. Historical statistics and national planning projections are used to calibrate annual capacity, peak load, and energy trajectories, which are then downscaled to a 168-hour representative week and a 365-day year. EV charging demand is generated from an hourly initial-charging-time distribution with state-of-charge–dependent AC/DC profiles, while rooftop PV is modeled using hourly irradiance and performance parameters. A 5×5 policy matrix (EV: BAU, Subsidy, Regulation, Charge-Time Management, Combination; PV: BAU, Subsidy, Regulation, Smart-Home, Combination) is evaluated using a min–max composite index (40% weekly supply-demand balance, 40% annual production–consumption balance, 20% policy cost), where higher values are preferable. Results show that EV3_PV1 (regulated EV growth with BAU PV) achieves the highest average composite score, EV4_PV1 provides the best adequacy, and EV3_PV3 yields the poorest adequacy, while EV3_PV1 and EV1_PV3 define the best and worst long-term production–consumption balance, respectively. EV1_PV1 is the least costly pathway and EV5_PV5 the most expensive, indicating that moderate, regulation-driven and charge-time–oriented strategies outperform highly interventionist EV–PV packages when adequacy, balance, and cost are jointly considered.
Keywords:
electric vehicle charging
; unmanaged charging
; rooftop photovoltaics
; no-export regulation
; peak demand mitigation
; negative load modeling
1. Introduction
Indonesia has announced a national ambition to reach net-zero emissions by around 2060, a goal articulated in its long-term climate strategy and repeatedly referenced in sectoral roadmaps under the Ministry of Energy and Mineral Resources (ESDM). [1]. Transport electrification is a central pillar of Indonesia’s decarbonization. Government targets call for ~2 million battery-electric cars and ~13 million electric two-wheelers on the road by 2030, supported by Presidential Regulation No. 55/2019 and its 2023 amendment [2]. To stimulate uptake, the Ministry of Finance has provided VAT relief for eligible domestically compliant BEVs and buses via PMK 38/2023 (continued for 2024 in PMK 8/2024), complementing broader EV ecosystem policies. [3,4]. Adoption momentum is material: the IEA’s Global EV Outlook 2025 notes that Indonesia’s electric-car sales more than tripled in 2024, with the sales share exceeding 7 percent. [5]. Public charging infrastructure plans have also scaled; ESDM’s pathway now points to roughly 32,000 public charging points (SPKLU) by 2030, with PLN carrying a significant share of the build-out [6].
While beneficial for long-run emissions, rapid EV diffusion can exacerbate short-term system peaks if charging is concentrated in evening hours typical of Indonesia’s demand profile. International experience highlights this risk: system operators in high-renewable jurisdictions, e.g. California ISO, document steep evening ramp requirements (the duck curve), while UK regulators and the National Grid ESO quantify materially higher peak demand from unmanaged charging and the mitigating potential of smart charging [8]. In the Jamali context, where historical peak events frequently occur around early evening, similar temporal clustering of EV charging would increase transformer loading, net-peak magnitude, and ramping needs, unless controlled by pricing or coordination. [9]
In parallel, rooftop photovoltaics (PV) are expanding from a low base and have become a near-term option for distributed mitigation of net demand. Policy targets and communications from ESDM have repeatedly cited a 3.6 GW rooftop PV ambition by 2025 within the broader renewable-energy share objective. [10]. However, under Ministerial Regulation (Permen) ESDM No. 2/2024, the prior net-metering/energy export credit was removed for new systems, and deployment is now governed by five-year quotas set by the grid licensee (PLN) and approved by the Directorate General of Electricity. In effect, surplus exports from new rooftop PV systems are not credited toward customer bills, meaning behind-the-meter PV primarily reduces on-site consumption and appears to the grid as “negative load.” [11] As of mid-2025, official statements indicated cumulative rooftop PV adoption of only several hundred megawatt-peak nationwide—far below technical potential and indicative of significant headroom. [12]
Two dynamics are therefore pivotal for Jamali’s pathway to net zero: (i) hourly and weekly load-shape interactions between EV charging and baseline demand, and (ii) variability of rooftop PV. Indonesia’s monsoon climate drives pronounced wet–dry season differences in cloud cover and solar irradiance, which modulate PV output. [13]. Moreover, ESDM has explicitly acknowledged the temporal mismatch between residential PV generation (daytime) and household peaks (evening), especially in the absence of net-metering—reinforcing the need to consider operational strategies such as smart charging, workplace/daytime charging, and behind-the-meter storage. [14]
Against this backdrop, the present study develops a region-specific, probabilistic simulation for the Jamali grid (2025–2060) that treats rooftop PV as a negative load and explicitly models the temporal coincidence between EV charging demand and PV production. The analysis examines weekly (168-h) and yearly (365-day) windows and evaluates policy-plausible scenarios for EV penetration, charging behavior, and rooftop PV population. By integrating Indonesia’s current regulatory conditions, EV fiscal incentives, charging-infrastructure targets, and the rooftop PV rules, into a unified supply–demand framework, the paper quantifies the extent to which rooftop PV can mitigate EV-driven peaks in Jamali and the implications for achieving Indonesia’s net-zero objective.
1.1. Jawa Madura Bali Power Grid
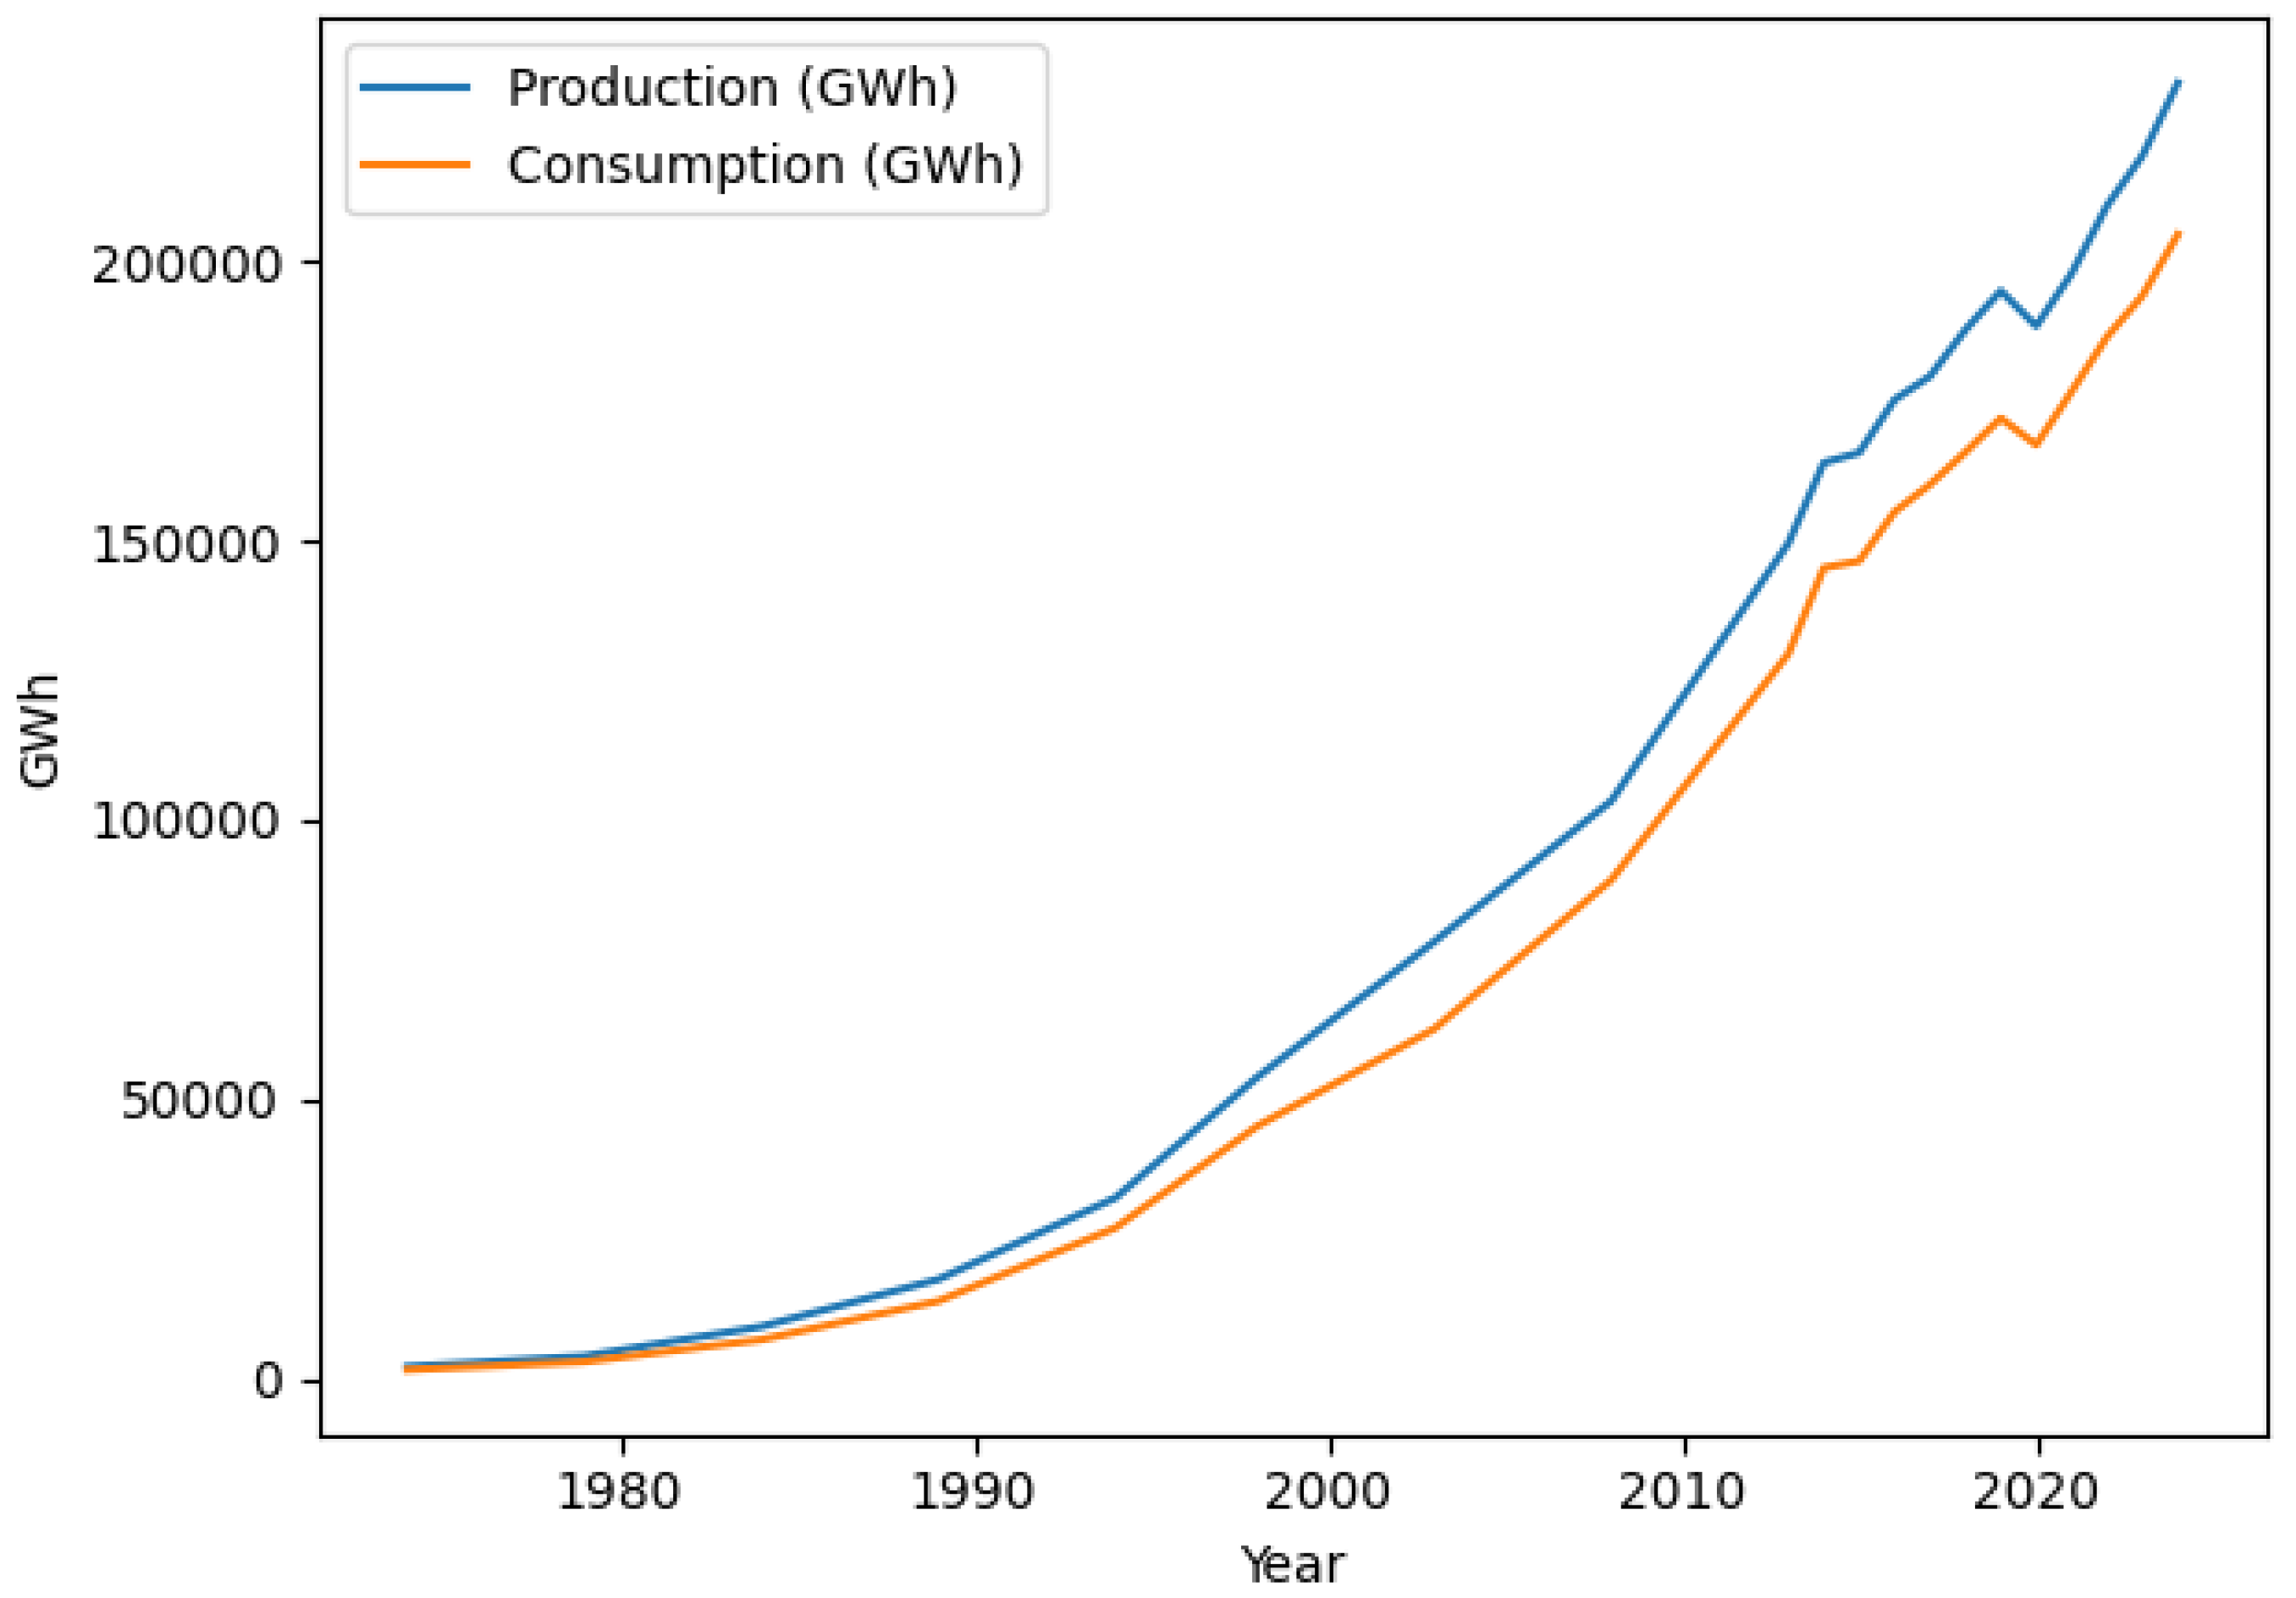
Indonesia’s on-grid electricity sales reached 288,435.78 GWh in 2023 (≈ 790 GWh/day), underscoring sustained demand growth following the pandemic recovery. Within that total, the Java–Madura–Bali (Jamali) subsystem dominates consumption: PLN’s 2023 statistics record 196,410.34 GWh sold in Java, or 68.09% of national sales (≈ 538 GWh/day), reflecting the region’s population density and industrial base. [15]
From a system-adequacy perspective, the national peak load in 2023 was 58,282.48 MW. Jamali accounted for 40,223.47 MW of that peak, illustrating the risk that future EV charging could exacerbate. PLN also reports 72,976.30 MW of total installed capacity nationwide (PLN + IPP + rental) in 2023. [16]
Consistent with these figures, the Ministry of Energy and Mineral Resources (ESDM) noted that Jamali’s oversupply narrowed to ~4 GW by end-2023, implying headroom on the order of ~10% relative to the 40.2 GW peak. [17]
Graph below shows the yearly production and consumption of Jamali Grid.
1.2. EV and PV Intermittency
EVs introduce load intermittency: charging demand is concentrated into discrete plug-in events governed by human travel patterns and state-of-charge (SOC) thresholds. Iqbal et al. construct a travel-activity-based stochastic model using Finland’s National Travel Survey and simulate 50 passenger EVs over 100 days with residential home charging. [21] Their Monte-Carlo simulation shows that the aggregate charging load under unmanaged home charging is almost zero during the late morning, then rises sharply from noon, reaching a maximum around 18:00 when most vehicles return home. At this peak, the mean and 90th-percentile number of EVs charging simultaneously are 34 and 42, respectively, then drop to roughly 14 and 22 by midnight and to below 10 after 03:00. [22] This strongly time-localized pattern illustrates the high temporal intermittency and peakiness of residential EV charging even in a relatively small fleet.
Public and fast-charging infrastructure exhibits an additional form of intermittency [23]: low utilization over most of the day but very high instantaneous power draw during short windows of intensive use. Using a large empirical dataset from German charging stations, Hecht et al. derive standard load profiles for various station sizes and power levels. For AC public chargers in urban areas, they report an average power of only 0.71 kW per charge point and about 6.2 MWh of energy delivered annually per point, despite nominal rated powers that are an order of magnitude higher. This implies a low load factor and a high peak-to-average ratio (PAR), confirming that EV charging demand is both intermittent in time and highly spiky relative to installed charging capacity. [24]
The total charging load in this simulation is calculated using the following mathematical formula:
where LEV(γ,s,τ) is the total charging load in kW in year γ, scenario s, hour-of-week τ; NEV(γ,s) is the total EV population; αe is the share of EV type e; pe (τ) is the probability a single charging session of type e starts at hour τ; Pe(k) is the per-vehicle charging load profile in kW for type e, k hours after plug in and Ke is the charging duration for type e.
Residential rooftop PV (RTPV) output is inherently intermittent because it depends on local, rapidly changing cloud fields, module orientation, and shading from the built environment. Long-term monitoring of 246 identical rooftop systems in 19 residential communities showed that field performance deviates significantly from standard-test-condition expectations: even among similar systems in the same neighborhood, persistent differences in annual yield and short-term output were observed, mainly due to small variations in shading, sky clearness, and module orientation. [26] This confirms that RTPV generation is not only variable in time at a single dwelling but also heterogeneous across dwellings.
High-frequency RTPV intermittency is commonly quantified using normalized power ramp rates and variability metrics. Van Haaren and Fthenakis use this definition with 1-min data and report maximum minute-scale ramp rates on the order of 0.5–0.7 p.u. for utility-scale plants, emphasizing how quickly PV output can change under broken-cloud conditions. [27] Studies of spatially distributed PV fleets use related indices such as relative output variability and variability reduction factor to show that aggregation over a municipality can reduce RTPV variability to roughly 20% of the variability of a single rooftop, but with diminishing returns as more systems are added within the same weather footprint.[28]
The total PV negative load in this simulation is calculated using the following mathematical formula:
where Lneg,PV(y,s,t) is the PV negative Load in kW; NPV(y,s) is the total number of PV rooftop systems; βp is the share of PV type p; Cunit,p is the rated power; G(τ) is the irradiance in hour τ; Tcell(τ) is the temperature in hour τ; γ is the temperature coefficient of power and PR is the performance ratio.
1.3. Literature Review and Overview of Contributions
The Jawa–Madura–Bali (Jamali) system supplies most of the Indonesia’s electricity demand and is the main focus of national power-system planning and decarbonization efforts. Recent work has started to characterize Jamali’s demand and operational constraints. Surya et al. apply a long short-term memory (LSTM) model to forecast Jamali peak load, which is crucial for long-term capacity planning [31]
On the supply side, Marbun et al. estimate the total cost of integrating solar PV into the Jamali system, including capital costs, fuel savings, and system operation, and show that large-scale PV deployment is already economically competitive under certain price assumptions [32]. Amir evaluates techno-economic and environmental performance of a grid-connected renewable energy system in Madura, confirming that hybrid PV-based systems can reduce both costs and emissions compared with fossil-only baselines [33]. Sukarso and Adimas emphasize that rooftop PV is a particularly attractive decarbonization option for Indonesia’s electricity sector, given the large technical potential on existing buildings [34]
The integration of large EV fleets introduces highly time-varying and spatially concentrated loads. Mohammad et al. review PV-based EV modeling in distribution networks and show that uncoordinated charging tends to create new evening peaks [35]. At the demand-modeling level, Dong et al. develop a user-decision-based urban EV load model that links drivers’ activity patterns, trip chains, and charging decisions to time-resolved load curves, illustrating that behavioral heterogeneity has a first-order impact on aggregated charging profiles [36]. Hiesl et al. propose a stochastic framework to model EV electricity demand based on traffic surveys in Austria, demonstrating that travel-survey data combined with Monte Carlo techniques can reproduce realistic temporal demand variability [37].
Rooftop PV is inherently intermittent, and its contribution to decarbonization depends critically on the alignment between generation and demand. Jurasz et al. examine whether a city can reach energy self-sufficiency solely via rooftop PV and show that even when annual PV production matches annual load, substantial hourly and seasonal mismatches remain, requiring storage and flexible demand to maintain reliability [38]. Martin et al. study the use of rooftop PV to cover individual EV charging demand and find that a substantial fraction of annual EV energy can be supplied from rooftop PV, but temporal mismatches between PV output and charging needs lead to residual dependence on the grid or storage [39]. Liu et al. develop a home energy-management system integrating rooftop PV, EVs, and occupant behaviour, and Merrington et al. optimize the sizing of rooftop PV and battery storage for households with EVs [40,41]. Jittayasotorn analyzes the adoption of rooftop PV integrated with EVs in Bangkok and underlines that local policy incentives and urban form strongly influence achievable PV–EV synergies. [42].
Based on the literature study, table below shows the Research Gaps in EV-PV previous studies:

| Year | Authors | Location of Interest | EV GF Consideration | Dynamic EV Load | Dynamic ICT | PV GF Considered | Dynamic PV Specs | Dynamic Solar Irradiance | Novelty | Research Gap |
|---|---|---|---|---|---|---|---|---|---|---|
| 2023 | Alyami et al. | Network of Smarthomes | V | X | V | V | X | X | EV and PV Flexibility Indices | Only 4 ICT Hour, all in the evening |
| 2023 | Almutairi et al. | Residential smart homes in Saudi Arabia | X | V | V | X | X | V | Flexibility assessment of home-manageable loads (incl. EV and rooftop PV) using proposed indices and case-study profiles. | No long-term EV/PV growth factors or transmission-grid impact; focus on a Saudi smart-home community. |
| 2021 | Liu et al. | Residential prosumer home in Kansas, USA | X | V | V | X | X | V | PV–EV integrated home energy management that explicitly models occupant behaviors, EV charging and rooftop PV in joint optimization. | Single-household scale; no grid-level balancing or multi-decade EV/PV proliferation scenarios. |
| 2022 | Martin et al. | Individual EV users and residential rooftops in Switzerland | X | V | V | X | V | V | Combines high-resolution real EV driving/charging data with detailed rooftop-PV potential mapping to assess EV demand coverage by self-PV under different charging strategies. | European context; does not include power-system constraints or long-term EV/PV adoption pathways |
| 2023 | Merrington et al. | Grid-connected detached houses in Australia | X | V | V | X | V | V | Practical optimal sizing framework for rooftop PV and BES in EV-owning households, incorporating stochastic EV availability, SoC and weather uncertainties. | Emphasizes customer economics; no explicit transmission-grid peak analysis or regional EV/PV growth scenarios. |
| 2024 | Zhao et al. | City-scale building–EV network in China | X | V | V | X | X | V | “CityEnergyFlow Navigator” for coordinated operation of buildings and EVs to maximise rooftop-PV self-consumption at city scale. | Operational focus with fixed EV fleet and PV capacity; no long-term expansion scenarios or explicit peak mitigation. |
| 2022 | Chang et al. | Four cities and one province in Korea | V | X | X | V | X | X | Techno-economic analysis of PV+EV combined systems as an urban decarbonisation strategy (2019–2030) across multiple built forms and regulatory settings. | Uses aggregated annual indicators; does not model hourly EV charging or solar variability |
| 2022 | Kobashi et al. | Residential and commercial districts in Japan | V | X | X | V | X | X | Quantifies techno-economic and decarbonisation benefits of PV+EV systems (2020–2040) in residential vs commercial districts. | Treats PV and EV mainly as annual energy resources. |
| 2024 | Amiruddin et al. | Indonesia national grid (Java–Bali and Sumatra nodes) | V | V | V | V | X | V | PLEXOS-based national energy-system model co-optimising EV adoption and renewable integration, with multiple charging strategies and V2G for Indonesia. | RE modelled as aggregated utility-scale plant; rooftop PV not distinguished as negative load nor resolved at Jamali-subsystem level. |
| 2025 | Tampubolon et al. (this study) | Java–Madura–Bali (Jamali) interconnected system | V | V | V | V | V | V | Long-term (2025–2060) dynamic simulation of the Jamali grid coupling hourly load forecasting, stochastic EV charging (incl. ICT distributions) and rooftop-PV growth as negative load to evaluate peak mitigation and net-zero pathways under Indonesian policy targets. | Focuses on Jamali region and rooftop PV; other VRE technologies and detailed distribution-network constraints are represented in aggregated form. |
To address these gaps, the present paper develops an integrated, high-resolution simulation framework for the Jamali grid up to 2060 that:
- Implements a novel, detailed calculation of hourly load supply–demand and daily energy production–consumption for the baseline, EV-only, PV-only, and combined EV–PV scenarios in the Jamali system.
- Models future EV charging demand using data-driven and scenario-based approaches consistent with projected EV adoption in Indonesia, distinguishing between vehicle classes and charging behaviors, and predicts the resulting scenario outcomes in terms of their impact on hourly load and daily energy balances.
- Represents rooftop PV as a negative load by explicitly mapping projected rooftop PV capacity and irradiance patterns to hourly net-load reductions at the system level, while considering dynamic PV growth factors and technical specifications.
- Couples EV and rooftop PV dynamics to quantify how different combinations of EV growth, charging-time management, and rooftop PV penetration reshape Jamali’s hourly and weekly load profiles and derives targeted EV and PV growth trajectories that minimize supply–demand and production–consumption deficits relative to policy and reliability constraints.
2. Materials and Methods
This study employs an integrated, scenario-based simulation framework implemented in Python/Google Colab to quantify the long-term impact of EV charging demand and rooftop PV negative load on the Jamali power system. Figure 2 shows the global simulation’s flowchart. Starting from an initial dataset for base year y0 and Scenario 0, the model iteratively advances year by year, updating grid supply capacity, EV population, and PV rooftop population using predefined growth factors for each scenario. For every year–scenario combination, the framework first simulates hourly EV charging demand and annual EV electricity consumption, as well as hourly PV negative load and annual PV production, based on the detailed EV and PV sub-models described in the following subsections. These are then coupled with forecasted grid supply trajectories to generate a high-resolution hourly supply–demand balance and a daily production–consumption balance for the representative year.
The data from 1974 to 2024, such as population shown in Figure 3, production and consumption data in Figure 4, population share per provinces in Figure 5, capacity and peak load data in Figure 6 and the weekly temperature and humidity, in relation to the base demand load in Figure 7, were taken as historical data to analyze growth.
2.1. EV Charging Demand Load Simulation
The EV charging load simulation, shown in Figure 8, starts from the scenario-specific input of annual EV population in year y, which is disaggregated into several EV classes (e.g., 2W, 4W, buses, and commercial vehicles) according to predefined type shares. For each EV type, the model assigns an initial charging-time probability distribution over the 168 hours of a representative week, reflecting different usage patterns such as overnight home charging or daytime opportunity charging. In the next step, the expected number of vehicles that start charging in each time-of-week slot is combined with type-specific charging power curves (AC and DC) expressed as power versus elapsed charging time. By convolving the start-time distribution with the corresponding charging curve, the framework obtains the hourly charging load profile for each EV type, which is then aggregated across all types to yield the total EV charging demand profile for that year and scenario.
The total EV charging load is calculated by using the following formula,
where LEV(γ,s,τ) is the total charging load in kW in year γ, scenario s, hour-of-week τ; NEV(γ,s) is the total EV population; αe is the share of EV type e; pe (τ) is the probability a single charging session of type e starts at hour τ; Pe(k) is the per-vehicle charging load profile in kW for type e, k hours after plug in and Ke is the charging duration for type e.
Vehicle data, including the EV population in Figure 9, sales number per province in Table 2 and vehicle population per year in Table 3 were taken as inputs in the simulation.
The EV dataset below defines the representative vehicle portfolio used in the Jamali charging-demand simulation, covering four-wheelers (4W) and two-wheelers (2W) across “base luxury” (BL), “base daily” (BD), “standard luxury” (SL), and “standard daily” (SD) classes. The classification is based on purchase price of IDR 400 million for 4W and IDR 30 million for 2W. Big for 4 wheelers defined by the seating capacity and for 2 wheelers by the physical dimensions. For each model, the table specifies technical parameters, driving range and battery size, DC fast-charging capability, DC/AC charging duration and maximum charging load, as well as behavioural and market parameters such as typical daily commute distance, average charging frequency and 2025 purchase price.
|
Veh_Class |
Veh_Mod | Driving_Range_km | Batt_Size_kWh | DC_Charging_Capability | DC_Charging_Duration_min | DC_Max_Charging_Load_kW | AC_Charging_Duration_min | AC_Max_Charging_Load_kW | Charge_Frequency_days | Price_2025_IDR |
|---|---|---|---|---|---|---|---|---|---|---|
| 4wBL | Denza D9 EV | 600 | 103.0 | Yes | 35.0 | 150.0 | 540 | 11.0 | 14 | 1,500,000,000 |
| 4wBD | BYD M6 | 530 | 71.8 | Yes | 35.0 | 115.0 | 480 | 7.0 | 17 | 430,000,000 |
| 4wSL | Mercedes-Benz EQB | 448 | 66.5 | Yes | 32.0 | 100.0 | 420 | 11.0 | 13 | 1,700,000,000 |
| 4wSD | Wuling Air ev | 300 | 26.7 | No | - | - | 240 | 6.6 | 10 | 240,000,000 |
| 2wBL | ALVA CERVO | 125 | 3.5 | No | - | - | 270 | 1.5 | 4 | 43,000,000 |
| 2wBD | United TX1800 | 65 | 1.7 | No | - | - | 300 | 1.2 | 2 | 35,000,000 |
| 2wSL | Honda EM1 e: | 50 | 1.3 | No | - | - | 360 | 0.6 | 1 | 40,000,000 |
| 2wSD | Viar New Q1 | 60 | 1.4 | No | - | - | 270 | 0.3 | 2 | 15,000,000 |
The charging load for each vehicle, shown in Figure 10, is subsequently modeled and taken as EV load simulation input.
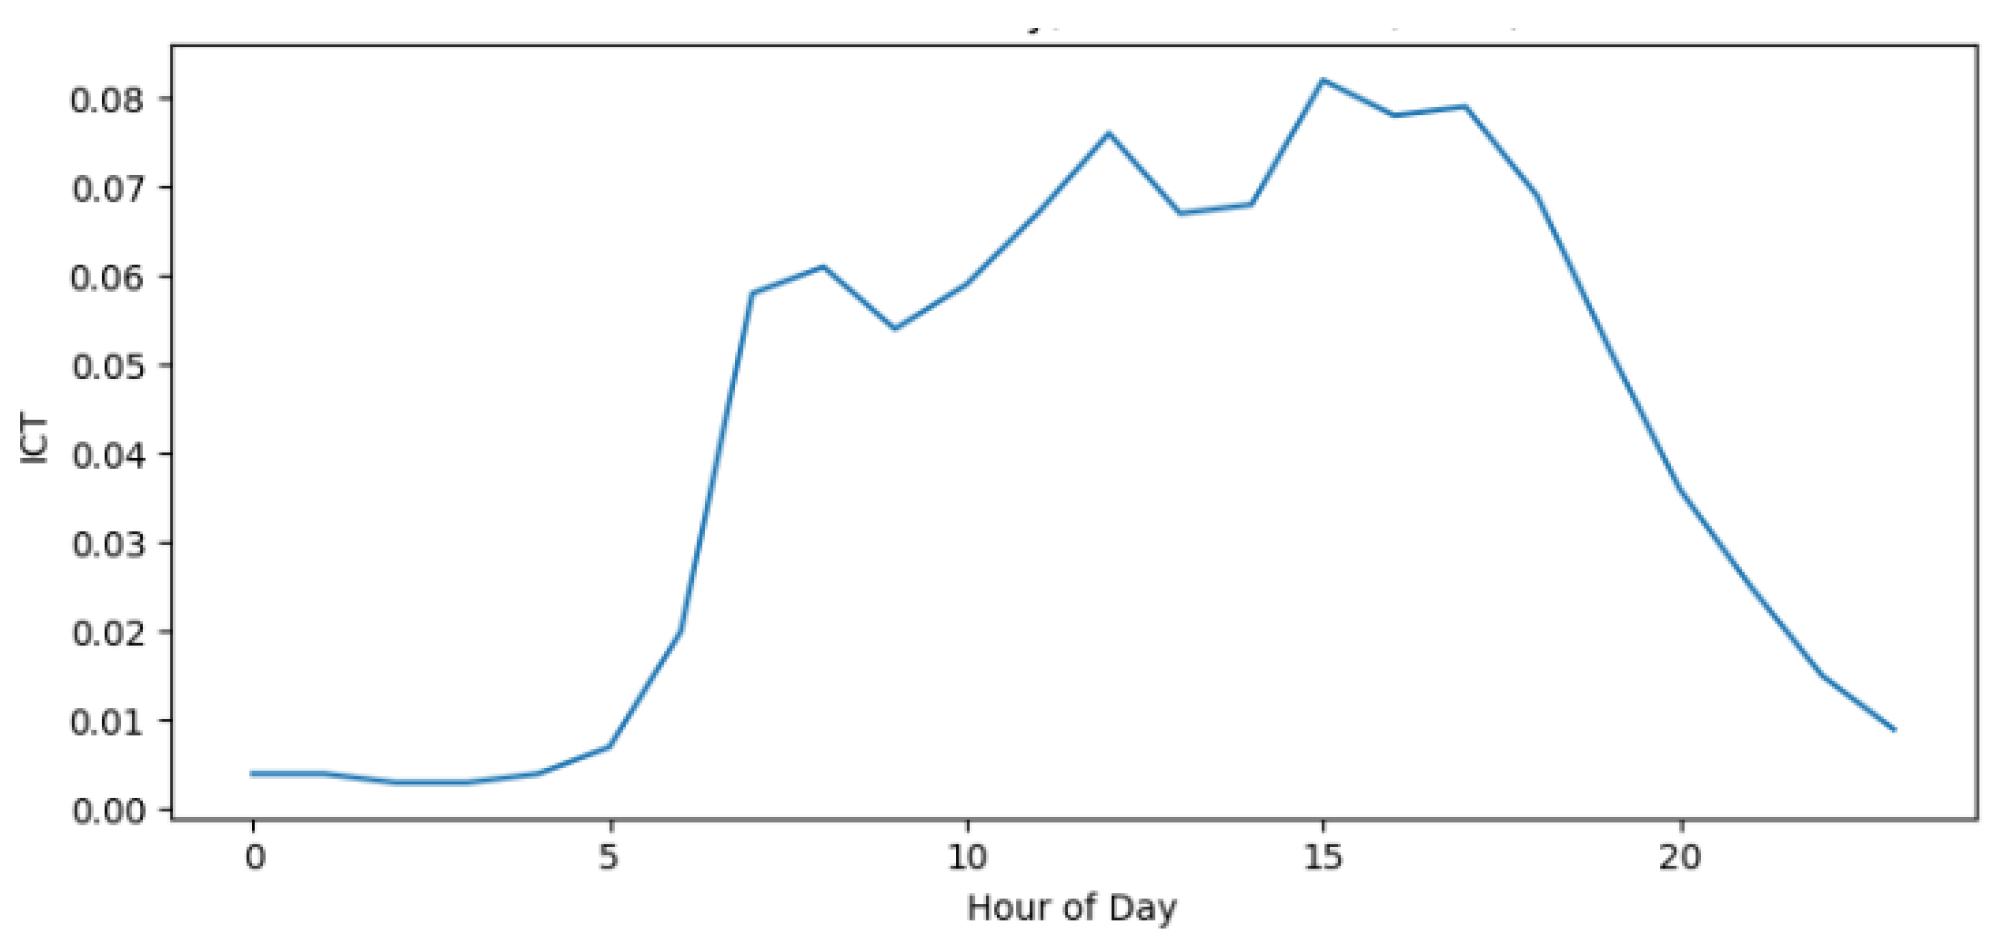
The initial charging-time (ICT) profile represents the probability that an EV user initiates charging in each hour of the day, which typically coincides with the user’s typical arrival time after finishing daily activities [68].
Figure 11.
ICT Profile (Monday 2024) [68]
Figure 11.
ICT Profile (Monday 2024) [68]
2.2. PV Rooftop Negative Load Simulation
The PV rooftop negative load simulation, shown in Figure 12, begins with the scenario-dependent PV population for year y, which is disaggregated into multiple PV system types, with different installed capacities and roof configurations, according to predefined type shares. For each type, the installed capacity is combined with hourly solar irradiance and temperature data derived from NASA POWER and converted into a 168-hour representative-week profile using standard performance-ratio and temperature-derating factors. This yields an hourly AC power output per PV type, which is then treated as a negative load.
The total PV negative load is calculated by using the following formula,
where Lneg,PV(y,s,t) is the PV negative Load in kW; NPV(y,s) is the total number of PV rooftop systems; βp is the share of PV type p; Cunit,p is the rated power; G(τ) is the irradiance in hour τ; Tcell(τ) is the temperature in hour τ; γ is the temperature coefficient of power and PR is the performance ratio.
The available historical PV capacity data for Indonesia and Jamali in Figure 13 is still relatively limited in length and resolution, but it already shows a steep, almost exponential increase in installed capacity over the past few years. These PV capacity figures are compiled from the most recent national electricity planning documents (Rencana Umum Ketenagalistrikan Nasional, RUKN). [69]
In the PV rooftop negative-load module, a small set of aggregate parameters is used to link national rooftop-PV deployment and housing statistics to an effective PV capacity per Jamali household. Table below summarizes (i) the assumed share of Indonesia’s residential rooftop PV that is located in the Jamali grid, (ii) the number of households in Jamali, (iii) the average usable roof area per household that can host PV modules, and (iv) the representative rooftop PV system specification used to convert irradiance into hourly power output.
Table 5.
PV Parameter.
| Parameter | Symbol | Value |
|---|---|---|
| Jamali share of Indonesia rooftop PV | f_PV_Jamali | 70% |
| Number of households in Jamali (base year) | N_HH_Jamali | 40,000,000 |
| Average usable rooftop area per household | A_roof | 20 square metre |
| Representative rooftop PV system specification | PV_spec | 3.0 kWp system; module efficiency ≈ 18%; PR ≈ 0.75 |
The irradiance curve shown in Figure 14 represents the hourly solar irradiance pattern for a representative week in 2024, derived from NASA POWER data for grid cells covering the Jawa–Madura–Bali (Jamali) region and averaged over the full year. The resulting profile exhibits the expected diurnal shape, with irradiance close to zero during night-time hours, a rapid increase after sunrise, a midday peak of roughly 600–650 W/m², and a symmetric decline towards sunset, repeated for each of the seven days in the 168-hour window.
2.3. Weekly Supply and Demand Simulation and Yearly Energy Production and Consumption Simulation
The simulation models the short-term operational balance between supply and demand on an hourly basis over a representative 168-hour week and a 365-days year, as shown in Figure 15.
The weekly operational view is extended to a full-year energy balance. For each scenario–year combination, annual production and consumption trajectories are constructed by aggregating or scaling the representative hourly/weekly profiles to 365 days, consistent with the annual forecasts used in Phase-1. Grid energy production is obtained from forecasted annual generation, disaggregated into a daily profile using the baseline daily pattern. Energy consumption is computed as the sum of baseline consumption, additional EV energy consumption (integrated from the hourly EV charging load), and the reduction due to PV rooftop generation (integrated negative load). The model then calculates daily and annual energy surpluses or deficits and summary indicators such as total yearly deficit, maximum daily deficit, and frequency of deficit days.
The net system load for scenario s, year y, time τ, combining base demand, EV load and PV negative load, is
where Lbase(y,s,τ) is the forecasted hourly base load without EVs and PV.
2.4. Scenario Permutation
The simulation explores a large space of possible futures by systematically combining different growth assumptions. Each scenario is defined by a specific key parameters, such as EV growth factor, PV growth factor, grid supply growth factor, and additional levers, such as charging-time management. The Colab implementation generates all permutations of these parameter levels (e.g., a 5×5 grid of EV–PV growth families combined with several supply-growth options), and for each resulting Scenario-X and year y, it calls the EV load module, PV negative-load module, weekly supply–demand simulation, and yearly energy-balance simulation. The outputs from all scenarios–year combinations are subsequently noted.
| Dimension | Scenario | Short label | Main policy description | Adoption / capacity growth multiplier vs BAU | Purchase / investment subsidy parameter | Tax / regulatory parameter | Time-of-use / smart-control parameter | Additional program cost parameter |
|---|---|---|---|---|---|---|---|---|
| EV | EV1_BAU | Business-as-usual | No additional incentives or regulations; EV uptake follows reference growth only. | 2W: 1.0; 4W: 1.0 | 2W subsidy: 0 Rp; 4W subsidy: 0 Rp | ICE import tax: 0%; EV annual tax discount: 0% | Off-peak tariff discount: 0% | Shiftable EV load share: 0% |
| EV | EV2_REG | Regulation | Stronger regulation against ICE vehicles via higher import tax and annual ownership tax; reduced annual tax for EVs. | 2W: [1.1]; 4W: [1.15] | 2W subsidy: 0 Rp; 4W subsidy: 0 Rp | ICE import tax increase: [10%]; EV annual tax discount: [50%] | Off-peak tariff discount: 0% | Shiftable EV load share: [10%] |
| EV | EV3_SUB | Purchase subsidy | Direct purchase subsidy for new EVs (2W and 4W) | 2W: [1.15]; 4W: [1.20] | 2W subsidy: [7,000,000 Rp/vehicle]; 4W subsidy: [70,000,000 Rp/vehicle] | ICE import tax: 0%; EV annual tax discount: 0% | Off-peak tariff discount: 0% | Shiftable EV load share: [10%] |
| EV | EV4_CTM | Charge-time management | Time-of-use tariff with off-peak discounts; EV owners are incentivized to shift charging to off-peak hours; no purchase subsidies. | 2W: [1.05]; 4W: [1.05] | 2W subsidy: 0 Rp; 4W subsidy: 0 Rp | ICE import tax: 0%; EV annual tax discount: 0% | Off-peak tariff discount: [20%] | Shiftable EV load share: [50–60%] |
| EV | EV5_COMBO | Combined package | Combination of EV2–EV4: moderate purchase subsidy, ICE regulation, EV tax discounts, and off-peak tariff incentives. | 2W: [1.30]; 4W: [1.40] | 2W subsidy: [5,000,000 Rp/vehicle]; 4W subsidy: [50,000,000 Rp/vehicle] | ICE import tax increase: [5%]; EV annual tax discount: [50%] | Off-peak tariff discount: [15–20%] | Shiftable EV load share: [60–70%] |
| PV | PV1_BAU | Business-as-usual | No additional support beyond existing policies; rooftop PV growth follows reference BAU trajectory. | PV capacity growth multiplier: 1.0 | PV investment subsidy: 0% of CAPEX | PV import tax reduction: 0%; mandatory PV on new buildings: 0% | Smart-home / smart-inverter penetration: 0% | Smart-home device cost: 0 Rp/household |
| PV | PV2_SUB | Subsidy | Capital subsidy on rooftop PV investment (rebate on installation cost); no mandatory regulation. | PV capacity growth multiplier: [1.20] | PV investment subsidy: [20% of CAPEX] | PV import tax reduction: [0–5%]; mandatory PV: 0% | Smart-home / smart-inverter penetration: [10%] | Smart-home device cost: [2,000,000 Rp/household] |
| PV | PV3_REG | Regulation | Regulatory mandate for PV on new buildings and minimum PV coverage targets; limited or no direct subsidy. | PV capacity growth multiplier: [1.15] | PV investment subsidy: [0–10% of CAPEX] | Mandatory PV on new buildings: [30–50%]; PV import tax reduction: [0–5%] | Smart-home / smart-inverter penetration: [10%] | Smart-home device cost: [1,500,000 Rp/household] |
| PV | PV4_SMART | Smart-home | Incentives for smart-home / smart-inverter systems that optimize PV self-consumption; PV growth moderate but flexibility increases. | PV capacity growth multiplier: [1.10] | PV investment subsidy: [10% of CAPEX] | PV import tax reduction: 0%; mandatory PV: 0% | Smart-home / smart-inverter penetration: [40–60%] | Smart-home device cost: [3,000,000 Rp/household] |
| PV | PV5_COMBO | Combined package | Combination of PV2–PV4: moderate investment subsidy, light regulation for PV-ready buildings, and high smart-home penetration. | PV capacity growth multiplier: [1.30] | PV investment subsidy: [15–25% of CAPEX] | Mandatory PV on new buildings: [20–40%]; PV import tax reduction: [5%] | Smart-home / smart-inverter penetration: [50–70%] | Smart-home device cost: [2,500,000 Rp/household] |
2.5. Scoring System
The scoring, simulating the priority of Indonesia’s government priorities [84], system converts the multi-dimensional outputs of the simulations into a single comparable performance index for each scenario–year. Three main dimensions are considered: (i) weekly supply–demand adequacy, captured by metrics such as maximum hourly deficit and number of deficit hours; (ii) annual production–consumption balance, captured by total yearly deficit or surplus; and (iii) program cost, which aggregates the annualized cost of additional generation, EV charging infrastructure, and rooftop PV deployment. Each raw indicator is normalized to a [0,1] and [0,100%] scale using min–max normalization across all scenarios. A composite score is then computed as a weighted sum of the normalized sub-scores, 40% weekly supply–demand, 40% annual production–consumption, and 20% cost. A lower weight (20%) was assigned to Policy Cost as the 2060 Net-Zero target is a strategic national mandate where long-term system stability and decarbonization are prioritized over initial fiscal subsidies. The scenarios are finally ranked according to this composite score.
The cost associated with each scenario is explained in the Table 7 below.
2.6. Calibration and Validation
The simulation framework was validated using a multi-tier approach. First, long-term annual trajectories were calibrated against 50 years of historical Jamali data (1974–2024). Second, the hourly base-load dynamics were validated using 5-fold cross-validation on a 2024 representative week. Annual Energy and Peak Load: For long-term forecasting (2025–2060), four models were evaluated (Table 8).
For annual energy consumption, the Holt Linear Exponential Smoothing model demonstrated a robust fit with a MAPE of 10.47%. Hourly Base-Load Simulation: The hourly module shows exceptional accuracy. The Random Forest (RF) regressor, incorporating time-of-week and temperature features, achieved an R2 of 0.97 and a MAPE of only 1.30%. This ensures that the intraday "negative load" impact of rooftop PV and the ICT (Initial Charging Time) distributions for EVs are superimposed on a highly accurate baseline grid profile.
Given observed values y(t) and model predictions y^(t) for t=1, .. , T, these metrics are computed as:
3. Results and Discussions
Across the simulated policy families, EV population and rooftop-PV adoption rise from negligible levels in 2025 but diverge strongly by scenario, as shown in Figure 16. In the EV case, all models exhibit slow initial growth followed by an acceleration after roughly 2030–2035, with the combined-policy case (EV5_Combo) producing the steepest increase by mid-century, while BAU (EV1) remains closer to a gradual, sub-linear trajectory. A similar pattern appears in the PV results: the number of households adopting rooftop systems increases under all scenarios, but BAU (PV1) yields the lowest penetration, whereas targeted subsidies, smart-home integration, and their combination (PV5_Combo) substantially steepen the adoption curve and approach around three million PV-equipped households by 2060, as shown in Figure 17.
Figure 18 shows the hourly interaction between EV charging demand and rooftop PV output over a representative week in 2030 for scenario EV4_PV1 (charge-time–managed EVs with BAU PV adoption). The blue curve represents the unconstrained EV charging load, while the orange curve shows the portion of PV generation that is directly used to supply EV charging. Subtracting this PV contribution from the original EV load yields the residual net EV demand, shown as green dashed line. Even under a relatively modest PV baseline, the negative load effect noticeably trims midday and early-evening peaks, demonstrating how coincident rooftop PV production can offset a substantial share of the additional EV demand and smooth the net load profile.
Building on the hourly supply–demand simulation, the model then integrates EV charging and PV negative load over each day to obtain daily production and consumption figures. Figure 19 (EV5_PV3 in 2040) shows a representative week. The blue markers represent the total daily EV charging energy, the orange markers indicate how much of that energy is directly supplied by rooftop PV, and the green dashed line is the residual net EV demand that must be met by the grid. Repeating this aggregation for all days of the year and combining it with the underlying non-EV, non-PV load and generation yields annual totals of electricity produced and consumed
Each EV–PV policy combination is also assigned an associated program cost, reflecting subsidies, tax incentives, smart-home equipment, and regulatory implementation expenses. Figure 20 illustrates this for the most aggressive case, EV5_Combo + PV5_Combo. The solid lines show the evolution of annual production headroom, net consumption (baseline + EV – PV_used), and the resulting surplus/deficit, while the dashed curve on the secondary axis reports the cumulative program cost in trillion rupiah. In this scenario, higher EV and PV penetration improve long-term energy balance but require substantial upfront and mid-term expenditure, which peaks around the mid-2040s before flattening as incremental adoption saturates.
Finally, for every simulation year the 25 EV×PV combinations are ranked using the composite score (40% weekly supply–demand balance, 40% annual production–consumption balance, 20% program cost). The bar chart in Figure 21 for 2040 provides a snapshot comparison, showing which specific EV–PV pairing performs best in that year and how large the performance gap is to the next-best alternatives. The score-trajectory plot then extends this view over the full 2025–2060 horizon, revealing how individual scenarios improve or deteriorate over time as EV and PV penetration deepen and program costs accumulate. Complementing both, the heatmap offers a compact year-by-scenario matrix of scores, as shown in Figure 22.
Across the full 2024–2060 horizon, the ranking shows that the EV3_PV1 combination delivers the highest average composite score, indicating that relatively rapid EV uptake through regulation paired with business-as-usual PV growth offers the best overall compromise between adequacy, annual balance, and policy cost. In contrast, EV5_PV3 performs worst on the composite metric, suggesting that combining fast EV expansion, smart charging, and aggressive PV regulation is not cost-effective and tends to deteriorate at least one of the reliability or balance indicators. Looking at individual components, EV4_PV1 achieves the strongest supply–demand performance, confirming that targeted charge-time management can significantly reduce adequacy stress even with modest PV growth, while EV3_PV3 produces the poorest supply demand balance outcome when EV and PV growth are both strongly driven by regulation. For annual production–consumption balance, EV3_PV1 again emerges as the best configuration, whereas EV1_PV3 (slow EV with aggressive PV regulation) leads to the largest long-term mismatch. Finally, EV1_PV1 is unsurprisingly the least costly policy pathway, while EV5_PV5 is the most expensive, highlighting that maximalist interventions on both EV and PV sides incur very high fiscal and system-cost penalties relative to their reliability and balance benefits.
Figure 19.
Heatmap of Total Score (%) by Year and Scenario.
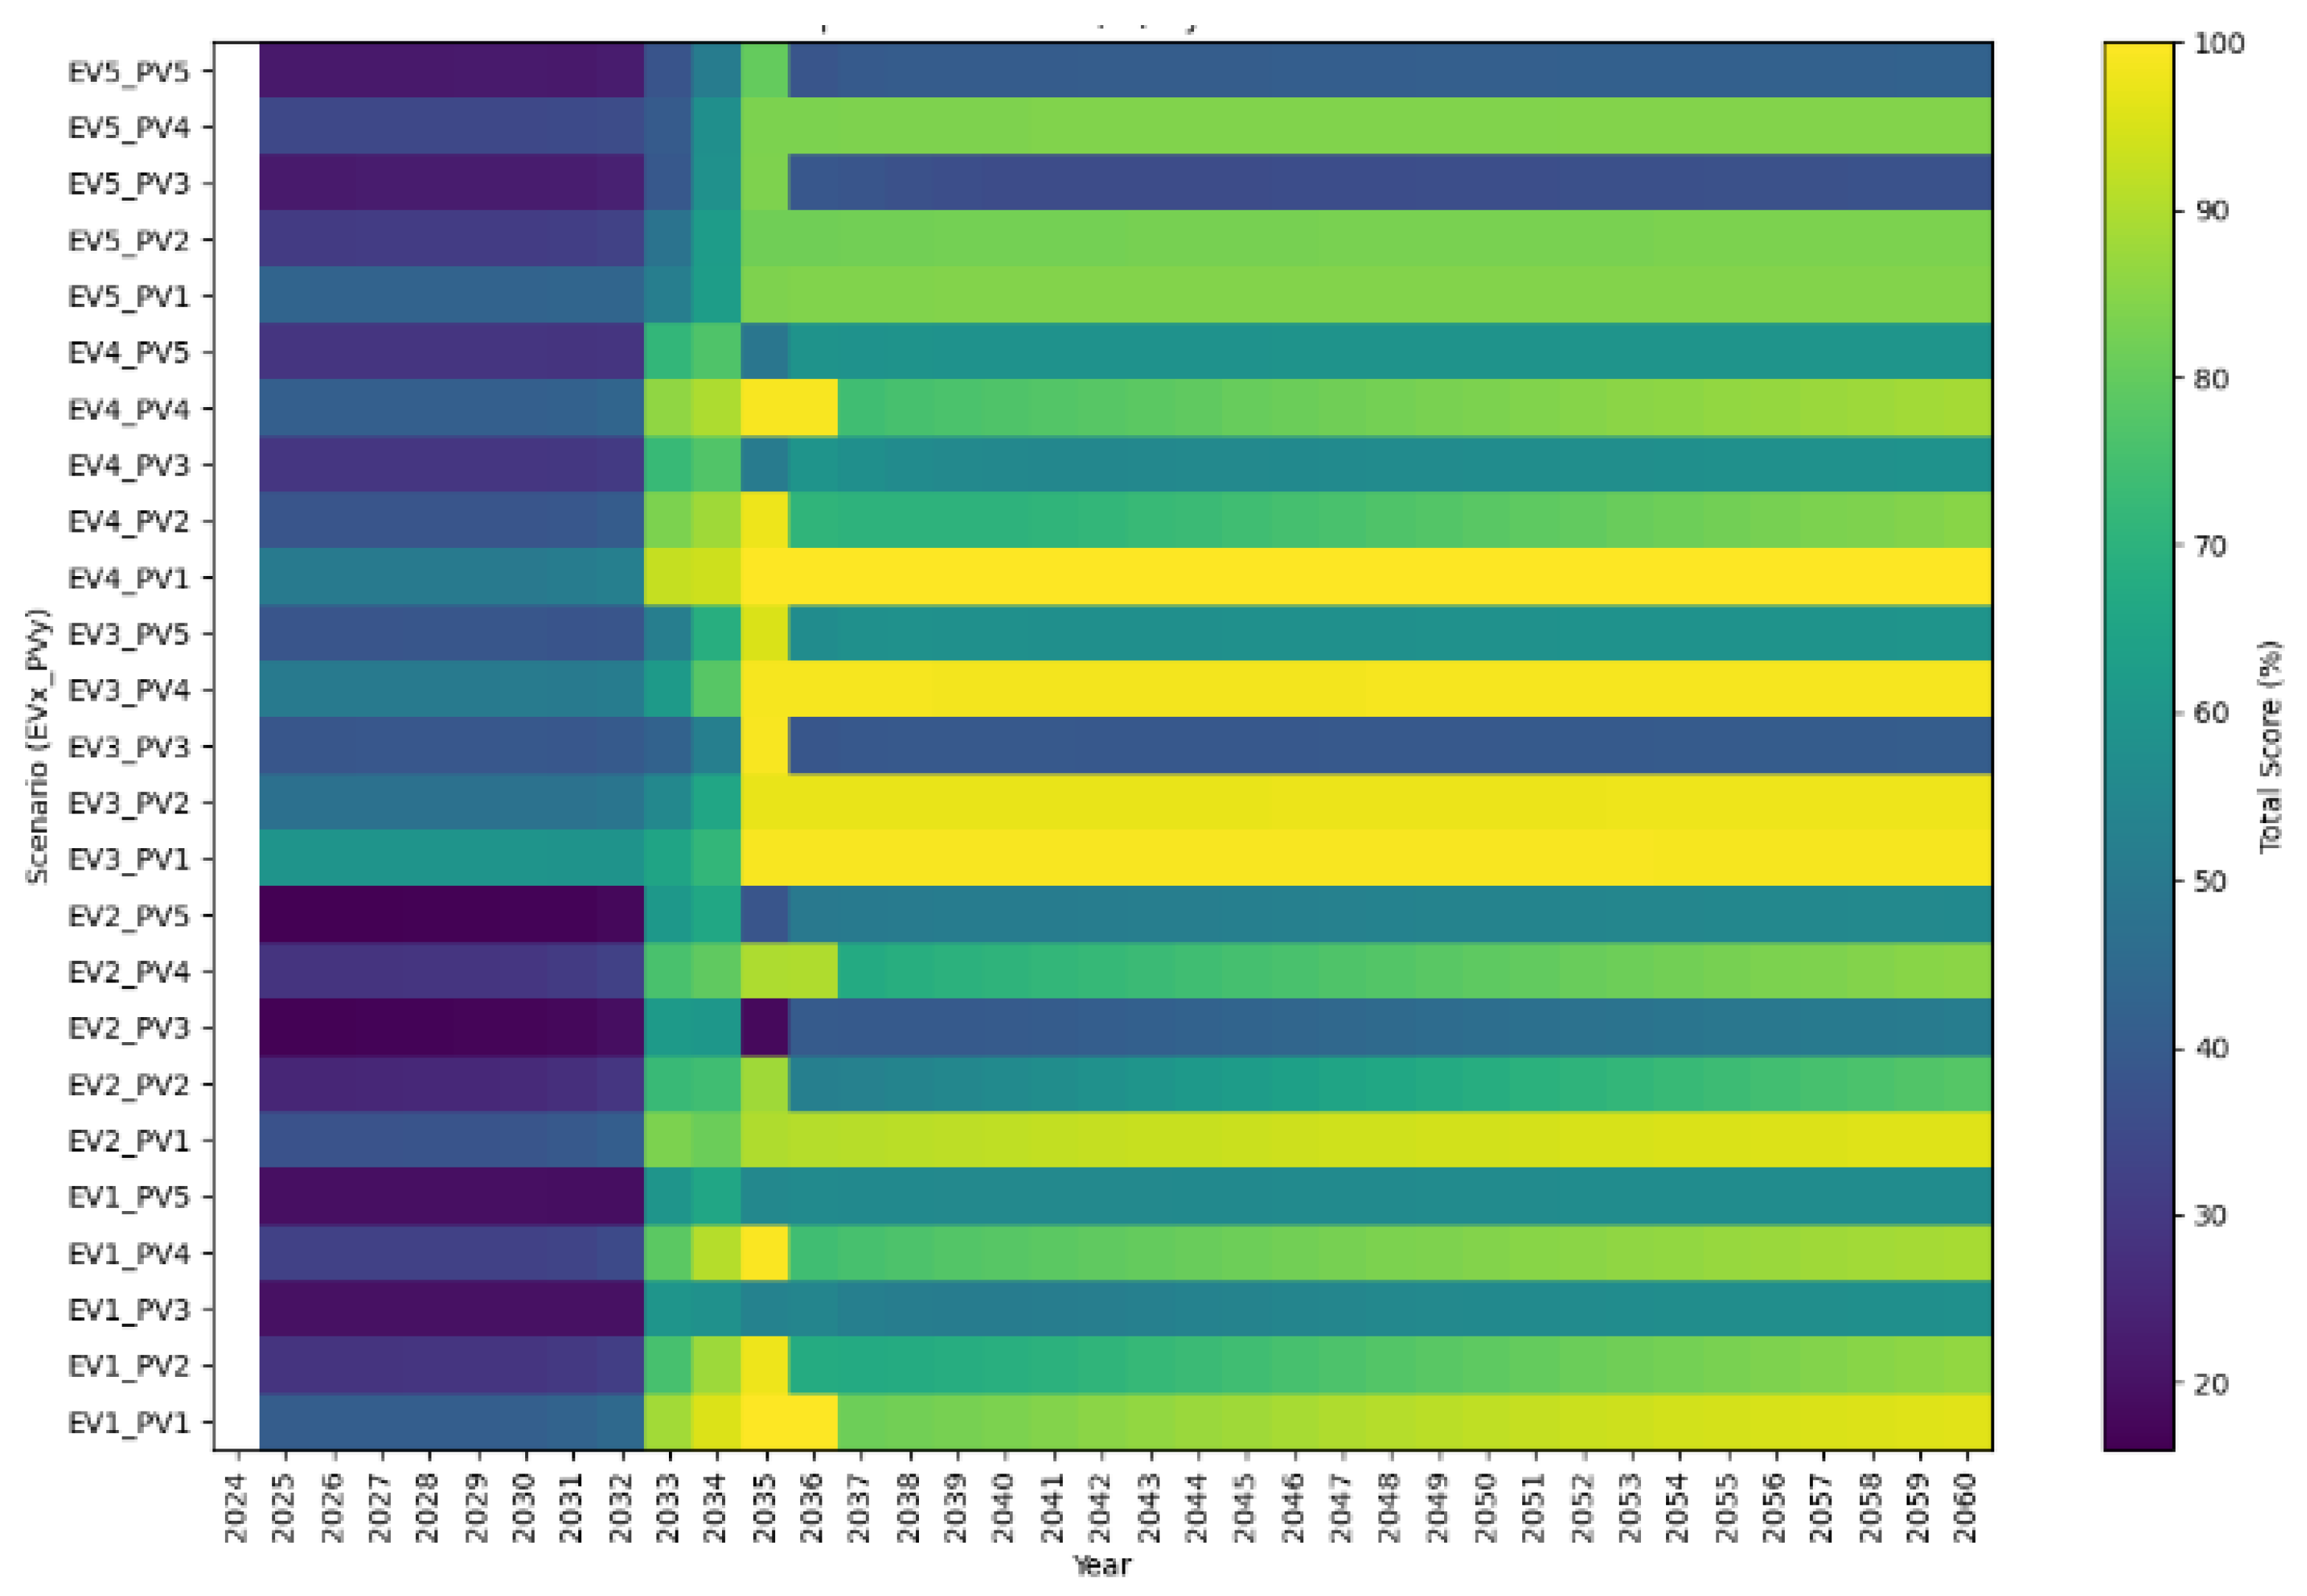
Table 9.
Output Scenarios
| Metric | Best_scenario | Best_avg_score | Worst_scenario | Worst_avg_score |
|---|---|---|---|---|
| Overall Composite Score | EV3_PV1 | 88.53% | EV5_PV3 | 35.35% |
| Supply–Demand Component | EV4_PV1 | 0.75 | EV3_PV3 | 0.02 |
| Production–Consumption Component | EV3_PV1 | 1.00 | EV1_PV3 | 0.00 |
| Policy Cost Component | EV1_PV1 | 1.00 | EV5_PV5 | 0.00 |
4. Conclusions
In this paper, we have developed and applied a reproducible simulation framework to assess the long-term interaction between electric-vehicle (EV) charging demand and rooftop photovoltaic (PV) “negative load” on the Java–Madura–Bali (Jamali) grid over the 2024–2060 horizon. Annual capacity, peak load, and energy balance trajectories were first calibrated to historical statistics and RUKN projections, then downscaled to hourly resolution for a representative week and to daily production–consumption profiles for a full year. On top of this baseline, we constructed a 5×5 policy matrix for EV and PV development, combining business-as-usual (BAU), regulation, subsidies, smart-charging/smart-home measures, and their combinations. Each EV–PV pathway was evaluated using a min–max composite index in percent, with 40% weight on weekly supply–demand adequacy, 40% on annual production–consumption balance, and 20% on program cost, such that higher values indicate lower adequacy stress, more favorable annual balance, and lower fiscal/system cost.
Across all 25 scenarios and the full multi-decadal horizon, the ranking shows that EV3_PV1 delivers the highest average composite score. This result indicates that relatively fast EV uptake driven by regulation, when paired with BAU rooftop-PV diffusion, provides the most robust compromise between adequacy, long-term energy balance, and policy cost. In contrast, EV5_PV3 systematically performs worst on the composite metric, suggesting that simultaneously combining aggressive EV expansion, smart charging, and strict PV regulation is not cost-effective and tends to deteriorate at least one of the reliability or balance components despite high policy effort. When the components are examined separately, EV4_PV1 achieves the strongest supply–demand adequacy performance, confirming that targeted charge-time management can substantially relieve adequacy stress even under modest PV expansion. At the other extreme, EV3_PV3 produces the poorest supply demand balance outcome, indicating that strong regulatory push on both EV and PV sides can lead to unfavorable coincidence between charging peaks and net load if not accompanied by sufficient flexibility mechanisms.
For the annual production–consumption balance, EV3_PV1 again emerges as the most favorable configuration, underscoring that a regulated but not “maximalist” EV trajectory combined with organic PV growth tends to avoid persistent long-term surplus or deficit on the Jamali system. By contrast, EV1_PV3 (slow EV growth with stringent PV regulation) leads to the largest long-term mismatch, highlighting that constraining rooftop PV while keeping EV diffusion slow may lock the grid into a structurally less balanced regime. From the cost perspective, the results confirm that EV1_PV1 is, unsurprisingly, the least expensive policy pathway, but it also delivers only moderate improvements in adequacy and balance. Conversely, EV5_PV5 represents the costliest configuration, reflecting that simultaneous “maximalist” intervention on both EV and PV sides—via subsidies, regulation, and smart-technology support—incurs very high fiscal and system-cost penalties relative to the incremental benefits in reliability and balance captured by the composite index.
Taken together, these findings suggest that, for the Jamali grid under the assumptions used in this study, policy designs that favor moderate but well-targeted regulation (particularly on the EV side) and simple charge-time management can outperform both laissez-faire and fully interventionist approaches when evaluated on a multi-criteria basis. Very aggressive, multi-instrument packages do not necessarily translate into better system outcomes once adequacy, annual balance, and cost are evaluated jointly, and certain combinations of strong EV and PV regulation can even worsen adequacy indicators. The framework presented here can be used by planners to stress-test alternative EV–PV policy portfolios and to identify robust “middle-of-the-road” pathways that deliver significant reliability and decarbonization gains without excessive cost.
Future work may extend this analysis by explicitly modeling transmission constraints within Jamali, incorporating vehicle-to-grid operation and differentiated ICT patterns across user segments, and endogenizing investment and behavioral responses to tariffs and incentives. Incorporating uncertainty in macroeconomic drivers, technology cost trajectories, and policy implementation pace through more extensive Monte Carlo analysis would further strengthen the robustness of the conclusions. Nonetheless, the present results already indicate that carefully calibrated EV regulation and pragmatic charge-time management, coupled with realistic rooftop-PV deployment, can play a central role in maintaining supply–demand adequacy and production–consumption balance on the road toward Indonesia’s long-term net-zero targets.
Author Contributions
“Conceptualization, J.T. and R.D.; methodology, B.S.; software, J.T.; validation, J.T., R.D. and B.S.; formal analysis, J.T.; investigation, R.D.; resources, B.S.; data curation, J.T.; writing—original draft preparation, J.T.; writing—review and editing, R.D.; visualization, J.T.; supervision, R.D.; project administration, R.D.; funding acquisition, R.D. All authors have read and agreed to the published version of the manuscript.
Funding
This research received no external funding
Conflicts of Interest
The authors declare no conflicts of interest.
Abbreviations
The following abbreviations are used in this manuscript:
| 2W | Two-wheelers |
| 4W | Four-wheelers |
| AC | Alternating Current |
| ARIMA | AutoRegressive Integrated Moving Average |
| BAU | Business-as-usual |
| BEV | Battery-electric vehicle |
| CAPEX | Capital Expenditure |
| DC | Direct Current |
| ESDM | Ministry of Energy and Mineral Resources (Kementerian Energi dan Sumber Daya Mineral) |
| ESO | Electricity System Operator |
| EV | Electric-vehicle |
| ICT | Initial charging-time |
| IDR | Indonesian Rupiah |
| IEA | International Energy Agency |
| ICE | Internal Combustion Engine |
| ISO | Independent System Operator |
| Jamali | Java–Madura–Bali |
| LSTM | Long short-term memory |
| MAE | Mean Absolute Error |
| MAPE | Mean Absolute Percentage Error |
| PAR | Peak-to-average ratio |
| PLN | Perusahaan Listrik Negara (Indonesian state-owned electricity company) |
| PMK | Peraturan Menteri Keuangan (Ministry of Finance Regulation) |
| PR | Performance ratio |
| PV | Photovoltaics |
| RMSE | Root Mean Square Error |
| RTPV | Residential rooftop PV |
| RUKN | Rencana Umum Ketenagalistrikan Nasional (National Electricity General Plan) |
| SOC | State-of-charge |
| SPKLU | Stasiun Pengisian Kendaraan Listrik Umum (Public Charging Points) |
| VAT | Value Added Tax |
References
- Indonesia. Long-Term Strategy for Low Carbon and Climate Resilience 2050 (Indonesia LTS-LCCR 2050). Available online: https://unfccc.int/documents/299279 (accessed on 13 September 2025).
- Ministry of Energy and Mineral Resources (ESDM). Ini Target Pemerintah untuk Populasi Kendaraan Listrik di Tahun 2030. Available online: https://www.esdm.go.id/en/media-center/news-archives/ini-target-pemerintah-untuk-populasi-kendaraan-listrik-di-tahun-2030 (accessed on 1 December 2025).
- Ministry of Finance; Republic of Indonesia. Peraturan Menteri Keuangan Nomor 38 Tahun 2023 Tentang PPN Ditanggung Pemerintah Tahun Anggaran 2023. Available online: https://jdih.kemenkeu.go.id/api/download/00a89875-b351-47c7-b584-a0d75b63340f/2023pmkeuangan038.pdf (accessed on 14 November 2025).
- Ministry of Finance; Republic of Indonesia. Peraturan Menteri Keuangan Nomor 8 Tahun 2024 Tentang PPN Ditanggung Pemerintah Tahun Anggaran 2024. Available online: https://jdih.kemenkeu.go.id/api/download/7178d808-6b33-415c-ba1c-087952552b0c/2024pmkeuangan008.pdf (accessed on 9 September 2025).
- International Energy Agency (IEA). Trends in electric car markets, Global EV Outlook 2025. Available online: https://www.iea.org/reports/global-ev-outlook-2025/trends-in-electric-car-markets (accessed on 6 December 2025).
- Directorate General of Electricity (Gatrik), ESDM. Pemerintah Siapkan Roadmap Pengembangan SPKLU. Available online: https://gatrik.esdm.go.id/post/read/pemerintah-siapkan-roadmap-pengembangan-spklu (accessed on 8 September 2025).
- Republic of Indonesia. Peraturan Presiden Nomor 79 Tahun 2023 tentang Perubahan atas Peraturan Presiden Nomor 55 Tahun 2019 tentang Percepatan Program Kendaraan Bermotor Listrik Berbasis Baterai. Available online: https://peraturan.bpk.go.id/Details/273447/perpres-no-79-tahun-2023 (accessed on 15 December 2025).
- International Renewable Energy Agency (IRENA). Innovation Outlook: Smart Charging for Electric Vehicles. Available online: https://www.irena.org/-/media/Files/IRENA/Agency/Publication/2019/May/IRENA_Innovation_Outlook_EV_smart_charging_2019.pdf (accessed on 17 November 2025).
- PT; PLN. Beli Mobil Listrik? PLN Hadirkan Promo Charging. Available online: https://web.pln.co.id/media/siaran-pers/2024/08/beli-mobil-listrik-pln-hadirkan-promo-charging (accessed on 19 October 2025).
- Ministry of Energy and Mineral Resources (ESDM). Kementerian ESDM Dorong Pemanfaatan Sel Surya di Atap Rumah dan Gedung Perkantoran. Available online: https://www.esdm.go.id/en/media-center/news-archives/kementerian-esdm-dorong-pemanfaatan-sel-surya-di-atap-rumah-dan-gedung-perkantoran (accessed on 20 September 2025).
- Ministry of Energy and Mineral Resources (ESDM). Peraturan Menteri ESDM Nomor 2 Tahun 2024 tentang PLTS Atap. Available online: https://jdih.esdm.go.id/storage/document/Permen%20ESDM%20No%202%20Thn%202%202024.pdf (accessed on 24 September 2025).
- Indonesia.go.id. Jelang Permen Baru PLTS Atap, Kuota Ekspor Listrik Dihapus. Available online: https://indonesia.go.id/kategori/editorial/10358/jelang-permen-baru-plts-atap-kuota-ekspor-listrik-dihapus (accessed on 20 September 2025).
- Garniwa, P.M.; et al. Global Horizontal Irradiance Estimation in Tropical Terrain Using Semi-Empirical Approach: A Seasonal Assessment in West Java, Indonesia. Int. J. Remote Sens. Earth Sci. 2025. Available online: https://ejournal.brin.go.id/ijreses/article/download/11405/10163/36013 (accessed on 9 October 2025).
- Ministry of Energy and Mineral Resources (ESDM). Policy Adjustment on Rooftop Solar PV Regulation Has Been Implemented by the Ministry of Energy and Mineral Resources. Available online: https://www.esdm.go.id/en/media-center/news-archives/policy-adjustment-on-rooftop-solar-pv-regulation-has-been-implemented-by-the-ministry-of-energy-and-mineral-resources (accessed on 6 September 2025).
- PT, PLN. Statistics PLN 2023. Available online: https://web.pln.co.id/statics/uploads/2025/09/Statistik-PLN-2023-Eng.pdf (accessed on 2 November 2025).
- PT, PLN. Statistics PLN 2023. Available online: https://web.pln.co.id/statics/uploads/2025/09/Statistik-PLN-2023-Eng.pdf (accessed on 12 September 2025).
- CNBC Indonesia. Bye Listrik Luber! Tahun Depan Pasokan Listrik RI Gak Berlebih Lagi. Available online: https://www.cnbcindonesia.com/news/20241004162629-4-577091/bye-listrik-luber-tahun-depan-pasokan-listrik-ri-gak-berlebih-lagi (accessed on 13 October 2025).
- PT, PLN. Statistics PLN 2023. Available online: https://web.pln.co.id/statics/uploads/2025/09/Statistik-PLN-2023-Eng.pdf (accessed on 20 September 2025).
- PT, PLN. Statistics PLN 2023. Available online: https://web.pln.co.id/statics/uploads/2025/09/Statistik-PLN-2023-Eng.pdf (accessed on 22 September 2025).
- Kementerian ESDM. Manajemen Rantai Penyediaan dan Pemanfaatan Energi Nasional. Available online: https://www.esdm.go.id/assets/media/content/content-manajemen-rantai-penyediaan-dan-pemanfaatan-energi-nasional-.pdf (accessed on 4 October 2025).
- Iqbal, M.; et al. Travel Activity Based Stochastic Modelling of Load and Charging State of Electric Vehicles. Sustainability 2021, 13, 1550. [Google Scholar] [CrossRef]
- Iqbal, M.; et al. Travel Activity Based Stochastic Modelling of Load and Charging State of Electric Vehicles. Sustainability 2021, 13, 1550. [Google Scholar] [CrossRef]
- Hecht, J.; et al. Standard Load Profiles for Electric Vehicle Charging Stations in Germany Based on Representative, Empirical Data. Energies 2023, 16, 2619. [Google Scholar] [CrossRef]
- Hecht, J.; et al. Standard Load Profiles for Electric Vehicle Charging Stations in Germany Based on Representative, Empirical Data. Energies 2023, 16, 2619. [Google Scholar] [CrossRef]
- Iqbal, M.; et al. Travel Activity Based Stochastic Modelling of Load and Charging State of Electric Vehicles. Sustainability 2021, 13, 1550. [Google Scholar] [CrossRef]
- Meng, B.; et al. Performance variability and implications for yield prediction of rooftop PV systems—Analysis of 246 identical systems. Appl. Energy 2022, 322, 119550. [Google Scholar]
- Van Haaren, R.; Morjaria, M.; Fthenakis, V. Empirical assessment of short-term variability from utility-scale solar PV plants. Prog. Photovolt. Res. Appl. 2014, 22, 548–559. [Google Scholar] [CrossRef]
- Ellis, A.; Pearre, A.; Swan, L. Power ramp rates and variability of individual and aggregate photovoltaic systems using measured production data at the municipal scale. Solar Energy 2021, 220, 363–370. [Google Scholar] [CrossRef]
- Dobos, A.P. PVWatts Version 5 Manual; National Renewable Energy Laboratory (NREL): Golden, CO, USA, 2014. [Google Scholar]
- International Electrotechnical Commission. IEC 61724-1: Photovoltaic System Performance—Part 1: Monitoring. Available online: https://webstore.iec.ch/searchform?q=61724-1 (accessed on 12 October 2025).
- Surya, A.; et al. Peak Load Forecasting Using Long-Short Term Memory (LSTM) and Backpropagation (BP) in Jawa–Madura–Bali System. In Proceedings of the International Conference on Technology and Policy in Energy and Electric Power (ICT-PEP), Jakarta, Indonesia, 2021. [Google Scholar]
- Marbun, E.; et al. Solar PV Total Cost Calculation in Jawa–Madura–Bali System. In Proceedings of the International Conference on Technology and Policy in Energy and Electric Power (ICT-PEP), Jakarta, Indonesia, 2022. [Google Scholar]
- Amir, N.; et al. Techno-economic and environmental analyses of a grid-connected renewable energy power system in Madura, Indonesia. Int. J. Ambient Energy 2022. [Google Scholar] [CrossRef]
- Sukarso, P.; Adimas. Decarbonizing Electricity in Indonesia: Opportunity in the Implementation of Rooftop Solar PV. IOP Conf. Ser. Mater. Sci. Eng, 2023. [Google Scholar]
- Mohammad, M.; et al. A Review on PV Based Electric Vehicle Modeling in Distribution Network. Energies 2020, 13, 4541. [Google Scholar] [CrossRef]
- Dong, S.; et al. User Decision-based Analysis of Urban Electric Vehicle Loads. CSEE J. Power Energy Syst. 2021, 7, 190–200. [Google Scholar]
- Hiesl, A.; Ramsebner, J.; Haas, R. Modelling Stochastic Electricity Demand of Electric Vehicles Based on Traffic Surveys—The Case of Austria. Energies 2021, 14, 1577. [Google Scholar] [CrossRef]
- Jurasz, J.; Dąbek, P.; Campana, P. Can a city reach energy self-sufficiency by means of rooftop photovoltaics? Case study from Poland. J. Cleaner Prod. 2020, 245, 118813. [Google Scholar] [CrossRef]
- Martin, H.; et al. Using rooftop photovoltaic generation to cover individual electric vehicle demand—A detailed case study. Renew. Sustain. Energy Rev. 2022, 157, 111969. [Google Scholar] [CrossRef]
- Liu, X.; et al. PV-EV Integrated Home Energy Management Considering Residential Occupant Behaviors. Sustainability 2021, 13, 13826. [Google Scholar] [CrossRef]
- Merrington, S.; Khezri, R.; Mahmoudi, A. Optimal sizing of grid-connected rooftop photovoltaic and battery energy storage for houses with electric vehicle. IET Smart Grid 2023, 6, 297–311. [Google Scholar] [CrossRef]
- Jittayasotorn, T.; Sadidah, M.; Yoshida, T.; Kobashi, T. On the Adoption of Rooftop Photovoltaics Integrated with Electric Vehicles toward Sustainable Bangkok City, Thailand. Energies 2023, 16, 3011. [Google Scholar] [CrossRef]
- Alyami, S.; et al. Novel Flexibility Indices of Controllable Loads in Relation to EV and Rooftop PV. ResearchGate 2023. [Google Scholar] [CrossRef]
- Almutairi, M.; et al. Flexibility Assessment of Home Manageable Loads in Connection with EV and Rooftop PV Systems. In Proceedings of the Saudi Arabia Smart Grid Conf. (SASG), Riyadh, Saudi Arabia, 2023. [Google Scholar]
- Liu, X.; et al. PV-EV Integrated Home Energy Management Considering Residential Occupant Behaviors. Sustainability 2021, 13, 13826. [Google Scholar] [CrossRef]
- Martin, H.; et al. Using rooftop photovoltaic generation to cover individual electric vehicle demand—A detailed case study. Renew. Sustain. Energy Rev. 2022, 157, 111969. [Google Scholar] [CrossRef]
- Merrington, S.; Khezri, R.; Mahmoudi, A. Optimal sizing of grid-connected rooftop photovoltaic and battery energy storage for houses with electric vehicle. IET Smart Grid 2023, 6, 297–311. [Google Scholar] [CrossRef]
- Zhao, X.; Zhang, Y.; Li, Y. CityEnergyFlow Navigator: Optimizing Building-EV Coordinate Operation on Rooftop PV Self-Consumption Performance at City Scale. In Proceedings of the Urban Transitions Conference, 2024. [Google Scholar]
- Chang, S.; et al. Energy infrastructure transitions with PV and EV combined systems using techno-economic analyses for decarbonization in cities. Appl. Energy 2022, 319, 119254. [Google Scholar] [CrossRef]
- Kobashi, T.; et al. Rapid rise of decarbonization potentials of photovoltaics plus electric vehicles in residential houses over commercial districts. Appl. Energy 2022, 306, 118142. [Google Scholar] [CrossRef]
- Amiruddin, A.; et al. Integration of Electric Vehicles and Renewable Energy in Indonesia’s Electrical Grid. Energies 2024, 17, 2037. [Google Scholar] [CrossRef]
- World Bank. Population, total – Indonesia (SP.POP.TOTL). Available online: https://data.worldbank.org/indicator/SP.POP.TOTL?locations=ID (accessed on 20 September 2025).
- NASA POWER Project. Data Access Viewer (DAV). Available online: https://power.larc.nasa.gov/data-access-viewer/ (accessed on 1 November 2025).
- PT PLN (Persero). Jamali hourly system load data (representative week, base year 2024). In Internal/utility operational dataset; 2024. [Google Scholar]
- Kementerian ESDM. Statistik Ketenagalistrikan Tahun 2023. Available online: https://gatrik.esdm.go.id/ (accessed on 16 October 2025).
- GAIKINDO. Vehicle Sales by Province in Indonesia January–May 2025. Available online: https://www.gaikindo.or.id/ (accessed on 15 December 2025).
- Badan Pusat Statistik (BPS). Perkembangan jumlah kendaraan bermotor menurut jenis (unit). Available online: https://www.bps.go.id/ (accessed on 11 October 2025).
- Badan Pusat Statistik (BPS). Perkembangan jumlah kendaraan bermotor menurut jenis (unit). Available online: https://www.bps.go.id/ (accessed on 6 October 2025).
- Representative EV portfolio parameters for Jamali charging-demand simulation. Compiled from OEM specifications 2025.
- byd-tangerang.com. DENZA D9 EV — technical specifications. Available online: https://byd-tangerang.com (accessed on 29 September 2025).
- BYD. BYD M6 — technical specifications. Available online: https://www.byd.com/id (accessed on 11 September 2025).
- Mercedes-Benz. EQB 250 — technical specifications. Available online: https://mercedes-benz-media.co.uk (accessed on 5 October 2025).
- Wuling. Air ev — technical specifications. Available online: https://wuling.id (accessed on 4 December 2025).
- ALVA. ALVA Cervo / Cervo X — technical specifications. Available online: https://www.alvaauto.com/ (accessed on 3 October 2025).
- United Motor. United TX1800 — technical specifications. Available online: https://unitedmotor.co.id (accessed on 19 November 2025).
- Astra Honda Motor. Honda EM1 e: — specifications. Available online: https://www.astra-honda.com (accessed on 18 November 2025).
- Viar Motor Indonesia. Viar New Q1 — specifications. Available online: https://www.viarmotor.com (accessed on 8 September 2025).
- Iqbal, S.; et al. Travel Activity Based Stochastic Modelling of Load and Charging State of Electric Vehicles. Sustainability 2021, 13, 1550. [Google Scholar] [CrossRef]
- Kementerian ESDM. Rencana Umum Ketenagalistrikan Nasional (RUKN) 2024–2060. Available online: https://jdih.esdm.go.id/ (accessed on 23 November 2025).
- Badan Pusat Statistik (BPS). Sensus Penduduk dan Rumah Tangga. Available online: https://www.bps.go.id (accessed on 6 October 2025).
- Badan Pusat Statistik (BPS). Jumlah rumah tangga menurut provinsi. Available online: https://www.bps.go.id (accessed on 15 October 2025).
- Badan Pusat Statistik (BPS). Indikator Perumahan 1993–2024. Available online: https://www.bps.go.id (accessed on 31 October 2025).
- Dobos, A.P. PVWatts Version 1 Technical Reference; National Renewable Energy Laboratory (NREL): Golden, CO, USA, 2013. [Google Scholar]
- NASA POWER Project. NASA POWER Data Access Viewer (DAV). Available online: https://power.larc.nasa.gov/ (accessed on 12 October 2025).
- Beichter, J.; et al. Net load forecasting using different aggregation levels. Energy Informatics 2022, 5. [Google Scholar] [CrossRef]
- Ministry of Industry; Republic of Indonesia. Regulation No. 6 of 2023 on guidelines for government assistance for the purchase of battery-based electric motorcycles (2W). 2023. [Google Scholar]
- Republic of Indonesia. Presidential Regulation No. 55 of 2019 on acceleration of battery-based electric vehicles for road transportation. 2019. [Google Scholar]
- PT, PLN. Tariff adjustment / ToU (WBP–LWBP) customer information. Available online: https://web.pln.co.id (accessed on 12 September 2025).
- Ministry of Investment; Republic of Indonesia. Regulation No. 6 of 2023 regarding investment supporting EV industry. 2023. [Google Scholar]
- Republic of Indonesia. Presidential Regulation No. 112 of 2022 on acceleration of renewable energy development for electricity supply. 2022. [Google Scholar]
- Ministry of Energy and Mineral Resources; Republic of Indonesia. Regulation No. 2 of 2024 on rooftop solar PV for PLN customers. 2024. [Google Scholar]
- Pohl, E.; et al. IEEE 1547-2018 Adaptation for Locally-Appropriate Grid Codes; National Renewable Energy Laboratory (NREL): Golden, CO, USA, 2024. [Google Scholar]
- International Renewable Energy Agency (IRENA). Behind-the-meter batteries. Available online: https://www.irena.org (accessed on 15 September 2025).
- Ministry of Energy and Mineral Resources; Republic of Indonesia. Rencana Umum Ketenagalistrikan Nasional (RUKN) 2024–2060. 2024. [Google Scholar]
- OECD; European Commission–JRC. Handbook on Constructing Composite Indicators: Methodology and User Guide; OECD Publishing: Paris, France, 2008. [Google Scholar]
- Ministry of Communication and Digital (Komdigi). Purchase of electric motorcycles receives government assistance of Rp7 million. Available online: https://www.kominfo.go.id (accessed on 3 September 2025).
- Ministry of Home Affairs; Republic of Indonesia. Regulation No. 6 of 2023 (motor-vehicle tax base). 2023. [Google Scholar]
- International Energy Agency (IEA). Demand response. Available online: https://www.iea.org/reports/demand-response (accessed on 28 November 2025).
- Ministry of Finance; Republic of Indonesia. Regulation No. 12/PMK.010/2025 (EV-related VAT/fiscal incentive); 2025.
- Institute for Essential Services Reform (IESR). Indonesia Solar Energy Outlook 2023; IESR: Jakarta, Indonesia, 2023. [Google Scholar]
- IESR. Indonesia’s new rooftop solar regulation (Permen ESDM 2/2024). Available online: https://iesr.or.id (accessed on 21 September 2025).
- IEA 4E. Residential HEMS and Controllers – Global Market Scan; IEA: Paris, France, 2025. [Google Scholar]
- IRENA. Energy storage costs. Available online: https://www.irena.org (accessed on 6 December 2025).
Figure 2.
Global Simulation’s Flowchart
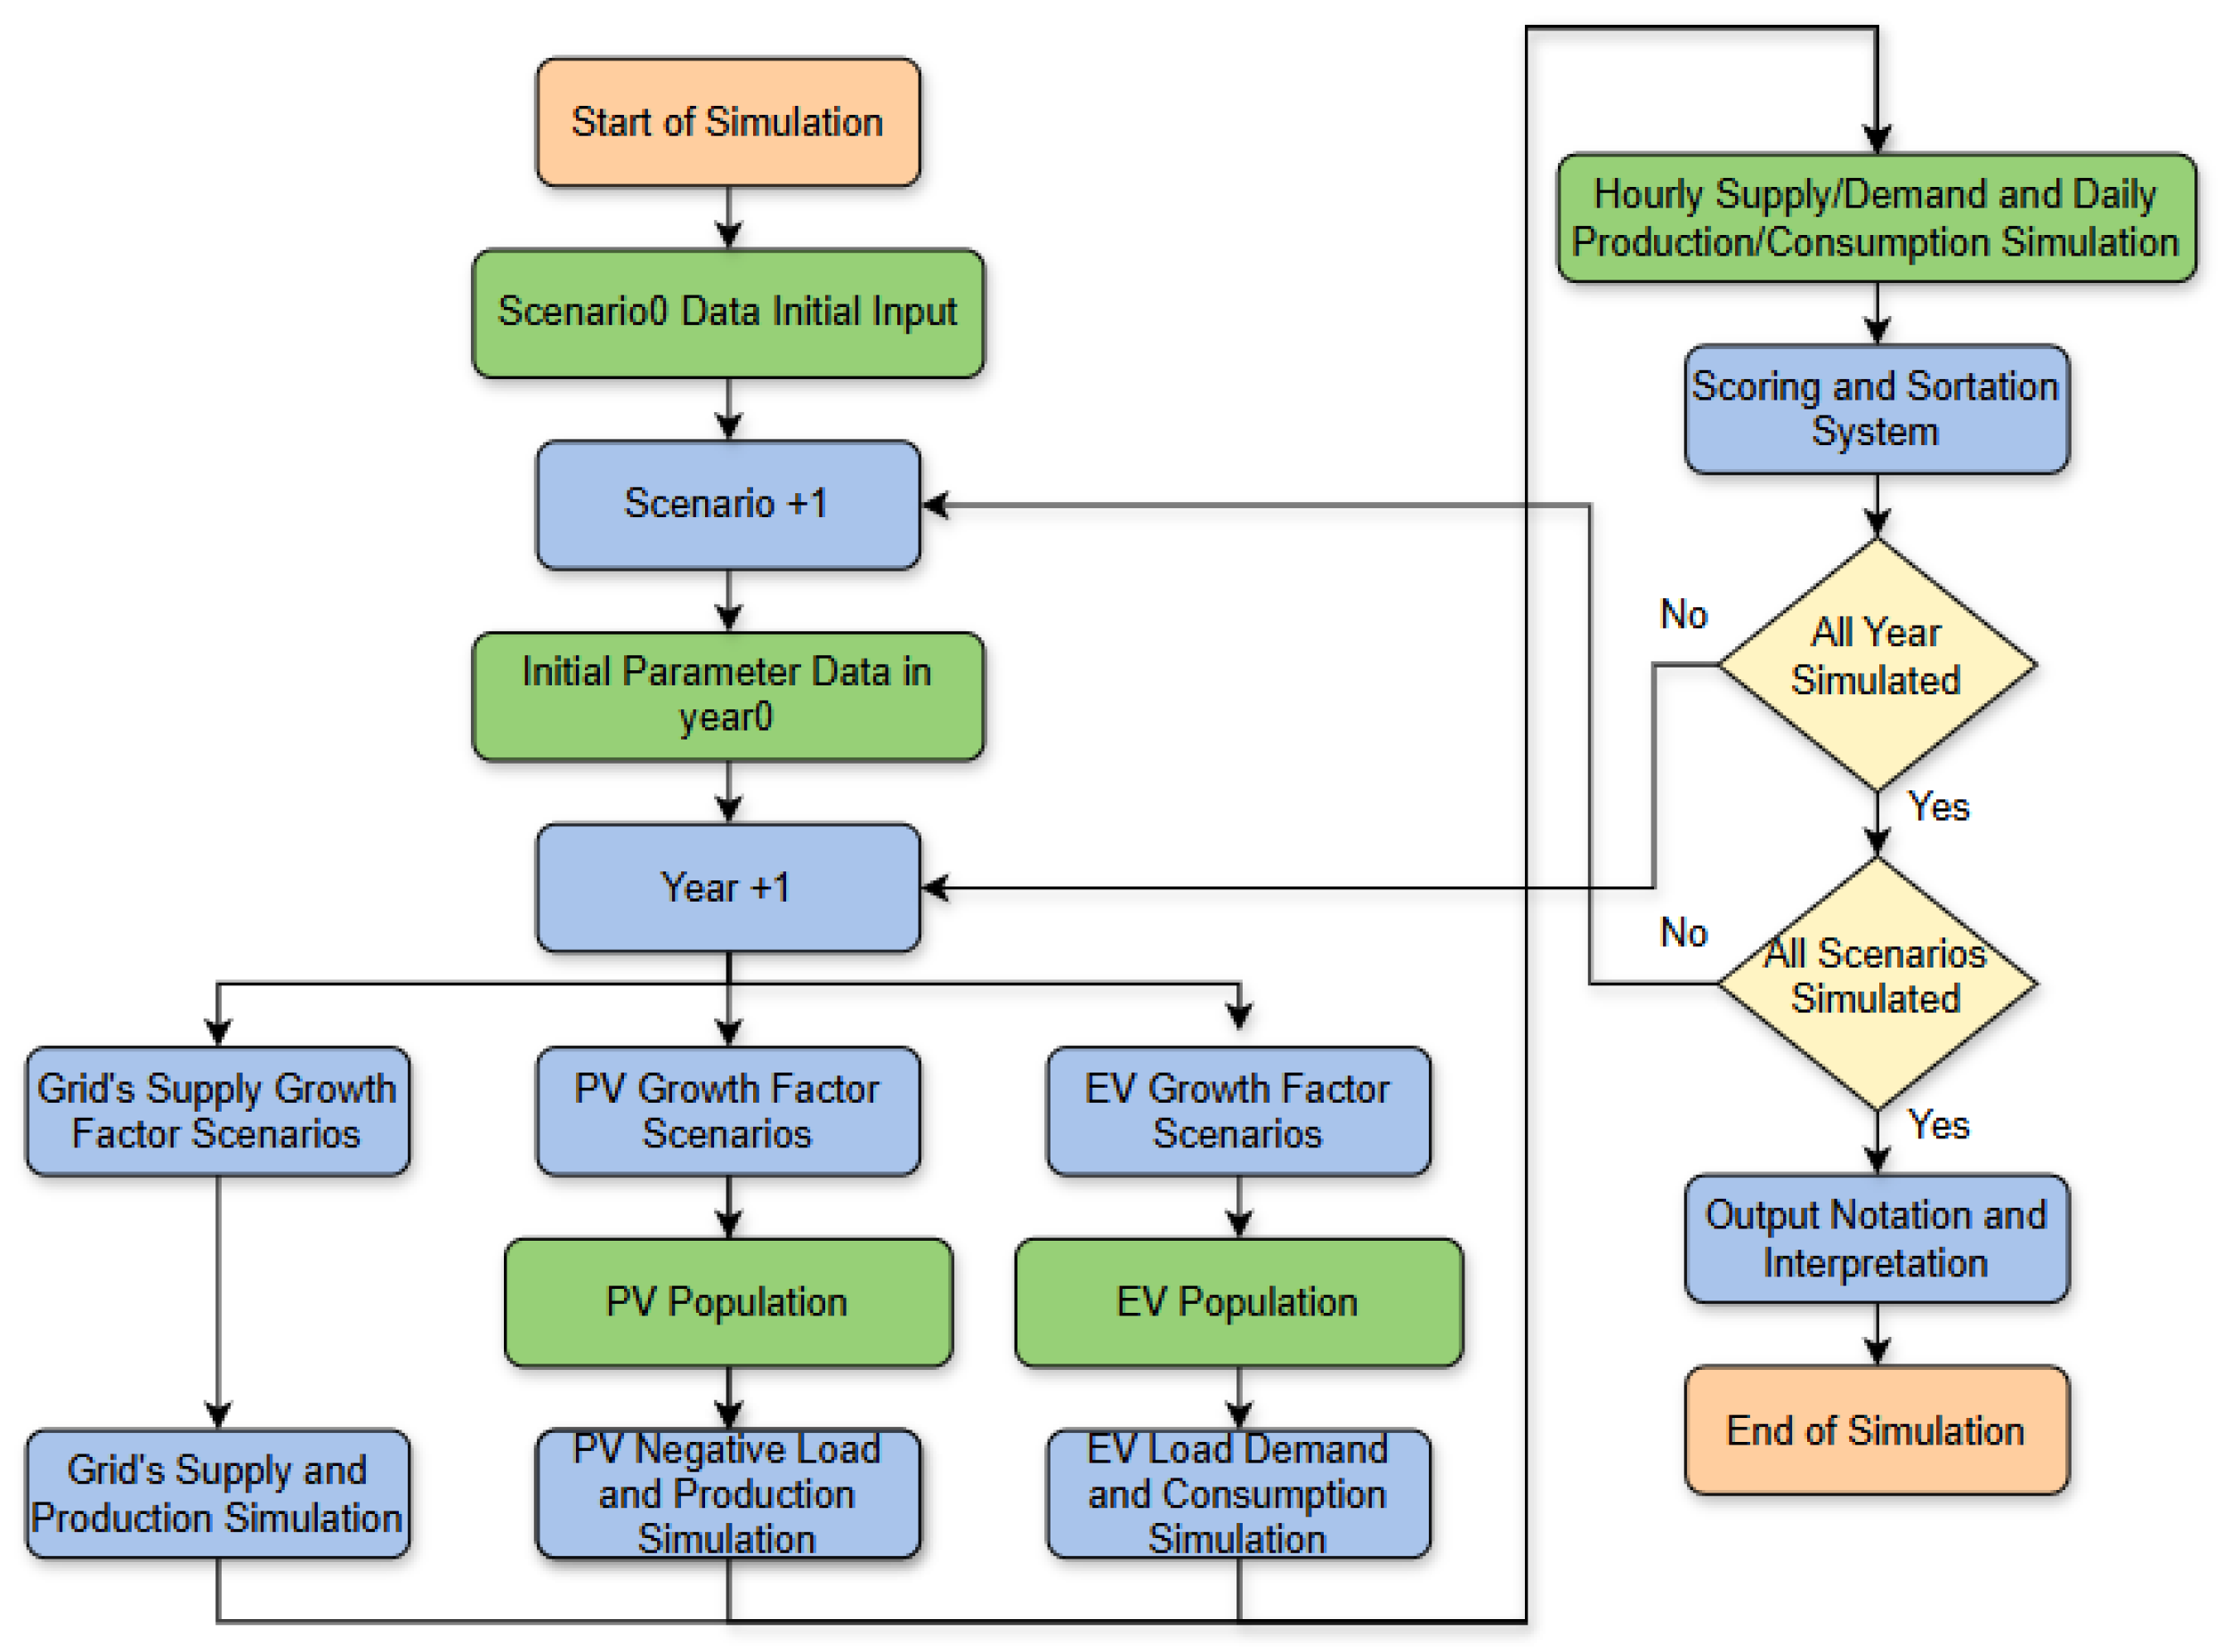
Figure 3.
Indonesia’s Historical Population [52]
Figure 3.
Indonesia’s Historical Population [52]
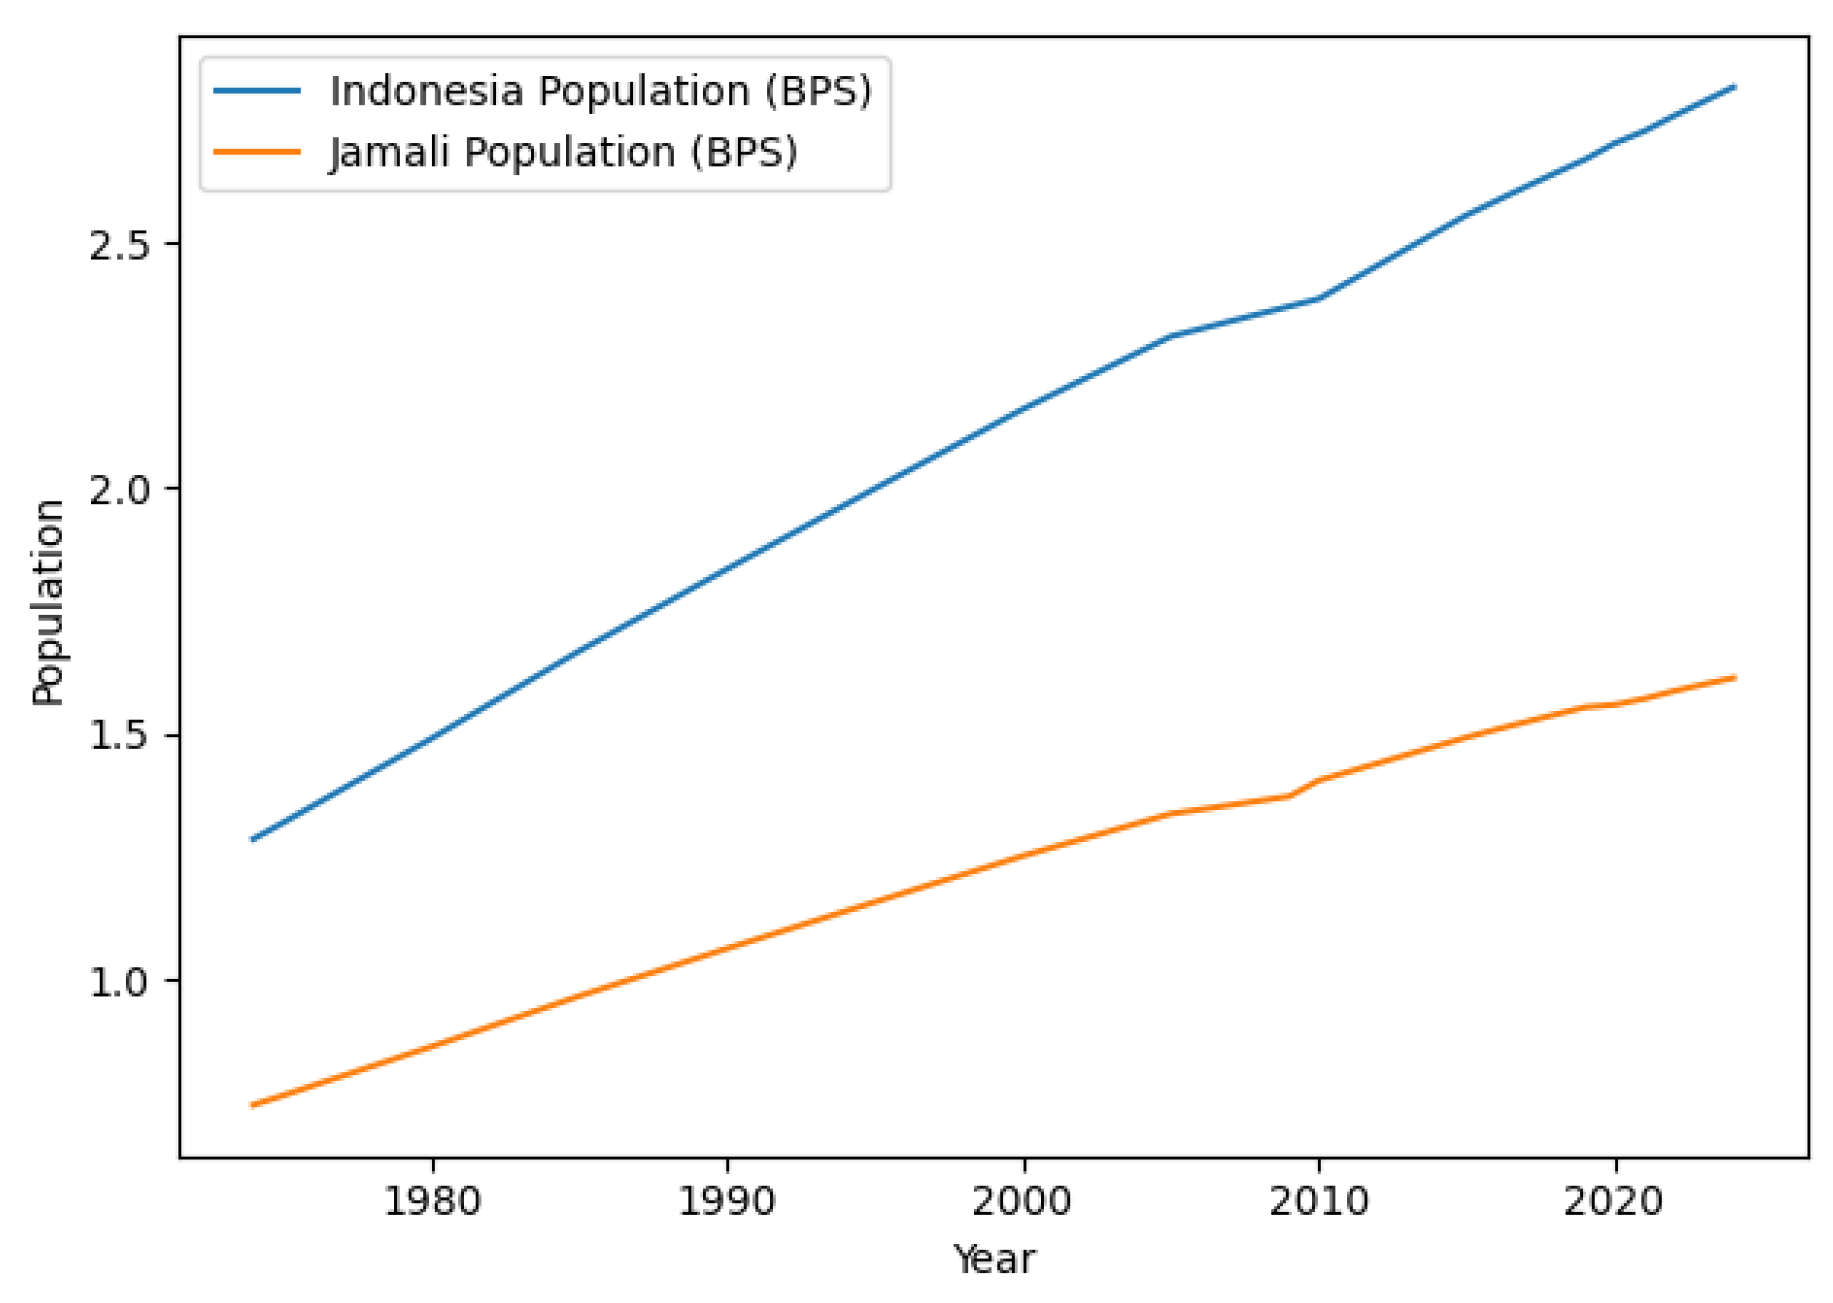
Figure 4.
Jamali Energy Production and Consumption Historical Data [55]
Figure 4.
Jamali Energy Production and Consumption Historical Data [55]
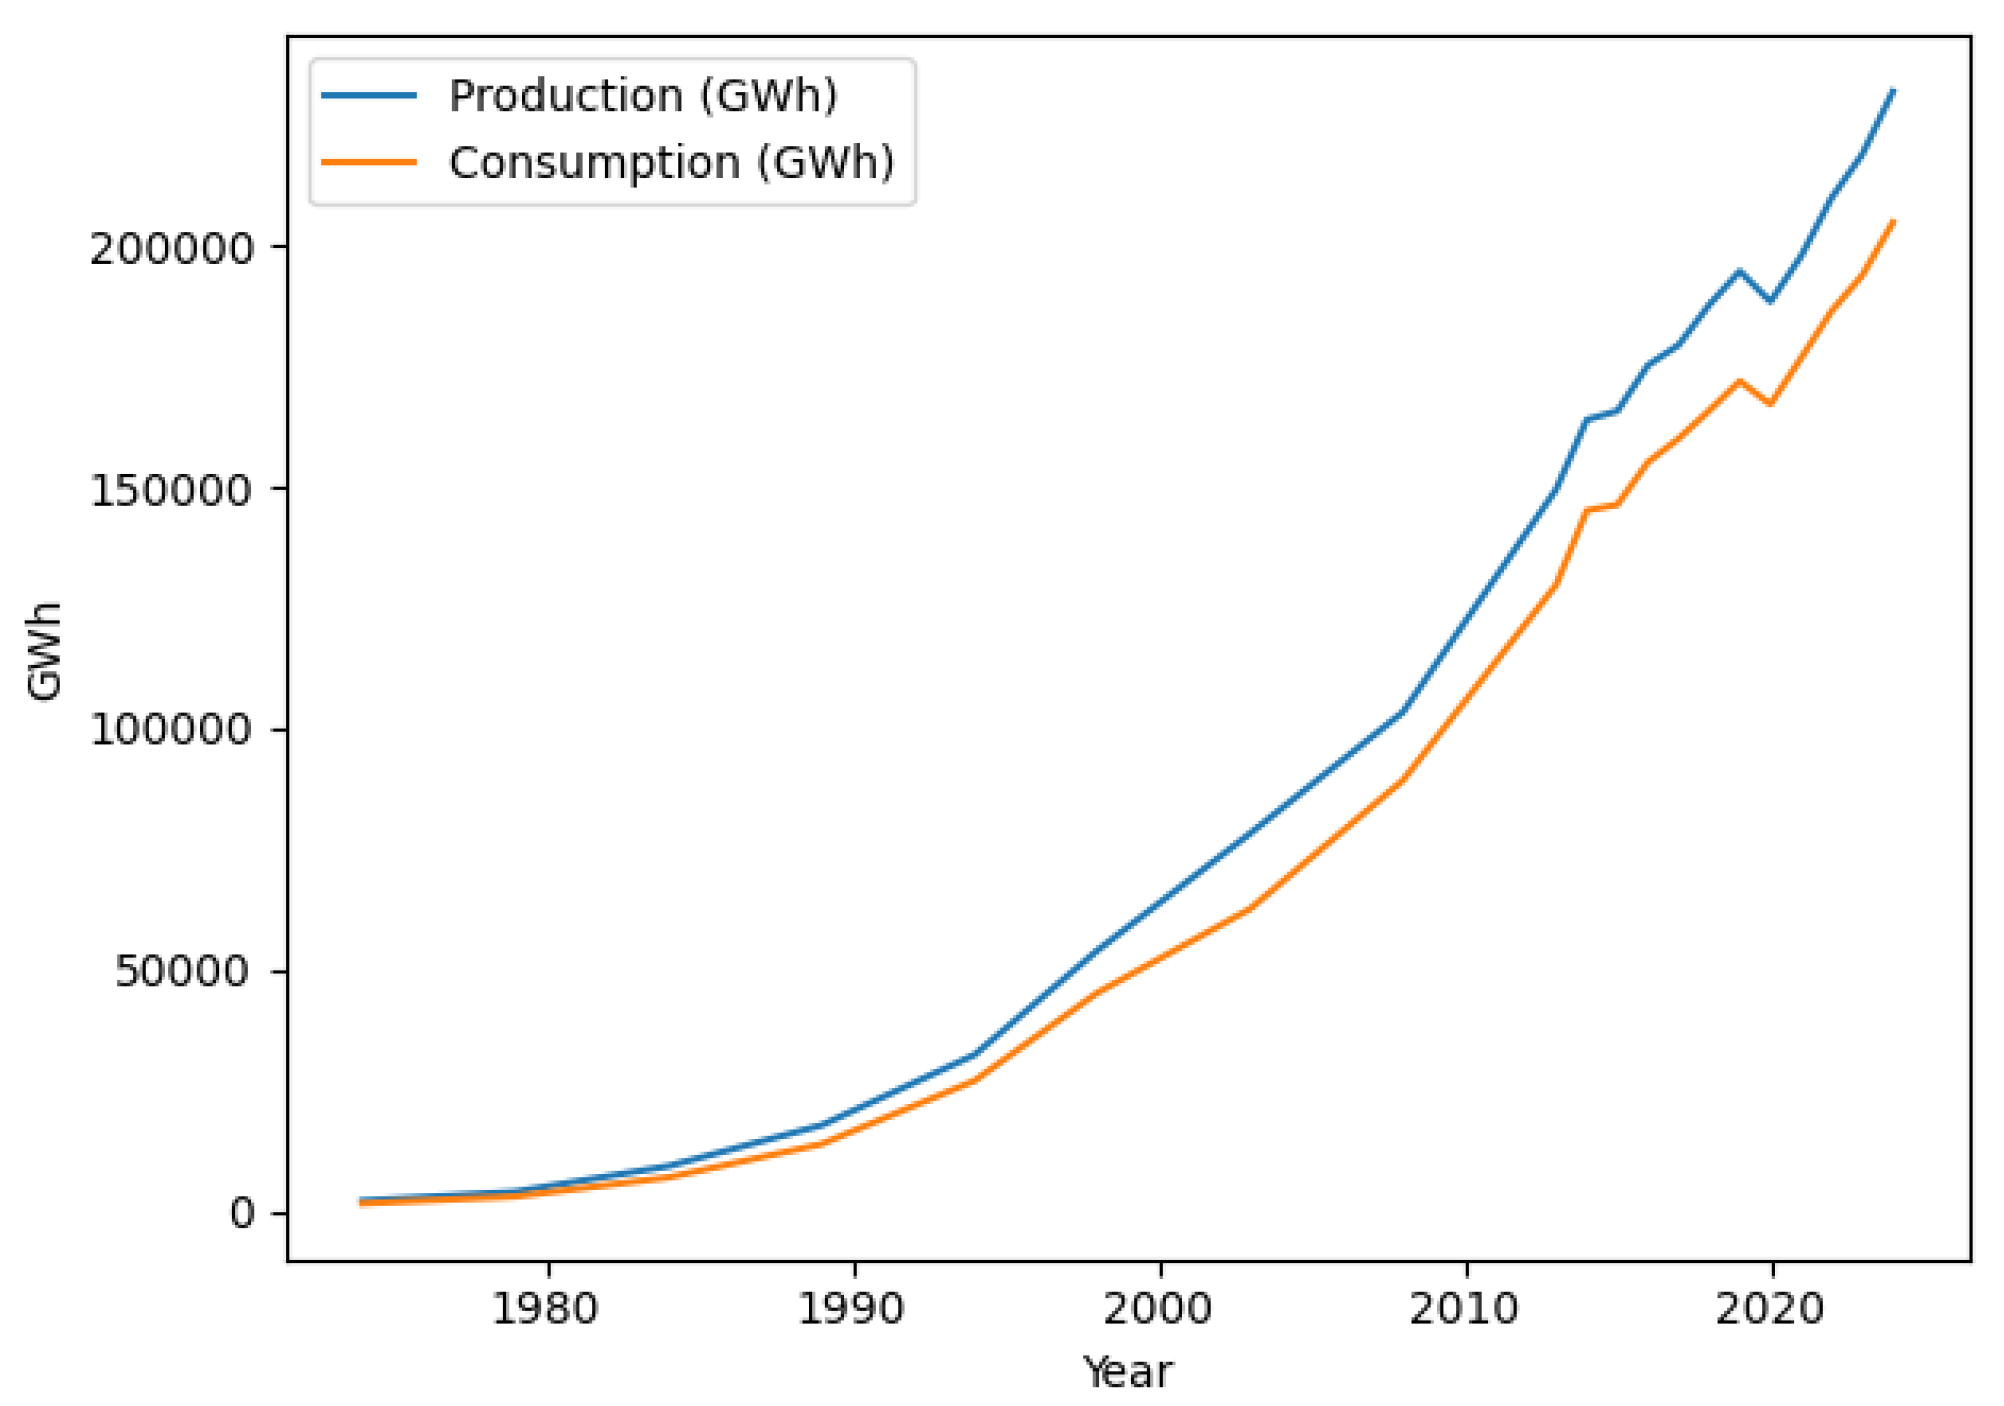
Figure 5.
Population Share per Province in Jamai (Year 2024)
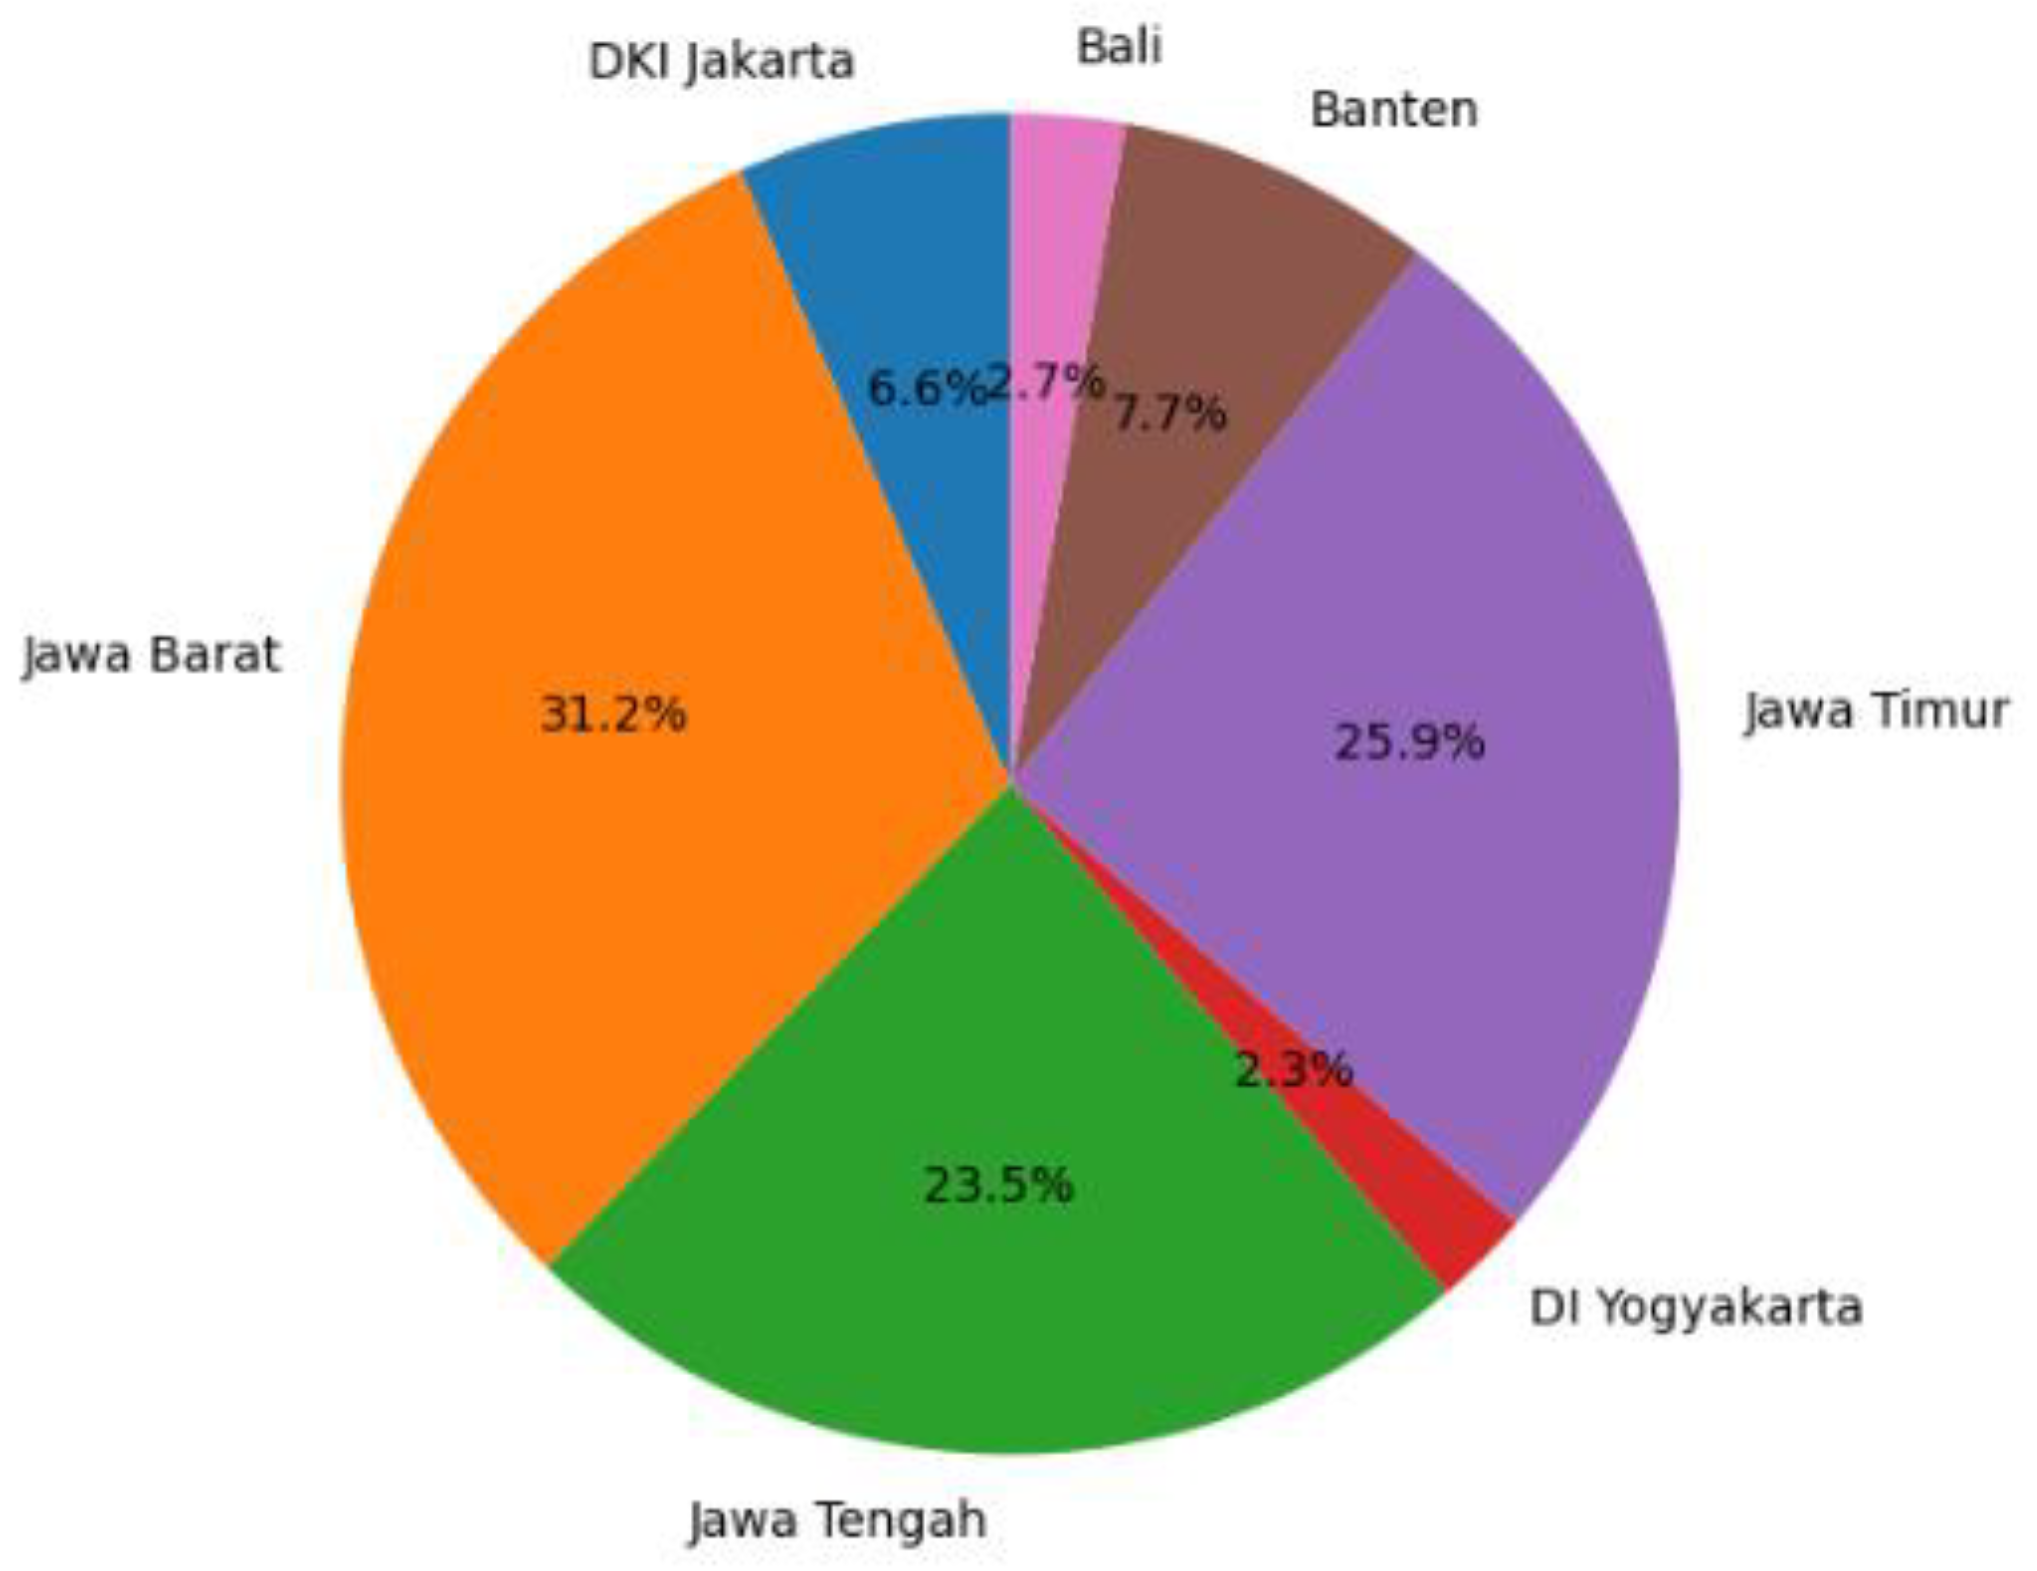
Figure 6.
Jamali Capacity and Peak Load
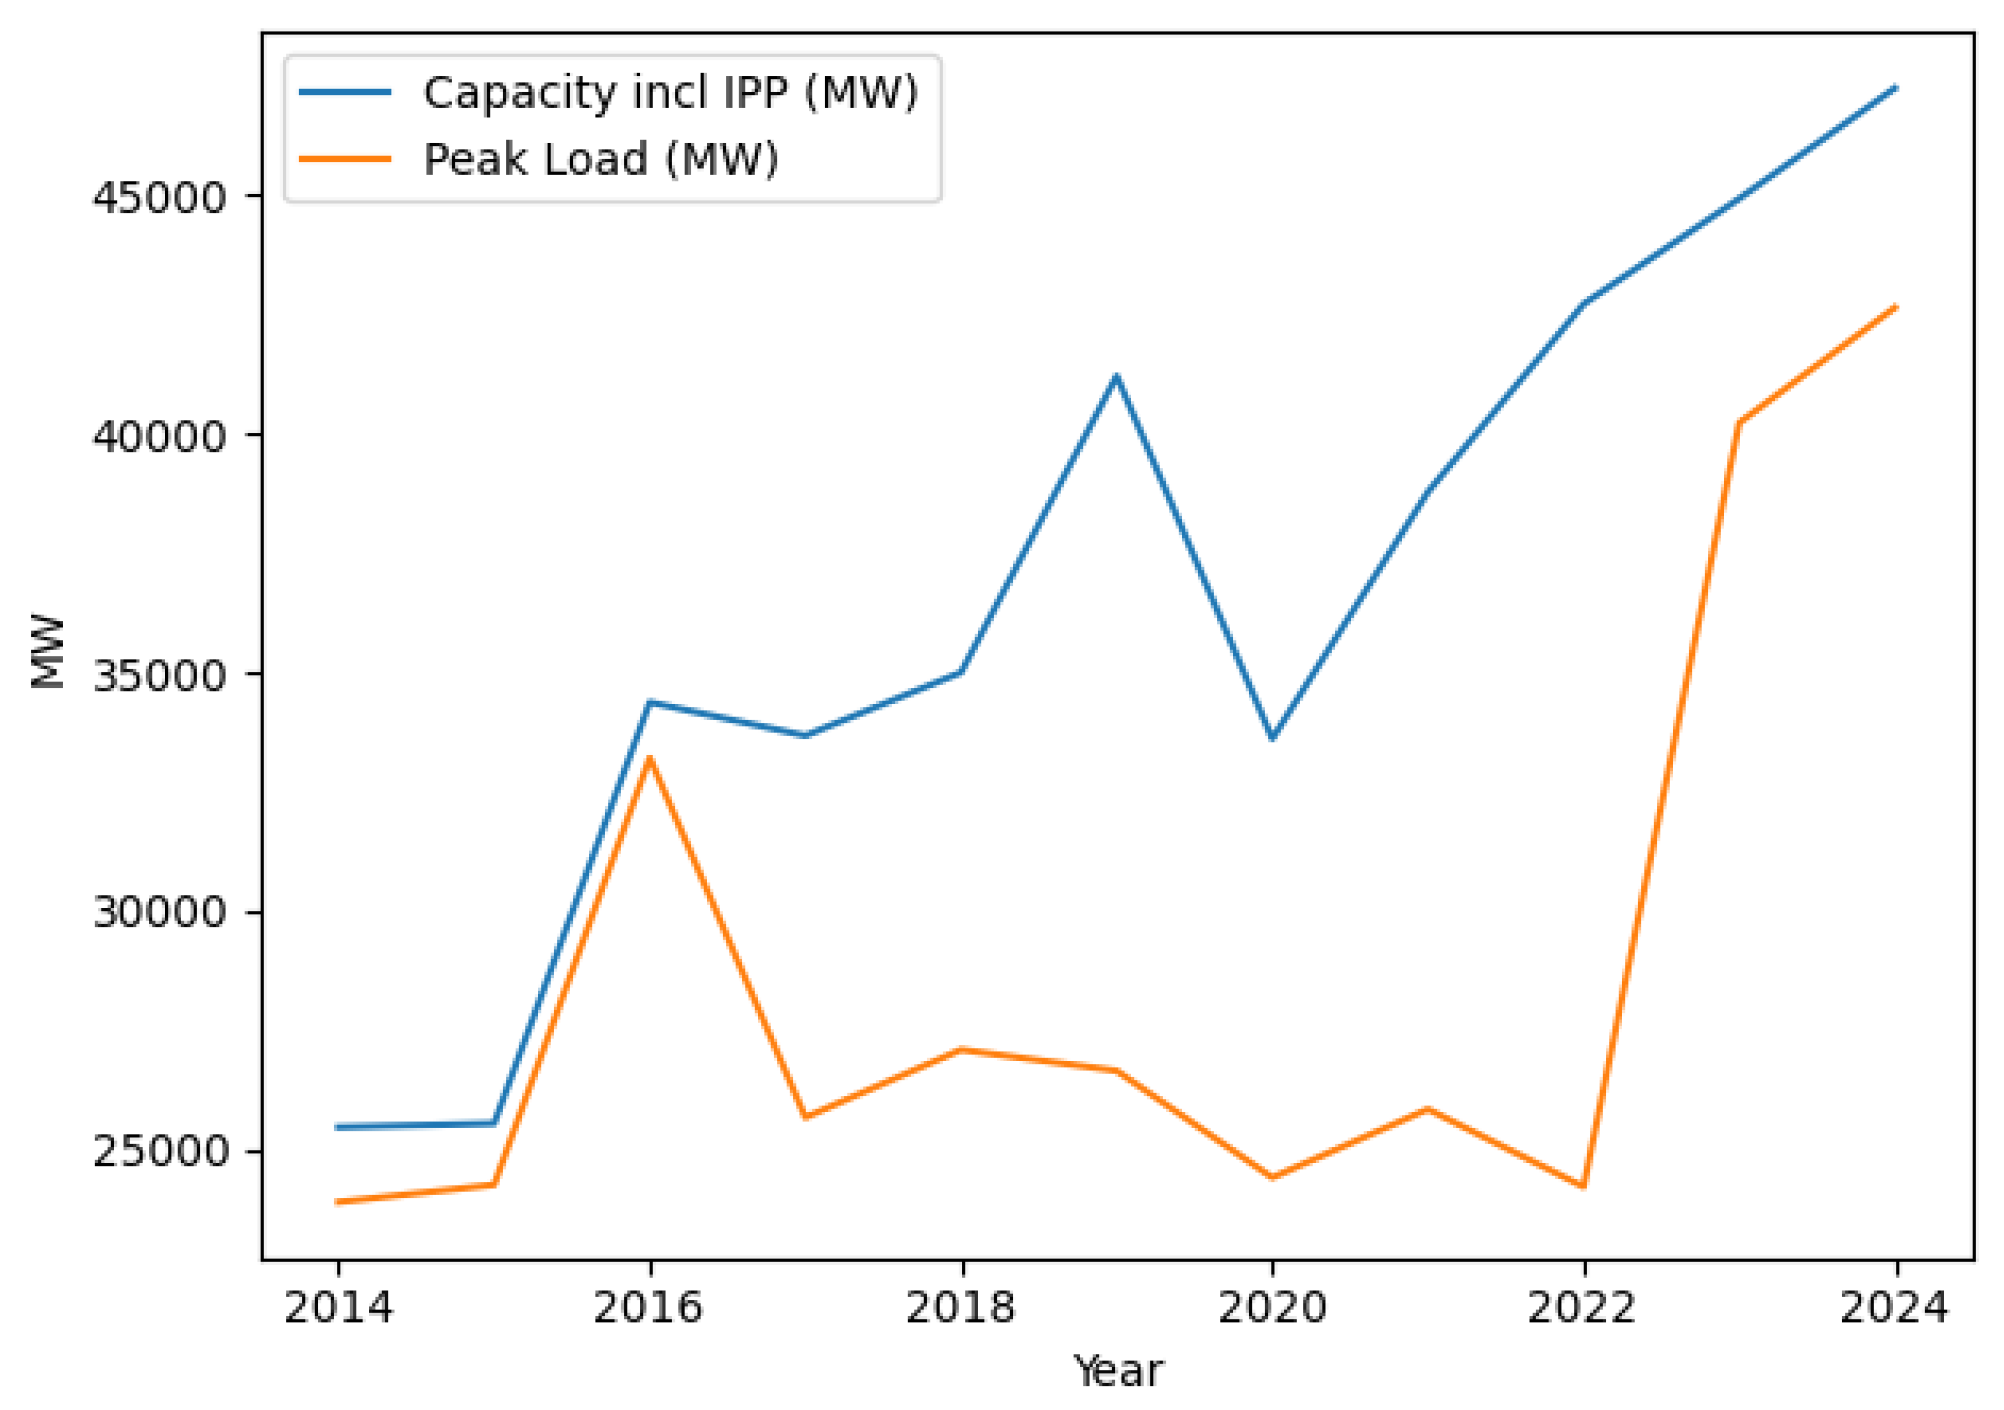
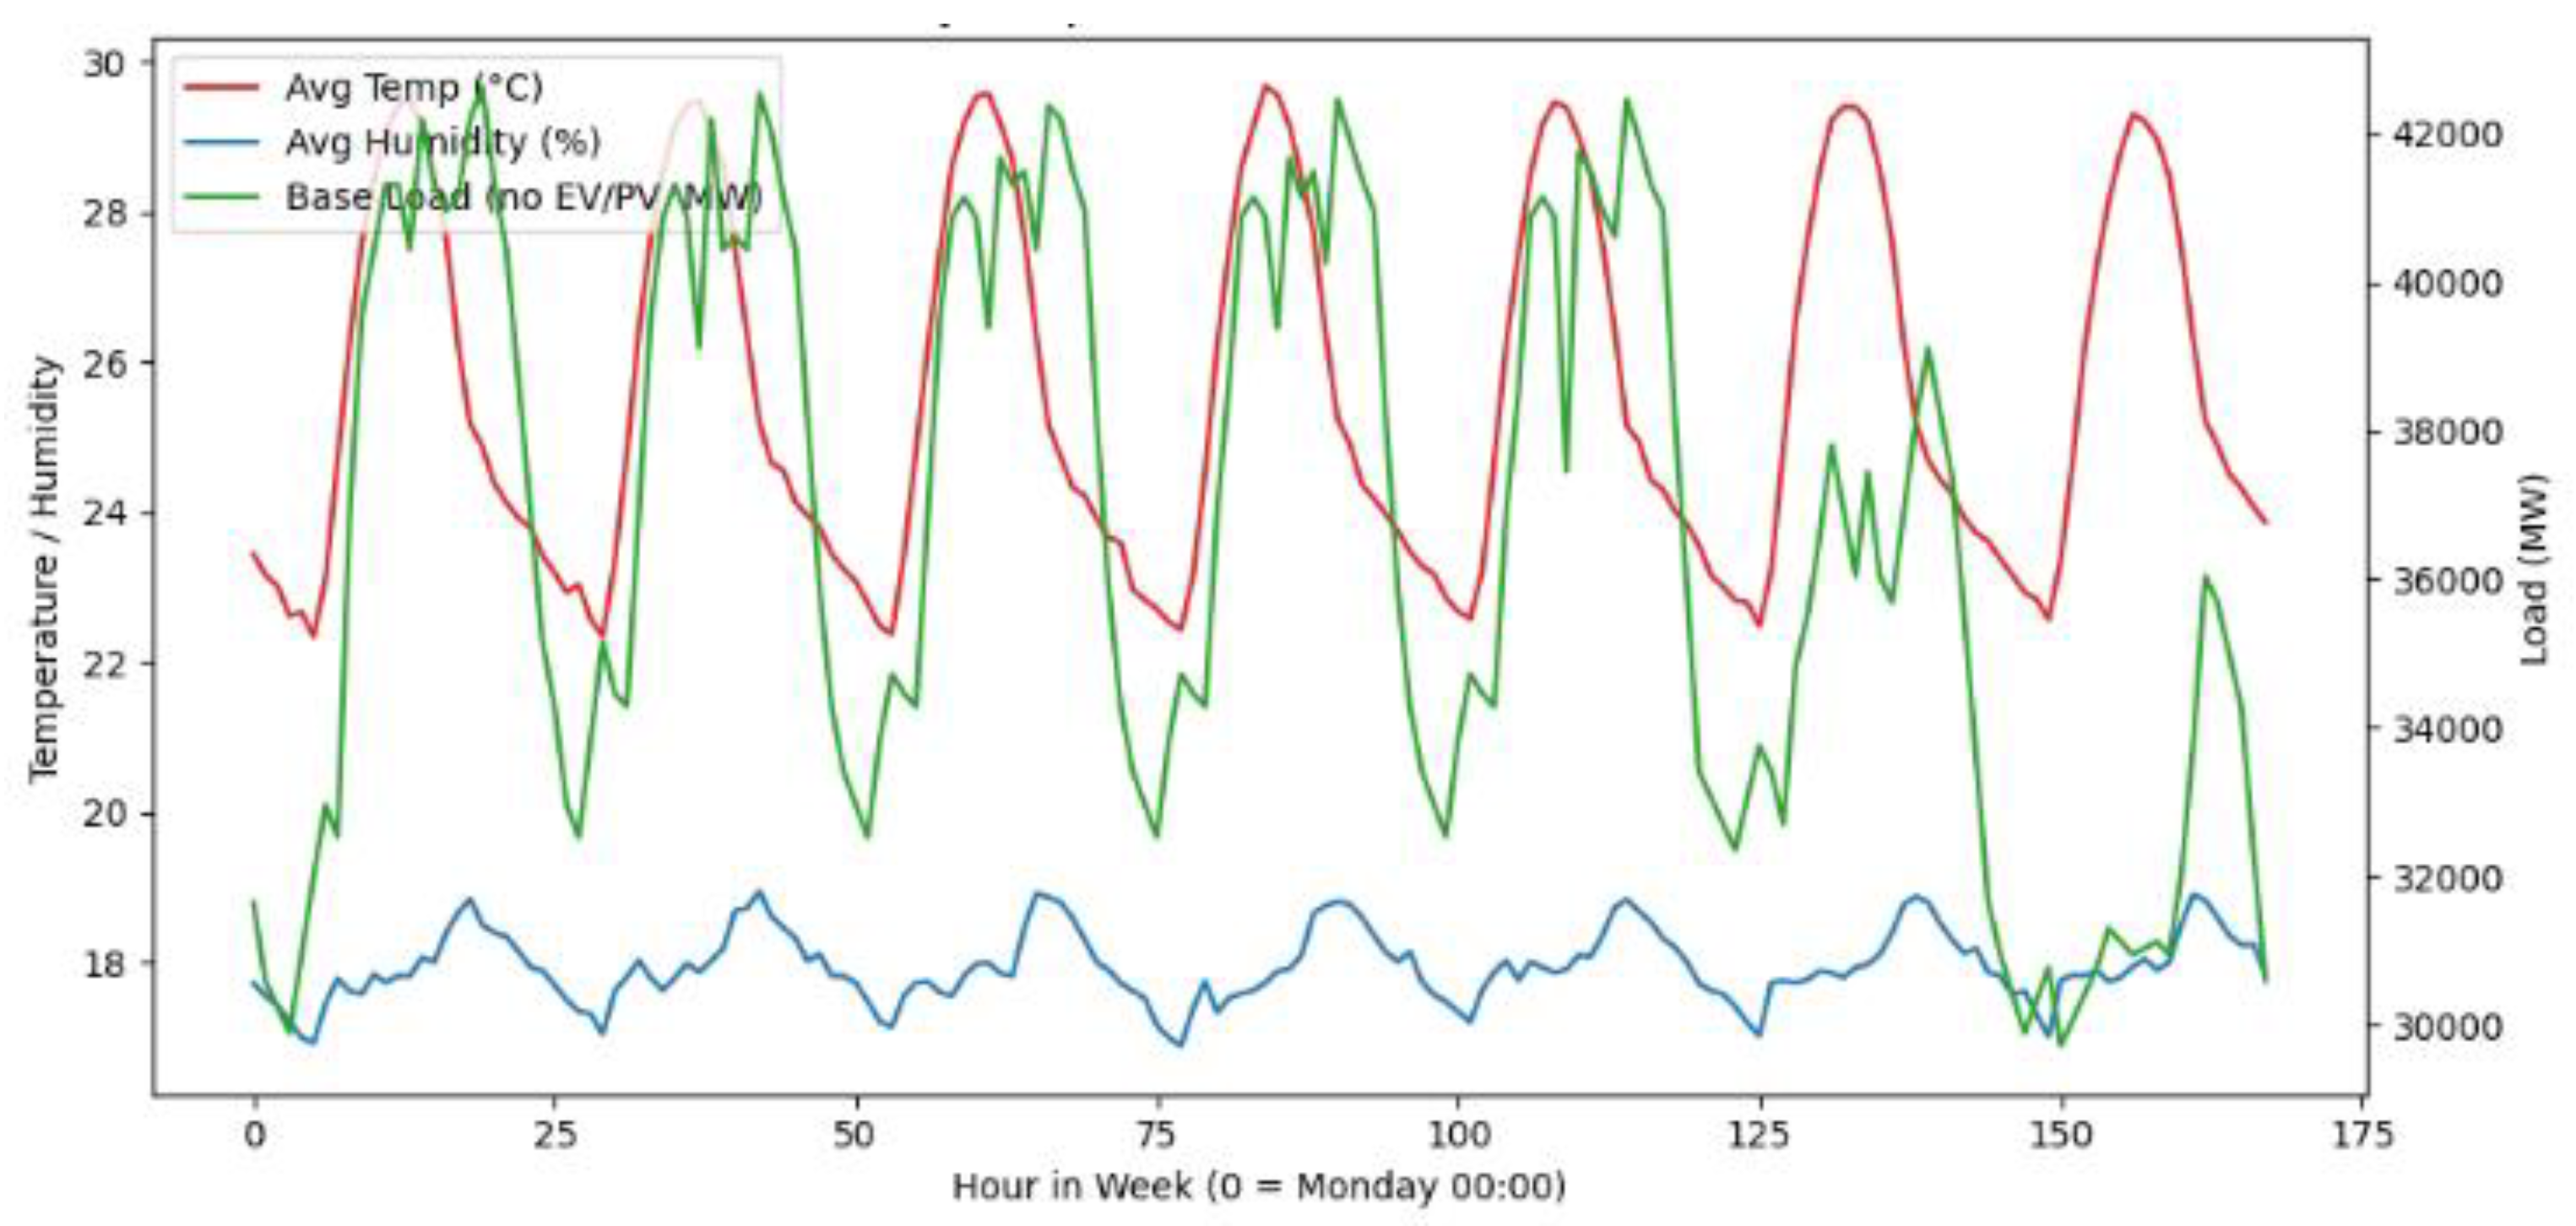
Figure 8.
EV Charging Load Simulation’s Flowchart
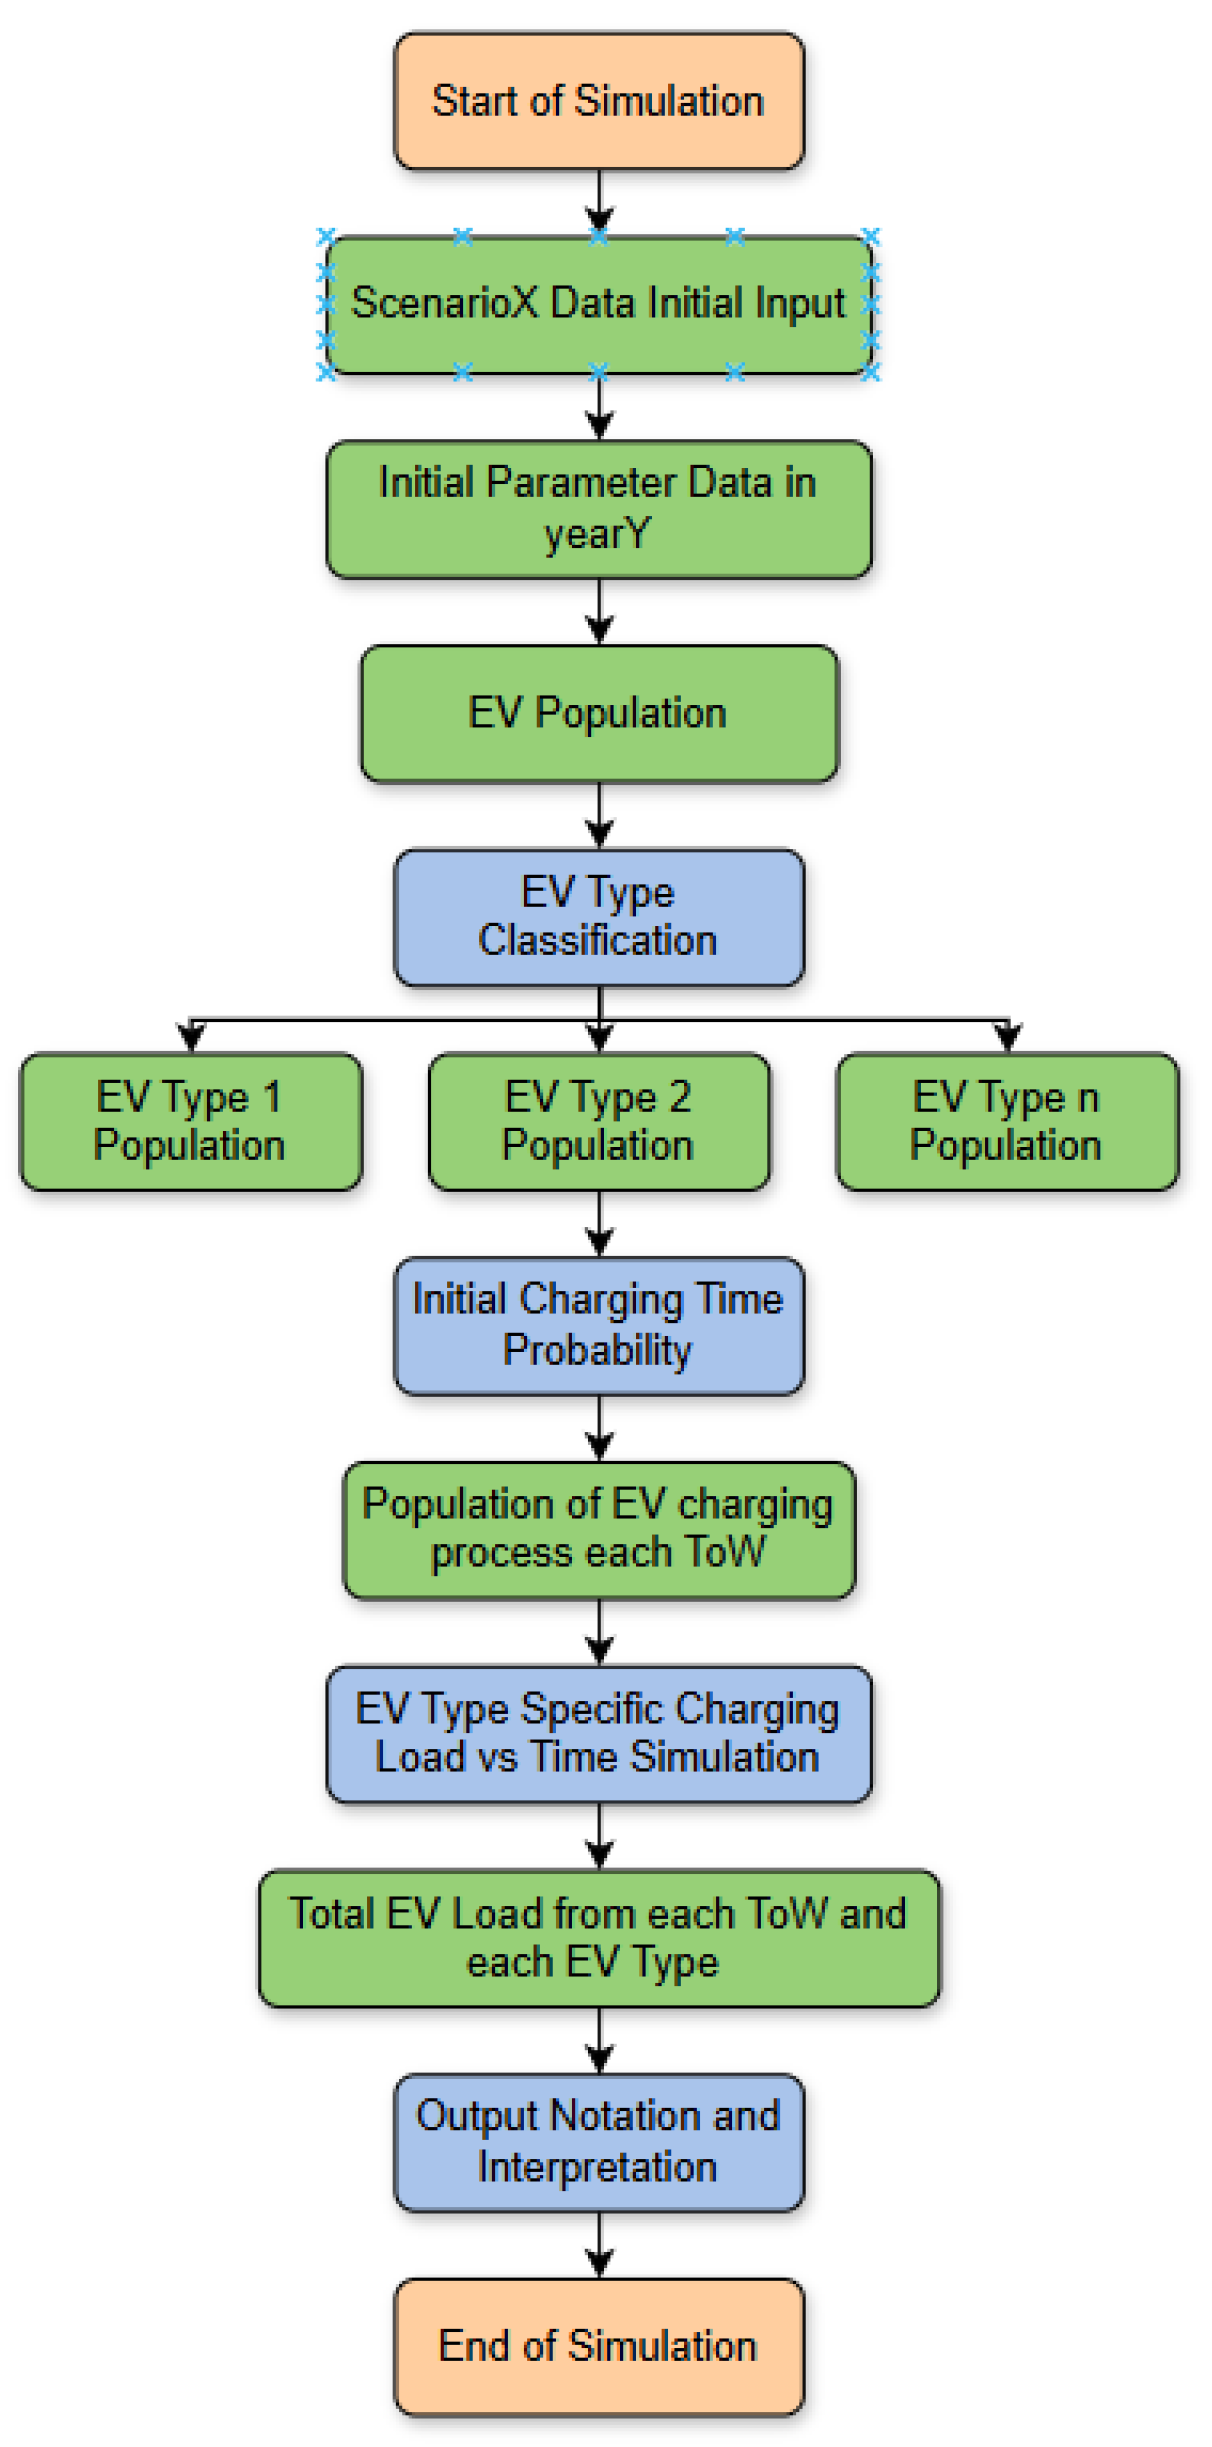
Figure 9.
Historical EV Population (2W and 4W) [57]
Figure 9.
Historical EV Population (2W and 4W) [57]
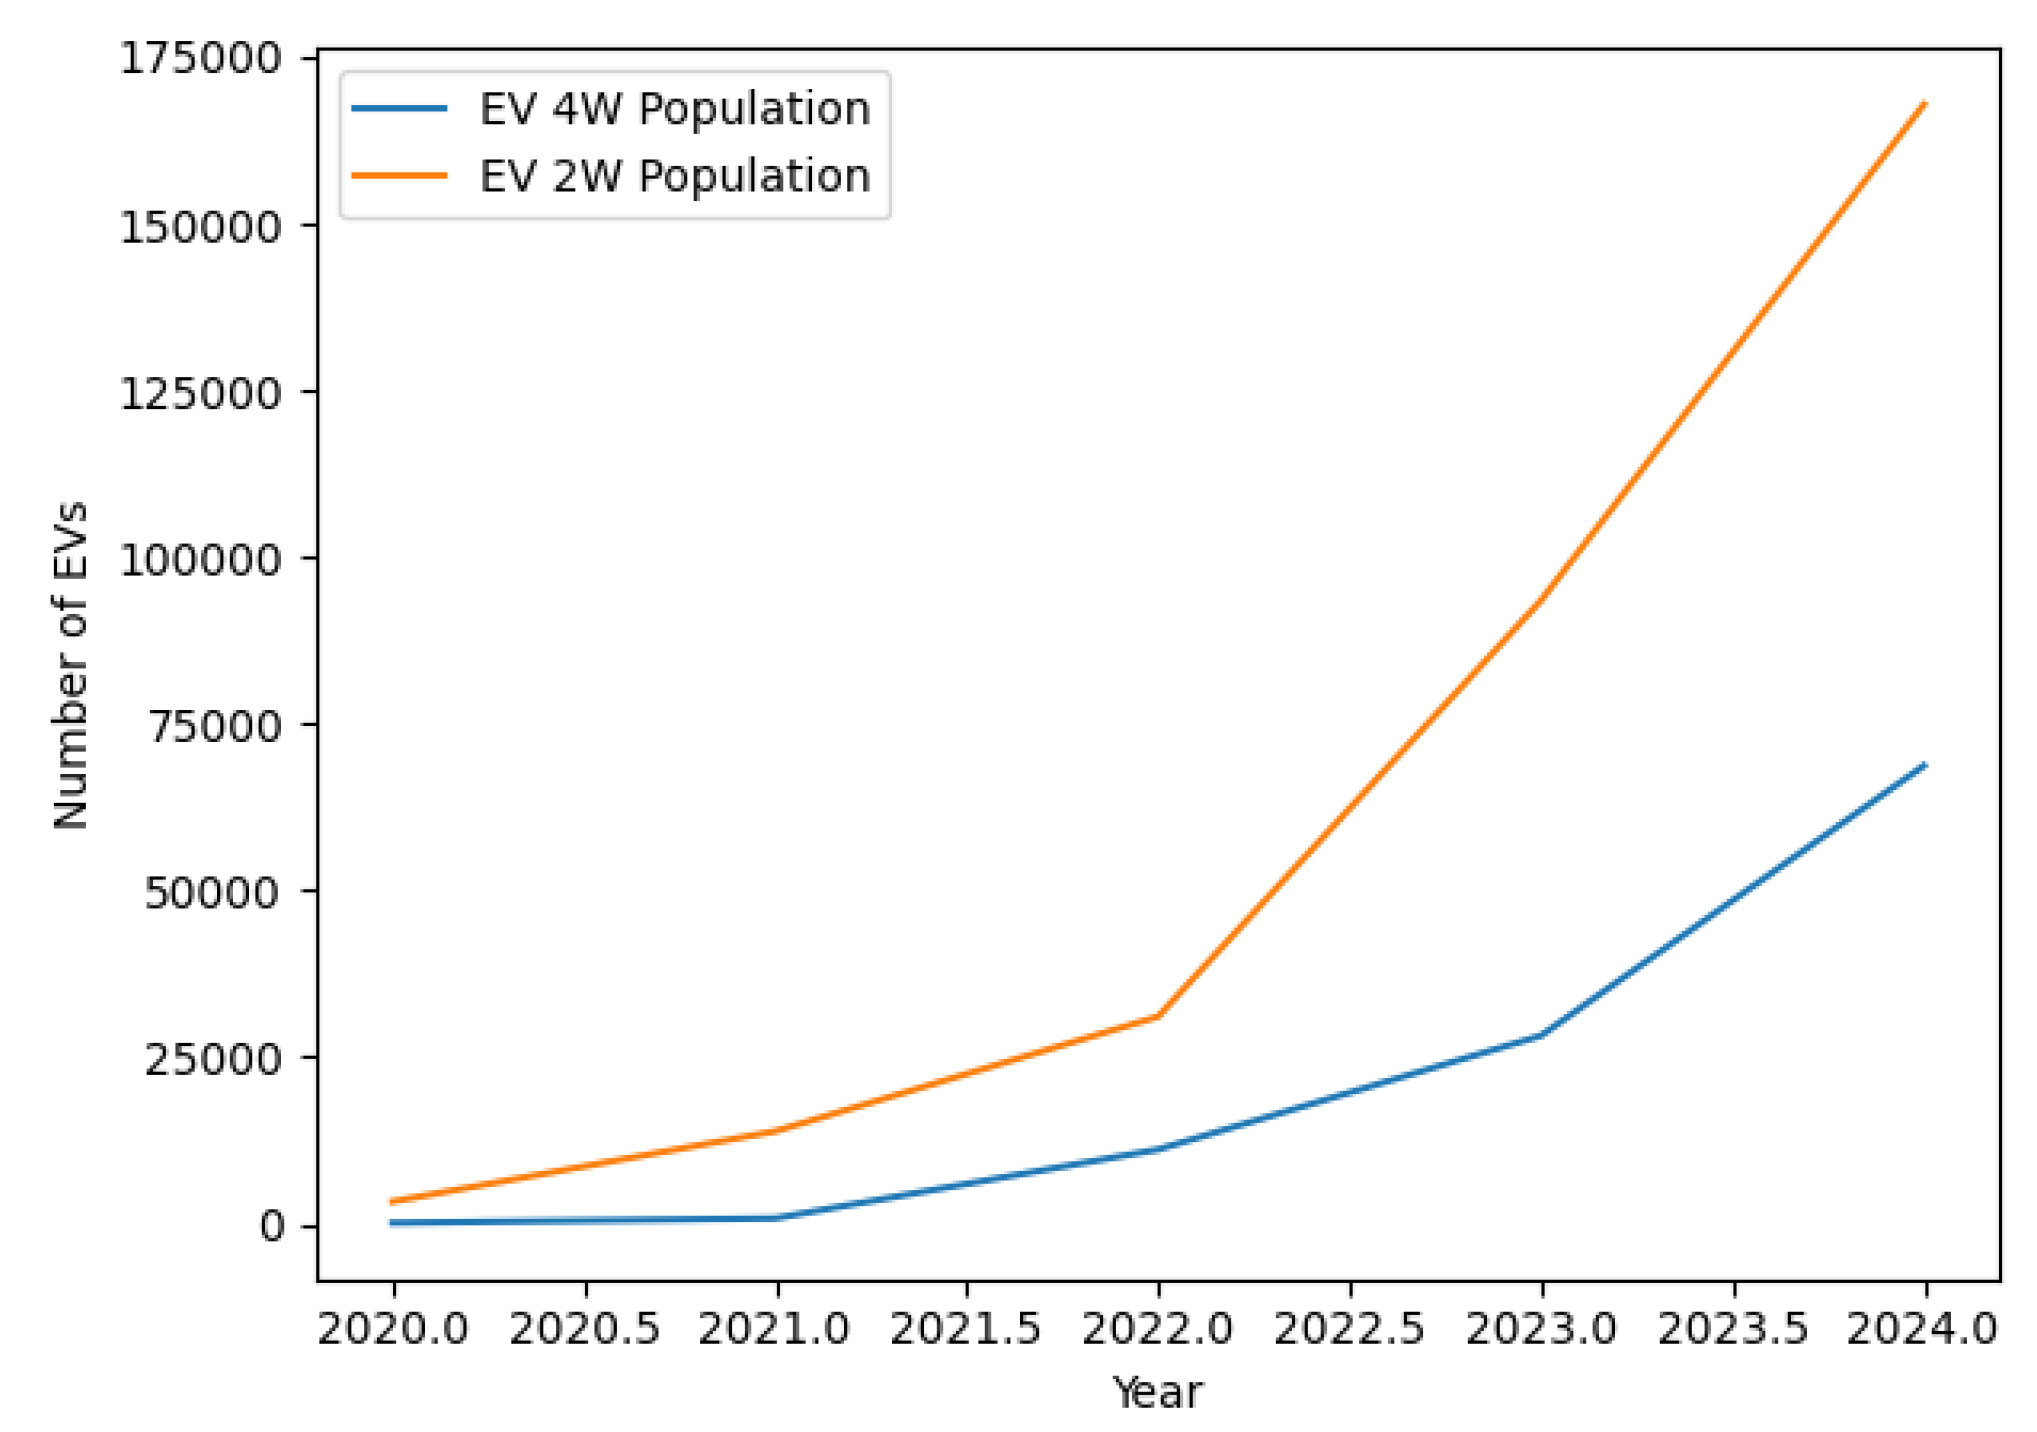
Figure 10.
EV AC and DC Charging Load Curves vs Time
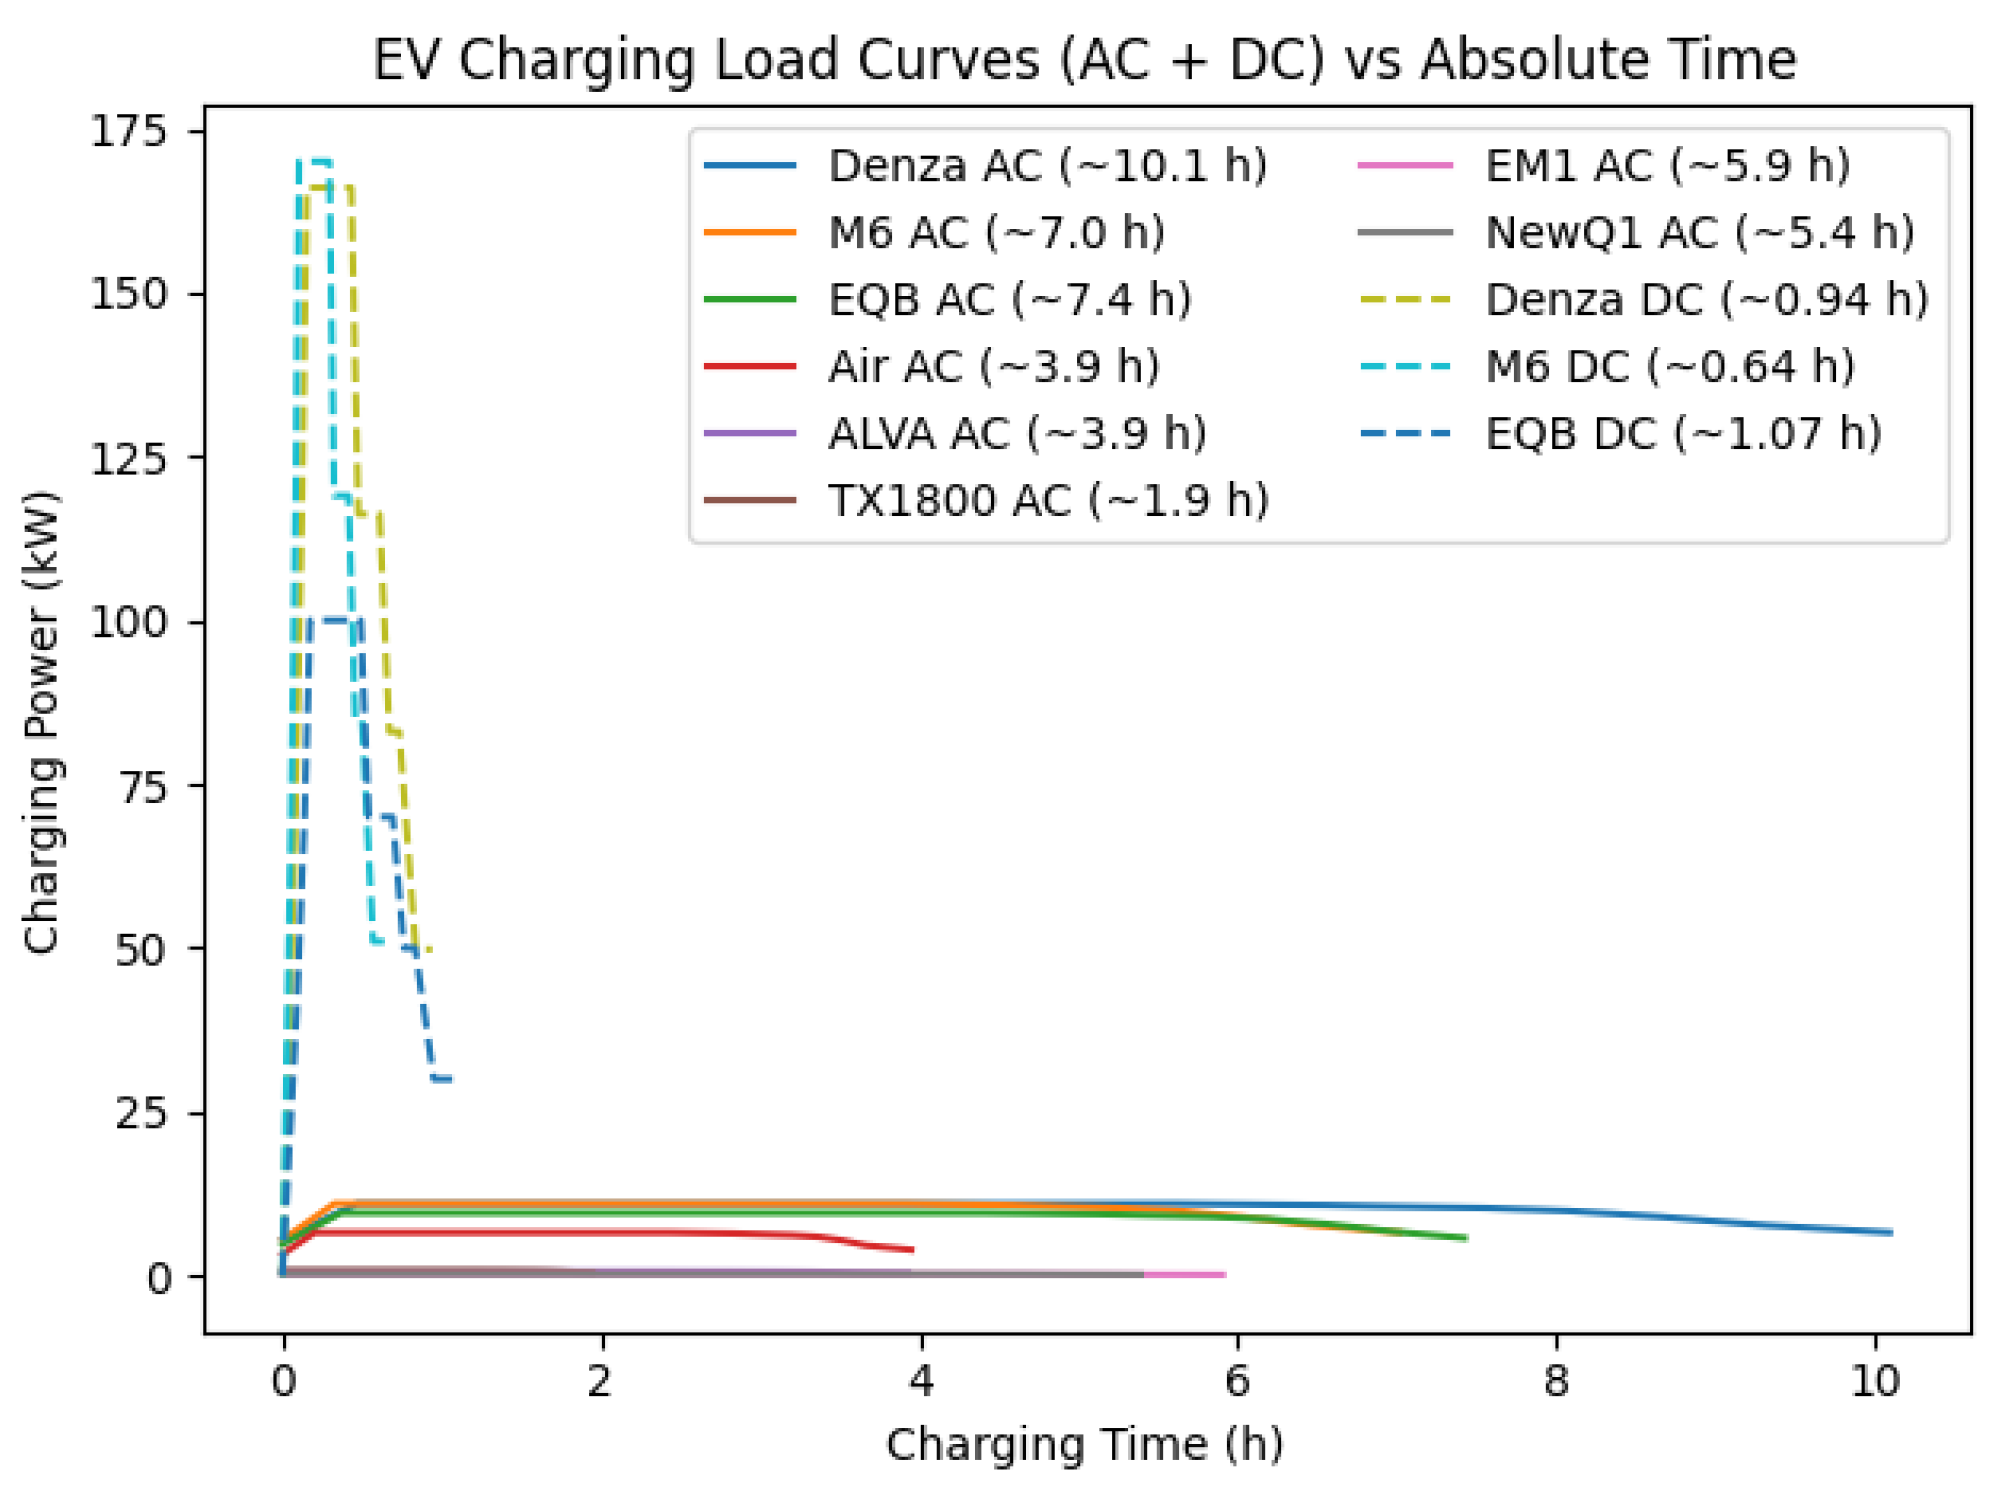
Figure 12.
PV Rooftop Negative Load Simulation’s Flowchart
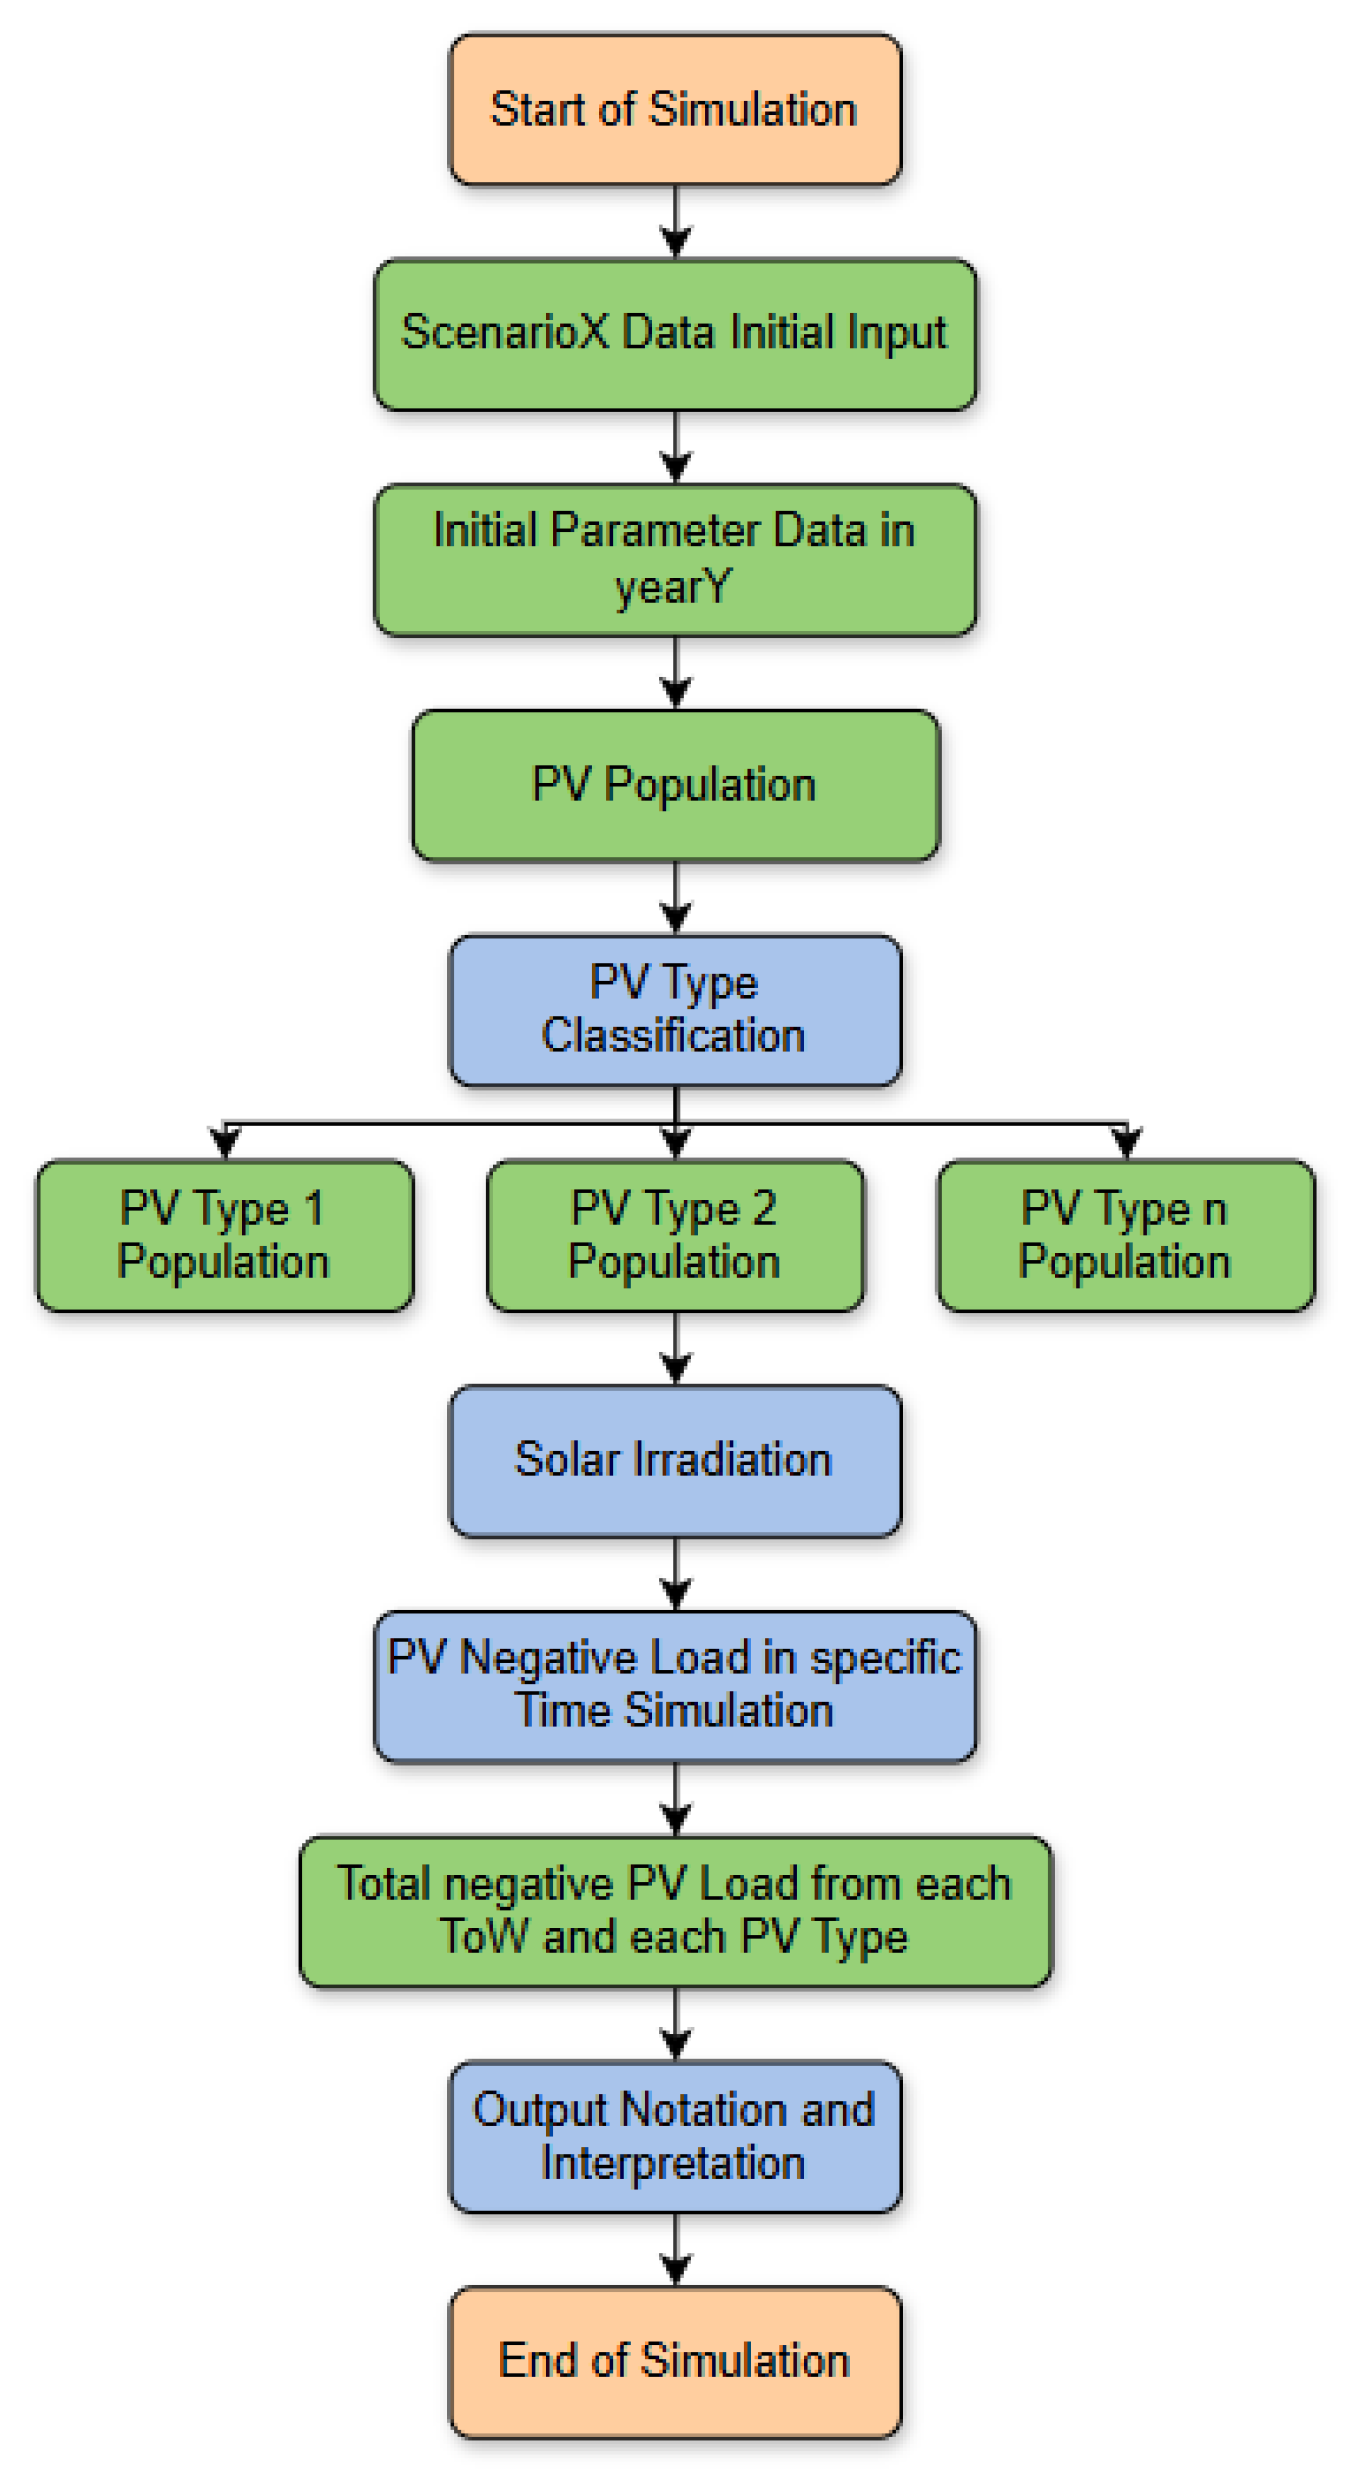
Figure 13.
Historical PV Rooftop Capacity [69]
Figure 13.
Historical PV Rooftop Capacity [69]
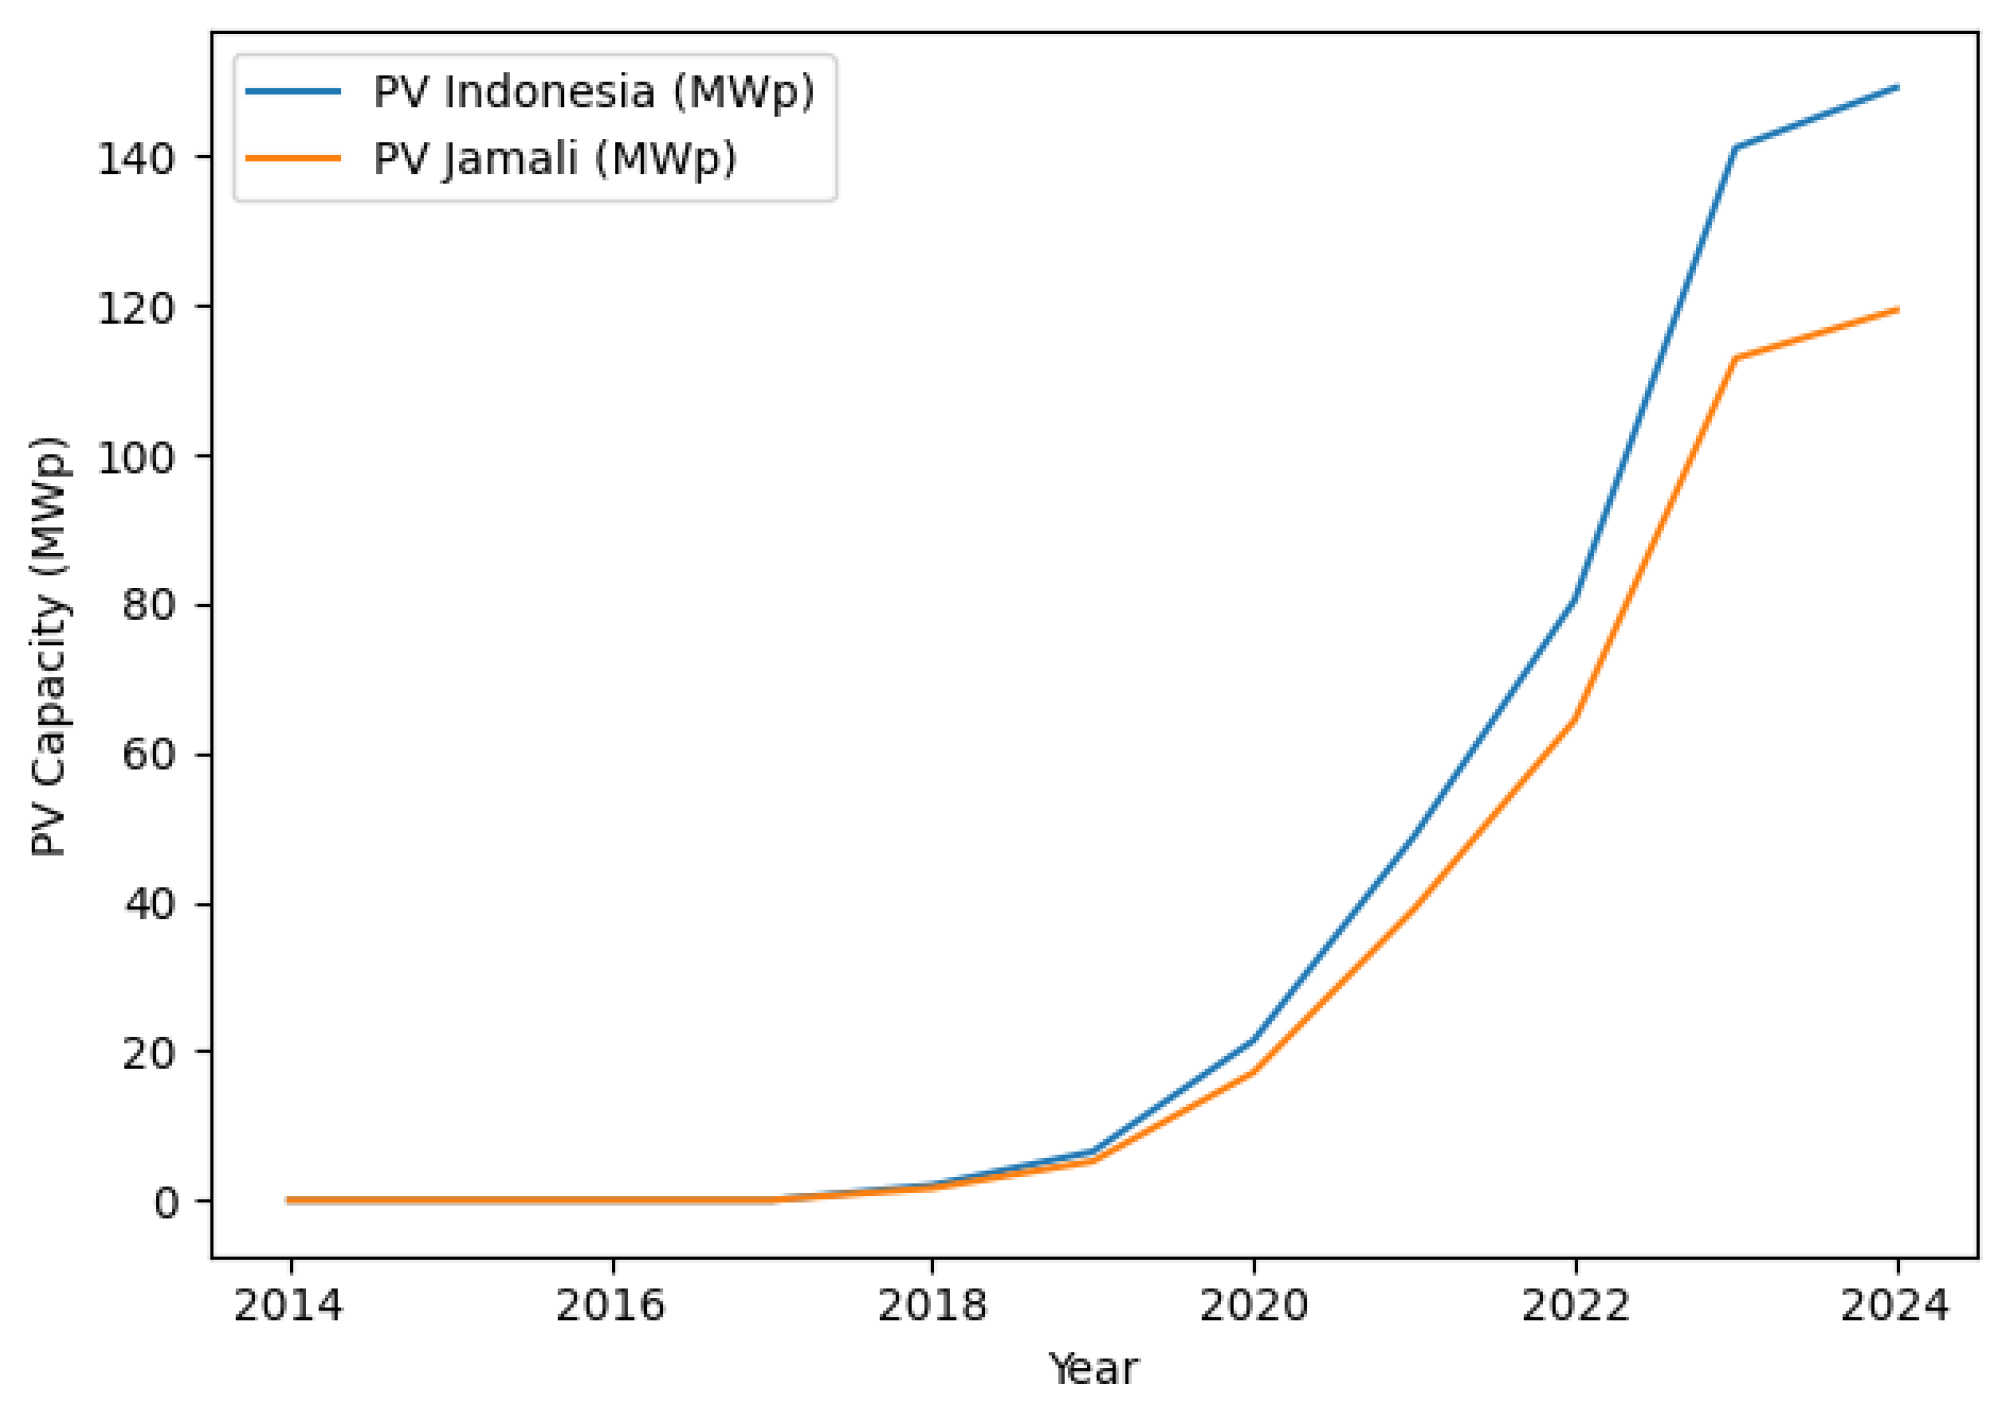
Figure 14.
Irradiance Profile 2024 [74]
Figure 14.
Irradiance Profile 2024 [74]
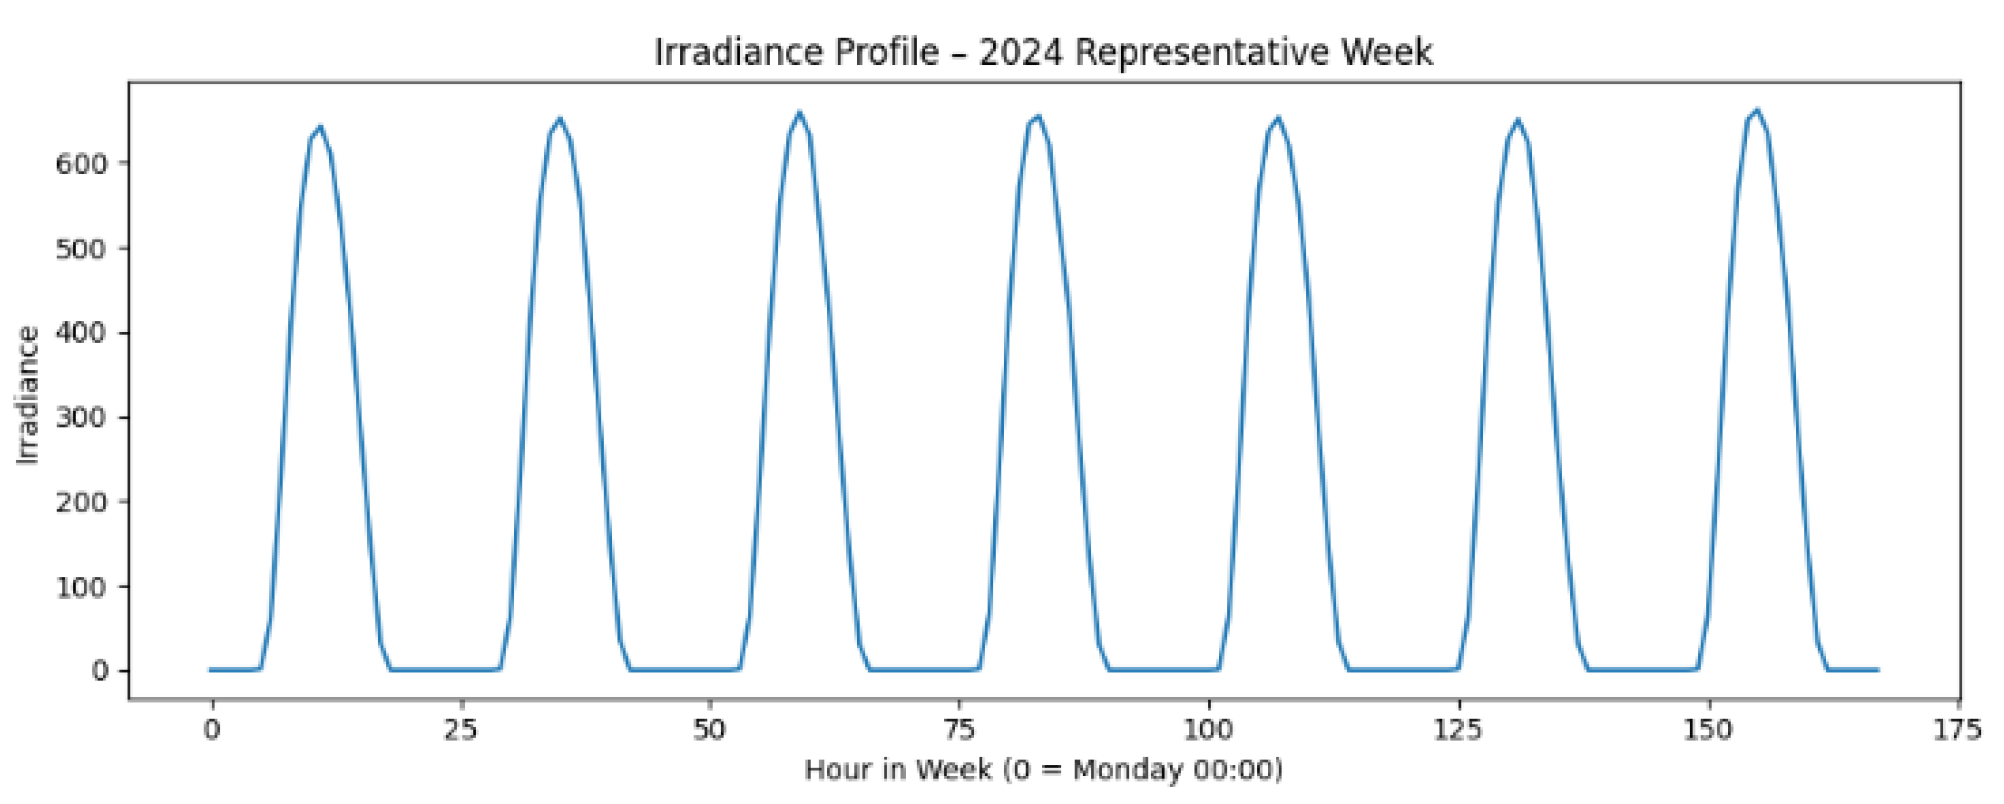
Figure 15.
Weekly Supply/Demand and Yearly Production/Consumption Simulation’s Flowchart
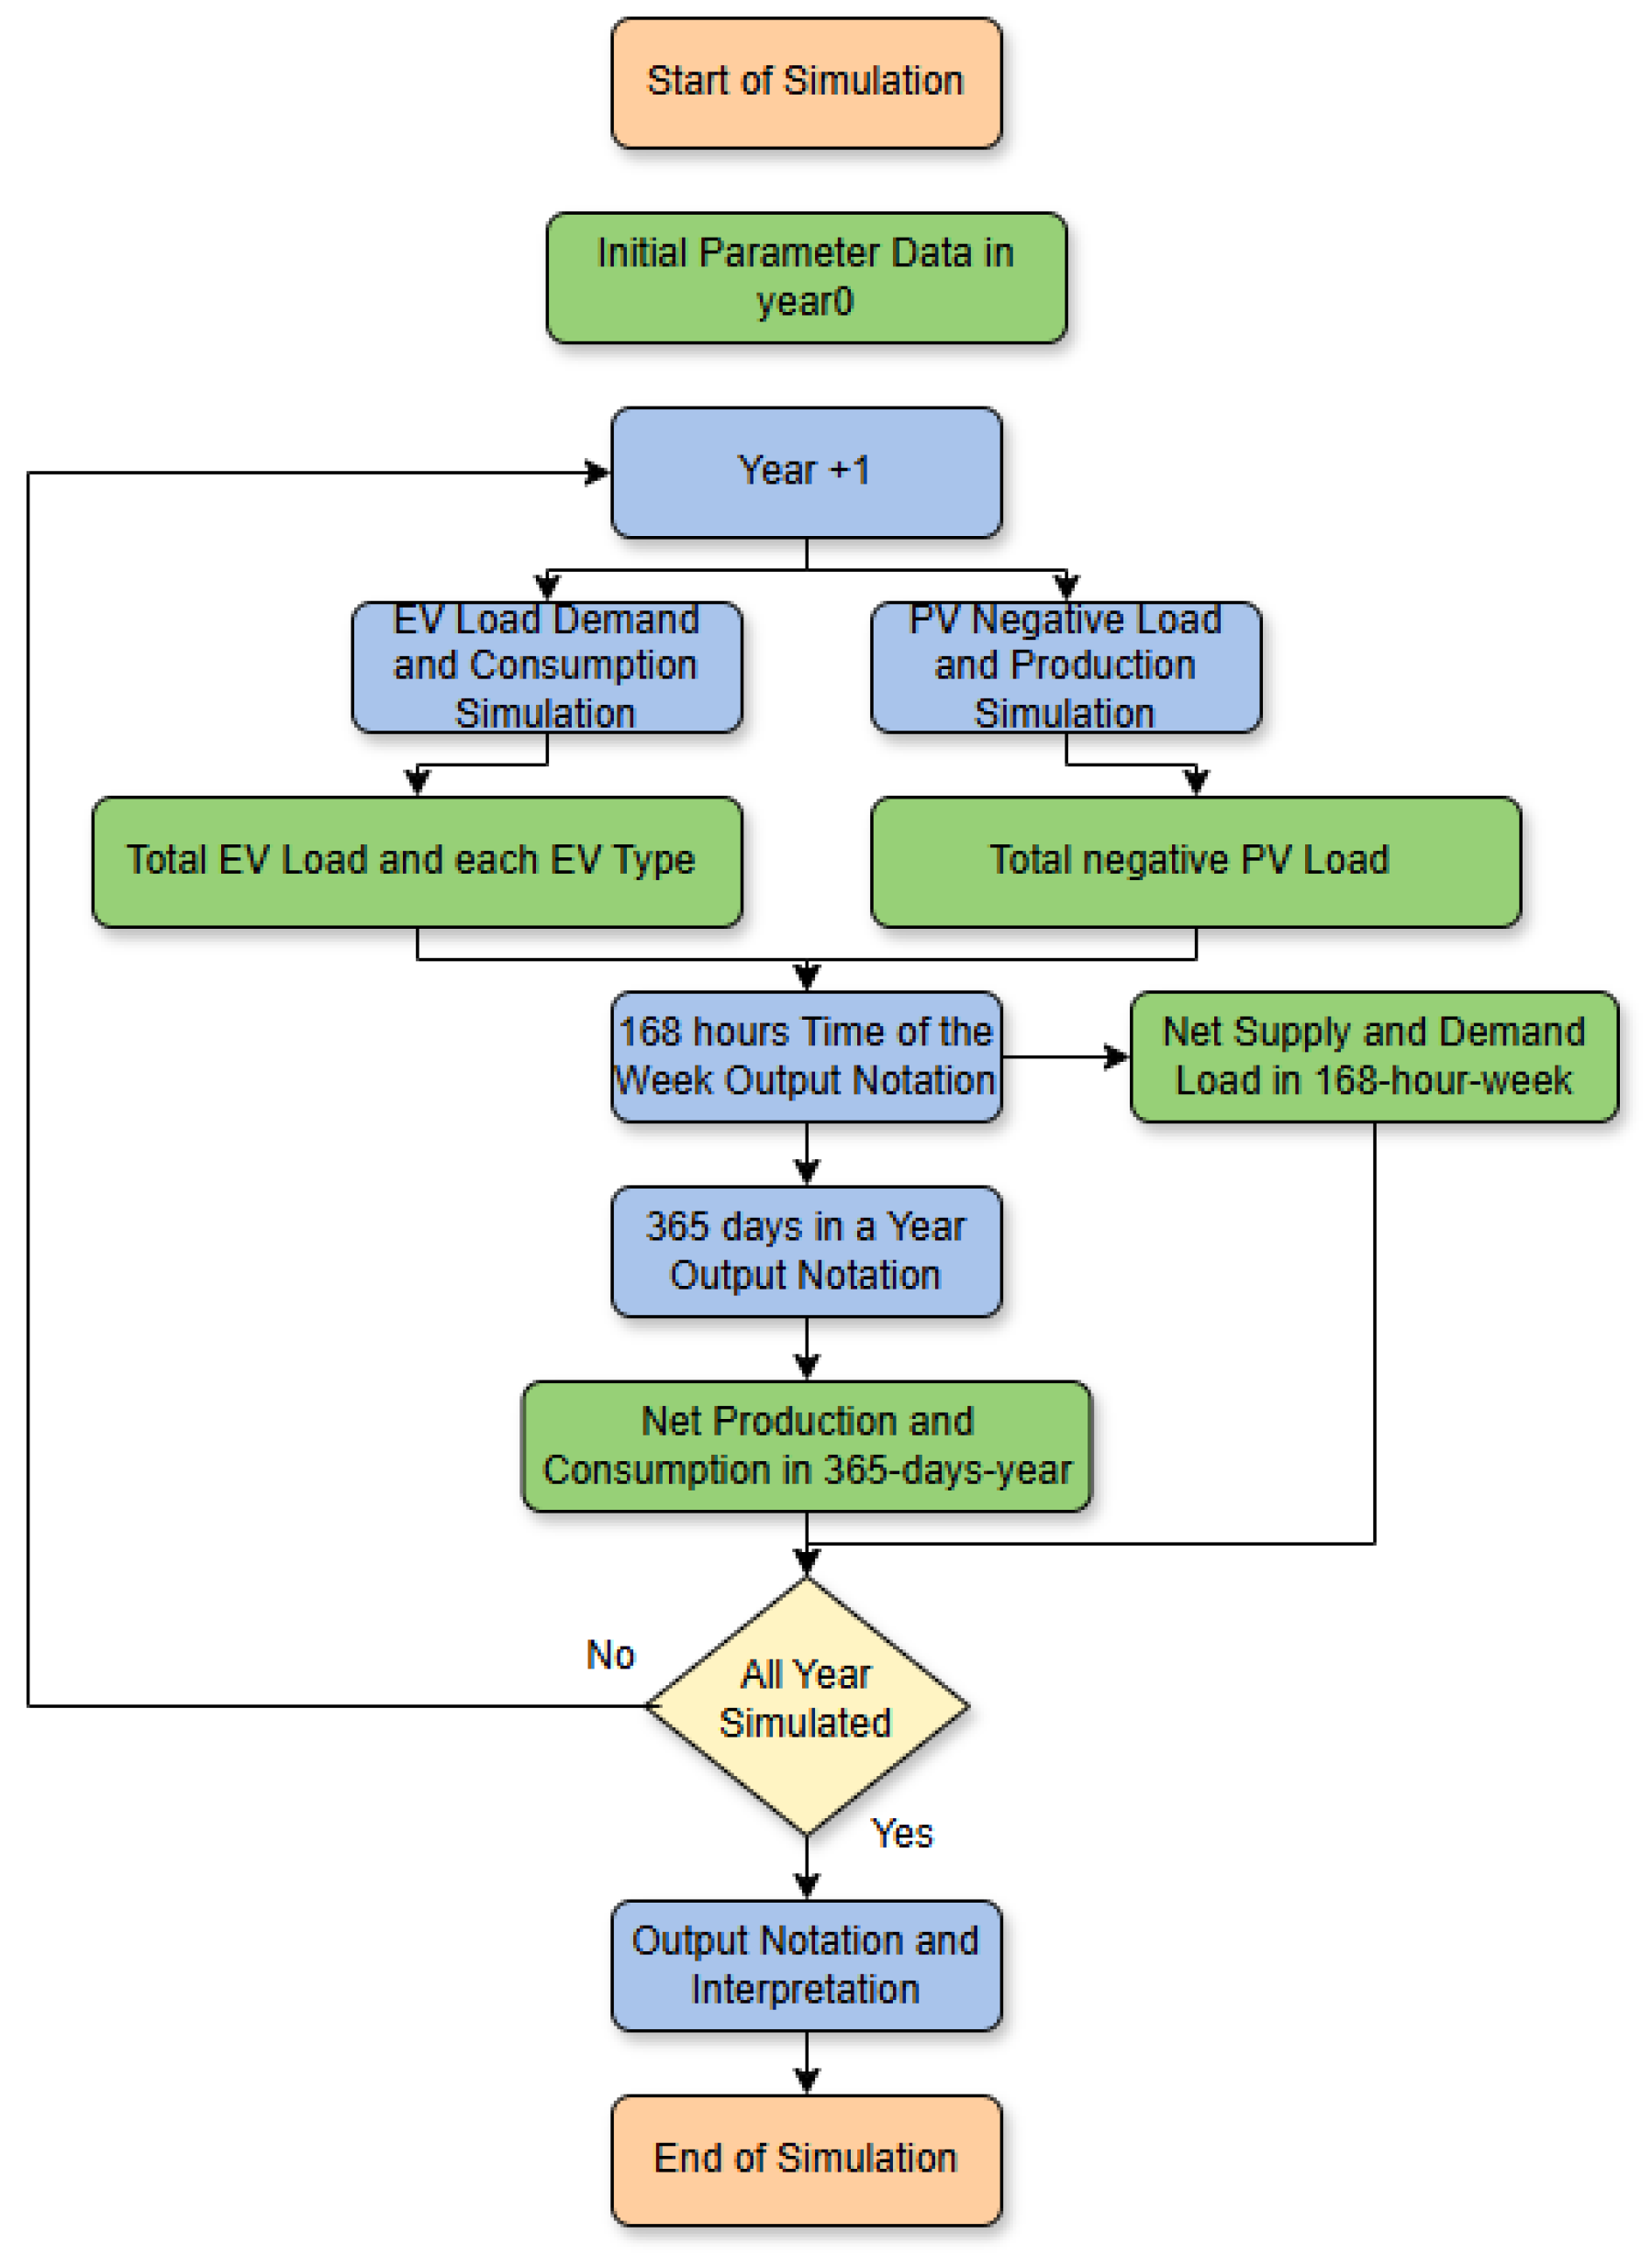
Figure 16.
4W Population Model across Scenarios
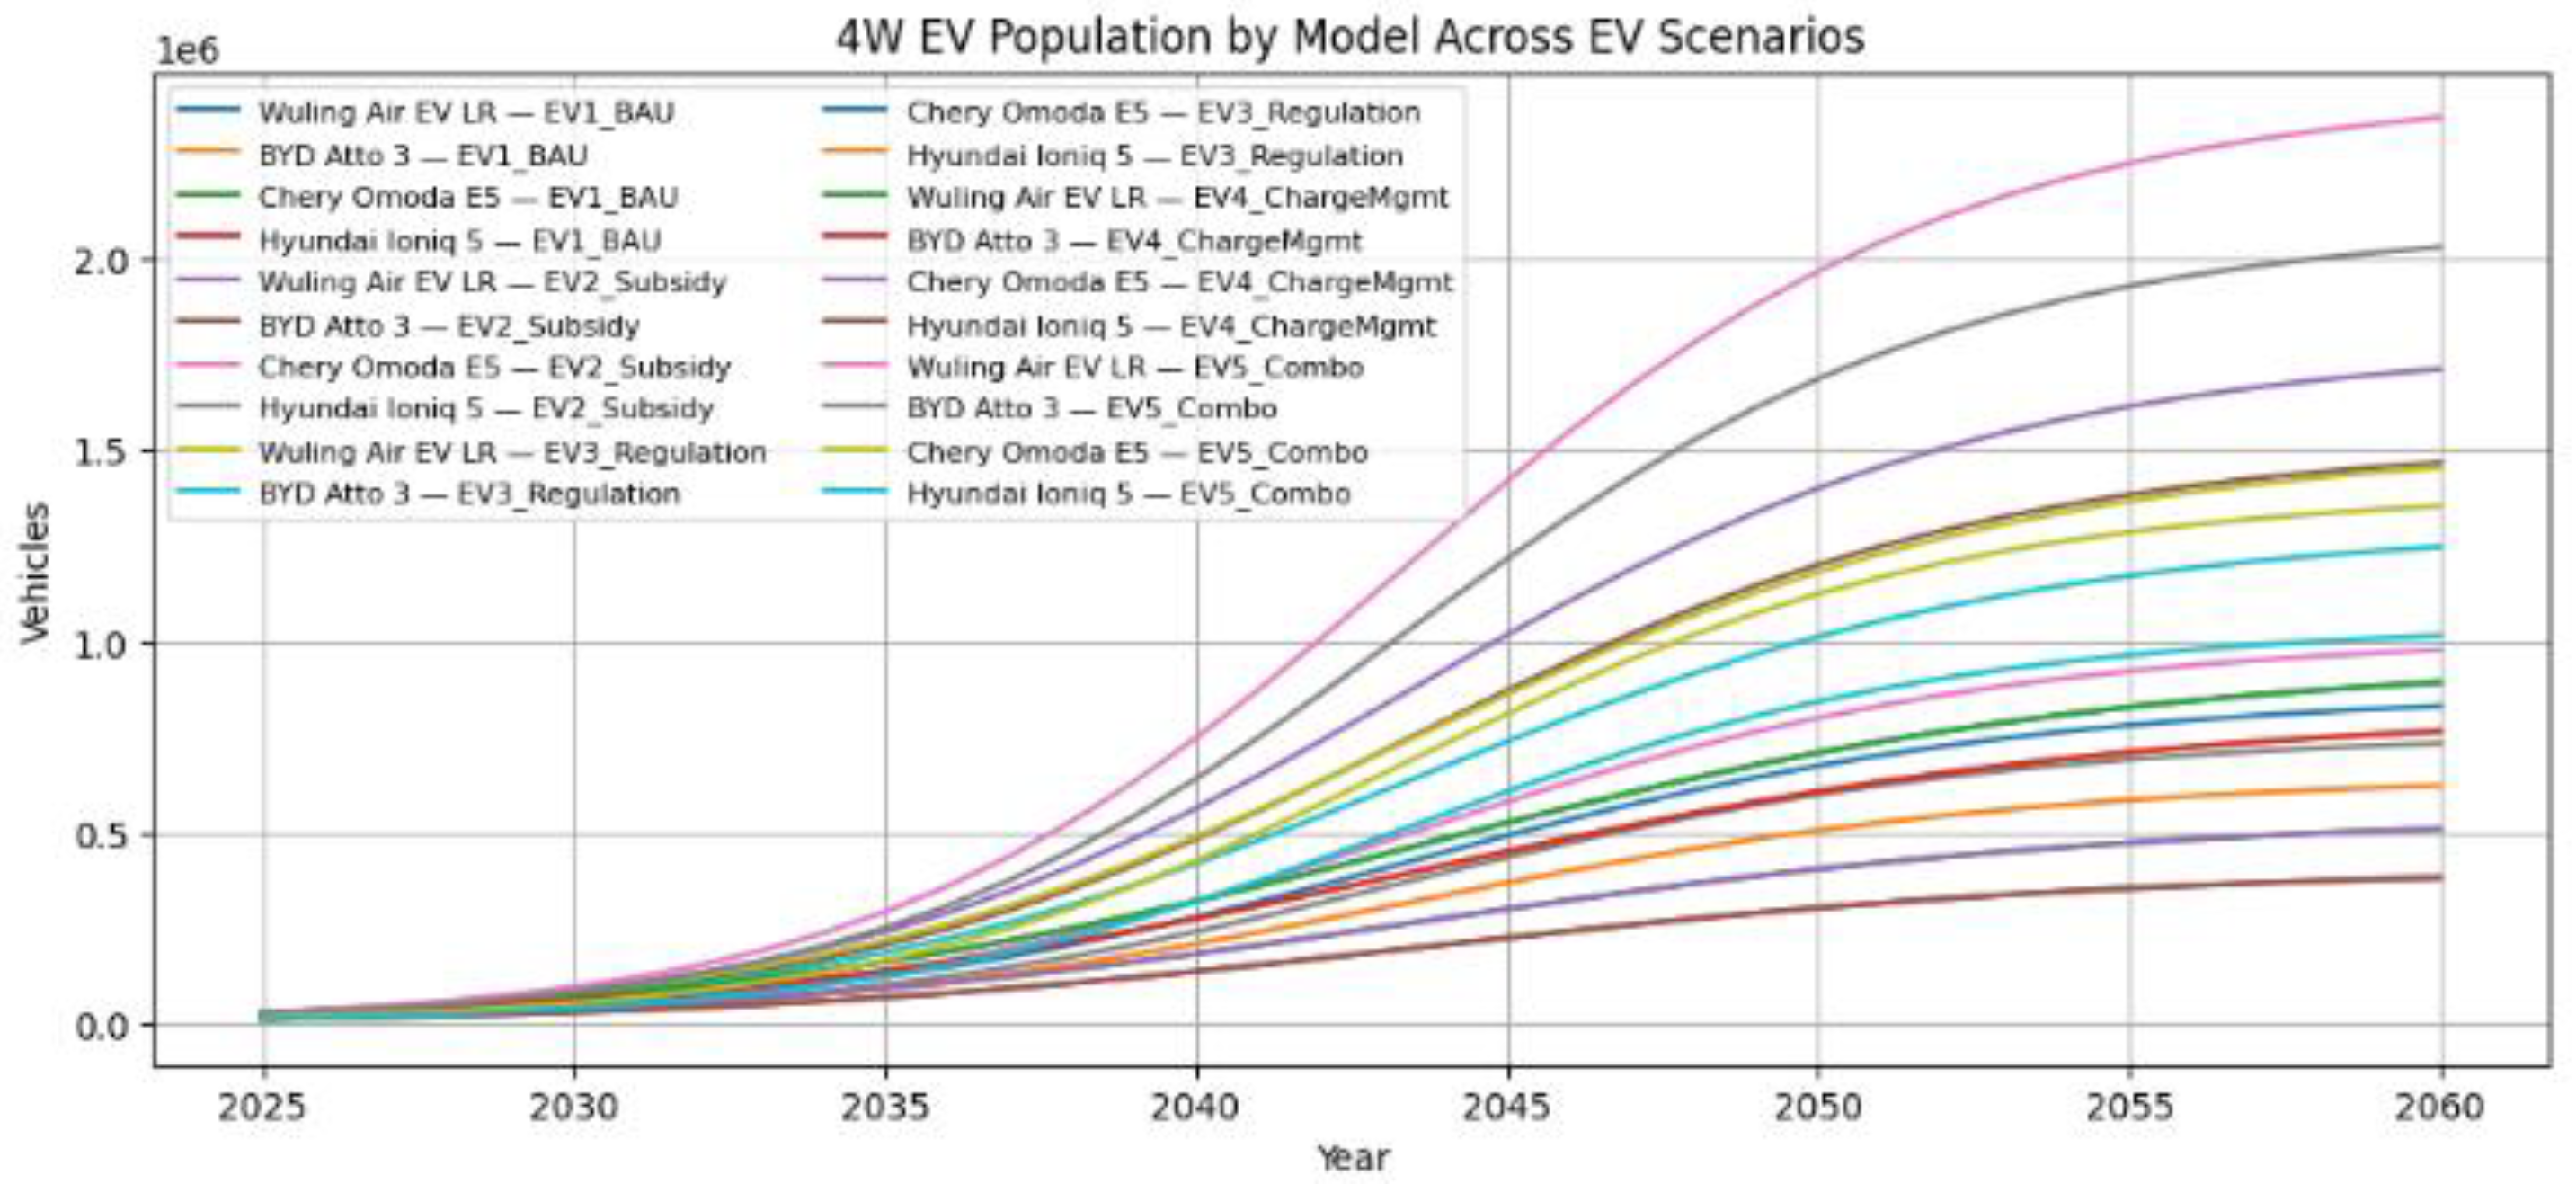
Figure 17.
Rooftop PV Households across Scenarios
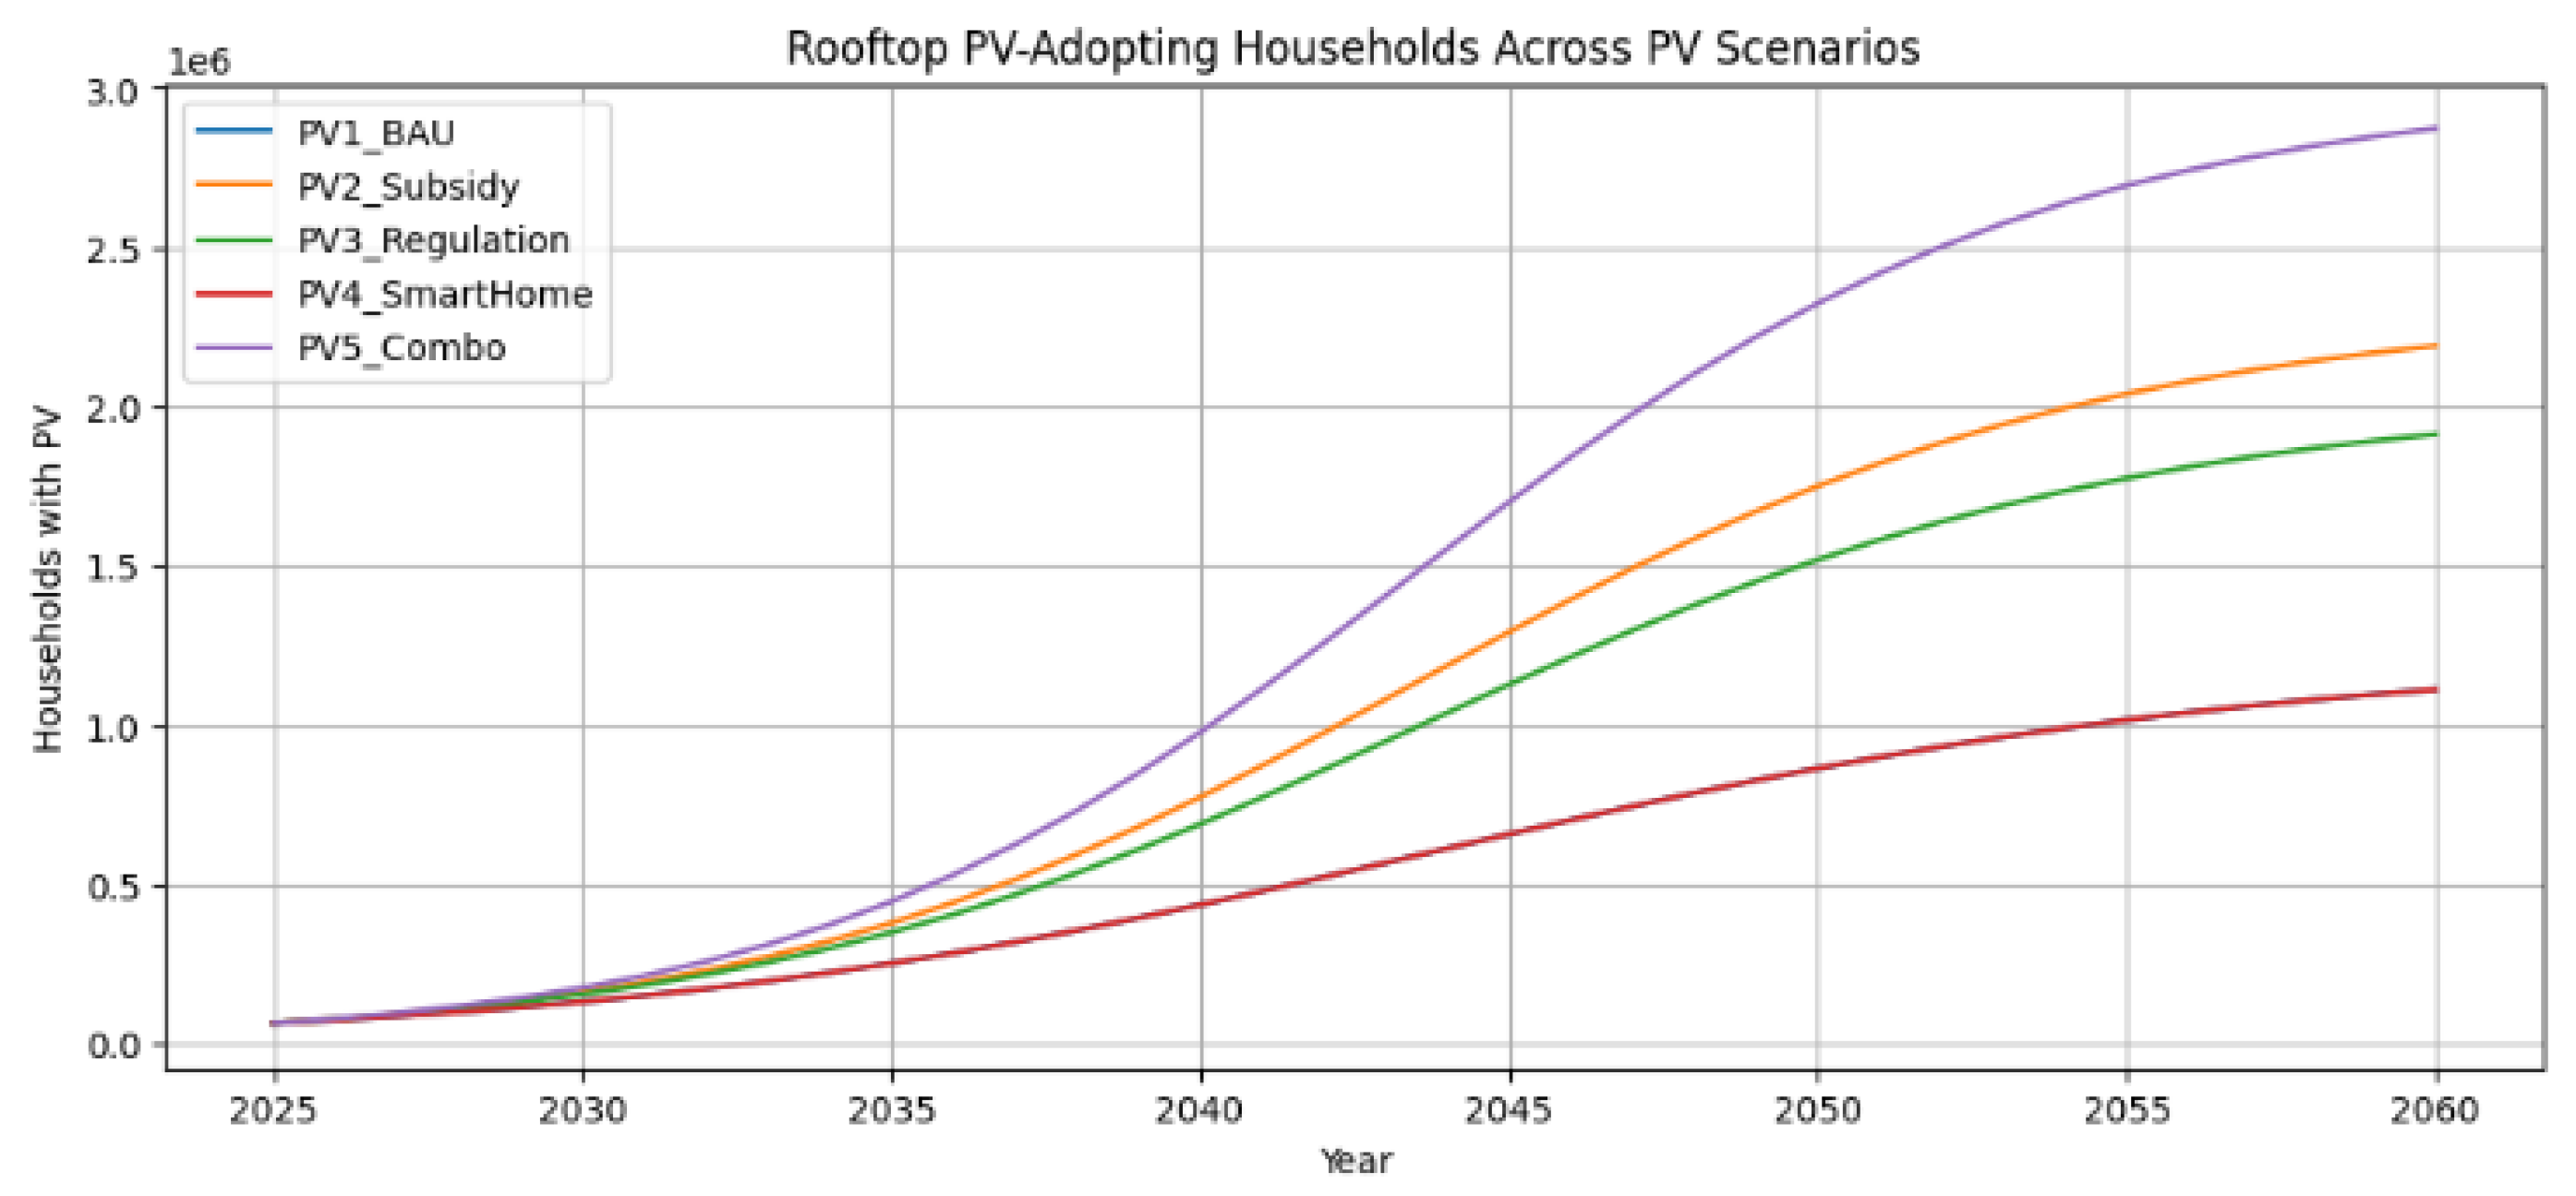
Figure 18.
Weekly EV and PV Load Curves (EV4_PV1 year 2030)
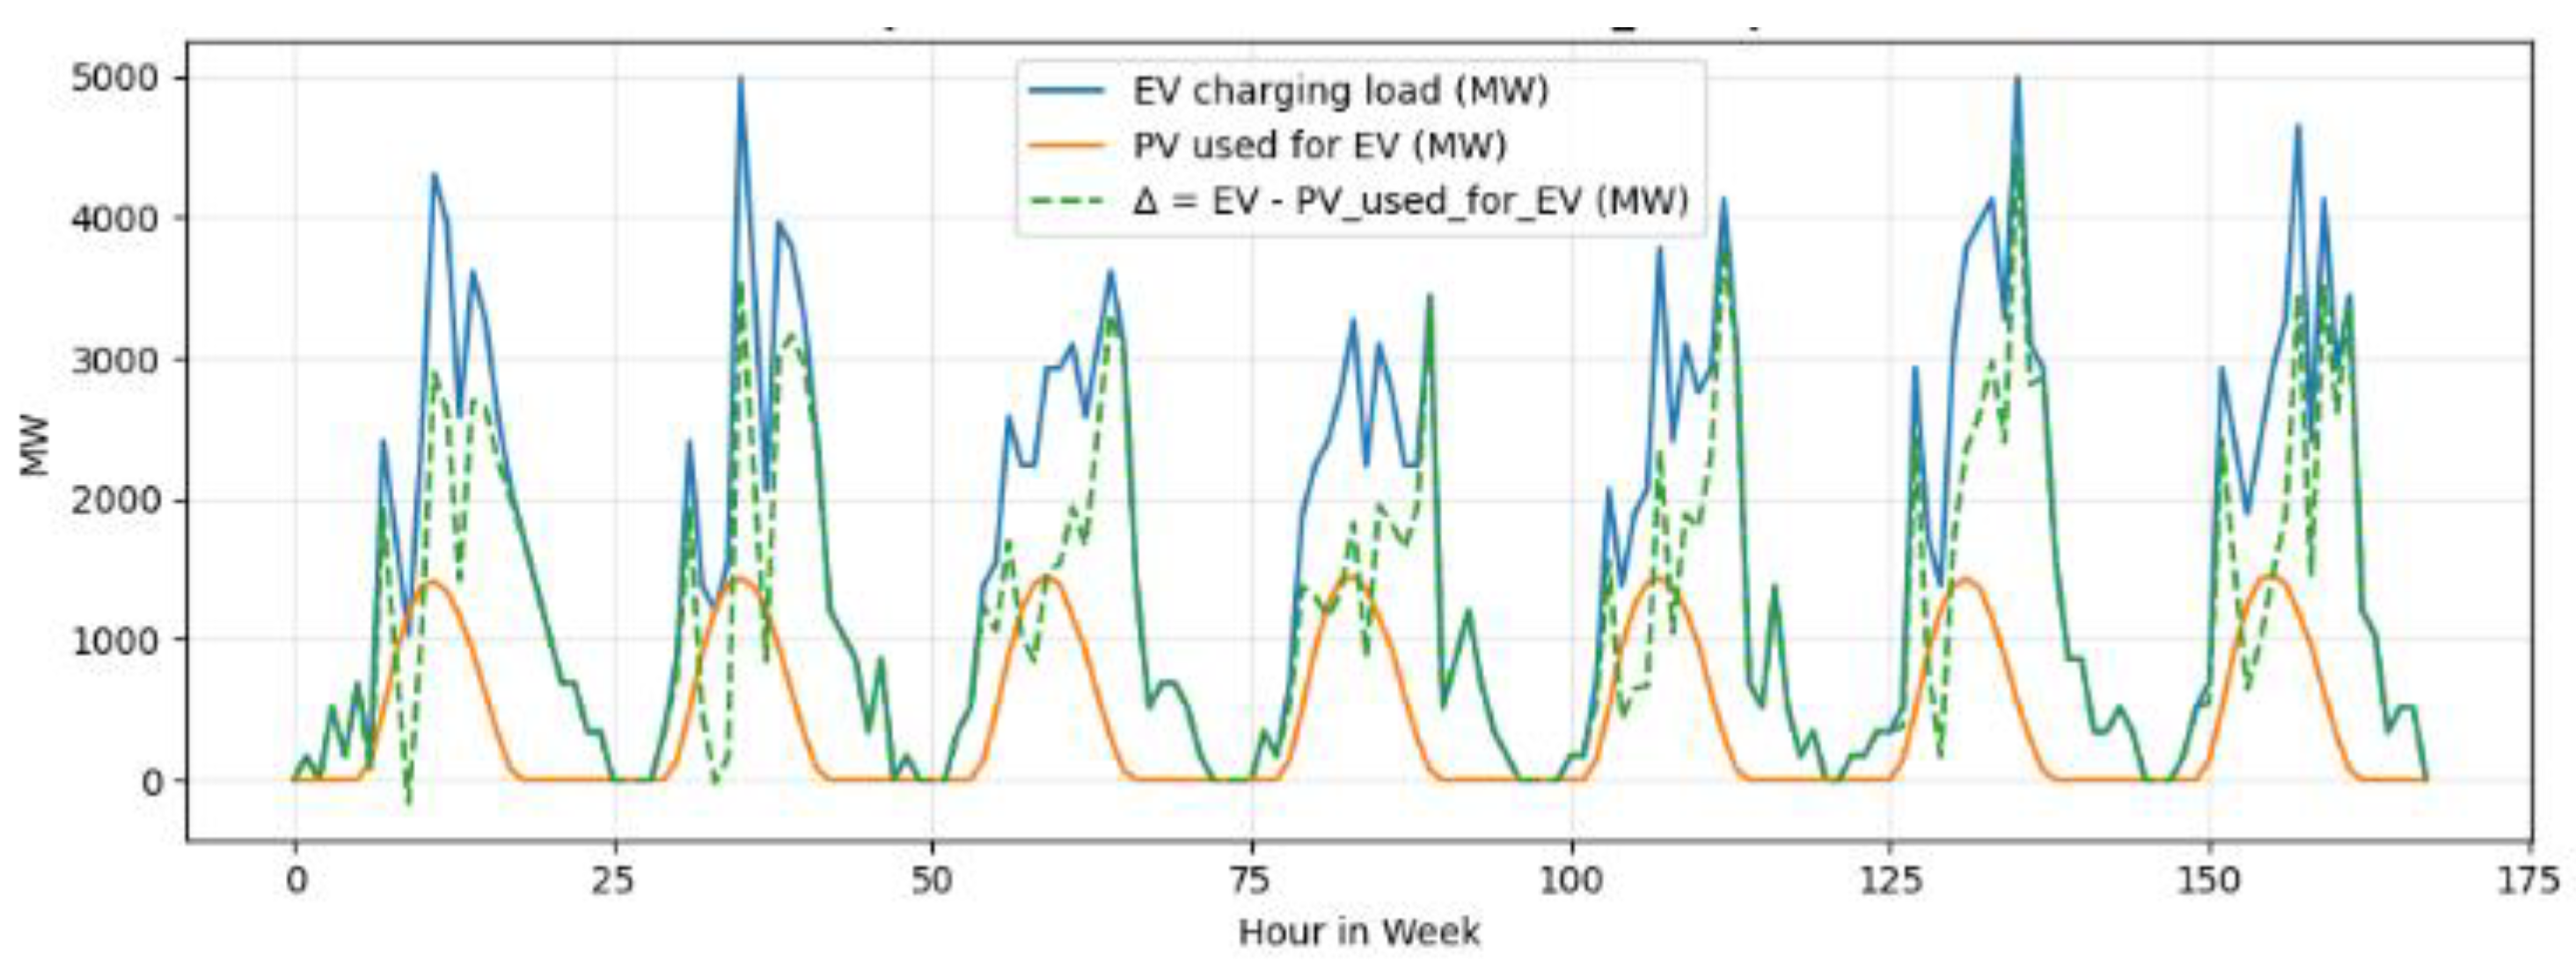
Figure 19.
Daily EV and PV Production and Consumption
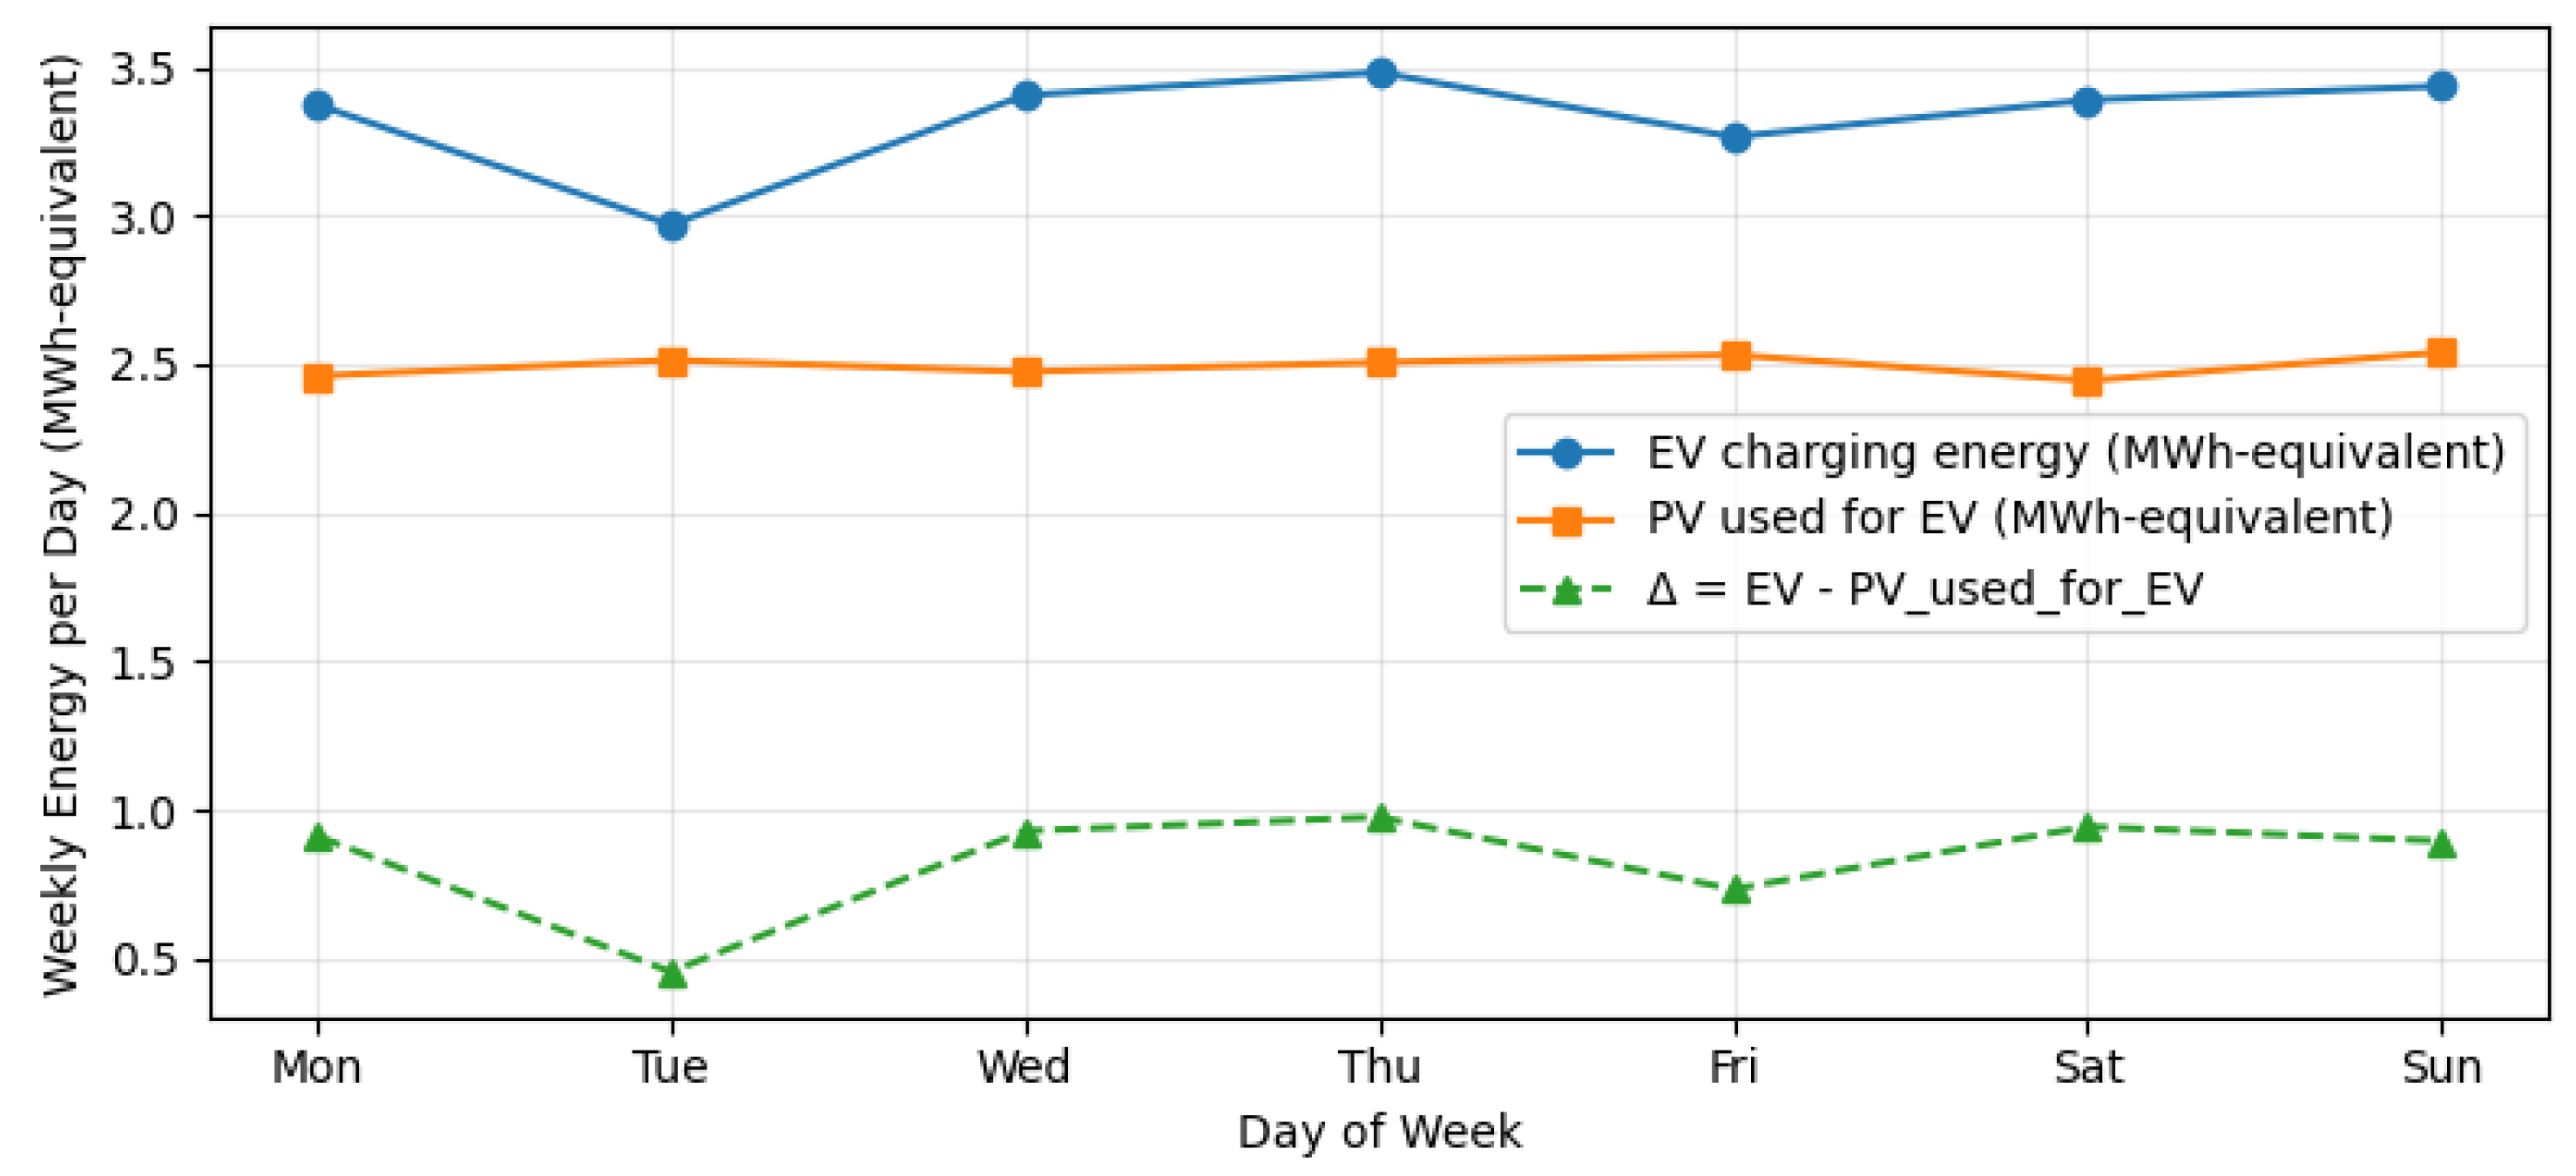
Figure 20.
Annual Energy Balance and Program Costs
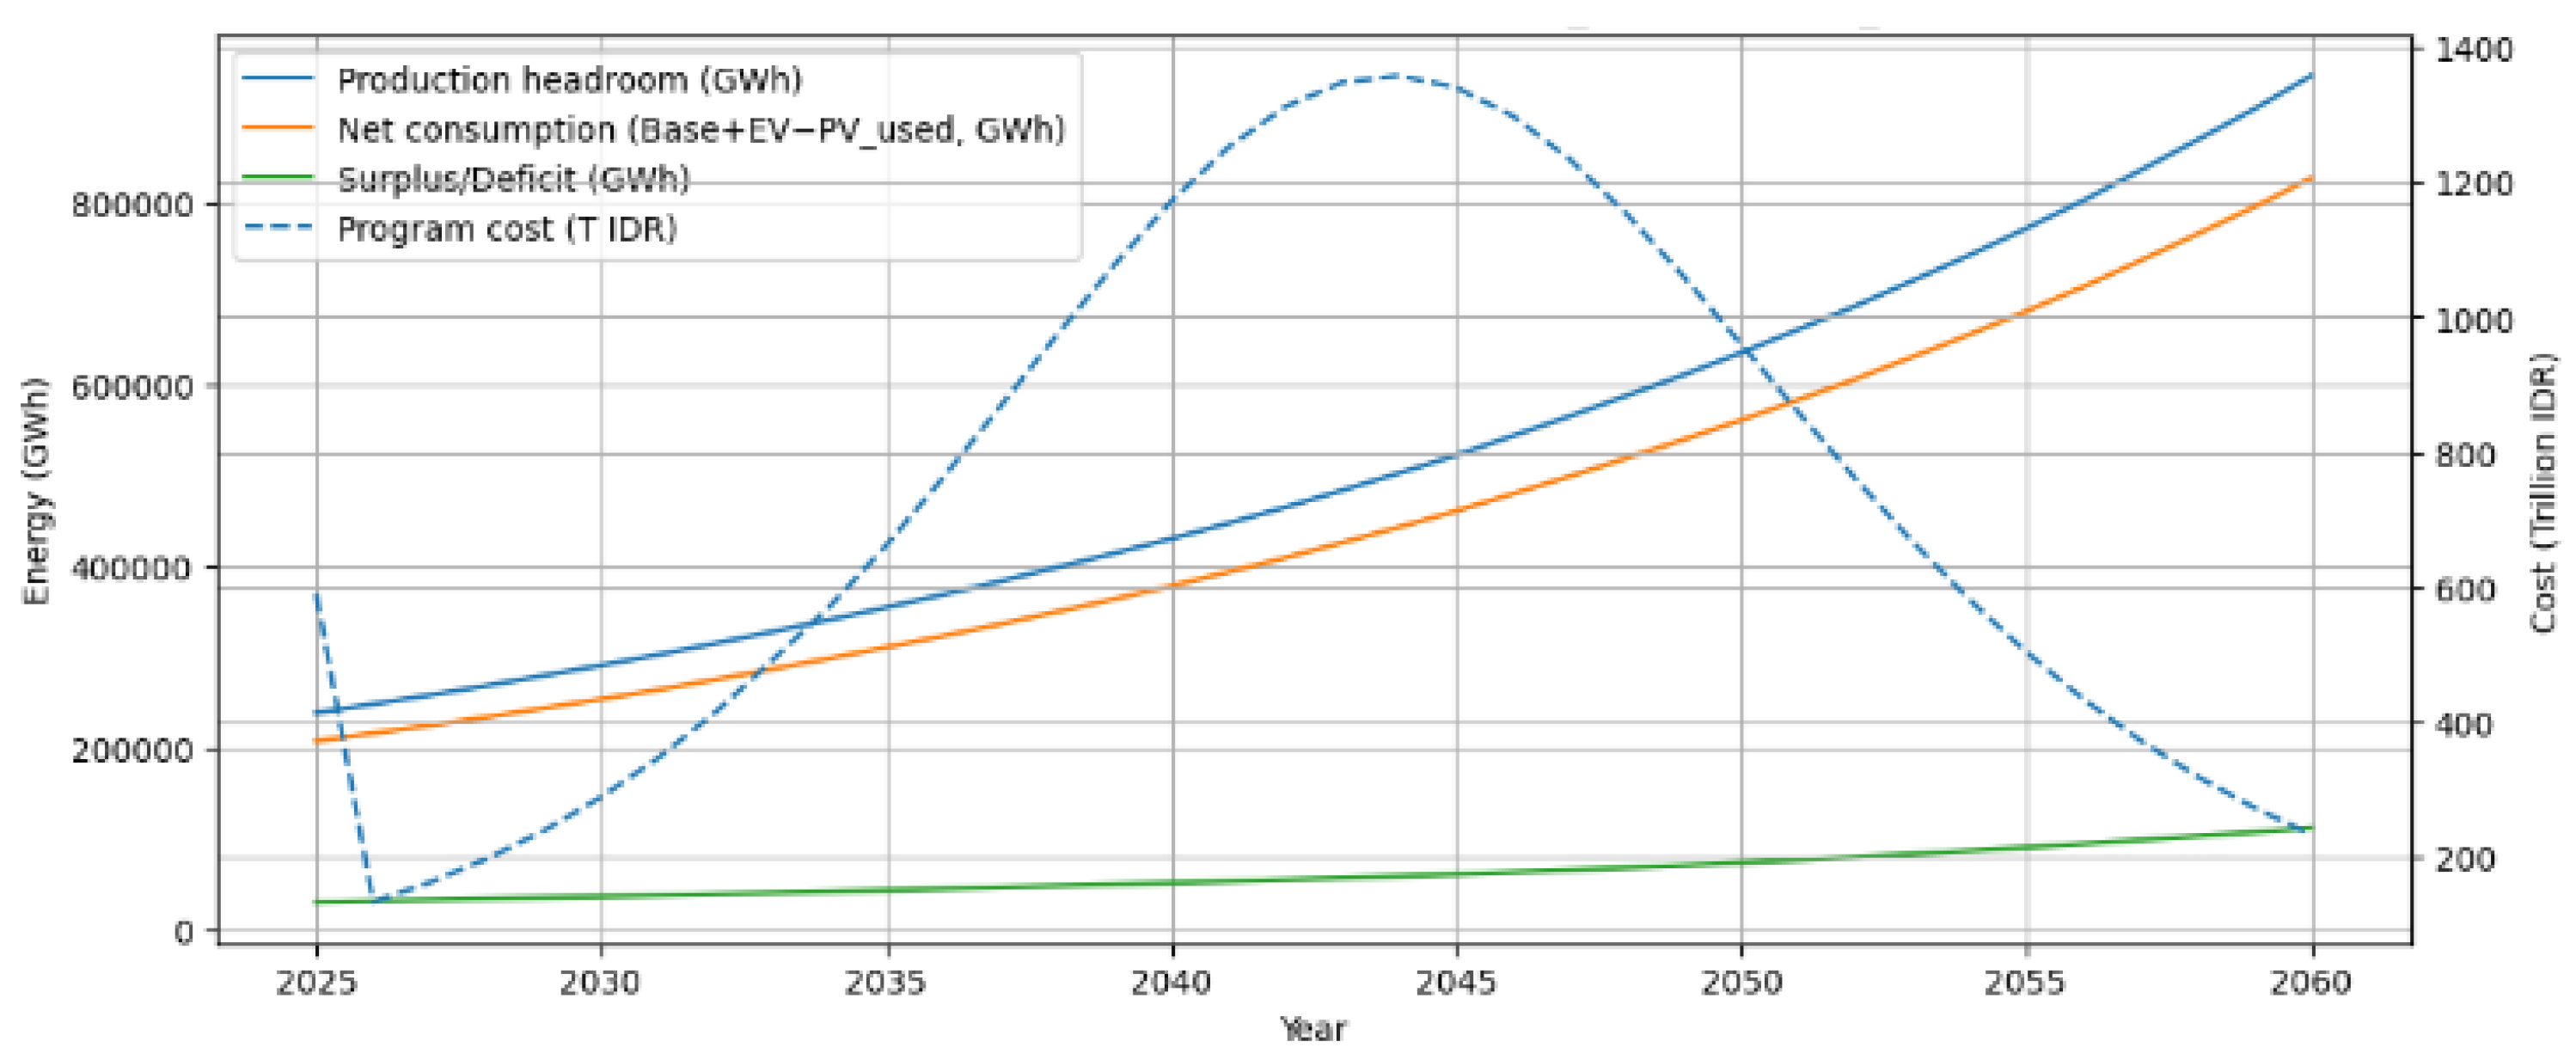
Figure 21.
Composite Scores Across Scenarios (Year 2040)
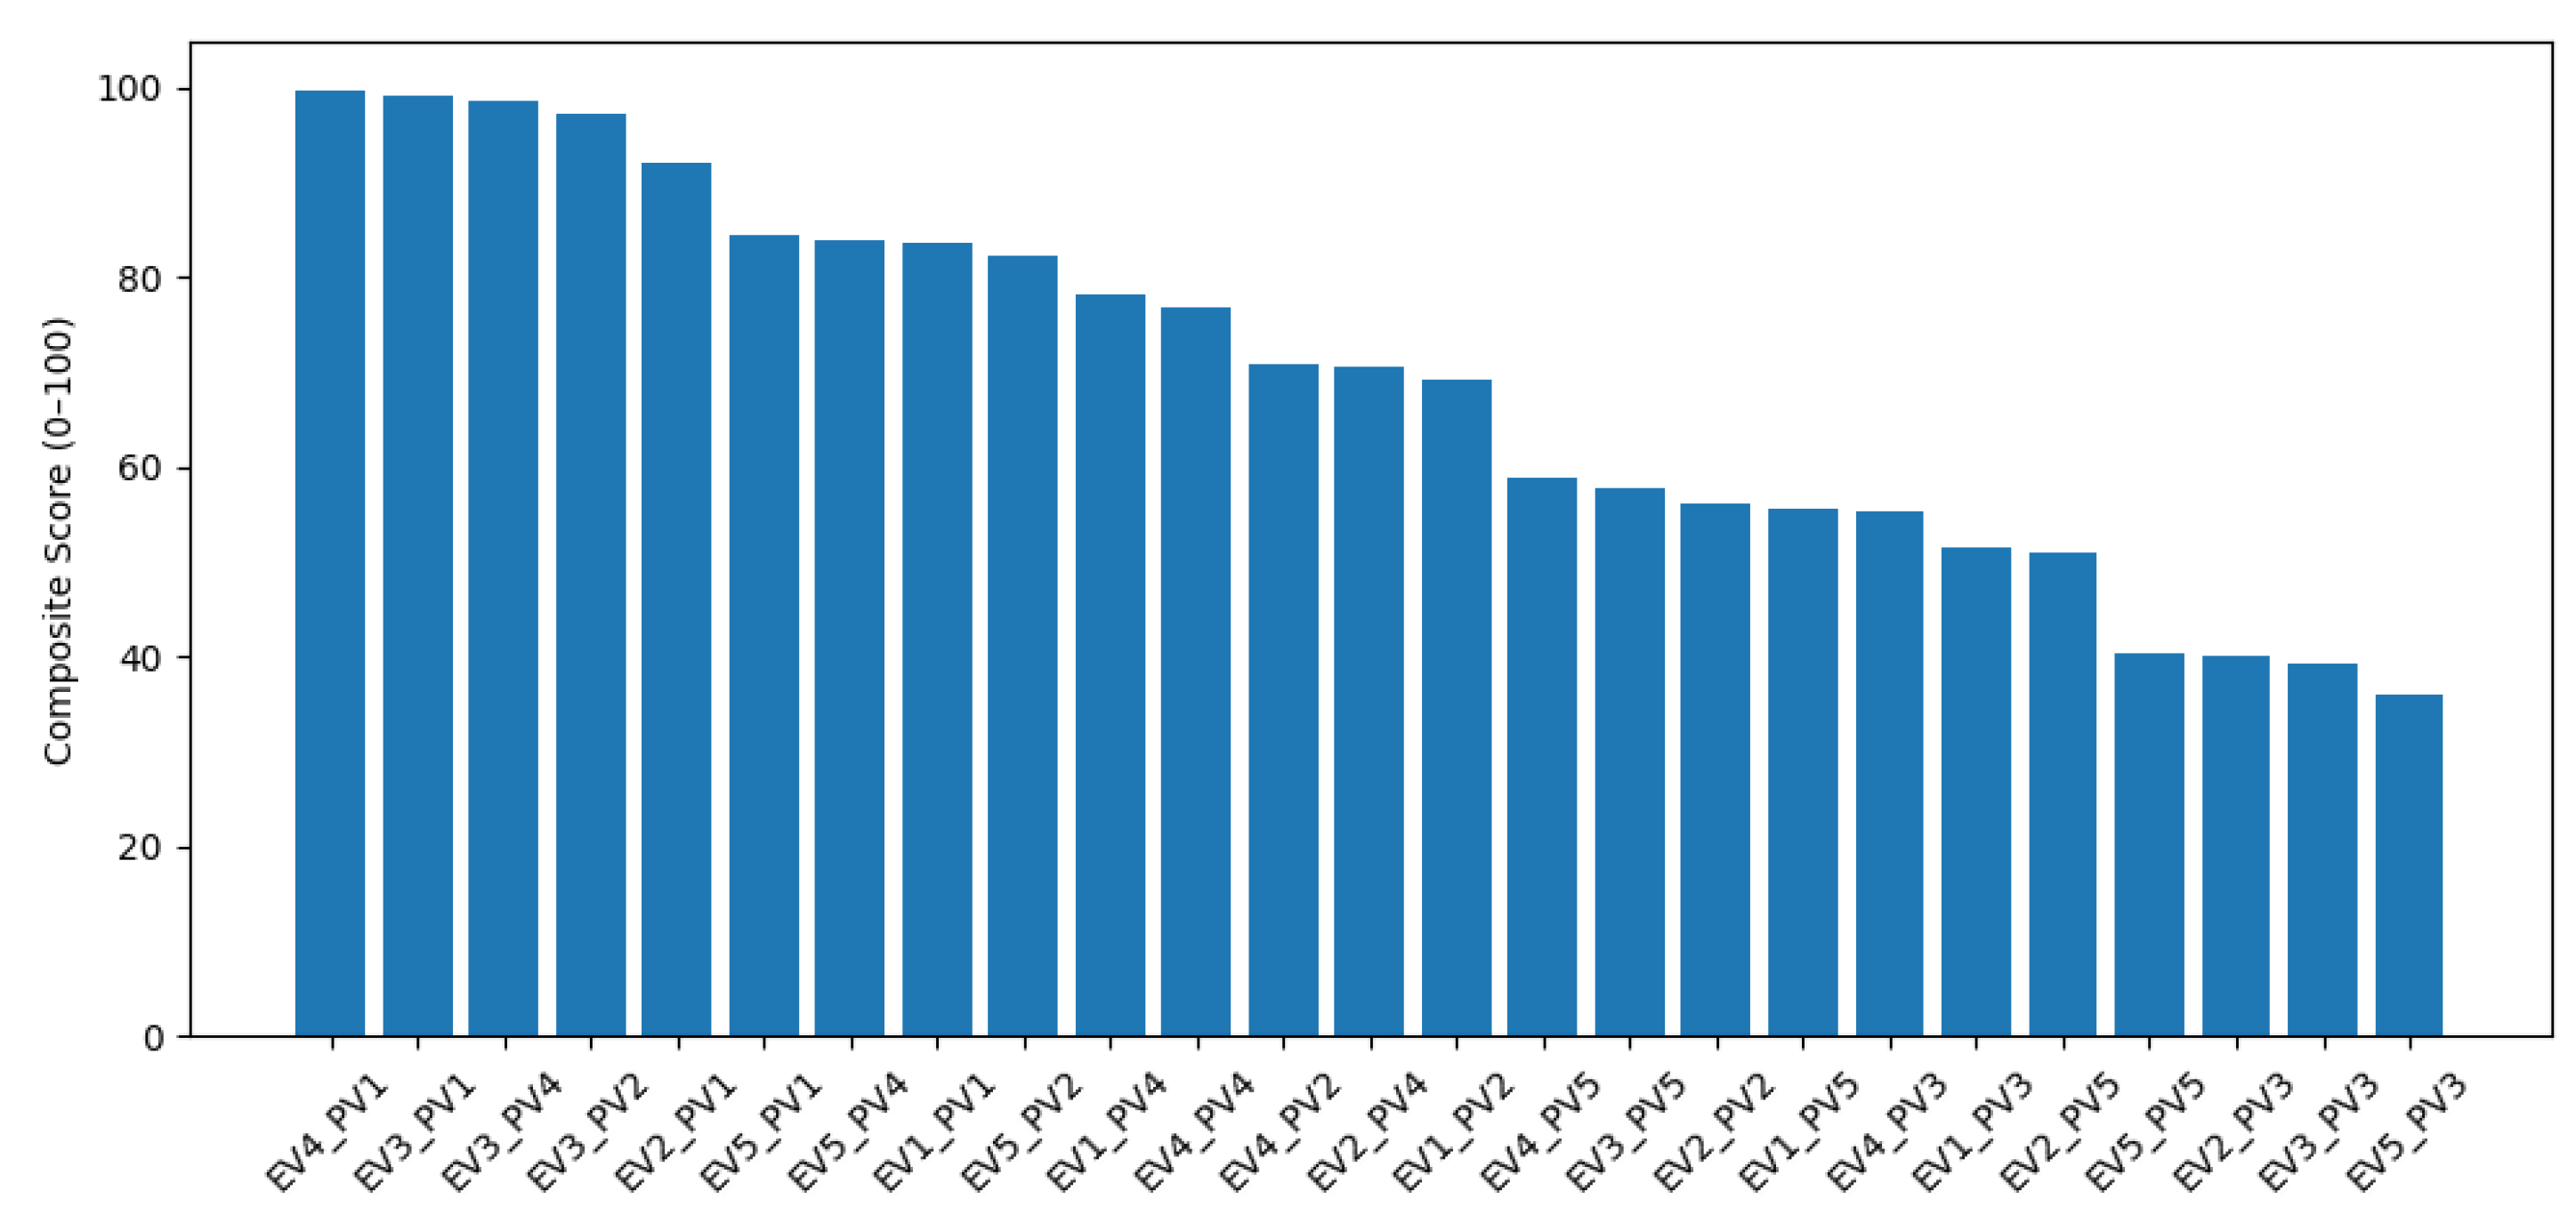
Table 2.
Vehicle Sales Number [56]
Table 2.
Vehicle Sales Number [56]
| Province | Vehicle Sales Jan–May 2025 (units) |
|---|---|
| DKI Jakarta | 64,761 |
| Jawa Barat | 41,396 |
| Banten | 18,958 |
| Jawa Tengah | 14,996 |
| DI Yogyakarta | 3,116 |
| Jawa Timur | 27,190 |
| Bali | 7,986 |
Table 3.
Vehicle Population per Type [58]
Table 3.
Vehicle Population per Type [58]
| Vehicle Population per Type | 2024 (unit) |
|---|---|
| 4-wheelers | 20.444.507 |
| Bussses | 293.991 |
| Commercial Vehicle | 6.277.403 |
| 2-wheelers | 139.450.013 |
| Total | 166.465.914 |
| EV scenario | Policy package | ) |
|---|---|---|
| EV1 – BAU | Baseline EV growth, no special incentives | Cost_EV1(y) = 0 (no explicit fiscal / administrative cost) |
| EV2 – Subsidy | Purchase subsidies for new EVs | Cost_EV2(y) = new_ev4w(y) × Rp 50,000,000 + new_ev2w(y) × Rp 7,000,000 |
| EV3 – Regulation | Regulation / tax waivers / stricter admin measures | Cost_EV3(y) = (new_ev4w(y) + new_ev2w(y)) × Rp 500,000 |
| EV4 – Charge-time management | Smart charging / load shifting program | participants(y) = EV_stock(y) × smart_share (smart_share = 0.35 for EV4) → Cost_EV4(y) = participants(y) × Rp 300,000 |
| EV5 – Combination | Combination of subsidy + regulation + smart charging | Cost_EV5(y) = Cost_EV2(y) + Cost_EV3(y) + Cost_EV4(y) |
Table 8.
Error Metrics of the Simulation.
| Series | Model | MAE | RMSE | NRMSE (%) | MAPE (%) | R2 |
|---|---|---|---|---|---|---|
| Annual Energy (GWh) | Holt-Linear | 18,718 | 21,395 | 10.5% | 10.47% | — |
| ARIMA(1,1,0) | 19,122 | 22,15 | 10.9% | 10.64% | — | |
| Hourly Load (MW) | Random Forest | 463.6 | 669.8 | 5.18% | 1.30% | 0.97 |
| Linear (T+Temp) | 1,879.7 | 2,384.0 | 18.45% | 5.28% | 0.82 |
Disclaimer/Publisher’s Note: The statements, opinions and data contained in all publications are solely those of the individual author(s) and contributor(s) and not of MDPI and/or the editor(s). MDPI and/or the editor(s) disclaim responsibility for any injury to people or property resulting from any ideas, methods, instructions or products referred to in the content. |
© 2026 by the authors. Licensee MDPI, Basel, Switzerland. This article is an open access article distributed under the terms and conditions of the Creative Commons Attribution (CC BY) license (http://creativecommons.org/licenses/by/4.0/).
Copyright: This open access article is published under a Creative Commons CC BY 4.0 license, which permit the free download, distribution, and reuse, provided that the author and preprint are cited in any reuse.


