
Submitted:
05 January 2026
Posted:
07 January 2026
You are already at the latest version
Abstract
Artisanal colonial cheese (ACC), produced from raw milk, retains its native microbiota throughout maturation, with lactic acid bacteria (LAB) being predominant, many of which exhibit probiotic potential. In this study, ten LAB strains isolated from ACC matured for 14 and 21 days were characterized and identified as Lacticaseibacillus casei, Lactiplantibacillus plantarum, Levilactobacillus brevis, and Pediococcus acidilactici. The strains were Gram-positive, catalase-negative, lacked phenotypic virulence factors (hemolysin, mucinase, and gelatinase), and showed sensitivity to at least two classes of antibiotics. They also exhibited high tolerance to simulated gastrointestinal conditions, along with strong auto-aggregation and hydrophobicity. The selected strains were microencapsulated by spray drying using inulin as a carrier agent. The resulting microparticles displayed predominantly spherical morphology and diameters ranging from 1.19 to 5.71 µm. Post-processing viability ranged from 76% to 99%, with cell counts remaining above 6 log CFU/g for up to 45 days under refrigeration. Storage at 25 °C significantly reduced cell survival. FTIR, XRD, and TGA/DTGA analyses confirmed the physicochemical stability of the microcapsules. Overall, the findings highlight ACC as a relevant source of safe and potentially probiotic LAB. Microencapsulation with inulin proved to be an effective strategy for preserving strain viability and stability, supporting their potential application in functional foods.
Keywords:
brazilian cheeses
; probiotic isolation
; spray-drying microencapsulation
; cell viability
1. Introduction
Artisanal Colonial Cheese (ACC) is a traditional product from southern Brazil, with historical roots linked to European colonization, particularly by Portuguese, Italian, and German immigrants. Produced from raw bovine milk, ACC exhibits distinctive sensory characteristics, such as a soft texture and yellowish color, which evolve throughout the maturation process. This period typically ranges from 15 to 30 days and is defined by the producer [1,2,3]. Like other artisanal cheeses, ACC reflects local environmental conditions and traditional know-how, serving as a rich source of microbial diversity with implications for both product quality and functional potential.
The microbiota of raw milk directly influences the final profile of the cheese, driving complex biochemical reactions during maturation, such as proteolysis, lipolysis, and carbohydrate fermentation, which lead to the formation of volatile compounds, organic acids, and fatty acids [4,5]. Among the microorganisms present, lactic acid bacteria (LAB) play a key role by contributing to fermentation and inhibiting undesirable microbes. Certain LAB strains, such as Lacticaseibacillus casei, Lactiplantibacillus plantarum, Levilactobacillus brevis, and Pediococcus acidilactici, display functional traits consistent with probiotic potential, provided they meet criteria such as resistance to the gastrointestinal tract, ability to adhere to the intestinal epithelium, absence of virulence factors, and susceptibility to antimicrobials [6,7,8,9].
However, the viability of probiotic strains can be compromised during food processing and storage. Factors such as temperature, humidity, and oxygen negatively affect their stability [10]. In this context, microencapsulation by spray drying emerges as an effective strategy to protect these bacteria, enhancing their resistance to adverse conditions and improving their release in the intestinal tract [11]. Additionally, the use of prebiotic carrier agents, such as inulin, can potentiate probiotic efficacy through functional synergy [12].
Considering the relevance of ACC as a source of microorganisms with probiotic potential and the challenges associated with their viability, this study aimed to: microbiologically and physicochemically characterize ACC produced in the western region of Santa Catarina; isolate and evaluate the probiotic potential of LAB strains present in the product; and investigate the efficacy of microencapsulation by spray drying using inulin as a carrier in the protection and functionality of these isolates.
2. Materials and Methods
2.1. Obtaining ACC Samples
ACC samples were produced using raw milk and a 21-day maturation period in two rural dairies located in Seara, SC (27°08′58″ S, 52°18′38″ W). Considering the microbiological dynamics during maturation, sampling was carried out on days 14 and 21, a period in which there is greater selectivity for LAB and a reduction of non–lactic acid bacteria. Sampling was performed at the production sites, and the cheeses were transported under refrigeration (<7 °C) in insulated boxes and in their original packaging to the laboratory, where they were stored at –18 °C until analysis.
2.2. Isolation and Morphological Characterization of Potentially Probiotic LAB by SEM.
LAB were isolated on Man Rogosa Sharpe agar (Sigma-Aldrich, St. Louis, Missouri, USA) by pour plating with an overlay, according to Tanaka et al. [13]. Briefly, 25 g aliquots of ACC, added to 225 mL of 0.85% saline solution, were homogenized in a sample homogenizer (model MA 440/CF, Marconi, São Paulo, Brazil) for 2 min. From the first dilution (10−1), the remaining serial dilutions were prepared and plated on MRS agar and incubated for 72 h at 37 °C under anaerobic conditions (Anaerocult, Merck, Darmstadt, Hesse, Germany). The isolates that showed typical LAB characteristics (Gram-positive, rods or cocci, catalase-negative) were stored at –20 °C in MRS medium supplemented with 20% glycerol until use.
Morphological analysis of the isolated strains was performed according to Silva et al. [14]. Cultures were grown in MRS broth for 24 h at 37 °C, washed twice with 0.85% saline solution, and centrifuged at 4,000 × g for 10 min. The pellets were frozen at –20 °C for 24 h followed by freezer drying. Subsequently, they were individually mounted on stubs with carbon tape and coated with a thin layer of gold by vacuum sputtering (Leica EM SCD 500, Wetzlar, Germany). Cell morphology was examined using a scanning electron microscope (JSM 6390 LV, Jeol, Tokyo, Japan) under an accelerating voltage of 8 kV, with magnifications of 6,000×, 7,500×, and 10,000× and working distances of 1–2 µm.
2.3. Genotypic Identification
Bacterial identification was performed using high-throughput sequencing of the V3/V4 regions of the 16S rRNA gene. Library preparation followed a proprietary protocol (Neoprospecta Microbiome Technologies, Brazil). Amplification was carried out with primers targeting the V3–V4 region of the 16S rRNA gene: 341F (CCTACGGGRSGCAGCAG) [15] and 806R (GGACTACHVGGGTWTCTAAT) [16]. Libraries were sequenced using the MiSeq Sequencing System (Illumina Inc., USA). Sequencing was performed in paired-end mode using the V3 kit with 600 cycles. Sequencing analyses were conducted using the Sentinel pipeline (Neoprospecta Microbiome Technologies, Florianópolis, SC, BR), following the approaches of Altschul et al. [17], Andrews [18], Cock et al. [19] and Masella et al. [20]. The obtained DNA sequences were compared against the Sentinel database [21] and the Greengenes database [22].
2.4. Hemolytic Activity:
The isolated strains were streaked on tryptic soy agar supplemented with 5% sheep blood (LaborClin, Pinhais, Brazil) and incubated at 37 °C for 48 h, as described by Margalho et al. [23]. Plate interpretation was based on the formation of halos around the colonies, classified as follows: greenish halos, indicating partial hemolysis (α-hemolysis); absence of halos, corresponding to non-hemolysis (γ-hemolysis); and transparent/bright halos, indicating complete hemolysis (β-hemolysis). Staphylococcus aureus ATCC 25923 was used as the positive control for β-hemolysis.
2.5. Gelatinase Production
Aliquots of 10 µL of the isolated strains were inoculated on Luria–Bertani agar supplemented with 3% gelatin (w/v). The plates were incubated at 37 °C for 48 hours and, after incubation, kept at 4 °C for 4 hours. Gelatin hydrolysis was recorded by the formation of halos around the colonies. S. aureus ATCC 25923 was used as the positive control for gelatinase [24].
2.6. Mucin Degradation Capacity
The isolated strains were inoculated on MRS agar and MRS-M agar (modified with 3% glucose), both supplemented with 0.5% porcine gastric mucin (Type III, M1778, Sigma-Aldrich, San Luis, MO, USA), and incubated at 37 °C for 72 h. For result interpretation, the plates were stained with 2% malachite green in 3.5 M acetic acid, as described by Leska et al. [25]. Salmonella Typhimurium ATCC 14028 was used as the positive control.
2.7. Antimicrobial Susceptibility Testing
The antimicrobial susceptibility assays followed ISO 20776-1 [26] using the minimum inhibitory concentration (MIC) technique. Antibiotic dilutions (ampicillin, benzylpenicillin, cephalexin, clindamycin, metronidazole, meropenem, and streptomycin) were prepared to obtain concentrations above and below the cutoff values for each antibiotic. The cutoff values established by the European Commission (EUC) [27], the European Food Safety Authority (EFSA) [28], the European Committee on Antimicrobial Susceptibility Testing (EUCAST) [29], and the study by Gad et al. [30] were used.
The inocula incubated in MRS broth for 16 hours at 37 °C were adjusted in a spectrophotometer (K37-VIS, KASVI, Brazil) at 625 nm to an absorbance between 0.08 and 0.13. Finally, 10 μL of the adjusted inoculum was added to the wells, and the microplates were incubated at 37 °C for 24 h. Microbial growth was confirmed by adding 20 μL of a 0.5% 2,3,5-triphenyltetrazolium chloride (TTC) dye solution, followed by 1 hour of incubation (37 °C). The BAL strains Lactiplantibacillus plantarum ATCC 8014 and Lacticaseibacillus casei BGP 93 were used as controls. The MIC was defined as the lowest antimicrobial concentration that inhibited microbial growth, i.e., showed no color development.
The minimum bactericidal concentration (MBC) followed Celiktas et al. [31] with modifications. Suspensions without microbial growth, i.e., below the MIC, were surface-inoculated (10 μL) onto MRS agar and incubated at 37 °C for 24 h. The lowest concentration at which no microbial growth was observed was considered the MBC
2.8. Evaluation of LAB Survival in the Gastrointestinal System In Vitro
The survival assays of LAB isolates under simulated gastrointestinal conditions followed the protocol proposed by Brodkorb et al. [32], with adaptations (Table 1). First, 1 mL of the bacterial cultures with an approximate count of 8 log CFU/mL, according to the 0.5 McFarland scale, were distributed into sterile test tubes. pH adjustments were performed by adding 0.1 M NaOH or 0.1 M HCl. The temperature was maintained at 37 °C, and the intensity of peristaltic movements was simulated in a digital Dubnoff water bath (Model NI 1232, Nova Instruments, Piracicaba, SP) with variable agitation [33]. Before use, the enzymatic solutions were prepared and sterilized by filtration using a 0.22 mm membrane filter (MF-Millipore, Billerica, MA, USA). After sterilization, all solutions were kept on an ice bath until use under the simulated gastrointestinal conditions. After that, all samples were subjected to viable cell counts, being inoculated in duplicate by deep plating with an overlay in MRS agar and incubated for 72 hours at 37 °C. After incubation, the colonies were counted, and the result was expressed as log CFU/mL. The bacterial survival rate (%) was calculated as described by [34].
2.9. Auto-Aggregation and Hydrophobicity Test
The isolated strains were cultured in MRS broth for 18 h at 37 °C, centrifuged (4000 rpm, 10 min), washed twice, and resuspended in phosphate-buffered saline (PBS) (pH 7.4) until reaching an optical density of 0.5 at 600 nm (A₀). The suspensions (2 mL) were incubated at 37 °C for 3, 6, and 24 h, followed by absorbance reading (Aₜ). The percentage of auto-aggregation was calculated based on the absorbance variation over time, according to Yasmin et al. [35].
Hydrophobicity was determined by bacterial adhesion to hydrocarbons (BATH), according to Farid et al. [36]. The strains were cultured in MRS broth for 24 h at 37 °C, centrifuged (4000 × g, 15 min), washed, and resuspended in phosphate-buffered saline (PBS) (pH 7.4) with an initial OD of 0.7 at 600 nm. Three milliliters of the suspension were mixed with 1 mL of dichloromethane, incubated for 10 min at 37 °C, vortexed for 30 seconds, and incubated again for 1 h for phase separation. The absorbance of the aqueous phase (ODfinal) was measured, and cell hydrophobicity was calculated based on the reduction in absorbance.
2.10. Lipase Production Assay
The isolated strains were cultured in MRS broth for 18 h at 37 °C. Lipase production was evaluated according to Barbosa et al. [37] by adding 10 µL aliquots of the culture onto the surface of modified Luria–Bertani agar supplemented with 0.2% (w/v) CaCl₂ and 1% Tween 80 for lipase detection. The plates were incubated at 37 °C for 48 h and, after incubation, kept at 4 °C for 4 h. Lipase production was recorded by the formation of halos around the colonies. Bacillus cereus ATCC 11778 was used as the positive control for lipase.
2.11. Microencapsulation of LAB Strains
The previously activated cultures were inoculated at 1% into MRS broth and incubated at 37 °C for 24 h. After incubation, the cells were centrifuged at 4,000 × g for 10 min and washed with sterile saline solution (0.85%, v/v), followed by a second centrifugation. The pellets were then resuspended in 5 mL of sterile saline solution (0.85%, v/v) under agitation. The cell suspension was incorporated into the carrier agent, inulin (200 g L-1), previously dissolved in sterile water. The mixture was kept under constant magnetic stirring to ensure homogeneity during atomization in a spray dryer (B-290, Buchi, Switzerland), operating with an inlet temperature of 150 °C, outlet temperature of 50 ± 3 °C, feed rate of 20 mL min-1, air flow of 35 m3 h-1, and pressure of 0.7 MPa. The resulting powders were collected in sterile Falcon tubes and stored at –20 ± 1 °C until further analyses.
2.12. Survival of LAB After Spray Drying and During Shelf-Life
The viability of the LAB strains was assessed before microencapsulation (feeding solution), immediately after spray drying, and during storage at 25 ± 1 °C and 4 °C for 10, 20, 30, 40, 50, and 60 days. For the analyses, 1 g of sample was transferred to 9 mL of sterile phosphate buffer (pH 7.0; 0.1 mol L-1) and homogenized for 5 min in a sample homogenizer to ensure complete release of the encapsulated cells. From the initial dilution (10-1), serial dilutions were prepared and plated in triplicate on MRS agar, followed by incubation at 37 °C for 72 h. Viability was expressed as Log CFU/mL, and the bacterial survival rate (%) was calculated as previously described.
2.13. Morphology and Size of Microparticles
The morphology and size of the microparticles were analyzed by SEM at an accelerating voltage of 10 kV with magnifications ranging from 300 to 4000×. For sample preparation, the microparticles were mounted on stubs using carbon tape and coated with a thin layer of gold. The diameter of the microparticles was estimated from the micrographs at their original magnification using ImageJ software (version 1.54g).
2.14. Interaction Between Microcapsule Components by FTIR
The interaction between the constituent components of the microcapsules was evaluated by Fourier-transform infrared spectroscopy (FTIR) using an IRPrestige-21 spectrophotometer (Shimadzu Scientific Instruments Inc., USA). The samples were prepared in pellet form using potassium bromide (KBr) as the dispersing matrix. Spectral analyses were performed in the scanning range of 550 to 4000 cm-1 with a resolution of 4 cm-1 [34].
2.15. Thermogravimetric Analysis
Thermogravimetric analysis (TGA) and derivative thermogravimetry (DTG) were performed using an STA 449 F3 Jupiter calorimeter (Netzsch). For each assay, approximately 6.5 mg of microcapsules or inulin were placed in aluminum pans and heated from 30 to 300 °C at a rate of 10 °C/min. Measurements were conducted under an inert nitrogen atmosphere with a controlled flow rate of 20 mL/min
2.16. X-Ray Diffraction (XRD)
The crystalline properties of the microcapsules and inulin were determined by X-ray diffraction using a Rigaku MiniFlex600 diffractometer. Analyses were performed over a range of 5 to 60°, with a wavelength of 0.05°/s and a scanning speed of 10°/min.
2.17. Statistical Analyses
Data were expressed as mean ± standard deviation. Statistical analyses were performed using Statistica® 14.0.1 software (TIBCO Software Inc., Palo Alto, CA, USA). Triplicate data were subjected to analysis of variance (ANOVA) followed by Tukey’s test (5% significance level). Data analysis and graph plotting were performed using Origin 10.0 software (OriginLab Corporation, Northampton, MA, USA).
3. Results and Discussion
3.1. Identification of BAL Strains
All strains isolated from ACC exhibited typical LAB characteristics. Morphological analysis by SEM (Figure 1) identified nine rod-shaped strains and one coccus-shaped strain, all of which were Gram-positive and catalase-negative.
Figure 1D shows the P. acidilactici strain LAB 04, displaying the typical coccoid morphology in paired arrangements. Overall, the bacterial cells exhibit cell wall damage due to the absence of a protective agent during culture lyophilization, although their general shape remained preserved. Genotypic analysis identified the species L. casei (n = 5), L. plantarum (n = 3), L. brevis (n = 1), and P. acidilactici (n = 1).
3.2. Safety Analyses of LAB Isolates
The LAB isolates tested showed no hemolytic or mucinolytic activity, nor did they produce gelatinase, indicating the absence of virulence factors associated with host invasion. Hemolysis is related to the destruction of red blood cells [38], gelatinase to the degradation of structural components such as collagen and elastin [39], and mucinase to the breakdown of mucin, a protective barrier of the intestinal epithelium [40].
The susceptibility of the isolated LAB strains to seven antibiotics, commonly used both clinically and in hospital settings, is presented in Table 2. All antibiotics showed at least one resistant strain; however, all isolates were sensitive to at least two different classes of antibiotics. Castro-López et al. [41] reported that antimicrobial resistance depends on the species and may vary even among strains of the same species. The EFSA [28] document does not provide a breakpoint value for L. plantarum against streptomycin; therefore, the cutoff established by the EUC [27] was used. Based on this criterion, among the three isolates, L. plantarum LAB 02 and LAB 03 were classified as resistant. Streptomycin resistance in L. plantarum is considered intrinsic, as the uptake of this antibiotic depends on cytochrome-mediated electron transport, a system absent in Lactobacillaceae, making these bacteria unable to internalize the compound [39]. Anisimova and Yarullina [42] also reported streptomycin resistance in 12 L. plantarum strains. Similar to the present study, MIC values reported by Shao et al. [43] ranged between 16 and 512 µg/mL, being classified as resistant according to EUC [27] breakpoints. All other strains analyzed in this study were sensitive to the antibiotic.
Li et al. [44] reported that many species within the Lactobacillaceae family exhibit resistance to antibiotics that inhibit nucleic acid synthesis or cell wall synthesis, such as metronidazole, benzylpenicillin, and cephalexin. All ten LAB strains in the present study were resistant to these antimicrobials, with the exception of L. casei LAB 08, which was sensitive to benzylpenicillin. However, only L. plantarum LAB 03 and L. casei LAB 08 showed resistance to ampicillin, which also acts by inhibiting cell wall synthesis. This resistance may have developed due to selective pressure in the isolation environment, potentially involving transferable resistance genes, such as those encoding extended-spectrum β-lactamases (ESBLs), including blaZ and blaSHV [39,44]. Within the carbapenem class, two L. casei isolates (LAB 07 and LAB 10) exhibited resistance to meropenem. DeMarco et al. [45] identified meropenem-resistant Lactobacillaceae in an immunocompromised patient consuming probiotics, with L. casei among the isolates. Anisimova et al. [46] also reported meropenem-resistant Lacticaseibacillus paracasei strains originating from probiotic supplements. In contrast, Duche et al. [47] did not detect imipenem resistance among probiotic bacteria; however, they reported meropenem resistance in isolates of L. brevis, L. paracasei, Lactiplantibacillus pentosus, and L. casei. The authors noted that carbapenem resistance in Lactobacillaceae may be species-specific, consistent with the findings of the present study. Nevertheless, studies investigating the susceptibility of probiotic microorganisms to meropenem are scarce, and information on resistance patterns remains limited. Meropenem resistance is believed to be intrinsic, as this antibiotic belongs to the β-lactam class and acts by inhibiting cell wall synthesis. Lactobacillaceae are generally sensitive to antimicrobials that inhibit protein synthesis, such as clindamycin [48]. In this study, only the L. brevis LAB 05 strain exhibited resistance to clindamycin. A study by Silva et al. [49] evaluating probiotic LAB isolated from artisanal Minas cheese found L. casei and L. plantarum strains to be clindamycin-sensitive, while also reporting clindamycin-resistant L. brevis isolates.
The MBC data showed no bactericidal activity for the antibiotics that exhibited 100% resistance (cephalexin and metronidazole) within the concentration range evaluated. Benzylpenicillin, which showed resistance in most isolates, presented MBC values close to the upper limit of the tested range. Some antibiotics showed identical MIC and MBC values; however, others did not present MBC values within the evaluated range, even when the corresponding strains were classified as sensitive.

Table 2.
MIC and MBC results for LAB isolated from ACC at 14 and 21 days of ripening.
| Cepas | Antibióticos (µg/mL) | |||||||||||||
|---|---|---|---|---|---|---|---|---|---|---|---|---|---|---|
| Ampicillin | Benzylpenicillin | Streptomycin | Clindamycin | Cephalexin | Metronidazole | Meropenem | ||||||||
| MIC | MBC | MIC | MBC | MIC | MBC | MIC | MBC | MIC | MBC | MIC | MBC | MIC | MBC | |
| L. plantarum LAB 01 | 2 | 4 | 4 | - | 4 | 64 | 0.25 | 0.25 | - | - | - | - | 0.125 | 0.125 |
| L. plantarum LAB 02 | 0.25 | 4 | 16 | 64 | 16 | - | 2 | 16 | 64 | - | - | - | 1 | 2 |
| L. plantarum LAB 03 | 4 | 8 | 1 | 1 | 32 | 64 | 0.125 | 0.125 | 32 | - | - | - | 0.25 | 4 |
| P. acidilactici LAB 04 | 4 | - | 4 | 64 | 64 | - | 0.5 | 4 | - | - | - | - | 2 | 16 |
| L. brevis LAB 05 | 0.5 | 2 | 8 | 32 | 64 | 256 | 2 | 16 | 64 | - | - | - | 2 | 4 |
| L. casei LAB 06 | 0.5 | 8 | 1 | 32 | 2 | 64 | 0.25 | 2 | - | - | - | - | 2 | - |
| L. casei LAB 07 | 1 | 8 | 1 | 4 | 16 | 128 | 0.25 | 1 | - | - | - | - | 4 | 64 |
| L. casei LAB 08 | 8 | 16 | 0.25 | 32 | 32 | 32 | 0.5 | 2 | - | - | - | - | 0.5 | - |
| L. casei LAB 09 | 2 | 32 | 1 | 2 | 32 | 512 | 0.125 | 0.5 | 32 | - | - | - | 0.25 | 2 |
| L. casei LAB 10 | 4 | 4 | 1 | 32 | 64 | 64 | 0.5 | 2 | - | - | - | - | 8 | 64 |
| L. plantarum ATCC 8014 | 4 | - | 4 | 64 | 128 | - | 0.25 | 4 | - | - | - | - | 2 | - |
| L. casei BGP 93 | 4 | - | 4 | - | 128 | 1024 | 0.25 | 4 | - | - | - | - | 2 | - |
| Cutting Point | ||||||||||||||
| L. plantarum | 2 | 0.5 | 16* | 2 | 16 | 4 | 2 | |||||||
| L. casei | 4 | 0.5 | 64 | 1 | 16 | 4 | 2 | |||||||
| L. brevis** | 2 | 0.5 | 64 | 1 | 16 | 4 | 2 | |||||||
| P. acidilactici | 4 | 0.5 | 64 | 1 | 16 | 4 | 2 | |||||||
MIC: Minimum inhibitory concentration. MBC: Minimum bactericidal concentration. (*): Concentrations ≥ 16 µg/mL were considered resistant (EUC, 2002). (**) Obligately heterofermentative. n.r – not required. Cut-off values adapted from EUC (2003), EFSA (2012), EUCAST (2021), and Gad et al. (2014), as shown in Table 2.
3.3. Lipase Production
Only the L. casei LAB 07 and L. plantarum LAB 01 strains exhibited lipolytic activity on enriched agar, despite the presence of other isolates belonging to the same species. Similar findings were reported by Ołdak et al. [50] and Guan et al. [51] for strains of these species. Lipases hydrolyze triacylglycerols, releasing free fatty acids that may contribute to the dairy industry, particularly to the development of flavor and aroma during cheese ripening [52,53].
3.4. Survival in the In Vitro Gastrointestinal System
To exert beneficial health effects, probiotics must reach the intestine at high concentrations and withstand the adverse conditions of the gastrointestinal tract [54]. As shown in Table 3, the tested LAB strains exhibited good tolerance to the simulated gastrointestinal system, maintaining counts above 7 log CFU/g even under low pH and in the presence of bile salts. This resistance is associated with mechanisms such as the presence of the F0F1-ATPase in Lactobacillaceae [55]. The observed reduction was below the critical threshold proposed by Hill et al. [56], who state that ≥6 log CFU/g of viable cells are required for probiotic effects. Moreover, rapid recovery after gastric stress is essential for intestinal viability [57].
Among the five L. casei strains evaluated, three (LAB 06, LAB 09, and LAB 10) maintained their cell counts without reduction (p > 0.05) during in vitro digestion, and none showed a decrease in survival rate. Among the L. plantarum strains, only LAB 03 maintained stable counts and high survival. L. plantarum LAB 01 exhibited a reduction (p < 0.05) under intestinal conditions, and LAB 02 showed a decrease at all simulated stages. L. brevis LAB 05 and P. acidilactici LAB 04 showed reductions (p < 0.05) after the gastric phase, but only L. brevis exhibited a drop in survival rate. Resistance to low pH and bile salts is a strain-dependent characteristic, enhanced when microorganisms are ingested with food matrices that provide physical protection, and can be further improved by the production of bile salt hydrolase (BSH) by some probiotics [58,59]. Ait Chait et al. [54] also observed strain-specific variation in L. brevis isolated from artisanal cheeses, with reductions below 1 log CFU/g. Margalho et al. [60] reported that L. plantarum and P. acidilactici strains isolated from ACC maintained 75–100% survival in 0.4% bile salts and at pH values between 2.5 and 3.5, conditions similar to those of the present study. According to the authors, approximately 25% of strains isolated from Brazilian artisanal cheeses exhibited bile salt resistance, influenced by the microbial isolation profile. Furthermore, the isolated strains naturally display greater tolerance to low pH due to the acidic nature of the ACC matrix from which they originate, as well as the production of organic acids by LAB, which requires increased tolerance for survival within the matrix. This contributes to their viability under gastric conditions and to the low losses observed during digestion [60].
Table 3.
Resistance of LAB strains to the stages of simulated in vitro digestion.
| Strains | LAB Count (Log UFC/g) | Survival Rate (%) | |||
|---|---|---|---|---|---|
| Initial | Stomach | Intestine | Stomach | Intestine | |
| L. plantarum LAB 01 | 8.53±0.02abA | 8.33±0.10aA | 7.65±0.10aB | 97.60±1.39abA | 89.69±1.01aB |
| L. plantarum LAB 02 | 8.65±0.03aA | 8.12±0.12abcB | 7.77±0.02aC | 93.87±1.03abA | 89.76±0.47aB |
| L. plantarum LAB 03 | 8.08±0.40abA | 8.10±0.14abcA | 7.69±0.55aA | 100.37±3.19aA | 95.12±2.13aA |
| P. acidilactici LAB 04 | 8.44±0.03abA | 7.46±0.12bcB | 7.14±0.09aB | 88.43±1.72bA | 84.63±1.38aA |
| L. brevis LAB 05 | 8.77±0.08aA | 8.31±0.11abB | 7.95±0.06aB | 94.73±0.30abA | 90.71±0.16aB |
| L. casei LAB 06 | 8.57±0.27abA | 8.06±0.31abcA | 7.58±0.07aA | 94.08±0.66abA | 88.53±1.90aA |
| L. casei LAB 07 | 8.49±0.13abA | 7.74±0.11abcB | 7.46±0.09aB | 91.22±2.70abA | 87.95±0.23aA |
| L. casei LAB 08 | 7.89±0.07bA | 7.36±0.02cB | 7.02±0.13aB | 93.22±1.14abA | 88.90±0.91aA |
| L. casei LAB 09 | 8.27±0.13abA | 7.90±0.43abcA | 7.45±0.39aA | 95.48±3.73abA | 90.20±6.19aA |
| L. casei LAB 10 | 8.32±0.29abA | 7.45±0.31cA | 7.37±0.28aA | 89.72±6.84abA | 88.76±6.39aA |
Results expressed as mean ± standard deviation. a–b Different lowercase letters indicate significant differences among strains within the same digestion stage (p < 0.05). A–C Different uppercase letters indicate significant differences among digestion stages for the same bacterial strain (p < 0.05). a–b Different lowercase letters indicate significant differences among strains in gastric or intestinal survival rate (p < 0.05). A–B Different uppercase letters indicate significant differences in gastric and intestinal survival rates for the same bacterial strain (p < 0.05).
3.5. Auto-Aggregation and Hydrophobicity Assay
Auto-aggregation is a prerequisite for probiotic selection, as it is related to gastrointestinal tract colonization and antagonism against pathogens [61]. All LAB strains analyzed showed good auto-aggregation indices after 24 hours, with emphasis on L. brevis LAB 05 and L. casei LAB 08 (Table 4), except for L. casei LAB 08, which showed no significant variation over time (p > 0.05). The findings are consistent with previous studies conducted on the same LAB species isolated from artisanal cheeses [54,62]. Factors influencing bacterial auto-aggregation include cell surface charge and composition, which may contain components released during autolysis, such as polysaccharides and extracellular DNA, as well as the presence of aggregation-promoting genes. Strains exhibiting aggregation rates above 50% frequently express this phenotype [62,63].
Cell surface hydrophobicity is associated with the adhesion of probiotic bacteria to the intestinal epithelium [60] and depends on components such as proteins, polysaccharides, and lipoteichoic acids [63]. In Table 4, the results showed high hydrophobicity levels, particularly for L. brevis LAB 05 and L. casei LAB 07. The strains L. plantarum LAB 01, LAB 02, and LAB 03 exhibited significant variations (p < 0.05), with values below 90%, while P. acidilactici LAB 04 presented the lowest index (< 50%). Among the L. casei isolates, three strains (LAB 06, LAB 07, and LAB 10) displayed hydrophobicity above 90%, a behavior also reported by Tuo et al. [64] and Ait Chait et al. [54]. According to Barzegar et al. [65] and Guan et al. [51], these results reflect the strain-specific composition of the cell wall, which may include intercalated proteins, hydrophobic amino acids, lipids, and other factors such as the bacterial growth phase, all of which can influence hydrophobicity.
3.6. Survival of LAB After Spray-Drying and During Shelf-Life
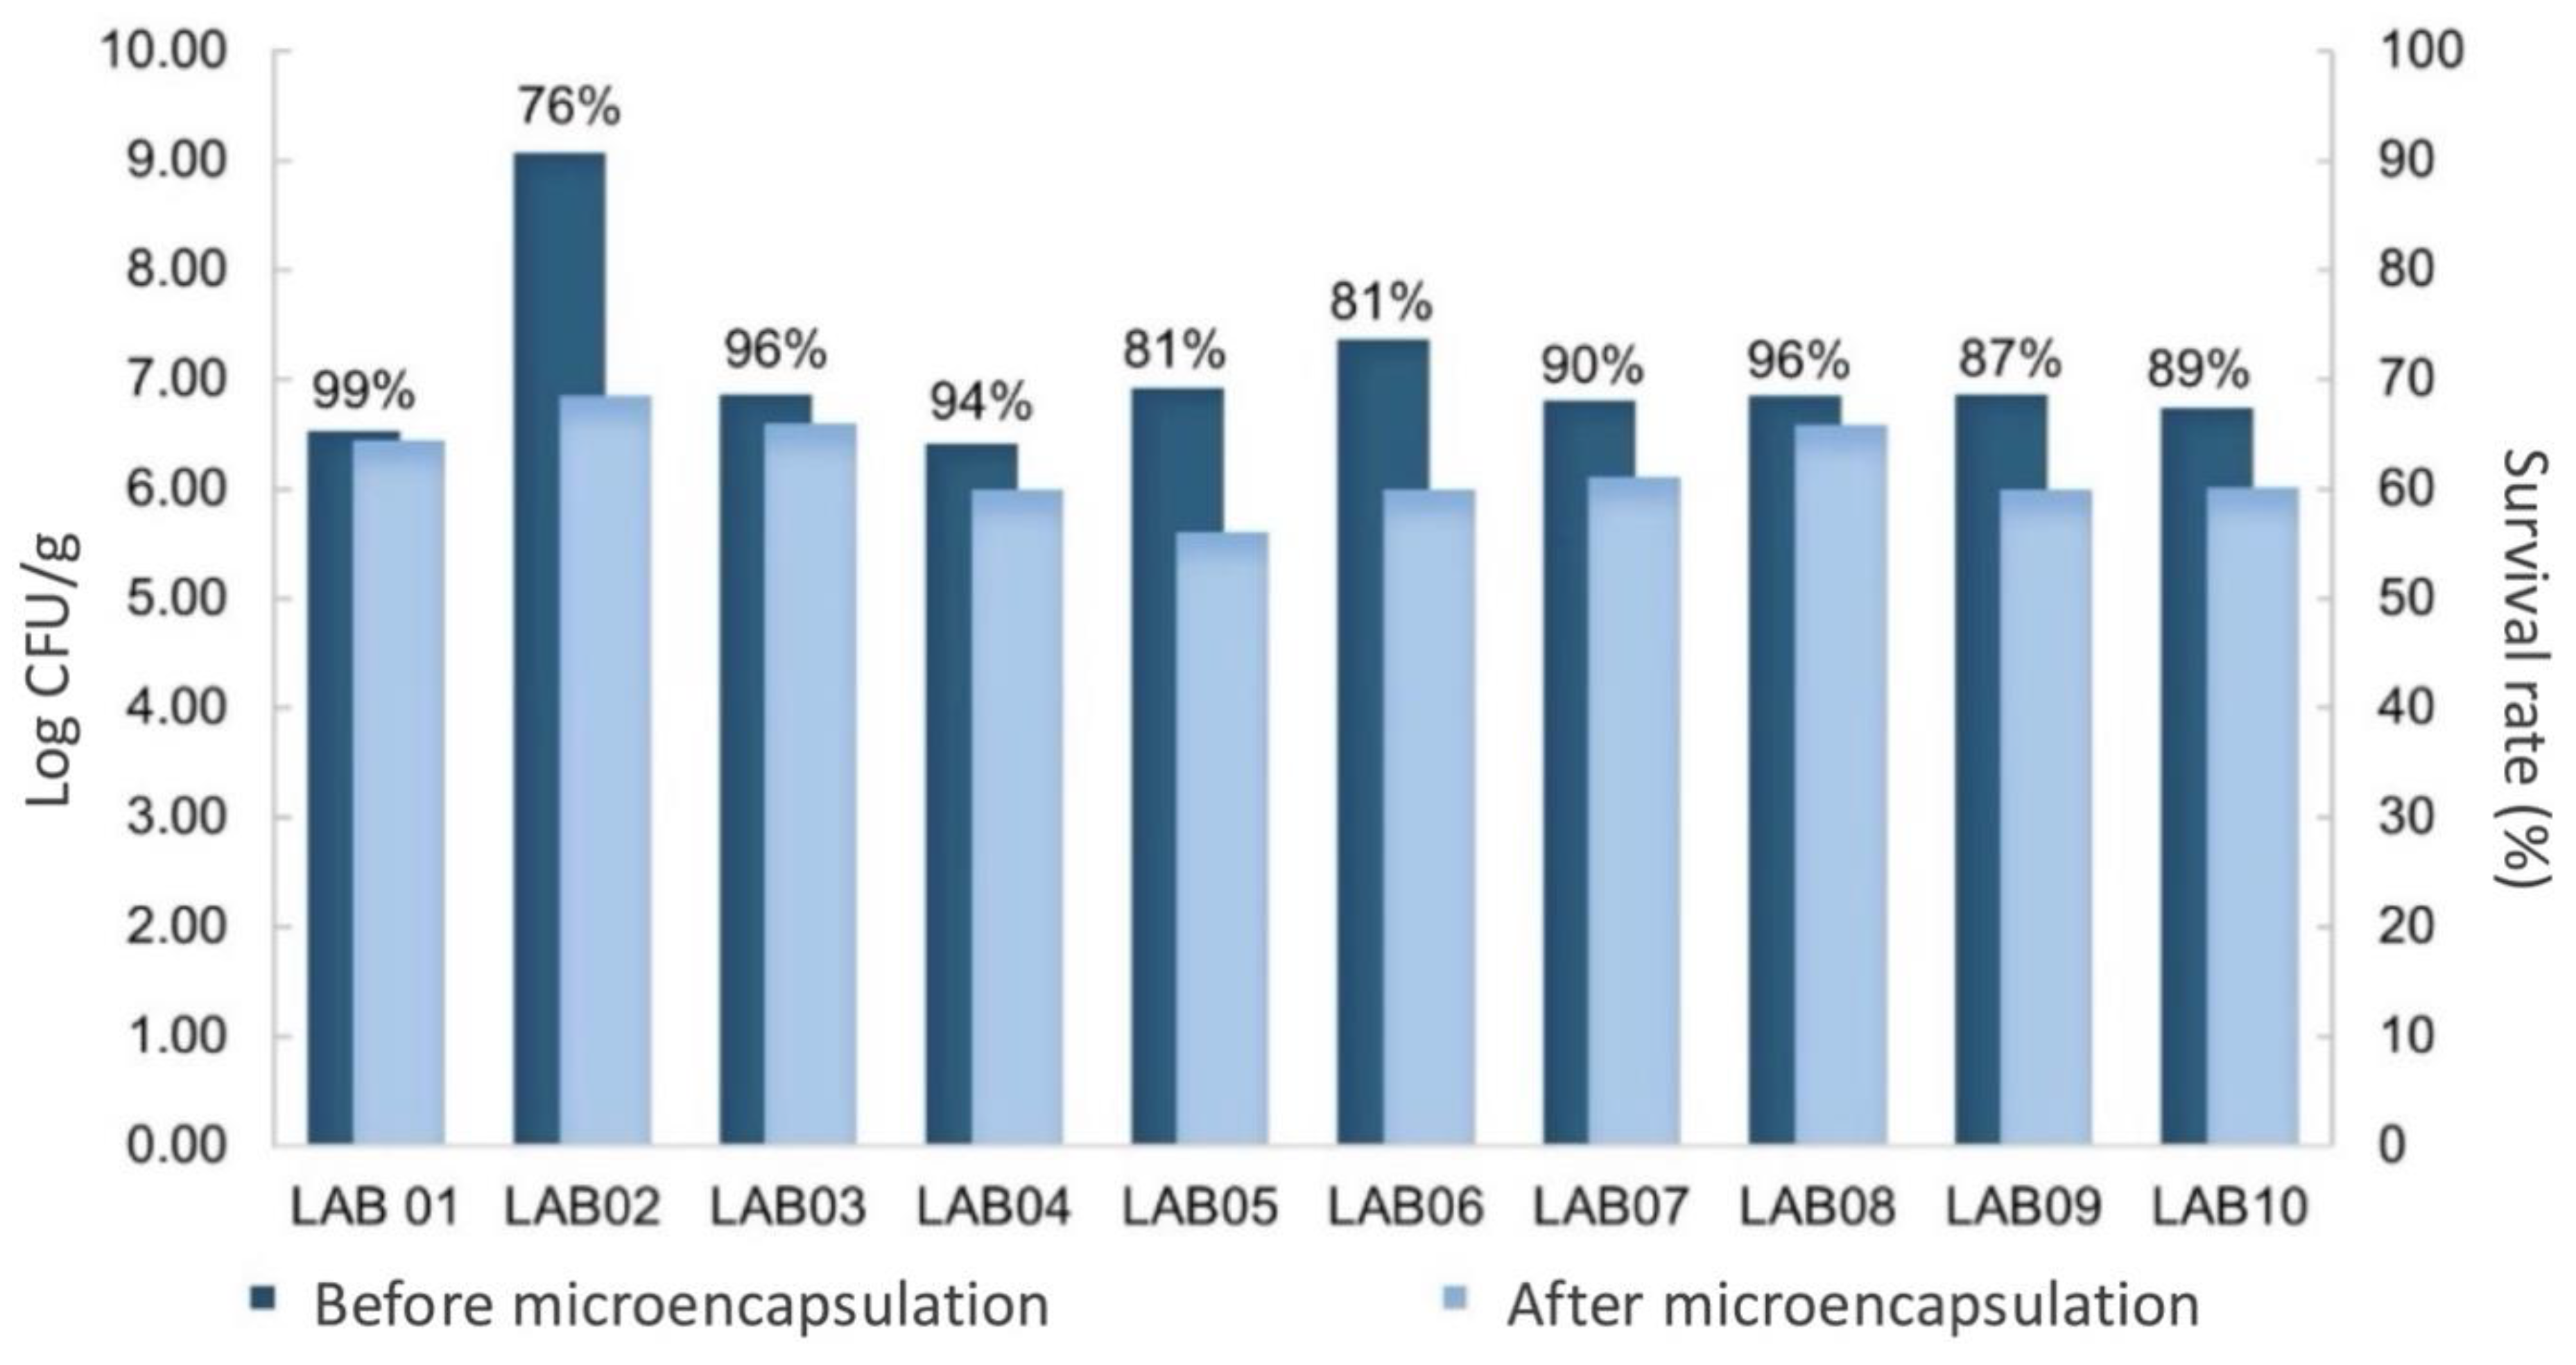
The survival rate of the microencapsulated strains obtained by spray-drying ranged from 76% to 99% (Figure 2). After the drying process, the average water activity (aw) of the powders was 0.27, while the mean moisture content was 4.59%, values indicative of good stability for storage. Most strains maintained viable counts above 6 log CFU/g and were therefore considered capable of providing potential health benefits [11,66]. The only exception was strain L. brevis LAB05, which showed counts of 5.41 log CFU/g. Strains L. plantarum LAB02, L. brevis LAB05, and L. casei LAB10 exhibited greater sensitivity to the microencapsulation process, showing reductions in viability (p < 0.05), with losses of up to 2 log CFU/g. These findings indicate that these strains were more affected by the thermal and mechanical conditions of spray drying, possibly compromising cell integrity and resulting in lower survival rates compared with the other strains evaluated.
After microencapsulation by spray drying, the L. plantarum strains (LAB 01, 02, and 03) maintained viable counts above 6 log CFU/g for up to 45 days when stored at 4 °C. However, the viability of strains L. plantarum LAB 01, 02, and 03 stored at 25 °C decreased by more than 1 log CFU/g after 45 days of storage, as shown in Figure 3A. This behavior is consistent with the findings of Verruck et al. [67], who reported a reduction in viable cell counts of Bifidobacterium BB-12 at 25 °C. This decline may be attributed to the degradation of essential macromolecules, such as proteins and membrane lipids, a process that is exacerbated at higher temperatures, as suggested by Ananta et al. [68].
The P. acidilactici strain (LAB04) showed a significant (p < 0.05) loss of viability when stored at both 4 °C and 25 °C (Figure 3B). After 30 days of storage at 4 °C, viable counts dropped below 6 log CFU/g, reaching 4.95 log CFU/g, a value considered insufficient to ensure potential health benefits. After 60 days of storage at 4 °C, the strain was no longer detected. When stored at 25 °C, the decrease in viability was even more pronounced, with counts falling to 5 log CFU/g after 15 days and becoming undetectable after 60 days of storage. These results demonstrate that P. acidilactici LAB04 microcapsules were sensitive to temperature variations and particularly vulnerable under non-refrigerated storage conditions.
Figure 2.
Survival rate of LAB strains L. plantarum (LAB 01, 02, and 03), P. acidilactici (LAB 04), L. brevis (LAB 05), and L. casei (LAB 06, 07, 08, 09, and 10) before and after the microencapsulation process by spray drying.
Figure 2.
Survival rate of LAB strains L. plantarum (LAB 01, 02, and 03), P. acidilactici (LAB 04), L. brevis (LAB 05), and L. casei (LAB 06, 07, 08, 09, and 10) before and after the microencapsulation process by spray drying.
The L. brevis strain (LAB05) proved to be highly sensitive to the microencapsulation process by spray drying, showing viable counts below 6 log CFU/g (5.41 log CFU/g) immediately after encapsulation (Figure 3C). These results suggest that the thermal and mechanical conditions of the process severely affected the cellular integrity of the strain, compromising its viability from the beginning of the storage period.
Figure 3.
Survival of probiotic microparticles during 60 days of storage at 4 °C and 25 °C, where (A): microparticles containing L. plantarum (LAB 01, 02, and 03), (B): P. acidilactici (LAB 04), (C): L. brevis (LAB 05), and (D): L. casei (LAB 06, 07, 08, 09, and 10). Error bars represent the standard deviation of the experimental mean.
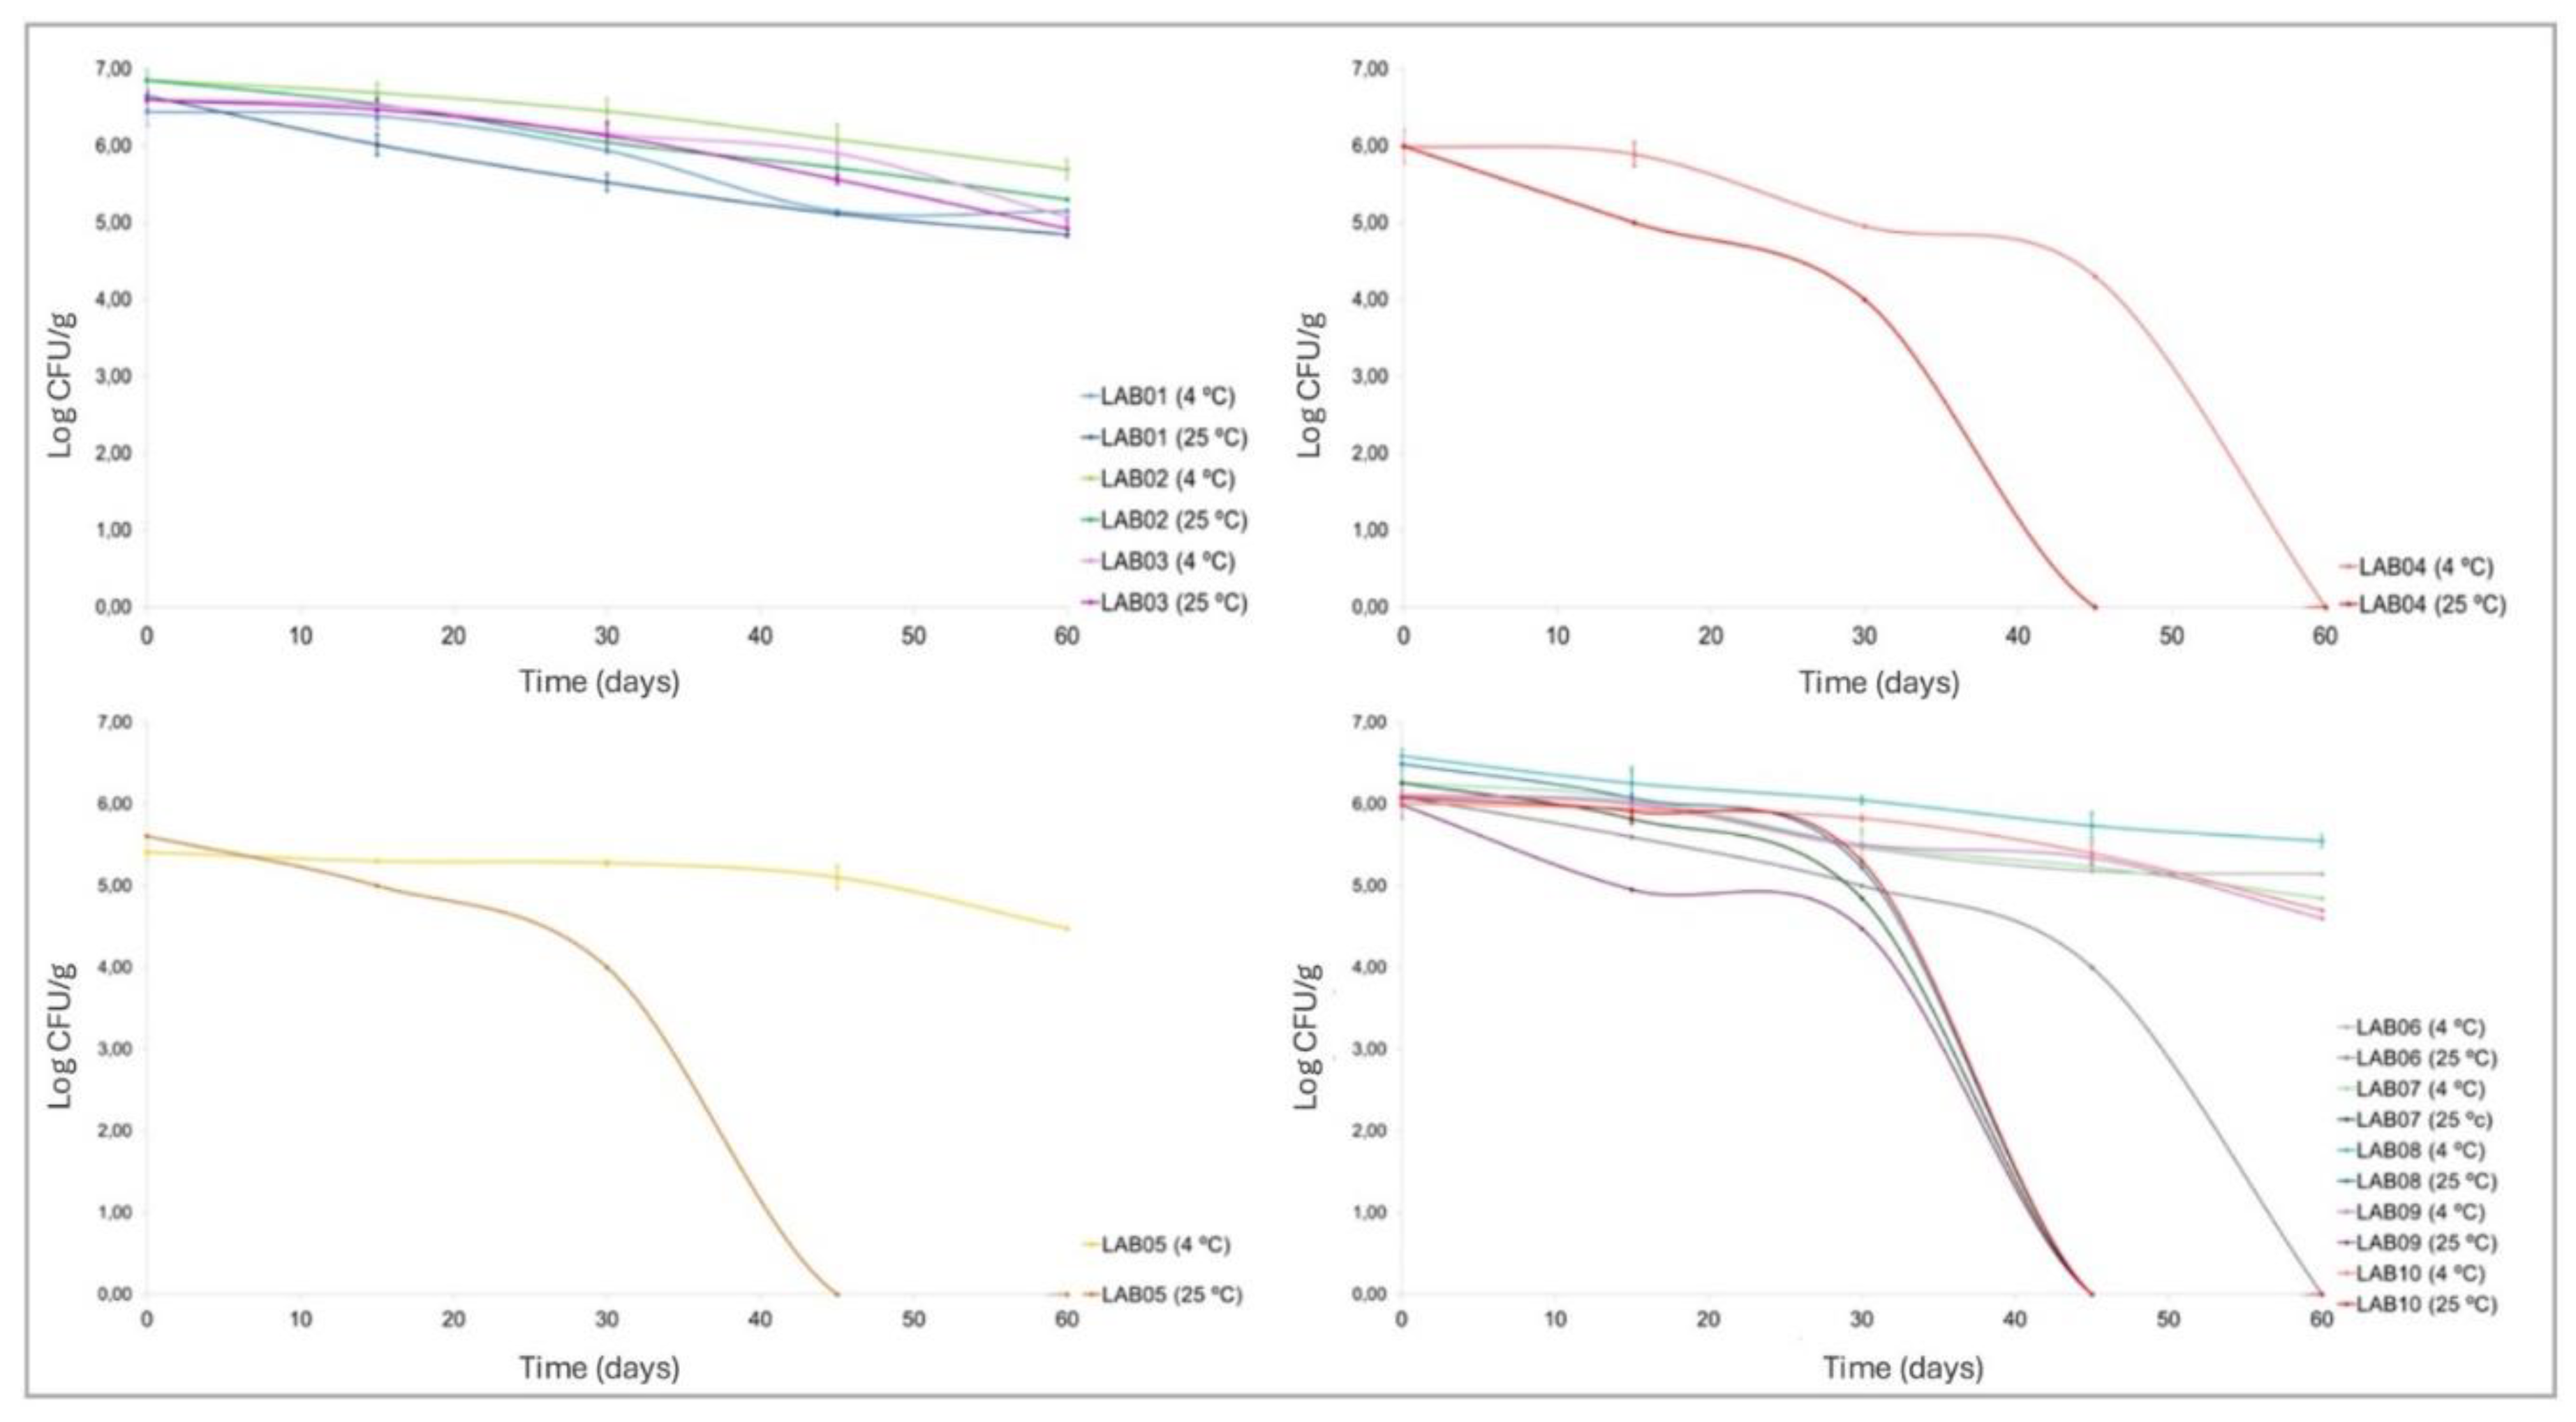
The L. casei strains (LAB 06, LAB 07, LAB 08, LAB 09, and LAB 10) exhibited similar behavior when stored at 4 °C (Figure 3, panel D). After 15 days of storage under this condition, all strains maintained viable cell counts above 6 log CFU/g. However, from this point onward, a gradual decline in viable cell counts was observed over time. Strain L. casei LAB 08 stood out by maintaining viable counts above 6 log CFU/g up to 30 days of storage at 4 °C, demonstrating greater stability compared to the other strains. On the other hand, when stored at 25 °C, a rapid reduction in viability was observed, with viable cell counts falling below 6 log CFU/g after just 15 days of storage. After 45 days at 25 °C, the strains showed counts close to zero, indicating a significant (p < 0.05) loss of viability. These findings demonstrate that although microencapsulation provides some initial protection, storage at room temperature (25 °C) compromises the viability of L. casei strains, making this condition unsuitable for their long-term preservation.
The results of this study support the hypothesis that low-temperature storage (4 °C) reduces chemical interactions and reactions that lead to cellular degradation, as suggested by [69]. The higher viability observed in the strains stored at 4 °C confirms that lower temperatures help preserve the cellular integrity of probiotics by limiting reactions that may compromise their viability. This behavior reinforces the importance of refrigerated storage for maintaining the effectiveness of encapsulated probiotics, ensuring that they reach the final consumer in adequate amounts to provide the expected health benefits.
Moreover, several factors directly influence probiotic viability during spray drying and subsequent storage, as highlighted by Sharma et al. [70]. These factors include the airflow rate, degree of dehydration, inlet and outlet temperatures during the drying process, the probiotic concentration in the initial suspension, the carrier materials used, and thermal, osmotic, and oxidative stresses, as well as packaging conditions. When combined with the specific characteristics of each strain, the growth conditions, and the developmental stage of the microorganisms, these elements play a crucial role in determining the extent of inactivation or the maintenance of probiotic viability.
3.7. Morphology and Size of LAB-Containing Microparticles
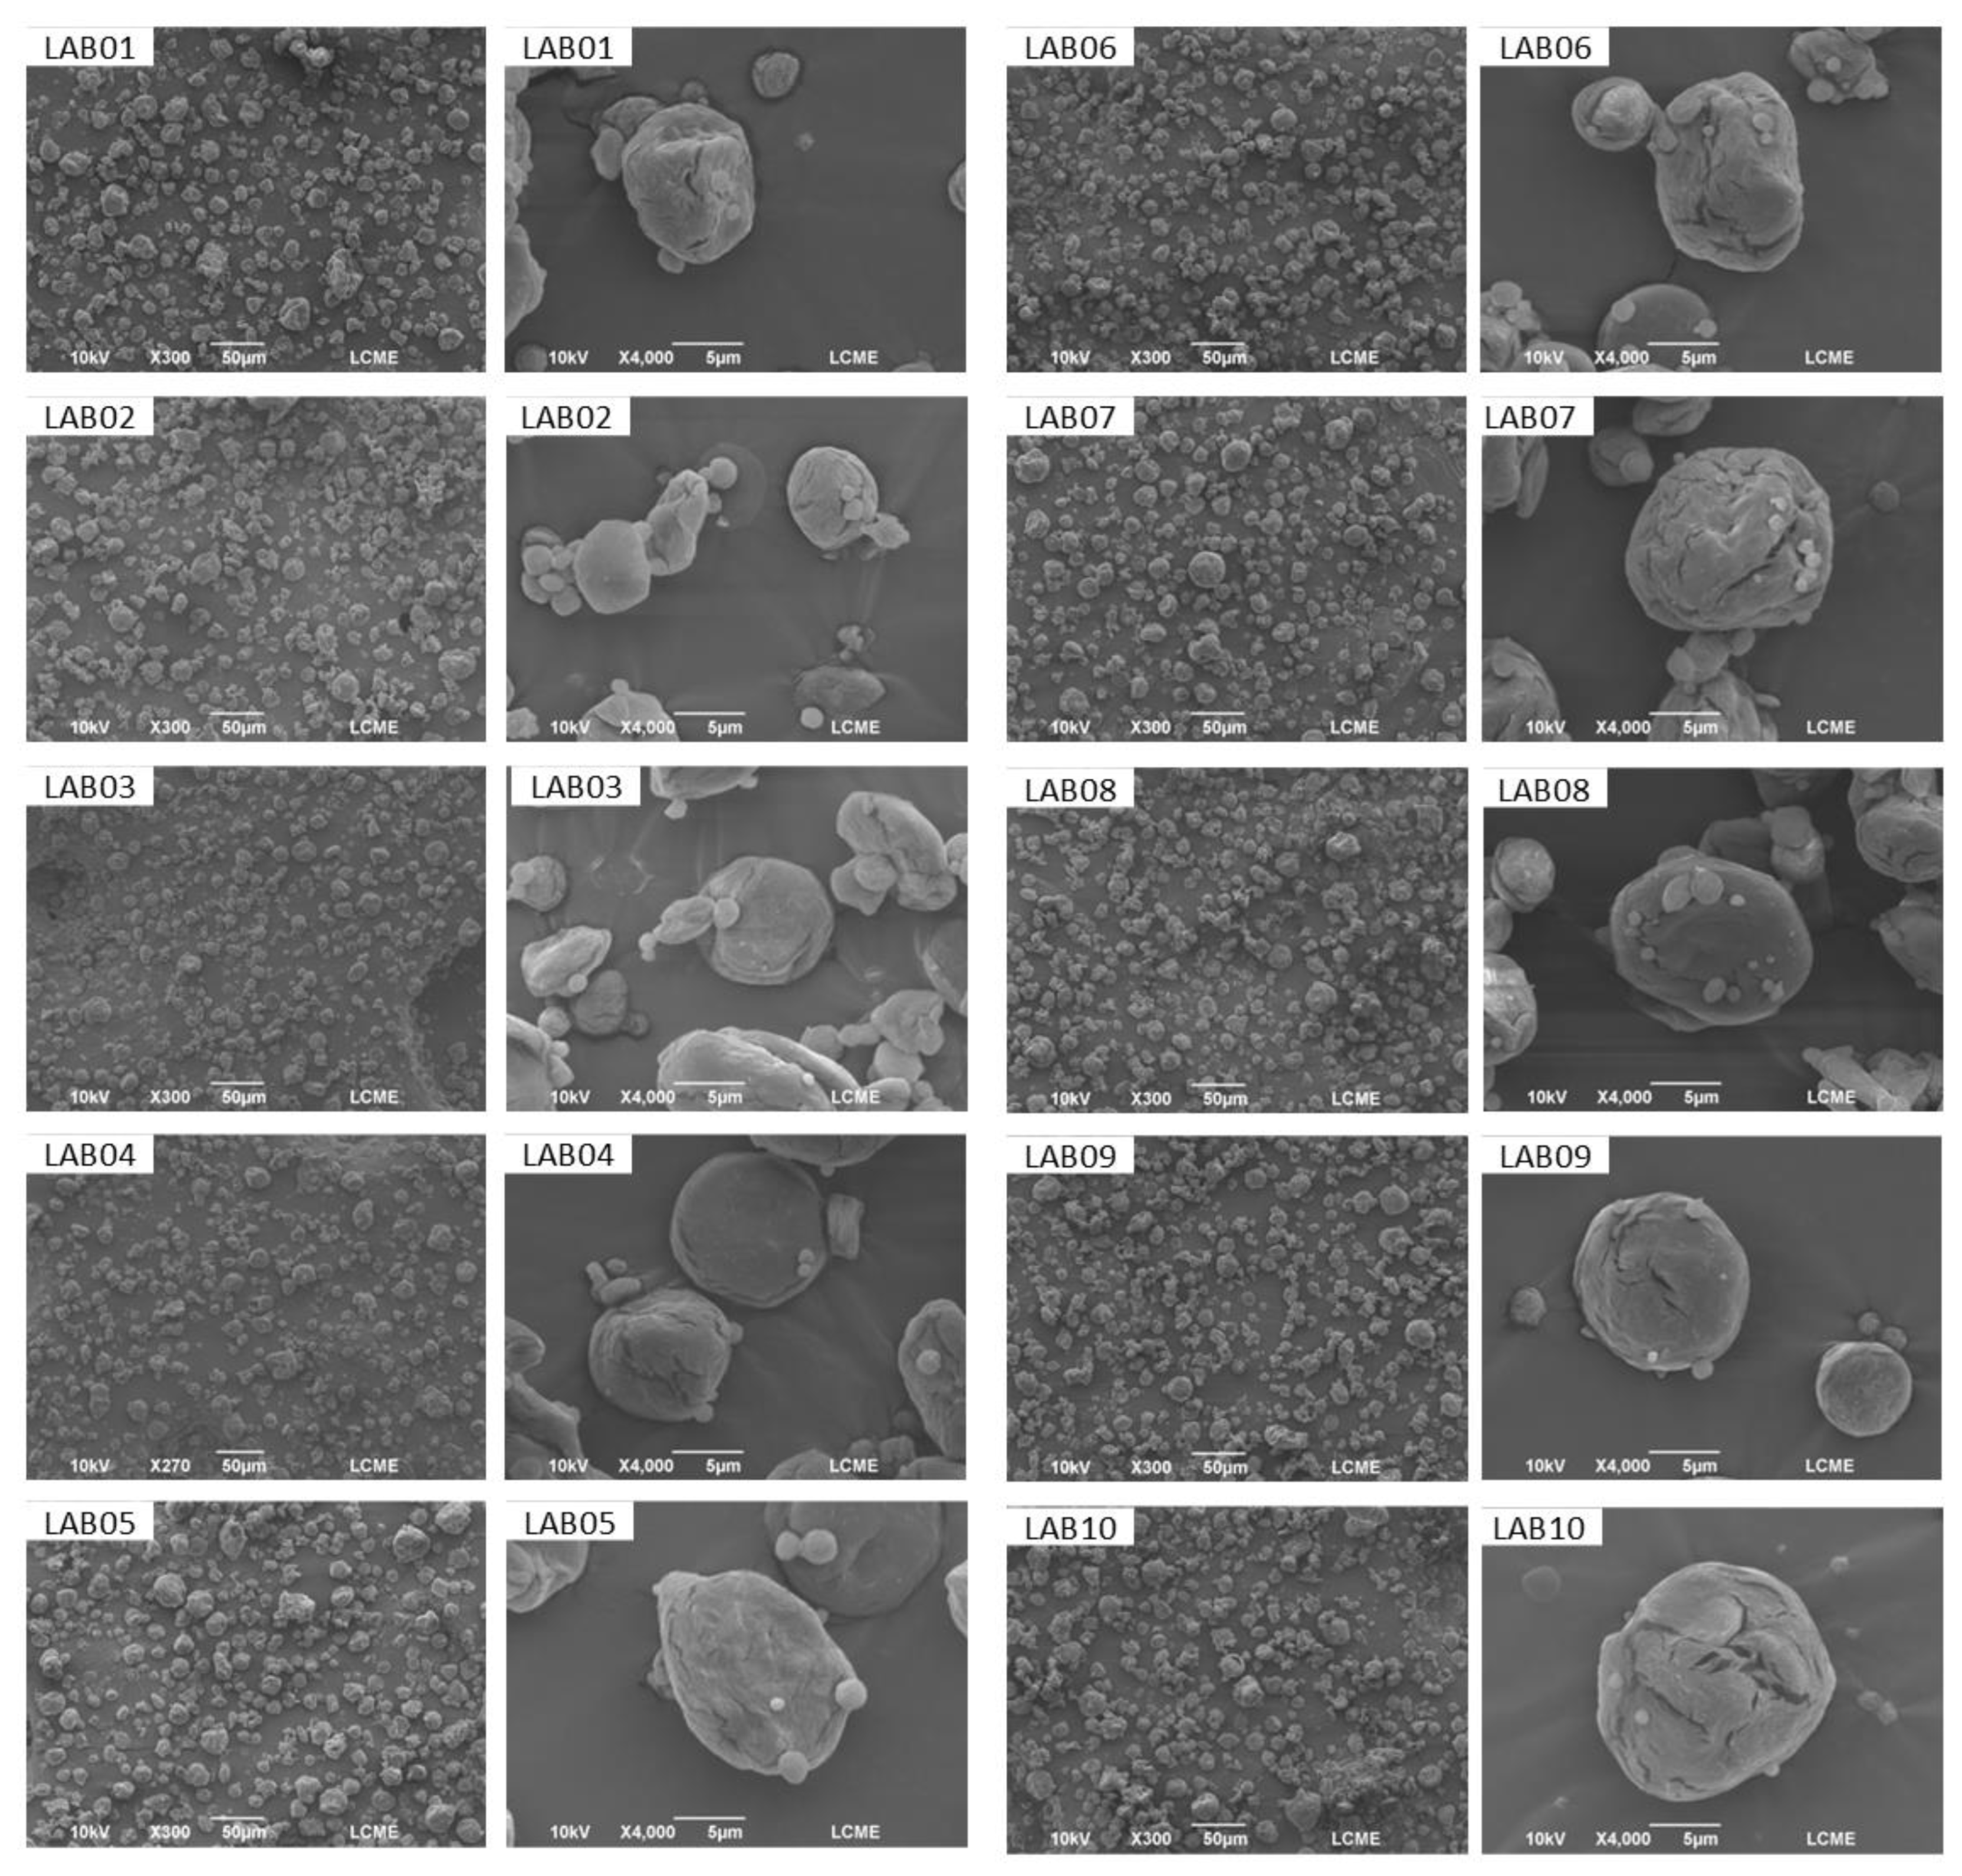
The SEM micrographs of the microparticles containing the isolates L. plantarum (LAB 01–03), P. acidilactici (LAB 04), L. brevis (LAB 05), and L. casei (LAB 06–10), encapsulated with inulin, revealed predominantly spherical particles featuring fissures and irregular shapes (Figure 4). Similar patterns were reported by Verruck et al. [67], attributed to the slow formation of the crust during spray drying, which induces surface stresses and leads to cracking [71]. Nevertheless, these fissures did not compromise the structural integrity of the microparticles, indicating effective protection of the probiotic cells. The absence of typical bacillus or coccus structures further confirms the efficiency of the encapsulation. However, such fissures may facilitate cellular oxidation, potentially affecting viability during storage [67].
The microparticles exhibited sizes ranging from 1.19 to 5.71 µm, with no significant differences (p < 0.05) among the encapsulated strains. Particle size can be influenced by factors such as solution viscosity, atomization parameters, feed rate, and air temperature [72]. More viscous solutions tend to produce larger droplets, resulting in larger particles after drying. To avoid this effect, the solution was kept under continuous stirring until atomization, ensuring homogeneity. The small particle sizes obtained (< 40 µm) favor dispersion in food matrices, contributing to improved texture and sensory acceptance [70,73].
Figure 4.
Scanning electron microscopy (SEM) micrographs of microcapsules containing L. plantarum (LAB 01, 02, and 03), P. acidilactici (LAB 04), L. brevis (LAB 05), and L. casei (LAB 06, 07, 08, 09, and 10) encapsulated with inulin, at magnifications ranging from 300× to 4000×.
Figure 4.
Scanning electron microscopy (SEM) micrographs of microcapsules containing L. plantarum (LAB 01, 02, and 03), P. acidilactici (LAB 04), L. brevis (LAB 05), and L. casei (LAB 06, 07, 08, 09, and 10) encapsulated with inulin, at magnifications ranging from 300× to 4000×.
3.8. Interaction Between Microcapsule Components by FTIR
Figure 5 presents the FTIR spectra of the microcapsules containing different probiotic strains, as well as pure inulin. Inulin exhibited characteristic polysaccharide bands, most notably a broad and intense band at 3380 cm-1, attributed to O–H stretching (hydroxyl groups), associated with the presence of hydroxyl groups and hydrogen-bond formation. This band is also sensitive to moisture, as indicated by the peak at 1645 cm-1, which corresponds to the bending vibration of H₂O molecules and reflects the hygroscopic nature of long-chain inulins [74,75,76].
Other relevant bands include the signal at 2930 cm-1, corresponding to C–H stretching (alkyl groups), as well as two distinct bands at 1135 and 1030 cm-1. These are attributed to C–O stretching (alcohol group) and asymmetric C–O–C stretching (ether group), respectively, both associated with the saccharide backbone of inulin [76]. The peak at 935 cm-1, related to out-of-plane deformation of the –CH₂ group (methylene group), was also identified and is considered a spectral signature specific to inulin [74,76,77].
Figure 5.
FTIR spectra (4000–550 cm-1) of inulin and inulin-based microencapsulated probiotic strains obtained by spray drying: L. plantarum (LAB 01, 02, and 03), P. acidilactici (LAB 04), L. brevis (LAB 05), and L. casei (LAB 06, 07, 08, 09, and 10).
Figure 5.
FTIR spectra (4000–550 cm-1) of inulin and inulin-based microencapsulated probiotic strains obtained by spray drying: L. plantarum (LAB 01, 02, and 03), P. acidilactici (LAB 04), L. brevis (LAB 05), and L. casei (LAB 06, 07, 08, 09, and 10).
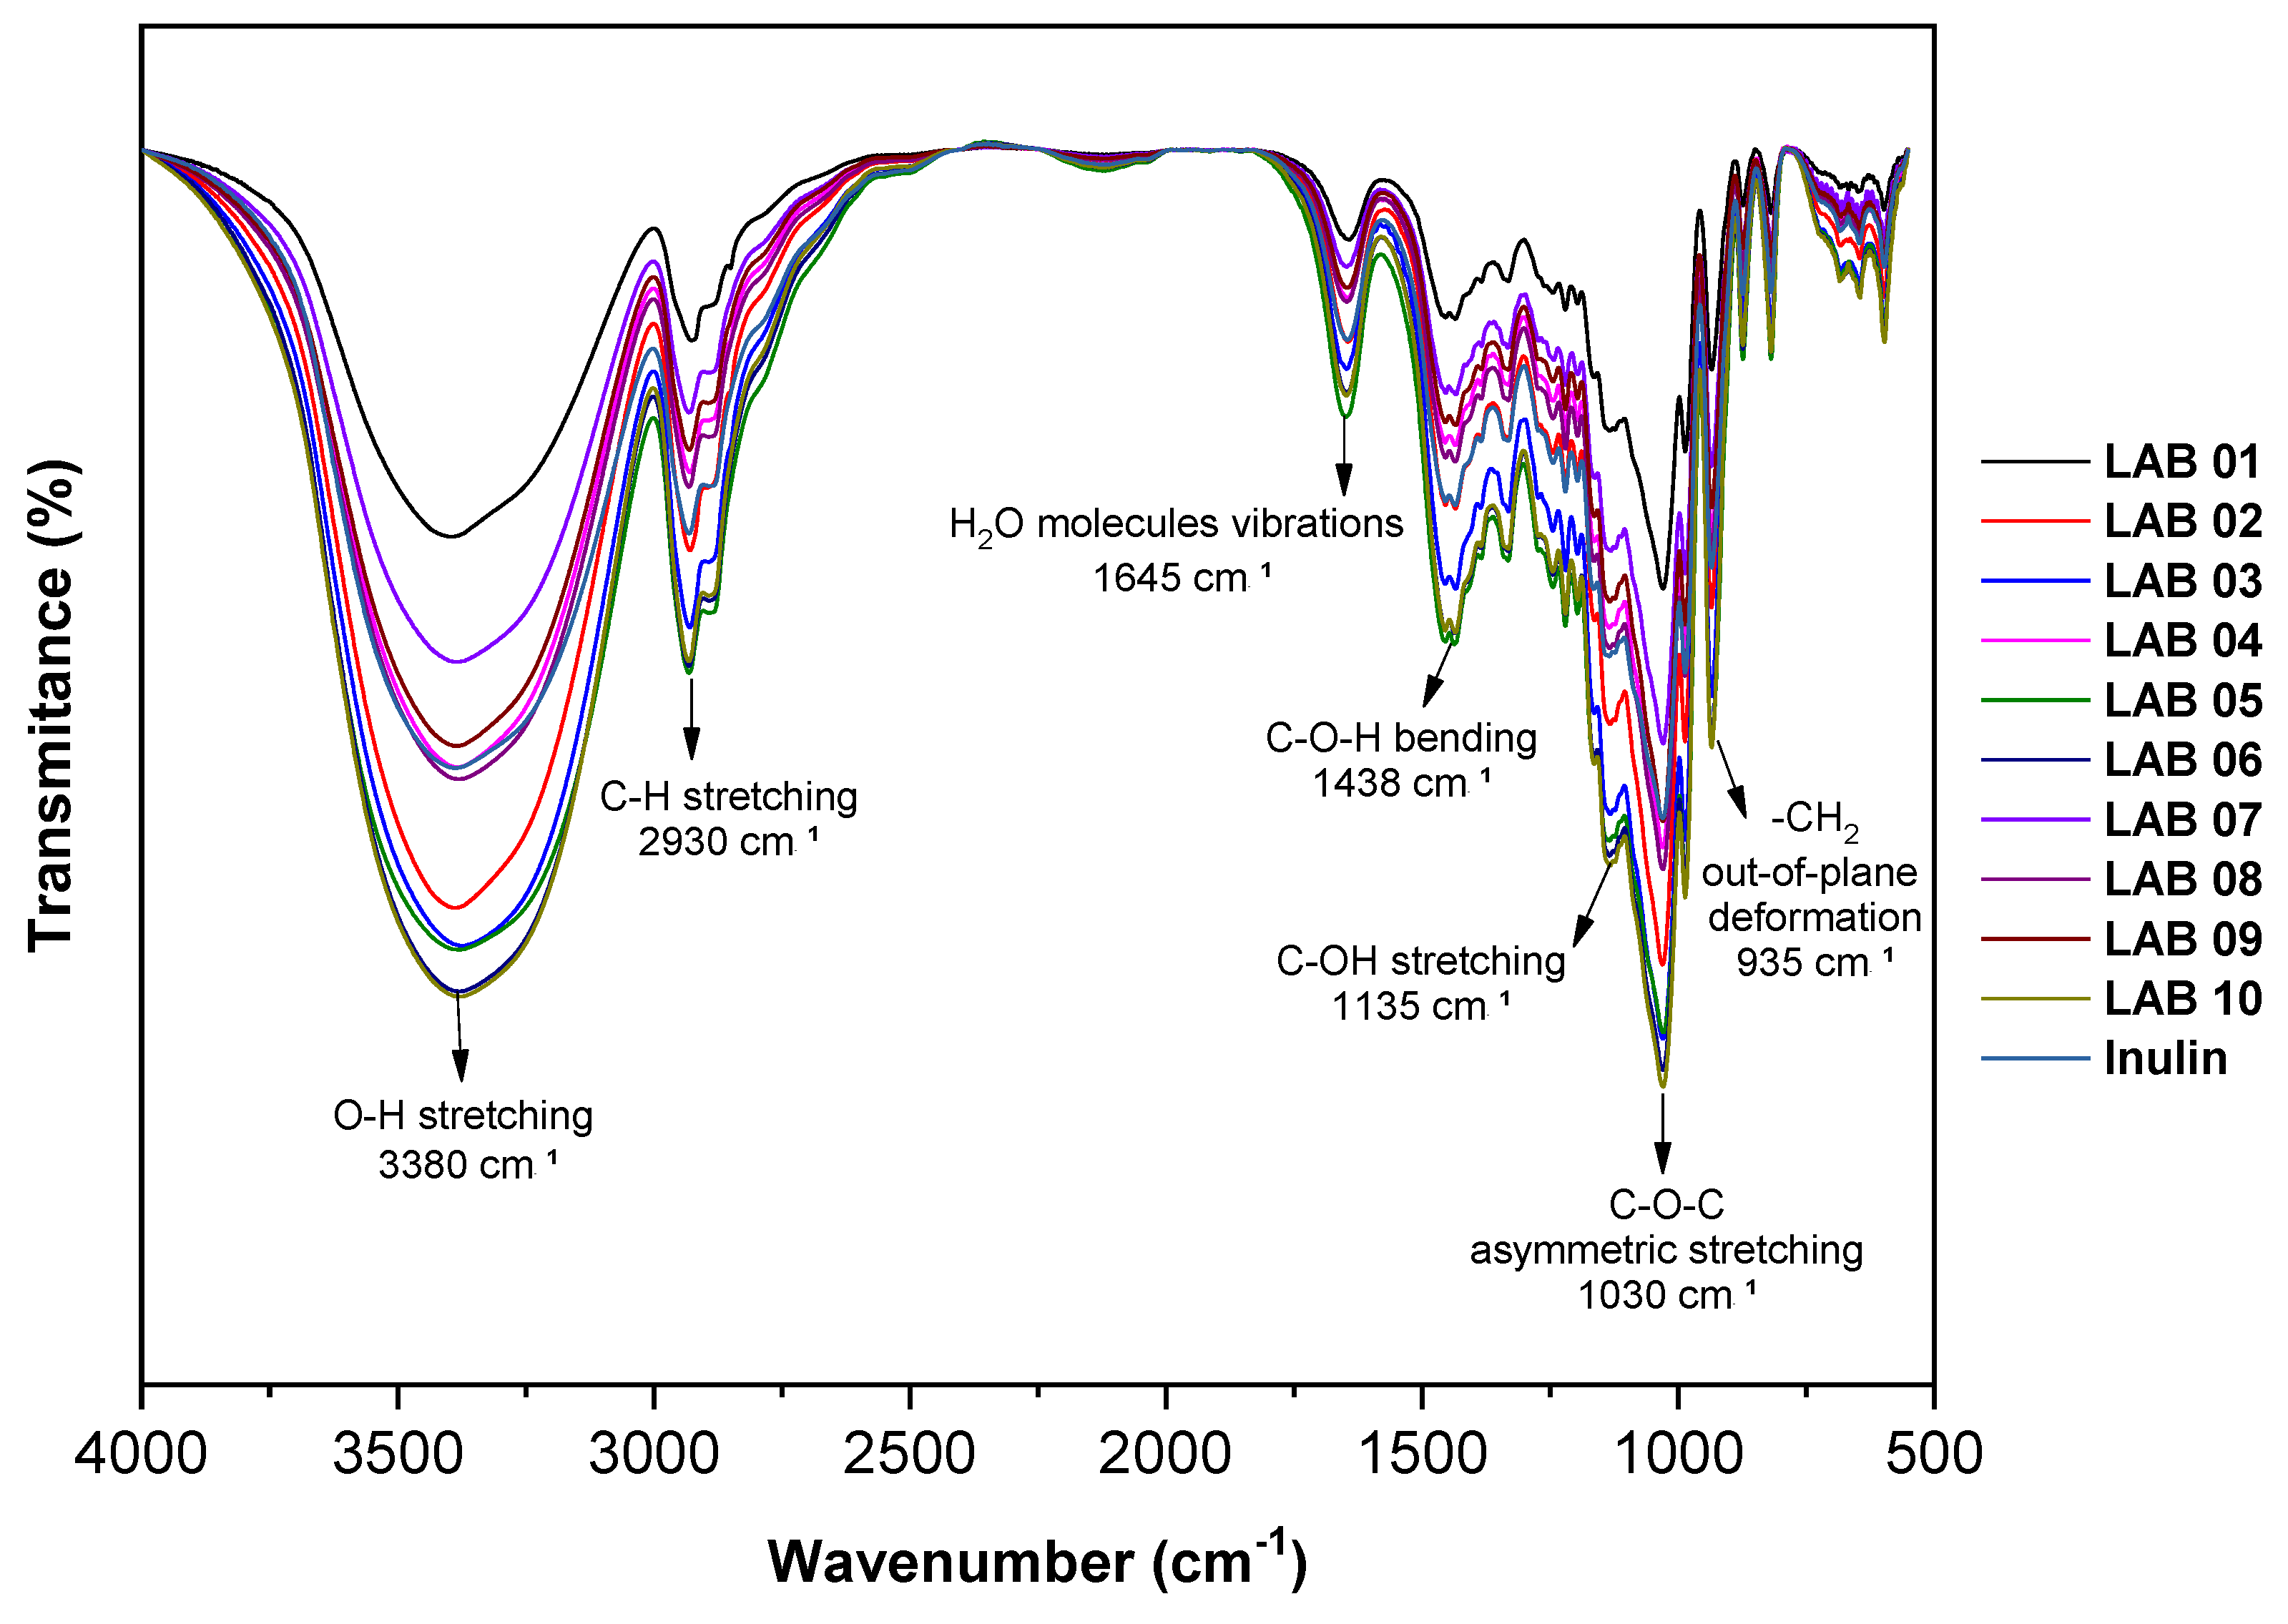
In the microencapsulated samples, the main inulin bands were preserved, indicating that its chemical structure remained intact after the encapsulation process. However, subtle changes in band intensity and slight spectral shifts were observed, particularly in the regions corresponding to O–H vibrations (3380 cm-1), C–O stretching (1030 cm-1), and –CH₂ deformation (935 cm-1). These shifts suggest modifications in the chemical environment of the matrix. Such changes are consistent with the formation of interactions, predominantly hydrogen bonding, between inulin hydroxyl groups and cellular components of the encapsulated probiotic strains, such as membrane polypeptides and exopolysaccharides, reflecting the effective incorporation of microbial biomass into the polymeric matrix during spray-drying microencapsulation. This behavior aligns with the literature, which associates the broadening of the 1030 cm-1 band with the overlap of saccharide backbone signals and new hydrophilic interactions between matrix constituents and the encapsulated materials [74,78]. Although small variations were observed around 1650 cm-1, no defined bands associated with Amide I (1650 cm-1) or Amide II (1540 cm-1) were detected, suggesting that the amount of encapsulated cellular proteins was below the FTIR detection limit under the experimental conditions used.
3.9. X-Ray Diffraction Analysis
Figure 6 shows the X-ray diffraction patterns of pure inulin and the microcapsules obtained with the different probiotic strains. Pure inulin displayed characteristic and well-defined diffraction peaks, mainly within the 20 range of 10° to 30°, with notable signals at 2θ = 12.2°, 16.4°, 17.7°, 18.8°, 21.3°, 24.5°, and 27.7°, indicating a semicrystalline structural nature [77,79]. The microencapsulated samples (L. plantarum LAB01 to L. casei LAB10) retained the typical diffraction peaks of inulin, although with reduced intensities and, in some cases, peak broadening. These modifications may be attributed to the interference of microbial biomass in the crystalline organization of the inulin matrix, molecular interactions between the polysaccharides and the cell wall components of the strains, or physical effects associated with the encapsulation technique used [78,80].
Differences in the X-ray diffraction profiles between the microencapsulated samples and pure inulin support the visual observation of reduced peak sharpness and intensity associated with the crystalline phase. This attenuation suggests a decrease in the structural order of the matrix after encapsulation [81]. The LAB08 sample stood out by exhibiting more smoothed signals, which may indicate stronger interactions between the L. casei strain and the polymeric matrix, or a more pronounced disruption of the crystalline network during processing. Conversely, L. casei LAB10 displayed a diffraction pattern more similar to that of pure inulin, suggesting a lower structural impact from the strain or greater compatibility with the matrix.
Figure 6.
X-ray diffraction (XRD) patterns of probiotic strains microencapsulated with inulin by spray drying: L. plantarum (LAB 01, 02, and 03), P. acidilactici (LAB 04), L. brevis (LAB 05), and L. casei (LAB 06, 07, 08, 09, and 10), along with the diffraction pattern of pure inulin.
Figure 6.
X-ray diffraction (XRD) patterns of probiotic strains microencapsulated with inulin by spray drying: L. plantarum (LAB 01, 02, and 03), P. acidilactici (LAB 04), L. brevis (LAB 05), and L. casei (LAB 06, 07, 08, 09, and 10), along with the diffraction pattern of pure inulin.
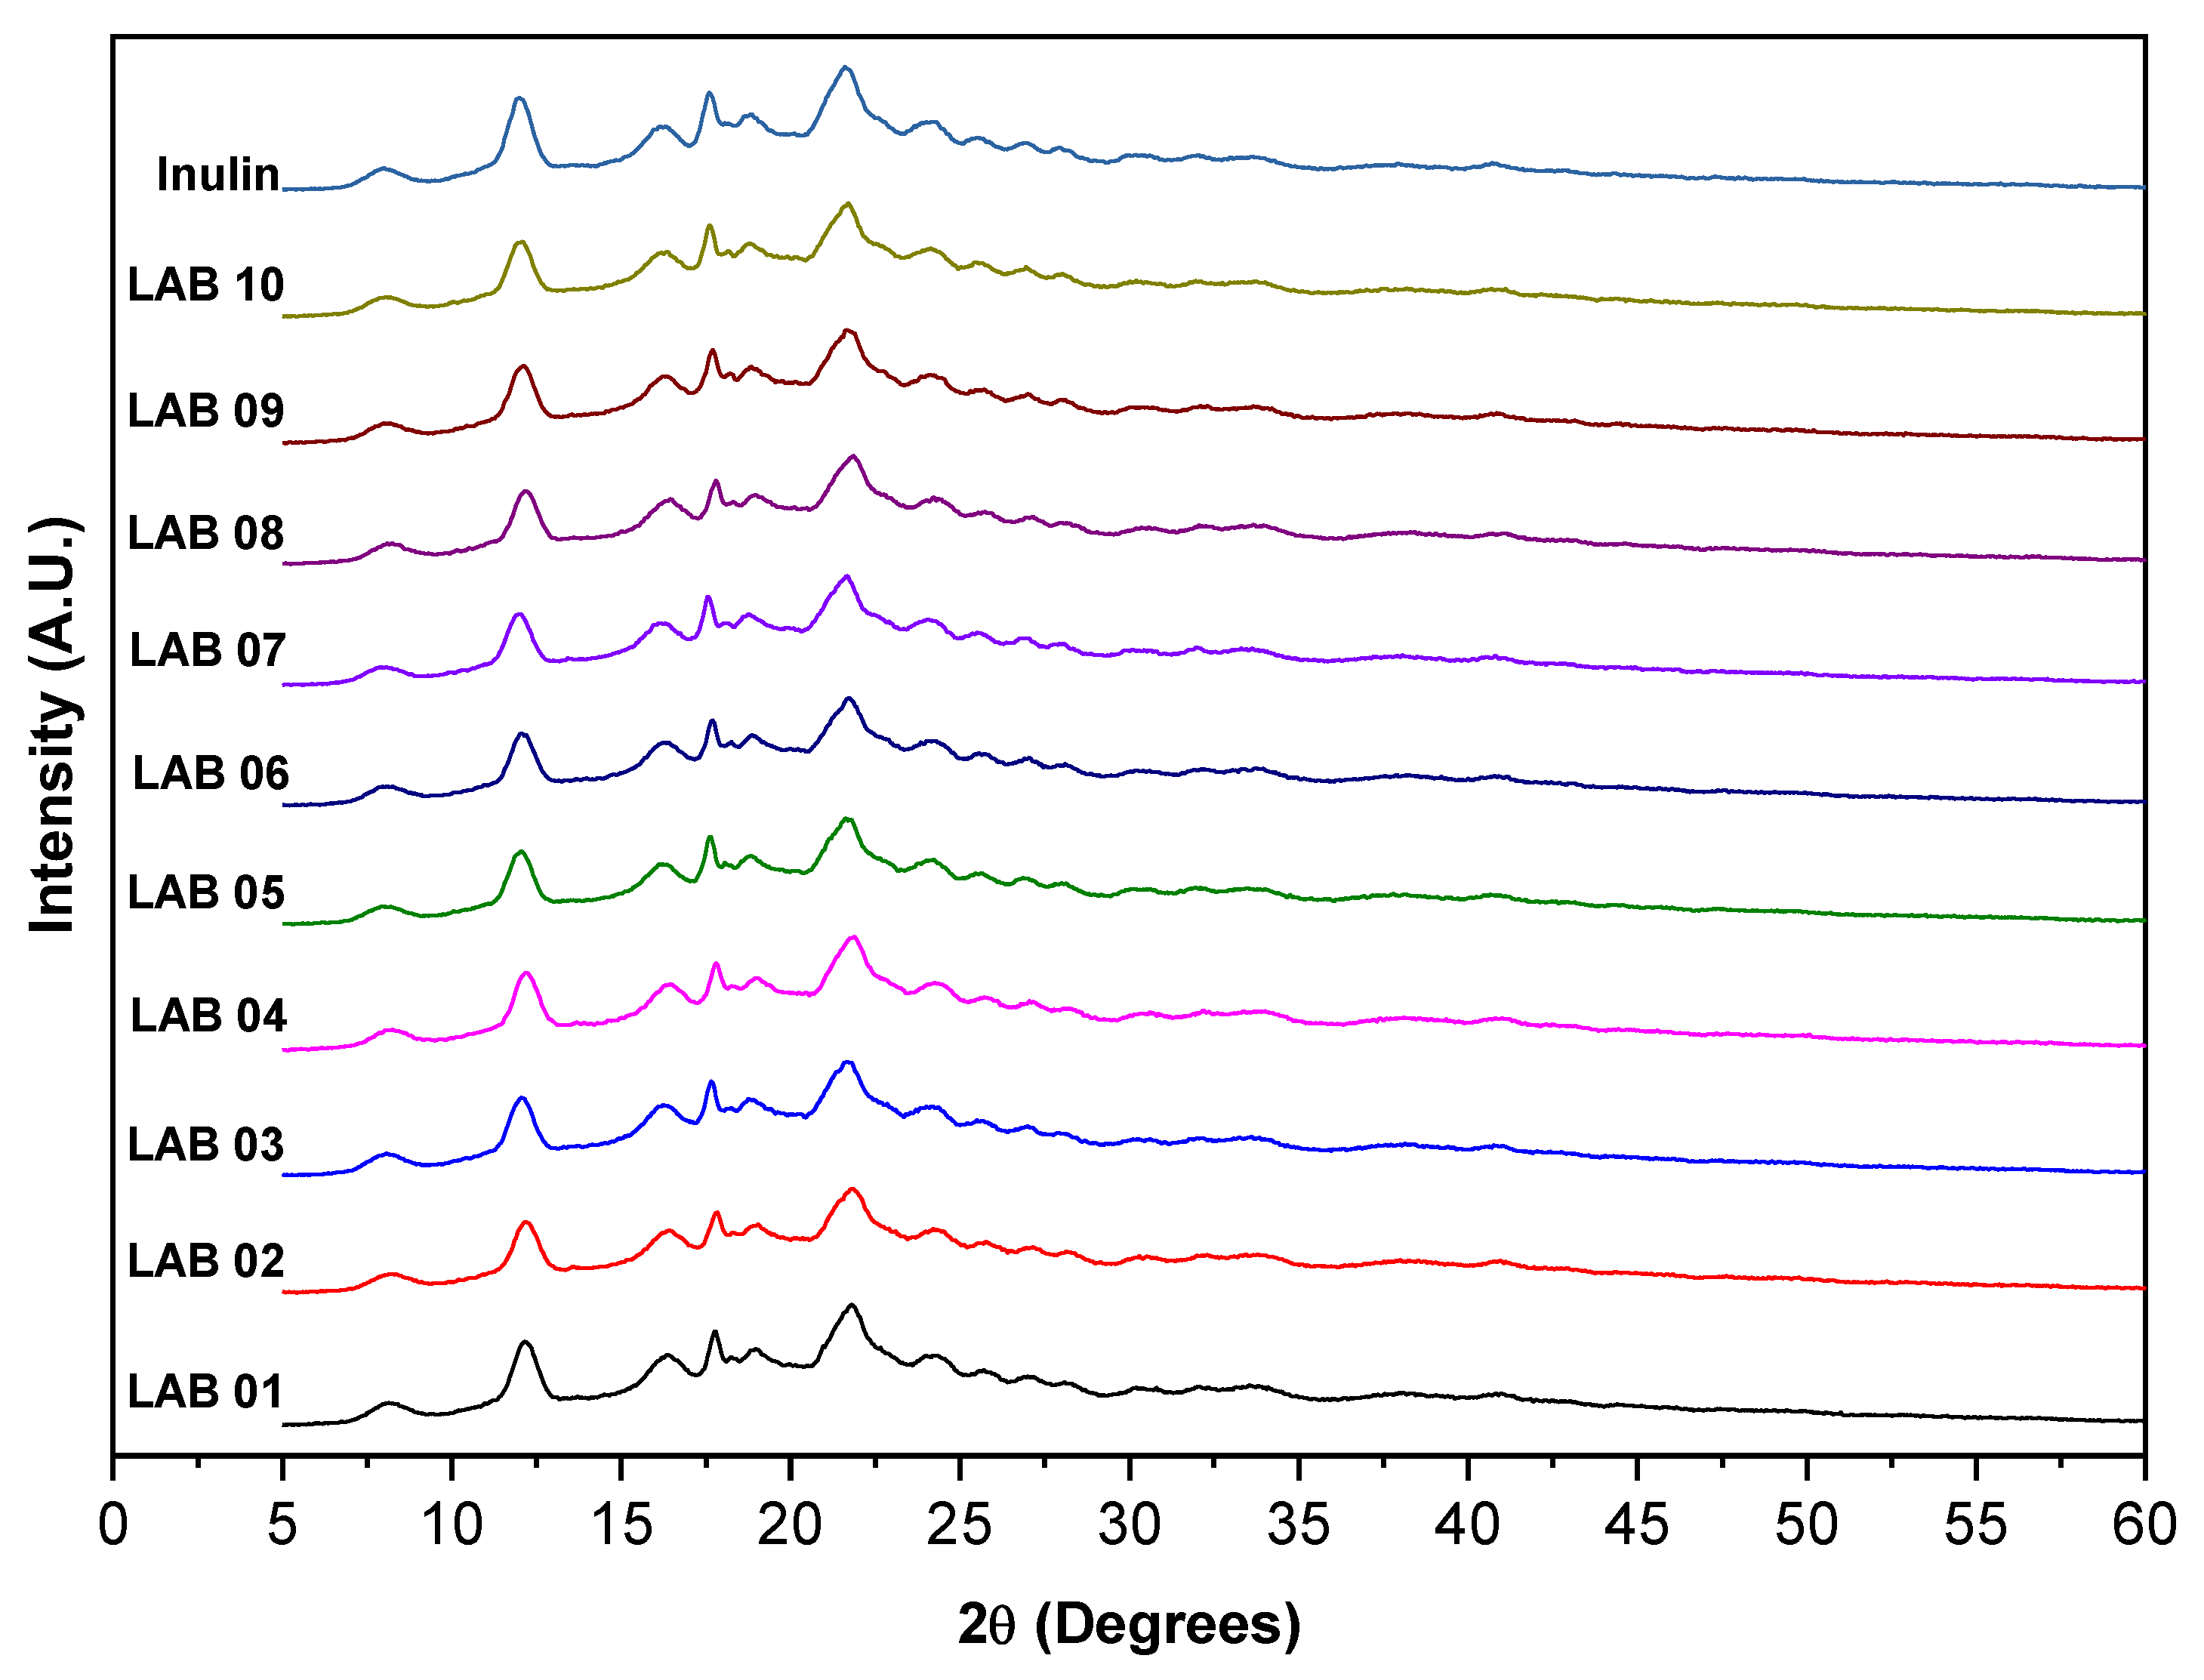
Overall, the results indicate that the inulin matrix retains part of its semicrystalline structure even after encapsulation, which may be technically advantageous. Semicrystalline structures tend to provide enhanced protection to probiotic cells and promote more controlled release in the gastrointestinal tract. Additionally, this structural behavior may be associated with the physical stability of the microcapsules over time, making it a relevant parameter in the development of probiotic formulations [82].
3.10. Thermogravimetric Analysis
Figure 7 illustrates the thermal behavior of the microcapsules containing probiotic strains encapsulated with inulin, evaluated through thermogravimetric analysis (TGA) and its derivative (DTGA). The TGA curves (solid lines) show the mass loss of the samples as a function of temperature, while the DTGA curves (dashed lines) indicate the rate of this mass loss, allowing the identification of temperature ranges associated with major thermal degradation events.
Overall, a thermal profile characterized by two main degradation stages was observed. The first stage, occurring below approximately 120 °C and corresponding to an initial mass loss of 2–5%, is associated with the removal of residual moisture and adsorbed water, as widely reported for microencapsulation systems based on hygroscopic carbohydrates such as inulin [83]. The second stage, marked by an intense degradation event between 220 °C and 270 °C, with a substantial mass loss ranging from 35% to 50%, corresponds to the thermal decomposition of the inulin matrix and the cellular components of the probiotic strains, including cell wall proteins and intracellular metabolites [83].
Figure 7.
Thermogravimetric analysis (TGA) (solid line) and derivative thermogravimetric analysis (DTGA) (dashed line) of probiotic strains microencapsulated with inulin by spray drying: (a) L. plantarum (LAB 01, 02, and 03); (b) P. acidilactici (LAB 04) and pure inulin; (c) L. brevis (LAB 05); and (d) L. casei (LAB 06, 07, 08, 09, and 10).
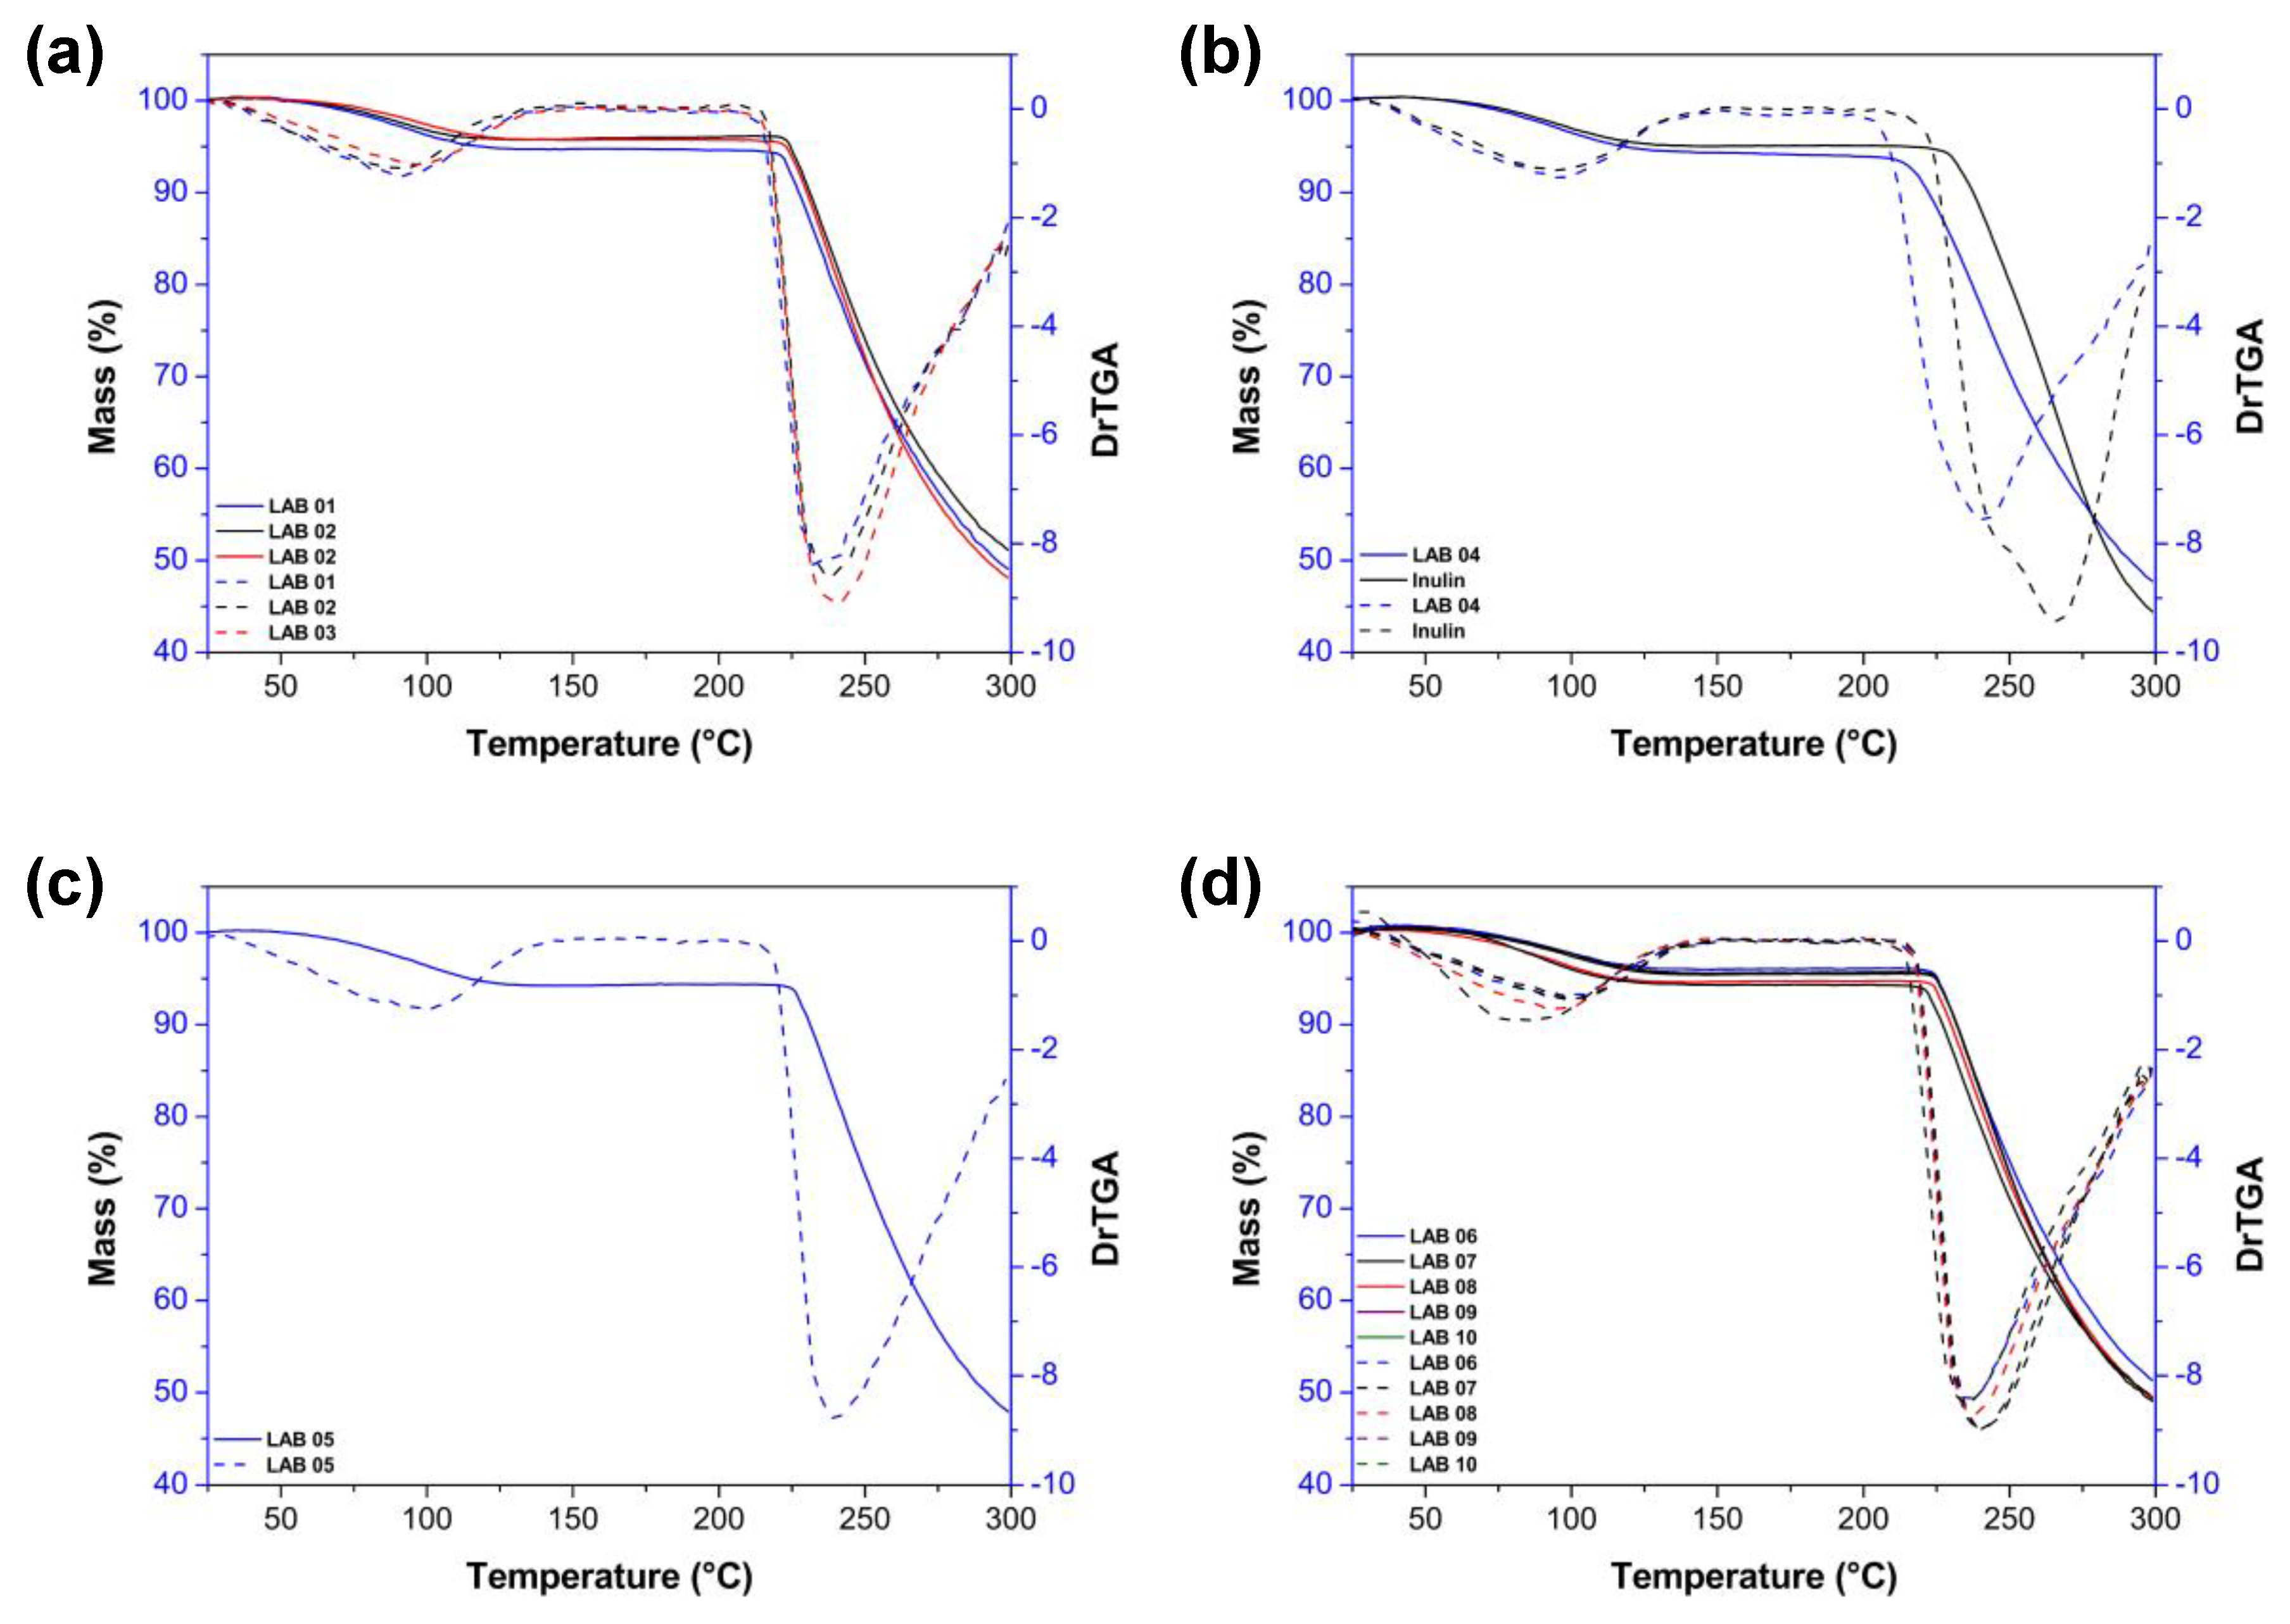
A comparison among the different formulations revealed that, although subtle variations exist between the strains, all samples exhibited similar thermal behavior, with the onset of significant degradation occurring above 200 °C and DTGA peaks within the 240–260 °C range, indicating the point of greatest degradation rate. These two degradation stages have also been reported in other studies involving inulin-based and probiotic systems, indicating a characteristic thermal pattern for this type of matrix [84,85]. This profile is indicative of good thermal stability of the microcapsules, which is desirable for applications in foods subjected to moderate heat processing.
The microcapsules containing L. brevis (LAB05) (Figure 7c) showed a DTGA profile with a single, sharp, and well-defined peak, suggesting a more homogeneous structure, possibly related to the smaller average particle size observed for this formulation. In contrast, the formulations with L. casei (LAB06 to LAB10) (Figure 7d) exhibited overlapping thermal patterns, reinforcing the reproducibility of the inulin microencapsulation process across different variants of the same species.
When compared with pure inulin (Figure 7b), the presence of probiotic strains slightly modified the thermal profiles, producing shifts in DTGA peaks and a smoothing of degradation rates, which suggests physicochemical interactions between the functional groups of inulin and cellular components of the probiotics, possibly via hydrogen bonding. Although non-covalent, such interactions contribute to enhanced thermal stability of the formulations, in agreement with previous findings for encapsulated systems using prebiotic fibers [78].
4. Conclusion
The selection of LAB strains isolated from ACC revealed lineages with strong probiotic potential, particularly regarding their survival under simulated gastrointestinal conditions, auto-aggregation capacity, cell surface hydrophobicity, and absence of virulence factors. Microencapsulation of these strains by spray drying using inulin as a carrier agent resulted in structurally stable microparticles, predominantly spherical in shape and with sizes suitable for food applications. Although viability was maintained under refrigeration, a reduction at room temperature was observed, indicating the need for further optimization. Overall, the findings reinforce the technological and functional potential of these formulations for applications in the food industry.
Author Contributions
I. M. – Investigation, data interpretation, analysis, and draft writing. V. C. Z. – Investigation, data interpretation, and draft writing. A. P. M. Z. – Investigation, data interpretation, and draft writing. N. R. C. F. – Investigation and data interpretation, and manuscript review; C. C. S. – Investigation and data interpretation, manuscript review. J. C. S. D. S. – Investigation, and manuscript review. M. W. – Data interpretation, and manuscript review. S. V. – Project administration, resources, conceptualization, supervision, data interpretation, editing, and revision.
Funding
This study was supported by the “Conselho Nacional de Desenvolvimento Científico e Tecnológico” (CNPq; Grants # 303672/2024-2 and # 402338/2023-5, respectively); and Foundation for Research Support of Santa Catarina - FAPESC [grant number 2022TR002005 and 2021TR001446].
Institutional Review Board Statement
Not applicable.
Informed Consent Statement
Not applicable.
Data Availability Statement
The raw data supporting the conclusions of this article will be made available by the authors on request.
Conflicts of Interest
The authors declare no conflicts of interest.
References
- Zanetti, V.C.; Maran, E.M.; Cabral, L.; Miotto Lindner, M.; de Oliveira Costa, A.C.; Gonzaga, L.V.; Louredo, F.J.C.; Tribuzi, G.; Block, J.M.; da Silveira, S.M.; et al. Seasonal Microbial Dynamics Influence on the Biochemical Identity of Artisanal Colonial Cheese from Southern Brazil during Ripening. Int. J. Dairy Technol. 2025, 78. [CrossRef]
- Kamimura, B.A.; Magnani, M.; Luciano, W.A.; Campagnollo, F.B.; Pimentel, T.C.; Alvarenga, V.O.; Pelegrino, B.O.; Cruz, A.G.; Sant’Ana, A.S. Brazilian Artisanal Cheeses: An Overview of Their Characteristics, Main Types and Regulatory Aspects. Compr. Rev. Food Sci. Food Saf. 2019, 18, 1636–1657. [CrossRef]
- Degenhardt, R.; Carvalho, M.M.; Voidaleski, M.F.; Daros, G.F.; Guaragni, A.; de Melo Pereira, G.V.; De Dea Lindner, J. Brazilian Artisanal Colonial Cheese: Characterization, Microbiological Safety, and Survival of Salmonella enterica Serovar Enteritidis during Ripening. Brazilian J. Microbiol. 2023, 54, 2129–2135. [CrossRef]
- Neviani, E.; Gatti, M.; Gardini, F.; Levante, A. Microbiota of Cheese Ecosystems: A Perspective on Cheesemaking. Foods 2025, 14, 830. [CrossRef]
- Fox, P.F.; Guinee, T.P.; Cogan, T.M.; McSweeney, P.L.H. Overview of Cheese Manufacture. In Fundamentals of Cheese Science; Springer US: Boston, MA, 2017; pp. 11–25.
- da Silva, T.F.; Glória, R. de A.; Americo, M.F.; Freitas, A. dos S.; de Jesus, L.C.L.; Barroso, F.A.L.; Laguna, J.G.; Coelho-Rocha, N.D.; Tavares, L.M.; le Loir, Y.; et al. Unlocking the Potential of Probiotics: A Comprehensive Review on Research, Production, and Regulation of Probiotics. Probiotics Antimicrob. Proteins 2024, 16, 1687–1723. [CrossRef]
- Hua, Z.; Liu, S.; Yang, G.; Hou, X.; Fang, Y. Next-Generation Probiotics: Innovations in Safety Assessments. Curr. Opin. Food Sci. 2025, 61, 101238. [CrossRef]
- Mohammed, S.; Çon, A.H. Isolation and Characterization of Potential Probiotic Lactic Acid Bacteria from Traditional Cheese. LWT 2021, 152, 112319. [CrossRef]
- Zheng, Y.; Zhang, Z.; Tang, P.; Wu, Y.; Zhang, A.; Li, D.; Wang, C.-Z.; Wan, J.-Y.; Yao, H.; Yuan, C.-S. Probiotics Fortify Intestinal Barrier Function: A Systematic Review and Meta-Analysis of Randomized Trials. Front. Immunol. 2023, 14. [CrossRef]
- Camelo-Silva, C.; Figueredo, L.L.; Zanetti, V.C.; Ambrosi, A.; Di Luccio, M.; Verruck, S. Microencapsulation of Probiotics. In Probiotic Foods and Beverages; New York, NY, 2023; pp. 199–212.
- Gruskiene, R.; Lavelli, V.; Sereikaite, J. Application of Inulin for the Formulation and Delivery of Bioactive Molecules and Live Cells. Carbohydr. Polym. 2024, 327, 121670. [CrossRef]
- Dantas, A.; Verruck, S.; Machado Canella, M.H.; Maran, B.M.; Murakami, F.S.; de Avila Junior, L.B.; de Campos, C.E.M.; Hernandez, E.; Prudencio, E.S. Current Knowledge about Physical Properties of Innovative Probiotic Spray-Dried Powders Produced with Lactose-Free Milk and Prebiotics. LWT 2021, 151, 112175. [CrossRef]
- Tanaka, Y.; Aryantini, N.P.D.; Yamasaki, E.; Saito, M.; Tsukigase, Y.; Nakatsuka, H.; Urashima, T.; Horiuchi, R.; Fukuda, K. In Vitro Probiotic Characterization and Safety Assessment of Lactic Acid Bacteria Isolated from Raw Milk of Japanese-Saanen Goat (Capra Hircus). Animals 2022, 13, 7. [CrossRef]
- Silva, H.L.A.; Balthazar, C.F.; Esmerino, E.A.; Vieira, A.H.; Cappato, L.P.; Neto, R.P.C.; Verruck, S.; Cavalcanti, R.N.; Portela, J.B.; Andrade, M.M.; et al. Effect of Sodium Reduction and Flavor Enhancer Addition on Probiotic Prato Cheese Processing. Food Res. Int. 2017, 99, 247–255. [CrossRef]
- Wang, Y.; Qian, P.-Y. Conservative Fragments in Bacterial 16S RRNA Genes and Primer Design for 16S Ribosomal DNA Amplicons in Metagenomic Studies. PLoS One 2009, 4, e7401. [CrossRef]
- Caporaso, J.G.; Lauber, C.L.; Walters, W.A.; Berg-Lyons, D.; Huntley, J.; Fierer, N.; Owens, S.M.; Betley, J.; Fraser, L.; Bauer, M.; et al. Ultra-High-Throughput Microbial Community Analysis on the Illumina HiSeq and MiSeq Platforms. ISME J. 2012, 6, 1621–1624. [CrossRef]
- Altschul, S.F.; Gish, W.; Miller, W.; Myers, E.W.; Lipman, D.J. Basic Local Alignment Search Tool. J. Mol. Biol. 1990, 215, 403–410. [CrossRef]
- Andrews, S. FastQC: A Quality Control Tool for High Throuthput Sequence Data. 2010.
- Cock, P.J.A.; Antao, T.; Chang, J.T.; Chapman, B.A.; Cox, C.J.; Dalke, A.; Friedberg, I.; Hamelryck, T.; Kauff, F.; Wilczynski, B.; et al. Biopython: Freely Available Python Tools for Computational Molecular Biology and Bioinformatics. Bioinformatics 2009, 25, 1422–1423. [CrossRef]
- Masella, A.P.; Bartram, A.K.; Truszkowski, J.M.; Brown, D.G.; Neufeld, J.D. PANDAseq: Paired-End Assembler for Illumina Sequences. BMC Bioinformatics 2012, 13, 31. [CrossRef]
- Quast, C.; Pruesse, E.; Yilmaz, P.; Gerken, J.; Schweer, T.; Yarza, P.; Peplies, J.; Glöckner, F.O. The SILVA Ribosomal RNA Gene Database Project: Improved Data Processing and Web-Based Tools. Nucleic Acids Res. 2012, 41, D590–D596. [CrossRef]
- DeSantis, T.Z.; Hugenholtz, P.; Larsen, N.; Rojas, M.; Brodie, E.L.; Keller, K.; Huber, T.; Dalevi, D.; Hu, P.; Andersen, G.L. Greengenes, a Chimera-Checked 16S RRNA Gene Database and Workbench Compatible with ARB. Appl. Environ. Microbiol. 2006, 72, 5069–5072. [CrossRef]
- Margalho, L.P.; Feliciano, M.D.; Silva, C.E.; Abreu, J.S.; Piran, M.V.F.; Sant’Ana, A.S. Brazilian Artisanal Cheeses Are Rich and Diverse Sources of Nonstarter Lactic Acid Bacteria Regarding Technological, Biopreservative, and Safety Properties—Insights through Multivariate Analysis. J. Dairy Sci. 2020, 103, 7908–7926. [CrossRef]
- Zhang, F.; Jiang, M.; Wan, C.; Chen, X.; Chen, X.; Tao, X.; Shah, N.P.; Wei, H. Screening Probiotic Strains for Safety: Evaluation of Virulence and Antimicrobial Susceptibility of Enterococci from Healthy Chinese Infants. J. Dairy Sci. 2016, 99, 4282–4290. [CrossRef]
- Leska, A.; Nowak, A.; Rosicka-Kaczmarek, J.; Ryngajłło, M.; Czarnecka-Chrebelska, K.H. Characterization and Protective Properties of Lactic Acid Bacteria Intended to Be Used in Probiotic Preparation for Honeybees (Apis mellifera L.)—An In Vitro Study. Animals 2023, 13, 1059. [CrossRef]
- ISO, I.O. for S. Susceptibility Testing of Infectious Agents and Evaluation of Performance of Antimicrobial Susceptibility Test Devices – Part 1: Broth Micro-Dilution Reference Method for Testing the in Vitro Activity of Antimicrobial Agents against Rapidly Growing Aerobi; Geneva, 2019;
- EUC, E.C. Opinion of the Scientific Committee on Animal Nutrition on the Criteria for Assessing the Safety of Micro-Organisms Resistant to Antibiotics of Human Clinical and Veterinary Importance; 2003;
- EFSA Guidance on the Assessment of Bacterial Susceptibility to Antimicrobials of Human and Veterinary Importance. EFSA J. 2012, 10. [CrossRef]
- EUCAST European Committee on Antimicrobial Susceptibility Testing. Breakpoint Tables for Interpretation of MICs and Zone Diameters.; 2021;
- Gad, G.F.M.; Abdel-Hamid, A.M.; Farag, Z.S.H. Antibiotic Resistance in Lactic Acid Bacteria Isolated from Some Pharmaceutical and Dairy Products. Brazilian J. Microbiol. 2014, 45, 25–33. [CrossRef]
- Celiktas, O.Y.; Kocabas, E.E.H.; Bedir, E.; Sukan, F.V.; Ozek, T.; Baser, K.H.C. Antimicrobial Activities of Methanol Extracts and Essential Oils of Rosmarinus officinalis, Depending on Location and Seasonal Variations. Food Chem. 2007, 100, 553–559. [CrossRef]
- Brodkorb, A.; Egger, L.; Alminger, M.; Alvito, P.; Assunção, R.; Ballance, S.; Bohn, T.; Bourlieu-Lacanal, C.; Boutrou, R.; Carrière, F.; et al. INFOGEST Static in Vitro Simulation of Gastrointestinal Food Digestion. Nat. Protoc. 2019, 14, 991–1014. [CrossRef]
- Zoldan, J.; De Marco, I.; Verruck, S.; Gomide, A.I.; Cartabiano, C.E.L.; de Melo Pereira, G.V.; De Dea Lindner, J. Evaluation of Viability to Simulated Gastrointestinal Tract Passage of Probiotic Strains and Pioneer Bioaccessibility Analyses of Antioxidants in Chocolate. Food Biosci. 2023, 52, 102494. [CrossRef]
- Camelo-Silva, C.; Figueredo, L.L.; Cesca, K.; Verruck, S.; Ambrosi, A.; Di Luccio, M. Membrane Emulsification as an Emerging Method for Lacticaseibacillus rhamnosus GG® Encapsulation. Food Bioprocess Technol. 2023, 16, 2651–2667. [CrossRef]
- Yasmin, I.; Saeed, M.; Khan, W.A.; Khaliq, A.; Chughtai, M.F.J.; Iqbal, R.; Tehseen, S.; Naz, S.; Liaqat, A.; Mehmood, T.; et al. In Vitro Probiotic Potential and Safety Evaluation (Hemolytic, Cytotoxic Activity) of Bifidobacterium Strains Isolated from Raw Camel Milk. Microorganisms 2020, 8, 354. [CrossRef]
- Farid, W.; Masud, T.; Sohail, A.; Ahmad, N.; Naqvi, S.M.S.; Khan, S.; Ali, A.; Khalifa, S.A.; Hussain, A.; Ali, S.; et al. Gastrointestinal Transit Tolerance, Cell Surface Hydrophobicity, and Functional Attributes of Lactobacillus acidophilus Strains Isolated from Indigenous Dahi. Food Sci. Nutr. 2021, 9, 5092–5102. [CrossRef]
- Barbosa, J.; Gibbs, P.A.; Teixeira, P. Virulence Factors among Enterococci Isolated from Traditional Fermented Meat Products Produced in the North of Portugal. Food Control 2010, 21, 651–656. [CrossRef]
- Lee, B.S.; Ban, O.-H.; Bang, W.Y.; Chae, S.A.; Oh, S.; Park, C.; Lee, M.; Kim, S.-J.; Yang, J.; Jung, Y.H. Safety Assessment of Lactobacillus reuteri IDCC 3701 Based on Phenotypic and Genomic Analysis. Ann. Microbiol. 2021, 71, 10. [CrossRef]
- Colautti, A.; Arnoldi, M.; Comi, G.; Iacumin, L. Antibiotic Resistance and Virulence Factors in Lactobacilli: Something to Carefully Consider. Food Microbiol. 2022, 103, 103934. [CrossRef]
- Herath, M.; Hosie, S.; Bornstein, J.C.; Franks, A.E.; Hill-Yardin, E.L. The Role of the Gastrointestinal Mucus System in Intestinal Homeostasis: Implications for Neurological Disorders. Front. Cell. Infect. Microbiol. 2020, 10. [CrossRef]
- Castro-López, C.; García-Galaz, A.; García, H.S.; González-Córdova, A.F.; Vallejo-Cordoba, B.; Hernández-Mendoza, A. Potential Probiotic Lactobacilli Strains Isolated from Artisanal Mexican Cocido Cheese: Evidence-Based Biosafety and Probiotic Action-Related Traits on in Vitro Tests. Brazilian J. Microbiol. 2023, 54, 2137–2152. [CrossRef]
- Anisimova, E.A.; Yarullina, D.R. Antibiotic Resistance of Lactobacillus Strains. Curr. Microbiol. 2019, 76, 1407–1416. [CrossRef]
- Shao, Y.; Zhang, W.; Guo, H.; Pan, L.; Zhang, H.; Sun, T. Comparative Studies on Antibiotic Resistance in Lactobacillus casei and Lactobacillus plantarum. Food Control 2015, 50, 250–258. [CrossRef]
- Li, T.; Teng, D.; Mao, R.; Hao, Y.; Wang, X.; Wang, J. A Critical Review of Antibiotic Resistance in Probiotic Bacteria. Food Res. Int. 2020, 136, 109571. [CrossRef]
- DeMarco, E.; DePetrillo, J.; Qadeer, F. Meropenem Resistant Lactobacillus Endocarditis in an Immunocompetent Patient. SAGE Open Med. Case Reports 2023, 11. [CrossRef]
- Anisimova, E.; Gorokhova, I.; Karimullina, G.; Yarullina, D. Alarming Antibiotic Resistance of Lactobacilli Isolated from Probiotic Preparations and Dietary Supplements. Antibiotics 2022, 11, 1557. [CrossRef]
- Duche, R.T.; Singh, A.; Wandhare, A.G.; Sangwan, V.; Sihag, M.K.; Nwagu, T.N.T.; Panwar, H.; Ezeogu, L.I. Antibiotic Resistance in Potential Probiotic Lactic Acid Bacteria of Fermented Foods and Human Origin from Nigeria. BMC Microbiol. 2023, 23, 142. [CrossRef]
- Ammor, M.S.; Belén Flórez, A.; Mayo, B. Antibiotic Resistance in Non-Enterococcal Lactic Acid Bacteria and Bifidobacteria. Food Microbiol. 2007, 24, 559–570. [CrossRef]
- Silva, J.G.; Castro, R.D.; Sant’Anna, F.M.; Barquete, R.M.; Oliveira, L.G.; Acurcio, L.B.; Luiz, L.M.P.; Sales, G.A.; Nicoli, J.R.; Souza, M.R. In Vitro Assessment of the Probiotic Potential of Lactobacilli Isolated from Minas Artisanal Cheese Produced in the Araxá Region, Minas Gerais State, Brazil. Arq. Bras. Med. Veterinária e Zootec. 2019, 71, 647–657. [CrossRef]
- Ołdak, A.; Zielińska, D.; Łepecka, A.; Długosz, E.; Kołożyn-Krajewska, D. Lactobacillus plantarum Strains Isolated from Polish Regional Cheeses Exhibit Anti-Staphylococcal Activity and Selected Probiotic Properties. Probiotics Antimicrob. Proteins 2020, 12, 1025–1038. [CrossRef]
- Guan, C.; Tao, Z.; Wang, L.; Zhao, R.; Chen, X.; Huang, X.; Su, J.; Lu, Z.; Chen, X.; Gu, R. Isolation of Novel Lactobacillus with Lipolytic Activity from the Vinasse and Their Preliminary Potential Using as Probiotics. AMB Express 2020, 10, 91. [CrossRef]
- Esteban-Torres, M.; Mancheño, J.M.; de las Rivas, B.; Muñoz, R. Characterization of a Halotolerant Lipase from the Lactic Acid Bacteria Lactobacillus plantarum Useful in Food Fermentations. LWT - Food Sci. Technol. 2015, 60, 246–252. [CrossRef]
- Konkit, M.; Kim, W. Activities of Amylase, Proteinase, and Lipase Enzymes from Lactococcus chungangensis and Its Application in Dairy Products. J. Dairy Sci. 2016, 99, 4999–5007. [CrossRef]
- Ait Chait, Y.; Gunenc, A.; Hosseinian, F.; Bendali, F. Antipathogenic and Probiotic Potential of Lactobacillus brevis Strains Newly Isolated from Algerian Artisanal Cheeses. Folia Microbiol. (Praha). 2021, 66, 429–440. [CrossRef]
- Ruiz-Moyano, S.; Gonçalves dos Santos, M.T.P.; Galván, A.I.; Merchán, A. V.; González, E.; Córdoba, M. de G.; Benito, M.J. Screening of Autochthonous Lactic Acid Bacteria Strains from Artisanal Soft Cheese: Probiotic Characteristics and Prebiotic Metabolism. LWT 2019, 114, 108388. [CrossRef]
- Hill, C.; Guarner, F.; Reid, G.; Gibson, G.R.; Merenstein, D.J.; Pot, B.; Morelli, L.; Canani, R.B.; Flint, H.J.; Salminen, S.; et al. The International Scientific Association for Probiotics and Prebiotics Consensus Statement on the Scope and Appropriate Use of the Term Probiotic. Nat. Rev. Gastroenterol. Hepatol. 2014, 11, 506–514. [CrossRef]
- Chen, S.; Cao, Y.; Ferguson, L.R.; Shu, Q.; Garg, S. Flow Cytometric Assessment of the Protectants for Enhanced in Vitro Survival of Probiotic Lactic Acid Bacteria through Simulated Human Gastro-Intestinal Stresses. Appl. Microbiol. Biotechnol. 2012, 95, 345–356. [CrossRef]
- Gomand, F.; Borges, F.; Burgain, J.; Guerin, J.; Revol-Junelles, A.-M.; Gaiani, C. Food Matrix Design for Effective Lactic Acid Bacteria Delivery. Annu. Rev. Food Sci. Technol. 2019, 10, 285–310. [CrossRef]
- Barache, N.; Ladjouzi, R.; Belguesmia, Y.; Bendali, F.; Drider, D. Abundance of Lactobacillus plantarum Strains with Beneficial Attributes in Blackberries (Rubus sp.), Fresh Figs (Ficus carica), and Prickly Pears (Opuntia ficus-indica) Grown and Harvested in Algeria. Probiotics Antimicrob. Proteins 2020, 12, 1514–1523. [CrossRef]
- Margalho, L.P.; Jorge, G.P.; Noleto, D.A.P.; Silva, C.E.; Abreu, J.S.; Piran, M.V.F.; Brocchi, M.; Sant’Ana, A.S. Biopreservation and Probiotic Potential of a Large Set of Lactic Acid Bacteria Isolated from Brazilian Artisanal Cheeses: From Screening to in Product Approach. Microbiol. Res. 2021, 242, 126622. [CrossRef]
- Yungareva, T.; Urshev, Z. The Aggregation-Promoting Factor in Lactobacillus delbrueckii ssp. bulgaricus: Confirmation of the Presence and Expression of the Apf Gene and in Silico Analysis of the Corresponding Protein. World J. Microbiol. Biotechnol. 2018, 34, 97. [CrossRef]
- García-Cayuela, T.; Korany, A.M.; Bustos, I.; P. Gómez de Cadiñanos, L.; Requena, T.; Peláez, C.; Martínez-Cuesta, M.C. Adhesion Abilities of Dairy Lactobacillus plantarum Strains Showing an Aggregation Phenotype. Food Res. Int. 2014, 57, 44–50. [CrossRef]
- Nwoko, E.Q.A.; Okeke, I.N. Bacteria Autoaggregation: How and Why Bacteria Stick Together. Biochem. Soc. Trans. 2021, 49, 1147–1157. [CrossRef]
- Tuo, Y.; Yu, H.; Ai, L.; Wu, Z.; Guo, B.; Chen, W. Aggregation and Adhesion Properties of 22 Lactobacillus Strains. J. Dairy Sci. 2013, 96, 4252–4257. [CrossRef]
- Barzegar, H.; Alizadeh Behbahani, B.; Falah, F. Safety, Probiotic Properties, Antimicrobial Activity, and Technological Performance of Lactobacillus Strains Isolated from Iranian Raw Milk Cheeses. Food Sci. Nutr. 2021, 9, 4094–4107. [CrossRef]
- Verruck, S.; Balthazar, C.F.; Rocha, R.S.; Silva, R.; Esmerino, E.A.; Pimentel, T.C.; Freitas, M.Q.; Silva, M.C.; da Cruz, A.G.; Prudencio, E.S. Dairy Foods and Positive Impact on the Consumer’s Health. In; 2019; pp. 95–164.
- Verruck, S.; de Liz, G.R.; Dias, C.O.; de Mello Castanho Amboni, R.D.; Prudencio, E.S. Effect of Full-Fat Goat’s Milk and Prebiotics Use on Bifidobacterium BB-12 Survival and on the Physical Properties of Spray-Dried Powders under Storage Conditions. Food Res. Int. 2019, 119, 643–652. [CrossRef]
- Ananta, E.; Volkert, M.; Knorr, D. Cellular Injuries and Storage Stability of Spray-Dried Lactobacillus rhamnosus GG. Int. Dairy J. 2005, 15, 399–409. [CrossRef]
- Pedroso, D. de L.; Thomazini, M.; Heinemann, R.J.B.; Favaro-Trindade, C.S. Protection of Bifidobacterium lactis and Lactobacillus acidophilus by Microencapsulation Using Spray-Chilling. Int. Dairy J. 2012, 26, 127–132. [CrossRef]
- Sharma, R.; Rashidinejad, A.; Jafari, S.M. Application of Spray Dried Encapsulated Probiotics in Functional Food Formulations. Food Bioprocess Technol. 2022, 15, 2135–2154. [CrossRef]
- Bashir, I.; Wani, S.M.; Bhat, A.A.; Khan, A.A.; Hussain, S.Z.; Ganai, S.A.; Anjum, N. Effect of Freeze Drying and Spray Drying on Physical Properties, Morphology and in Vitro Release Kinetics of Vitamin D3 Nanoparticles. Powder Technol. 2024, 432, 119164. [CrossRef]
- Tao, T.; Ding, Z.; Hou, D.; Prakash, S.; Zhao, Y.; Fan, Z.; Zhang, D.; Wang, Z.; Liu, M.; Han, J. Influence of Polysaccharide as Co-Encapsulant on Powder Characteristics, Survival and Viability of Microencapsulated Lactobacillus paracasei Lpc-37 by Spray Drying. J. Food Eng. 2019, 252, 10–17. [CrossRef]
- Duongthingoc, D.; George, P.; Katopo, L.; Gorczyca, E.; Kasapis, S. Effect of Whey Protein Agglomeration on Spray Dried Microcapsules Containing Saccharomyces boulardii. Food Chem. 2013, 141, 1782–1788. [CrossRef]
- Zaeim, D.; Sarabi-Jamab, M.; Ghorani, B.; Kadkhodaee, R.; Liu, W.; Tromp, R.H. Microencapsulation of Probiotics in Multi-Polysaccharide Microcapsules by Electro-Hydrodynamic Atomization and Incorporation into Ice-Cream Formulation. Food Struct. 2020, 25, 100147. [CrossRef]
- Maleki, O.; Khaledabad, M.A.; Amiri, S.; Asl, A.K.; Makouie, S. Microencapsulation of Lactobacillus rhamnosus ATCC 7469 in Whey Protein Isolate-Crystalline Nanocellulose-Inulin Composite Enhanced Gastrointestinal Survivability. LWT 2020, 126, 109224. [CrossRef]
- Araujo, V.; Gamboa, A.; Caro, N.; Abugoch, L.; Gotteland, M.; Valenzuela, F.; Merchant, H.A.; Basit, A.W.; Tapia, C. Release of Prednisolone and Inulin from a New Calcium-Alginate Chitosan-Coated Matrix System for Colonic Delivery. J. Pharm. Sci. 2013, 102, 2748–2759. [CrossRef]
- Lin, X.; Zhang, X.; Xu, B. Differences in Physicochemical, Rheological, and Prebiotic Properties of Inulin Isolated from Five Botanical Sources and Their Potential Applications. Food Res. Int. 2024, 180, 114048. [CrossRef]
- Lim, G.-P.; Ahmad, M.S. Development of Ca-Alginate-Chitosan Microcapsules for Encapsulation and Controlled Release of Imidacloprid to Control Dengue Outbreaks. J. Ind. Eng. Chem. 2017, 56, 382–393. [CrossRef]
- Bhanja, A.; Paikra, S.K.; Sutar, P.P.; Mishra, M. Characterization and Identification of Inulin from Pachyrhizus erosus and Evaluation of Its Antioxidant and In-Vitro Prebiotic Efficacy. J. Food Sci. Technol. 2023, 60, 328–339. [CrossRef]
- Choudhury, N.; Meghwal, M.; Das, K. Microencapsulation: An Overview on Concepts, Methods, Properties and Applications in Foods. Food Front. 2021, 2, 426–442. [CrossRef]
- Nouri, M. Probiotic Survival of Bifidobacterium lactis and Lacticaseibacillus rhamnosus in Pectin Microcapsule Extracted from Bitter Orange Peel for Ice Cream. Acta Sci. Pol. Tecnol. Aliment. 2025, 2, 283–294.
- Romano, N.; Mobili, P.; Zuñiga-Hansen, M.E.; Gómez-Zavaglia, A. Physico-Chemical and Structural Properties of Crystalline Inulin Explain the Stability of Lactobacillus plantarum during Spray-Drying and Storage. Food Res. Int. 2018, 113, 167–174. [CrossRef]
- Pandey, P.; Mishra, H.N. Co-Microencapsulation of γ-Aminobutyric Acid (GABA) and Probiotic Bacteria in Thermostable and Biocompatible Exopolysaccharides Matrix. LWT 2021, 136, 110293. [CrossRef]
- Ni, D.; Zhu, Y.; Xu, W.; Pang, X.; Lv, J.; Mu, W. Production and Physicochemical Properties of Food-Grade High-Molecular-Weight Lactobacillus Inulin. J. Agric. Food Chem. 2020, 68, 5854–5862. [CrossRef]
- Kumar, V.; Ahire, J.J.; R., A.; Nain, S.; Taneja, N.K. Microencapsulation of Riboflavin-Producing Lactiplantibacillus plantarum MTCC 25,432 and Evaluation of Its Survival in Simulated Gastric and Intestinal Fluid. Probiotics Antimicrob. Proteins 2024, 16, 1365–1375. [CrossRef]
Figure 1.
Morphology of LAB strains with probiotic potential isolated from ACC at 14 and 21 days of maturation. A: L. plantarum LAB 01. B: L. plantarum LAB 02. C: L. plantarum LAB 03. D: P. acidilactici LAB 04. E: L. brevis LAB 05. F: L. casei LAB 06. G: L. casei LAB 07. H: L. casei LAB 08. I: L. casei LAB 09. J: L. casei LAB 10.
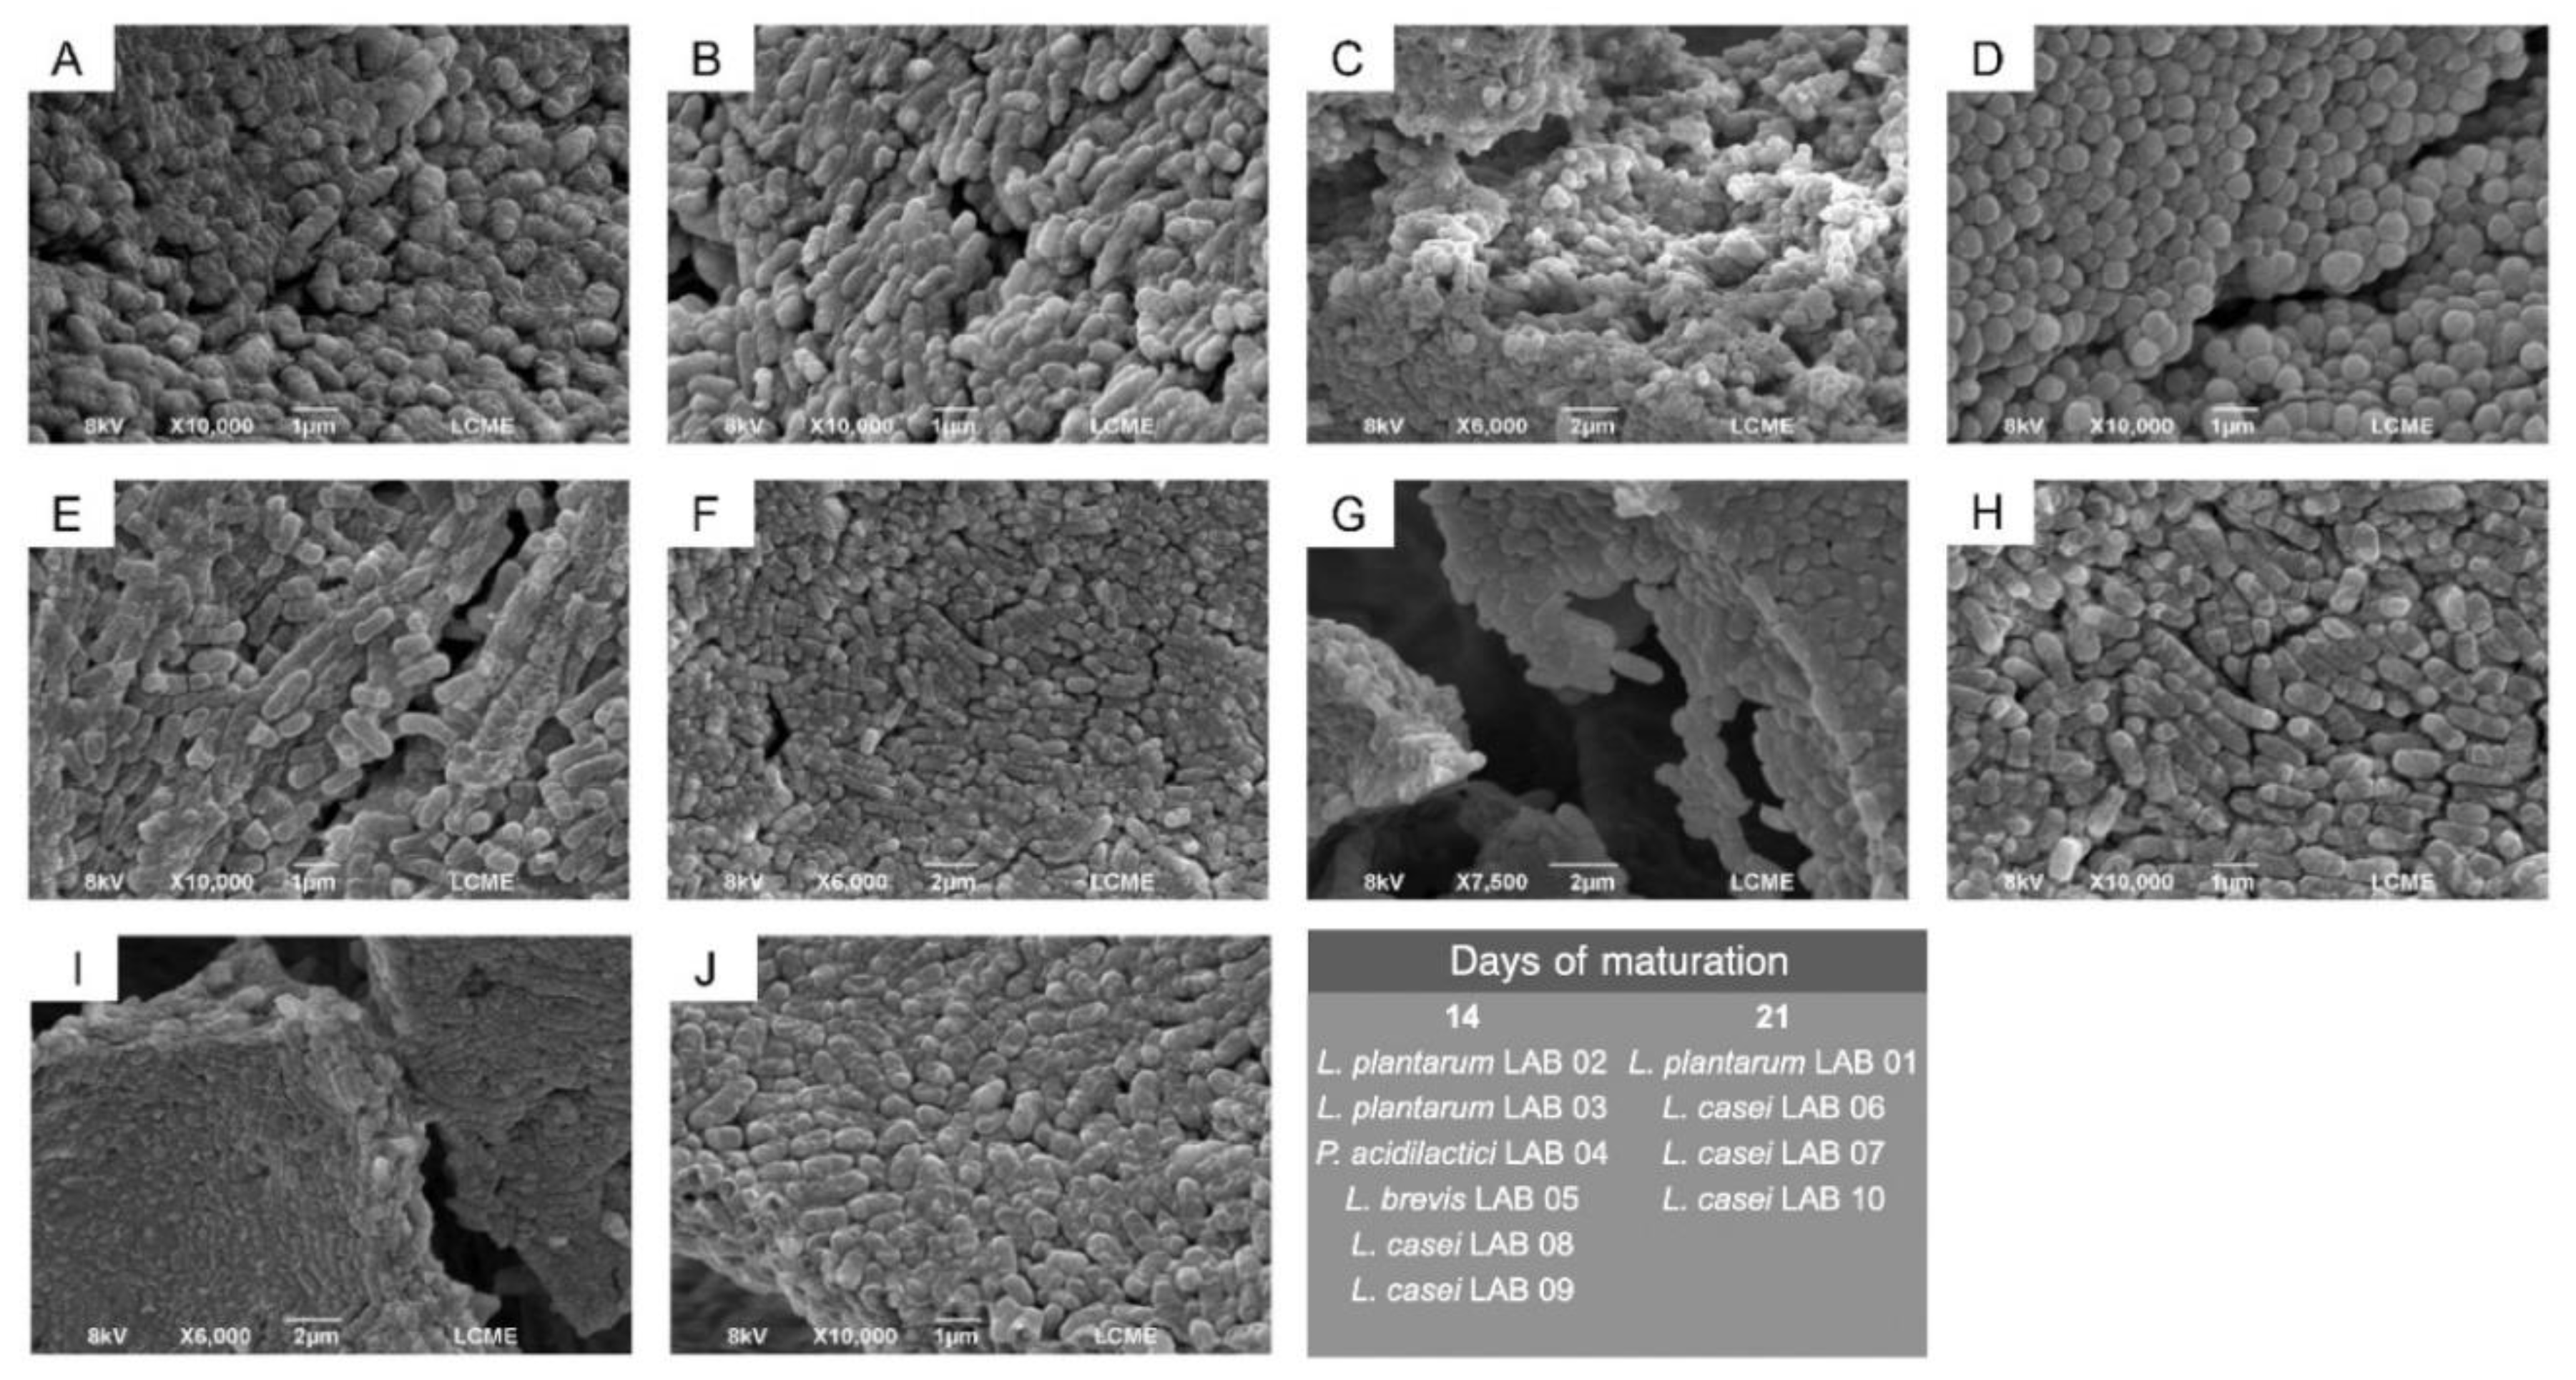
Table 1.
Evaluation of LAB strains resistance under simulated gastrointestinal conditions.
| Step | Simulated conditions |
|---|---|
| Gastric Phase | Mixture of oral bolus with SGF (1:1) |
| Inclusion of CaCl2 (0.15 mM in SGF) | |
| Addition of pepsin (2000 U/mL) | |
| Incubation with agitation (2 h, 37 °C, pH 3.0) | |
| Intestinal Phase | Mixture of gastric bolus with SIF (1:1) |
| Addition of bile (10 mM of bile salts) | |
| Inclusion of CaCl2 (0.6 mM in SIF) | |
| Addition of pancreatin (trypsin activity of 100 U/mL) | |
| Incubation in agitation (2 h, 37 °C, pH 7.0) |
Source: Brodkorb et al. [32]. SGF: simulated gastric fluid; SIF: simulated intestinal fluid.
Table 4.
Auto-aggregation and hydrophobicity results of potentially probiotic LAB isolated from ACC.
Table 4.
Auto-aggregation and hydrophobicity results of potentially probiotic LAB isolated from ACC.
| Strains | Auto-aggregation (%) | hydrophobicity (%) | ||
| 3h | 6h | 24h | ||
| L. plantarum LAB 01 | 31.62 ± 4.24aB | 38.96 ± 6.21aB | 73.56 ± 6.24aA | 76.69 ± 4.68d |
| L. plantarum LAB 02 | 33.08 ± 1.36aB | 42.80 ± 0.66aB | 62.72 ± 4.57aA | 87.41 ± 3.98b |
| L. plantarum LAB 03 | 32.47 ± 2.94aB | 37.76 ± 5.06aB | 73.18 ± 6.55aA | 56.06 ± 2.25e |
| P. acidilactici LAB 04 | 30.64 ± 3.17aB | 32.44 ± 6.85aB | 74.33 ± 3.49aA | 45.70 ± 4.40f |
| L. brevis LAB 05 | 29.43 ± 0.18aB | 42.96 ± 2.44aB | 78.44 ± 8.73aA | 99.67 ± 0.09a |
| L. casei LAB 06 | 23.53 ± 0.98aB | 28.41 ± 1.03aB | 68.84 ± 8.83aA | 95.38 ± 0.61ab |
| L. casei LAB 07 | 22.08 ± 5.14aB | 39.68 ± 0.45aAB | 65.69 ± 11.15aA | 97.72 ± 0.20a |
| L. casei LAB 08 | 30.72 ± 11.21aA | 34.10 ± 16.00aA | 78.76 ± 4.12aA | 78.66 ± 0.63cd |
| L. casei LAB 09 | 36.94 ± 0.29aB | 35.83 ± 3.37aB | 77.82 ± 3.09aA | 53.37 ± 0.87ef |
| L. casei LAB 10 | 20.29 ± 7.38aB | 27.50 ± 6.66aB | 75.04 ± 6.82aA | 93.16 ± 0.74ab |
Results are expressed as mean ± standard deviation. a–b Different lowercase letters indicate significant differences among strains at the same auto-aggregation time point (p < 0.05). A–C Different uppercase letters indicate significant differences among auto-aggregation times for the same bacterial strain (p < 0.05). a–b Different lowercase letters indicate significant differences among strains in the hydrophobicity results (p < 0.05).
Disclaimer/Publisher’s Note: The statements, opinions and data contained in all publications are solely those of the individual author(s) and contributor(s) and not of MDPI and/or the editor(s). MDPI and/or the editor(s) disclaim responsibility for any injury to people or property resulting from any ideas, methods, instructions or products referred to in the content. |
© 2026 by the authors. Licensee MDPI, Basel, Switzerland. This article is an open access article distributed under the terms and conditions of the Creative Commons Attribution (CC BY) license (http://creativecommons.org/licenses/by/4.0/).
Copyright: This open access article is published under a Creative Commons CC BY 4.0 license, which permit the free download, distribution, and reuse, provided that the author and preprint are cited in any reuse.


