
Submitted:
04 January 2026
Posted:
06 January 2026
You are already at the latest version
Abstract
Background: There is a growing interest in the effects of coffee consumption on the human health. This study was conducted to identify a causal relationship between the coffee consumption and the risk of metabolic syndrome (MetS). Methods: We analyzed the data of the 5th Korea National Health and Nutrition Examination Survey in 2010 for the current study. Results: The risk of MetS, high triglyceride (TG) and low high-density lipid-cholesterol (HDL-C), was significantly lower in the female subjects with a daily amount of coffee consumption of ≥ 3 cups as compared with those with a daily amount of coffee consumption of < 1 cup. There was a significant dose-response inverse correlation between the amount of coffee consumption and the risk factors of MetS (high TG and low HDL-C) after the adjustment of multiple confounding factors (P=0.015 and 0.011, respectively). There was also a modest dose-response relationship between the amount of coffee consumption and MetS (P=0.056). There was no significant correlation between the amount of coffee consumption and MetS in the male subjects. Conclusions: The coffee consumption might have a beneficial effect in lowering the risk of MetS. The current results suggest that it would be mandatory to consider individuals’ recognition of health impacts of coffee consumption.
Keywords:
coffee
; caffeine
; metabolic syndrome
; nutrition surveys
; health impact assessment
1. Introduction
In 1999, the StarBucks was first launched in Korea. Since then, the Korean coffee market has rapidly grown at a mean annual rate of 21.6%. Foreign coffee brands including the StarBucks have become popular as a place of refreshment with high-quality coffee products among Korean customers. With such consumption trend, there is no decrease in the demand on them even during economic depression. Moreover, an increase in the number of middle- to large-sized brand coffee shops is followed by that of small-sized ones. This eventually leads to a rapid expansion of the size of Korean market. As a result, brand coffee shops have been considered as one of the restaurant business companies that have experienced a rapid growth in sales and profits [1]. This is also closely associated with compound factors, such as alterations in the concept of home as well as an increase in national income and leisure time [2].
Coffee is one of the beverages that are increasingly consumed worldwide. With westernization of eating habits and lifestyles, coffee culture has become popular in Korea. This is followed by continuous increases in the amount of coffee consumption. Thus, there has been an increase in the mean weekly frequency of coffee consumption by Korean adults from 9 times in 2008 to 12 times in 2015 [3].
According to the US Department of Agriculture’s (USDA’s) Global Agriculture Information Network (GAIN), instant coffee made from the Columbian Arabica accounted for approximately 90% of the Korean coffee market in 2011 [4]. But it contains an excessive amount of sugar and cream. Korean adults ingesting instant coffee are therefore vulnerable to metabolic syndrome [5].
Controversial opinions exist regarding whether coffee consumption has a detrimental effect on human health. It has been reported that it affects the gut-brain axis and thereby lowers a risk of metabolic abnormalities [6]. In addition, frequent use of coffee has a significant inverse correlation with a risk of diabetes mellitus [7]. On the other hand, according to a previous published study showing a relationship between coffee consumption and a risk of cardiovascular diseases, coffee had a neutral or beneficial effect on cardiovascular health [8].
Metabolic syndrome (MetS) has become a major public health concern worldwide [9]. Its prevalence has been also increased in Asian countries including Korea [10,11]. It is defined as a set of multiple risk factors such as including abdominal obesity, hyperglycemia, hypertension and dyslipidemia [12]. Patients with MetS are at increased risks of developing cardiovascular diseases (CVD) and type 2 diabetes mellitus (T2DM) [13]. Many recent studies have focused on lifestyle factors such as diet and favorite food, thus attempting to identify and modify the potential risk factors for MetS [14,15].
Given the above background, this study was conducted to identify a causal relationship between the coffee consumption and the risk of MetS.
2. Methods
2.1. Study Subjects
The current cross-sectional study was conducted using the data of the 5th Korea National Health and Nutrition Examination Survey in 2010 (KNHANES V-1), where the Korea Centers for Disease Control and Prevention (KCDCP) selected 10,938 individuals from 3,840 households using a stratified, multistage probability sampling design and finally enrolled a total of 8,958 individuals. Thus, the overall participation rate was 81.9%.
The current study included the male or female subjects aged between 20 and 64 years. But it excluded the subjects with no available data about coffee consumption (n=1,273) and pregnant women (n=30). A total of 3,844 subjects (n=3,844) participated in the current study, all of whom submitted a written informed consent. The current study was conducted in compliance with the relevant ethics guidelines.
2.2. Data Collection and Measurement
In the KNHANES V-1, the data was collected through standardized health assessment performed in specially equipped mobile examination centers and via face-to-face interviews inside the households in such an order as the caffeine intake, the receipt of written informed consent, blood pressure (BP) measurement, anthropometric measurement, blood sampling and completion of the questionnaire survey. A standardized questionnaire survey was performed to examine such variables as the age, gender, socioeconomic characteristics, a past and current history of drug use, smoking habit and other lifestyle risk factors.
2.3. Coffee Consumption
The coffee consumption data was self-reported and obtained from the dietary interview, for which the subjects were recommended to respond to a questionnaire survey regarding the daily, weekly, monthly and yearly amount of coffee consumption. In addition, the degree of coffee consumption was evaluated as 6-11 cups/year, 1 cup/month, 2-3 cups/month, 1 cup/week, 2-3 cups/week, 4-6 cups/week, 1 cup/day, 2 cups/day and 3 or more cups/day. The frequency of coffee consumption was evaluated based on the daily amount of coffee consumption: < 1 cup/day, 1 cup/day, 2 cups/day and ≥ 3 cups/day. But there was no differentiation between caffeinated and decaffeinated coffee and between the types of coffee (boiled, filtered or instant one).
2.4. MetS
In the current study, MetS was defined according to the criteria of the American Heart Association/National Heart Lung and Blood Institute (AHA/NHLBI).
2.5. Evaluation Criteria
(1) High FPG: High FPG was defined as an FPG level of ≥ 100 mg/dL (5.6 mmol/L) or the use of anti-diabetic medication.
(2) High TG: High TG was defined as a TG level of ≥ 150 mg/dL (1.69 mmol/L) or the use of anti-dyslipidemic drug.
(3) Low HDL-C: Low HDL-C was defined as an HDL-C level of < 40 mg/dL (1.03 mmol/L) in men or < 50 mg/dL (1.29 mmol/L) in women.
2.6. Statistical Analysis
Statistical analysis was done using the IBM SPSS version 20.0 software packages (IBM Co., Armonk, NY). To improve the normality of FPG, TG, HDL-C and total calorie intake, they were log transformed. In addition, categorical variables were expressed as frequencies and SE.
The Student’s t-test or analysis of variance (ANOVA) were used to compare continuous variables and the Chi-square test was used to compare categorical ones between the two groups. Moreover, a multiple logistic regression analysis was also performed to identify the correlation between MetS and coffee consumption, for which the odds ratio (OR) of MetS and the 95% confidence intervals (CIs) were provided. All tests were two-sided and a P-value of < 0.05 was considered statistically significant.
3. Results
3.1. Baseline Characteristics
Baseline characteristics of the subjects are represented in Table 1; there were 875 cases of MetS (469 men and 406 women).
There were significant differences in the age, gender, marital status, education level, economic inactivity status, smoking and high-risk alcohol consumption between the subjects with MetS and those without it.
The daily amount of coffee consumption (≥ 1 cups/day) was significantly greater in the male subjects as compared with their female counterparts. In addition, it was also significantly higher in the subjects with MetS as compared with those without it.
3.2. The Correlation Between the Amount of Coffee Consumption and Risk Factors of MetS
As shown in Table 2, the amount of coffee consumption had a significant correlation with the age, marital status, economic activity status and smoking in both the male and female subjects. In addition, the education level also had a significant correlation with the amount coffee consumption in the male subjects. But this was not seen in the female subjects.
As shown Figure 1, the overall prevalence of MetS had a significant positive correlation with the amount of coffee consumption in the male subjects and it had a significant negative one in their female counterparts. In addition, the amount of coffee consumption had a significant positive correlation with TG in the male subjects and a significant negative correlation with HDL-C in their female counterparts.
As shown in Table 3, a multiple logistic regression analysis was performed to analyze the correlations of the amount of coffee consumption with the age, marital status, education level, economic inactivity status, smoking and general obesity in the male subjects and the smoking and general obesity in their female counterparts. This showed that the ORs of MetS, high TG and low HDL-C were 0.541 (95% CI: 0.329-0.891), 0.563 (95% CI: 0.362-0.877) and 0.590 (95% CI: 0.411-0.846), respectively, in the female subjects with a daily amount of coffee consumption of ≥ 3 cups as compared with those with a daily amount of coffee consumption of < 1 cup. Moreover, there was a significant dose-response inverse correlation between the amount of coffee consumption and the risk factors of MetS (high TG and low HDL-C) after the adjustment of multiple confounding factors (P=0.015 and 0.011, respectively). Furthermore, there was also a modest dose-response relationship between the amount of coffee consumption and MetS (P=0.056). But there was no significant correlation between the amount of coffee consumption and MetS in the male subjects.
4. Discussion
Takami et al. conducted a cross-sectional study in 1,902 Japanese people aged 40 years or older according to a baseline survey of the Japan Multi-Institutional Collaborative Cohort (J-MICC) Study, thus reporting not only that there was a significant inverse correlation between the coffee consumption and the occurrence of MetS, as defined by the AHA/NHLBI criteria, but also that the coffee consumption had a significant inverse correlation with all the risk factors of MetS except for low HDL-C.16) Moreover, Matsuura et al. showed that there was a significant inverse correlation between the moderate coffee consumption (≥ 4 cups/day) and the occurrence of MetS. These authors also noted that the moderate coffee consumption was effective in significantly lowering blood pressure and serum triglycerides in Japanese men rather than women.17)
Inconsistent with the current results, Lutsey et al. reported that there was no significant correlation between the coffee consumption and the occurrence of MetS according to a 9-year prospective study in 9,514 middle-aged adults from the US.15) Driessen et al. conducted a 9-year follow-up study in a healthy population and reported that the coffee consumption had no significant correlation with the MetS and the relevant risk factors. These authors noted that there might be an inverse correlation between the coffee consumption and the mean arterial BP, despite a lack of statistical significance, which disappeared after the adjustment of lifestyle covariates. It would be rash, however, for them to conclude that there is no correlation between the coffee consumption and MetS because they enrolled younger individuals aged between 27 and 36 years.18)
Consistent with the current results, some Japanese studies have reported that there was a significant inverse correlation between the coffee consumption and serum triglyceride levels.16,17) According to some clinical studies, conducted in the US, there was an increase in serum HDL-C levels after the coffee consumption.19,20) But there are also many contradictory reports to our results. That is, Driessen et al. reported that there was no correlation between the coffee consumption and high TG or low HDL-C levels.18) According to a previous study, there was an inverse correlation between the coffee consumption and HDL-C levels in health Dutch women.21)
According to a meta-analysis of 12 studies conducted in Western countries, the consumption of unfiltered coffee had a significant correlation with elevated serum levels of TC, low-density lipoprotein cholesterol (LDL-C) and TG in a dose-response-dependent manner.22) In addition, according to a meta-analysis of 14 published trials, there was a dose-response-dependent increase in serum levels of TC and LDL-C after the consumption of unfiltered, but not filtered, coffee.20) Moreover, several studies have also shown that the instant coffee, but not brewed one, played a role in altering serum lipid levels. Burr et al. reported that there was a significant increase in serum levels of TC and apolipoprotein B after the consumption of instant coffee.23) Furthermore, despite a lack of differentiation between the types of coffee such as boiled, filtered or instant one, it has also been shown that the consumption of instant coffee had a strong correlation with elevated serum levels of LDL-C and decreased serum levels of TG in middle-aged Japanese men.24,25)
The current results are in agreement with previous published studies showing that the frequency of coffee consumption had no significant correlation with WC or BMI; these include a baseline survey of the J-MICC study conducted in Japan, the 2003-2004 NHANES in the US and the Amsterdam Growth and Health Longitudinal Study (AGAHLS) in the Netherlands.16,21,26) By contrast, there are also some studies reporting that there was a negative correlation between the coffee consumption and WC.16,27) According to a large-scale, longitudinal study conducted in the US, the increased coffee consumption caused long-term weight gain to a slightly smaller extent in both men and women.28) Presumably, this discrepancy might be due to such factors as the age, ethnicity, preparation methods of coffee, the amount and type of coffee and the use of additives (e.g., sugar or cream). Nevertheless, the effects of coffee consumption on the obesity remain controversial.
According to some studies, controversial opinions exist regarding the correlation between the coffee consumption and BP.29) From this context, based on the current results that there was no significant correlation between the coffee consumption and high BP, it can be inferred not only that the habitual coffee and caffeine consumption might decrease the short-term effects of coffee consumption in increasing the BP but also that such effects might be potentially offset by other constituents of coffee.
Many recent studies have shown that the coffee had beneficial effects in reducing the risk of diabetes mellitus (DM); this has also been reported in Asian studies.30) To date, few studies have been conducted to examine the effects of the habitual coffee consumption on DM or impaired fasting glucose (IFG). Our results showed that the coffee consumption had no significant correlation with high FPG in both men and women. But this deserves further prospective studies.
The current study showed that there was a significant correlation between the coffee consumption and a lower risk of MetS in women, but this was not seen in men. Still, little is known about the differences in the effects of coffee consumption on the risk of MetS between men and women. It is presumed that the coffee consumption might have a relationship with unhealthy lifestyle habits such as smoking. In the current study, the proportion of smoking and high-risk alcohol consumption was significantly higher in men as compared with women. Presumably, this might be due to the differences in unhealthy lifestyle habits between men and women. But this also deserves further studies.
In conclusion, the coffee consumption might have a beneficial effect in lowering the risk of MetS. The current results suggest that it would be mandatory to consider individuals’ recognition of health impacts of coffee consumption. But this deserves further well-designed studies.
Funding
The authors thank Laon Medi Solution Inc. (Seoul, Republic of Korea) and KDH Medical Inc. (Gwangmyeong, Gyeonggi, Republic of Korea) for additional support of this study (Funding number: KDH-2023).
Conflicts of Interest
The authors report no competing interests to declare.
References
- Kim, A.; Lee, S.J.; Ko, S.H. A study on the importance and satisfaction of consumers in selecting a side dish at a coffee shop. Korean J. Food Cook. Sci. 2013, 29, 169–175. [Google Scholar] [CrossRef]
- dePaula, J.; Farah, A. Caffeine consumption through coffee: Content in the beverage, metabolism, health benefits and risks. Beverages 2019, 5, 37. [Google Scholar] [CrossRef]
- Lee, J.; Kim, H.Y.; Kim, J. Coffee consumption and the risk of obesity in Korean women. Nutrients 2017, 9, 1340. [Google Scholar] [CrossRef] [PubMed]
- Wong, T.H.T.; Wong, C.H.; Zhang, X.; Zhou, Y.; Xu, J.; Yuen, K.C.; et al. The association between coffee consumption and metabolic syndrome in adults: A systematic review and meta-analysis. Adv. Nutr. 2021, 12, 708–721. [Google Scholar] [CrossRef]
- Kim, H.J.; Cho, S.; Jacobs, D.R., Jr.; Park, K. Instant coffee consumption may be associated with higher risk of metabolic syndrome in Korean adults. Diabetes Res. Clin. Pract. 2014, 106, 145–153. [Google Scholar] [CrossRef]
- Holtmann, G.; Talley, N.J. The stomach–brain axis. Best Pract. Res. Clin. Gastroenterol. 2014, 28, 967–979. [Google Scholar] [CrossRef]
- Pimentel, G.D.; Zemdegs, J.C.; Theodoro, J.A.; Mota, J.F. Does long-term coffee intake reduce type 2 diabetes mellitus risk? Diabetol. Metab. Syndr. 2009, 1, 6. [Google Scholar] [CrossRef]
- Chrysant, S.G. Coffee consumption and cardiovascular health. Am. J. Cardiol. 2015, 116, 818–821. [Google Scholar] [CrossRef]
- Saklayen, M.G. The global epidemic of the metabolic syndrome. Curr. Hypertens. Rep. 2018, 20, 12. [Google Scholar] [CrossRef]
- Ranasinghe, P.; Mathangasinghe, Y.; Jayawardena, R.; Hills, A.P.; Misra, A. Prevalence and trends of metabolic syndrome among adults in the Asia-Pacific region: A systematic review. BMC Public Health 2017, 17, 101. [Google Scholar] [CrossRef]
- Herningtyas, E.H.; Ng, T.S. Prevalence and distribution of metabolic syndrome and its components among provinces and ethnic groups in Indonesia. BMC Public Health 2019, 19, 377. [Google Scholar] [CrossRef] [PubMed]
- Cornier, M.A.; Dabelea, D.; Hernandez, T.L.; Lindstrom, R.C.; Steig, A.J.; Stob, N.R.; et al. The metabolic syndrome. Endocr. Rev. 2008, 29, 777–822. [Google Scholar] [CrossRef] [PubMed]
- Ginsberg, H.N.; MacCallum, P.R. The obesity, metabolic syndrome, and type 2 diabetes mellitus pandemic: Part I. Increased cardiovascular disease risk and the importance of atherogenic dyslipidemia. J. Cardiometab. Syndr. 2009, 4, 113–119. [Google Scholar] [CrossRef] [PubMed]
- Millen, B.E.; Pencina, M.J.; Kimokoti, R.W.; Zhu, L.; Meigs, J.B.; Ordovas, J.M.; et al. Nutritional risk and the metabolic syndrome in women: Opportunities for preventive intervention from the Framingham Nutrition Study. Am. J. Clin. Nutr. 2006, 84, 434–441. [Google Scholar] [CrossRef]
- Lutsey, P.L.; Steffen, L.M.; Stevens, J. Dietary intake and the development of the metabolic syndrome: The Atherosclerosis Risk in Communities study. Circulation 2008, 117, 754–761. [Google Scholar] [CrossRef]
- Takami, H.; Nakamoto, M.; Uemura, H.; Katsuura, S.; Yamaguchi, M.; Hiyoshi, M.; et al. Inverse correlation between coffee consumption and prevalence of metabolic syndrome: Baseline survey of the J-MICC Study in Tokushima, Japan. J. Epidemiol. 2013, 23, 12–20. [Google Scholar] [CrossRef]
- Matsuura, H.; Mure, K.; Nishio, N.; Kitano, N.; Nagai, N.; Takeshita, T. Relationship between coffee consumption and prevalence of metabolic syndrome among Japanese civil servants. J. Epidemiol. 2012, 22, 160–166. [Google Scholar] [CrossRef]
- Driessen, M.T.; Koppes, L.L.; Veldhuis, L.; Samoocha, D.; Twisk, J.W. Coffee consumption is not related to the metabolic syndrome at the age of 36 years: The Amsterdam Growth and Health Longitudinal Study. Eur. J. Clin. Nutr. 2009, 63, 536–542. [Google Scholar] [CrossRef]
- Karabudak, E.; Türközü, D.; Köksal, E. Association between coffee consumption and serum lipid profile. Exp. Ther. Med. 2015, 9, 1841–1846. [Google Scholar] [CrossRef]
- Jee, S.H.; He, J.; Appel, L.J.; Whelton, P.K.; Suh, I.; Klag, M.J. Coffee consumption and serum lipids: A meta-analysis of randomized controlled clinical trials. Am. J. Epidemiol. 2001, 153, 353–362. [Google Scholar] [CrossRef]
- Balk, L.; Hoekstra, T.; Twisk, J. Relationship between long-term coffee consumption and components of the metabolic syndrome: The Amsterdam Growth and Health Longitudinal Study. Eur. J. Epidemiol. 2009, 24, 203–209. [Google Scholar] [CrossRef] [PubMed]
- Cai, L.; Ma, D.; Zhang, Y.; Liu, Z.; Wang, P. The effect of coffee consumption on serum lipids: A meta-analysis of randomized controlled trials. Eur. J. Clin. Nutr. 2012, 66, 872–877. [Google Scholar] [CrossRef] [PubMed]
- Burr, M.L.; Limb, E.S.; Sweetnam, P.M.; Fehily, A.M.; Amarah, L.; Hutchings, A. Instant coffee and cholesterol: A randomised controlled trial. Eur. J. Clin. Nutr. 1995, 49, 779–784. [Google Scholar] [PubMed]
- Nakanishi, N.; Nakamura, K.; Suzuki, K.; Tatara, K. Lifestyle and the development of dyslipidemia: A 4-year follow-up study of middle-aged Japanese male office workers. Environ. Health Prev. Med. 1999, 4, 140–145. [Google Scholar] [CrossRef]
- Nakanishi, N.; Tatara, K.; Nakamura, K.; Suzuki, K. Association of lifestyle with serum lipid levels: A study of middle-aged Japanese men. J. Epidemiol. 2000, 10, 216–225. [Google Scholar] [CrossRef]
- Vernarelli, J.A.; Lambert, J.D. Tea consumption is inversely associated with weight status and other markers for metabolic syndrome in U.S. adults. Eur. J. Nutr. 2013, 52, 1039–1048. [Google Scholar] [CrossRef]
- Bouchard, D.R.; Ross, R.; Janssen, I. Coffee, tea and their additives: Association with BMI and waist circumference. Obes. Facts 2010, 3, 345–352. [Google Scholar] [CrossRef]
- Mozaffarian, D.; Hao, T.; Rimm, E.B.; Willett, W.C.; Hu, F.B. Changes in diet and lifestyle and long-term weight gain in women and men. N. Engl. J. Med. 2011, 364, 2392–2404. [Google Scholar]
- Ding, M.; Bhupathiraju, S.N.; Satija, A.; van Dam, R.M.; Hu, F.B. Long-term coffee consumption and risk of cardiovascular disease: A systematic review and dose-response meta-analysis of prospective cohort studies. Circulation 2014, 129, 643–659. [Google Scholar] [CrossRef]
- Carlström, M.; Larsson, S.C. Coffee consumption and reduced risk of developing type 2 diabetes: A systematic review with meta-analysis. Nutr. Rev. 2018, 76, 395–417. [Google Scholar] [CrossRef]
Figure 1.
Prevalence of metabolic syndrome and its components depending on coffee consumption in both men and women. *P=0.004 for higher TG in men (A) and **P=0.033 for lower HDL-cholesterol in women (B). P<0.05 at the Chi-square test for independence to determine whether there is a significant correlation between the level of coffee consumption and metabolic syndrome components.
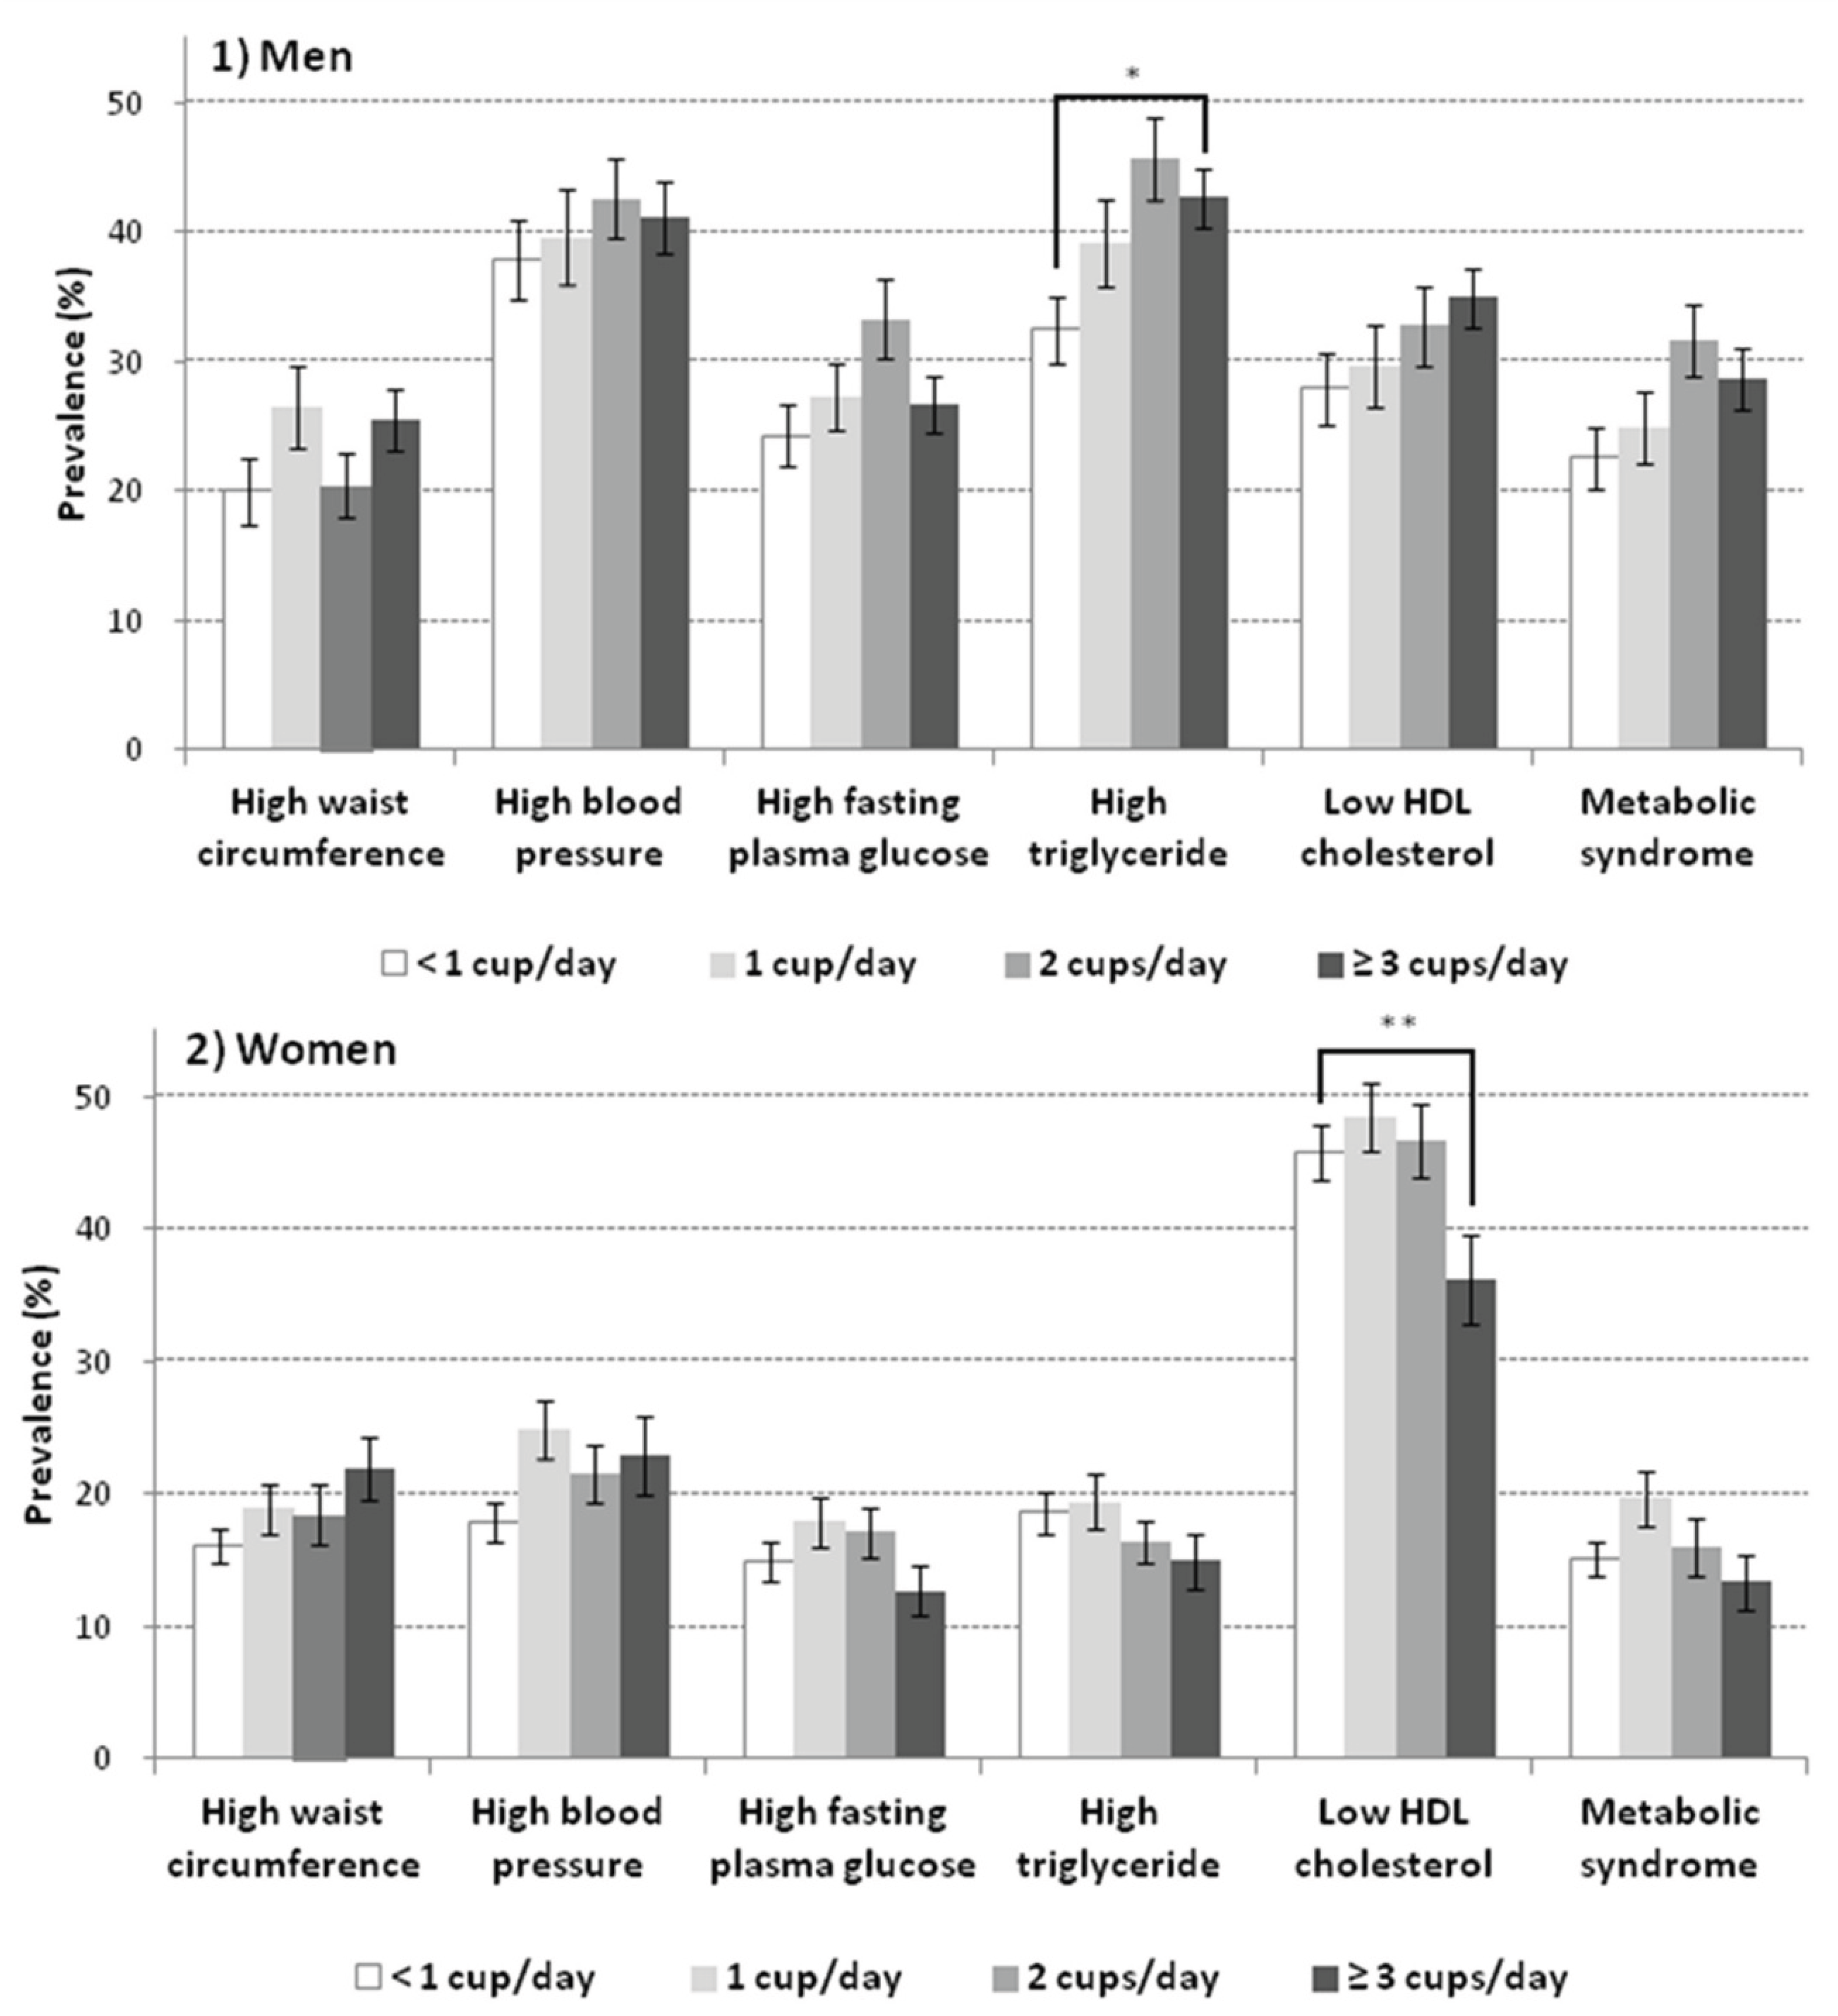

Table 1.
Baseline characteristics of the subjects (n=3,844).
| Men (n=1,531) | Women (n=2,313) | P-value | MetS (-) (n=2,969) | MetS (+) (n=875) | P-value | |||||
| Mean | ±SE | Mean | ±SE | Mean | ±SE | Mean | ±SE | |||
| Age (years) | 44.2 | ±0.6 | 43.9 | ±0.4 | 0.561 | 39.5 | ±0.4 | 48.5 | ±0.5 | < 0.001 |
| Waist circumference (cm) | 84.1 | ±0.3 | 76.6 | ±0.3 | < 0.001 | 77.4 | ±0.2 | 90.0 | ±0.4 | < 0.001 |
| Systolic blood pressure (mmHg) | 117.5 | ±0.5 | 111.9 | ±0.4 | < 0.001 | 111.0 | ±0.4 | 127.3 | ±0.6 | < 0.001 |
| Diastolic blood pressure (mmHg) | 80.9 | ±0.4 | 74.1 | ±0.3 | < 0.001 | 75.1 | ±0.3 | 85.4 | ±0.5 | < 0.001 |
| Fasting plasma glucose (mg/dl)* | 98.3 | ±0.8 | 92.7 | ±0.5 | < 0.001 | 91.3 | ±0.4 | 110.1 | ±1.6 | < 0.001 |
| Total cholesterol (mg/dl)* | 188.8 | ±1.2 | 185.2 | ±0.9 | 0.029 | 183.3 | ±0.8 | 199.8 | ±1.8 | < 0.001 |
| Triglyceride (mg/dl)* | 158.4 | ±4.9 | 102.0 | ±1.9 | < 0.001 | 101.8 | ±1.7 | 227.0 | ±8.0 | < 0.001 |
| HDL-cholesterol (mg/dl) | 46.1 | ±0.3 | 51.8 | ±0.3 | < 0.001 | 51.1 | ±0.3 | 41.7 | ±0.3 | < 0.001 |
| Total energy intake (kcal/day)* | 2550 | ±28 | 1780 | ±19 | < 0.001 | 2158 | ±23 | 2222 | ±40 | 0.116 |
| % | (SE) | % | (SE) | % | (SE) | % | (SE) | |||
| Women | - | - | - | - | NA | 55.8 | (1.0) | 39.1 | (1.8) | < 0.001 |
| Residence: Rural area | 30.3 | (2.5) | 28.5 | (2.3) | 0.207 | 28.4 | (2.3) | 32.7 | (2.8) | 0.030 |
| Marital status: Single | 30.6 | (1.6) | 25.1 | (1.3) | 0.002 | 30.2 | (1.4) | 18.9 | (1.8) | < 0.001 |
| Education level: < 12 years | 17.1 | (1.3) | 26.1 | (1.5) | < 0.001 | 17.6 | (1.2) | 36.9 | (2.2) | < 0.001 |
| Economic inactive or unemployed | 15.7 | (1.3) | 42.7 | (1.4) | < 0.001 | 31.0 | (1.2) | 25.4 | (1.8) | 0.013 |
| The use of antihypertensive drugs | 11.5 | (1.0) | 9.5 | (0.7) | 0.091 | 4.2 | (0.5) | 32.7 | (1.9) | < 0.001 |
| The use of hypoglycemic agents | 4.8 | (0.6) | 2.9 | (0.4) | 0.005 | 1.2 | (0.2) | 13.2 | (1.2) | < 0.001 |
| The use of antidyslipidemic drugs | 3.8 | (0.6) | 3.6 | (0.4) | 0.834 | 1.1 | (0.2) | 13.0 | (1.5) | < 0.001 |
| Smoking | < 0.001 | < 0.001 | ||||||||
| Ex-smoker | 31.5 | (1.5) | 7.7 | (0.8) | 17.5 | (0.8) | 24.9 | (1.9) | ||
| Current smoker | 49.0 | (1.6) | 5.5 | (0.7) | 25.0 | (1.1) | 31.0 | (1.9) | ||
| High risk alcohol consumption | 22.9 | (1.3) | 5.0 | (0.6) | < 0.001 | 12.0 | (0.8) | 18.9 | (1.6) | < 0.001 |
| Regular walking activity | 40.3 | (1.6) | 39.8 | (1.3) | 0.841 | 40.1 | (1.1) | 39.8 | (2.0) | 0.868 |
| Body mass index: ≥ 25 kg/m2 | 38.4 | (1.6) | 24.5 | (1.0) | < 0.001 | 21.0 | (1.0) | 67.3 | (2.1) | < 0.001 |
| Metabolic syndrome | 27.8 | (1.3) | 16.4 | (0.8) | < 0.001 | - | - | - | - | NA |
| Coffee consumption ≥ 1 cup/day | 68.9 | (1.5) | 64.8 | (1.3) | 0.038 | 65.5 | (1.1) | 71.2 | (1.9) | 0.012 |
| Coffee consumption | < 0.001 | 0.081 | ||||||||
| < 1 cup/day | 31.1 | (1.5) | 35.2 | (1.3) | 34.5 | (1.1) | 28.8 | (1.9) | ||
| 1 cup/day | 19.4 | (1.2) | 24.5 | (1.1) | 21.9 | (0.9) | 22.6 | (1.8) | ||
| 2 cups/day | 19.7 | (1.2) | 24.8 | (1.1) | 21.5 | (1.0) | 23.7 | (1.7) | ||
| ≥ 3 cups/day | 29.8 | (1.4) | 15.5 | (1.0) | 22.2 | (0.9) | 24.9 | (2.1) | ||
* Values presented are the estimated mean, but log values were used for comparisons. P-values at Student’s t-test or chi-square test.
Table 2.
Baseline characteristics of the study subjects depending on coffee consumption in both men and women.
Table 2.
Baseline characteristics of the study subjects depending on coffee consumption in both men and women.
| Variables by gender | Coffee consumption | P-value | ||||||||
| < 1 cup/day | 1 cup/day | 2 cups/day | ≥ 3 cups/day | |||||||
| Men (n=1,531) | (n=414) | (n=300) | (n=336) | (n=481) | ||||||
| Age (years) | 37.0 | ±0.8 | 41.4 | ±0.9 | 43.6 | ±0.8 | 43.1 | ±0.6 | < 0.001 | |
| Total energy intake (kcal/day)* | 2508 | ±59 | 2372 | ±55 | 2568 | ±59 | 2698 | ±58 | 0.063 | |
| Residence: Rural area | 29.2 | (3.4) | 28.5 | (3.8) | 30.3 | (3.6) | 33.5 | (3.5) | 0.575 | |
| Marital status: Single | 48.4 | (2.9) | 34.9 | (3.4) | 20.5 | (2.9) | 19.1 | (2.3) | < 0.001 | |
| Education level: < 12 years | 11.8 | (1.6) | 19.4 | (2.7) | 16.6 | (2.3) | 18.7 | (2.1) | 0.019 | |
| Economic inactive or unemployed | 27.4 | (2.7) | 19.0 | (3.1) | 10.9 | (1.9) | 6.8 | (1.2) | < 0.001 | |
| Smoking | < 0.001 | |||||||||
| Ex-smoker | 32.1 | (2.5) | 30.1 | (2.7) | 39.0 | (2.8) | 25.4 | (2.3) | ||
| Current smoker | 39.2 | (3.1) | 44.4 | (3.1) | 45.0 | (3.0) | 64.9 | (2.4) | ||
| High risk alcohol consumption | 21.8 | (2.5) | 20.0 | (2.6) | 25.5 | (2.8) | 23.4 | (2.2) | 0.516 | |
| Regular walking activity | 43.1 | (3.0) | 40.7 | (3.3) | 38.8 | (3.1) | 37.3 | (2.5) | 0.449 | |
| Body mass index: ≥ 25 kg/m2 | 34.8 | (3.1) | 38.2 | (3.3) | 38.9 | (3.2) | 41.3 | (2.8) | 0.423 | |
| Women (n=2,313) | (n=806) | (n=598) | (n=570) | (n=339) | ||||||
| Age (years) | 39.0 | ±0.6 | 43.0 | ±0.6 | 42.4 | ±0.6 | 42.6 | ±0.7 | < 0.001 | |
| Total energy intake (kcal/day)* | 1778 | ±34 | 1774 | ±34 | 1783 | ±34 | 1786 | ±48 | 0.985 | |
| Residence: Rural area | 27.8 | (2.5) | 27.4 | (3.0) | 29.1 | (3.2) | 32.0 | (4.3) | 0.646 | |
| Marital status: Single | 33.7 | (2.2) | 27.3 | (2.5) | 17.8 | (2.2) | 20.1 | (3.2) | < 0.001 | |
| Education level: < 12 years | 26.2 | (2.0) | 26.7 | (2.3) | 24.4 | (2.7) | 21.4 | (2.7) | 0.419 | |
| Economic inactive or unemployed | 50.4 | (2.6) | 44.0 | (2.5) | 36.1 | (2.2) | 31.3 | (2.9) | < 0.001 | |
| Smoking | < 0.001 | |||||||||
| Ex-smoker | 7.6 | (1.2) | 7.5 | (1.7) | 6.3 | (1.1) | 9.6 | (2.3) | ||
| Current smoker | 5.2 | (1.1) | 2.8 | (0.8) | 4.2 | (1.2) | 13.0 | (2.3) | ||
| High risk alcohol consumption | 5.0 | (1.0) | 3.9 | (1.1) | 4.3 | (1.1) | 7.5 | (1.7) | 0.198 | |
| Regular walking activity | 39.2 | (2.0) | 41.7 | (2.5) | 37.8 | (2.7) | 42.6 | (3.2) | 0.559 | |
| Body mass index: ≥ 25 kg/m2 | 22.1 | (1.6) | 25.0 | (1.9) | 22.7 | (2.2) | 30.1 | (3.0) | 0.072 | |
Data expression as estimated mean±standard error or estimated percent (standard error), as appropriate. *Values presented are the estimated mean, but log values are used for comparisons. P-values at ANOVA with Bonferroni’s correction or Chi-square test.
Table 3.
Adjusted odds ratios of metabolic syndrome and its components depending on coffee consumption in both men and women.
Table 3.
Adjusted odds ratios of metabolic syndrome and its components depending on coffee consumption in both men and women.
| Coffee consumption | P for trend | |||||||||
| < 1 cup/day | 1 cup/day | 2 cups/day | ≥ 3 cups/day | |||||||
| Men | ||||||||||
| Metabolic syndrome | 1 | (reference) | 0.801 | (0.527-1.218) | 1.101 | (0.693-1.747) | 0.843 | (0.565-1.258) | 0.648 | |
| High WC | 1 | (reference) | 1.310 | (0.737-2.330) | 0.743 | (0.411-1.343) | 0.930 | (0.559-1.548) | 0.439 | |
| High BP | 1 | (reference) | 0.845 | (0.568-1.255) | 0.830 | (0.567-1.217) | 0.811 | (0.568-1.159) | 0.272 | |
| High FPG | 1 | (reference) | 0.825 | (0.553-1.230) | 1.066 | (0.697-1.632) | 0.756 | (0.540-1.058) | 0.219 | |
| High TG | 1 | (reference) | 1.145 | (0.784-1.672) | 1.314 | (0.921-1.876) | 1.069 | (0.771-1.481) | 0.586 | |
| Low HDL-C | 1 | (reference) | 0.951 | (0.640-1.415) | 1.080 | (0.730-1.598) | 1.123 | (0.795-1.587) | 0.423 | |
| Women | ||||||||||
| Metabolic syndrome | 1 | (reference) | 1.057 | (0.651-1.716) | 1.032 | (0.643-1.657) | 0.541 | (0.329-0.891) | 0.056 | |
| High WC | 1 | (reference) | 0.950 | (0.588-1.535) | 1.221 | (0.791-1.886) | 1,002 | (0.626-1.603) | 0.623 | |
| High BP | 1 | (reference) | 1.136 | (0.777-1.660) | 1.198 | (0.817-1.755) | 1.234 | (0.782-1.948) | 0.295 | |
| High FPG | 1 | (reference) | 0.988 | (0.694-1.407) | 1.137 | (0.828-1.561) | 0.714 | (0.471-1.081) | 0.346 | |
| High TG | 1 | (reference) | 0.842 | (0.596-1.190) | 0.797 | (0.547-1.162) | 0.563 | (0.362-0.877) | 0.015 | |
| Low HDL-C | 1 | (reference) | 1.033 | (0.788-1.355) | 0.960 | (0.728-1.266) | 0.590 | (0.411-0.846) | 0.011 | |
Data is expressed as odds ratio with a 95% confidence interval. Age adjusted for continuous variables, and the marital status, education level (only for men), economic activity, smoking and body mass index adjusted for categorical ones.
Disclaimer/Publisher’s Note: The statements, opinions and data contained in all publications are solely those of the individual author(s) and contributor(s) and not of MDPI and/or the editor(s). MDPI and/or the editor(s) disclaim responsibility for any injury to people or property resulting from any ideas, methods, instructions or products referred to in the content. |
© 2026 by the authors. Licensee MDPI, Basel, Switzerland. This article is an open access article distributed under the terms and conditions of the Creative Commons Attribution (CC BY) license (http://creativecommons.org/licenses/by/4.0/).
Copyright: This open access article is published under a Creative Commons CC BY 4.0 license, which permit the free download, distribution, and reuse, provided that the author and preprint are cited in any reuse.


