
Submitted:
12 April 2025
Posted:
15 April 2025
You are already at the latest version
Abstract
Background/Objectives: In this longitudinal study, the relationship between chewing status and fatty liver was examined in 3,775 people aged ≥ 50 years who underwent medical checkups at Junpukai Health Maintenance Center in Okayama, Japan. Methods: Participants without fatty liver at a baseline survey in 2018 were followed until 2022. Chewing status was assessed by self-administered questionnaire. The presence or absence of fatty liver was ascertained from the medical records of Junpukai Health Maintenance Center. Results: A total of 541 participants (14%) were diagnosed as having poor chewing status at baseline. Furthermore, 318 (8%) participants were newly diagnosed with fatty liver at follow-up. Multivariate logistic regression analyses showed that the presence or absence of fatty liver was associated with sex (male; odds ratio [OR], 1.830; 95% confidence interval [CI], 1.414-2.368), age (OR, 0.969; 95% CI, 0.948-0.991), body mass index (≥25.0 kg/m2; OR, 1.975; 95% CI, 1.510-2.585), diastolic blood pressure (OR, 1.017; 95% CI, 1.002-1.032), and chewing status (poor; OR, 1.475; 95% CI, 1.090-1.996) at baseline. Conclusions: The results indicate that poor chewing status was associated with fatty liver development after 4 years. Maintaining good chewing status may prevent future unhealthy fat accumulation in the liver.
Keywords:
chewing status
; fatty liver
; longitudinal study
; medical checkups
; self-administered questionnaire
1. Introduction
Fatty liver is a condition in which excess fat accumulates in the liver, and lipolysis is impaired, resulting in abnormal lipid metabolism and an unhealthy condition in the liver [1,2]. In recent years, the proportion of Japanese patients with fatty liver has been increasing, and it is reported that about 10-30% of Japanese people have fatty liver [3,4,5]. Patients with fatty liver often show few subjective symptoms when the disease is mild [6]. However, as symptoms progress, liver failure, kidney failure, and liver cancer may occur [7,8,9]. Therefore, identifying and controlling factors associated with new-onset fatty liver will contribute to preventing the development of liver failure, kidney failure, and liver cancer.
Chewing status is one of the health conditions related to eating behavior and eating habits that has been implicated in fat accumulation in the body. For example, past epidemiological studies showed that chewing status is associated with abdominal obesity [10,11]. Furthermore, another epidemiological study also reported the association between poor chewing status and fatty liver [12]. However, these studies showed the cross-sectional association between chewing status and fat accumulation status, and it is not still clear whether poor chewing status could lead to fatty liver in the future.
In Japan, the Ministry of Health, Labour and Welfare mandates the provision of specific health checkups focusing on lifestyle [13,14]. The questionnaire of the specific health checkups includes items such as eating behavior, including chewing status [15]. Furthermore, in Junpukai Health Maintenance Center in Okayama, Japan, participants who undergo the specified health checkups can receive medical checkups for fatty liver if they so desire. Therefore, by combining these data, the association between chewing status and fatty liver can be investigated.
In addition, it has been reported that the state of chewing status begins to decline around middle age [16], and in Japan, an increase in the “proportion of Japanese people aged ≥ 50 years with good chewing status” has been set as a health philosophy in the national health promotion movement “Healthy Japan 21” to promote the health of Japanese people in the 21st century. In other words, there is a high possibility of finding a longitudinal association between masticatory status and fatty liver in a population aged ≥ 50 years, in which reduced mastication is more likely to be observed. Therefore, the present study was a longitudinal study over a period of 4 years in which the aim was to clarify the longitudinal relationships between chewing status and fatty liver in Japanese people aged ≥ 50 years who underwent medical checkups at Junpukai Health Maintenance Center.
2. Materials and Methods
Study Design
This was a prospective, cohort study with a follow-up period of 4 years. The disease of interest was fatty liver, and the factor considered was good or poor chewing status.
Participants
Data from community residents who underwent medical checkups at Junpukai Health Maintenance Center in Okayama, Japan, were analyzed. Participants without fatty liver at the baseline survey in 2018 were followed until 2022. Informed consent was not obtained because this study used anonymized claims data.
Assessment of Fatty Liver
The presence or absence with fatty liver was diagnosed by abdominal ultrasonography at Junpukai Health Maintenance Center. A skilled technician performed real-time ultrasound examinations to detect blurred vessels, deep attenuation, and increased echotexture of the liver compared with the kidneys to assess the degree of fatty infiltration [17]. An expert physician then confirmed the validity of the findings.
Assessment of Body Composition
Nurses measured the height and weight of participants. The body mass index (BMI) was calculated as weight divided by the square of height (kg/m2) [12]. In general, BMI ≥ 25.0 kg/m2 indicates obesity in Japan [18]. Therefore, the presence or absence of BMI ≥ 25.0 kg/m2 was analyzed as a factor in this study.
Assessment of the Serum Hemoglobin A1c (HbA1c) Level
The serum HbA1c level was measured using high-performance liquid chromatography on venous blood samples collected after an overnight fast [19]. In general, a serum HbA1c level ≥ 6.5% indicates poor glycemic control [20]. Therefore, the presence or absence of a serum HbA1c level ≥ 6.5% was analyzed as a factor in this study.
Assessment of Blood Pressure Levels
Nurses measured the systolic and diastolic blood pressures of the participants. Blood pressure levels were measured twice for each participant, and the mean value was calculated [21].
Assessment of Chewing Status and Other Items by a Self-Administered Questionnaire
The self-administered questionnaire was the same one used in specific health checkups in Japan [22]. Regarding current chewing status, participants selected from: “I can eat anything.”; “I sometimes have difficulty chewing due to dental problems such as dental caries or periodontal disease.”; and “I can hardly chew.” Participants who answered “I can eat anything.” were defined as having good chewing status, whereas those who answered “I sometimes have difficulty chewing due to dental problems such as dental caries or periodontal disease.” and “I can hardly chew.” were defined as having poor chewing status [10]. Other items on the specific health checkup questionnaire included data on the following: sex, age, smoking (smoking at least one cigarette per day: presence or absence), drinking (drinking alcohol at least once per day: presence or absence), exercise (“I have engaged in light ≥ 30-minute exercise more than twice/week for ≥ 1 year”: presence or absence), physical activity (“I go for a walk or perform an equivalent physical activity for ≥1 hour/day”: presence or absence), sleep status (good or poor), eating speed (slow, medium, or quick), snacking (none, sometimes, or daily), skipping breakfast (< 3 times/week or ≥ 3 times/week), and dinner within 2 hours before bedtime (< 3 times/week or ≥ 3 times/week) [13,22,23,24].
Sample Size
The study included all participants who underwent medical checkups at Junpukai Health Maintenance Center survey in 2018 and 2022, respectively.
Statistical Analysis
Normality of the data was checked with the Lilliefors tests. It was found that all continuous variables were not normally distributed. Therefore, the data are expressed as median (first and third quartile) values. Significant differences in characteristics of each factor by good or poor chewing status were assessed using Fisher’s exact test and the Mann-Whitney U test. Univariate and multivariate logistic regression analyses were performed with the presence of fatty liver as the dependent variable. On multivariate stepwise logistic regression analysis, factors that were significantly different on univariate logistic regression analysis in addition to sex and age were selected for the third category. The suitability of the model using multivariate stepwise logistic regression analysis was confirmed by the Hosmer-Lemeshow fit test. All data were analyzed using statistical analysis software (SPSS statistics version 27; IBM Japan, Tokyo, Japan). All p-values < 0.05 were considered significant.
Research Ethics
The present study was approved by the Ethics Committee of Asahi University (No. 27010 and 30018) and was performed in accordance with Declaration of Helsinki (as revised in Brazil 2013).
3. Results
Between April 2018 and March 2019, a total of 10,411 Japanese persons aged ≥ 50 years participated in the baseline survey. First, participants with fatty liver at baseline (2458 participants) were excluded. Furthermore, participants with missing data for blood tests (170 participants) were excluded from the analysis. Of these 7,783 participants, 3,775 were followed from April 2022 to March 2023 (follow-up rate, 49%). Therefore, the data of 3,775 community residents (1,620 male and 2,155 female, mean age 57.6 years) were analyzed in the present study (Figure 1).
Figure 1.
Table 1 shows the characteristics of the participants by chewing status at baseline. A total of 541 participants (14%) were diagnosed as having poor chewing status at baseline. Participants with poor chewing status were characterized by a significantly higher proportion of males (p < 0.001), smoking (p < 0.001), drinking (p < 0.001), poor sleep status (p < 0.001), skipping breakfast ≥ 3 times /week (p < 0.001), and dinner within 2 hours before bedtime ≥ 3 times /week (p < 0.001). Furthermore, participants with poor chewing status were characterized by significantly lower age (p = 0.024), BMI (p < 0.001), systolic blood pressure (p < 0.001), and diastolic blood pressure (p < 0.001).
Abbreviations: BMI, body mass index; HbA1c, hemoglobin A1c. * p < 0.05, using Fishers exact test or Mann-Whitney U test. a Male (proportion of male); b Presence (proportion of presence).
Table 2 shows the relationship between chewing status at baseline and fatty liver at follow-up. A total of 318 (8%) participants were newly diagnosed with fatty liver at follow-up. Participants with poor chewing status at baseline were characterized by a significantly higher proportion of fatty liver at follow-up (p = 0.002).
Table 3 shows the crude odds ratios [ORs] and 95% confidence intervals [CIs] for fatty liver at follow-up. The results showed that the risk of fatty liver after 4 years was significantly correlated with sex (male; OR, 2.165; 95% CI, 1.712-2.738), age (OR, 0.968; 95% CI, 0.948-0.988), BMI ≥25.0 kg/m2 (OR, 2.281; 95% CI, 1.764-2.950), smoking (OR, 1.496; 95% CI, 1.123-1.993), systolic blood pressure (OR, 1.007; 95% CI, 1.001-1.013), diastolic blood pressure (OR, 1.019; 95% CI, 1.010-1.029), sleep status (poor: OR, 1.278; 95% CI, 1.013-1.613), poor chewing status (OR, 1.574; 95% CI, 1.177-2.105), skipping breakfast ≥ 3 times/week (OR, 1.594; 95% CI, 1.140-2.229), and dinner within 2 hours before bedtime ≥ 3 times/week (OR, 1.671; 95% CI, 1.307-2.136) at baseline.
Table 4 shows adjusted ORs and 95% CIs for fatty liver at follow-up. After adjusting for sex, age, BMI, smoking, systolic blood pressure, diastolic blood pressure, sleep status, chewing status, skipping breakfast, and dinner within 2 hours before bedtime, the risk of fatty liver at 4 years was significantly correlated with sex (male; OR, 1.830; 95% CI, 1.414-2.368), age (OR, 0.969; 95% CI, 0.948-0.991), BMI ≥25.0 kg/m2 (OR, 1.975; 95% CI, 1.510-2.585), diastolic blood pressure (OR, 1.017; 95% CI, 1.002-1.032), and poor chewing status (OR, 1.475; 95% CI, 1.090-1.996) at baseline.
4. Discussion
To the best of our knowledge, this is the first longitudinal study to examine the associations between chewing status and fatty liver in Japanese people aged ≥ 50 years using data from medical checkups. The results showed that participants with poor chewing status at baseline had a higher proportion of participants with fatty liver after 4 years than those with good chewing status. The results of logistic regression analysis showed that after adjusting for sex, age, BMI, smoking, systolic blood pressure, diastolic blood pressure, sleep status, skipping breakfast, and dinner within 2 hours before bedtime, the presence or absence of fatty liver after 4 years was associated with poor chewing status at baseline. Thus, a decrease in chewing status was associated with a higher risk of the onset of fatty liver in the future.
There are several possible mechanisms for the association between chewing status and fatty liver. First, a lack of systemic caloric expenditure may be involved. It has been noted that poor chewing status causes a decrease in diet-induced heat production and induction of neurohistamine inactivation [25,26,27]. The lack of calories consumed due to these factors may affect fat accumulation in the liver. Second, eating habits may also be involved. It has been reported that people with poor chewing status tend to consume less vegetables and fruits and more soft high-energy foods than those with good chewing status [28,29,30,31]. Furthermore, it has also been also noted that an increase in the number of chews increases subjective satiety after a meal, which is involved in the prevention of overeating [32]. It has been reported that overeating affects fat accumulation in the liver [33]. These contribute to obesity and may affect fat accumulation in the liver. However, further research is needed to clarify the mechanism by which poor chewing status is associated with fatty liver.
Previous studies have reported the relationship between chewing status and fat accumulation. For example, it has been reported that chewing difficulty affects abdominal obesity [34]. It has also been shown that unbalanced chewing habits due to poor chewing status were associated with overweight and obesity [35]. Previous studies and the present study support the concept that poor chewing status may be involved in unhealthy fat accumulation in the body.
In the present study, a self-administered questionnaire was used to evaluate participants’ chewing status. Therefore, it is possible that the participants’ subjective symptoms and their actual chewing ability may differ. However, it has been reported that chewing status confirmed by a self-administered questionnaire is not only related to the number of present teeth and molars, but also useful as a screening method for actual chewing ability [36]. Another study also indicated that a self-administered questionnaire on chewing status reflects dental and oral health status, and knowing the results of a self-administered questionnaire may improve participants’ dental and oral health status and improve metabolic syndrome [37].
In the present study, male, younger age (among aged ≥ 50 years), BMI, and diastolic blood pressure were associated with the presence of fatty liver in participants aged ≥ 50 years. These results are consistent with previous studies reporting that fatty liver is a disease that is more likely to affect men [38] and is associated with higher BMI [39,40]. In addition, a previous study reported that the most common age of persons with fatty liver in Japan is about 52 years [41]. Therefore, it is possible that fatty liver tended to develop at a younger age in the present study, which was limited to participants aged ≥ 50 years. Furthermore, an elevated diastolic blood pressure is not only a hypertensive state, but also suggests the progression of arterial stiffness [42]. Fatty liver is associated with atherosclerosis, as well as hypertension [43,44]. Therefore, though both systolic and diastolic blood pressures were associated with fatty liver on univariate analysis, diastolic blood pressure may have been associated with fatty liver as a stronger factor on multivariate analysis in which both factors were analyzed simultaneously.
The proportion of the present participants with fatty liver was 8%, and that with poor chewing status was 14%. In Japan, it has been reported that the proportion of people with fatty liver ranges from 10% to 30% [3,4,5]. Furthermore, according to the data of Health Japan 21 (the third term), the proportion of people aged ≥ 50 years with poor chewing status in 2019 was 29% [45]. This indicates that the proportion of the present participants with fatty liver and poor chewing status was lower than that of the average Japanese population. The reason for this is that the present participants were people who underwent medical checkups, suggesting that they may have been more health-conscious on a daily basis. Therefore, the results may differ if a different health population were to be targeted.
In the present study, the Hosmer-Lemeshow fit test was used in the multivariate logistic regression analysis model. The Hosmer-Lemeshow fit test is used to examine the fit of multivariate logistic regression analysis models and tests whether the event rate observed in a subgroup model is compatible with the expected event rate. The Hosmer-Lemeshow fit test is considered a good fit if the p-value > 0.05 [46]. In the present study, the p-value was 0.489. Therefore, the present multivariate logistic regression analysis model was diagnosed as having a good fit.
However, there are several limitations in the present study. First, the participants included only those who underwent medical checkups at Junpukai Health Maintenance Center. Therefore, external validity should be considered. Second, dietary intake of the participants was not investigated. A past study reported that fatty liver is associated with fructose intake and unhealthy eating habits [47]. It is possible that usual eating habits may affect fat accumulation, and we would like to examine this point in the future. However, a major strength of the present study is the sample size of over 3,700 Japanese people aged ≥ 50 years. This sample size is sufficient to demonstrate a longitudinal relationship between chewing status and future fatty liver development, and it may help to infer factors associated with unhealthy fat accumulation in the liver in the Japanese population.
5. Conclusions
The present study showed that Japanese people aged ≥ 50 years with poor chewing status have a higher risk for fatty liver after 4 years. Maintaining good chewing status may prevent future unhealthy fat accumulation in the liver.
Author Contributions
The present study was carried out with the collaboration of all authors. Methodology, K.I., D.E., T.A. and T.T.; formal analysis, T.A. and T.M.; investigation, T.A., T.Y., K.T., N.T., K.K. and T.M.; writing-original draft preparation, K.I.; writing-review and editing, K.I., D.E., and T.T.; supervision, T.T.; project administration, T.T. All authors have read and agreed to the published version of the manuscript.
Funding
This study was self-funded by the authors and their institution. This research received no external funding.
Institutional Review Board Statement
The study was conducted in accordance with the Declaration of Helsinki and approved by the Ethics Committee of Asahi University (No. 27010; Approved August 21, 2015 and 30018; Approved February 23, 2023).
Informed Consent Statement
Informed consent was not obtained because this study used anonymized claims data.
Data Availability Statement
The data presented in this study are available on request from the corresponding author. The data are not publicly available due to ethical restrictions.
Acknowledgments
The authors are grateful to Junpukai Health Maintenance Center for providing the data.
Conflicts of Interest
The authors declare no conflicts of interest.
References
- Allison, M. Fatty liver. Hosp Med. 2004, 65, 609–612. [Google Scholar] [CrossRef]
- Dietrich, P.; Hellerbrand, C. Non-alcoholic fatty liver disease, obesity and the metabolic syndrome. Best Pract Res Clin Gastroenterol. 2014, 28, 637–653. [Google Scholar] [CrossRef] [PubMed]
- Eguchi, Y.; Hyogo, H.; Ono, M.; Mizuta, T.; Ono, N.; Fujimoto, K.; Chayama, K.; Saibara, T. Prevalence and associated metabolic factors of nonalcoholic fatty liver disease in the general population from 2009 to 2010 in Japan: a multicenter large retrospective study. J Gastroenterol. 2012, 47, 586–595. [Google Scholar] [CrossRef] [PubMed]
- Sasamori, N. Nationwide results of the 2008 Ningen Dock. Ningen Dokku. 2009, 24, 901–948. [Google Scholar]
- Taniai, M. Epidemiology of NAFLD/NASH. J Society Internal Medicine. 2020, 109, 11–18. [Google Scholar]
- Steven, F.; Rudolph, B. Nonalcoholic fatty liver disease. Pediatr Rev. 2015, 36, 198–205. [Google Scholar]
- Roeb, E. NASH (non-alcoholic steatohepatitis): fatty liver or fatal liver disease? Zentralbl Chir. 2014, 139, 168–174. [Google Scholar]
- Wang, Y.; Wang, F.; Bu, Y.; Targher, G.; Byrne, C.; Sun, D.; Zheng, M. Association of metabolic dysfunction-associated fatty liver disease with kidney disease. Nat Rev Nephrol. 2022, 18, 259–268. [Google Scholar] [CrossRef]
- Marengo, A.; Rosso, C.; Elisabetta, B. Liver cancer: Connections with obesity, fatty liver, and cirrhosis. Annu Rev Med. 2016, 67, 103–117. [Google Scholar] [CrossRef]
- Iwai, K.; Azuma, T.; Yonenaga, T.; Ekuni, D.; Watanabe, K.; Obora, A.; Deguchi, F.; Kojima, T.; Morita, M.; Tomofuji, T. Association between self-reported chewing status and glycemic control in Japanese adults. Int J Environ Res Public Health. 2021, 18, 9548. [Google Scholar] [CrossRef]
- Motokawa, K.; Mikami, Y.; Shirobe, M.; Edahiro, A.; Ohara, Y.; Iwasaki, M.; Watanabe, Y.; Kawai, H.; Kera, T.; Obuchi, S.; Fujiwara, Y.; Ihara, K.; Hirano, H. Relationship between chewing ability and nutritional status in Japanese older adults: A cross-sectional study. Int J Environ Res Public Health. 2021, 18, 1216. [Google Scholar] [CrossRef] [PubMed]
- Iwai, K.; Azuma, T.; Yonenaga, T.; Sasai, Y.; Watanabe, K.; Deguchi, F.; Obora, A.; Kojima, T.; Tomofuji, T. Relationship between chewing status and fatty liver diagnosed by liver/spleen attenuation ratio: A cross-sectional study. Int J Environ Res Public Health. 2022, 20, 307. [Google Scholar] [CrossRef]
- Ministry of Health, Labour and Welfare. Standard health examination and health guidance program for fiscal year 2008. https://www.mhlw.go.jp/file/06-Seisakujouhou-10900000-Kenkoukyoku/00_3 (Accessed on , 2025). 13 March.
- Suzuki, S.; Sano, Y. Guidebook for specified health examination and specified health guidance leading to results. Chuohoki: Tokyo, Japan, 2014.
- Miyano, T.; Anada, T.; Furuta, M.; Yamashita, Y. Prefectural differences in chewing ability in questionnaire for specific health checkup and exploring related factors. J Dent Hlth. 2023, 73, 103–111. [Google Scholar]
- Iyota, K.; Mizutani, S.; Oku, S.; Asao, M.; Futatsuki, T.; Inoue, R.; Imai, Y.; Kashiwazaki, H. A cross-sectional study of age-related changes in oral function in healthy Japanese individuals. Int J Environ Res Public Health. 2020, 17, 1376. [Google Scholar] [CrossRef] [PubMed]
- Japan Society of Gastroenterology. Guidelines for NASH/NAFLD in 2020. https://www.jsge.or.jp/committees/guideline/guideline/pdf/nafldnash2020.pdf#page=58 (Accessed on , 2025). 29 March.
- Japan Society for the Study of Obesity. Obesity clinical practice guidelines in 2016. https://www.jstage.jst.go.jp/article/naika/107/2/107_262/_pdf/-char/ja (Accessed on , 2025). 18 March.
- Kawahara, T.; Imawatari, R.; Kawahara, C.; Inazu, T.; Suzuki, G. Incidence of type 2 diabetes in pre-diabetic Japanese individuals categorized by HbA1c levels: A historical cohort study. PLoS One. 2015, 10, e0122698. [Google Scholar] [CrossRef]
- The International Expert Committee. International expert committee report on the role of the A1C assay in the diagnosis of diabetes. <i>Diabetes Care</i>. <b>2009</b>, 32. The International Expert Committee. International expert committee report on the role of the A1C assay in the diagnosis of diabetes. Diabetes Care, 1327. [Google Scholar]
- Kim, J.; Crimmins, E. Blood pressure and mortality: Joint effect of blood pressure measures. J Clin Cardiol Cardiovasc Ther. 2020, 2, 1009. [Google Scholar] [CrossRef]
- Azuma, T.; Irie, K.; Watanabe, K.; Deguchi, F.; Kojima, T.; Obora, A.; Tomofuji, T. Association between chewing problems and sleep among Japanese adults. Int J Dent. 2019, 2019, 8196410. [Google Scholar] [CrossRef]
- Sultan, Q.; Shereen, A.; Estabraq, M.; Jood, S.; Abdelfattah, AT.; Adil, A. Electronic cigarette among health science students in Saudi Arabia. Ann Thorac Med. 2019, 14, 56–62. [Google Scholar]
- Kudo, A.; Asahi, K.; Satoh, H.; Iseki, K.; Moriyama, T.; Yamagata, K.; Tsuruya, K.; Fujimoto, S.; Narita, I.; Konta, T.; Kondo, M.; Shibagaki, Y.; Kasahara, M.; Watanabe, T.; Shimabukuro, M. Fast eating is a strong risk factor for new-onset diabetes among the Japanese general population. Sci Rep. 2019, 9, 8210. [Google Scholar] [CrossRef]
- Hamada, Y.; Kashima, H.; Hayashi, N. The number of chews and meal duration affect diet-induced thermogenesis and splanchnic circulation. Obesity. 2014, 22, 62–69. [Google Scholar] [CrossRef]
- Morton, J.; Cummings, E.; Baskin, G.; Barsh, S.; Schwartz, W. Central nervous system control of food intake and body weight. Nature. 2006, 443, 289–295. [Google Scholar] [CrossRef] [PubMed]
- Sakata, T.; Yoshimatsu, H.; Kurokawa, M. Hypothalamic neuronal histamine: implications of its homeostatic control of energy metabolism. Nutrition. 1997, 13, 403–411. [Google Scholar] [CrossRef] [PubMed]
- Tada, A.; Miura, H. Systematic review of the association of mastication with food and nutrient intake in the independent elderly. Arch Gerontol Geriatr. 2014, 59, 497–505. [Google Scholar] [CrossRef] [PubMed]
- Tsai, C.; Chang, L. Association of dental prosthetic condition with food consumption and the risk of malnutrition and follow-up 4-year mortality risk in elderly Taiwanese. J Nutr Health Aging. 2011, 15, 265–270. [Google Scholar] [CrossRef]
- Yoshida, M.; Kikutani, T.; Yoshikawa, M.; Tsuga, K.; Kimura, M.; Akagawa, Y. Correlation between dental and nutritional status in community-dwelling elderly Japanese. Geriatr Gerontol Int. 2011, 11, 315–319. [Google Scholar] [CrossRef]
- Lee, S.; Weyant, J.; Corby, P.; Kritchevsky, B.; Harris, B.; Rooks, R.; Rubin, M.; Newman, B. Edentulism and nutritional status in a biracial sample of well-functioning, community-dwelling elderly: the health, aging, and body composition study. Am J Clin Nutr. 2004, 79, 295–302. [Google Scholar] [CrossRef]
- Zhu, Y.; Hsu, W.; Hollis, J. Increasing the number of masticatory cycles is associated with reduced appetite and altered postprandial plasma concentrations of gut hormones, insulin and glucose. Br J Nutr. 2013, 110, 384–390. [Google Scholar] [CrossRef]
- Farrell, G.; Schattenberg, J.; Leclercq, I.; Yeh, M.; Goldin, R.; Teoh, N.; Schuppan, D. Mouse models of nonalcoholic steatohepatitis: Toward optimization of their relevance to human nonalcoholic steatohepatitis. Hepatology. 2019, 69, 2241–2257. [Google Scholar] [CrossRef]
- Sheng, Z.; Xia, B.; Wu, J.; Zhao, X.; He, X.; Wen, X.; Yuan, C.; Pang, T.; Xu, X. Associations between abdominal obesity, chewing difficulty and cognitive impairment in dementia-free Chinese elderly. Am J Alzheimers Dis Other Demen. 2023, 38, 15333175231167118. [Google Scholar] [CrossRef]
- Pereira, A.; Araujo, D.; Scudine, K.; Prado, D.; Lima, D.; Castelo, P. Chewing in adolescents with overweight and obesity: An exploratory study with behavioral approach. Appetite. 2016, 107, 527–533. [Google Scholar] [CrossRef]
- Yanagisawa, T.; Ueno, M.; Shinada, K.; Ohara, S. ; Kawaguchi, Yoko. Validity of self-reported masticatory function in a Japanese population. J Dent Hlth.
- Anzai, K.; Sakai, H.; Kondo, E.; Tanaka, H.; Shibata, A.; Hashidume, M.; Kurita, H. The effectiveness of a self-reported questionnaire on masticatory function in health examinations. Odontology. 2024, 112, 1361–1369. [Google Scholar] [CrossRef]
- Lonardo, A.; Nascimbeni, F.; Ballestri, S.; Fairweather, D.; Win, S.; Than, T.; Abdelmalek, M.; Suzuki, A. Sex differences in nonalcoholic fatty liver disease: state of the art and identification of research gaps. Hepatology. 2019, 70, 1457–1469. [Google Scholar] [CrossRef] [PubMed]
- Yamamura, S.; Kawaguchi, T.; Nakano, D.; Tomiyasu, Y.; Yoshinaga, S.; Doi, Y.; Takahashi, H.; Anzai, K.; Eguchi, Y.; Torimura, T. Prevalence and independent factors for fatty liver and significant hepatic fibrosis using B-mode ultrasound imaging and two dimensional-shear wave elastography in health check-up examinees. J Med Kurume. 2021, 66, 225–237. [Google Scholar] [CrossRef]
- Chen, C.; Zhu, Z.; Mao, Y.; Xu, Y.; Du, J.; Tang, X.; Cao, H. HbA1c may contribute to the development of non-alcoholic fatty liver disease even at normal-range levels. Biosci Rep. 2020, 40, BSR20193996. [Google Scholar] [CrossRef]
- Shimada, Y.; Nakamura, T.; Dohi, M.; Watanabe, M.; Goromaru, N.; Kanasaki, M.; Shirakashi, M.; Inagawa, M.; Masuda, T.; Takeda, T. Fatty liver has the same background characteristics in those under their ideal weight and the general population. J Ningen Dock and Preventive Medical Care. 2024, 39, 440–446. [Google Scholar]
- Saleh, M.; Alfaddagh, A.; Elajami, T.; Ashfaque, H.; Haj, I.H.; Welty, F. Diastolic blood pressure predicts coronary plaque volume in patients with coronary artery disease. Atherosclerosis. 2018, 277, 34–41. [Google Scholar] [CrossRef]
- Zhao, Y.; Zhao, G.; Chen, Z.; She, Z.; Cai, J.; Li, H. Nonalcoholic fatty liver disease: an emerging driver of hypertension. Hypertension. 2020, 75, 275–284. [Google Scholar] [CrossRef] [PubMed]
- Trovato, G. Non-alcoholic fatty liver disease and Atherosclerosis at a crossroad: The overlap of a theory of change and bioinformatics. World J Gastrointest Pathophysiol. 2020, 11, 57–63. [Google Scholar] [CrossRef]
- Ministry of Health, Labour and Welfare. The National Health and Nutrition Survey Japan 2019. https://www.mhlw.go.jp/content/10900000/000687163 (Accessed , 2025). 13 March.
- Hosmer, D.W.; Lemeshow, S. Applied logistic regression, 2nd edition. John Wiley and Sons 2000. [Google Scholar]
- Faienza, M.; Baima, J.; Cecere, V.; Monteduro, M.; Farella, I.; Vitale, R.; Antoniotti, V.; Urbano, F.; Tini, S.; Lenzi, F.; Prodam, F. Fructose intake and unhealthy eating habits are associated with MASLD in pediatric obesity: A cross-sectional pilot study. Nutrients. 2025, 17, 631. [Google Scholar] [CrossRef]
Figure 1.
.
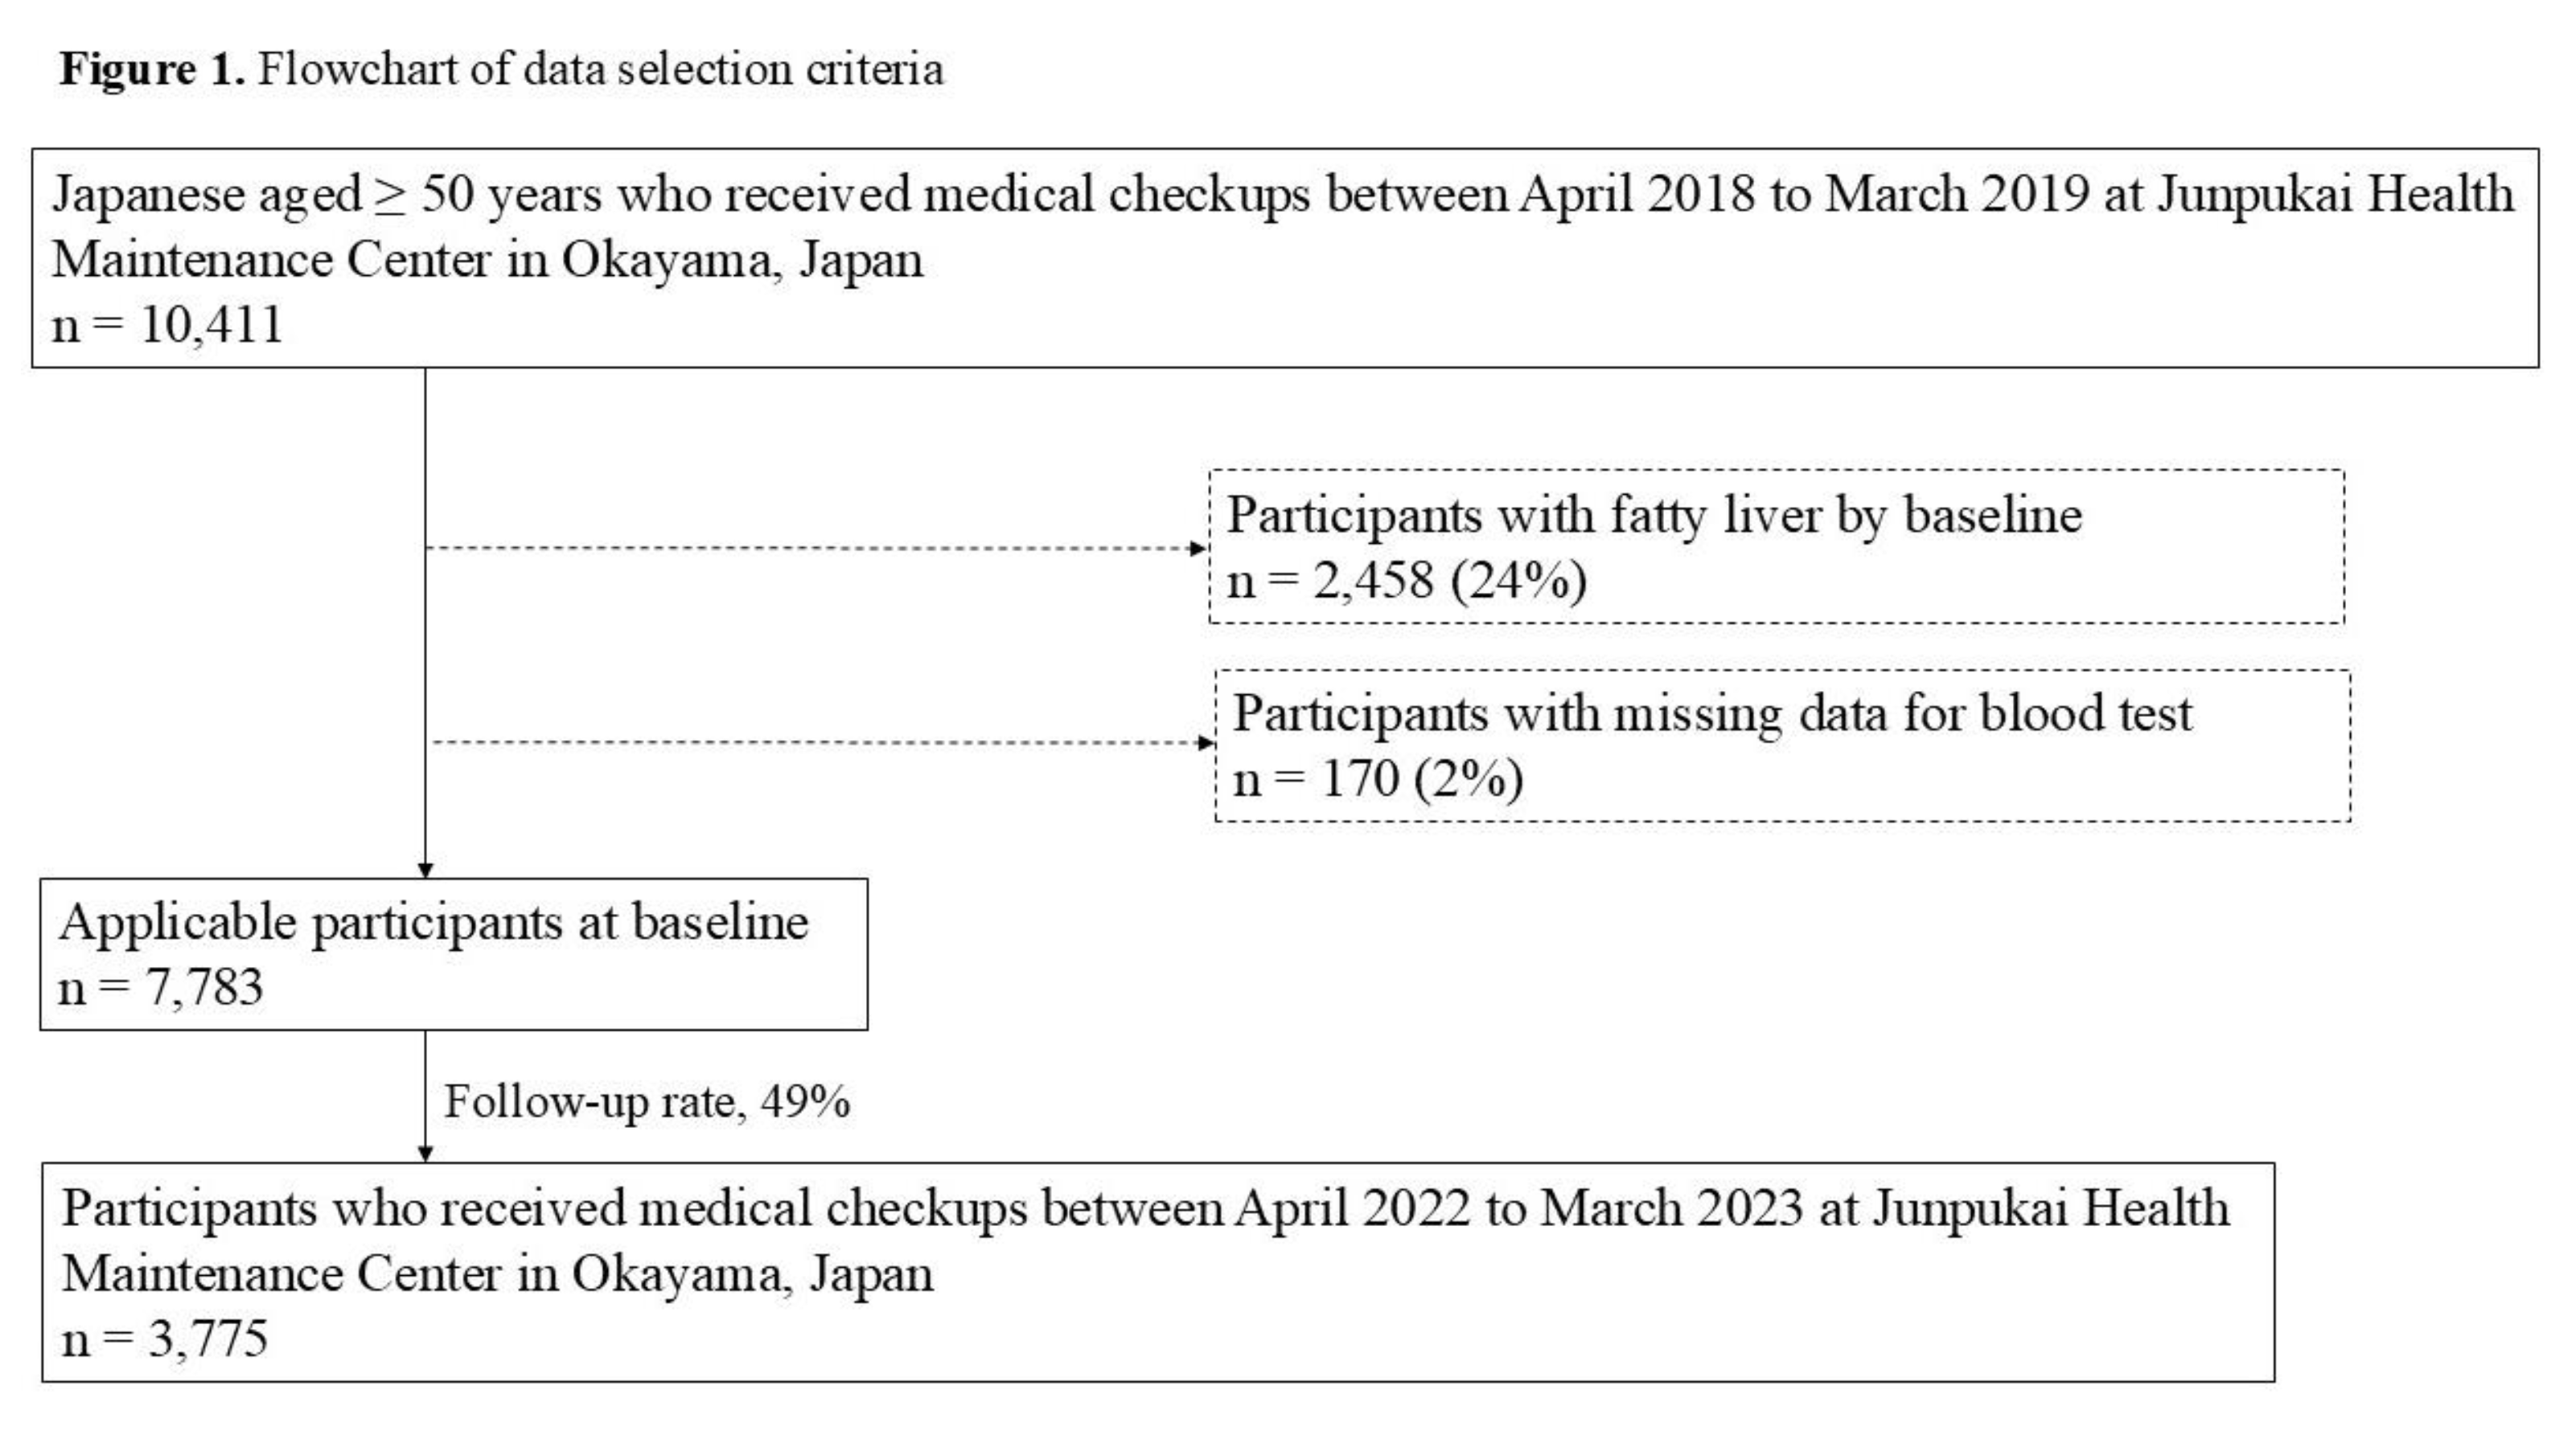

Table 1.
Differences in factors at baseline between good and poor chewing status.
| Factor | Chewing status | p-value* | |
|---|---|---|---|
| Good(n = 3,234) | Poor(n = 541) | ||
| Gender a | 1,345 (42%) | 275 (50%) | < 0.001* |
| Age (years) | 57 (53, 62) | 56 (52, 62) | 0.024* |
| BMI (kg/m2) | 22.0 (20.1, 24.1) | 19.7 (21.6, 23.7) | < 0.001* |
| HbA1c level (%) | 5.6 (5.5, 5.9) | 5.7 (5.5, 5.9) | 0.879 |
| Smoking habit b | 443 (14%) | 138 (25%) | < 0.001* |
| Drinking habit b | 906 (28%) | 198 (37%) | < 0.001* |
| Exercise habit b | 1,069 (33%) | 171 (32%) | 0.507 |
| Physical activity b | 823 (25%) | 124 (23%) | 0.209 |
| Systolic blood pressure level (mmHg) | 120 (107, 133) | 114 (102, 128) | < 0.001* |
| Diastolic blood pressure level (mmHg) | 75 (67, 84) | 72 (65, 80) | < 0.001* |
| Sleep status | |||
| Well | 2,056 (64%) | 285 (53%) | < 0.001* |
| Poor | 1,178 (36%) | 256 (47%) | |
| Eating speed | |||
| Slowly | 275 (8%) | 61 (11%) | 0.098 |
| Medium | 1,925 (60%) | 318 (59%) | |
| Quickly | 1,034 (32%) | 162 (30%) | |
| Snacking habit | |||
| None | 591 (18%) | 93 (17%) | 0.686 |
| Sometimes | 1,657 (51%) | 274 (51%) | |
| Daily | 986 (31%) | 174 (32%) | |
| Skipping breakfast habit | |||
| < 3 times / week | 2,939 (91%) | 467 (86%) | < 0.001* |
| ≥ 3 times / week | 295 (9%) | 74 (14%) | |
| Dinner within 2 hours before bedtime habit | |||
| < 3 times / week | 2,496 (77%) | 367 (68%) | < 0.001* |
| ≥ 3 times / week | 738 (23%) | 174 (32%) | |
Table 2.
Relationship between chewing status at baseline and fatty liver at follow-up.
| Chewing status at baseline | p-value* | ||||
| Good(n = 3,234) | Poor(n = 541) | ||||
| Fatty liver at follow-up | Absence | 2,980 (92%) | 477 (88%) | 0.002* | |
| Presence | 254 (8%) | 64 (12%) | |||
| *p < 0.05, using Fishers exact test. | |||||
Table 3.
Crude ORs and 95% CIs for fatty liver at follow-up.
| Factor | ORs | 95% CIs | p-value | |
| Gender | Female | 1 | (reference) | < 0.001 |
| Male | 2.165 | 1.712-2.738 | ||
| Age (years) | 0.968 | 0.948-0.988 | 0.002 | |
| BMI (kg/m2) | < 25.0 | 1 | (reference) | < 0.001 |
| 25.0 ≤ | 2.281 | 1.764-2.950 | ||
| HbA1c level (%) | < 6.5 | 1 | (reference) | 0.550 |
| 6.5 ≤ | 0.844 | 0.484-1.472 | ||
| Smoking habits | Absence | 1 | (reference) | 0.006 |
| Presence | 1.496 | 1.123-1.993 | ||
| Drinking habit | Absence | 1 | (reference) | 0.072 |
| Presence | 1.251 | 0.980-1.597 | ||
| Exercise habit | Presence | 1 | (reference) | 0.054 |
| Absence | 1.284 | 0.995-1.657 | ||
| Physical activity | Presence | 1 | (reference) | 0.360 |
| Absence | 1.136 | 0.865-1.481 | ||
| Systolic blood pressure level (mmHg) | 1.007 | 1.001-1.013 | 0.020 | |
| Diastolic blood pressure level (mmHg) | 1.019 | 1.010-1.029 | < 0.001 | |
| Sleep status | Well | 1 | (reference) | 0.038 |
| Poor | 1.278 | 1.013-1.613 | ||
| Chewing status | Good | 1 | (reference) | 0.002 |
| Poor | 1.574 | 1.177-2.105 | ||
| Eating speed | Not quickly | 1 | (reference) | 0.508 |
| Quickly | 1.086 | 0.851-1.386 | ||
| Snacking habit | Not daily | 1 | (reference) | 0.327 |
| Daily | 0.881 | 0.683-1.136 | ||
| Skipping breakfast habit | < 3 times / week | 1 | (reference) | 0.006 |
| ≥ 3 times / week | 1.594 | 1.140-2.229 | ||
| Dinner within 2 hours before bedtime habit | < 3 times / week | 1 | (reference) | < 0.001 |
| ≥ 3 times / week | 1.671 | 1.307-2.136 | ||
| Abbreviations: ORs, odds ratios; CIs, confidence intervals; BMI, body mass index; HbA1c, hemoglobin A1c.. | ||||
Table 4.
Adjusted ORs and 95% CIs for fatty liver at follow-up.
| Factor | ORs | 95% CIs | p-value | |
| Gender | Female | 1 | (reference) | < 0.001 |
| Male | 1.830 | 1.414-2.368 | ||
| Age (years) | 0.969 | 0.948-0.991 | 0.006 | |
| BMI (kg/m2) | < 25.0 | 1 | (reference) | < 0.001 |
| 25.0 ≤ | 1.975 | 1.510-2.585 | ||
| Smoking habits | Absence | 1 | (reference) | 0.951 |
| Presence | 1.010 | 0.737-1.384 | ||
| Systolic blood pressure level (mmHg) | 0.995 | 0.986-1.005 | 0.343 | |
| Diastolic blood pressure level (mmHg) | 1.017 | 1.002-1.032 | 0.025 | |
| Sleep status | Well | 1 | (reference) | 0.135 |
| Poor | 1.200 | 0.945-1.524 | ||
| Chewing status | Good | 1 | (reference) | 0.012 |
| Poor | 1.475 | 1.090-1.996 | ||
| Skipping breakfast habit | < 3 times / week | 1 | (reference) | 0.257 |
| ≥ 3 times / week | 1.227 | 0.861-1.749 | ||
| Dinner within 2 hours before bedtime habit | < 3 times / week | 1 | (reference) | 0.174 |
| ≥ 3 times / week | 1.201 | 0.922-1.565 | ||
| Abbreviations: ORs, odds ratios; CIs, confidence intervals; BMI, body mass index. Adjustment for gender, age, BMI, smoking habits, systolic blood pressure level, diastolic blood pressure level, sleep status, chewing status, skipping breakfast habit, and dinner within 2 hours before bedtime habit. Hosmer-Lemeshow fit test; p = 0.489. | ||||
Disclaimer/Publisher’s Note: The statements, opinions and data contained in all publications are solely those of the individual author(s) and contributor(s) and not of MDPI and/or the editor(s). MDPI and/or the editor(s) disclaim responsibility for any injury to people or property resulting from any ideas, methods, instructions or products referred to in the content. |
© 2025 by the authors. Licensee MDPI, Basel, Switzerland. This article is an open access article distributed under the terms and conditions of the Creative Commons Attribution (CC BY) license (http://creativecommons.org/licenses/by/4.0/).
Copyright: This open access article is published under a Creative Commons CC BY 4.0 license, which permit the free download, distribution, and reuse, provided that the author and preprint are cited in any reuse.


