
Submitted:
05 January 2026
Posted:
06 January 2026
You are already at the latest version
Abstract
High-quality RGB–thermal infrared (RGB-T) semantic segmentation datasets are crucial for search-and-rescue (SAR) applications, yet their development is hindered by the scarcity of annotated ground truth and by the challenges of thermal-camera calibration, which typically depends on heated targets with limited geometric definition. Recent approaches, such as MATT, focus on transferring SAM-based RGB masks to multi-spectral data, but they do not fully address the need for robust cross-modal alignment, quality control, or human-in-the-loop reliability assessment in RGB-T segmentation. To fill this gap, we propose a general annotation methodology that performs geometric alignment of RGB-T pairs, combines model-based proposals with interactive refinement, and incorporates annotation cost and systematic quality checks using inter-annotator agreement. In this methodology, multimodal alignment is ensured through feature-based matching and homography estimation. Annotation integrates automatic proposals and guided refinement, and final masks undergo quantitative cost and quality control before being used in downstream model training. The proposed methodology was evaluated on a SAR-oriented RGB-T dataset comprising 306 image pairs. Consistent cross-modal alignment was achieved via SuperGlue-based matching and homography estimation, enabling the implementation of a SAM2-based semi-automatic annotation pipeline in Label Studio. Results across two annotators show that the proposed approach reduces annotation time by 21% while achieving a high annotation quality mean IoU = 74.9%) and a high inter-annotator agreement (mean pixel accuracy = 88.4%, Cohen's kappa = 83%). The curated labels were then used to benchmark two representative RGB-T segmentation models. These findings demonstrate the practical value of the proposed methodology and establish a reproducible framework for generating reliable RGB-T semantic segmentation datasets, complementing and extending recent multispectral auto-labeling approaches.
Keywords:
RGB–thermal infrared segmentation
; semantic segmentation dataset
; semi-automatic annotation
; search-and-rescue
1. Introduction
Rescue robots must navigate through unfamiliar environments that often have low visibility, degraded sensing conditions, and moving targets. In these situations, reliable object segmentation is crucial for tasks such as simultaneous localization and mapping (SLAM) [1], modeling disaster sites [2], detecting people in need of assistance [3] or missing people [4], and maintaining situational awareness during catastrophic events [5]. Furthermore, to improve robustness under these adverse perception conditions, the combination of RGB and thermal infrared (TIR) imagery is becoming increasingly relevant [6,7,8].
Despite this growing relevance, multimodal RGB and TIR datasets are limited in availability. In the autonomous driving domain, the FLIR-ADAS dataset [9] includes both RGB and TIR (RGB-T) images, along with bounding box annotations for object detection. Similarly, the MFNET dataset [10] contains RGB and TIR images captured during daytime and nighttime, accompanied by semantic segmentation labels. Additionally, the PST900 dataset [11] focuses on daily activity scenes and also contains RGB-T annotated images. In the search-and-rescue (SAR) domain, several datasets include both RGB and TIR modalities; however, most of them provide only bounding box annotations [6,7,8]. In contrast, RescueNet [12] and DRespNeT [13] offer multi-class semantic segmentation annotations for SAR scenarios, although they are limited to RGB imagery, highlighting both the scarcity of multimodal semantic labels and the challenges involved in generating them.
Manually creating semantic segmentation annotations is a time-consuming and labor-intensive task, and the resulting labels are often inconsistent due to human errors. Furthermore, the procedures for generating these datasets are often insufficiently described, limiting reproducibility and the systematic assessment of annotation quality. In particular, RGB–TIR datasets pose a fundamental technical challenge: achieving reliable cross-modal alignment. While standard planar calibration patterns are effective for RGB cameras, calibration in the thermal domain is often problematic due to limitations of heated patterns, such as uneven temperature distribution, low geometric definition, and thermal diffusion, which in turn complicates the establishment of accurate point correspondences between modalities.
Recently, there has been increasing attention within the community toward developing tools and workflows that reduce the time and cost of annotation, positioning human intervention primarily in a supervisory role [14,15,16,17,18,19]. In particular, promptable models such as SAM2 (Segment Anything Model v2) [20] provide a flexible mechanism for generating initial segmentation masks across a wide range of image scenes, enabling semi-automatic workflows in which human annotators review and refine automatically generated masks. Unlike video object segmentation (VOS) models [21], SAM2 employs a unified architecture for both image- and video-based segmentation tasks. Its transmission memory mechanism supports zero-shot segmentation, reducing annotation time, and requires less user interaction compared to previous methods, such as Open-Vocabulary models [22]. Related approaches to our proposal, such as MATT [23], use SAM-generated masks on RGB images and transfer them to other modalities, including multispectral or thermal imagery. While these methods reduce annotation time, they often depend on well-aligned image pairs and do not incorporate systematic cross-modal alignment, annotation quality metrics, or human-in-the-loop reliability assessment, leaving a gap for more general, reproducible pipelines.
Inter-annotation agreement (IAA) is a critical metric that quantifies the degree of consistency with which multiple human annotators label the same data, statistically accounting for agreement by chance. Originally established in fields such as psychology and medicine, IAA metrics have been adopted in computer vision fields, including medical [24], agricultural [25], and transportation [26], to evaluate the quality of semantic segmentation ground truth. In the context of RGB-T semantic segmentation, widely used benchmark datasets such as MFNet and PST900 have enabled rapid comparable models. However, insufficient quality control can have major implications for both the reproducibility of the findings and the interpretation of the results [27]. Inconsistency annotations can artificially inflate or suppress quantitative metrics, thereby hiding real model improvements. Consequently, similar to medical imaging applications [28], semantic segmentation annotations in RGB-T datasets should be regarded as accurate and reproducible as possible.
Thus, to address these limitations, we propose a semi-automatic annotation methodology that combines cross-modal alignment, explicit quality checks (QC), human efficiency and reliability evaluation, and downstream validation. The main contributions of this article are:
- We propose a RGB-T Pipeline for Dataset Semantic Segmentation that integrates a cross-modal alignment method, which has been implemented for RGB and TIR modalities.
- We benchmark two annotation strategies: a fully manual polygon-based annotation baseline against our semi-automatic annotation built around SAM2 as ML backend model. We evaluate both methodologies by measuring IAA for label Quality Checks (QC) and human annotation timing, as well as conducting an inter-rater reliability study.
- We applied the proposed pipeline to generate 306 annotated image pairs from a SAR-oriented RGB-T dataset [29]. The labeled data were then used to train two state-of-the-art RGB-T semantic segmentation models. Both, the data and trained models are publicly available at https://github.com/amsalase/CPGFANet.
The remainder of this paper is organized as follows: Section 2 reviews related literature. Section 3 provides a comprehensive overview of the proposed pipeline, detailing its procedural steps. Section 4 presents the SAR dataset, implementation details, and evaluation metrics for analyzing quality, cost, and IAA. Section 5 presents the results on annotation cost, quality, IAA, and dataset validation. Section 6 summarizes findings and outlines some discussion points. Finally, Section 7 offers conclusions.
2. Related Work
Recent work in semantic segmentation has proposed task-specific annotation pipelines tailored to constrained scenarios, such as degraded imagery, remote sensing, or medical imaging. In [15], the authors propose a two-step training pipeline for semi-supervised semantic segmentation in degraded images captured under adverse conditions such as nighttime or fog. This approach decouples the training of labeled and unlabeled images to mitigate overfitting in extremely limited datasets, but its assumptions limit applicability to unstructured scenarios. In [16], SAM2 is combined with an Enhancement and Labeling Network (ELNet) to accelerate annotation in remote sensing segmentation tasks, with experiments limited to two-class, single-modality images. A systematic framework for semantic segmentation in satellite images is presented in [17]. This work provides a guide for efficiently and systematically exploiting artificial intelligence (AI) tools, including segmentation models, data preparation, model selection, and validation. However, this approach is tailored to a specific structure in satellite images. Finally, in [18], a fully automated framework is presented as an end-to-end pipeline to generate semantically enriched BIM-compatible 3D reconstructions from a single RGB image, jointly performing depth estimation and semantic segmentation. This framework is designed for structured environments, limiting its generalization to unstructured scenes.
Beyond task-specific pipelines, other works explore multi-step or interactive workflows for annotation. In [30], an iterative annotation scribble-based method is proposed for segmenting urban city scenes based on scribbles. This iterative process involves obtaining an initial segmentation, which requires at least two experienced annotators to refine it through user-provided corrections and back-propagation. In [19], a method for automatic segmentation and labeling is proposed based on a sequence of ground extraction (via RANSAC) followed by a coarse-to-fine segmentation strategy in urban scenarios. Moreover, the MATT workflow [23] uses SAM to perform segmentation on aerial RGB images and transfer these annotations to co-aligned multi-spectral images, thereby defining an automated segmentation labeling process. While this work is the only one proposing label transfer between modalities, it assumes that the images are co-aligned and synchronized, where the cameras share common features such as field of view (FOV) and image resolution. On the other hand, in [31], a novel network architecture enhances building segmentation by addressing multi-scale feature fusion and foreground perception, without encompassing annotation in a pipeline.
These approaches aim to reduce manual annotation effort through semi-supervised methods or iterative refinement, demonstrating a growing interest in developing efficient and reliable annotation pipelines, which are crucial for scaling semantic segmentation to diverse and complex scenarios. However, none address cross-modal alignment, inter-annotator agreement, or human-in-the-loop reliability assessment, and few studies integrate these elements into a standardized and generalizable pipeline.
3. SAM2-Driven RGB-T Annotation Pipeline
Figure 1 summarizes the proposed methodology for semantic annotation of multimodal RGB-T imagery in SAR scenarios. The pipeline is designed to reduce manual annotation effort while preserving spatial and semantic accuracy. With this purpose, the methodology relies on the structured integration of homography-based cross-modal alignment without explicit thermal camera calibration, semi-automatic semantic annotation using SAM2, and manual refinement supported by thermal imagery. This work contributes a reproducible workflow that combines existing technologies in a structured manner, with explicit alignment and quality control. Detailed implementation aspects are provided in Section 4.
The proposed pipeline consists of four stages:
- 1.
- Cross-Modal Camera Aligmnent. RGB and TIR images are geometrically aligned by estimating a planar homography from image correspondences. This alignment enables warping the RGB image into the TIR modality and facilitates label transfer across modalities, thereby avoiding the need for thermal-camera calibration using heated patterns, which is often problematic due to their limited geometric definition compared to standard RGB calibration targets. It is well known that four-point correspondences between images are sufficient to compute an exact homography matrix H [32], which constitutes the minimal solution for robust estimators such as RANSAC. However, in cross-modal RGB–T settings, establishing reliable correspondences is challenging due to significant appearance differences between modalities [33,34]. To address this, rather than relying solely on hand-crafted feature matching followed by RANSAC, we adopt a learning-based feature matching approach using the SuperGlue model [35], which jointly estimates keypoint correspondences and their confidence. This approach provides a robust mechanism for cross-modal alignment while preserving the conceptual connection to classical robust estimation methods. In this stage (see Figure 1), the annotator selects a reference RGB–T pair from a fixed set of cameras, choosing a scene that contains a sufficient number of objects of interest to ensure reliable keypoint estimation and a well-conditioned homography matrix H. If the resulting alignment is qualitatively unsatisfactory, the annotator repeats the process with an alternative reference pair.
- 2.
- Annotation Taxonomy. A fixed, domain-specific annotation taxonomy is defined in SAR scenarios to constrain the labeling process and ensure semantic consistency across annotators.
- 3.
- Semi-automatic annotation. The proposed semi-automatic annotation methodology for RGB–T images leverages the complementary strengths of automatic and manual annotation using tools such as the open-source Label Studio [36]. Initial segmentation masks are generated from RGB images, as these images provide higher spatial resolution, richer texture, and clearer object boundaries than TIR images. During the SAM2 semi-automatic step, annotators interact with the Label Studio SAM2 ML backend using positive clicks or bounding boxes to prompt segmentation. The automatic masks are produced using the SAM2 model, which generates class-specific segmentation proposals based on user-provided prompts. If the automatically generated masks are not satisfactory (e.g., missing or inaccurate classes), annotators refine them manually, creating a semi-automatic annotation process that combines speed with control over quality. This manual refinement on RGB-generated masks is performed using polygon annotation tools such as PolygonLabels in Label Studio.
- 4.
- Annotation refinement. The RGB masks are then transferred to the corresponding TIR images via the homography H estimated in Section 4.2. To capture classes that are poorly visible or invisible in the RGB modality, the masks are further refined directly on the TIR images using the same polygon-based annotation strategy. The annotators manually correct residual misalignment, remove spurious islands, and fill holes not properly captured by SAM2, ensuring high-quality segmentation masks.
4. Experimental Methodology
In this work, we quantitatively evaluate annotation efficiency and annotation quality using annotation time and inter-annotator agreement metrics, respectively, enabling an objective comparison of annotation strategies within the proposed framework. This section presents the experimental setup for evaluating our semi-automatic annotation methodology for RGB–T images, including a description of the SAR dataset and the segmentation models used, the cross-modal camera alignment procedure for ensuring geometric consistency between RGB and TIR images, and the annotation cost and quality metrics.
4.1. SAR Dataset and Model Details
We use the proposed pipeline to annotate 306 RGB and TIR image pairs from the UMA-SAR dataset [29]. The image pairs were captured with monocular TIR and RGB analog cameras. Both images have the same resolution (704×576) and are mostly overlapped, but with different horizontal FOVs for TIR () and RGB (). Three representative examples are shown in Figure 2a,b.
For annotation, we adopt the eleven representative classes in SAR imaging defined in [37]: First-Responder, Civilian, Vegetation, Road, Dirt-Road, Building, Sky, Civilian-Car, Responder-Vehicle, Debris and Command-Post.
With the resulting dataset, we trained two RGB-T models: FEANet [38] and SAFERNet (with ResNet–152 as backbone) [39]. All instance masks, exported as Label Studio JSON format, including polygon and RLE encodings, were converted into class index maps (0–11) for training.
The models were implemented in PyTorch toolbox and trained on a NVIDIA RTX A6000 with CUDA version of 12.6. In terms of data augmentation, all training images were flipped and cropped. We adopted stochastic gradient descent (SGD) with a learning rate of 0.003, a momentum of 0.9, and a weight decay of 0.0005. The learning rate was multiplied by a decay rate of 0.95.
Moreover, to assess annotation quality and consistency, we leverage the validated annotations of the benchmark MFNet dataset [10], a multimodal RGB–T dataset designed for object segmentation in urban scenes. The dataset contains both RGB and thermal images captured under daytime and nighttime conditions. For our experiments, we selected 15 daytime and 15 nighttime scenes for the annotators. MFNet defines eight semantic segmentation classes: car, person, bike, curve, car stop, guardrail, color cone, and bump.
4.2. Cross-Modal Alignment Configuration
Keypoints are detected and matched using the SuperGlue Outdoor model with a confidence threshold of 0.2, which is the default value. The TIR image was used as the reference modality, since its FOV is more restrictive than that of the RGB image. Matched keypoints are then post-processed to recover their original coordinates, and a projective transformation (homography) is estimated using OpenCV’s findHomography. Finally, the resulting homography matrix H is applied to all SAR RGB–T images to warp the RGB images into the TIR view. Nearest-neighbor interpolation is used during warping to preserve label integrity.
4.3. Annotation Cost and Annotation Quality
In this work, we quantitatively evaluate annotation quality and annotation efficiency by benchmarking two annotation methods: a baseline manual polygon-based annotation with PolygonLabels in Label Studio against the implementation of our semi-automatic approach based on SAM2. This evaluation is conducted by measuring accuracy, annotation timing, and IAA metrics, thereby enabling an objective comparison of the strategies within the proposed framework.
To evaluate annotation consistency and efficiency, two human annotators independently applied both methods to two separate image sets: 30 images from the MFNet dataset (for consistency against the ground truth) and 14 SAR images (for annotation time efficiency). Also, their agreement (IAA) was measured on the 14 SAR images. Annotations were performed in matched batches and followed the same class order for both annotators, ensuring consistent annotation conditions across strategies. The annotators differed in experience: Annotator A has over 5 years of experience with semantic segmentation and greater familiarity with the Label Studio annotation tool, whereas Annotator B has approximately 1 year of experience.
Regarding costs, the annotation time per image (in seconds) was recorded automatically in Label Studio. This metric was computed and compared in three annotation strategies: (1) Manual polygon annotation on RGB images, (2) SAM2 semi-automatic annotation on RGB only, (3) the proposed full SAM2 semi-automatic annotation on RGB-T imagery.
To evaluate annotation quality, an inter-annotation agreement technique was used by two annotators using class-wise Intersection over Union () and Cohen’s :
- a)
- Intersection over Union: The computes pixels where both masks belong to a specific class over pixels where at least one mask belongs to a specific class:where are the pixels annotated as class c by annotator A, and are the pixels annotated as class c by annotator B.
- b)
- Cohen’s : This inter-annotator agreement measures the flexibility between two annotators while correcting for agreement expected by chance. For two segmentation maps, is defined as:where represents how often the two annotators assign the same class to a pixel, and is the probability that both annotators would choose the same class to a pixel if they both just guess randomly.
Together, these metrics quantify not only the efficiency provided by SAM2 and the thermal modality, but also the consistency and reliability of the resulting segmentation labels.
5. Results
5.1. Cross-Modal Camera Alignment
Figure 2 illustrates the complete alignment RGB-T image registration, showing the original RGB and TIR images, the RGB images warped using the homography matrix estimated by the SuperGlue model, and the fused RGB-T image.
The captures were done with slightly different relative camera poses. Therefore, three different homography matrices have been computed following the procedure given in Section 4.2. The results correctly capture the different misalignments, as can be appreciated in column (c) of Figure 2.
Column (d) presents the fused RGB-T images, which combine the warped RGB data with the TIR data. This column visually demonstrates the effectiveness of the homography matrix. Elements such as buildings, people, roads, and dirt road boundaries exhibit strong spatial correspondence, with only minor residual misalignments due to the planar assumption in homography estimation.
All in all, these results evidence robust image correspondences in the UMA-SAR dataset with different camera FOVs and misalignments. For the rest of the annotation pipeline analysis, as illustrated in Figure 1 and Figure 3, all RGB-T image pairs were aligned using this cross–modal homography estimation to ensure pixel-level correspondence.
5.2. Annotation Quality
Since the RGB-T modalities for SAR scenes lack a publicly available semantic segmentation dataset for comparison, we first evaluated the annotation quality of Annotator A and Annotator B using 30 MFNet [10] validation images (15 day and 15 night scenes) with the manual polygon method. The selected subset balanced annotation feasibility with representative scene diversity, which is a common practice in annotation-cost and agreement studies. A demonstrated around 5% higher annotator consistency (: 66% vs. 63% for B). This result may be influenced by differences in annotator experience, with Annotator A showing stricter adherence to the annotation protocol, particularly in boundary definition.
Subsequently, we evaluated the absolute segmentation quality of the annotator A against MFNet ground-truth with the same data as before (30 MFNet images). However, we evaluated the results using three strategies: (1) manual RGB polygon, (2) SAM2-assisted RGB, (3) SAM2-assisted RGB-T refinement. This enables us to assess whether AI assistance enhances segmentation quality compared to official ground-truth annotations from MFNet.
Table 1 reveals that SAM2–assisted annotations improve the segmentation quality for our annotator A. Compared to ground-truth, manual annotation achieved 65.9%, while SAM2-assisted methods increase this percentage by 3.6% in SAM2-assisted RGB and 9% in SAM2-assisted RGB-T. Therefore, these data demonstrate that: (1) AI assistance can enhance annotation quality rather than compromising it. (2) to improve annotation quality a modality refinement could be an important technique.
Figure 4 provides qualitative comparisons that corroborate the insights of Table 1. Visually, SAM2 assisted methods (e and f) produce a segmentation mask with better boundary definitions that are close to the ground–truth data. In contrast, the manual polygon (d) shows approximated boundaries, justifying why manual annotation has a lower
5.3. Annotation Cost
Table 2 summarizes the annotation cost across three strategies. Friedman non-parametric test shows a significant global effect (, . Post-hoc pairwise comparison (Wilcoxon test with Bonferroni correction, ) indicates that incorporating SAM2-based methods into the annotation pipeline significantly reduced the mean annotation time relative to manual annotation ( for both). Specifically, SAM2 (RGB-T) with refinement achieved a saving time of around 180 seconds (3 minutes per image). Overall, the results confirm that the SAM2 assistance, even when requiring refinement, substantially reduces the time cost of generating segmentation ground-truth without compromising annotation quality (see Section 5.2).
5.4. Inter-Annotation Agreement
Table 3 reveals a critical interaction between annotator expertise and SAM2 assistance. The expert annotator (A) maintained almost perfect agreement with SAM2 as the semi-automatic annotation methodology (), demonstrating the ability to integrate AI assistance without altering annotation quality. In contrast, the less experienced annotator (B) showed approximately 0.10 points less in the agreement metric compared to the expert reference when using SAM2 ( from to ). This decrease, accompanied by increased variability ( vs. ), highlights the sensitivity of chance-corrected metrics to annotator variability (i.e. that novice annotators may accept an AI proposal with less critical refinement) and class imbalance. The inclusion of thermal refinement does not affect agreement levels.
5.5. Comparative Analysis
Here, we conduct a comprehensive analysis of segmentation fidelity, employing both quantitative and qualitative visual analysis in two SOTA models, on the augmented UMA-SAR dataset.
Table 4 reports a quantitative benchmark of two SOTA RGB-T models on the UMA–SAR test set. Overall, SAFERNet achieves clear superiority in the two metrics (i.e. a substantial improvement of +8.77 percentage points on and +7.69 on ), which indicates enhanced global segmentation fidelity. At the class level, the improvements are particularly pronounced in critical classes such as: Road, Dirt-Road, Command Post, and crucially detects Civilian-Car, where FEANet completely fails. The results reflect that SAFERNet offers better spatial consistency and reduced misclassifications. Conversely, FEANet shows competitive performance in Vegetation, Building, and Debris. Although both methods perform comparably on dominant classes such as Sky and First-Responder, FEANet exhibits significant weaknesses in rare categories, most notably the complete failure on Civilian-Car. These findings suggest that SAFERNet is more robust to class imbalance and more effective at capturing complex multimodal cues present in SAR environments.
The qualitative comparison presented in Figure 5 visually corroborates the quantitative trends observed in Table 4. In particular, SAFERNet shows superior performance in semantically detecting Road (third row) and Command-Post (fourth row). Furthermore, both FEANet and SAFERNet demonstrate the ability to detect low-contrast objects that are barely distinguishable in RGB but salient in TIR domain, highlighting the benefits multimodal fusion.
6. Discussion
This work has introduced and validated a comprehensive methodology for generating high-quality, reliably annotated RGB-T semantic segmentation datasets, specifically search-and-rescue (SAR) applications. The proposed annotation methodology integrates cross-modal alignment, human-in-the-loop reliability assessment, and quality checks in a RGB-T semantic segmentation framework. The utility of the resulting annotated dataset was validated by successfully training two state-of-the-art models, demonstrating the practical value of the pipeline.
The cross-modal alignment technique leverages feature-based homography estimation to ensure consistent spatial correspondence. The resulting spatial coherence visually enhances the alignment across various modalities and facilitates better integration of data from multiple sources, such as different cameras. By integrating AI (SuperGlue) to obtain homography estimation, we provide a robust and practical solution for registering RGB and TIR imagery in real-world unstructured SAR scenes.
Additionally, the proposed method successfully compensated for mechanical misalignment, resulting in spatially coherent RGB-T pairs that are suitable for fusion and annotation. The key advantage of our method is its flexibility over rigid calibration procedures, and it can be applied to future developed datasets. Homography relies on the assumption of local planarity, which limits its effectiveness for close objects in the scene, potentially leading to minor residual misalignment. Future work may explore non-rigid registration methods.
The integration of SAM2 into the annotation pipeline provides a favorable balance between annotation quality, cost, and inter-annotation agreement (i.e. simultaneously enhances output quality: and reduces time cost with an improvement of ). However, the benefits are related to annotator expertise. The expert annotator maintained almost perfect agreement when using SAM2, indicating effective human–AI interactions. In contrast, the novice annotator showed a reduced agreement under AI assistance, highlighting the influence of annotator expertise and suggesting a propensity for less critical acceptance of AI suggestions. This suggests that AI-assisted protocols benefit from the expertise of expert annotators and expert review to ensure label integrity.
Finally, the practical utility of the resulting curated dataset was unequivocally demonstrated by its successful use in training and benchmarking state-of-the-art RGB–T segmentation models. This confirms that the annotations are of sufficient fidelity and consistency for downstream model development.
Overall, the results indicate that SAM2-based pipelines combined with well-defined protocols can accelerate dataset creation while preserving annotation quality. While the planar homography model introduces minor residual errors, the visual and quantitative coherence of the outputs confirms its adequacy for segmentation tasks.
Very recently, SAM3 was presented [40]. SAM3 is an evolution from single-object visual segmentation to promptable concept segmentation (PCS), enabling the detection and tracking of all instances of a concept in images using text phrases, image samples, or a combination of both. As future work, integrating SAM3 into the proposed pipeline could further enhance the labeling process and user interaction by leveraging its agentic workflow features, potentially combined with multimodal large language models (MLLMs) for complex reasoning-based labeling.
7. Conclusions
This paper presented a reproducible framework for generating reliable RGB-T semantic segmentation labels through a semi-automatic pipeline. The proposed approach integrates SAM2 as a machine-learning backend model to reduce manual annotation effort, while a cross-modality alignment method enables label transfer and refinement across RGB and TIR modalities. This alignment method, based on planar homography estimation, allows image warping under camera misalignment and eliminates the need for explicit TIR camera intrinsic calibration, which is often complex and inaccurate.
The user interaction within the proposed pipeline relies on polygon-based annotation. We evaluated two annotation strategies: a fully manual polygon-based annotation as a baseline and our proposed semi-automatic annotation process. Annotation cost and quality were assessed using inter-annotation agreement (IAA) for label quality checks and human annotation time. The results show a improvement in annotation quality and a reduction in annotation cost when using the proposed pipeline.
The proposed pipeline was further employed to generate 306 annotated RGB-T image pairs for a SAR-oriented dataset. This labeled data was used to train two state-of-the-art RGB-T semantic segmentation models, validating the consistency and fidelity of the generated annotated dataset. Both the data and the trained models are made publicly available.
Future work will focus on extending the proposed framework to include additional image modalities, such as depth and multispectral imagery. The recent release of SAM3 represents a significant improvement that can be integrated into this pipeline.
Author Contributions
Conceptualization, A.S.-E., R.V.-M and A.M.; methodology, A.S.-E. and R.V.-M; software, A.S.-E.; validation, A.S.-E. and R.V.-M; formal analysis, A.S.-E., R.V.-M and A.M.; investigation, A.S.-E. and R.V.-M; resources, A.S.-E.; data curation, A.S.-E.; writing—original draft preparation, A.S.-E. and R.V.-M; writing—review and editing, A.S.-E., R.V.-M and A.M.; visualization, A.S.-E.; supervision, R.V.-M and A.M.; project administration, A.M.; funding acquisition, A.M. All authors have read and agreed to the published version of the manuscript.
Funding
This work has been partially funded by the Ministerio de Ciencia, Innovación y Universidades, Gobierno de España, project PID2021-122944OB-I00. This work was technically supported by IMECH.UMA through PPRO-IUI-2023-02 (Universidad de Málaga).
Institutional Review Board Statement
Not applicable.
Informed Consent Statement
Not applicable.
Data Availability Statement
The data presented in this study are available at https://github.com/amsalase/CPGFANet.
Acknowledgments
The authors want to thank the collaboration of the Chair for Safety, Emergencies and Disasters of the Universidad de Málaga, led by Jesús Miranda for organizing the exercises. We would like to thank all the members of the Robotics and Mechatronics Lab.The first author received a grant by Asociación Universitaria Iberoamericana de Postgrado (AUIP), Universidad de Málaga, and Universidad Técnica de Manabí
Conflicts of Interest
The authors declare no conflict of interest.
References
- Feng, M.; Su, W. Semantic Visual SLAM Algorithm Based on Geometric Constraints. Lecture Notes in Networks and Systems 2025, 1290, 42–51. [Google Scholar] [CrossRef]
- Yajima, Y.; Kim, S.; Chen, J.; Cho, Y.K. Fast Online Incremental Segmentation of 3D Point Clouds from Disaster Sites. In Proceedings of the International Symposium on Automation and Robotics in Construction, 2021; pp. 341–348. [Google Scholar]
- Speth, S.; Gonçalves, A.; Rigault, B.; Suzuki, S.; Bouazizi, M.; Matsuo, Y.; Prendinger, H. Deep learning with RGB and thermal images onboard a drone for monitoring operations. Journal of Field Robotics 2022, 39, 840–868. [Google Scholar] [CrossRef]
- Wang, Z.; Benhabib, B. Concurrent Multi-Robot Search of Multiple Missing Persons in Urban Environments. Robotics 2025, 14. [Google Scholar] [CrossRef]
- González-Navarro, R.; Lin-Yang, D.; Vázquez-Martín, R.; Garcia-Cerezo, A. Disaster area recognition from aerial images with complex-shape class detection. In Proceedings of the Proceedings of the 2023 IEEE International Symposium on Safety, Security, and Rescue Robotics (SSRR), 2023; pp. 126–131. [Google Scholar]
- Byukusenge, P.; Zhang, Y. Life Detection Based on UAVs - Thermal Images in Search and Rescue Operation. In Proceedings of the 2022 IEEE 22nd International Conference on Communication Technology (ICCT), 2022; pp. 1728–1731. [Google Scholar] [CrossRef]
- Ahmed, M.; Khan, N.; Ovi, P.R.; Roy, N.; Purushotham, S.; Gangopadhyay, A.; You, S. GADAN: Generative Adversarial Domain Adaptation Network For Debris Detection Using Drone. In Proceedings of the International Conference on Distributed Computing in Sensor Systems, 2022; pp. 277–282. [Google Scholar] [CrossRef]
- Broyles, D.; Hayner, C.R.; Leung, K. WiSARD: A Labeled Visual and Thermal Image Dataset for Wilderness Search and Rescue. In Proceedings of the International Conference on Intelligent Robots and Systems, 2022; pp. 9467–9474. [Google Scholar] [CrossRef]
- OEM, T.F. FREE Teledyne FLIR Thermal Dataset for Algorithm Training. 2025. Available online: https://oem.flir.com/solutions/automotive/adas-dataset-form/ (accessed on 5 December 2025).
- Ha, Q.; Watanabe, K.; Karasawa, T.; Ushiku, Y.; Harada, T. MFNet: Towards real-time semantic segmentation for autonomous vehicles with multi-spectral scenes. In Proceedings of the IEEE International Conference on Intelligent Robots and Systems, 2017; pp. 5108–5115. [Google Scholar] [CrossRef]
- Shivakumar, S.S.; Rodrigues, N.; Zhou, A.; Miller, I.D.; Kumar, V.; Taylor, C.J. PST900: RGB-Thermal Calibration, Dataset and Segmentation Network. In Proceedings of the IEEE International Conference on Robotics and Automation, 2020; pp. 9441–9447. [Google Scholar] [CrossRef]
- Rahnemoonfar, M.; Chowdhury, T.; Murphy, R. RescueNet: A High Resolution UAV Semantic Segmentation Dataset for Natural Disaster Damage Assessment. Scientific Data 2023 2023, 10 10, 1–9. [Google Scholar] [CrossRef]
- Sirma, A.; Plastropoulos, A.; Tang, G.; Zolotas, A. DRespNeT: A UAV Dataset and YOLOv8-DRN Model for Aerial Instance Segmentation of Building Access Points for Post-Earthquake Search-and-Rescue Missions. Preprint in ArXiv 2025. [Google Scholar]
- Anderson, C.; Schenck, E.; Reinhardt, C.; Blue, R.; Clipp, B. AA-Pipe: Automatic annotation pipeline for visible and thermal infrared video. Optical Engineering 2025, 64. [Google Scholar] [CrossRef]
- An, G.; Guo, J.; Guo, C.; Wang, Y.; Li, C. Semantic segmentation in adverse scenes with fewer labeled images. Neural Networks 2025, 191. [Google Scholar] [CrossRef]
- Yang, J.; Yu, W.; Lv, Y.; Sun, J.; Sun, B.; Liu, M. SAM2-ELNet: Label Enhancement and Automatic Annotation for Remote Sensing Segmentation. IEEE Journal of Selected Topics in Applied Earth Observations and Remote Sensing 2025, 18, 22499–22512. [Google Scholar] [CrossRef]
- Wang, R.; Chowdhury, T.; Ortiz, A.C. Semantic segmentation framework for atoll satellite imagery: An in-depth exploration using UNet variants and Segmentation Gym. Applied Computing and Geosciences 2025, 25, 100217. [Google Scholar] [CrossRef]
- Erişen, S.; Mehranfar, M.; Borrmann, A. Single Image to Semantic BIM: Domain-Adapted 3D Reconstruction and Annotations via Multi-Task Deep Learning. Remote Sensing 2025, 17. [Google Scholar] [CrossRef]
- Ye, H.; Mai, S.; Wang, M.; Gao, M.; Fei, Y. Coarse-to-fine Automatic Segmentation and Labeling for Urban MLS Point Clouds. In Proceedings of the International Conference on Robotics and Artificial Intelligence, New York, NY, USA, 2025; pp. 31–36. [Google Scholar] [CrossRef]
- Ravi, N.; Gabeur, V.; Hu, Y.T.; Hu, R.; Ryali, C.; Ma, T.; Khedr, H.; Rädle, R.; Rolland, C.; Gustafson, L.; et al. SAM 2: Segment Anything in Images and Videos. arXiv 2024, arXiv:2408.00714. [Google Scholar] [PubMed]
- Zulfikar, I.E.; Mahadevan, S.; Voigtlaender, P.; Leibe, B. Point-VOS: Pointing Up Video Object Segmentation. arXiv 2024, arXiv:2402.05917. [Google Scholar] [CrossRef]
- Liu, S.; Zeng, Z.; Ren, T.; Li, F.; Zhang, H.; Yang, J.; Li, C.; Yang, J.; Su, H.; Zhu, J.; et al. Grounding dino: Marrying dino with grounded pre-training for open-set object detection. arXiv 2023, arXiv:2303.05499. [Google Scholar]
- Gallagher, J.E.; Gogia, A.; Oughton, E.J. A Multispectral Automated Transfer Technique (MATT) for Machine-Driven Image Labeling Utilizing the Segment Anything Model (SAM). IEEE Access 2025, 13, 4499–4516. [Google Scholar] [CrossRef]
- Abhishek, K.; Kawahara, J.; Hamarneh, G. What Can We Learn from Inter-Annotator Variability in Skin Lesion Segmentation? In Proceedings of the Skin Image Analysis, and Computer-Aided Pelvic Imaging for Female Health; 2026; pp. 23–33. [Google Scholar] [CrossRef]
- Zenkl, R.; McDonald, B.A.; Walter, A.; Anderegg, J. Towards high throughput in-field detection and quantification of wheat foliar diseases using deep learning. Computers and Electronics in Agriculture 2025, 232. [Google Scholar] [CrossRef]
- Ewecker, L.; Wagner, N.; Brühl, T.; Schwager, R.; Sohn, T.S.; Engelsberger, A.; Ravichandran, J.; Stage, H.; Langner, J.; Saralajew, S. Detecting Oncoming Vehicles at Night in Urban Scenarios - An Annotation Proof-Of-Concept. Proceedings of the 2024 IEEE Intelligent Vehicles Symposium (IV) 2024, 2117–2124. [Google Scholar] [CrossRef]
- Maier-Hein, L.; Eisenmann, M.; Reinke, A.; Onogur, S.; Stankovic, M.; Scholz, P.; Arbel, T.; Bogunovic; Bradley, Hrvoje; Carass, A.P.; Feldmann, A.C.; et al. Why rankings of biomedical image analysis competitions should be interpreted with care. Nature Communications 2018, 9. [Google Scholar] [CrossRef]
- Kohli, M.D.; Summers, R.M.; Geis, J.R. Medical Image Data and Datasets in the Era of Machine Learning. Journal of Digital Imaging 2017, 30. [Google Scholar] [CrossRef]
- Morales, J.; Vázquez-Martín, R.; Mandow, A.; Morilla-Cabello, D.; García-Cerezo, A. The UMA-SAR Dataset: Multimodal data collection from a ground vehicle during outdoor disaster response training exercises. The International Journal of Robotics Research 2021, 40, 835–847. [Google Scholar] [CrossRef]
- Sambaturu, B.; Gupta, A.; Jawahar, C.; Arora, C. ScribbleNet: Efficient interactive annotation of urban city scenes for semantic segmentation. Pattern Recognition 2023, 133. [Google Scholar] [CrossRef]
- Xu, H.; Huang, Q.; Liao, H.; Nong, G.; Wei, W. MFFP-Net: Building Segmentation in Remote Sensing Images via Multi-Scale Feature Fusion and Foreground Perception Enhancement. Remote Sensing 2025, 17. [Google Scholar] [CrossRef]
- Hartley, R.; Zisserman, A. Multiple View Geometry in Computer Vision, 2nd ed.; Cambridge University Press, 2004. [Google Scholar]
- Arora, P.; Mehta, R.; Ahuja, R. Enhancing Image Registration Leveraging SURF with Alpha Trimmed Spatial Relation Correspondence. In Proceedings of the Computational Science and Its Applications – ICCSA; Volume 2024, 2024, pp. 180–191. [CrossRef]
- Shao, R.; Wu, G.; Zhou, Y.; Fu, Y.; Fang, L.; Liu, Y. LocalTrans: A Multiscale Local Transformer Network for Cross-Resolution Homography Estimation. In Proceedings of the 2021 IEEE/CVF International Conference on Computer Vision (ICCV), 2021; pp. 14870–14879. [Google Scholar] [CrossRef]
- Sarlin, P.E.; DeTone, D.; Malisiewicz, T.; Rabinovich, A. SuperGlue: Learning Feature Matching With Graph Neural Networks. In Proceedings of the IEEE/CVF Conference on Computer Vision and Pattern Recognition, 2020; pp. 4937–4946. [Google Scholar] [CrossRef]
- LabelStudio. Open Source Data Labeling Platform. 2025. Available online: https://labelstud.io/ (accessed on 23 December 2025).
- Salas-Espinales, A.; Vázquez-Martín, R.; García-Cerezo, A.; Mandow, A. SAR Nets: An Evaluation of Semantic Segmentation Networks with Attention Mechanisms for Search and Rescue Scenes. In Proceedings of the IEEE International Symposium on Safety, Security, and Rescue Robotics, 2023; pp. 139–144. [Google Scholar] [CrossRef]
- Deng, F.; Feng, H.; Liang, M.; Wang, H.; Yang, Y.; Gao, Y.; Chen, J.; Hu, J.; Guo, X.; Lam, T.L. FEANet: Feature-Enhanced Attention Network for RGB-Thermal Real-time Semantic Segmentation. In Proceedings of the 2021 IEEE/RSJ International Conference on Intelligent Robots and Systems (IROS), 2021; pp. 4467–4473. [Google Scholar] [CrossRef]
- Salas-Espinales, A.; Vazquez-Martin, R.; Mandow, A. SAFERNet: Channel, Positional, and Global Attention Fusion for Efficient RGB-T Segmentation in Disaster Robotics. 2025. [Google Scholar] [CrossRef]
- Carion, N.; Gustafson, L.; Hu, Y.T.; Debnath, S.; Hu, R.; Suris, D.; Ryali, C.; Alwala, K.V.; Khedr, H.; Huang, A.; et al. SAM 3: Segment Anything with Concepts. arXiv 2025, arXiv:2511.16719. [Google Scholar] [CrossRef]
Figure 1.
Flowchart of the proposed annotation pipeline. The flowchart consist of four stages: (1) Cross-modal Alignment where the homography matrix is estimated and the RGB image is warped, (2) Annotation Taxonomy where the classes of the dataset are defined, (3) Semi-automatic Annotation where Label Studio with SAM2 as ML backend generate the initial mask, (4) Annotation Refinement where the annotator manually or using SAM2 add or correct annotations, resulting in the final refined RGB-T semantic mask.
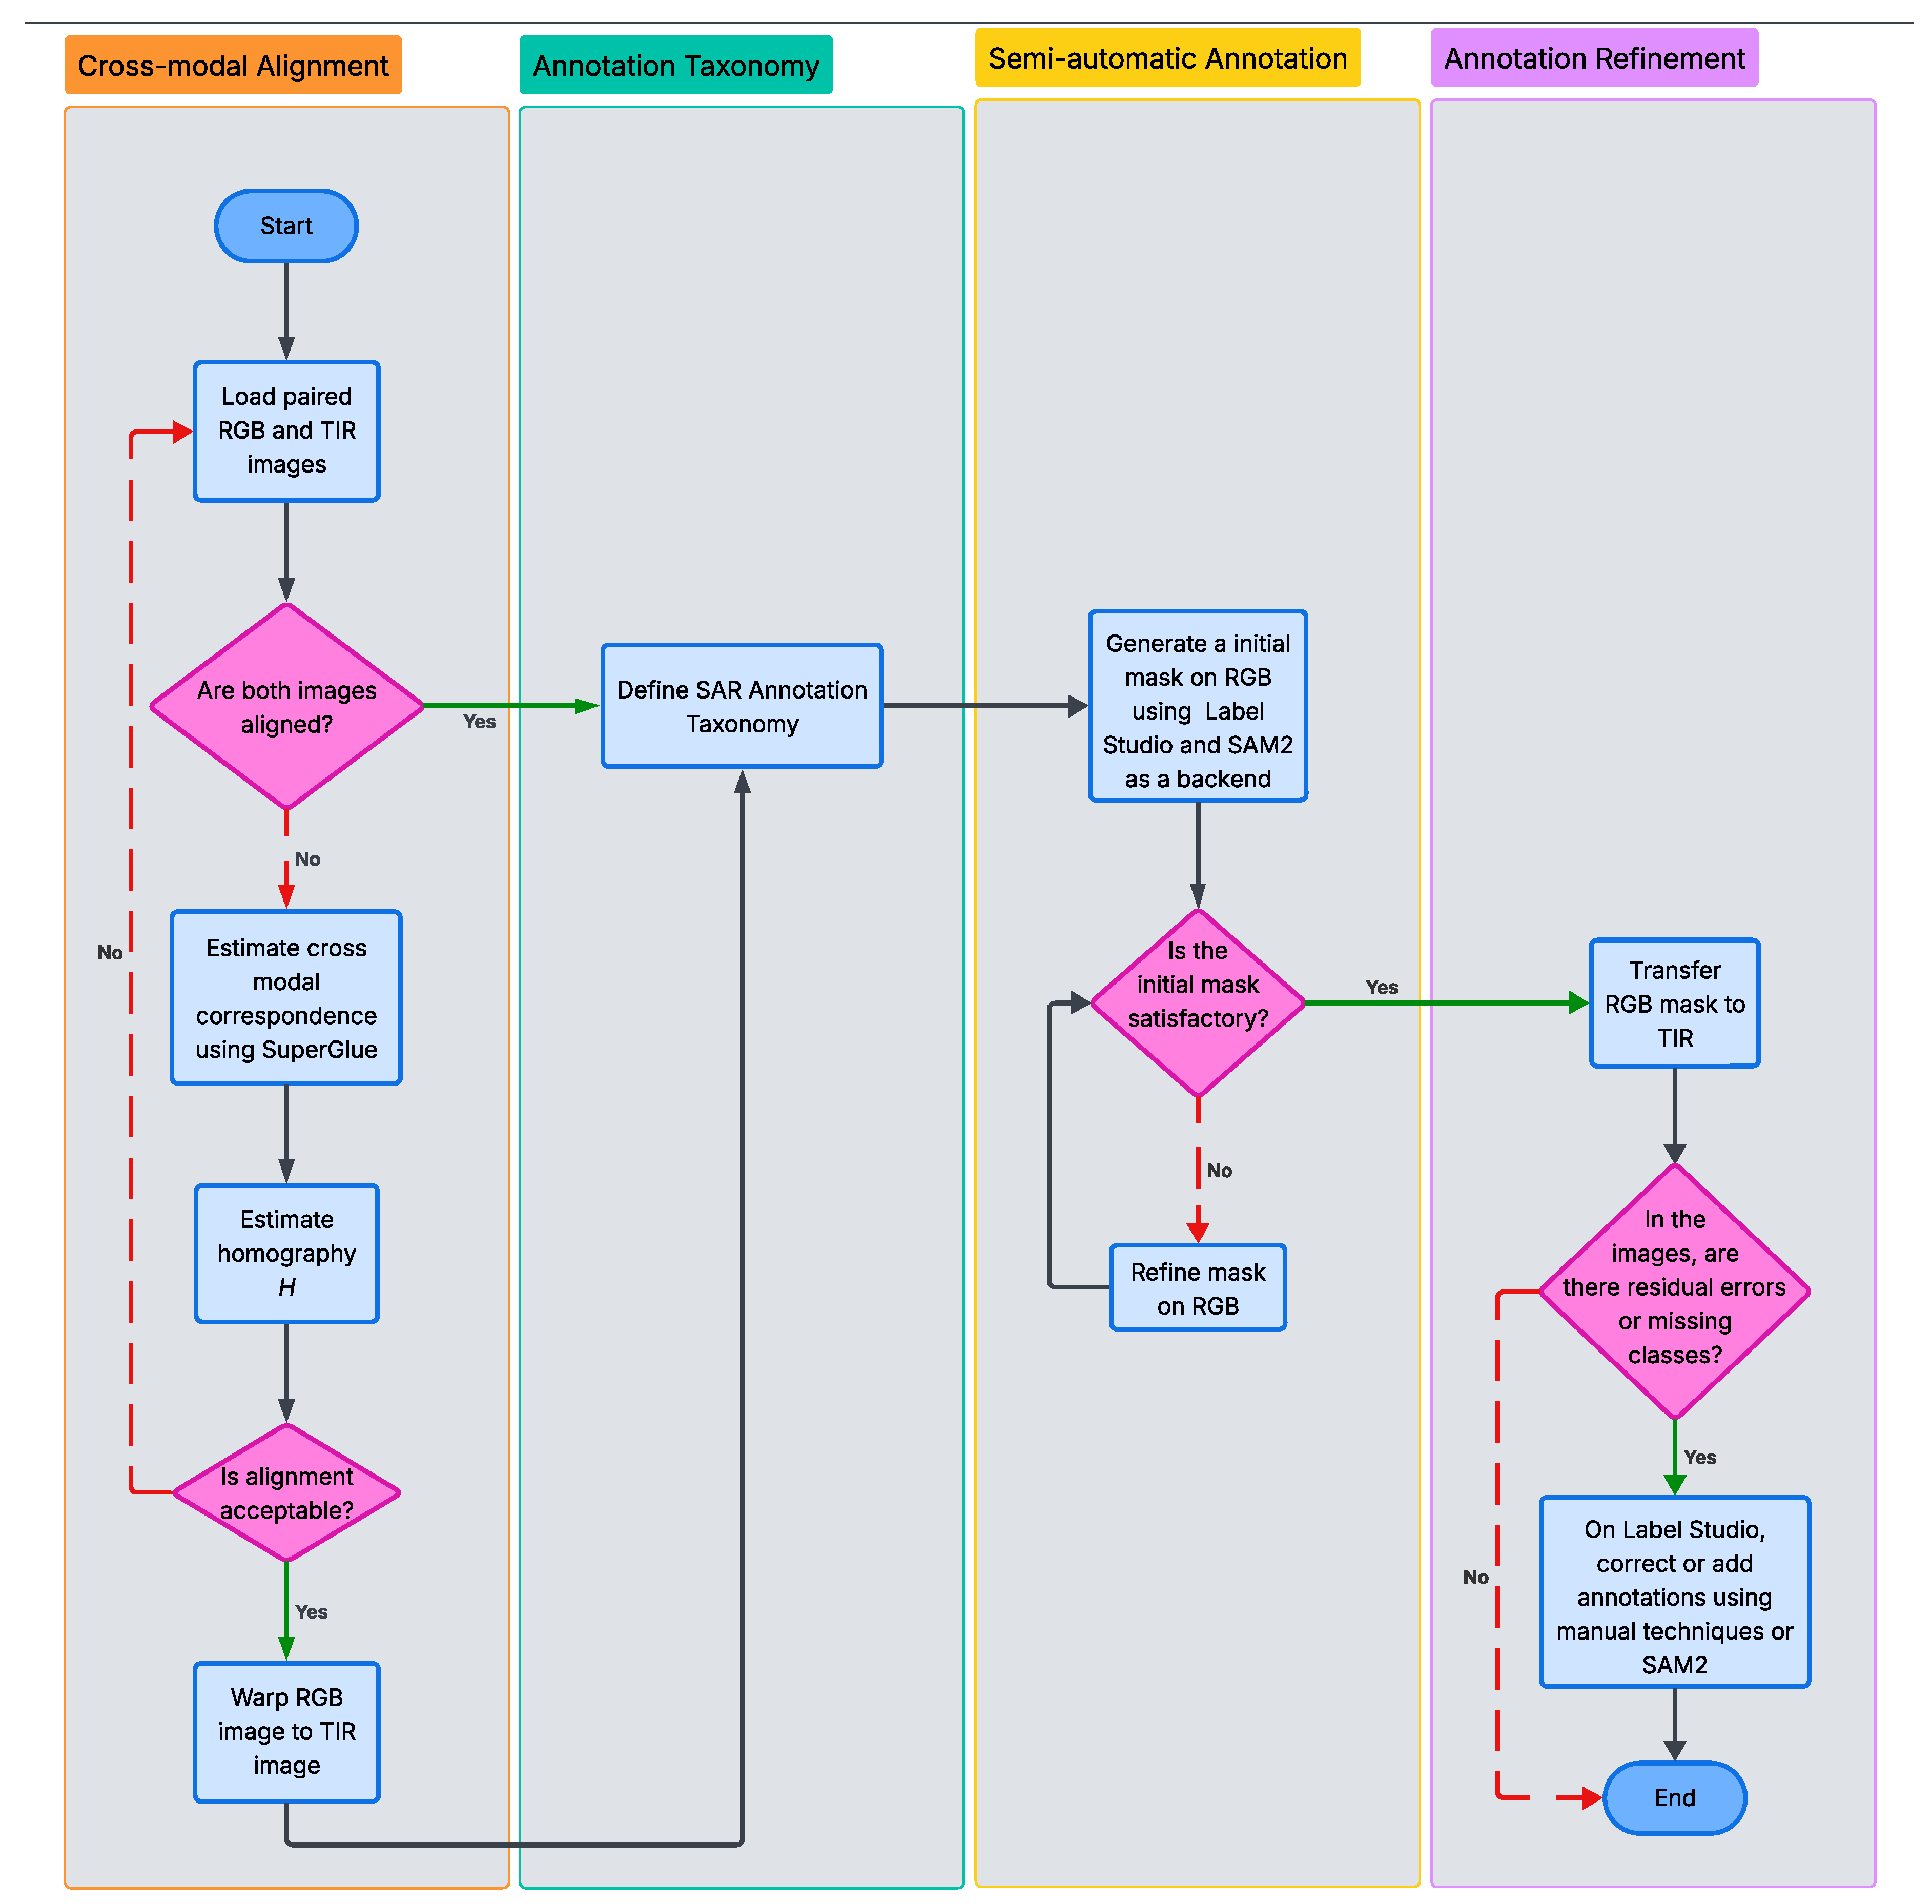
Figure 2.
Multimodal Alignment Results: (a) RGB input, (b)Thermal input, (c) RGB warped via SuperGlue homography, and (d) fused RGB-T.
Figure 2.
Multimodal Alignment Results: (a) RGB input, (b)Thermal input, (c) RGB warped via SuperGlue homography, and (d) fused RGB-T.
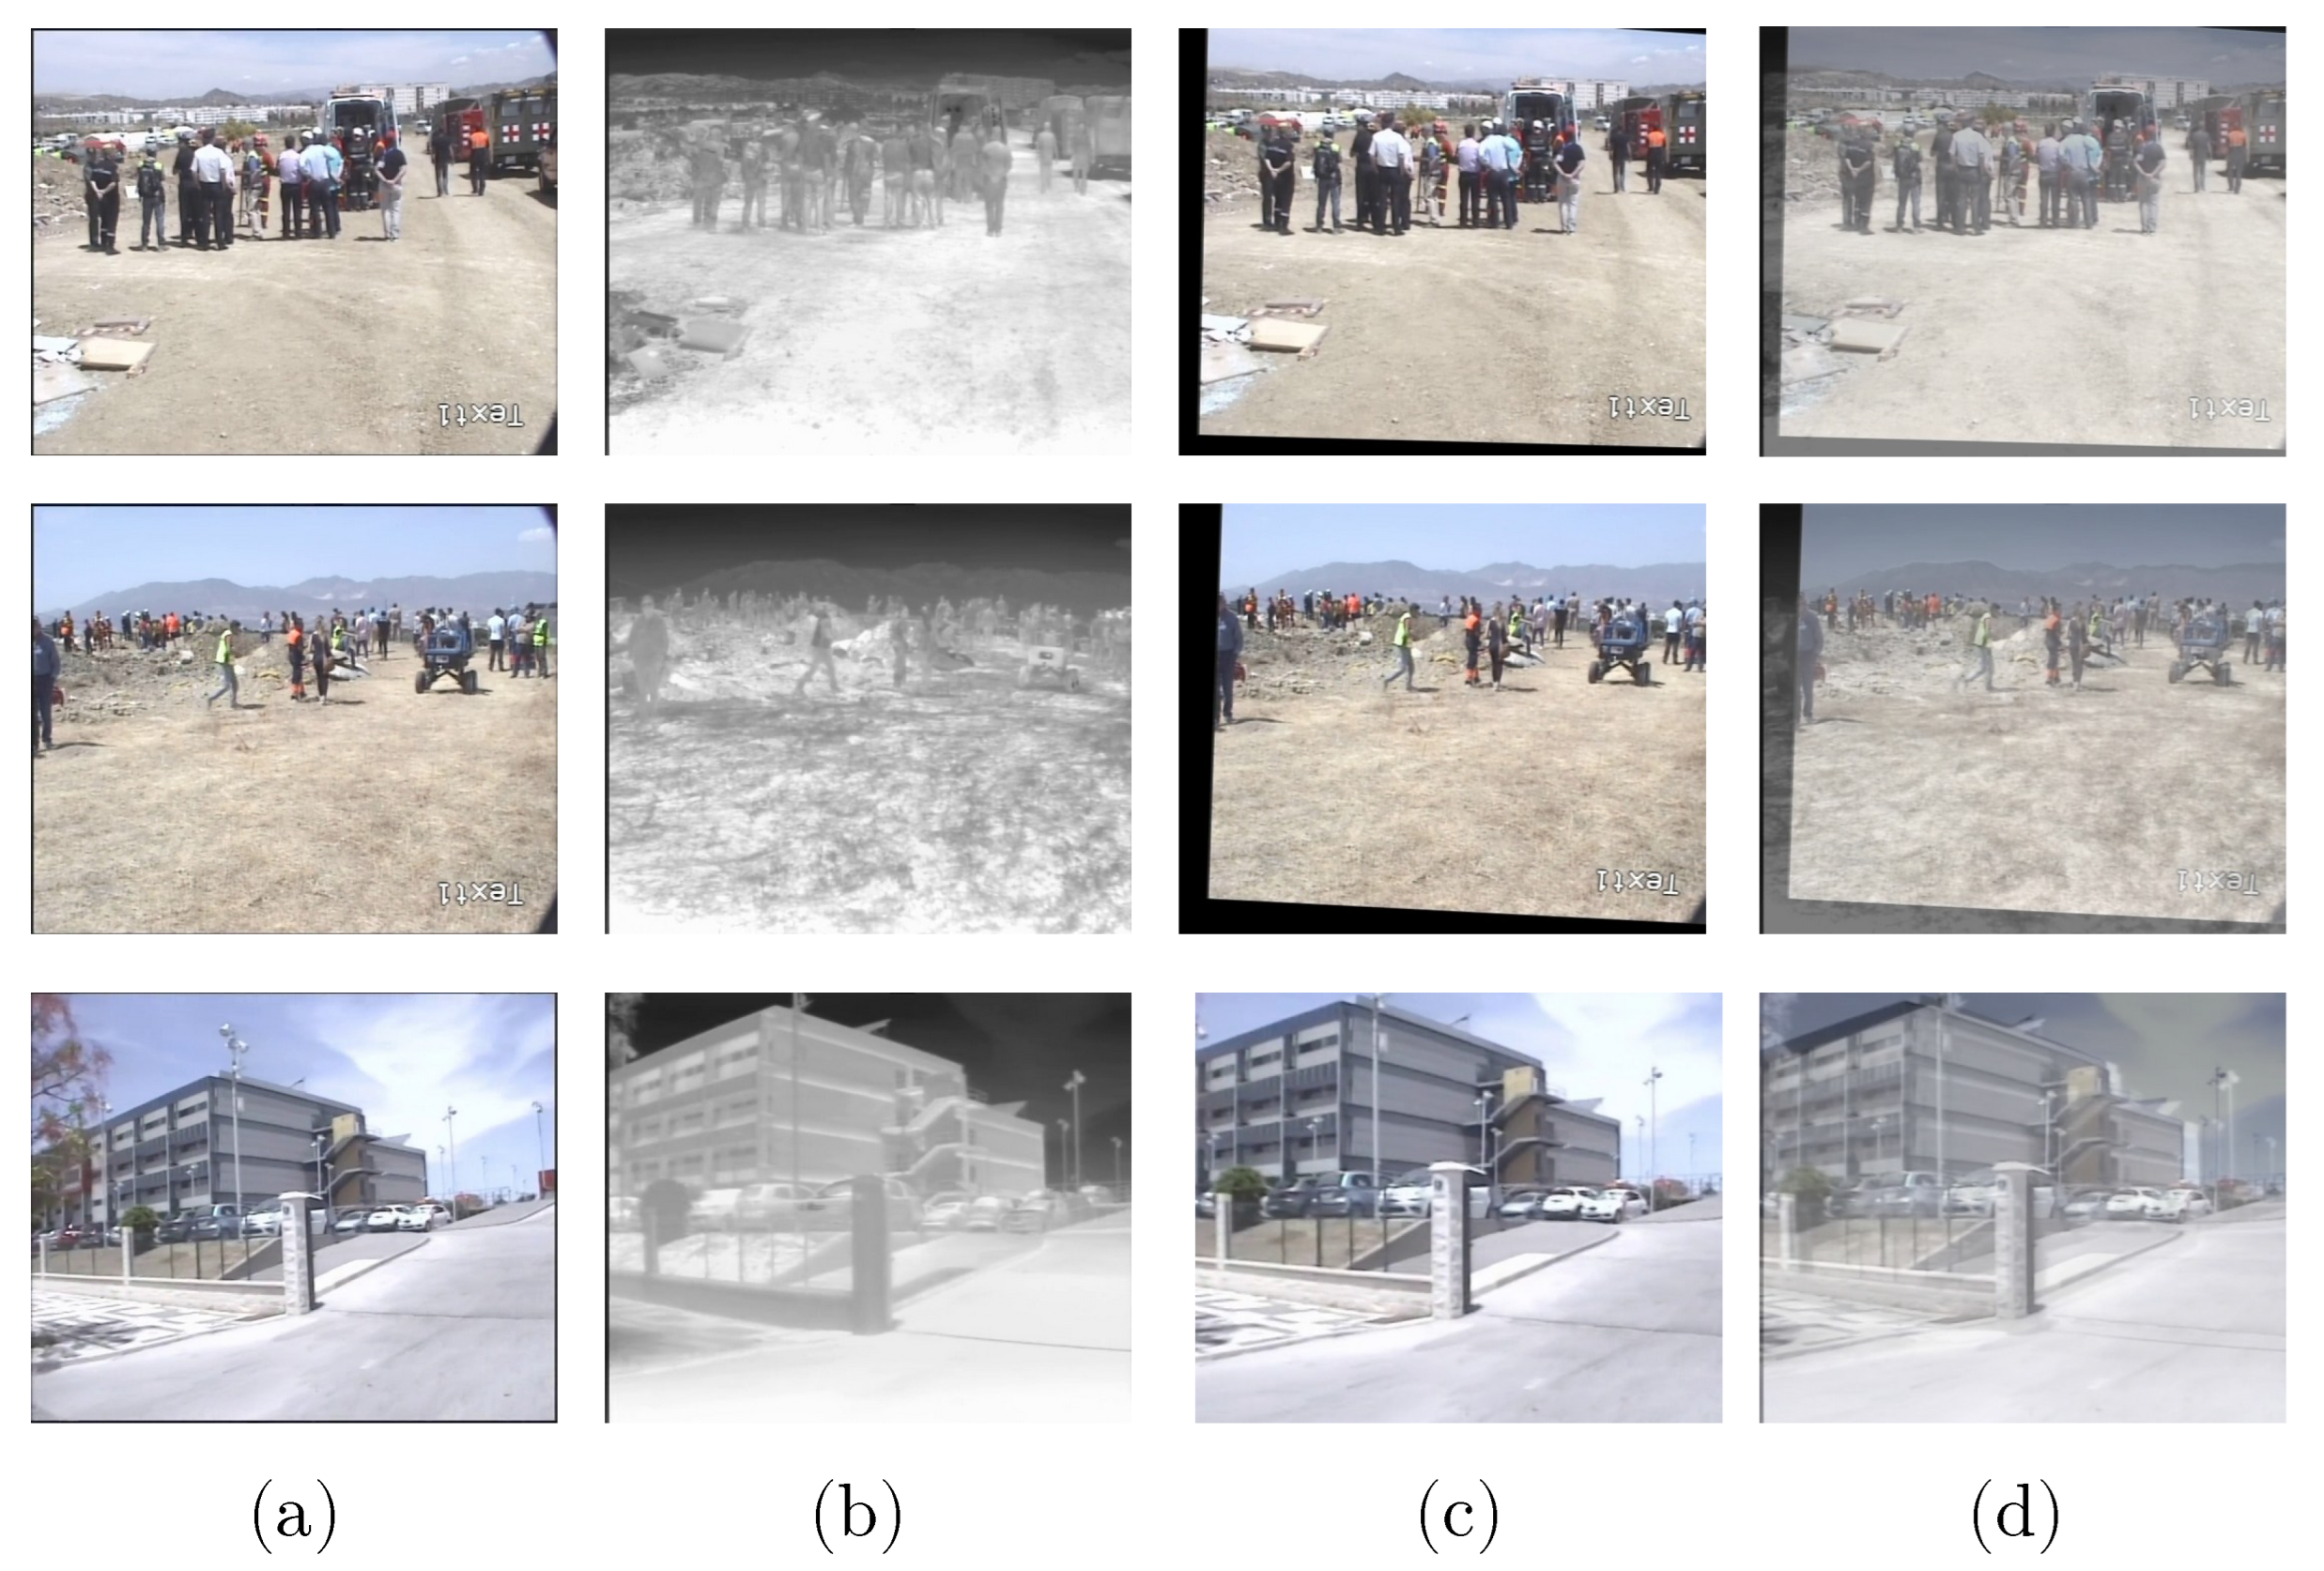
Figure 3.
Illustration of the proposed annotation pipeline with an example of SAR image pair. The illustration shows: (1) the cross-modal correspondences points estimated by SuperGlue and the warp RGB image in the Cross-modal Alignment stage, (2)The initial mask generated by Label Studio in the Semi-automatic Annotation stage, (3) The final refined RGB-T semantic mask from the Annotation Refinement. Notice here that there are three classes that were not identify in the RGB image.
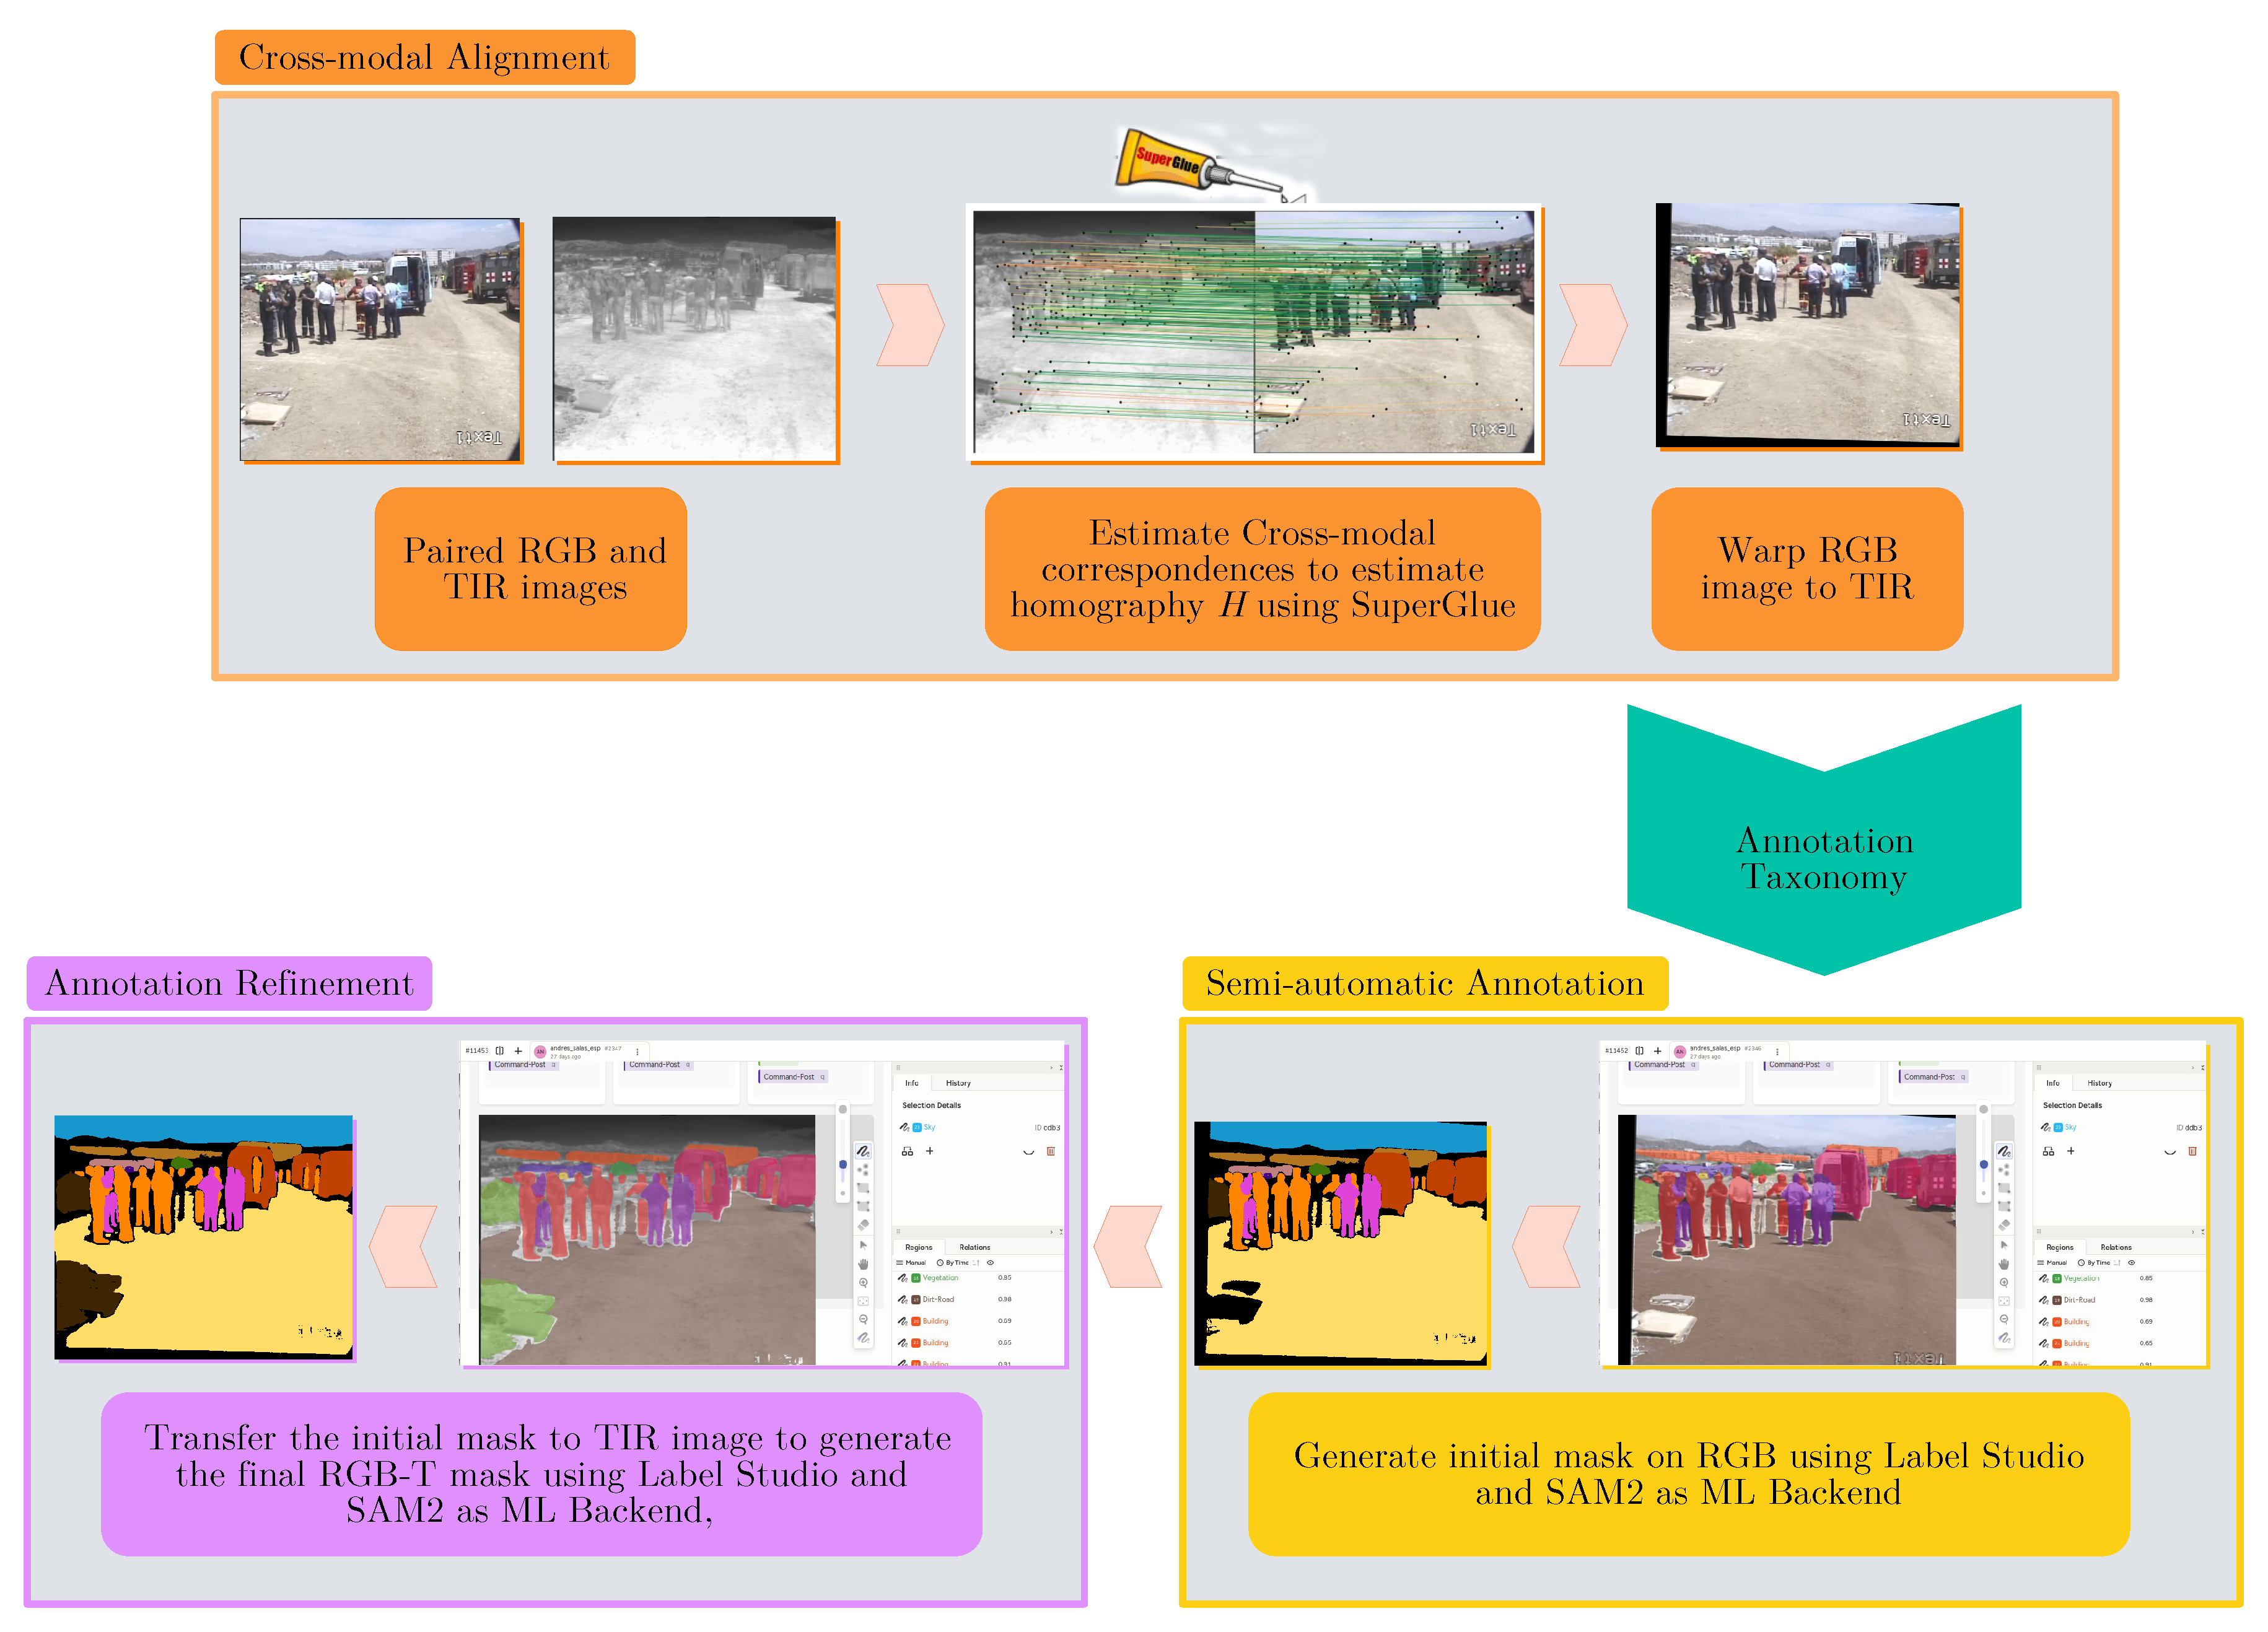
Figure 4.
Qualitative comparisons of annotation strategies on two representative MFNet validation images (day and night scenes): (a) RGB input, (b)Thermal input, (c) MFNet ground–truth, (d)A Manual polygon method, (e) A SAM2 (RGB) method, (f) SAM2 (RGB-T) refinement method. The SAM2 (RGB-T) method (f) demonstrates superior adherence to the ground–truth (c), corresponding to the significant improvement in Table 1.
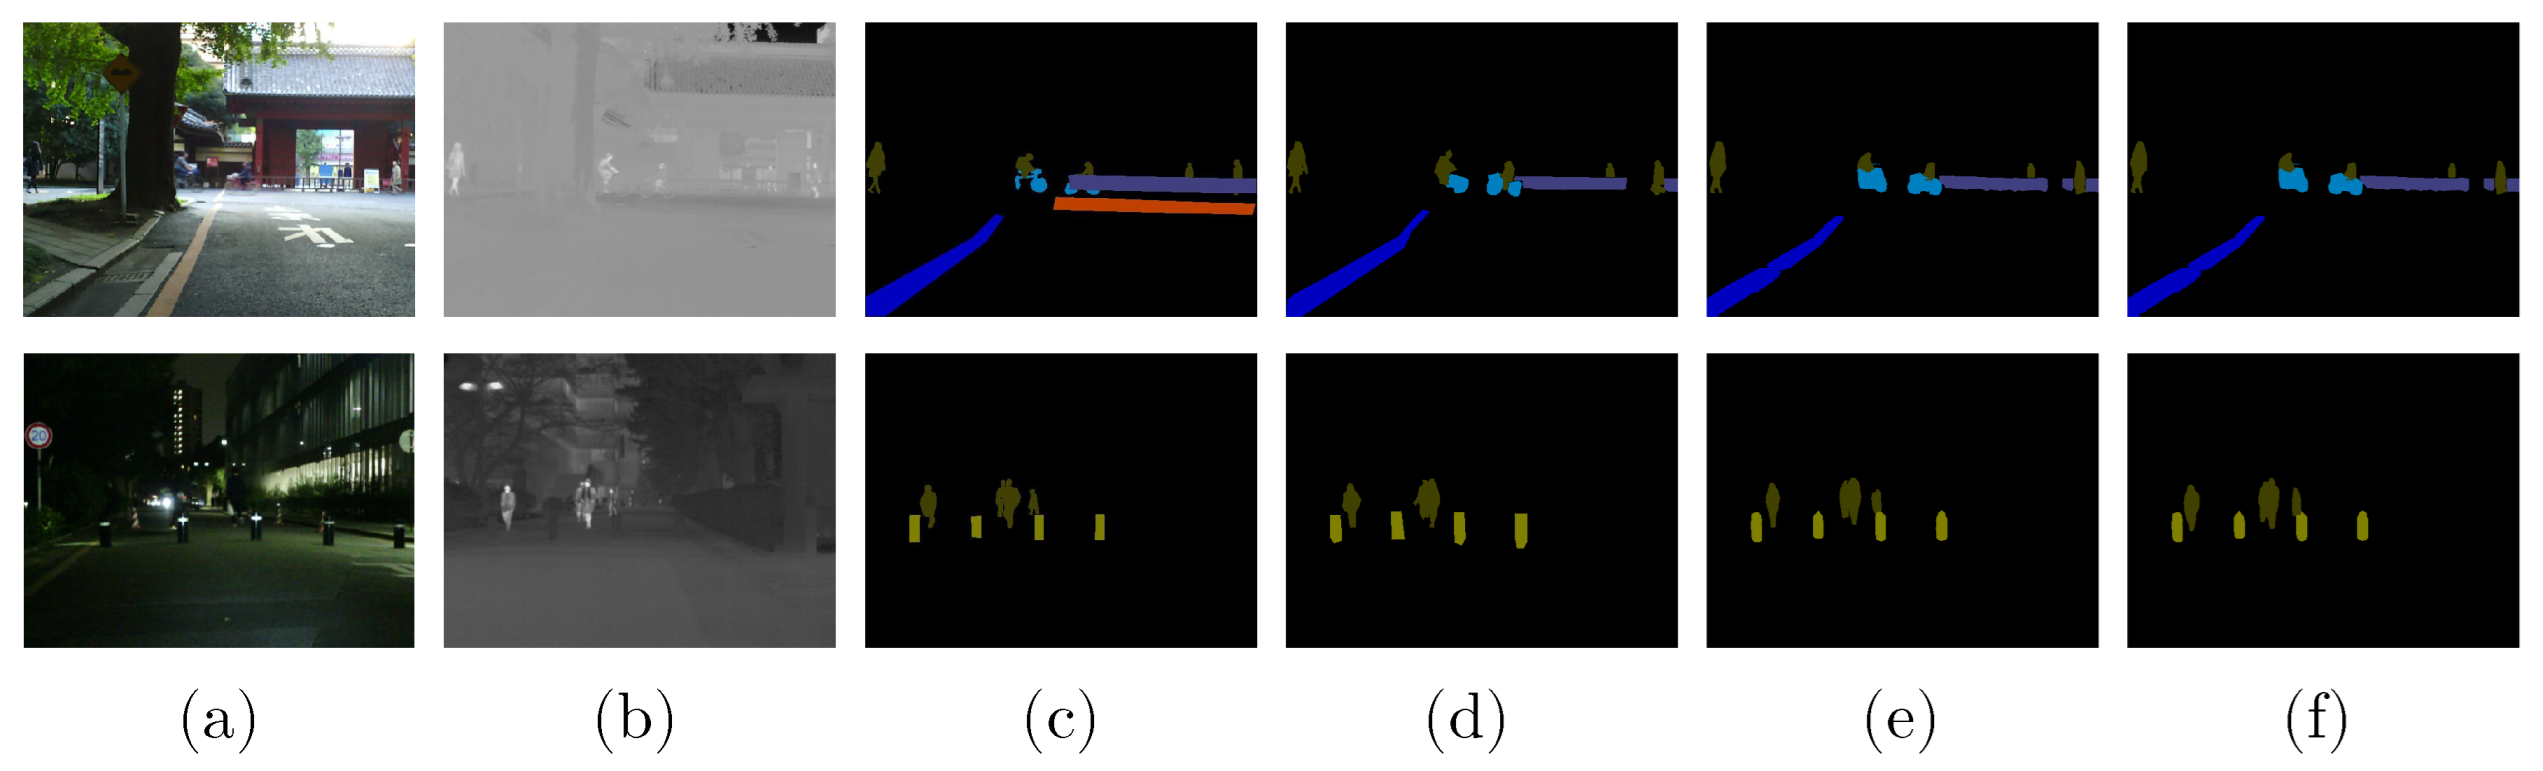
Figure 5.
Predictions on UMA-SAR dataset: (a) RGB images, (b) TIR images, (c) Ground- truth images, (d) FEANET predicted images, (e) SAFERNet predicted images.
Figure 5.
Predictions on UMA-SAR dataset: (a) RGB images, (b) TIR images, (c) Ground- truth images, (d) FEANET predicted images, (e) SAFERNet predicted images.
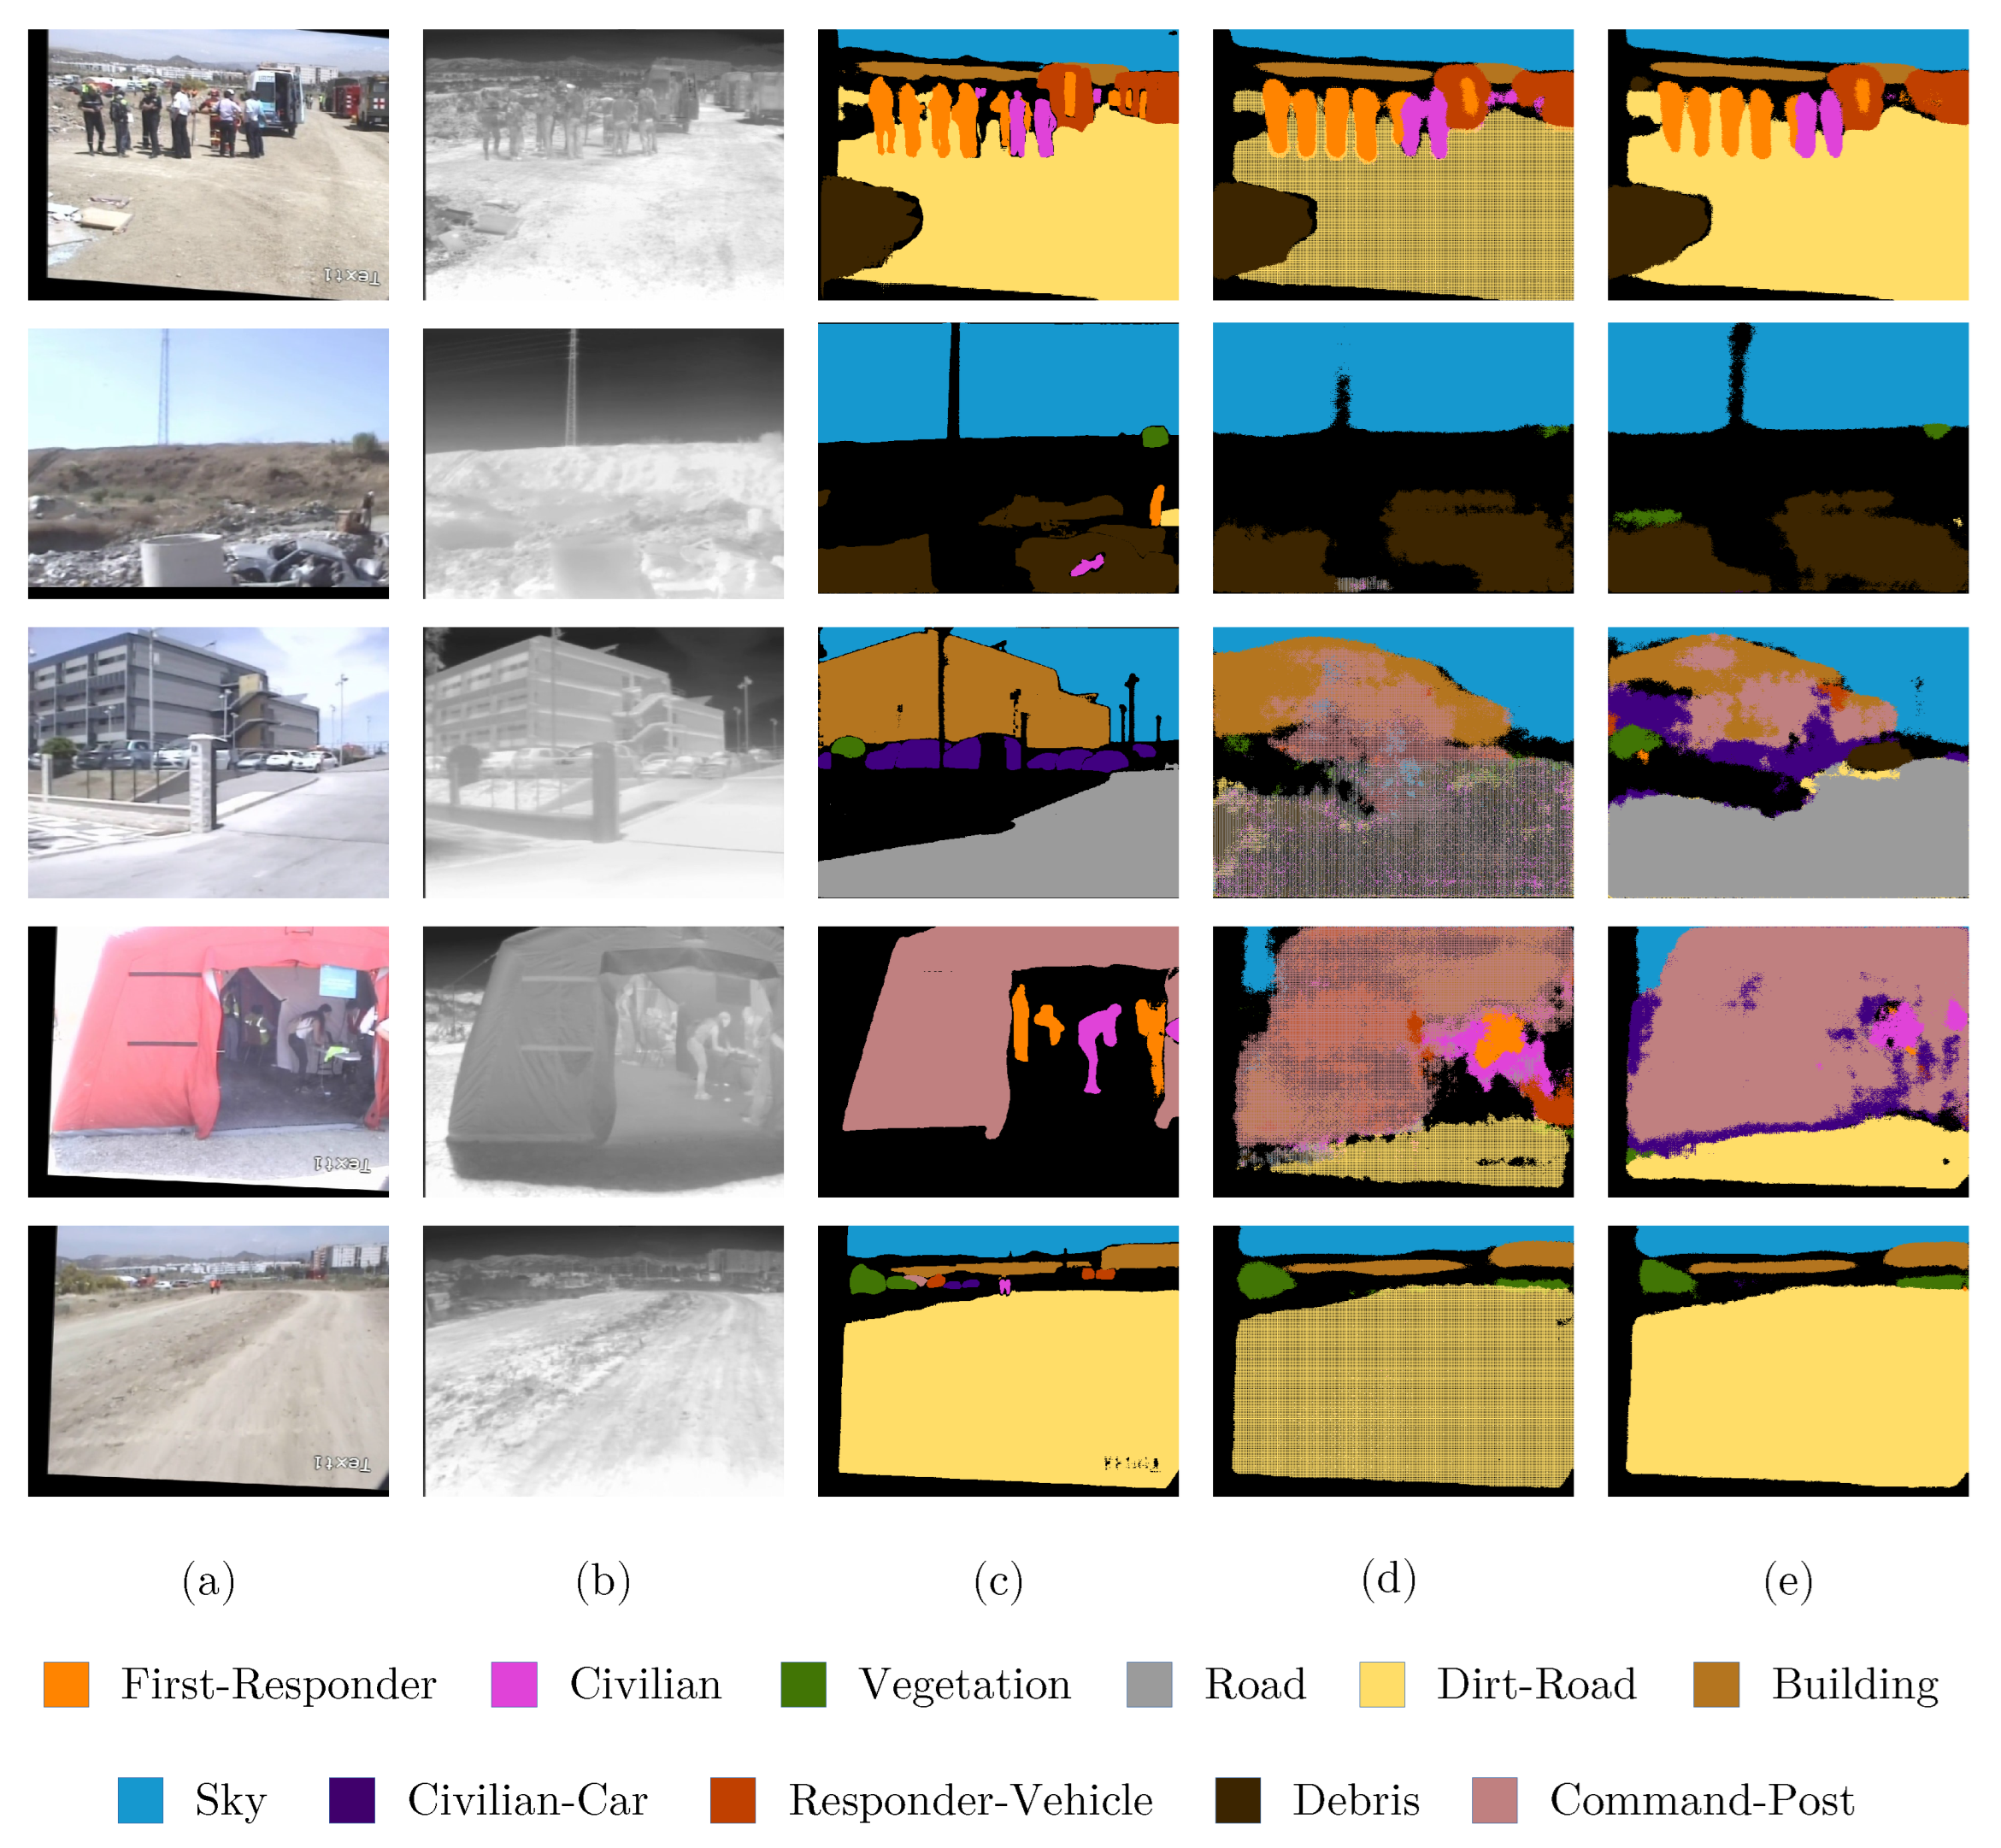

Table 1.
Segmentation quality comparison against MFNet ground-truth. percentages are computed on 30 MFNet validation images (15 day, 15 night scenes). The relative difference is measured against Manual Polygon (RGB)
Table 1.
Segmentation quality comparison against MFNet ground-truth. percentages are computed on 30 MFNet validation images (15 day, 15 night scenes). The relative difference is measured against Manual Polygon (RGB)
| Annotation Method | (%) | Relative Difference (%) |
|---|---|---|
| Manual Polygon (RGB) | 65.9 | – |
| SAM2 (RGB) | 69.5 | +3.6% |
| SAM2 (RGB-T) refinement | 74.9 | +9% |
Table 2.
Annotation cost comparison across strategies. Mean times and standard deviation s are in seconds. Improvements are relative to Manual Polygon Annotation (baseline). Asterisks indicate statistically significant differences from the manual method (Friedman test with Wilcoxon post-hoc analysis and Bonferroni corrections, ). The relative large standard deviations reflect the heterogeneous complexity of SAR scenes.
| Annotation | Annotator A | Annotator B | Overall | |
|---|---|---|---|---|
| Method | Improvement (%) | |||
| Manual Polygon (RGB) |
723.8 ± 532.1 | 962.5 ± 294.4 | 843.2 ± 443.2 | – |
| SAM2 (RGB) | 499.2 ± 732.9 | 632.9 ± 202.2 | 566.0 ± 531.4* | 32.9 |
| SAM2 (RGB-T) refinement |
565.9 ± 772.1 | 766.3 ± 262.1 | 666.1 ± 559.3* | 21.00 |
Table 3.
Agreement metrics: Pixel Accuracy (%) and Inter-annotator Cohen’s Kappa () agreement. Measurements are between annotations produced by each method and a common reference standard (Annotator A’s Manual Polygon on the same image). Categories: Slight (0–0.2), Fair (0.2–0.4), Moderate (0.4–0.6), Substantial (0.6–0.8), Almost perfect (0.8–1.0).
| Annotation Id |
Annotation Method |
Pixel Accuracy (Mean ± SD) (%) |
Cohen’s (Mean ± SD) |
Category (based on ) |
|---|---|---|---|---|
| A | SAM2 (RGB) | 88.9 ± 5 | 0.84 ± 0.07 | Almost perfect |
| SAM2 (RGB-T) refinement |
88.4 ± 5 | 0.83 ± 0.07 | Almost perfect | |
| B | Manual Polygon (RGB) |
88.8 ± 7 | 0.84 ± 0.1 | Almost perfect |
| SAM2 (RGB) | 80.8 ± 12 | 0.73 ± 0.14 | Substantial | |
| SAM2 (RGB-T) refinement |
80.8 ± 12 | 0.73 ± 0.14 | Substantial |
Table 4.
Segmentation fidelity results (%) on the UMA-SAR test set.
| FEANet [38] | SAFERNet [39] | |||
|---|---|---|---|---|
| (%) | (%) | (%) | (%) | |
| First-Responder | 86.00 | 73.18 | 86.16 | 74.84 |
| Civilian | 62.70 | 44.56 | 59.77 | 48.51 |
| Vegetation | 62.96 | 50.18 | 55.15 | 44.64 |
| Road | 39.9 | 27.41 | 79.78 | 59.68 |
| Dirt-Road | 66.87 | 61.33 | 88.60 | 79.89 |
| Building | 74.57 | 57.85 | 70.50 | 56.71 |
| Sky | 94.79 | 90.68 | 94.61 | 90.80 |
| Civilian-Car | 00.00 | 00.00 | 42.65 | 20.80 |
| Responder-Vehicle | 83.96 | 69.73 | 83.00 | 73.09 |
| Debris | 79.44 | 66.83 | 76.67 | 64.36 |
| Command-Post | 64.85 | 41.43 | 86.54 | 55.72 |
| (%) | (%) | (%) | (%) | |
| 65.81 | 52.44 | 74.58 | 60.13 | |
Disclaimer/Publisher’s Note: The statements, opinions and data contained in all publications are solely those of the individual author(s) and contributor(s) and not of MDPI and/or the editor(s). MDPI and/or the editor(s) disclaim responsibility for any injury to people or property resulting from any ideas, methods, instructions or products referred to in the content. |
© 2026 by the authors. Licensee MDPI, Basel, Switzerland. This article is an open access article distributed under the terms and conditions of the Creative Commons Attribution (CC BY) license (http://creativecommons.org/licenses/by/4.0/).
Copyright: This open access article is published under a Creative Commons CC BY 4.0 license, which permit the free download, distribution, and reuse, provided that the author and preprint are cited in any reuse.


