
Submitted:
05 January 2026
Posted:
06 January 2026
You are already at the latest version
Abstract
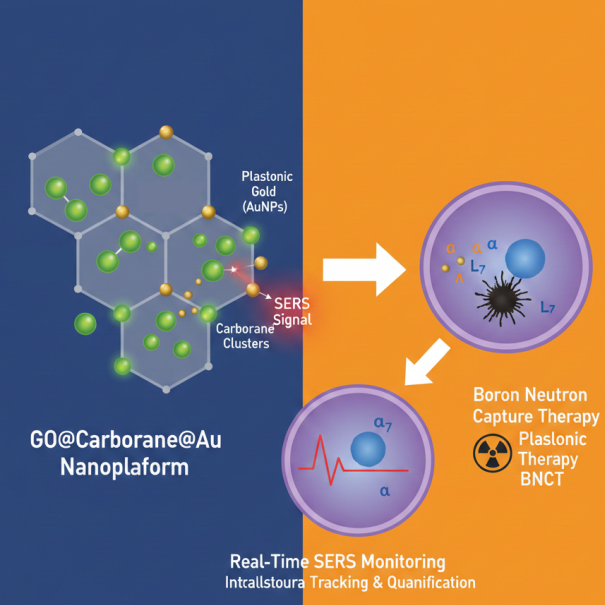
Background: Boron Neutron Capture Therapy (BNCT) represents a highly selective therapeutic modality for recalcitrant cancers, leveraging the nuclear reaction initiated by thermal neutron capture in Boron-10 (10B) to deliver high-linear energy transfer radiation (α-particles and 7Li ions) directly within tumor cell boundaries. However, the widespread clinical adoption of BNCT is critically hampered by the pharmacological challenge of achieving sufficiently high, tumor-selective intracellular 10B concentrations (20-50 μg of 10B /g tissue). Conventional small-molecule boron carriers often exhibit dose-limiting non-specificity, rapid systemic clearance, and poor cellular uptake kinetics. Methods: To overcome these delivery barriers, we synthesized and characterized a novel dual-modality nanoplatform based on highly biocompatible, functionalized graphene oxide (GO). This platform was structurally optimized through covalent conjugation with high-boron content carborane clusters (dodecacarborane derivatives) to enhance BNCT efficacy. Crucially, the nanocarrier was further decorated with plasmonic gold nanostructures (AuNPs), thereby endowing the system with intrinsic surface-enhanced Raman scattering (SERS) properties, which enabled real-time, high-resolution intracellular tracking and quantification. Results: We evaluated the synthesized GO@Carborane@Au nanoplatforms for their stability, cytotoxicity, and internalization characteristics. Cytotoxicity assays demonstrated excellent biocompatibility against the non-malignant human keratinocyte line (HaCaT), while showing selective toxicity (upon irradiation, if tested) and high cellular uptake efficiency in the aggressive human glioblastoma tumor cell line (T98G). The integrated plasmonic component allowed for the successful, non-destructive monitoring of nanoplatform delivery and accumulation within both HaCaT and T98G cells using SERS microscopy, confirming the potential for pharmacokinetic and biodistribution studies in vivo. Conclusion: This work details the successful synthesis and preliminary in vitro validation of a unique Graphene Oxide-based dual-modality nanoplatform designed to address the critical delivery and monitoring challenges of BNCT. By combining highly efficient carborane delivery with an integrated photonic trace marker, this system establishes a robust paradigm for next-generation theranostic agents, significantly advancing the potential for precision, image-guided BNCT for difficult-to-treat cancers like glioblastoma.
Keywords:
carboranes
; graphene oxide
; gold nanoparticles
; drug delivery
; Raman microscopy
1. Introduction
Boron Neutron Capture Therapy (BNCT) has emerged as a promising modality within precision oncology, offering theoretical and practical advantages for treating malignancies such as glioblastoma, malignant melanoma, and recurrent squamous cell carcinomas of the head and neck as examples of tumors traditionally resistant to conventional photon-based radiotherapy and chemotherapy.[1,2] BNCT therapeutic efficacy hinges on the selective delivery of the non-toxic isotope 10B to tumor cells, followed by irradiation with low-energy thermal neutrons.[3,4] The high neutron capture cross-section of the boron triggers a nuclear reaction producing high-linear energy transfer (LET) α-particles and 7Li nuclei, which deposit lethal energy within a cellular-scale range of 5–9 μm.[5] This microscopic precision confines cytotoxicity to boron-loaded tumor cells while sparing surrounding healthy tissues and vascular structures. However, clinical translation of BNCT has been fundamentally constrained by the pharmacokinetics of first-generation boron carriers such as L-borono-phenylalanine (BPA) and sodium mercaptoundecahydro-dodecaborate (BSH).[6,7,8] These agents suffer from suboptimal tumor selectivity, rapid systemic clearance, and insufficient tumor-to-normal tissue ratios, compromising the requisite intratumoral boron concentration (20–50 μg/g) during neutron irradiation.[9] Addressing these critical limitations necessitates advanced drug delivery systems (DDS) that can protect boron payloads in circulation, prolong systemic half-life, and achieve targeted release within the tumor microenvironment.
Nanomaterial-based platforms have emerged as transformative candidates for BNCT DDS, providing customizable physicochemical interfaces that enable controlled biodistribution and stimulus-responsive payload release.[10] Graphene Oxide (GO) represents a particularly attractive scaffold due to its single-atom-thick, amphiphilic structure, which offers exceptional surface area and functional group diversity for high-density drug loading.[11,12] Nevertheless, pristine GO is prone to aggregation in physiological media, limiting its clinical applicability. Surface functionalization with biocompatible polymers such as Polyvinyl Alcohol (PVA) enhances colloidal stability by introducing a steric hydration layer that mitigates serum protein adsorption and reticuloendothelial system clearance.[13,14,15] PVA-functionalized GO nanocarriers are optimally sized to evade renal filtration while taking advantage of the enhanced permeability and retention (EPR) effect for preferential tumor accumulation. Moreover, these constructs can be engineered for triggered boron release in response to acidic tumor pH or lysosomal conditions, thereby maximizing intratumoral boron delivery specificity. Graphene oxide has been previously utilized in a drug delivery of multiple compounds, including nucleic acids such as siRNA [16,17], proteins [18], or low molecular drugs [19]. GO was also functionalized using carborane for possible applications in electronics. [20] Drug delivery systems for carboranes were also developed based on hyaluronic acid [21] where its selectivity towards interactions with CD44 were studied, iron oxide nanomaterials [20] for evaluation of its cytotoxicity on cells including HeLa, BxPC-3, MCF-7, and L929, or gold nanoclusters [22] for a purposes of precise imaging of glioblastoma cells.
Building on these insights, we present a novel hierarchical nanoplatform, GO@Carb@Au, comprising a GO core functionalized with PVA, loaded with a carborane boron cluster, and decorated with gold nanoparticles. The carborane moiety significantly amplifies boron payload density beyond conventional agents, enhancing neutron capture potential. Gold nanoparticle integration provides structural reinforcement and offers additional functionality including radio sensitization and tracing using surface enhanced Raman microscopy, thereby facilitating future theranostic applications. Comprehensive in vitro evaluation using T98G glioblastoma and HaCaT keratinocyte cell lines demonstrates efficient tumor-selective internalization, a pronounced cytotoxic effect in malignant cells post neutron irradiation analogues, and negligible toxicity to healthy counterparts. These findings validate the GO@Carb@Au platform's capability to overcome current delivery barriers and highlight its promise as a next-generation DDS tailored for BNCT. This work represents an interdisciplinary convergence of nuclear physics, nanomaterial science, polymer chemistry, and tumor biology, providing a robust strategy to redefine particle-based radiotherapeutics in oncology.
2. Materials and Methods
Preparation of GO
The initial material for the study was based on commercially produced GO obtained from Merck (Saint Louis, MO, USA). The target average flake size (<100 nm) was achieved through a combined approach involving ultrasonication, solvent, and temperature. Briefly, the GO stock solution (c = 4 mg/mL) was diluted with a sterile PBS to 400 µg/mL. Consequently, ultrasonication was applied for 2 hours at 50˚C using a Bandelin ultrasonic bath (Berlin, Germany). The sample was then agitated for 18 hours at 500 RPM and 65 C and subsequently sonicated again at 70 C for 1 hour. Larger flakes were removed by centrifugation at 21,191 RPM for 15 minutes. Next, pristine GO nanomaterial was functionalized with PVA to enhance biocompatibility and increase the number of active functional groups for further anchoring of drug-delivery compounds. An amount of 25 mg of PVA (Sigma-Aldrich, St. Louis, MI, USA) was added to the 5 mL of previously prepared GO dispersion. The mixture underwent a 10-minute sonication step. Following this, 40 µL of N-(3-dimethylaminopropyl)-N´-ethylcarbodiimide hydrochloride (EDC, Sigma-Aldrich) at a concentration of 5 mg/mL was gradually added to the mixture. After 24 hours of stirring (500 RPM, 65 °C), a second round of stirring and sonication followed for 18 hours (500 RPM, 65 °C) and 6 hours (70 °C) respectively. Infrared spectra of PVA-modified GO were acquired using a Nicolet IR spectrometer (Fisher Scientific, Waltham, MA, USA) operating in ATR mode using a ZnSe crystal.
Synthesis of GO@Carb
In total, 2 mL of the previously prepared GO@PVA flakes were ultrasonicated for 3 hours. The dispersion was then mixed with 1 mL of an aqueous solution containing 100 mg/L of m carborane-1-carboxylic acid (Carb, structure in Figure 1) and 1 mL of 1 mg/L of 1-ethyl-3-(3-dimethylaminopropyl)carbodiimide (EDC), and stirred at room temperature at 60 RPM for 3 hours. This protocol would achieve a loading of 33.3 μg of carborane on the platform at 100% loading capacity. The functionalized 2D nanomaterial was isolated by microdialysis for 18 hours at room temperature and then re-suspended in 2 mL of phosphate-buffered saline (pH 7.4). The further analysis of the free carborane compound in the reaction mixture after the dialysis shown a loading capacity of 92% at the present conditions, which gives approximately 31 ug/mL concentration of carborane loaded on the platform, marking it as a possible alternative to currently applied free drugs.
Synthesis of GO@Carb@Au
The 1 mL of previously prepared GO@Carb nanomaterial was mixed with 1 mL PBS suspension (pH = 7.4) of gold nanoparticles (0.1 mg/mL) and shaken at 150 RPM for 6 hours at room temperature. The mixture was centrifuged at 15,000 RPM at 4 °C for 30 minutes to separate GO from the free and considerably smaller Au nanoparticles. The separated GO was washed with PBS. The process was repeated 2 times. The final product was stored in the refrigerator at 5˚C.
Characterization of the Platform Using Microscopy
The initial nanomaterials and their functionalized modalities were characterized using electron microscopy, including scanning electron microscopy (SEM, ZEISS Sigma 360, Germany) and transmission electron microscopy (TEM, Delong, Brno, Czechia). The experimental parameters for SEM were 7 – 10 kV accelerating voltage; the aperture was set to 30. TEM: 5 kV accelerating voltage. The materials were also characterized using atomic force microscopy (NTegra spectra, NT-MDT, Russia) using CSG-30 tips.
In Vitro Biological Study
Cell Culture
For the in vitro biological studies, two different cell lines were used: HaCaT, an immortalized human keratinocyte line, and T98G, a human glioblastoma-derived tumor cell line. Both cell types were maintained in DMEM (Gibco) supplemented with 10% fetal bovine serum (FBS; Gibco), 1% L-glutamine (Gibco), and 1% penicillin–streptomycin solution (100 U/mL and 100 µg/mL; Gibco). All cell manipulation steps were carried out under aseptic conditions in a laminar flow hood. The cultures were incubated at 37 °C in a humidified atmosphere containing 5% CO₂. Prior to experiments, cells were detached using trypsin, pelleted by centrifugation, and resuspended in a fresh medium. Cell concentrations were determined using a Bio-Rad TC10™ automated cell counter (Marshall Scientific, Hampton, NH, USA).
Cell Viability (Alamar Blue) Assay
For the Alamar Blue viability assay, 8,000 cells were seeded per well on a 96-well plate and allowed to adhere overnight. Cells were subsequently exposed to bare GO functionalized using PEG (labeled as “bare”), GO@Carb, and GO@Carb@Au samples at five concentrations (1.75, 3.5, 7, 14, and 28 μg/mL), where all tested concentrations were normalized to the total Carb content. Prior to application, each sample was placed in an ultrasonic bath for 10 minutes to ensure proper dispersion and then diluted directly into a complete culture medium to obtain the desired working concentrations. The treated cells were incubated for 24 or 72 h at 37 °C under 5% CO₂. Following the exposure period, Alamar Blue reagent was added directly to the existing culture medium to achieve a final concentration corresponding to 10% of the total well volume. During a 6-h incubation at 37 °C and 5% CO₂, metabolically active cells reduced resazurin to fluorescent resorufin, whereas no conversion occurred in non-viable cells. Absorbance was measured using a Tecan Infinite M200 Pro plate reader at an emission wavelength of 570 nm. Cell viability was determined by comparing the mean absorbance of treated wells to that of untreated control cells, and the results are expressed as percentage viability. Data are presented as mean ± standard deviation from six independent measurements.
Fixation of Cells for Raman Spectroscopy
Raman spectroscopy was employed as a label-free method to investigate cellular responses to the tested nanomaterials. This technique offers molecular-level information on cellular composition and enables the detection of biochemical alterations resulting from nanoparticle uptake and intracellular interactions.
For sample preparation, sterile glass coverslips were placed into a 24-well culture plate before cell seeding. Subsequently, 30,000 HaCaT or T98 cells were added onto each coverslip in 500 μL of complete medium and allowed to adhere for 24 h. The following day, the cells were treated with the GO@Carb@Au at a concentration corresponding to 1.75 µg/mL, normalized to the total Carb content. After a 24 h incubation period, the coverslips were washed three times with 1 mL of PBS to remove any remaining medium and unbound material. The cells were then fixed at room temperature for 30 min using 1 mL of a fixative solution composed of 1.5% paraformaldehyde (from a 4% stock in PBS; Thermo Fisher Scientific, USA), 0.1% glutaraldehyde (Sigma Aldrich, USA), and PBS. Following fixation, the samples were washed once with 1 mL of PBS and subsequently rinsed three times with 1 mL of distilled water to eliminate salts and minimize spectral interference. Finally, the coverslips were allowed to air-dry at room temperature and stored in a dust-free environment until Raman measurements were conducted.
Characterization and Study of the GO@Carb@Au Using Vibrational Spectroscopy
First, the nanomaterial was characterized using infrared spectroscopy to evaluate the effect of the carborane presence on the surface of the 2D nanoplatform on its vibrational states. The measurements were performed using a Thermo-Fisher infrared microscope using a ZnSe ATR crystal (Thermo-Fisher, U.S.A.). Second, the nanomaterial and fixed cells, both treated and untreated with the GO@Carb@Au nanomaterial, were studied using Raman imaging. The Witec Alpha 300R+ Raman system (Witec G.M.B.H.) was utilized for all experiments. The laser operated at a wavelength of 532 nm (green) with a power of 5 mW on the sample. The single spectra were obtained using 64 microscans with an exposure time of 1 second. The maps were obtained by averaging four microscans, with an exposure time of 0.5 seconds.
3. Results
Morphological and Chemical Characterization of the GO@Carb@Au Nanoplatforms
The morphological properties of the prepared GO@Carb@Au nanoplatforms were evaluated using multiple relevant microscopy techniques. Figure 2A (TEM) and Figure 2B (SEM) reveal that the nanoplatforms consist of thin, sheet-like structures characteristic of graphene oxide. The lateral size of these flakes varies, and they are clearly decorated with clusters of spherical gold nanoparticles. Atomic force microscopy (Figure 2D) confirmed the few-layered nature of the GO flakes and the presence of AuNP clusters on their surface. The average size of the gold nanospheres is approximately 20 nanometers, and the formed cluster islands consist of units of nanoparticles. This constellation indicates the formation of plasmonic hotspots with properties suitable for use as a detection system in surface-enhanced Raman spectroscopy. This potential will be evaluated in the following sections. Spectroscopic analysis confirmed the successful functionalization of the platform. The FTIR spectrum in Figure 2C displays characteristic spectral bands corresponding to the functional groups present in the composite material. Notably, peaks for ν(C=O) at 1652 cm-1 and ν(C-O-C) at 1205 cm-1 stretches confirm the graphene oxide framework, while the broad ν(C-O-H) stretch found at 935 cm-1 is indicative of both GO and the PVA coating. The infrared spectrum of the functionalized GO@Carb@Au nanoplatform also contains spectral bands characteristic of carborane, including a strong band at 2550 cm-1 corresponding to the ν(B-H) vibration mode. Raman imaging (Figure 2E and 2F) further visualizes the distribution of the carborane payload across the surface of the GO flakes using a combination of Raman imaging (in red) and optical microscopy (background image), and also using a overlapped combination of univariate analysis models showing a distribution of v(B-H) vibrations (for carborane, in red color) across the D-band of the graphene oxide (in gray - black) shown on the Figure 2F. The considerably strong signal confirms its successful attachment to the present graphene oxide flakes.
Evaluation of Plasmonic Properties
The presence of gold nanoparticles imparts plasmonic properties to the nanoplatform, making it suitable for Surface-Enhanced Raman Spectroscopy (SERS). To demonstrate this capability, the platform was incubated for 24 hours at a room temperature (293K) with Rhodamine 6G, a common SERS probe (R6G) at a concentration of c = 1 µM. Figure 3A shows a strong SERS spectra of R6G obtained from four points of interest located on various flakes on the sample. Spectral data are labeled in orange, red, blue, and violet trace colors, indicating robust signal enhancement of the analyte at all places, albeit at moderately different signal intensities. This effect could originate from the variations in the presence of islands composed of gold nanoparticles on the surface and by the presence of available hotspots. The signal of the GO, represented, e.g., by the D and G bands at 1250 and 1590 cm-1, varies reliably with the structure of the flakes and their thickness. The green signal shows the Raman signal obtained by the incubation of the Rhodamine 6G at a concentration level of 1 mM with a pristine GO. The spectral data indicates a considerable drop in the intensity of R6G-specific bands, compared to intensities obtained using a material with the presence of gold nanoparticle islands on its surface. The signal amplification factor calculated as a ratio between amplified and non-amplified signals measured at defined concentrations is on average 1×10⁴. The Raman map in Figure 3B visualizes the distribution of the SERS signal across a single GO flake, revealing that the enhancement is concentrated in "hotspots" that correspond to the locations of the previously localized AuNP clusters.
Confirmation of Carborane Functionalization
Raman spectroscopy provided direct evidence for the successful conjugation of carborane. Figure 4A shows the Raman spectrum of pure m-carborane-1-carboxylic acid, which is dominated by a set of sharp and intense spectral bands at approximately 2600 cm-1, corresponding to the v(B-H) stretching mode. Figure 4B shows a SERS signal of the nanoplatform surface averaged over the center of the flake (labeled as Spot 1) and an average spectrum taken from the edge of the flake (labeled as Spot 2). The resulting average Raman intensity of carborane – specific spectral bands from various spots on the nanoplatform indicate that the variations in presence of functional groups binding carborane on the edges and in the center of the flake play a role in its distribution patterns. Figure 4C compares the spectra of the bare nanoplatform and the final GO@Carb@Au product. The characteristic carborane peak is clearly present in the spectrum of the final product and absent from the bare platform, unequivocally confirming successful functionalization. The SERS image in Figure 4D maps the intensity of this v(B-H) signal in red-blue grading from light red to dark blue colors, illustrating the distribution of carborane across multiple flakes (shown in the shades of gray), with the carboranes covering a majority of the surface (show in red color) and concentrated in the center of the flakes (shown in dark blue).
Evaluation of the Cytotoxicity
The biocompatibility of nanoplatforms is crucial for any potential clinical application. Figure 5 shows the results of cytotoxicity assays performed on T98 glioblastoma cells and HaCaT keratinocytes after 24 and 72 hours of incubation. Across all tested concentrations (1.75 to 28 µg/mL), the bare, carborane-functionalized, and gold-decorated platforms exhibited minimal toxicity. Cell viability remained high (generally above 80-90%) for both cell lines at both time points. This excellent biocompatibility suggests that the nanoplatform is a safe vehicle for cellular delivery.
Studies of Cellular Internalization
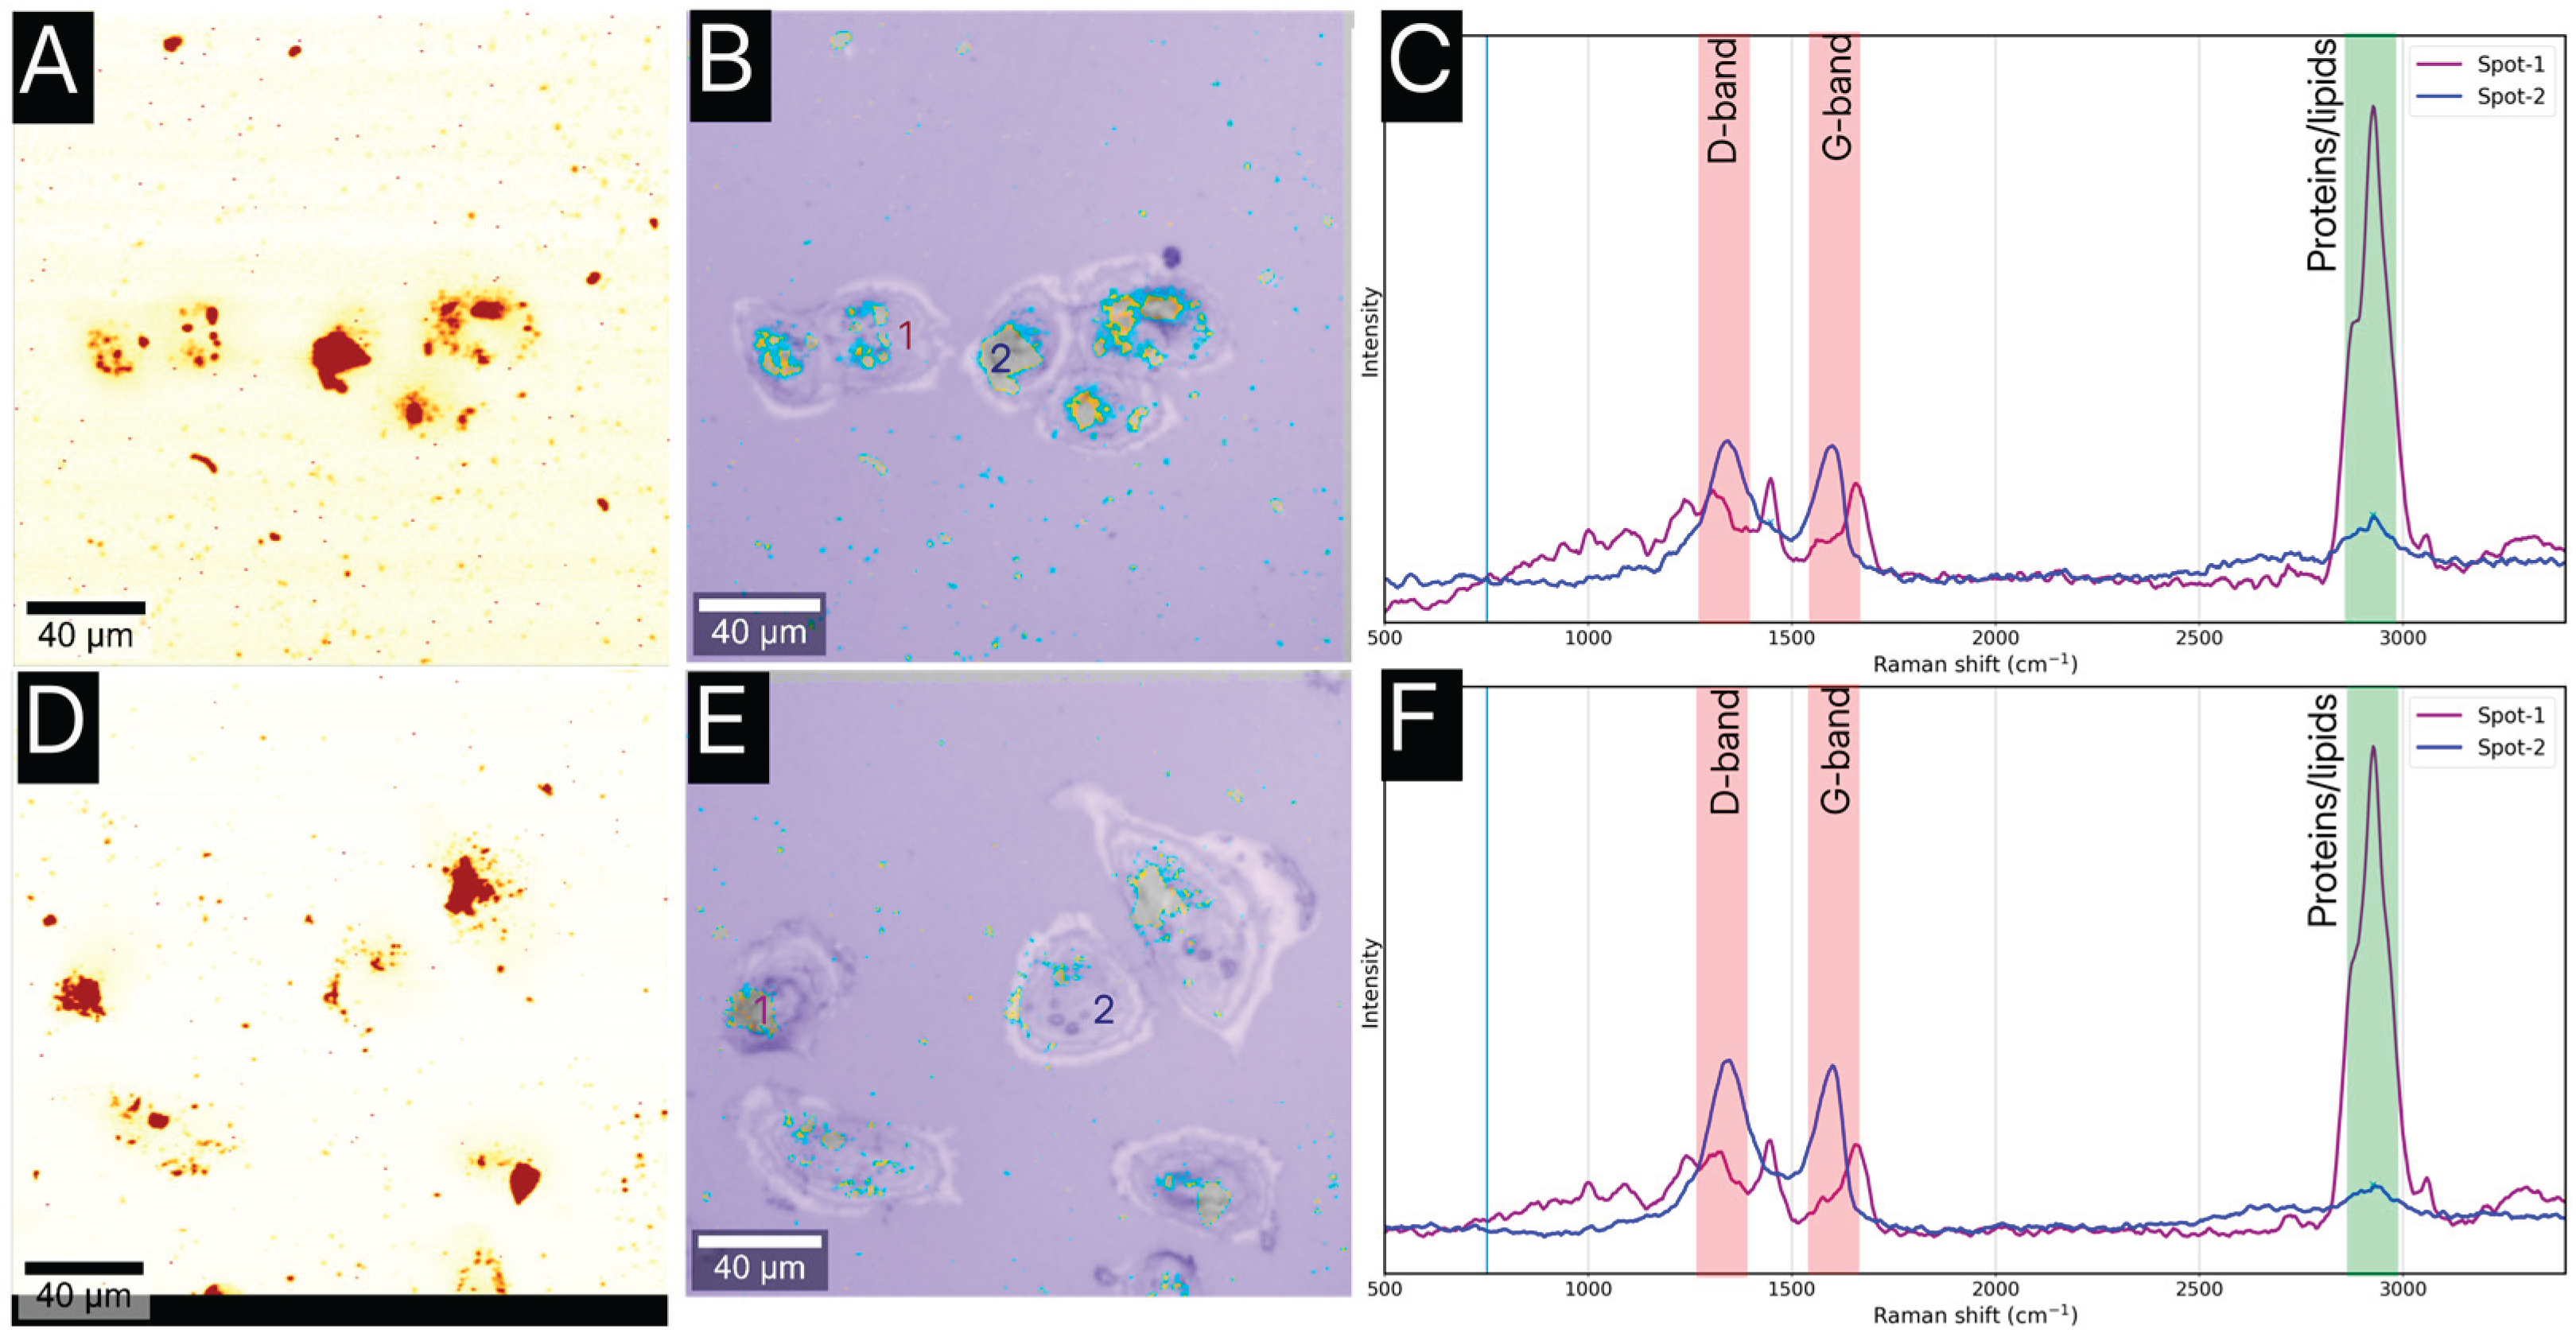
To be effective, the boron delivery agent must be internalized by the target cancer cells. Despite the existence of other fluorescence-based microscopies, we utilized SERS mapping to visualize the uptake of the GO@Carb@Au nanoplatform. This approach does not require additional fluorescence labeling by not stable-enough or photobleaching structures and thus offers a clearer and less biased image. Figure 6 displays the results of the imaging for T98 and HaCaT cells. The SERS maps (A, C) and the overlapped optical/SERS images (B, D) clearly show that the nanoplatforms are located within the cellular cytoplasm. SERS maps are constructed using a univariate analysis targeted at graphene oxide (D-band, in orange color), and the optical overlays contain SERS map of graphene oxide as a D-band (in orange color) and carborane as a v(B-H) band (in blue color) on a background of an optical microscopy image. It can be seen that the carborane is localized on the surface and also importantly around the edges of the oxide graphene flakes suggesting its release into the cytoplasm. The corresponding average spectra (C) differentiates between the cell's intrinsic signal (labeled as Spot-1) and the platform's signal (Labeled as Spot-2). Spectra from Spot-1 (cytoplasm) show broad bands characteristic of proteins and lipids, while spectra from Spot-2 (internalized platform) exhibit the distinct D and G bands of graphene oxide, together with a weaker, albeit still present signal of carborane at 2550 cm-1, confirming the intracellular presence of the nanoplatform. Interestingly, the overall amount of the GO@Carb@Au is considerably lower inside the HaCaT cells. The spectral analysis of data shown in Figure 6B and 6E uncovered >50% difference, which indicates a considerable level of selection of the carbon-based platform to internalize preferentially in cancer cell lines.
4. Discussion
The primary objective of this study was to develop and characterize a multi-functional nanoplatform capable of delivering carborane for BNCT applications while offering secondary modality for SERS-based tracking. The results confirm the successful synthesis of a GO@Carb@Au platform that meets these criteria. The combination of electron and atomic force microscopy provided a comprehensive morphological characterization, confirming a structure well-suited for drug delivery: high-surface-area GO flakes decorated with plasmonically active gold nanoparticles. The successful attachment of carborane, the boron-containing payload, was the most critical step. While FTIR suggested successful surface chemistry modifications, Raman spectroscopy provided other important proof. The distinct ν(B-H) vibrational band of carborane served as a unique spectral fingerprint, and its presence in the final product (Figure 4) confirmed that the carborane was successfully conjugated to the GO surface. This demonstrates the power of Raman spectroscopy as a non-destructive quality control tool for verifying the functionalization of such nanocarriers. A key innovation of this platform is its theranostic design. The gold nanoparticles are not merely structural; they provide a SERS functionality that was successfully demonstrated using R6G (Figure 3). This built-in optical reporting capability was then leveraged to track the platform's fate in a biological environment. The SERS imaging experiments (Figure 6) conclusively showed that the nanoplatforms are efficiently internalized by both cancerous (T98) and non-cancerous (HaCaT) cells, localizing within the cytoplasm. This is a vital finding, as effective BNCT relies on the intimate proximity of the boron agent to the cell's nucleus. Furthermore, the platform demonstrated excellent biocompatibility. The low cytotoxicity observed in both cell lines even after 72 hours of exposure (Figure 5) is a prerequisite for any material intended for in vivo use. This suggests that the GO@Carb@Au construct is a safe and stable delivery vehicle.
5. Conclusions
In this work, we have synthesized and characterized a novel GO@Carb@Au theranostic nanoplatform. Multi-modal characterization confirmed the successful decoration of graphene oxide flakes with gold nanoparticles and the covalent attachment of carborane. The platform exhibits strong SERS activity, enabling its label-free tracking once internalized by cells. Importantly, the nanoplatform shows high biocompatibility and is readily taken up by both glioma and keratinocyte cells, with a stronger preference towards internalization in T98 cell lines, accumulating in the cytoplasm. These findings highlight the significant potential of this hybrid nanomaterial as a safe and effective delivery system for Boron Neutron Capture Therapy, with integrated optical tracking capabilities that could aid in future diagnostics and treatment monitoring.
Author Contributions
V.R.: Writing – Original Draft, Investigation, Methodology, Project Administration, Formal Analysis, Data Curation, Writing – Review & Editing, L.Z.: Investigation, Data Curation, Methodology, Writing – Original Draft.
Funding
The work was supported by the MEYS CR (Large Research Infrastructure Project LM2018129 – Czech Bio-imaging) and by the project National Institute for Cancer Research (Programme EXCELES, ID Project No. LX22NPO5102)—Funded by the European Union—Next Generation EU, project SALVAGE (OP JAC; reg. no. CZ.02.01.01/00/22_008/0004644), by European Regional Development Funds – project “TECHSCALE” (CZ.02.01.01/00/22_008/0004587), and European Regional Development Fund – Project “Excellence in Regenerative Medicine” (CZ.02.01.01/00/22_008/0004562).
Data Availability Statement
The data presented in this study are available on request from the corresponding author due to legal reasons.
Conflicts of Interest
The funders had no role in the design of the study; in the collection, analyses, or interpretation of data; in the writing of the manuscript; or in the decision to publish the results.
Abbreviations
The following abbreviations are used in this manuscript:
| SEM | Scanning electron microscopy |
| PVA | Polyvinyl alcohol |
| GO | Graphene Oxide |
| Carb | m-carborane-1-carboxylic acid); EDC (1-ethyl-3-(3-dimethylaminopropyl)carbodiimide |
| SERS | Surface Enhanced Raman Spectroscopy |
References
- Chen, G.; Yang, J.; Lu, G.; Liu, P. C.; Chen, Q.; Xie, Z.; Wu, C. One Stone Kills Three Birds: Novel Boron-Containing Vesicles for Potential BNCT, Controlled Drug Release, and Diagnostic Imaging. Mol. Pharmaceutics 2014, 11(10), 3291–3299. [Google Scholar] [CrossRef]
- Coghi, P.; Li, J.; Hosmane, N. S.; Zhu, Y. Next Generation of Boron Neutron Capture Therapy (BNCT) Agents for Cancer Treatment. Medicinal Research Reviews 2023, 43(5), 1809–1830. [Google Scholar] [CrossRef]
- Nedunchezhian, K.; Aswath, N.; Thiruppathy, M.; Thirugnanamurthy, S. Boron Neutron Capture Therapy - A Literature Review. Journal of Clinical and Diagnostic Research : JCDR 2016, 10(12), ZE01. [Google Scholar] [CrossRef]
- Barth, R. F.; Soloway, A. H.; Fairchild, R. G. Boron Neutron Capture Therapy for Cancer. 1990, 263(4), 100–107. [Google Scholar] [CrossRef] [PubMed]
- Luderer, M. J.; De La Puente, P.; Azab, A. K. Advancements in Tumor Targeting Strategies for Boron Neutron Capture Therapy. Pharmaceutical Research 2015, 32(9), 2824–2836. [Google Scholar] [CrossRef] [PubMed]
- Barth, R. F.; Mi, P.; Yang, W. Boron Delivery Agents for Neutron Capture Therapy of Cancer. Cancer Communications 2018, 38(1), 1–15. [Google Scholar] [CrossRef] [PubMed]
- Barth, R. F.; Grecula, J. C. Boron Neutron Capture Therapy at the Crossroads - Where Do We Go from Here? Applied Radiation and Isotopes 2020, 160, 109029. [Google Scholar] [CrossRef]
- Xu, J.; Wang, J.; Wei, Q. Boron Neutron Capture Therapy in Clinical Application: Progress and Prospect. Kexue Tongbao/Chinese Science Bulletin 2022, 67(14), 1479–1489. [Google Scholar] [CrossRef]
- Barth, R. F.; Gupta, N.; Kawabata, S. Evaluation of Sodium Borocaptate (BSH) and Boronophenylalanine (BPA) as Boron Delivery Agents for Neutron Capture Therapy (NCT) of Cancer: An Update and a Guide for the Future Clinical Evaluation of New Boron Delivery Agents for NCT. Cancer Communications 2024, 44(8), 893–909. [Google Scholar] [CrossRef]
- Fan, W.; Yung, B.; Huang, P.; Chen, X. Nanotechnology for Multimodal Synergistic Cancer Therapy. Chemical Reviews 2017, 117(22), 13566–13638. [Google Scholar] [CrossRef]
- Shim, G.; Kim, M. G.; Park, J. Y.; Oh, Y. K. Graphene-Based Nanosheets for Delivery of Chemotherapeutics and Biological Drugs. Advanced Drug Delivery Reviews 2016, 105, 205–227. [Google Scholar] [CrossRef] [PubMed]
- Gu, Z.; Zhu, S.; Yan, L.; Zhao, F.; Zhao, Y. Graphene-Based Smart Platforms for Combined Cancer Therapy. Advanced Materials 2019, 31(9). [Google Scholar] [CrossRef] [PubMed]
- Mirzaie, Z.; Reisi-Vanani, A.; Barati, M.; Atyabi, S. M. The Drug Release Kinetics and Anticancer Activity of the GO/PVA-Curcumin Nanostructures: The Effects of the Preparation Method and the GO Amount. Journal of Pharmaceutical Sciences 2021, 110(11), 3715–3725. [Google Scholar] [CrossRef]
- Mirzaie, Z.; Reisi-Vanani, A.; Barati, M. Polyvinyl Alcohol-Sodium Alginate Blend, Composited with 3D-Graphene Oxide as a Controlled Release System for Curcumin. Journal of Drug Delivery Science and Technology 2019, 50, 380–387. [Google Scholar] [CrossRef]
- Khan, M. U. A.; Yaqoob, Z.; Ansari, M. N. M.; Razak, S. I. A.; Raza, M. A.; Sajjad, A.; Haider, S.; Busra, F. M. Chitosan/Poly Vinyl Alcohol/Graphene Oxide Based pH-Responsive Composite Hydrogel Films: Drug Release, Anti-Microbial and Cell Viability Studies. Polymers 2021, 13(18), 3124. [Google Scholar] [CrossRef] [PubMed]
- Saravanabhavan, S. S.; Rethinasabapathy, M.; Zsolt, S.; Kalambettu, A. B.; Elumalai, S.; Janakiraman, M.; Huh, Y. S.; Natesan, B. Graphene Oxide Functionalized with Chitosan Based Nanoparticles as a Carrier of siRNA in Regulating Bcl-2 Expression on Saos-2 & MG-63 Cancer Cells and Its Inflammatory Response on Bone Marrow Derived Cells from Mice. Materials Science and Engineering C 2019, 99, 1459–1468. [Google Scholar] [CrossRef]
- Chen, A. M.; Zhang, M.; Wei, D.; Stueber, D.; Taratula, O.; Minko, T.; He, H. Co-Delivery of Doxorubicin and Bcl-2 siRNA by Mesoporous Silica Nanoparticles Enhances the Efficacy of Chemotherapy in Multidrug-Resistant Cancer Cells. Small 2009, 5(23), 2673–2677. [Google Scholar] [CrossRef]
- Shen, H.; Liu, M.; He, H.; Zhang, L.; Huang, J.; Chong, Y.; Dai, J.; Zhang, Z. PEGylated Graphene Oxide-Mediated Protein Delivery for Cell Function Regulation. ACS Appl. Mater. Interfaces 2012, 4(11), 6317–6323. [Google Scholar] [CrossRef]
- Zhao, X.; Liu, L.; Li, X.; Zeng, J.; Jia, X.; Liu, P. Biocompatible Graphene Oxide Nanoparticle-Based Drug Delivery Platform for Tumor Microenvironment-Responsive Triggered Release of Doxorubicin. Langmuir 2014, 30(34), 10419–10429. [Google Scholar] [CrossRef]
- Ŝtengl, V.; Bakardjieva, S.; Bakardjiev, M.; Ŝtíbr, B.; Kormunda, M. Carborane Functionalized Graphene Oxide, a Precursor for Conductive Self-Assembled Monolayers. Carbon 2014, 67, 336–343. [Google Scholar] [CrossRef]
- Di Meo, C.; Panza, L.; Capitani, D.; Mannina, L.; Banzato, A.; Rondina, M.; Renier, D.; Rosato, A.; Crescenzi, V. Hyaluronan as Carrier of Carboranes for Tumor Targeting in Boron Neutron Capture Therapy. Biomacromolecules 2007, 8(2), 552–559. [Google Scholar] [CrossRef] [PubMed]
- Wang, J.; Chen, L.; Ye, J.; Li, Z.; Jiang, H.; Yan, H.; Stogniy, M. Y.; Sivaev, I. B.; Bregadze, V. I.; Wang, X. Carborane Derivative Conjugated with Gold Nanoclusters for Targeted Cancer Cell Imaging. Biomacromolecules 2017, 18(5), 1466–1472. [Google Scholar] [CrossRef] [PubMed]
Figure 1.
Structure of the utilized used carborane molecule.
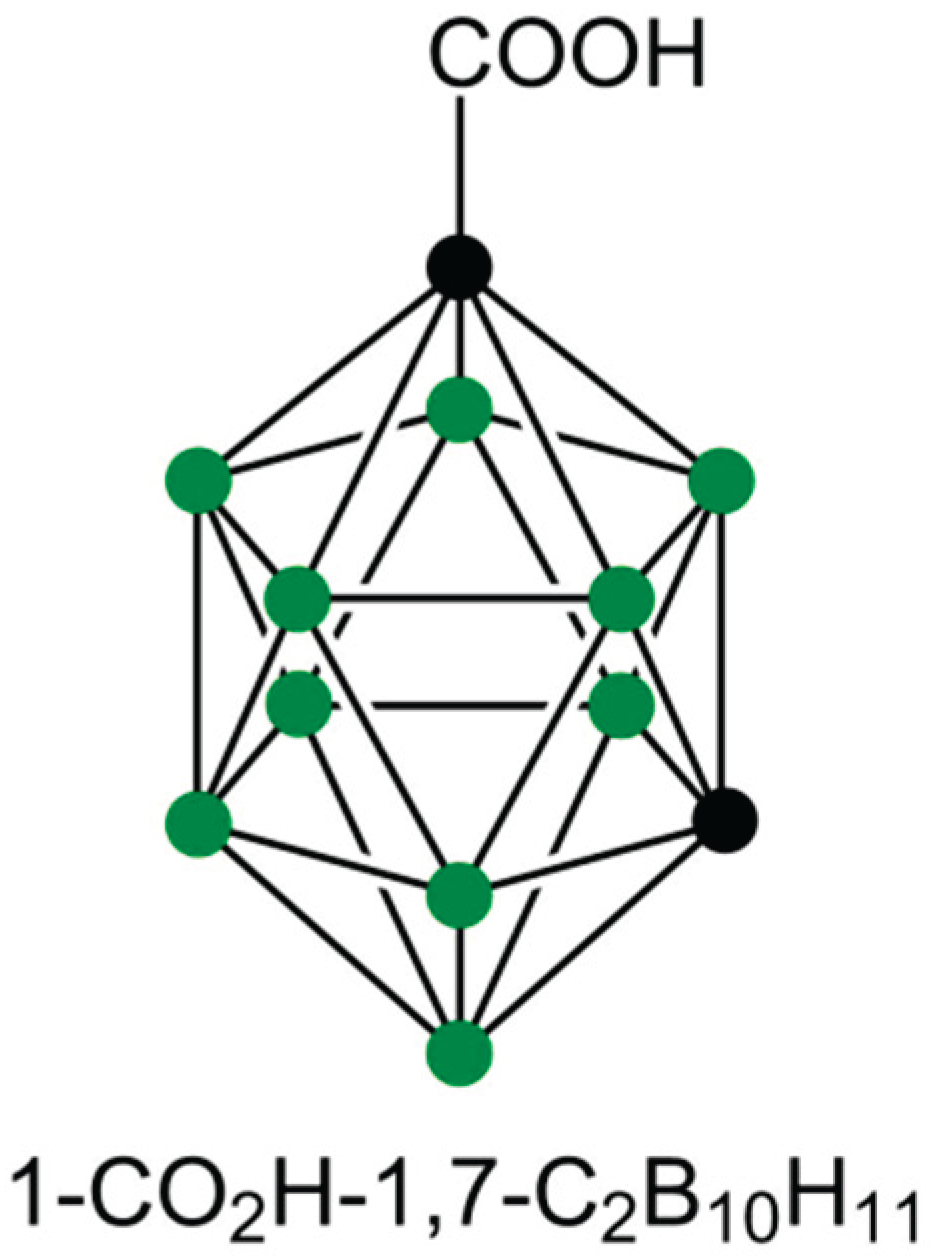
Figure 2.
A) TEM image of the prepared GO@Carb@Au nanoplatform, B) SEM image of the GO@Carb@Au nanoplatform, C) FTIR spectra of the raw carborane and synthesized GO@Carb@Au nanoplatform, D) AFM image of the GO@Carb@Au nanoplatform, E) overlapped optical and Raman (in red) image of the GO@Carb@Au nanoplatform, E) Raman image of the distribution of the carborane on a surface of the GO@Carb@Au nanoplatform.
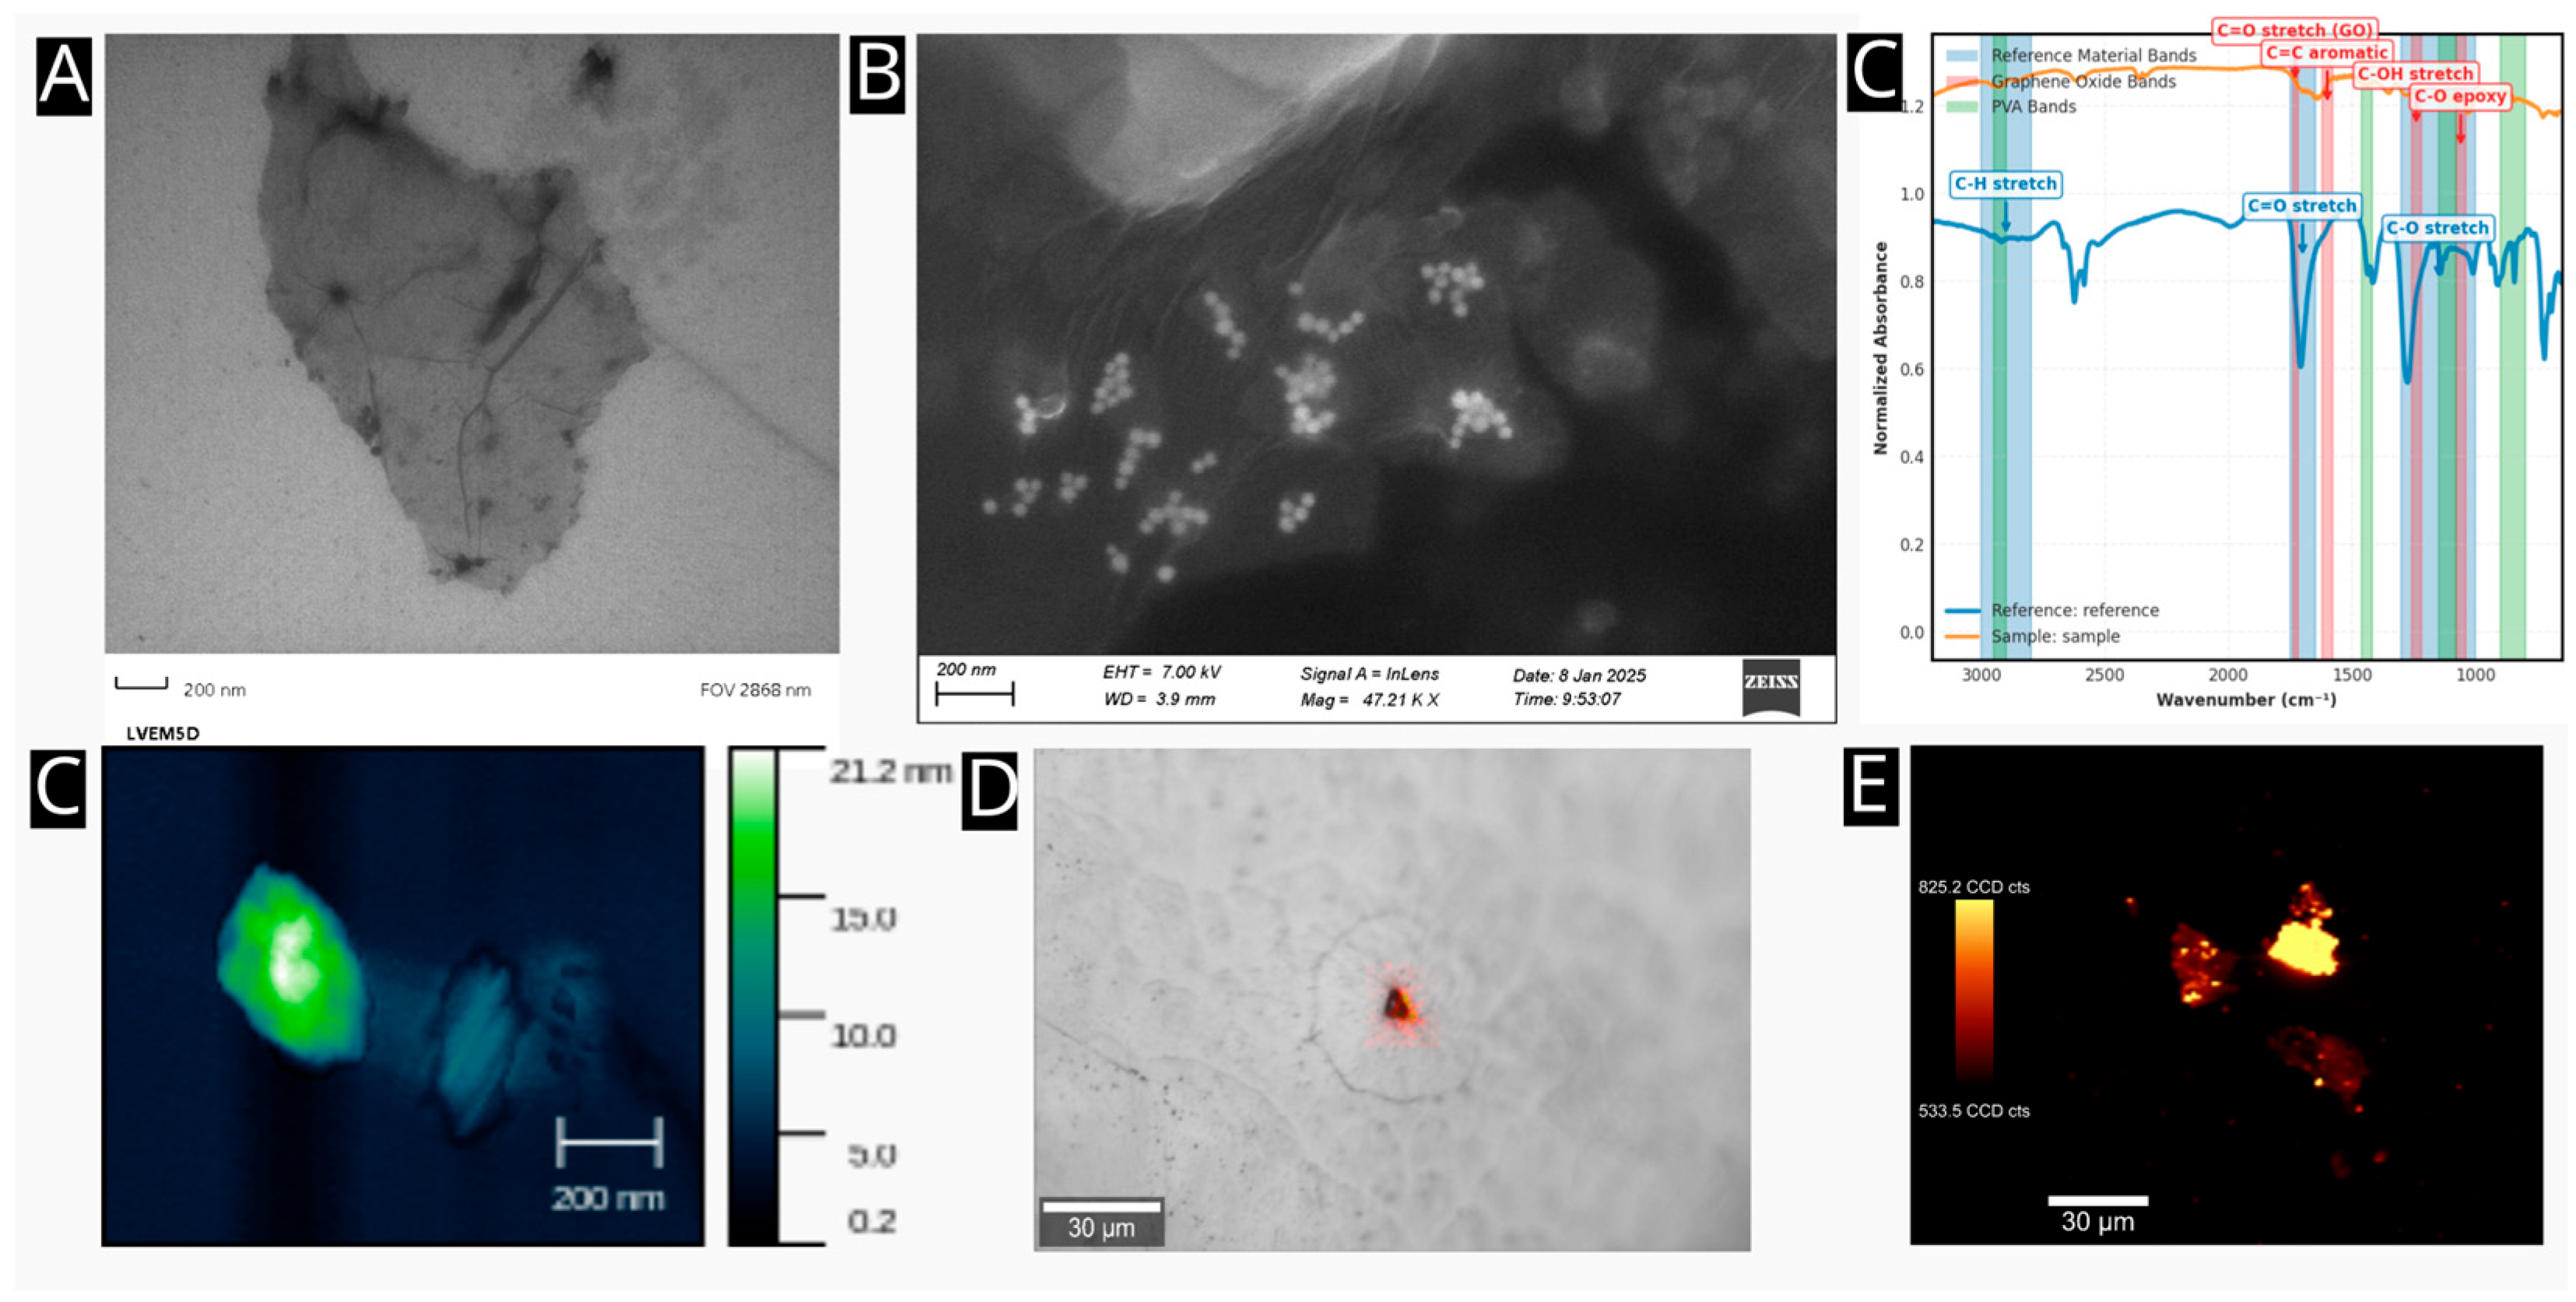
Figure 3.
A) SERS spectra of the R6G on a surface of the nanoplatform, B) Distribution of SERS signal R6G via a surface of the GO@Carb@Au nanoplatform.
Figure 3.
A) SERS spectra of the R6G on a surface of the nanoplatform, B) Distribution of SERS signal R6G via a surface of the GO@Carb@Au nanoplatform.
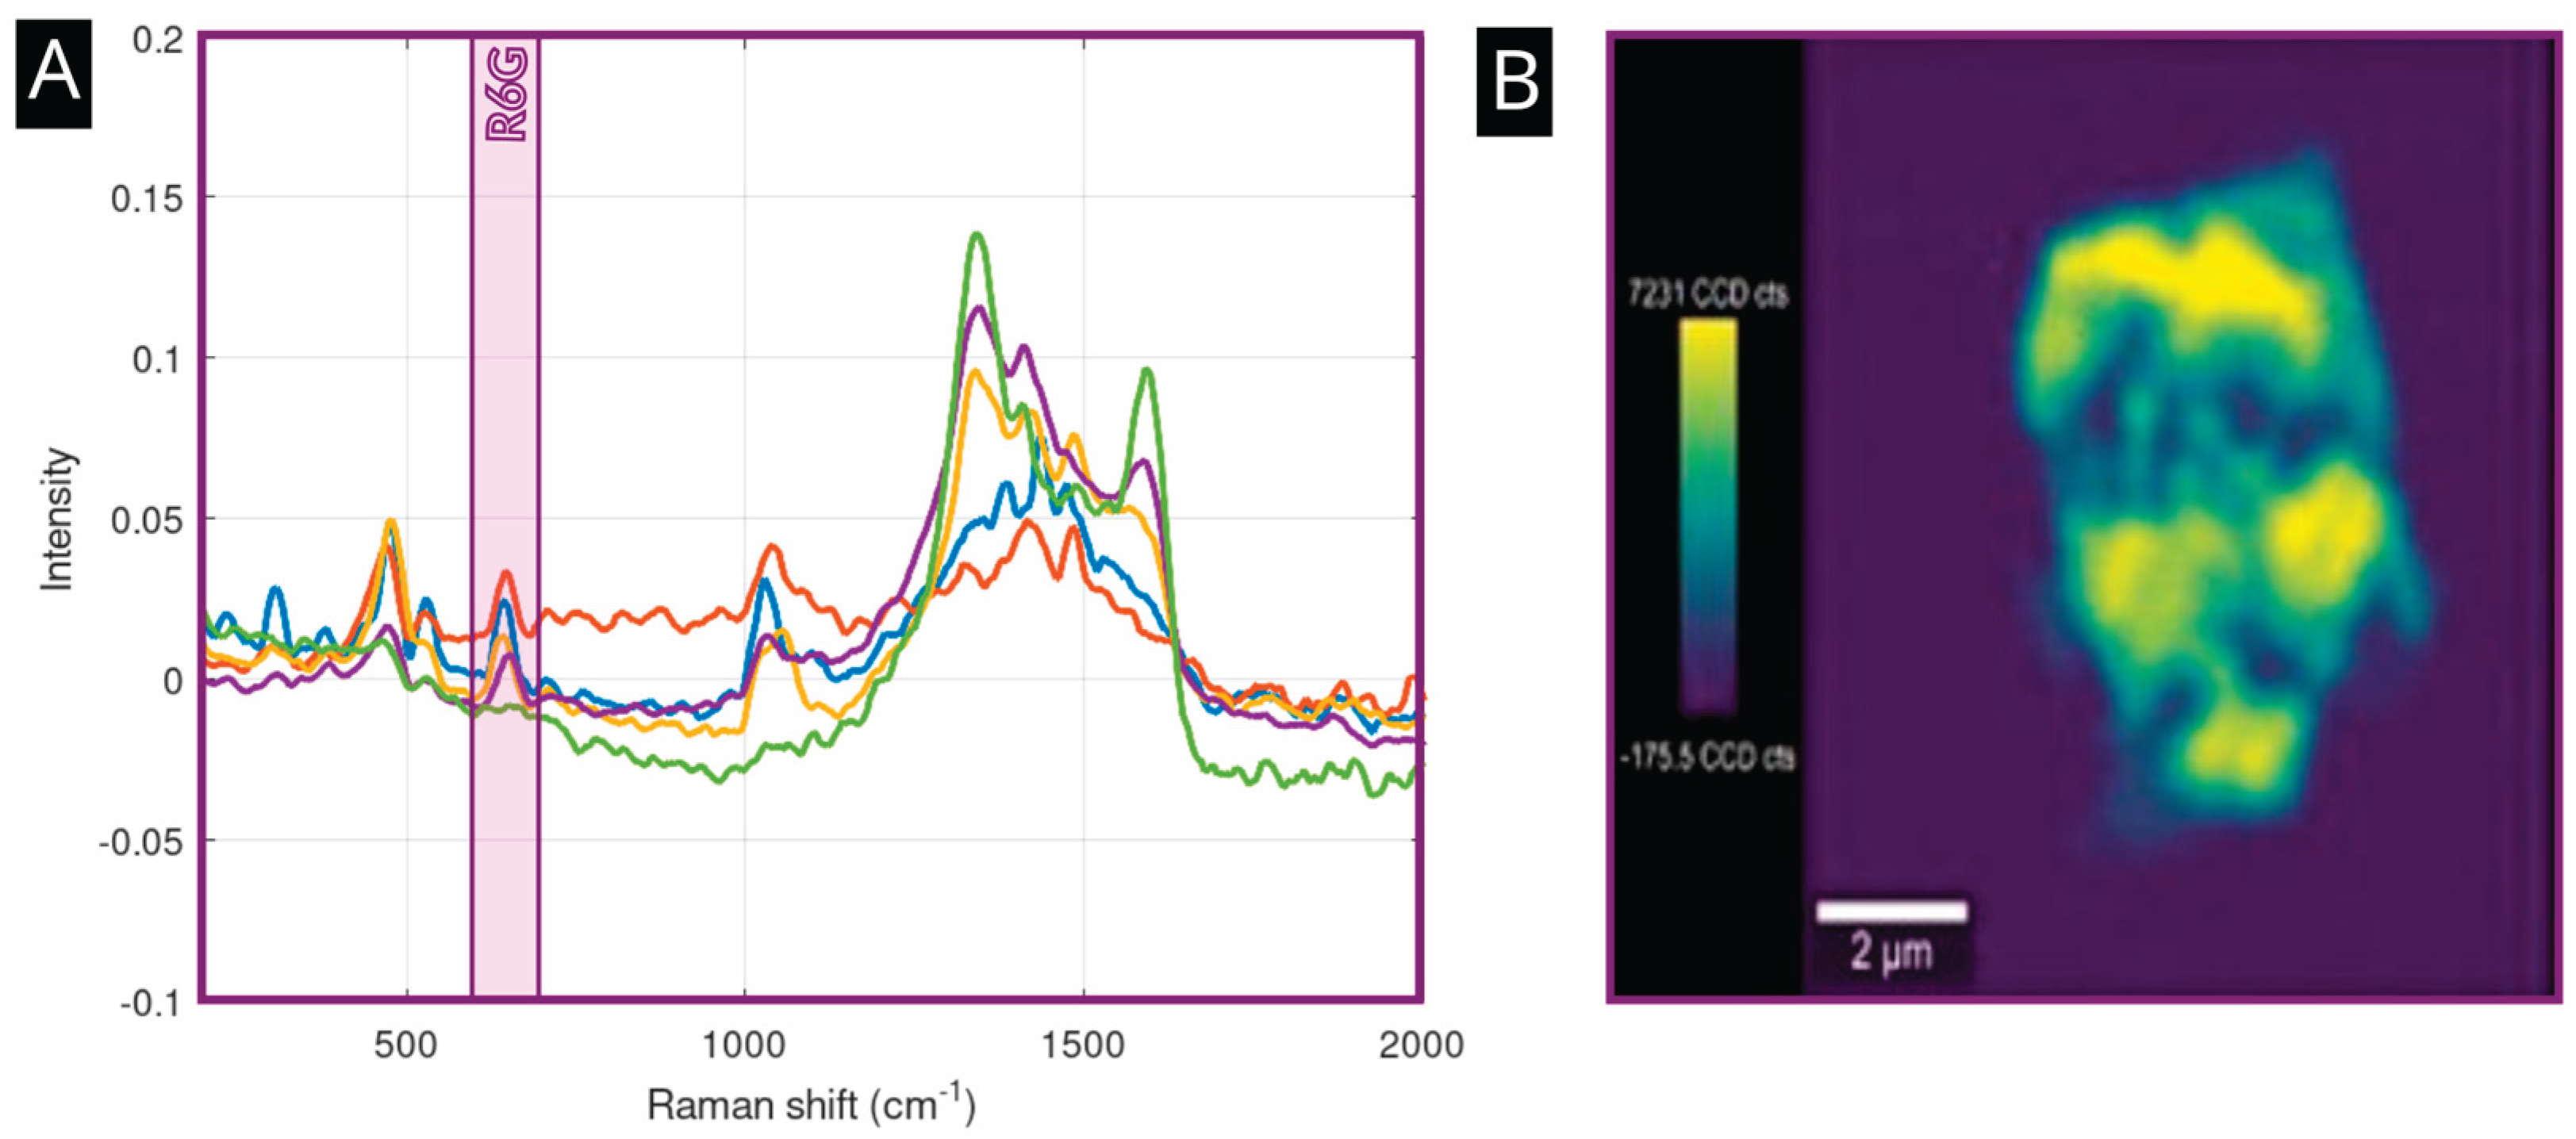
Figure 4.
A) Raman spectrum of the carborane, B) SERS spectra of the GO@Carb@Au nanoplatform from the center (labeled as Spot 1) and from the edge of the flake (labeled as Spot 2), C) SERS spectra of carborane (red), bare Go@Au nanoplatform, and GO@Carb@Au nanoplatform (violet), D) SERS image of the carborane distribution across multiple flakes.
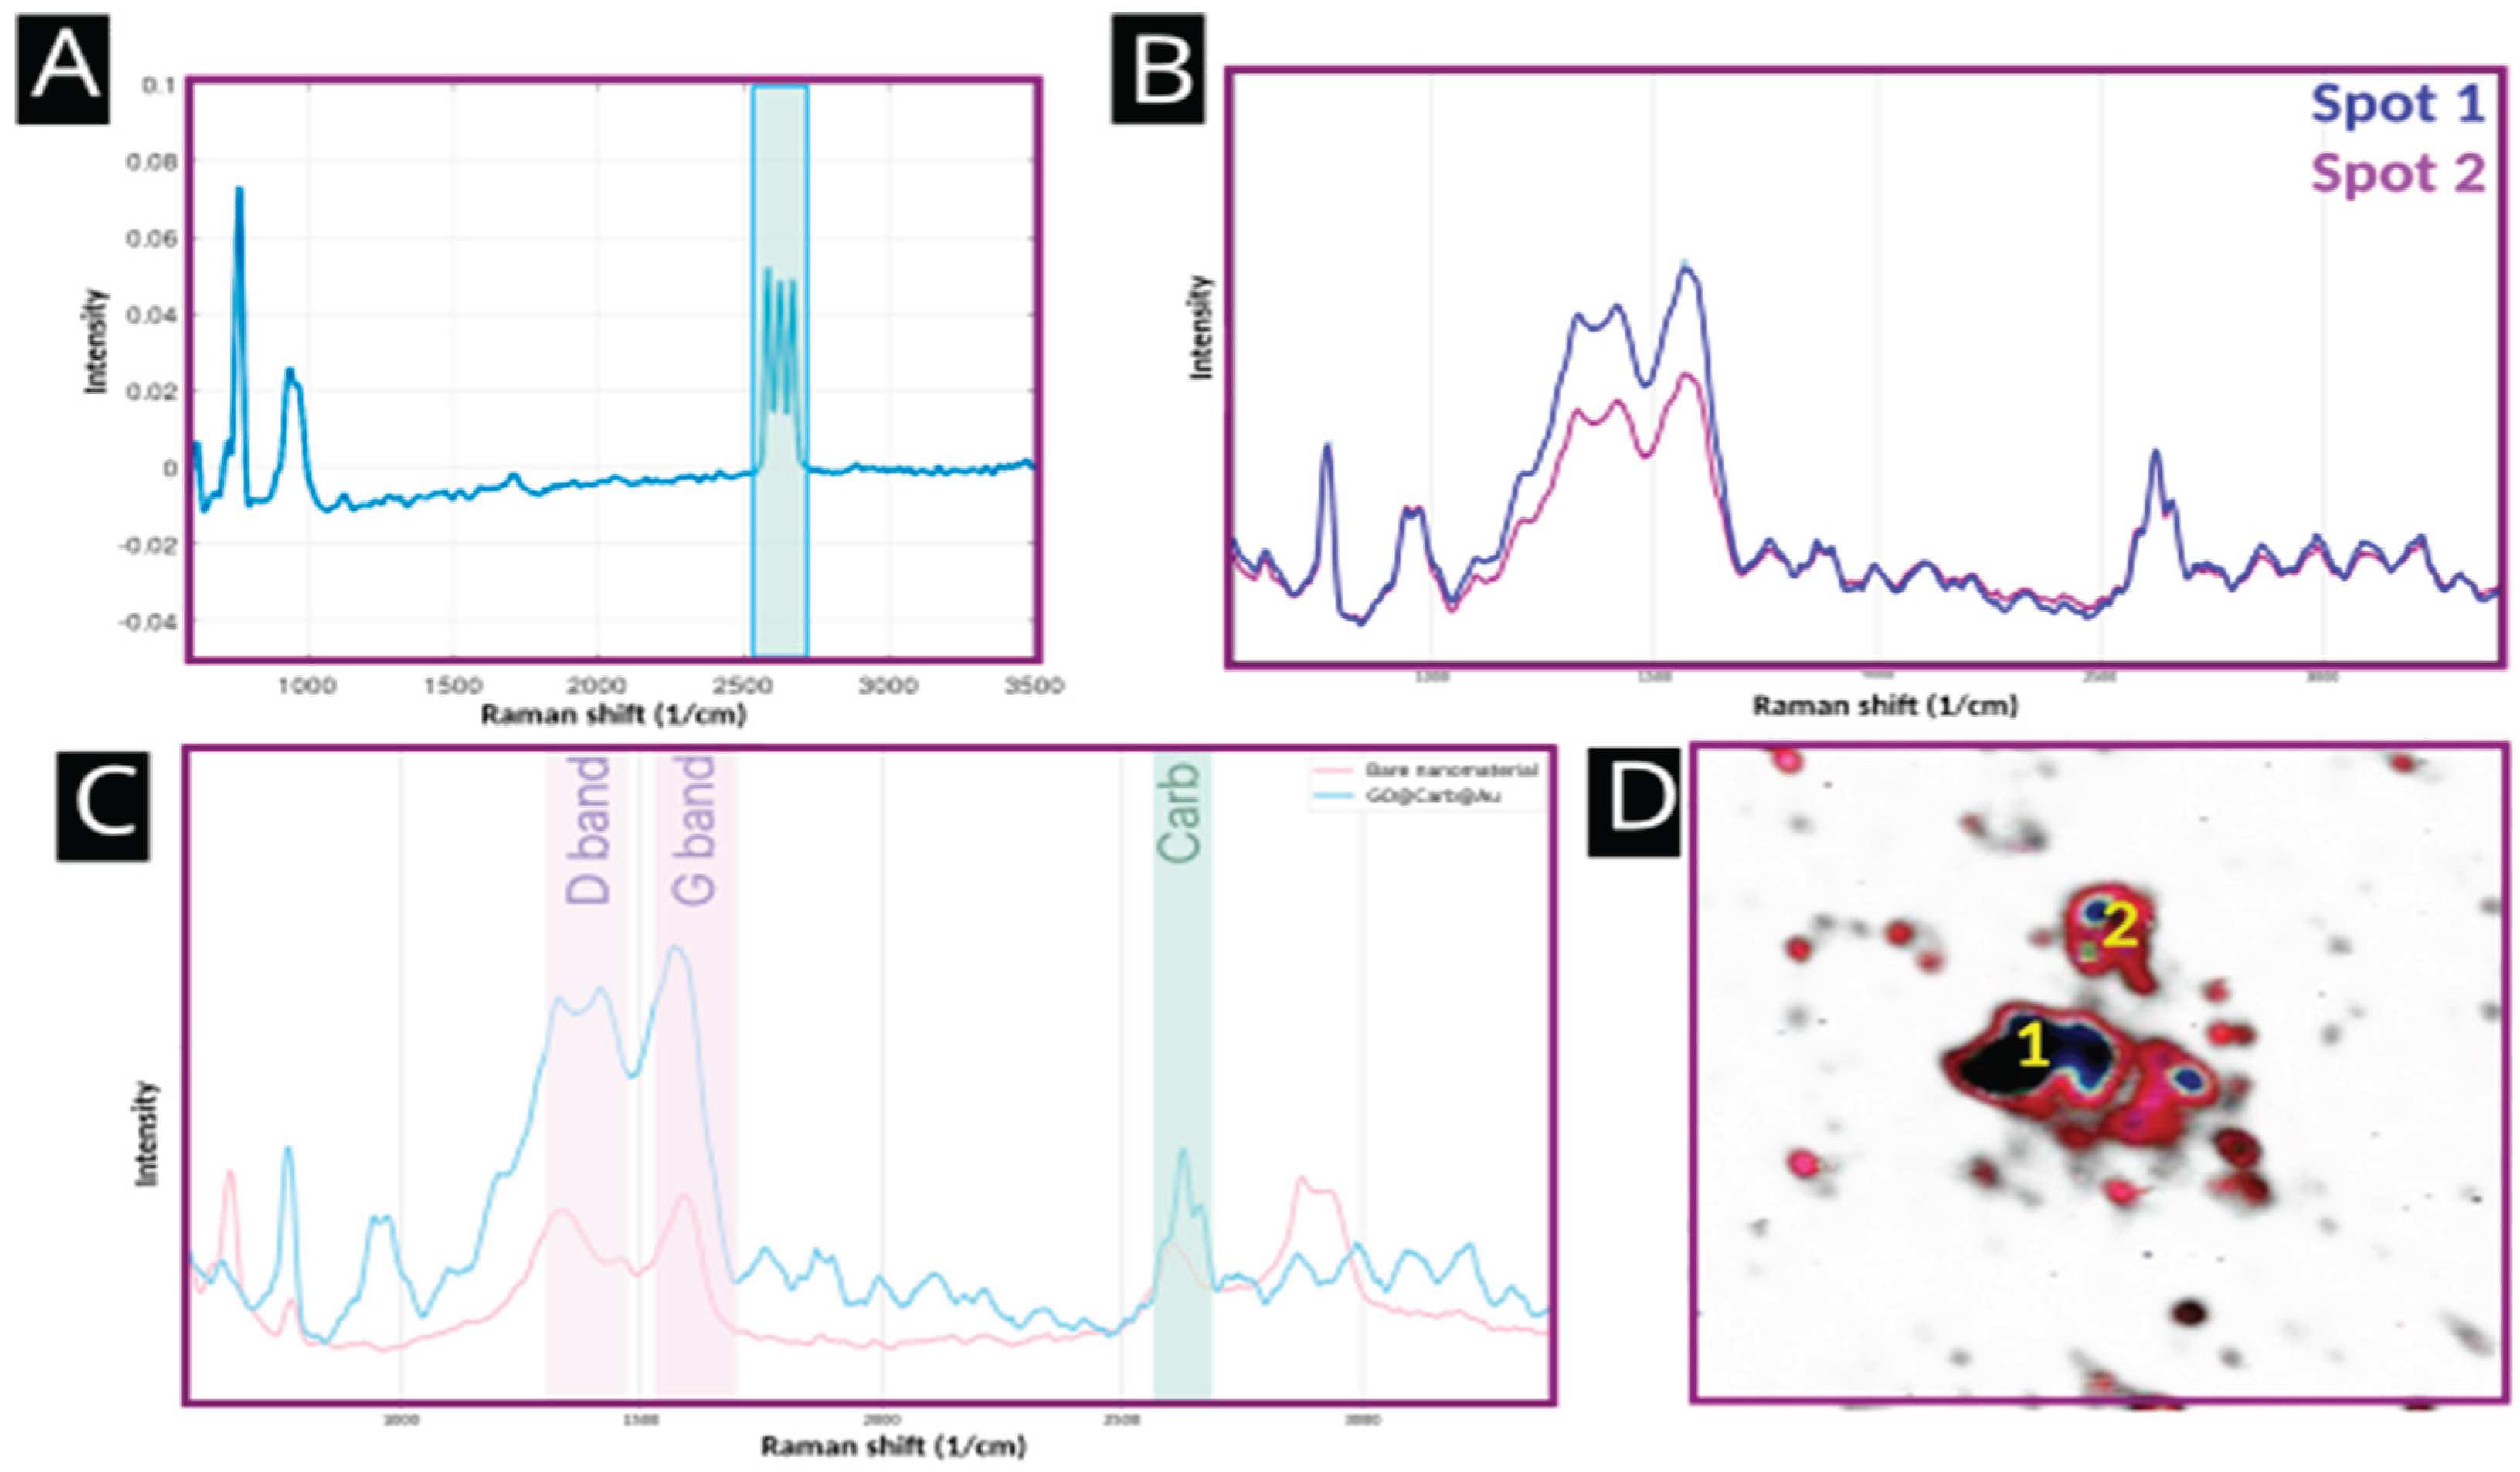
Figure 5.
Evaluation of the cytotoxicity of the nanoplatform studied on HaCaT and T98 cells after 24 and 78 hours of incubation.
Figure 5.
Evaluation of the cytotoxicity of the nanoplatform studied on HaCaT and T98 cells after 24 and 78 hours of incubation.
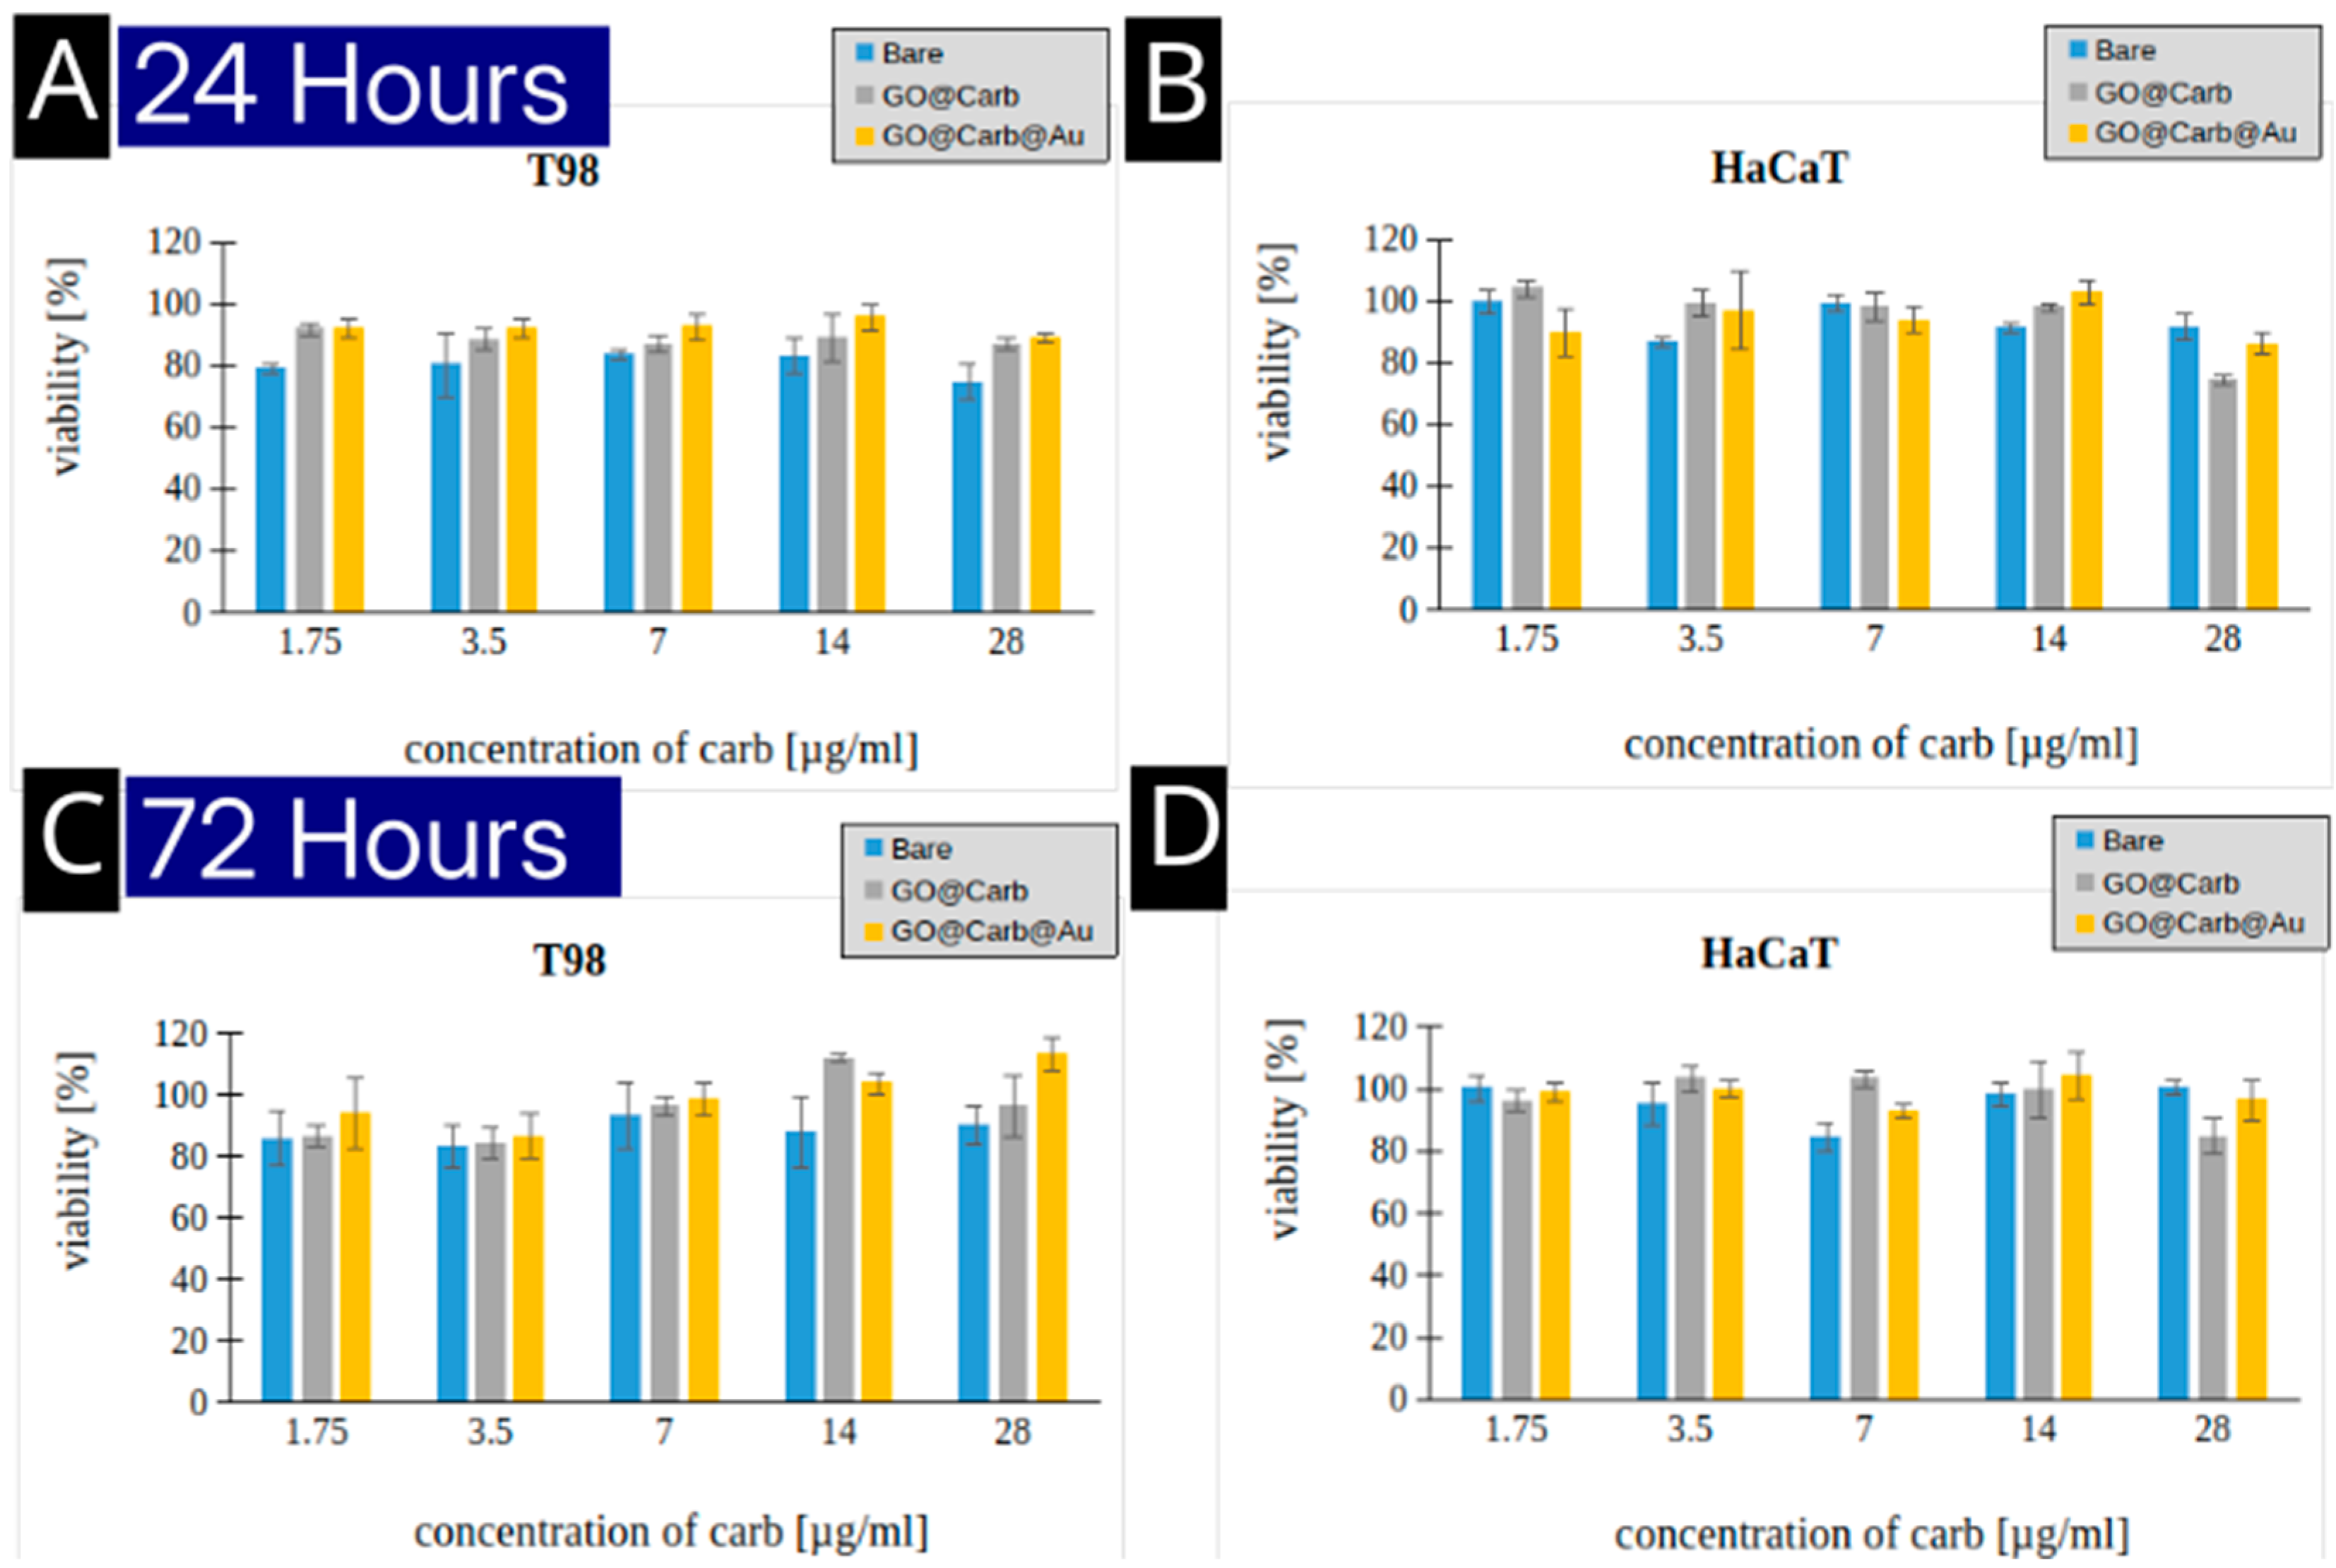
Figure 6.
SERS maps of a distribution of GO@Carb@Au nanoplatforms in T98 (A) and HaCaT (D) cells, overlap of optical and SERS image showing distribution of Carb in the T98 (B) and HaCaT (E) cells, average SERS spectra obtained from the spots 1 and 2 for HaCaT cells (C).
Figure 6.
SERS maps of a distribution of GO@Carb@Au nanoplatforms in T98 (A) and HaCaT (D) cells, overlap of optical and SERS image showing distribution of Carb in the T98 (B) and HaCaT (E) cells, average SERS spectra obtained from the spots 1 and 2 for HaCaT cells (C).
Disclaimer/Publisher’s Note: The statements, opinions and data contained in all publications are solely those of the individual author(s) and contributor(s) and not of MDPI and/or the editor(s). MDPI and/or the editor(s) disclaim responsibility for any injury to people or property resulting from any ideas, methods, instructions or products referred to in the content. |
© 2026 by the authors. Licensee MDPI, Basel, Switzerland. This article is an open access article distributed under the terms and conditions of the Creative Commons Attribution (CC BY) license (http://creativecommons.org/licenses/by/4.0/).
Copyright: This open access article is published under a Creative Commons CC BY 4.0 license, which permit the free download, distribution, and reuse, provided that the author and preprint are cited in any reuse.


