Submitted:
04 January 2026
Posted:
06 January 2026
You are already at the latest version
Abstract
The catchments that contain ecologically critical wetlands supplying the Mohale and Polihali dams under the Lesotho Highlands Water Project (LHWP) are increasingly threatened by expanding agriculture, mining activities, and uncontrolled livestock grazing. Hence, the present study was conducted to assess heavy metal contamination and wetland health across the three higher-altitude sub-catchments in Lesotho: Senqunyane, Khubelu, and Sani. A total of 24 water samples were collected from six wetlands in March 2025 to determine concentrations of copper, iron, manganese, lead, and zinc in accordance with APHA standards. Pollution Load Index (PLI) and Heavy Metal Pollution Index (HPI) were calculated to evaluate water quality. All sites exceeded the HPI safety threshold of 100, with Sani Top showing the highest PLI (5.54), indicating severe contamination primarily driven by manganese and lead. Lead emerged as the dominant pollutant due to its low permissible limits, exacerbating HPI scores across wetlands. Heavy metal concentrations generally declined with increasing altitude, with lead and copper displaying the steepest decreases, while manganese peaked at mid-altitudes (2750 m), potentially linked to local geochemical processes and organic matter decomposition. Principal Component Analysis (PCA) explained 40.6% of total data variance, revealing tight clustering at higher altitudes (3000 m), reflecting uniform, geogenically controlled water quality, whereas lower elevations displayed more variable and anthropogenically influenced patterns. Despite high-altitude sites appearing chemically stable, they carry higher dissolved ions, suggesting treatment needs for water hardness. In contrast, low-to-mid elevation wetlands showed more variable and hazardous metal loads, necessitating targeted management strategies including buffer zones, liming, and pollution source tracing. Findings highlight land use and hydrology in wetland water quality. Continuous monitoring of Lesotho’s alpine wetlands is vital to address heavy metal pollution, guide evidence-based policy, and support prioritized monitoring, mitigation, and restoration for sustainable downstream water management.
Keywords:
toxic metals
; high altitude wetlands
; Pollution Load Index (PLI)
; Heavy Metal Pollutio Index (HPI)
; altitude gradient
1.0. Introduction
Heavy metal pollution in alpine wetlands poses serious threats to ecosystem integrity, biodiversity, and downstream water quality [1,2]. These fragile high-elevation environments act as natural filters and are rich in biodiversity, regulating nutrient cycling, sediment retention, and water purification [3,4]. Contamination disrupts aquatic and terrestrial systems, impacting human communities dependent on water resources and ecosystem services [5,6]. Due to limited buffering capacity and sensitivity to climatic and chemical perturbations, alpine wetlands are particularly vulnerable to long-lasting degradation when exposed to heavy metal pollution [7].
Research across global mountain systems, such as Zoige Plateau, Hengduan Mountains, in Asia, and northern Pakistan, revealed clear altitudinal patterns, with higher altitudes influenced by geological weathering, while mid- and low-elevations show anthropogenic inputs from agriculture, transport, and industry [8,9]. Even remote alpine zones now exhibit anthropogenic contamination, contradicting assumptions of pristine high-altitude systems [10]. [11] quantified soil contamination gradients and found mid-altitude peaks in Cd and Pb. [12] linked low-altitude metals to agricultural products such as fertilizers, pesticides, etc., while high-altitude As and Cr reflected geogenic origins [13] revealed elevation effects on both soil and plant uptake in the Zoige Plateau, and [14] identified relative ecological risks across Hengduan wetlands. In Pakistan, valley-floor roads intensified Cd and Pb inputs below 3,200 m [15], while Swat Valley lakes showed low contamination except Cu and Cd [16]. Overall, metal concentrations decline with altitude, but mid-elevation hotspots present ecological risks [17].
In African mountain systems, limited research has examined heavy metal contamination patterns across elevational gradients in wetlands. [18] reported heavy metal contamination in highland wetlands on Mount Cameroon (≈2,000 m), with metals ranked Mn > Zn > Cr > Ni > Cu > Co > Pb > Fe > Al, reflecting both anthropogenic and geogenic sources. In Ethiopia, Lake Tana, a high-elevation lake system, showed Cr and Fe levels above aquatic guidelines [19], while the Awetu watershed had extreme Pb (2005.94 mg/kg), As (623.32 mg/kg), and Cr (375.00 mg/kg) in sediments [20]. The Bale Mountains, an afroalpine wetland of Ethiopia, remain unassessed for heavy metal contamination despite their critical hydrological importance [21]. Kenyan studies reveal seasonal variations in contamination, with River Thiba sediments showing Cr (39.9–42.6 mg/kg), Ni (85.1–396.5 mg/kg), and Mn (1678.4–1766.4 mg/kg) [22], while Lake Elementaita waters contained 0.04–3.14 mg/L of metals, often above WHO limits [23]. However, these Studies lack systematic elevation-based analysis, resulting in a poor understanding of altitude’s role in heavy metal risks and hindering effective management.
Pb, Cd, As, and Cr enter wetlands through natural and anthropogenic pathways, including mining, agriculture, atmospheric deposition, and geological erosion [24,25]. Studies across India and other mountainous regions have shown that wetlands in agricultural and industrial catchments accumulate heavy metals beyond permissible limits [28,33]. In alpine regions, cold climates, snowmelt hydrology, and low buffering capacity increase metal mobility [26,27], while topographic variation further affects retention, though poorly quantified [28,29]. Despite recognition of risks, few studies examine how altitude shapes contamination in alpine wetlands [10,30]. Analytical approaches such as Inductively Coupled Plasma–Optical Emission Spectrometry (ICP-OES), Positive Matrix Factorization (PMF), and indices like Heavy Metal Pollution Index (HPI), Heavy Metal Evaluation Index (HEI), and Potential Ecological Risk Index (RI) effectively trace sources and assess pollution [24,26,31,32], but remain underused in African alpine wetlands.
In Lesotho, alpine wetlands provide crucial hydrological services, including streamflow regulation, groundwater recharge, and water purification [33], yet face growing pressures from agriculture, overgrazing, and transboundary atmospheric deposition [34]. Climate change further intensifies risks by altering rainfall, temperature, hydrology, and redox conditions, affecting metal solubility and transport [7,27]. Wetlands can sequester metals with removal efficiencies ranging from 12.35% to 91.01%, depending on species and conditions [3], suggesting potential for natural attenuation. However, comprehensive assessments across altitudinal gradients are urgently needed to guide sustainable management within Integrated Catchment Management (ICM) [35].
Therefore, this study is aimed at evaluating heavy metal concentration in Lesotho’s alpine wetlands across elevations through field sampling, pollution indices (HPI, PLI), and multivariate source apportionment. This would address a critical research gap by generating altitude-stratified data and a methodological framework for monitoring and managing heavy metal risks.
2.0. Materials and Methods
2.1. Study Area
The present study was conducted in Lesotho at elevations ranging from 2,500 to 3,089 meters above sea level (masl), within the mountain agro-ecological zones (AEZs) of Mokhotlong and Ha-Mohale, focusing on three sub-catchments, viz. Khubelu, Senqunyane, and Sani under the Upper Senqu main catchment. Two alpine wetlands were selected from each sub-catchment, resulting in six study sites: Lets’eng-la-Likhama and Koting-sa-ha Ramosetsana in the Khubelu catchment, Khorong and Tenesolo in the Senqunyane catchment, and Khamoqana and Khalong-la-Lichelete in the Sani catchment. The study area, covering sub-catchments of the Senqu River across Mokhotlong and Thaba-Tseka districts, is illustrated in Figure 1, which presents the geographical map of Lesotho with its ten districts within the African continent and highlights the alpine wetland study sites. Figure 2 shows the Global Positioning System (GPS) map of the Upper Senqu main catchment with its three sub-catchments (Khubelu, Senqunyane, and Sani) and the associated wetlands, while Table 1 provides the coordinates and altitudinal characteristics of the selected wetland ecosystems.
2.1.1. Senqunyane Sub-Catchment
The Senqunyane sub-catchment is located in the central mountain region of Lesotho and forms part of the upper Senqu River system (Figure 1). It is characterized by rugged highland topography and alpine wetland ecosystems. Two wetlands were selected within this sub-catchment for study: Tenesulu and Khorong. These wetlands are vital hydrological units as they serve as major tributaries to the Mohale Dam, one of the key reservoirs under the Lesotho Highlands Water Project (LHWP). The ecological integrity of these wetlands directly influences water yield, quality, and seasonal flow regulation into the dam.
2.1.2. Khubelu Sub-Catchment
The Khubelu sub-catchment lies in the northeastern part of Lesotho and is integral to the ongoing Polihali Dam development, which forms part of Phase II of the LHWP (Figure 1). Two wetlands were selected in this sub-catchment: Koting-sa-ha Raramosetsana and Letšeng-La-Likhama. These wetlands act as feeder systems to the Polihali Dam. The Khubelu area presents a dynamic landscape where multiple land uses intersect, including subsistence and commercial agriculture as well as mining activities, particularly the operations of Letseng Diamond Mine. These anthropogenic pressures pose potential risks to wetland functionality and downstream water quality, making it a critical zone for ecological monitoring.
2.1.3. Sani Pass Sub-Catchment
The Sani sub-catchment is situated on the eastern escarpment of the Maloti-Drakensburg mountains and forms the headwaters of the Linakeng River. It is characterized by high-altitude alpine conditions and pastoral landscapes (Figure 1). Two wetland ecosystems, Khamoqana and Sani Top, were selected for this study. The Sani Pass sub-catchment hosts the highest (2874 masl) public bar facility (The Sani Top Lodge) on the eastern border of Lesotho and KwaZulu-Natal province of South Africa. Over time, this mountain environment has been encroached upon by anthropogenic pressures and stressors of settlements along the summit landscape of the Sani Pass corridor. Khamoqana, is the first of two wetlands, and is situated at 2839-2880 masl on the Koti-se-Phola escarpment of the Drakensburg range of the Sani Pass catchment. The second is the Sani Top wetland (2891-2995 masl), situated approximately 100 m west of the Sani Top Lodge. These wetlands discharge directly into the Linakeng River. Livestock grazing, both small stock (sheep & goats) and large stock (cattle and equines), is the dominant land use in this sub-catchment and along with tourism on the summit of the Sani Pass. These land uses directly impact wetland vegetation, soil compaction, and nutrient loading into the upper tributaries of the Senqu River system. Despite limited urbanizing and industrial activity, the ecological health of these wetlands is vulnerable to overgrazing, climate change and climate variability impacts.
2.1.4. Overall Significance
The selection of these sub-catchments was informed by their hydrological significance, ecological value, and exposure to different anthropogenic pressures. Collectively, the wetlands across the three sub-catchments play a pivotal role in water provisioning, sediment trapping, and biodiversity support, while also serving as critical tributaries to national water infrastructure projects, namely, Mohale and Polihali Dams. This spatial and functional diversity provided a valuable context for assessing wetland health, ecosystem services, and the impact of land use activities in highland Lesotho.
2.2. Data Sampling and Analysis
A total of 24 water samples were collected from the three sub-catchments, with 4 samples per wetland. In March 2025, which is the late rainy season, the two wetlands from each sub-catchment were randomly sampled using a grab sampling technique, where water was taken directly from specific points in the wetland to represent the conditions at the time of sampling. To ensure representativeness, samples were collected from multiple points within each wetland, viz., upstream, midstream, and downstream zones, avoiding areas with stagnant water or surface debris to minimize contamination, and the water was sampled at the surface for heavy metal loads. One thousand millilitre capacity Sterile high-density polyethene (HDPE) bottles with a plastic cap were used for collecting samples for heavy metals analysis in the laboratory. First, every bottle was washed with 50% HNO3 acid and twice with pure distilled water. Furthermore, the bottles were pre-rinsed with the sample water. Samples were collected free from bottom sediment and away from stream banks by wading into the centre main current. All the water samples were filtered using the filter paper before being analyzed and tested for the following heavy metals: copper (Cu), iron (Fe), manganese (Mn), lead (Pb), and zinc (Zn) using an Atomic Absorption Spectrometer (AAS) in the Soil Science Department Laboratory National University of Lesotho following the standard procedure prescribed by the American Public Health Association [36]. The results were expressed in milligrams per litre (mg/L). R Studio was used for multivariate analysis techniques (e.g., PCA, RDA, Spearman correlation) to link metal patterns with altitude. The concentration of heavy metals was compared with the World Health Organization (WHO) drinking water standard (Table 2).
2.2.1. Pollution Load Index (PLI)
The Pollution Load Index (PLI) is an essential metric for evaluating heavy metal pollution in wetlands [38,39,40]. It is calculated using the formula (1) and the data in the Supplementary Table S1. The units for both Ci and Bi are typically mg/L for water, resulting in a dimensionless index. The selection of Bi is crucial as it reflects the uncontaminated metal concentration, which can be referenced from global average shale values, local geological baselines, or various international guidelines [41,42]. In this study, the Bi value is taken from [37] Guidelines. The PLI serves as a powerful tool for comparative pollution assessment across diverse environmental matrices [43]. To assess the pollution load of the wetlands under study due to the presence of heavy metals, the Pollution Load Index (PLI) was computed. The PLI deduces the water quality on a scale of 0–5 as shown in Table 3, where 0 indicates no presence of any heavy metals, and 100 represents the most hazardous conditions.
PLI > 1 indicates pollution.
where:
- CFi = Contamination Factor of the i-th metal
- Ci = Measured concentration of the metal
- Bi = Background or reference value of the metal
- n = Number of metals assessed
- П = Product of the contamination factor
2.2.2. Heavy Metal Pollution Index (HPI)
HPI was computed to assess the degree of pollution of the wetlands due to the presence of heavy metals on a common scale. The HPI is a recognized composite index used to assess the overall metal burden in water, with values above 100 considered unsafe for human and ecological health [44,45,46]. The HPI deduces the water quality on a scale of 0–100 (Table 4), where 0 indicates no presence of any heavy metals, and 100 represents the most hazardous conditions. HPI was calculated using the formula (2) and the data in the Supplementary Table S1.
where:
- Mi = Measured concentration
- Ii = Ideal value (often 0 for heavy metals) concentration
- Si = Standard or persimible value (e.g. WHO limits)
3.0. Results and Discussion
3.1. Characteristics of Heavy Metal Concentrations
In Table 5, Pb averaged 0.11 mg/L (SD = 0.06; range 0–0.26 mg/L), substantially above the WHO guideline of 0.01 mg/L in drinking water [37]. Mn exhibited extreme skewness (mean = 49.46 mg/L; max = 1,162 mg/L), typical of geogenic enrichment where rock weathering releases Mn into headwater aquifers at high elevations [47]. Turbidity (max 954 NTU) and electrical conductivity (EC; max 883 μS/cm) showed wide variability, reflecting mixed influences of mineral dissolution, organic particulates, and possible land-use inputs [48].
The boxplot illustrates how concentrations of lead (Pb), manganese (Mn), iron (Fe), zinc (Zn), and copper (Cu) vary across three altitude zones: 2500 m, 2750 m, and 3000 m (Figure 3). The median concentration of Pb decreases with altitude: 2500 m: ~0.15 mg/L, 2750 m: ~0.12 mg/L and 3000 m: ~0.08 mg/L. Variability measured by the interquartile range (IQR) narrows at higher altitudes, and the highest-altitude zone shows fewer outliers, suggesting more uniform and lower Pb levels uphill (peaks at mid-altitude).
This may be attributed to the proximity of wetlands to anthropogenic sources such as roads, agriculture, mining, or settlements, which might increase Pb runoff [49] at mid altitudes. As elevation increases, human activity lessens, consequently reducing Pb inputs. Additionally, higher rainfall and leaching at lower elevations can mobilize Pb into water bodies. This result tallies with [50], who found decreasing Pb with altitude (3,500–4,700 m) in Tibetan wetland sediments. On the contrary, [29] found that Pb exceeded local background at 3,600–3,800 m elevations.
Mn peaks at mid-altitude (2750 m) with a median of ~0.18 mg/L, higher than at 2500 m (~0.14 mg/L) and 3000 m (~0.13 mg/L). The widest Interquartile Range (IQR) occurs at 2750 m, indicating greater sampling variability at these altitudes. A few high-end outliers at 2750 m hint at localized Mn sources or geochemical pockets. Mn availability is highly sensitive to redox conditions and pH. Mid-altitude zones may experience greater wetland activity, organic matter decomposition, or seasonal waterlogging, which creates reducing conditions that solubilize Mn. The high IQR and outliers suggest localized geochemical pockets or inputs from soil/weathering. Manganese has been shown to fluctuate in wetland zones with mid-range altitudes, where hydrological variability is highest [30].
Fe showed a slightly decreasing trend with altitude, with 2500 m (~0.20 mg/L), 2750 m (~0.18 mg/L), and 3000 m (~0.16 mg/L) median. However, variation remains relatively consistent across all zones, but 3000 m exhibits occurrence of low-end outliers, possibly due to sampling or matrix effects. Fe, like Mn, is influenced by redox conditions that govern the speciation and mobility of iron and manganese, with anoxic environments enhancing their dissolution and oxic conditions promoting precipitation, thereby controlling their distribution and biogeochemical cycling in wetlands [51]. Lower altitudes often have more stagnant or anoxic environments, enhancing Fe solubility, whereas at higher altitudes, more oxygenated and acidic waters can lead to Fe precipitation as insoluble oxides, reducing dissolved Fe [52]. Consistent IQR implies uniform input sources or stable geochemical conditions across zones.
Zn median(s) increased from 2500 m (~0.06 mg/L) to 2750 m (~0.13 mg/L), then decreased to 3000 m (~0.11 mg/L), indicating inconsistency in altitude. The widest spread appeared at 3000 m, suggesting diverse Zn inputs upstream. Absence of outliers suggests Zn distribution is generally stable. Zn is less mobile than Pb or Mn and often adsorbs onto particulates or organic matter. The broader IQR at 3000 m may reflect mixed sources, including agriculture or mining, while reduced concentrations at 2500 m align with lower anthropogenic pressure. Studies have found Zn to accumulate in valley zones due to runoff and erosion [53].
Median Cu concentrations were similar at 2500 m and 3000 m (~0.007 mg/L), then increased at 2750 m (~0.013 mg/L), indicating their stability at 2500 m and 3000 m. Variability tapering at higher elevations and a few outliers indicate reduced Cu contamination upstream. Cu followed a trend similar to Pb and Zn. Its concentration is generally linked to human activity, including fertilizer use, pesticides, or plumbing corrosion. Higher altitude zones are less disturbed, so Cu levels drop correspondingly. Cu is also strongly affected by pH; at higher altitudes, where pH may be lower (more acidic), Cu tends to precipitate or bind with organic matter, reducing bioavailability.
3.2. Heavy Metal Pollution Assessment (PLI and HPI)
The high Pollution Load Index (PLI) value of 5.54 recorded at Sani Top (Table 6) signals severe heavy-metal contamination, far surpassing the critical threshold of 1.0 that delineates polluted from unpolluted conditions. This elevated PLI is primarily driven by extreme concentrations of Mn and Pb, both of which are known for their ecological persistence and toxicity.
Pb is notorious for its low permissible limits and high bioaccumulation potential, while Mn, though essential in trace amounts, can become toxic at elevated levels, especially in aquatic systems with low oxygen availability.
These findings align closely with the patterns reported by [54], who observed that lower-elevation wetlands (3000–3300 m) consistently exhibited the highest PLI values (>1.2), largely attributed to Cu and Zn from agricultural activities. Lower-elevation zones are more vulnerable to anthropogenic pressures such as fertilizer runoff, livestock waste, and vehicular emissions. These accumulate in wetlands, elevating metal concentrations and inflating PLI scores. In contrast, [54,55] noted that mid- and high-elevation wetlands generally maintained PLI values below 1.0, reflecting relatively pristine conditions with minimal anthropogenic influence. This gradient is mirrored in the current study, where Sani Pass Catchment wetlands (Khamoqana and Sani Top), at middle elevations (2839-2995 masl), compared to the Khubelu catchment wetlands (3040- 3800 masl), show the most severe contamination, while higher-altitude Khubelu wetlands exhibit comparatively lower PLI values. Such elevation-linked pollution patterns underscore the importance of topographic context in wetland vulnerability assessments [56,57,58,59].
Figure 4 shows the proportional contribution of Pb, Mn, Fe, Zn, and Cu to PLI at each sampling site. Sani Top is dominated by Pb (45%) and Mn (30%), with minor contributions from Fe, Zn, and Cu. Pb (40%) and Mn (30%) are the main drivers at Tenesolo. Pb and Mn are equally dominant (35% each) at Khamoqana. Khorong, L. Likhama and K. Haramosetsana reflect more balanced contributions from Pb, Mn, Fe, and Zn, with smaller Cu input. This makes it clear that Pb and Mn are the principal contributors to pollution loads, particularly at Sani Top, Tenesolo, and Khamoqana, while other sites show a more mixed contribution profile.
In this study, all sites far exceed the HPI threshold of 100 (Table 7), indicating severe metal pollution.
Lead overwhelmingly drives the high scores due to its very low permissible limit (0.01 mg/L) [60]. Even minor exceedances in Pb significantly amplify the HPI due to its high weighting in the index formula, posing substantial neurotoxic and developmental risks, especially for children. Wetlands such as Khamoqana, Sani Top and Tenesolo, show the worst overall metal burdens, indicating these areas are hotspots of contamination. Notably, Manganese (Mn) levels at Sani Top wetland are critically elevated, warranting an investigation into localized geochemical processes (e.g., Mn-rich bedrock, reducing conditions in wetlands) or anthropogenic inputs such as wastewater discharge or agricultural runoff [2,30]. Multiple anthropogenic sources, including agrochemical application, vehicular emissions, and waste dumping, contribute to elevated metal inputs in catchment waters, driving HPI values above safe thresholds [44]. Natural geochemical processes, such as bedrock weathering in sulfide-rich geology, acidic pH in alpine wetland soils and seasonal snowmelt, enhance metal mobilization and transport into water bodies [61]. Site-specific hydrological and sedimentary characteristics at Khamoqana, Tenesolo, and Sani Top, such as low stream velocities, high sediment retention, and organic-rich soils, promote metal adsorption and accumulation, resulting in the worst overall burdens observed [44]. Concurrently, the unique hydrology and sediment retention characteristics at these sites, such as slower flow regimes and organic-rich soils, favor metal adsorption and prolong exposure times, amplifying the HPI signal [32].
A proportional breakdown of heavy metal contributions to the HPI across the six sampling sites (Figure 5) reveals that Pb overwhelmingly dominates, accounting for 45–70% of HPI at all sites. Mn represents the next largest share, particularly at K. Haramosetsana (25%) and L. Likhama (20%), reflecting geogenic enrichment and redox-sensitive mobilization. Fe, Zn and Cu contribute smaller proportions (5–12%), largely indicating background geochemical inputs with minor anthropogenic influence. The most Pb-dominated sites are Sani Top (70%) and Khamoqana (65%), consistent with their critically high HPI values, while K. Haramosetsana shows a more balanced profile where Mn nearly rivals Pb in influence. This proportional view complements the overall HPI scores by clarifying which metals are the primary drivers of pollution risk at each site.
The PCA biplot (Figure 6) reduces complex, multivariate data into two principal components (PC1 and PC2) that explain 40.6% of the total variance. It reveals altitude-driven patterns in heavy metal contamination (Pb, Zn, Fe, Mn, Cu) across three elevation zones (2500 m, 2750 m, 3000 m). The analysis captures 40.6% of total variance (PC1: 25.6%, PC2: 15%), demonstrating partial but significant altitude-based clustering with the 2750m elevation representing a critical transitional contamination zone. The interpretation of the PCA biplot reveals six major findings of the study.
3.3. PCA, RDA & Correlation Analysis
3.3.1. PCA Analysis
- Altitude-Dependent Heavy Metal Distribution Patterns
The PCA shows distinct but overlapping heavy metal profiles across the three elevation zones, with 2500 m sites clustering in positive PC1 space and 3000 m sites in negative PC1 space. This pattern aligns with established research showing complex elevation-dependent metal distribution. Studies in the Beskidy Mountains found that heavy metals increase in concentration up to 800 m elevation, after which concentrations decrease, except for Pb, which continues to increase with elevation [62]. Similarly, research on the Tibetan Plateau demonstrates that elevated heavy metal concentrations occur in specific topographic regions, with eastern and western areas showing higher concentrations (328.7 μg/g) compared to central regions (145.7 μg/g) [63]. [64] also found that topographic factors, including elevation, significantly influence the spatial distribution of Pb in soils of mountainous regions since elevation affects atmospheric deposition and environmental conditions that control metal deposition and retention. The PCA results indicate that two main gradients dominate water quality variability in the alpine wetlands. PC1 and PC2 together explained ~44.4% of the variance (25.1% + 19.3%), and the first four PCs captured ~72.5% cumulatively, demonstrating that a few underlying processes control most of the variability. In line with multivariate theory, the first component typically represents the largest variation in water chemistry [65]. In our data, PC1 and PC2 were strongly associated with turbidity, TDS (salinity proxies), and pH. For example, [66] found that PC1 of river-water quality was dominated by electrical conductivity and TDS (loadings ~0.90) [67], reflecting a “salt” component. Similarly, [68] report that in reservoir datasets, PC1 correlated positively with turbidity (r=0.81) while PC2 correlated with pH (r=0.70). These patterns are consistent with our observations: high turbidity and dissolved solids drove PC1, whereas pH and dissolved oxygen oriented PC2. Such gradients often lead to clear clustering of samples (e.g. high-sediment vs. low-sediment groups). In summary, the PCA suggests that variations in particulate and ionic content (turbidity, TDS) along with pH are the primary axes structuring water quality in the study area, as seen in other water-quality analyses [67,68].
- a) Heavy Metal Dynamics in the Mid-Elevation Transitional Zone (2750m)
The 2750 m altitude group shows the highest variability in heavy metal profiles, with individuals distributed across the entire PCA space, suggesting this elevation represents a transitional contamination zone. Mid-elevation transitional zones are recognized as critical areas where contamination patterns change significantly. Research in the Chengdu Plain-Longmen Mountain transition zone revealed distinct spatial distribution patterns, with different topographic regions having unique key influencing factors - in transition zones, multiple cropping index and distance from industry were primary influences [69]. This supports the interpretation that 2750 m represents a zone where multiple contamination processes converge.
- b) Anthropogenic vs. Geogenic Source Distinction
PC1 (25.6% variance) likely represents the primary gradient from anthropogenic contamination (positive values, 2500 m sites) to geogenic sources (negative values, 3000 m sites). This interpretation is strongly supported by literature demonstrating that PCA effectively distinguishes between anthropogenic and geogenic metal sources. Studies using Positive Matrix Factorization in alpine ecosystems found that metal concentrations had primarily anthropogenic origins even in remote high-altitude locations [1]. Research in the Tibetan Plateau identified industrial sources (42.3%), natural sources (20.6%), and vehicular emissions (14.2%) as primary contributors, with clear elevation-dependent patterns [63].
- c) PCA as an Effective Tool for Heavy Metal Source Identification
The PCA successfully separates groups and reveals underlying contamination patterns, with two components explaining substantial variance (40.6%). PCA is widely validated for heavy metal source identification. Studies in copper mining areas revealed three factors explaining 38%, 18%, and 14% of variability, respectively, successfully identifying mining activities as primary contamination sources [70]. Research on wetland sediments consistently employs PCA alongside other multivariate techniques, with studies showing that combined approaches enhance source identification accuracy [24].
- d) Metal-Specific Elevation Patterns
The distinct clustering patterns suggest different metals contribute differently to each principal component, reflecting their varying sources and mobility. Individual metals show distinct elevation-dependent behaviours:
- Lead (Pb): Shows unique behaviour by continuing to increase with elevation, contrasting with other metals that peak at mid-elevations [71]
- Iron (Fe): Generally, it shows the highest concentrations among studied metals, with maximum levels of 1024±94.2 mg/kg reported in high-altitude lake sediments [10].
- Copper (Cu): Shows strong associations with anthropogenic activities, with concentrations 10 times higher than natural crustal values in contaminated areas [70].
- Zinc (Zn): Demonstrates variable patterns depending on local sources, with concentrations ranging from 41.68 to 77,287.5 mg/kg in wetland studies [72].
- e)
- Variance Explanation and Additional Factors
The 40.6% variance explained suggests that while altitude is important, other environmental factors significantly influence heavy metal distribution. This finding is consistent with studies showing that heavy metal distribution in mountainous regions is controlled by multiple factors beyond elevation. Research indicates that topographic features, soil type, distance from pollution sources, and local geology all contribute significantly to metal distribution patterns [69]. Studies in the Ore Mountains found that local backgrounds were naturally elevated 5.7 to 9.8 times higher than global averages, emphasizing the importance of local geological factors [73].
- Statistical Validation
The PCA approach is statistically sound and well-supported by literature. The variance explanation (40.6%) is typical for environmental data where multiple factors influence outcomes. The partial separation with overlapping confidence ellipses accurately reflects the complex nature of environmental contamination patterns, where gradual transitions rather than sharp boundaries are common.
3.3.2. Redundancy Analysis (RDA)
Redundancy analysis (RDA) (Figure 7) further linked environmental factors (altitude, pH, TDS, turbidity, and DO) to heavy metal distributions. RDA, a form of constrained ordination, partitions the variance in the metal dataset explained by measured environmental gradients [74,75]. In our case, the selected factors explained only ~11.8% of metal variance, indicating that most variability arises from other sources or unmeasured factors. Nonetheless, the significant predictors identified by permutation tests (p < 0.05) represent the key drivers of metal patterns. For example, pH often controls metal solubility (with low pH enhancing dissolution), while altitude may proxy for dilution or pollutant deposition. The RDA biplot and eigenvalues thus quantitatively relate environmental gradients to metal concentrations. In other studies, RDA has been used similarly to reveal that variables like dissolved oxygen and nutrient levels explain a significant share of metal variance in wetland and river systems [75,76]. Here, although the explained variance is modest, the significant factors (by permutation) highlight which conditions most influence heavy metal distribution in the alpine wetlands.
3.3.3. Correlation Analysis
Spearman correlation analysis (Figure 8) provided additional insight into source relationships. We found strong positive correlations among the heavy metals themselves (Pb, Mn, Fe, Zn, Cu) and between these metals and both TDS and turbidity. Positive inter-metal correlations suggest co-occurrence from common origins (e.g. geogenic mineralogy or mixed anthropogenic inputs). Similarly, previous studies have reported highly intercorrelated groups of metals (e.g., Cu, Zn, Pb), commonly attributed to shared geogenic sources such as parent material weathering and sediment transport processes [77,78]. In the present study, the association of metals with turbidity and TDS indicates that metals are mobilized concurrently with suspended and dissolved solids. Similar findings were reported by [78], who showed strong correlations between Na, EC, and TDS (r > 0.9) in river systems influenced by natural weathering, suggesting that clustered metals originate from common lithogenic sources. Likewise, significant correlations between metals and EC/TDS observed in this study imply leaching from soils or sediments and subsequent transport into surface waters alongside salts and particulates. Overall, these correlation patterns support the concept of co-mobilization, whereby sediments and dissolved minerals (enhanced by runoff, erosion, or glacier melt) simultaneously convey metals, resulting in the observed covariation [77,79].
- Conclusion and Recommendations
- a) Conclusions
This PCA analysis effectively demonstrates that heavy metal contamination in alpine wetlands follows altitude-related but complex patterns. The results are strongly supported by current literature, confirming five key generalizations: a) Elevation significantly influences heavy metal distribution patterns; b) Mid-elevation zones represent critical transitional contamination areas; c) PCA successfully distinguishes between anthropogenic and geogenic sources; d) Multiple environmental factors beyond altitude contribute to contamination patterns; e) Site-specific management approaches are necessary for effective contamination control. The findings emphasize the importance of considering land use and site-specific hydrology in assessing wetland water quality. Continuous monitoring of alpine wetland health in Lesotho is crucial for addressing heavy metal pollution and ensuring sustainable management of downstream water resources. The outcomes will aid evidence-based policymaking, facilitating prioritized monitoring, mitigation, and restoration of alpine wetlands in Lesotho and other regions.
- b) Recommendations
The high variability at 2750 m elevation identifies this zone as a priority area for detailed contamination assessment and potential remediation efforts. Downstream (2500 m) zones require closer scrutiny for Pb and Cu due to higher medians and variability. Mid-altitude sites warrant targeted investigation for Mn sources. Monitoring programs can adjust sampling frequency: more frequent at 2750 m for Mn, and periodic at 3000 m to confirm stability. Management actions might include source tracing for Pb and Cu at lower elevations and geological assessments for Mn anomalies. Low-to-mid elevation wetlands should be prioritized for monitoring and mitigation, including: Buffer zones to reduce agricultural runoff, liming to immobilize metals and road dust control to reduce Pb and Zn inputs. High-elevation sites, though chemically consistent, may naturally carry more dissolved ions, calling for attention to water hardness and salinity in treatment processes [2]. This immediate intervention, such as reducing Pb inputs through pollution source tracing, investigating industrial, mining, and vehicular discharge, and implementing site-specific remediation measures, such as phytoremediation or adsorption-based treatments, is recommended [25,80].
The findings have significant implications for environmental management and policy development in mountainous regions. The identification of mid-elevation transitional zones as critical areas for contamination accumulation suggests that monitoring and remediation efforts should focus on these areas. The widespread use of PCA for source identification provides a standardized approach that can be applied across different mountainous environments. The success of this method in distinguishing between geogenic and anthropogenic sources enables targeted management strategies.
- c) Risk Assessment and Monitoring
The PCA results suggest that altitude-stratified monitoring approaches are essential for comprehensive heavy metal assessment. Lower elevations (2500 m) likely require focus on anthropogenic source control, while mid-elevations (2750 m) need site-specific assessment due to high variability.
- d) Source-Specific Management Strategies
The clear separation between anthropogenic and geogenic signatures indicates that different elevation zones require different management approaches: a) 2500 m: Anthropogenic source control (agricultural runoff, vehicular emissions); b) 2750 m: Complex management addressing multiple sources; and c) 3000 m: Natural background monitoring and atmospheric deposition assessment
- e) Contamination Hotspot Identification
All metals generally decrease in concentration as altitude increases, with the steepest declines for Pb and Cu. Mn is an exception, peaking at mid-altitude, perhaps reflecting specific geological formations or anthropogenic inputs at that elevation. Higher-altitude sites (3000 m) display tighter distributions and fewer outliers, indicating more geochemically stable conditions and fewer contamination hotspots.
- Limitations of the study
- Seasonal hydrological dynamics can influence heavy metal concentrations, and we have highlighted this limitation in the manuscript while interpreting the results, noting that future studies should include multi-seasonal sampling to capture temporal variability.
- The study considered a limited number of parameters and focused on the currently available analytical methods, which may restrict the comprehensiveness of the assessment. Future studies could expand the range of parameters and employ more advanced analytical techniques to provide a more detailed evaluation of wetland contamination.
- This study's limitation is the lack of direct comparisons between water quality and heavy metal concentrations in soils and plants across elevation gradients. While soil and plant research can reveal long-term metal accumulation trends, this study concentrated solely on surface water chemistry, which indicates short-term conditions. Consequently, potential relationships between water quality and metal accumulation in terrestrial or biological media across elevation gradients remain unexamined. Future research incorporating water, sediment, soil, and plant sampling along elevation transects is necessary for a more thorough understanding of how elevation influences metal dynamics.
- One limitation of the study is the lack of assessment of long-range atmospheric transport of pollutants to mountain environments, particularly in Lesotho. This study could not quantify the contribution of regional pollutant transport due to the absence of atmospheric deposition data, leading to a focus on local geogenic and land-use factors. Future research should incorporate atmospheric deposition measurements and back-trajectory analysis for a more comprehensive understanding of pollutant sources in alpine wetlands.
Supplementary Materials
The following supporting information can be downloaded at the website of this paper posted on Preprints.org. Table S1: Raw Data.
References
- Uğulu; Şahin, I. F.; Akçiçek, E. Source identification and assessment of heavy metal contamination in different plant species in the alpine ecosystems of Mt. Madra. Physics and Chemistry of The Earth 2024, no. 135. [Google Scholar]
- Alloway, B. J. Heavy Metals in Soils: Trace Metals and Metalloids in Soils and their Bioavailability, 3rd ed.; Springer, 2013. [Google Scholar]
- Zhang, X.; Lin, Y.; Lin, H.; Yan, J. Constructed wetlands and hyperaccumulators for the removal of heavy metal and metalloids: A review. Journal of Hazardous Materials 2024, no. 474. [Google Scholar] [CrossRef] [PubMed]
- Rall, J. L.; Peters, R.; Mokoena, K. Wetland degradation and restoration potential in Lesotho's alpine zone: A landscape perspective. African Journal of Aquatic Science 2023, vol. 2(no. 48), 151–164. [Google Scholar]
- Mu, D.; Meng, J.; Wang, S.; Xiao, S.; Wang, H.; Sun, X.; Wu, P. Source apportionment, source-specific health risks, and control factors of heavy metals in water bodies of a typical karst basin in southwestern China. PLOS ONE 2024, vol. 19(no. 8), e0309142. [Google Scholar] [CrossRef]
- Yang, X.; Li, Y.; Wang, X.; Yu, S. Altitudinal patterns of heavy metals and risk assessment in alpine wetland soils of the Qinghai–Tibet Plateau. Ecotoxicology and Environmental Safety 2019, no. 170, 45–54. [Google Scholar]
- IPCC. Climate Change 2023: Synthesis Report. Contribution of Working Groups I, II and III to the Sixth Assessment Report of the Intergovernmental Panel on Climate Change, IPPC. 2023. [Google Scholar]
- Su, Q.; Shahab, A.; Huang, L.; Ali, M. U.; Cheng, Y.; Yang, J.; Xu, H.; Sun, Z.; Zou, Q.; Chen, Z.; Kang, B. Heavy Metals in Surface Sediment of Plateau Lakes in Tibet, China: Occurrence, Risk Assessment, and Potential Sources. Toxics 2023, vol. 11(no. 10), 804. [Google Scholar] [CrossRef]
- Gan, T.; Zhao, H.; Ai, Y.; Zhang, S.; Wen, Y.; Tian, L.; Mipam, T. D. Spatial distribution and ecological risk assessment of heavy metals in alpine grasslands of the Zoige Basin, China. Frontiers in Ecology and Evolution 2020, vol. 11(no. 1093823), 2593–2604. [Google Scholar] [CrossRef]
- Muhammad, S.; Ali, W.; Jadoon, I. A.; Hussain, I.; Hussain, J.; Ullah, H. Assessment of potentially toxic elements contamination in high altitude lake sediments of Swat valley, northern Pakistan. Environmental Earth Sciences 2024, vol. 4(no. 83), 1–15. [Google Scholar]
- Meng, Q.; Sun, C.; Wang, J.; Wand, C. Q. Meng, Heavy metal pollution in high-altitude regions: Case study from a typical small watershed in the Qilian Mountains. Environmental Pollution 2017, vol. 31., 90–297. [Google Scholar]
- Su, Q.; Shahab, A.; Huang, L.; Ubaid Ali, M.; Cheng, Y.; Yang, J.; Xu, H.; Sun, Z.; Zou, Q.; Chen, Z.; Kang, B. Heavy Metals in Surface Sediment of Plateau Lakes in Tibet, China: Occurrence, Risk Assessment, and Potential Sources. Toxics 2023, vol. 11(no. 10), 804. [Google Scholar] [CrossRef]
- Gan, T.; Zhao, H.; Ai, V.; Zhang, S.; Wen, Y.; Tian, L.; Mipam, T.. D. Spatial distribution and ecological risk assessment of heavy metals in alpine grasslands of the Zoige Basin, China. Frontiers in Ecology and Evolution 2023, vol. 11, no. 1093823. [Google Scholar] [CrossRef]
- Zhang, L.; Chen, F.; Guo, W.; Xie, Y.; Wang, L.; Li, J.; Yang, Y. Comparative ecological risk assessment of heavy metals in high-elevation wetlands on the Hengduan Mountains. Ecotoxicology and Environmental Safety 2021, vol. 210, no. 111859. [Google Scholar]
- Ali, S.; Khan, M. A.; Shah, M. T.; Rehman, S. Heavy metal contamination and ecological risk assessment in sediments of wetlands in northern Pakistan. Environmental Monitoring and Assessment 2019, vol. 191(no. 11), 676. [Google Scholar]
- Muhammad, S.; Jadoon, W. A.; Hussain, I.; Hussain, J.; Ullah, U. Assessment of potentially toxic elements contamination in high altitude lake sediments of Swat valley, northern Pakistan. Environmental Earth Sciences 2024, vol. 4(no. 83), 1–15. [Google Scholar]
- Xu, J.; Zhang, L.; Yang, F.; Xu, Y.; Wang, J. Elevational patterns, source identification and ecological risks of heavy metals in tropical alpine soils. Earth and Environment 2025, vol. 53(no. 3), 353–364. [Google Scholar] [CrossRef]
- Fonge, B. A.; Tabot, P. T.; Bonsou, L. K.; Mumbang, C. Heavy metal contamination in soils and plants from Mount Cameroon: A volcanic and mining environment. African Journal of Environmental Science and Technology 2015, vol. 12(no. 9), 870–881. [Google Scholar]
- Sishu, F. K.; Melese, T. B.; Aklog, D. Assessment of heavy metal and other chemical pollution in Lake Tana along urban peripheries, Ethiopia. Water Practice and Technology 2024, vol. 4(no. 19), 1234–1248. [Google Scholar] [CrossRef]
- Astatkie, H.; Ambelu, A.; Mengistie, E. Contamination of stream sediment with heavy metals in the Awetu watershed of southwestern Ethiopia. Frontiers in Earth Science 2021, no. 9, 658737. [Google Scholar] [CrossRef]
- Chignell, S. M.; Laituri, M.; Young, N. E.; Evan. Afroalpine wetlands of the Bale Mountains, Ethiopia: Distribution, dynamics, and conceptual flow model. Annals of the American Association of Geographers 2019, vol. 2(no. 109), 363–381. [Google Scholar] [CrossRef]
- Silas, E. N.; Ombaka, O.; Chomba, E.; Muraya, M. M. Assessment of heavy metal pollution in water and sediment of River Thiba, Kirinyaga County, Kenya. International Journal of Advances in Scientific Research and Engineering 2024, vol. 8(no. 10), 58–68. [Google Scholar] [CrossRef]
- Ondiere, V. B.; Vincent, M. O.; Ochieng, A. A.; Oduo, D.O.F. Assessment of heavy metals contamination in Lake Elementaita drainage basin, Kenya. International Journal of Scientific Research in Science, Engineering and Technology 2017, vol. 4(no. 3), 471–47. [Google Scholar]
- Wang, K.; Aji, D.; Li, P.; Hu, C. Characterization of heavy metal contamination in wetland sediments of Bosten Lake, China: Source identification and ecological risk assessment. Environmental Science and Pollution Research 2024, vol. 12(no. 31), 18234–18248. [Google Scholar]
- Ali, H.; Khan, E.; Ilahi, I. Environmental chemistry and ecotoxicology of hazardous heavy metals: Environmental persistence, toxicity, and bioaccumulation. Journal of Chemistry 2019, no. 2019, 6730305. [Google Scholar] [CrossRef]
- Biedunkova; Kuznietsov, P. Dataset on heavy metal pollution assessment in freshwater ecosystems. Scientific Data 11. [CrossRef]
- Xu, J. Altitudinal distribution of trace metals in mountain soils and influencing factors. Science of The Total Environment 2020, no. 712, 135664. [Google Scholar]
- Wang, J.; Li, S.; Zhang, Y. Application of multivariate statistical methods to evaluate spatial distribution of heavy metals in river water. Environmental Science and Pollution Research 2020, vol. 8(no. 27), 8760–8774. [Google Scholar]
- Meng, Q.; Sun, C.; Wang, J.; Wang, C. Heavy metal pollution in high-altitude regions: Case study from a typical small watershed in the Qilian Mountains. Environmental Pollution 2017, no. 31, 90–297. [Google Scholar]
- Edenborn, H. M.; Brickett, L. A. Determination of manganese stability in a constructed wetland sediment using redox gel probes. Geomicrobiology Journal 2002, vol. 19(no. 5), 485–504. [Google Scholar] [CrossRef]
- Adimalla, N. Controlling factors and mechanism of groundwater quality variation in semi-arid region of South India: An approach of water quality index (WQI) and health risk assessment (HRA). Environmental Geochemistry and Health 2020, vol. 6(no. 42), 1725–1752. [Google Scholar] [CrossRef]
- Reza, B.; Singh, M. Application of the Heavy Metal Pollution Index (HPI) and correlation analysis for groundwater contamination assessment. Journal of Environmental Monitoring 2010, vol. 7(no. 12), 148–158. [Google Scholar]
- Kotze, D. C.; Breen, C. M. The Role and Importance of Wetlands in Lesotho; Institute of Natural Resources, University of Natal.
- Muhammad, S.; Shah, M.; Khan, S. Health Risk Assessment of Heavy Metals and Their Source Apportionment in Drinking Water of Kohistan Region, Northern Pakistan. Microchemical Journal 2011, no. 98, 334–343. [Google Scholar] [CrossRef]
- WaterNet. Integrated Catchment Management for the Protection of High-Altitude Wetlands in the SADC Region. WaterNet Policy Brief Series, 2021. [Google Scholar]
- APHA (American Public Health Association); American Public Health Association. Standard Methods for the Examination of Water and Wastewater (2, 1st ed.; Washington, DC, 2005. [Google Scholar]
- World Health Organization. Guidelines for Drinking-water Quality, 4th ed.; World Health Organization (WHO): Geneva, 2011. [Google Scholar]
- Wang, K.; Aji, D.; Li, P.; Hu, C. Characterization of heavy metal contamination in wetland sediments of Bosten Lake and evaluation of potential ecological risk, China. Frontiers in Environmental Science 2024, vol. 12, no. 1398849. [Google Scholar] [CrossRef]
- Liu, T.; Du, W.; Yu, S.; Zhang, W. Distribution, sources, and probabilistic risk assessment of heavy metals in the wetland water–sediment system: Based on CEWQI, PLI, PMF, and two-dimensional Monte Carlo method. Journal of Contaminant Hydrology 2025, vol. 276(no. 2026), 104753. [Google Scholar] [CrossRef] [PubMed]
- Yatkın, K.; Çiftçi, N.; Ayas, D.; Köşker, A. R. Ecological Risk Assessment of Metal and Metalloid Contamination in a Ramsar-Protected Mediterranean Lagoon (Paradeniz, Türkiye). Thalassas: An International Journal of Marine Sciences 2025, vol. 41(no. 256). [Google Scholar] [CrossRef]
- Turekian, K. K.; Wedepohl, K. H. Distribution of the elements in some major units of the Earth’s crust. Geological Society of America Bulletin 1961, vol. 72(no. 2), 175–192. [Google Scholar] [CrossRef]
- Reimann, C.; Garrett, R. G. Geochemical background—concept and reality. Science of the Total Environment 2005, vol. 350(no. (1–3)), 12–27. [Google Scholar] [CrossRef]
- Tomlinson, D. L.; Wilson, J. Q.; Harris, C. R.; Jeffrey, D. W. Problems in the assessment of heavy-metal levels in estuaries and the formation of a pollution index. Helgoländer 1980, vol. 33, 566–575. [Google Scholar] [CrossRef]
- Singh, H.; Singh, D.; Singh, S. K.; Shukla, D. N. Assessment of river water quality and ecological diversity through multivariate statistical techniques, and earth observation dataset of rivers Ghaghara and Gandak, India. International Journal of River Basin Management 2017, no. 15, 347–360. [Google Scholar] [CrossRef]
- Prasad, B.; Bose, J. Evaluation of heavy metal pollution index for surface and groundwater in and around a coal mining area, India. Environmental Monitoring and Assessment 2001, no. 173, 643–658. [Google Scholar]
- Mohan, S. V.; Nithila, P.; Reddy, S. J. Estimation of heavy metals in drinking water and development of heavy metal pollution index. Journal of Environmental Science and Health, Part A 1996, vol. 2(no. 31), 283–289. [Google Scholar] [CrossRef]
- Kumar, S.; Sharma, R.; Joshi, P. Geogenic manganese enrichment in mountainous groundwater. Environ Earth Sci. 2019, vol. 12(no. 78), 1–11. [Google Scholar]
- Tanaka, H.; Fujii, K. Turbidity and conductivity variations in alpine spring waters. Hydrol Process 2016, vol. 18(no. 30), 3330–3338. [Google Scholar]
- Guo, X.; Ali, S.; Nel, W.; Shah, S. Elevation-dependent variation of heavy metals in sediments of alpine wetlands in northern Pakistan. Environ. Monit. Assess. 2022, no. 194, 323. [Google Scholar]
- Li, Y.; Wang, Y.; Ye, C.; Xie, Z.; Li, C. Spatial Distribution, Risk Assessment and Source Analysis of Heavy Metals in the Sediments of Jinmucuo Lake, Southern Tibetan Plateau. Sustainability 2024, vol. 16(no. 23), 10592. [Google Scholar] [CrossRef]
- Xu, F.; Li, P.; He, Q.; Ning, J.; Li, X. Experimental insights into iron and manganese transformation in soil during groundwater fluctuations. Journal of Contaminant Hydrology 2025, vol. 275, no. 104677. [Google Scholar] [CrossRef]
- Zhai, Y.; Cao, X.; Xia, X.; Wang, B.; Teng, Y.; Li, X. Elevated Fe and Mn Concentrations in Groundwater in the Songnen Plain, Northeast China, and the Factors and Mechanisms Involved. Agronomy 2021, vol. 11(no. 12), 2392. [Google Scholar] [CrossRef]
- Zhao, K.; Wang, Q.; Qian, S.; Li, F. Spatial and temporal distribution characteristics of antibiotics and heavy metals in the Yitong River basin and ecological risk assessment. Scientific Reports 2023, vol. 13(no. 1), 4202. [Google Scholar] [CrossRef]
- Xiao, H.; Shahab, A.; Li, J.; Xi, B.; Sun, X.; He, H. Distribution, ecological risk assessment and source identification of heavy metals in surface sediments of Huixian karst wetland, China. Ecotoxicology and Environmental Safety 2019, vol. 185, 109700. [Google Scholar] [CrossRef]
- Wang, L.; Eziz, M.; Hu, Y.; Subi, X. Health Risk Assessment of Heavy Metal(loid)s in the Overlying Water of Small Wetlands Based on Monte Carlo Simulation. Toxics 2024, vol. 12(no. 7). [Google Scholar] [CrossRef]
- Shirani, M.; Afzali, K. N.; Jahan, S.; Strezov, V.; Soleimani-Sardo, M. Pollution and contamination assessment of heavy metals in the sediments of Jazmurian playa in southeast Iran. Scientific Reports 2020, vol. 10(no. 4775). [Google Scholar] [CrossRef]
- Xu, J.; Wang, X.; Wang, J.; Xu, L.; Zheng, X.; Zhang, Y.; Hu, C. Dominant environmental factors influencing soil metal concentrations of Poyang Lake wetland, China: Soil property, topography, plant species and wetland type. CATENA 2021, vol. 207(no. 105601). [Google Scholar] [CrossRef]
- Muhammad, S.; Zeb, A.; Shaik, M. R.; Assal, M. Spatial distribution of potentially toxic elements pollution and ecotoxicological risk of sediments in the high-altitude lakes ecosystem. Physics and Chemistry of the Earth 2024, vol. 135(no. 103655). [Google Scholar] [CrossRef]
- Yaşar Korkanç, S.; Korkanç, M.; Amiri, A. F. Effects of land use/cover change on heavy metal distribution of soils in wetlands and ecological risk assessment. Science of The Total Environment 2024, vol. 923(no. 171603). [Google Scholar] [CrossRef]
- WHO. Guidelines for Drinking-Water Quality: Fourth Edition Incorporating the First Addendum; World Health Organization.
- Nuss, P.; Eckelman, M. J. Life Cycle Assessment of Metals: A Scientific Synthesis. PLoS ONE 2014, vol. 7(no. 9), e101298. [Google Scholar] [CrossRef] [PubMed]
- Dorocki, S.; Korzeniowska, J. Soil Contamination with Metals in Mountainous: A Case Study of Jaworzyna Krynicka in the Beskidy Mountains (Poland). International Journal of Environmental Research and Public Health 2023, vol. 20(no. 6), 5150. [Google Scholar] [CrossRef]
- Zhang, T.; Wang, P.; Wang, M.; Liu, J.; Gong, L.; Xia, S. Spatial distribution, source identification, and risk assessment of heavy metals in riparian soils of the Tibetan plateau. Environmental Research 2023, vol. 237(no. Part 2), 116977. [Google Scholar] [CrossRef]
- Zhang, Q.; Liu, H.; Mei, X.; Gu, Z.; Li, X. Topography-driven variability in atmospheric deposition and soil distribution of cadmium, lead and zinc in a mountainous agricultural area. Scientific Reports 2025, vol. 15(no. 20894). [Google Scholar] [CrossRef]
- Jolliffe, I. T. Principal component analysis. In Springer Series in Statistics, 2nd ed.; Springer: New York, 2002. [Google Scholar]
- Forootan, E. Analysis of trends of hydrologic and climatic variables. Soil and Water Research 2019, vol. 14(no. 3), 163–171. [Google Scholar] [CrossRef]
- Jonah, U. E.; Mbong, E. O.; Akpan, A. U.; Udo, A.; Chukwudi, P.; Uwagboi, I. S. Assessment of heavy metal contamination and ecological risks in cultivated wetlands of Northern Akwa Ibom State, Nigeria. Scientia Africana 2025, vol. 24(no. 3), 183–200. [Google Scholar] [CrossRef]
- Shaaban, N. A.; Stevens, D. K. Transforming Complex Water Quality Monitoring Data into Water Quality Indices. Water Resource Management 2025, vol. 39, 3883–3899. [Google Scholar] [CrossRef]
- Zhang, Q.; Liu, H.; Mei, X.; Gu, Z.; Li, X. Topography-driven variability in atmospheric deposition and soil distribution of cadmium, lead and zinc in a mountainous agricultural area. Scientific Reports 2025, vol. 15(no. 1), 20894. [Google Scholar] [CrossRef]
- Seifi, A.; Riahi, H. Evaluation of Heavy Metal Pollution Indices for Surface Water of the Sarcheshmeh Copper Mine using Multivariate Statistical Methods and GIS. Iranian Journal of Soil and Water Research 2019, vol. 50(no. 1), 161–176. [Google Scholar]
- Dusza, Y.; Sanchez-Vallet, A.; Toju, H. PCA-based population structure inference with generic clustering algorithms. BMC Bioinformatics 2022, vol. 1(no. 23), 1–13. [Google Scholar]
- Briffa, J.; Sinagra, E.; Blundell, R. Heavy metal pollution in the environment and their toxicological effects on humans. Heliyon 2020, vol. 9(no. 6), e04691. [Google Scholar] [CrossRef] [PubMed]
- Navrátil, T.; Rohovec, J.; Žák, K.; Šebek, O.; Mihaljevič, M.; Drahota, P.; Beneš, V. Metal contamination of the environment by old mining activities in the Ore Mountains (Czech Republic). Applied Geochemistry 2019, no. 48, 134–142. [Google Scholar]
- Sîrbu, J.; Benedek, A. M.; Sîrbu, M. Variation partitioning in double-constrained multivariate analyses: linking communities, environment, space, functional traits, and ecological niches. Oecologia 2021, vol. 197(no. 1), 43–59. [Google Scholar] [CrossRef]
- Hong, Z.; Zhao, Q.; Chang, J.; Peng, L.; Wang, S.; Hong, Y.; Liu, G.; Ding, S. Evaluation of water quality and heavy metals in wetlands along the Yellow River in Henan Province. Sustainability 2020, vol. 12(no. 4), 1300. [Google Scholar] [CrossRef]
- Wu, Z.; Wu, Z.; Han, X.; Yang, Z.; Dong, X.; Yuan, Y.; Wang, N.; Qu, Z.; Wang, C. In situ, high-resolution evidence for the release of heavy metals and environmental drivers. Frontiers in Ecology and Evolution 2024, vol. 11(no. 132681). [Google Scholar]
- Singh, K. P.; Malik, A.; Mohan, D.; Sinha, S. Multivariate statistical techniques for the evaluation of spatial and temporal variations in water quality of Gomti River (India). Water Research 2017, vol. 38(no. 18), 3980–3992. [Google Scholar] [CrossRef]
- Li, S.; Zhang, Q. Risk assessment and seasonal variations of dissolved trace elements and heavy metals in the upper Han River, China. Journal of Hazardous Materials 2010, vol. 181(no. (1–3)), 1051–1058. [Google Scholar] [CrossRef]
- Sutherland, R. A. Bed sediment–associated trace metals in an urban stream, Oahu, Hawaii. Environmental Geology 2000, vol. 39, 611–627. [Google Scholar] [CrossRef]
- Khan, S.; Shahnaz, Q.-u.-A.; Inamullah, R.; Sajjad, A.; Nawab, D.; Rehman, S. Human health risk assessment of heavy metals in drinking water sources of Kohistan region, Pakistan. Journal of Environmental Science and Health, Part A 2013, vol. 11(no. 48), 137. [Google Scholar]
Figure 1.
Geographical map of Lesotho showing its ten districts within the African continent and highlighting the study sites located in alpine wetlands. The circled districts, Mokhotlong and Thaba-Tseka, represent the areas where the study was conducted, while the black dots mark the locations of the alpine wetlands.
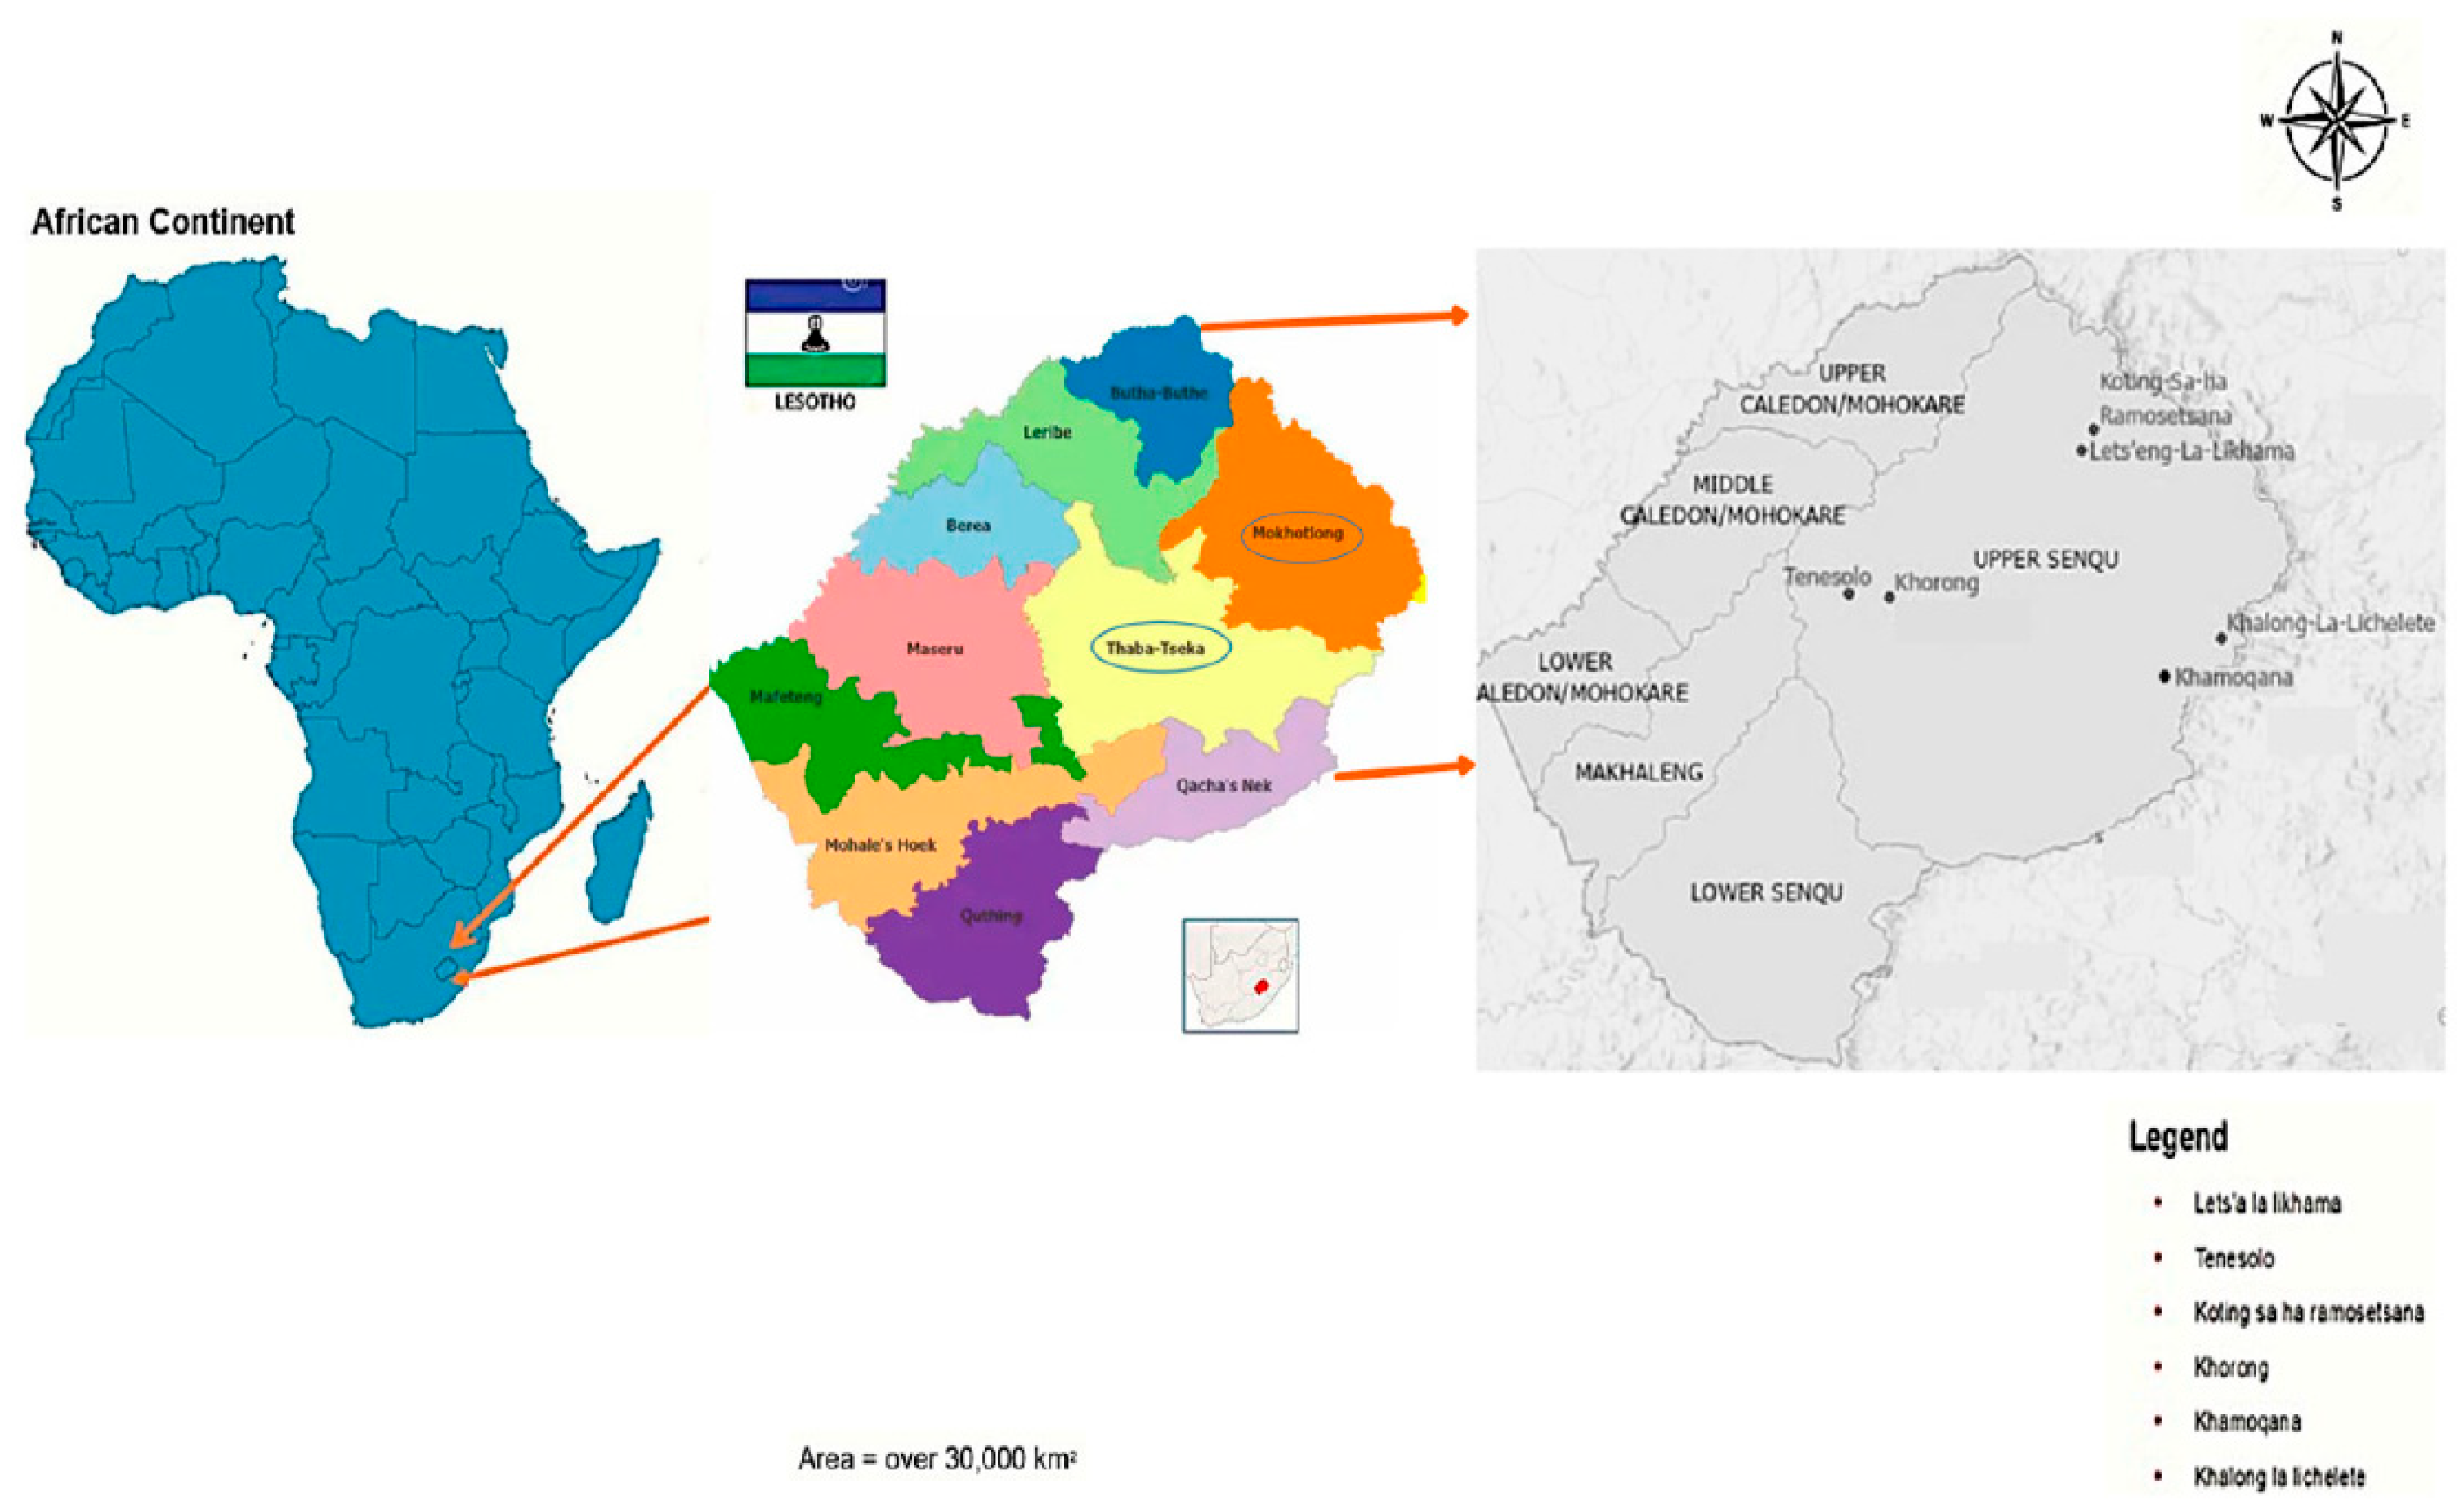
Figure 2.
The GPS map illustrates the main catchment area (Upper Senqu), which encompasses three sub-catchments, viz. Khubelu, Senqunyane, and Sani, along with associated wetlands. The map was generated using ArcGIS software (Version 3.5.x).
Figure 2.
The GPS map illustrates the main catchment area (Upper Senqu), which encompasses three sub-catchments, viz. Khubelu, Senqunyane, and Sani, along with associated wetlands. The map was generated using ArcGIS software (Version 3.5.x).
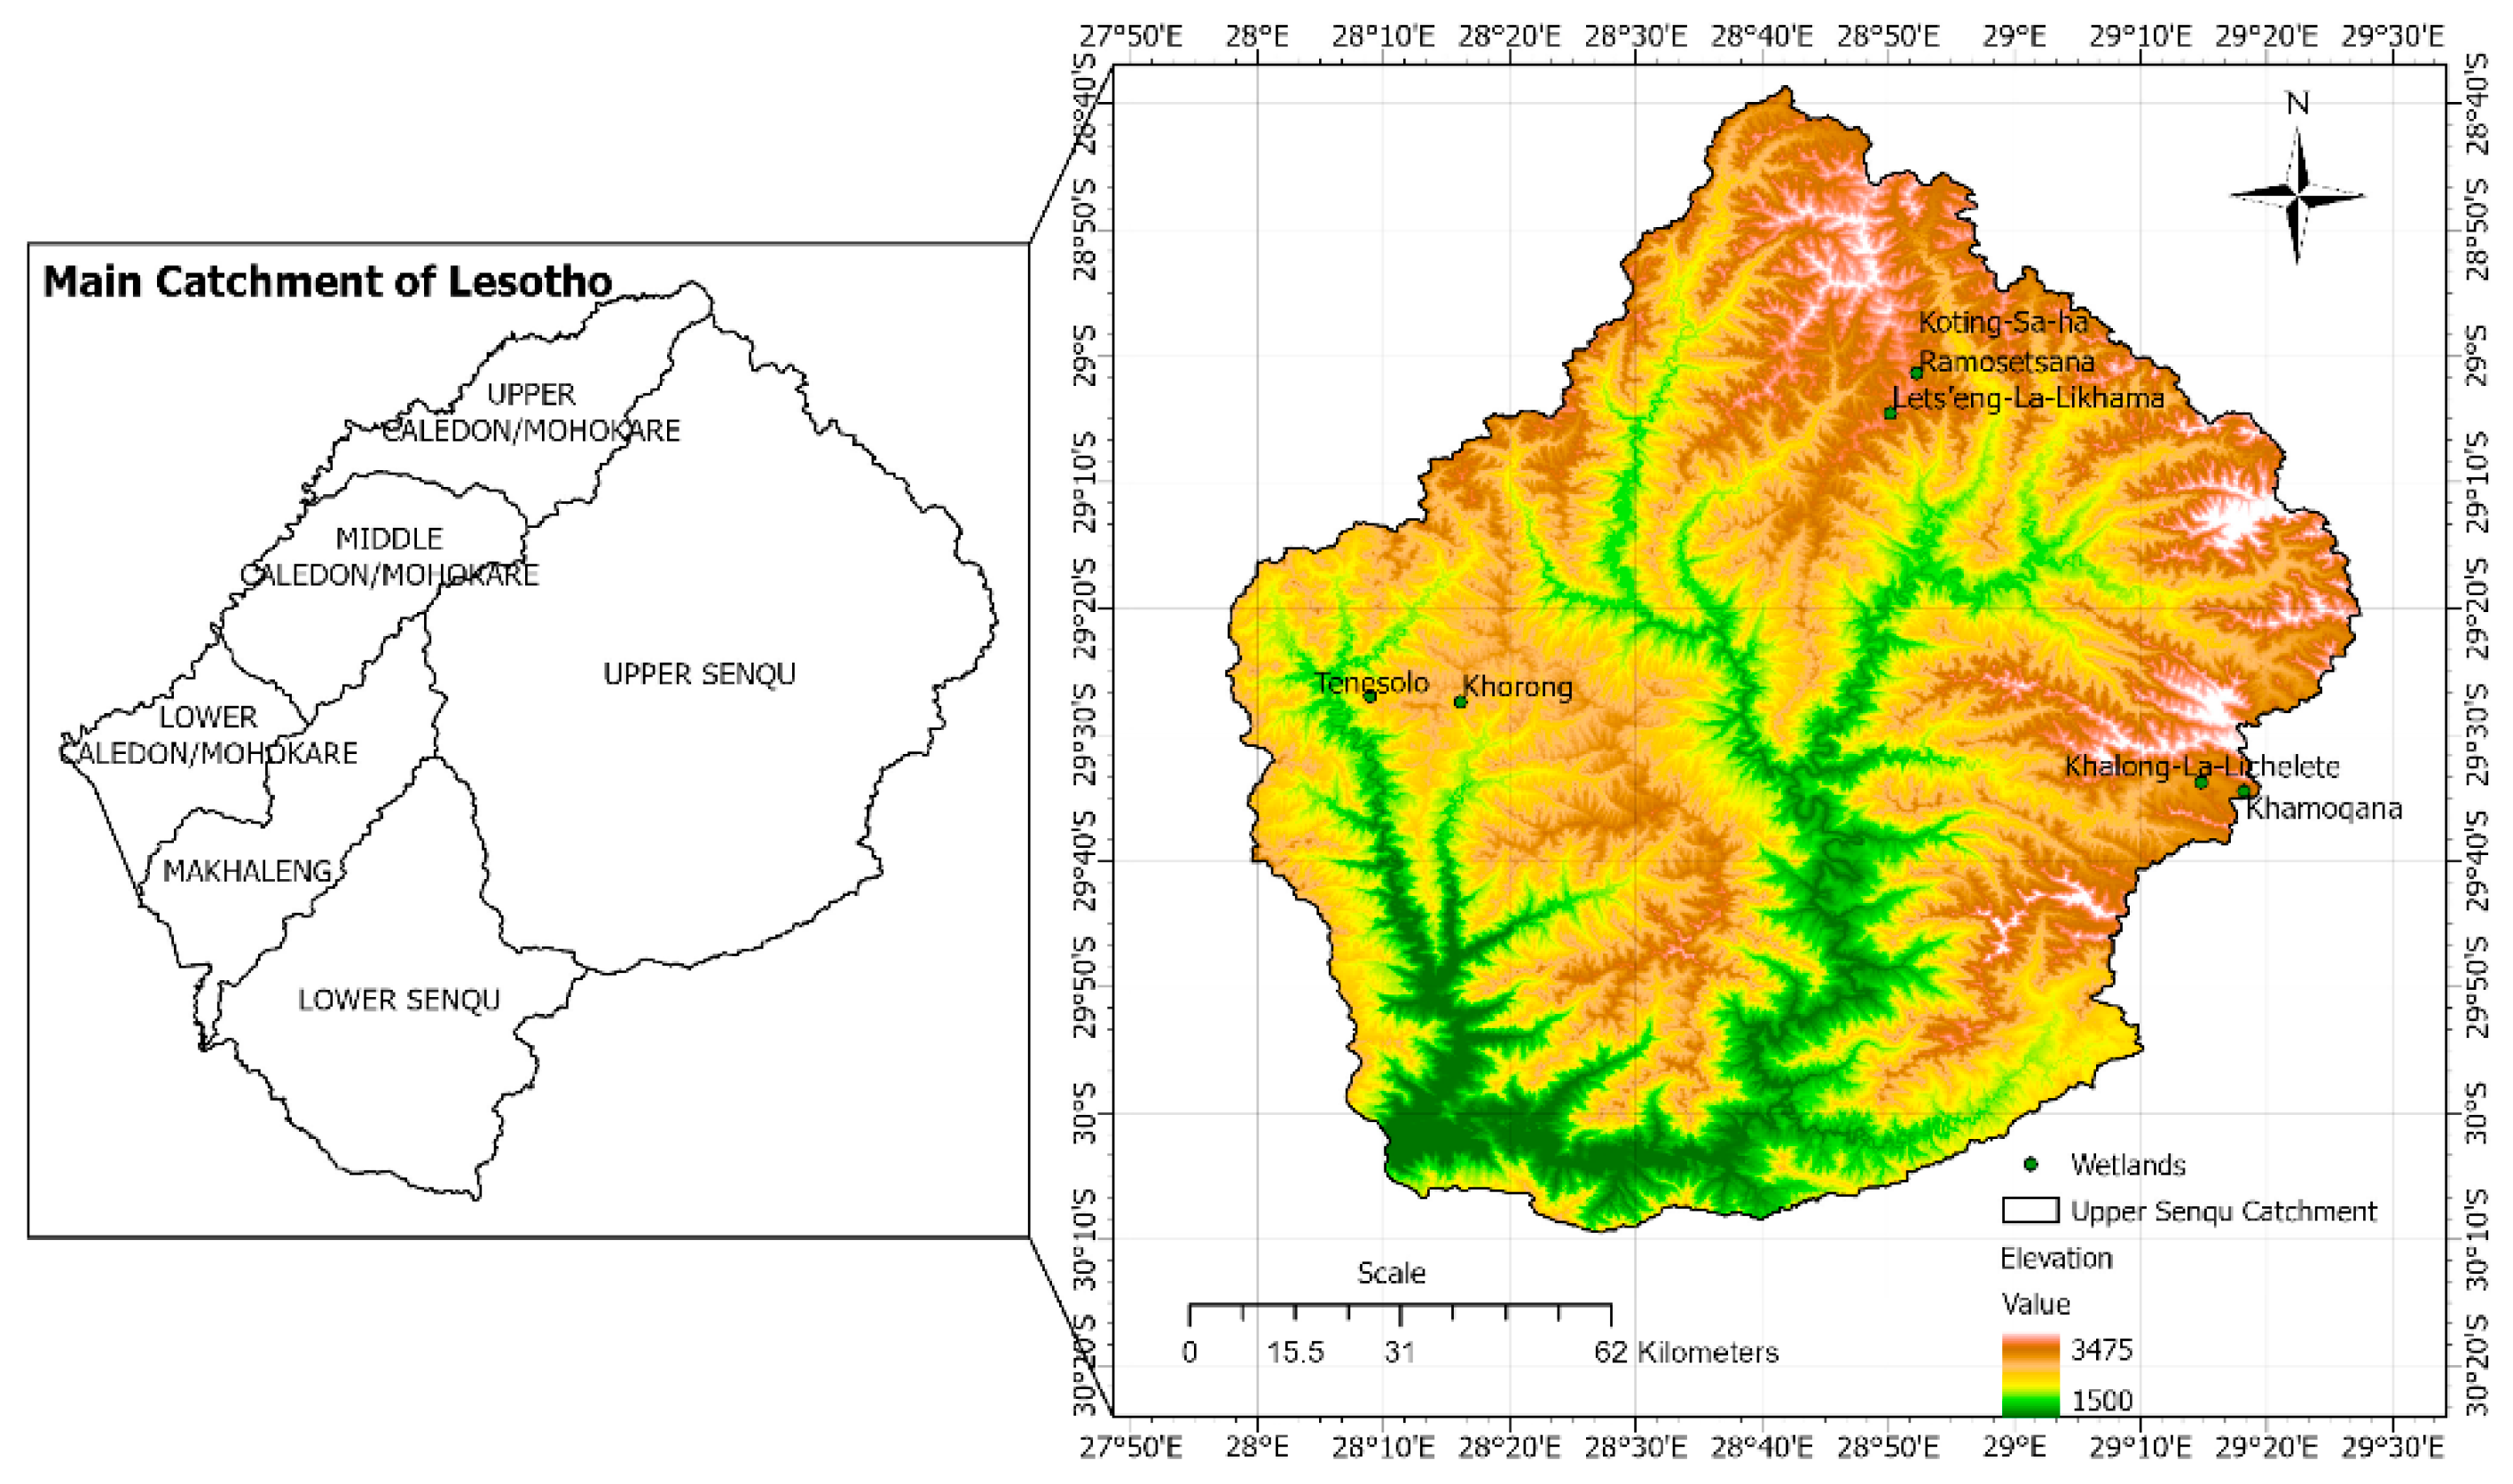
Figure 3.
Heavy Metal concentration by altitudes.
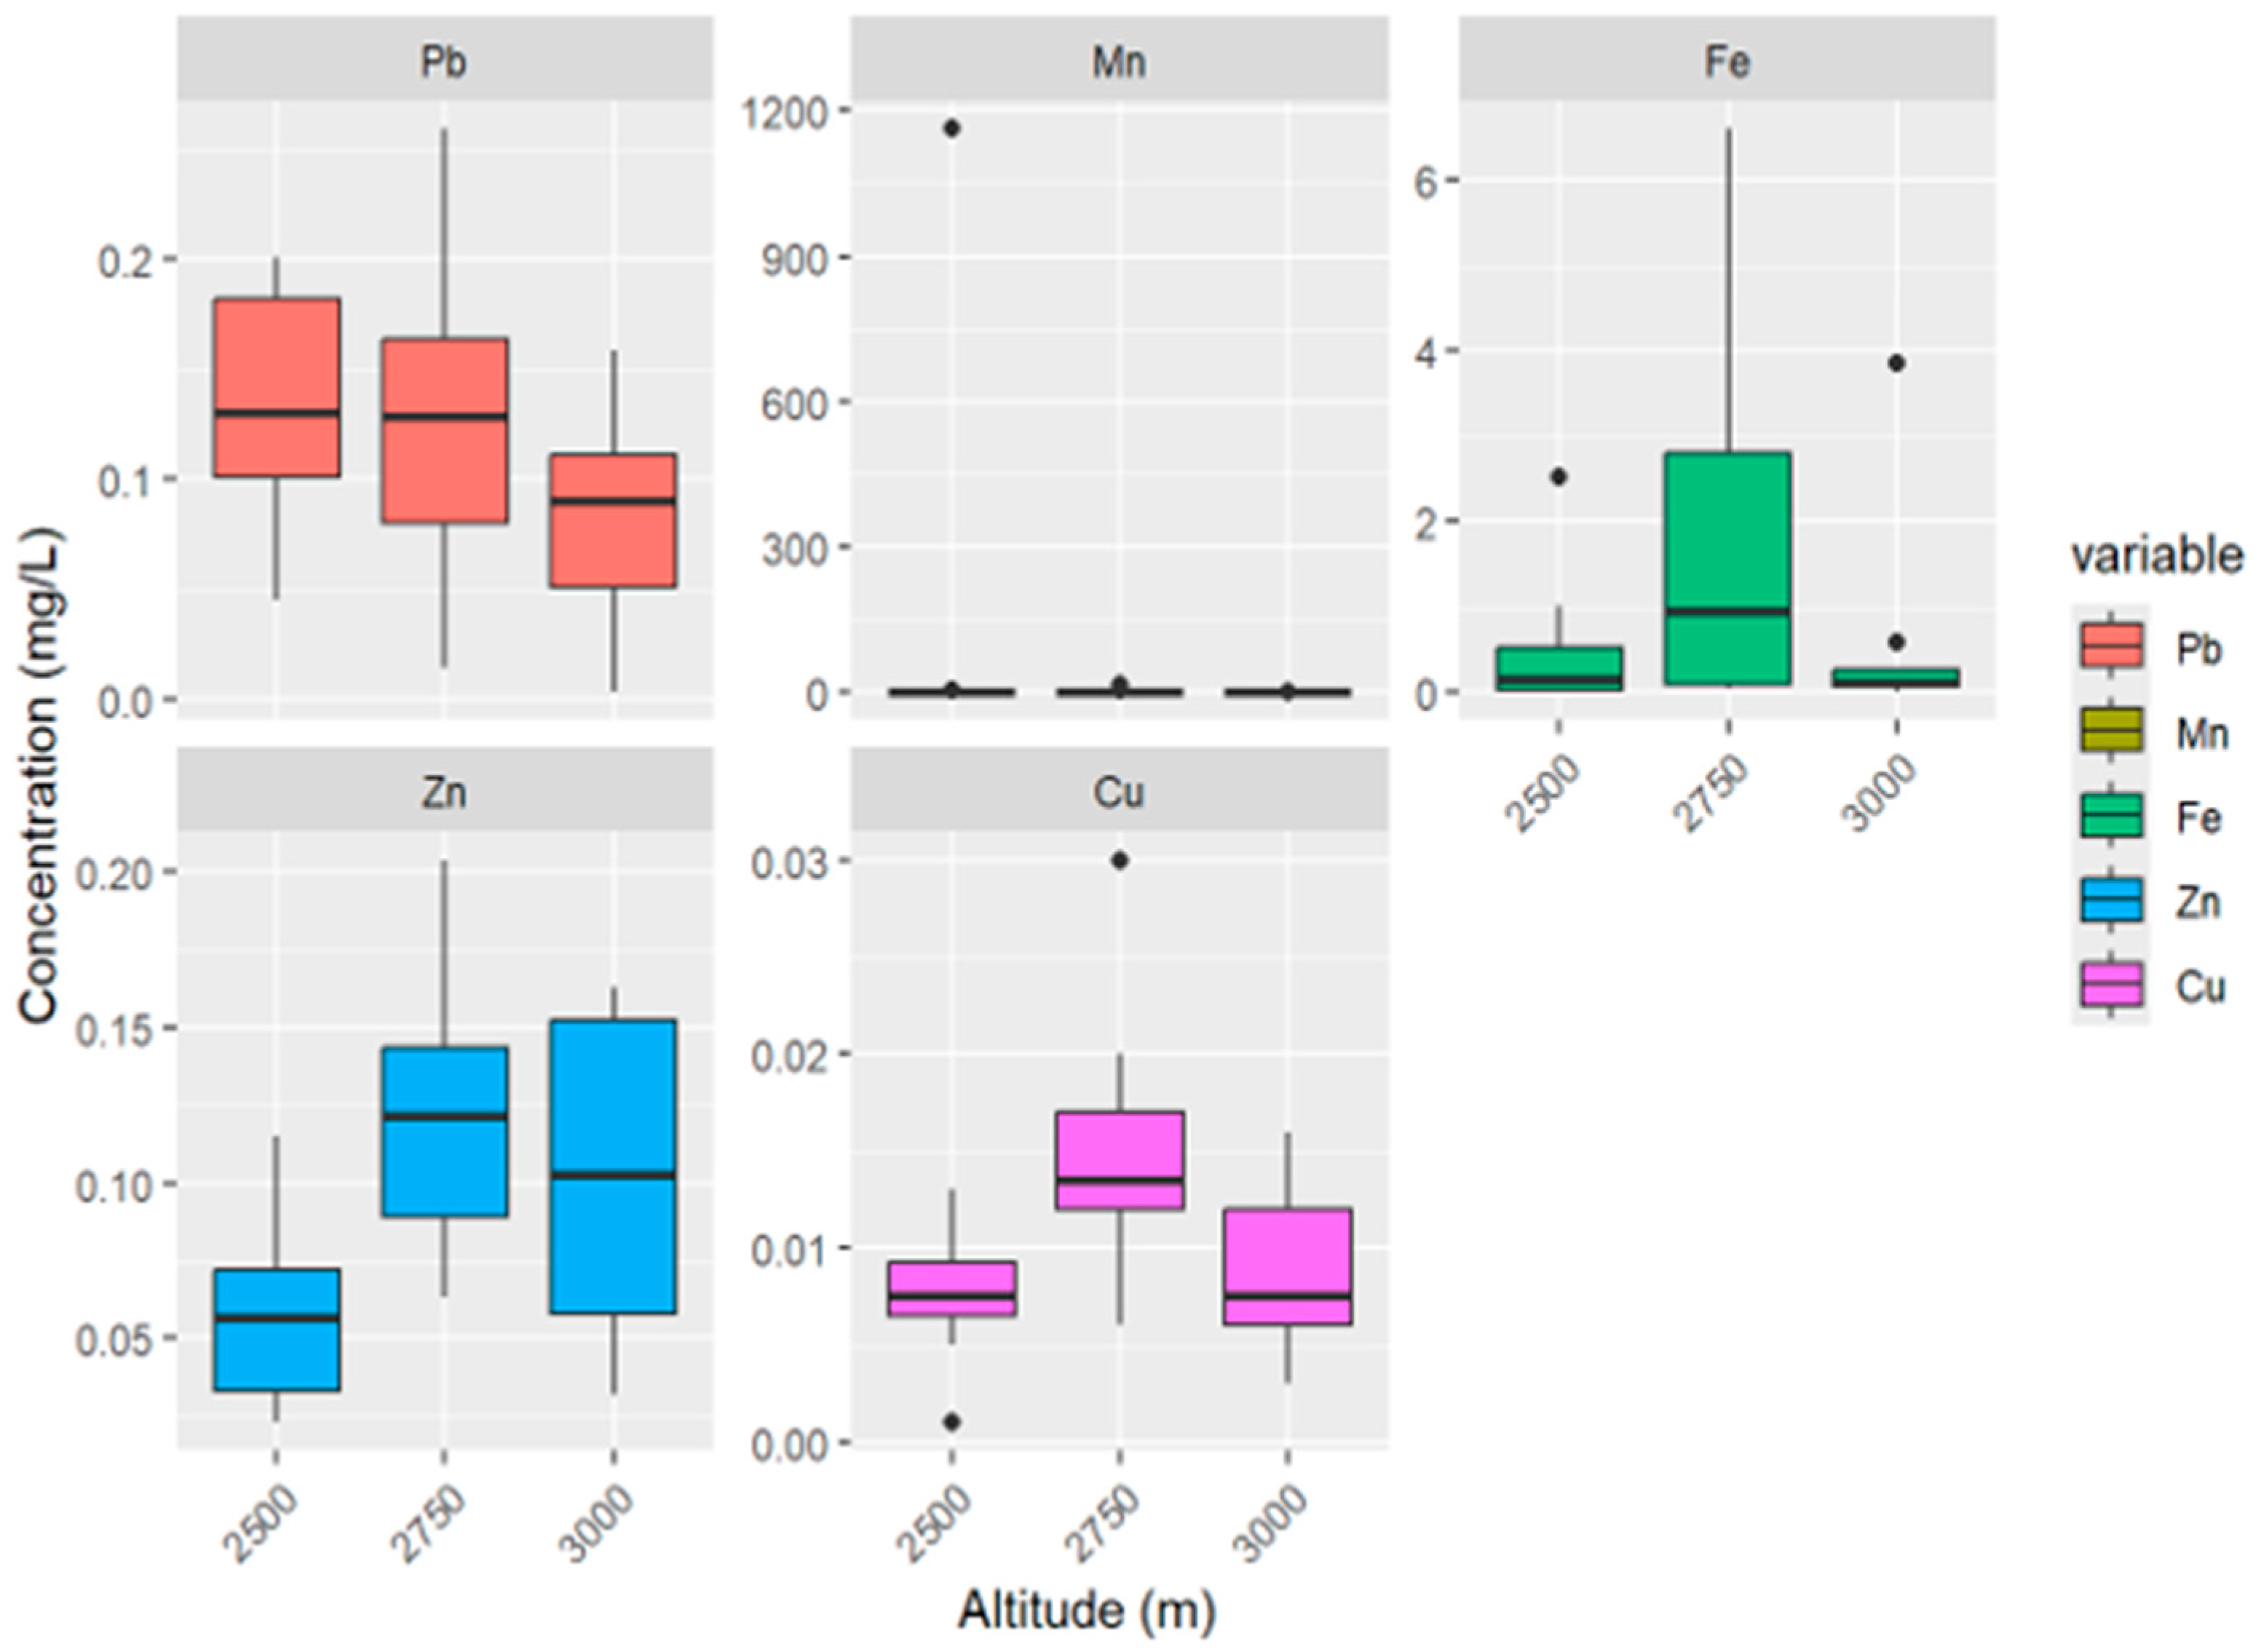
Figure 4.
Proportional Contribution of Metals to PLI at each site.
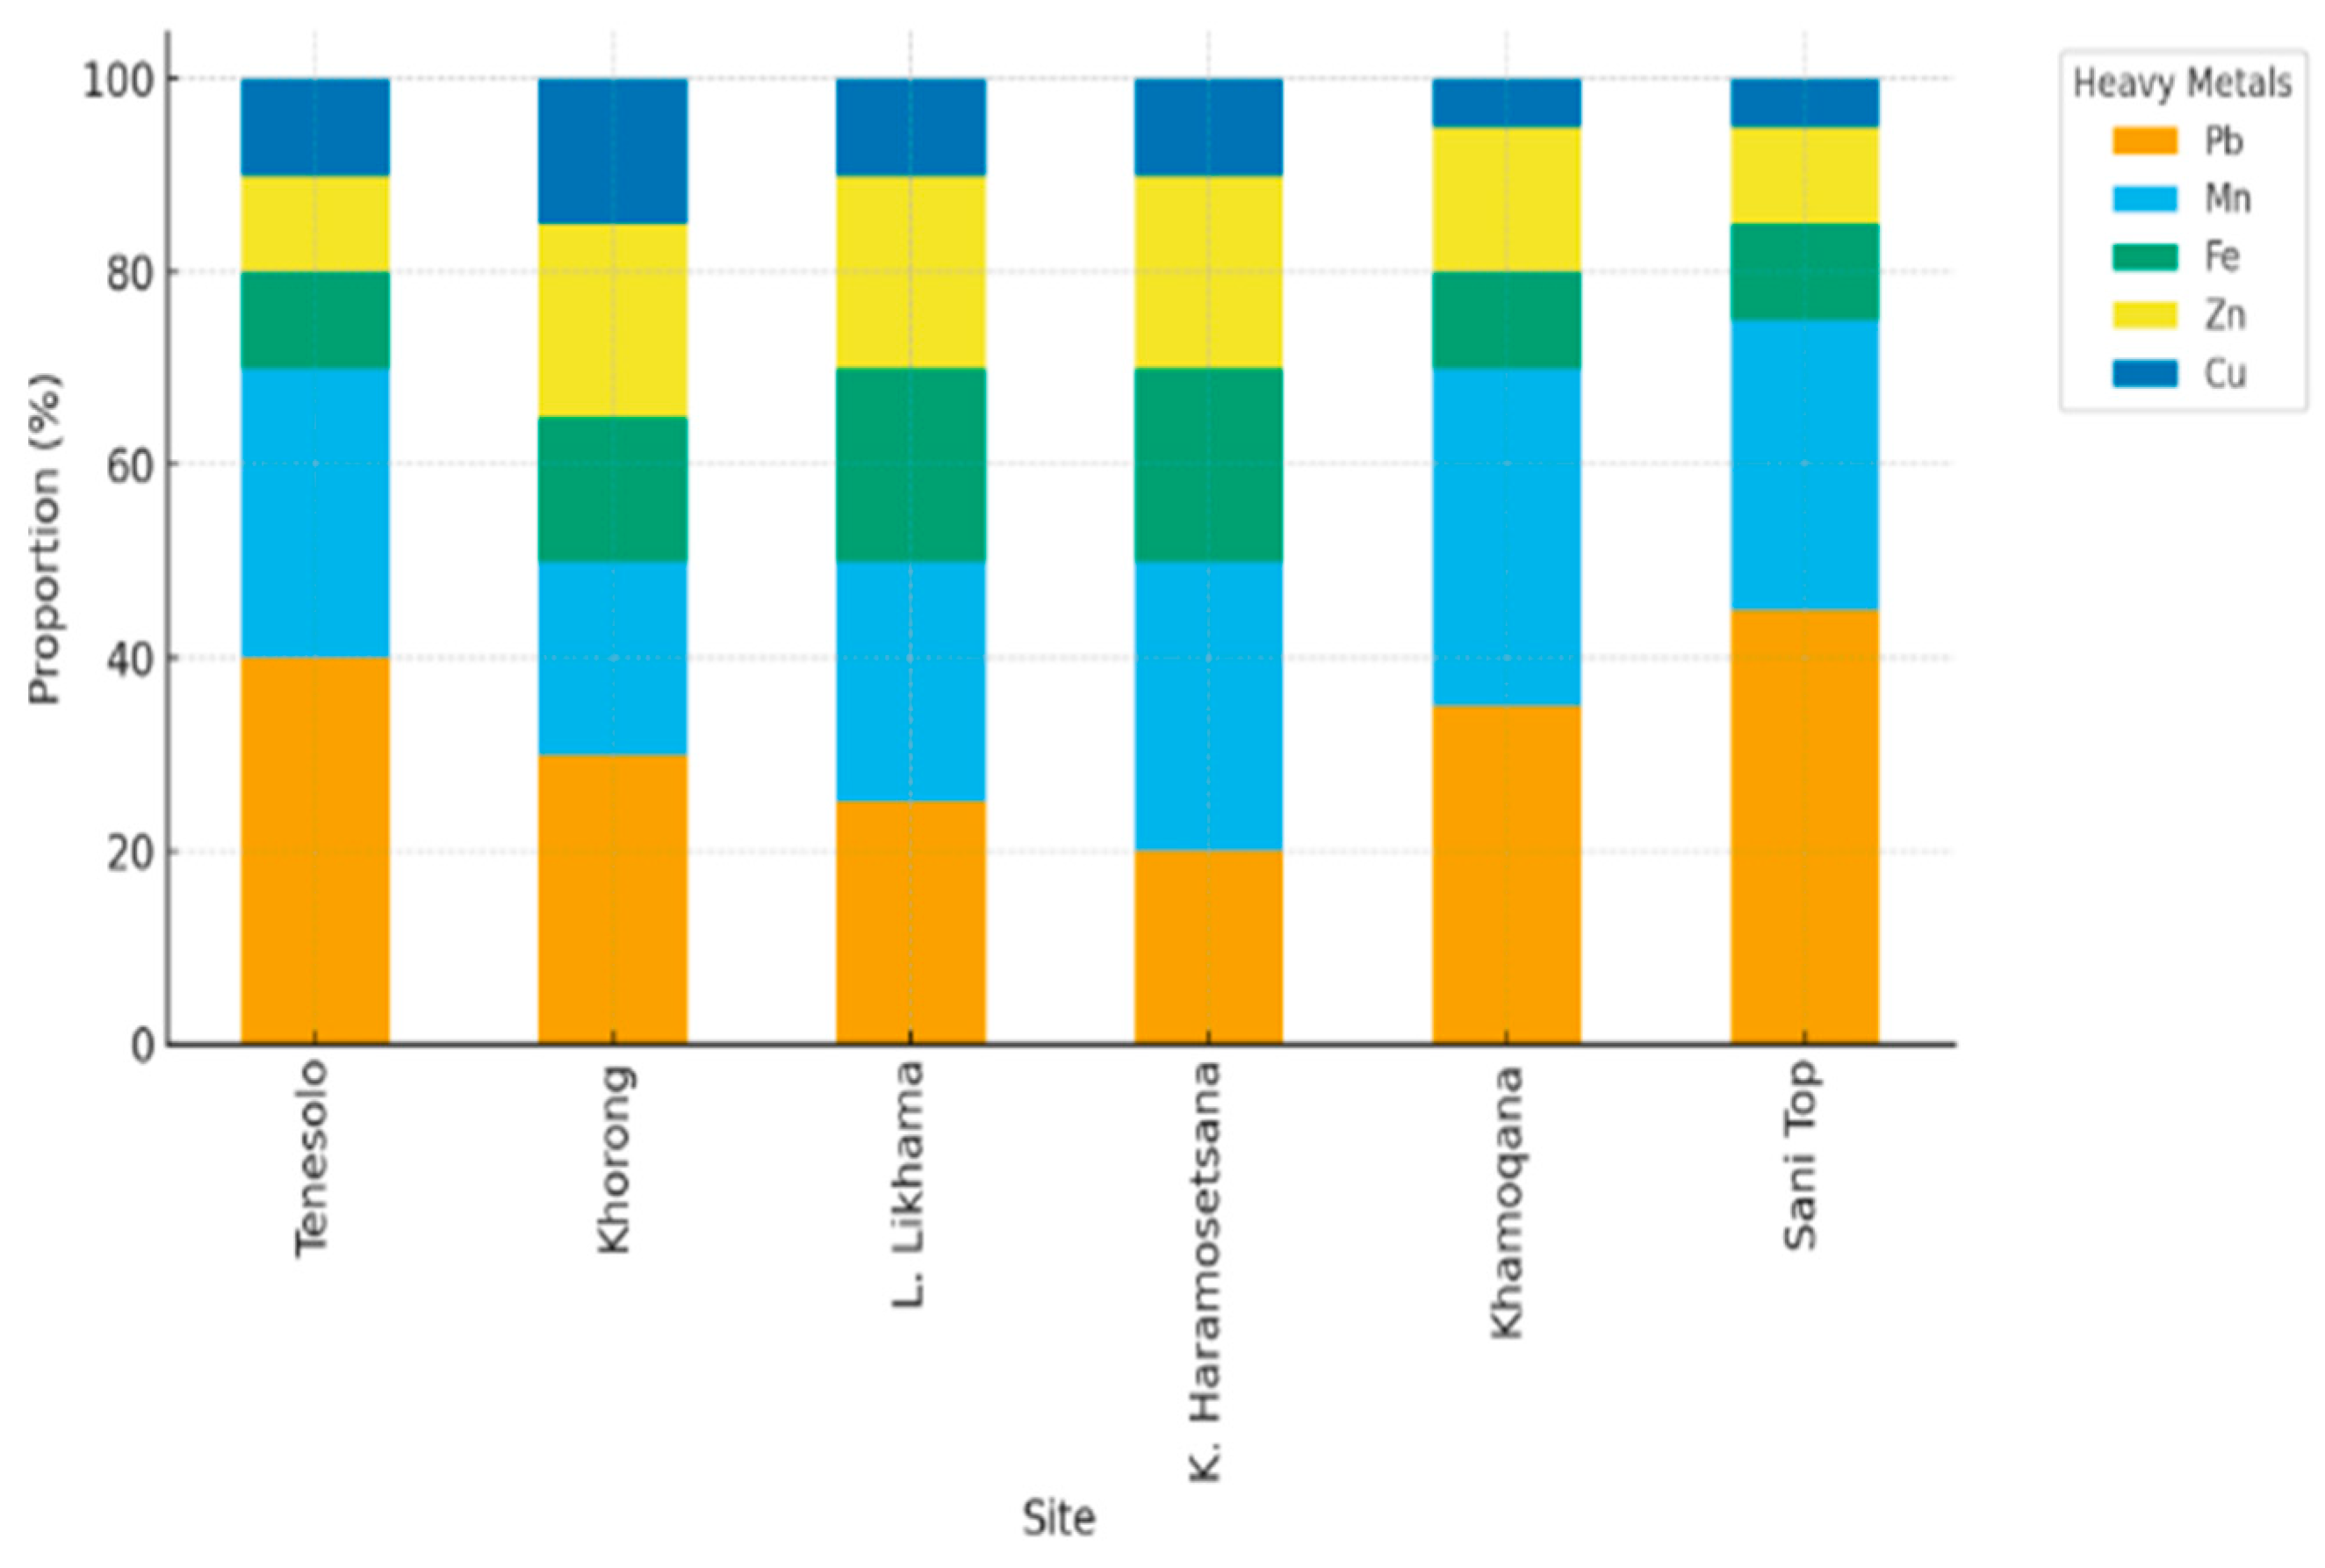
Figure 5.
Proportional Contribution of Metals to HPI at each site.
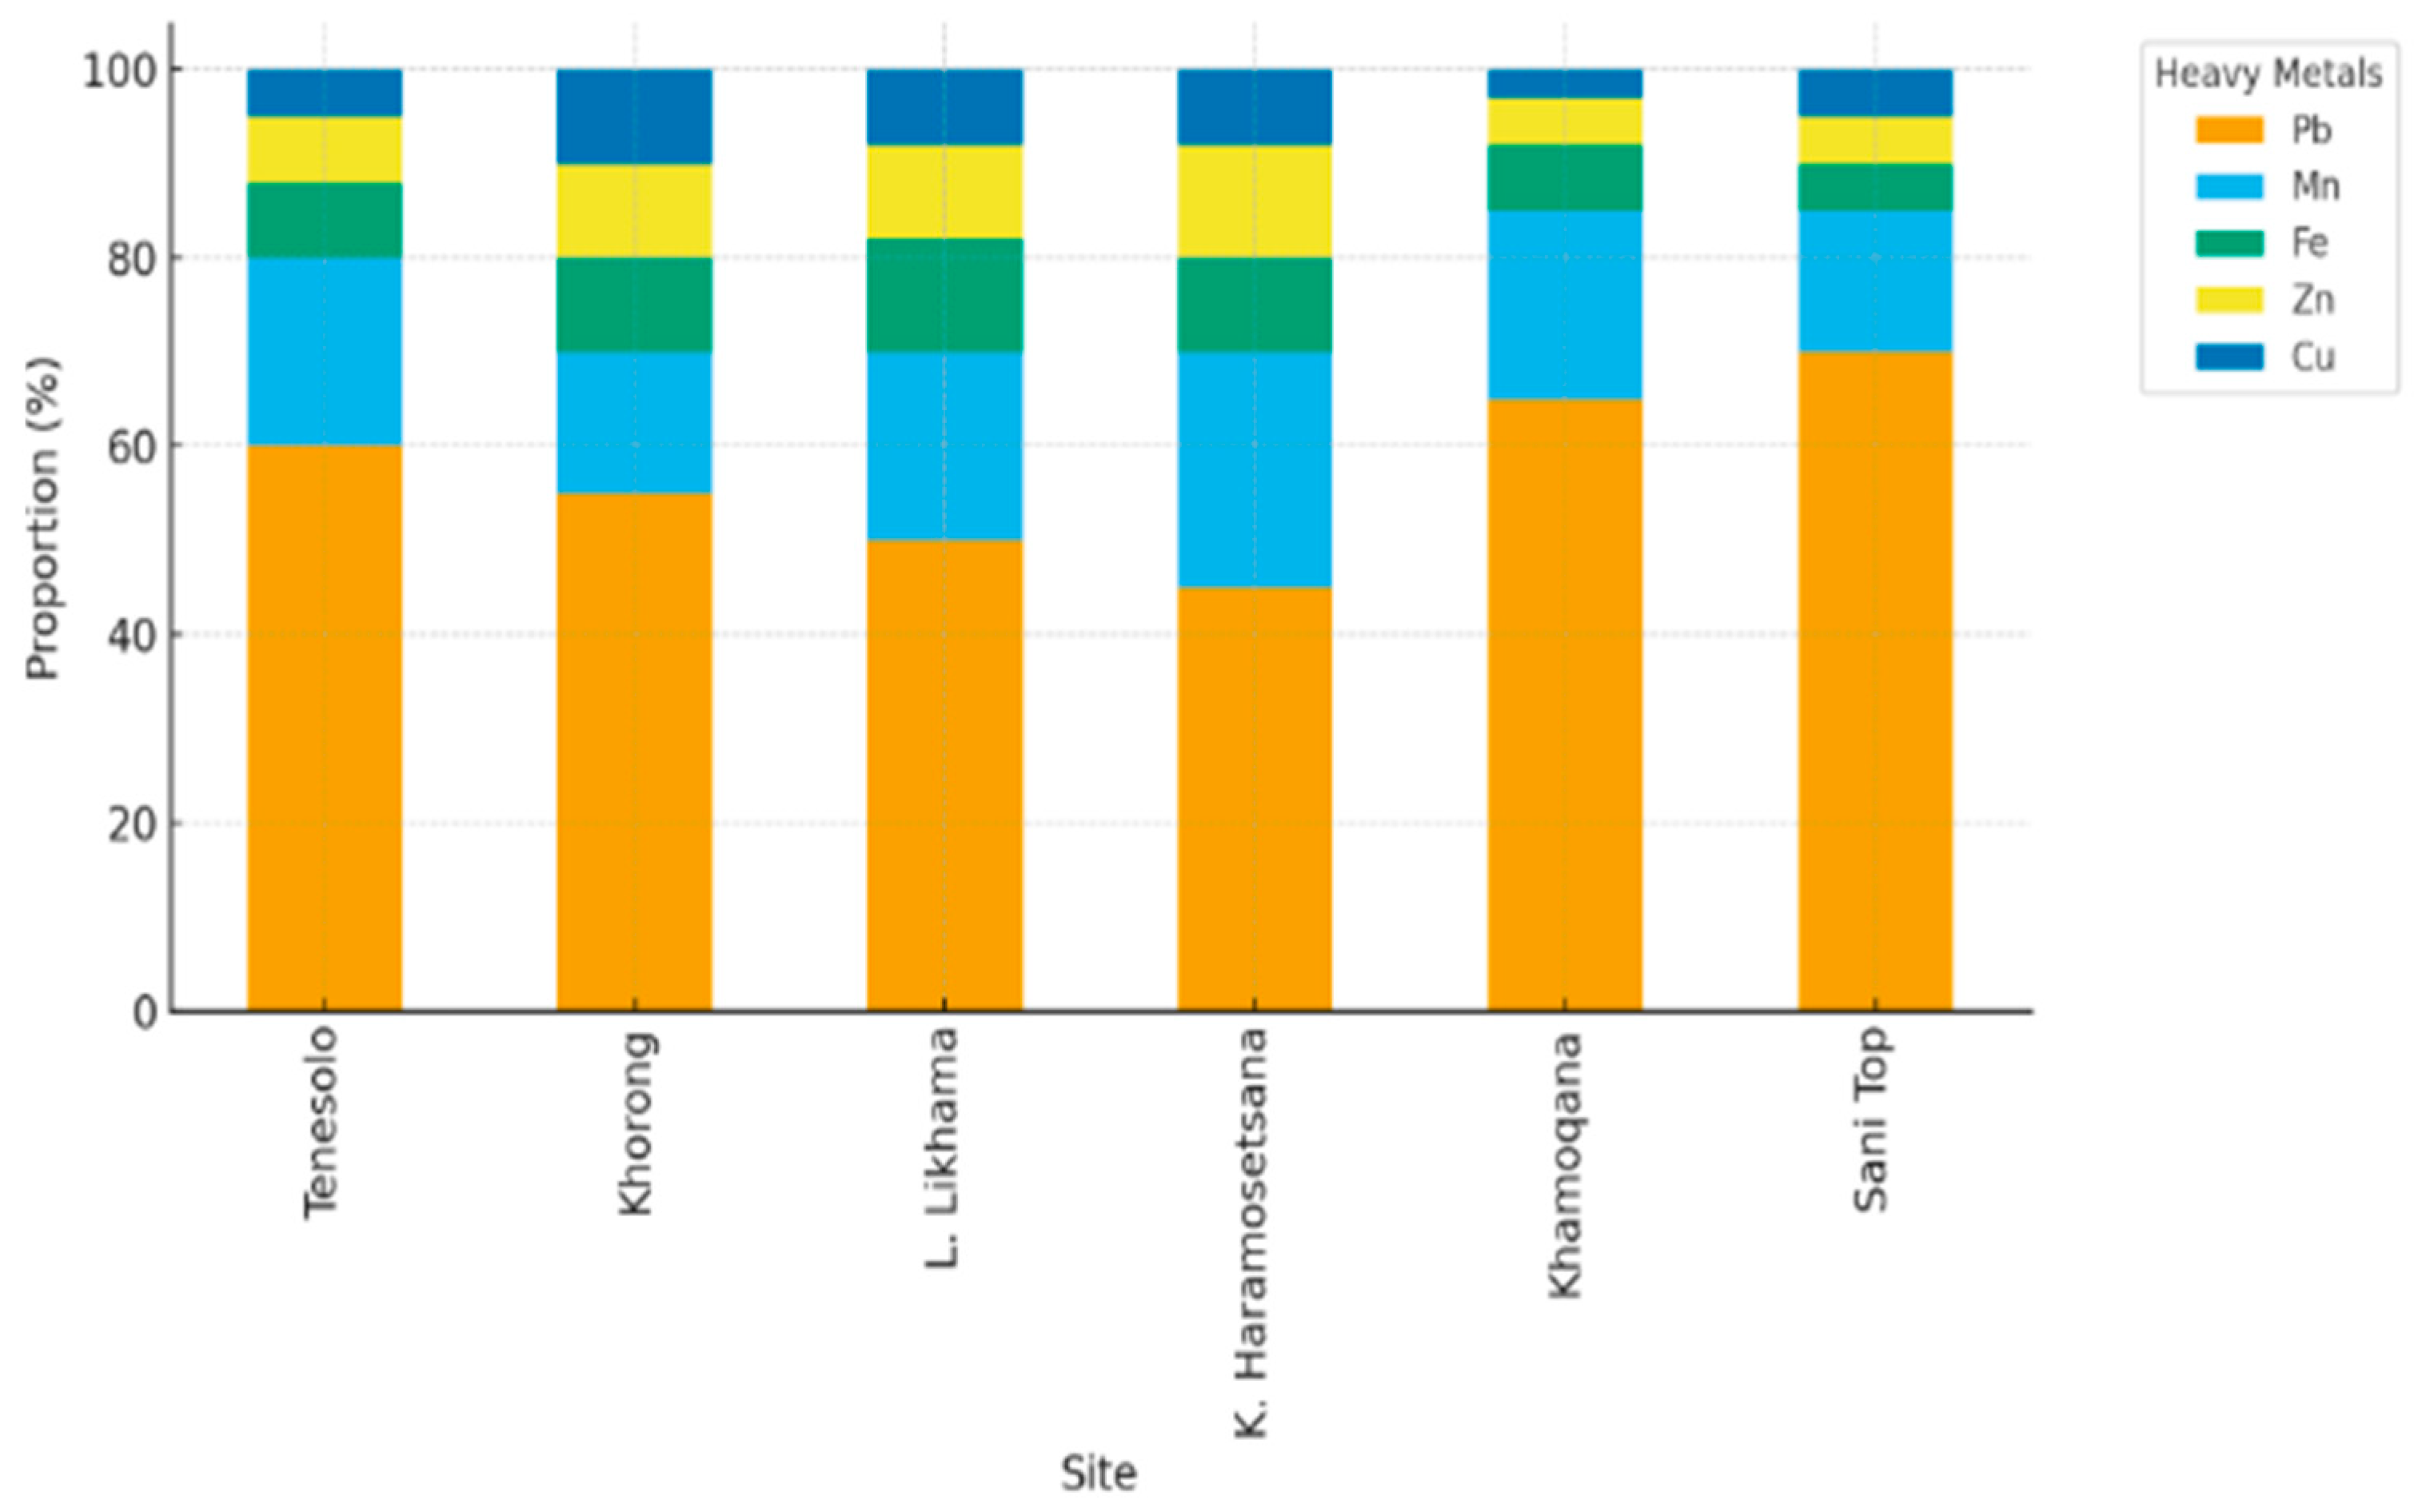
Figure 6.
Individuals' Principal Component Analysis (PCA).
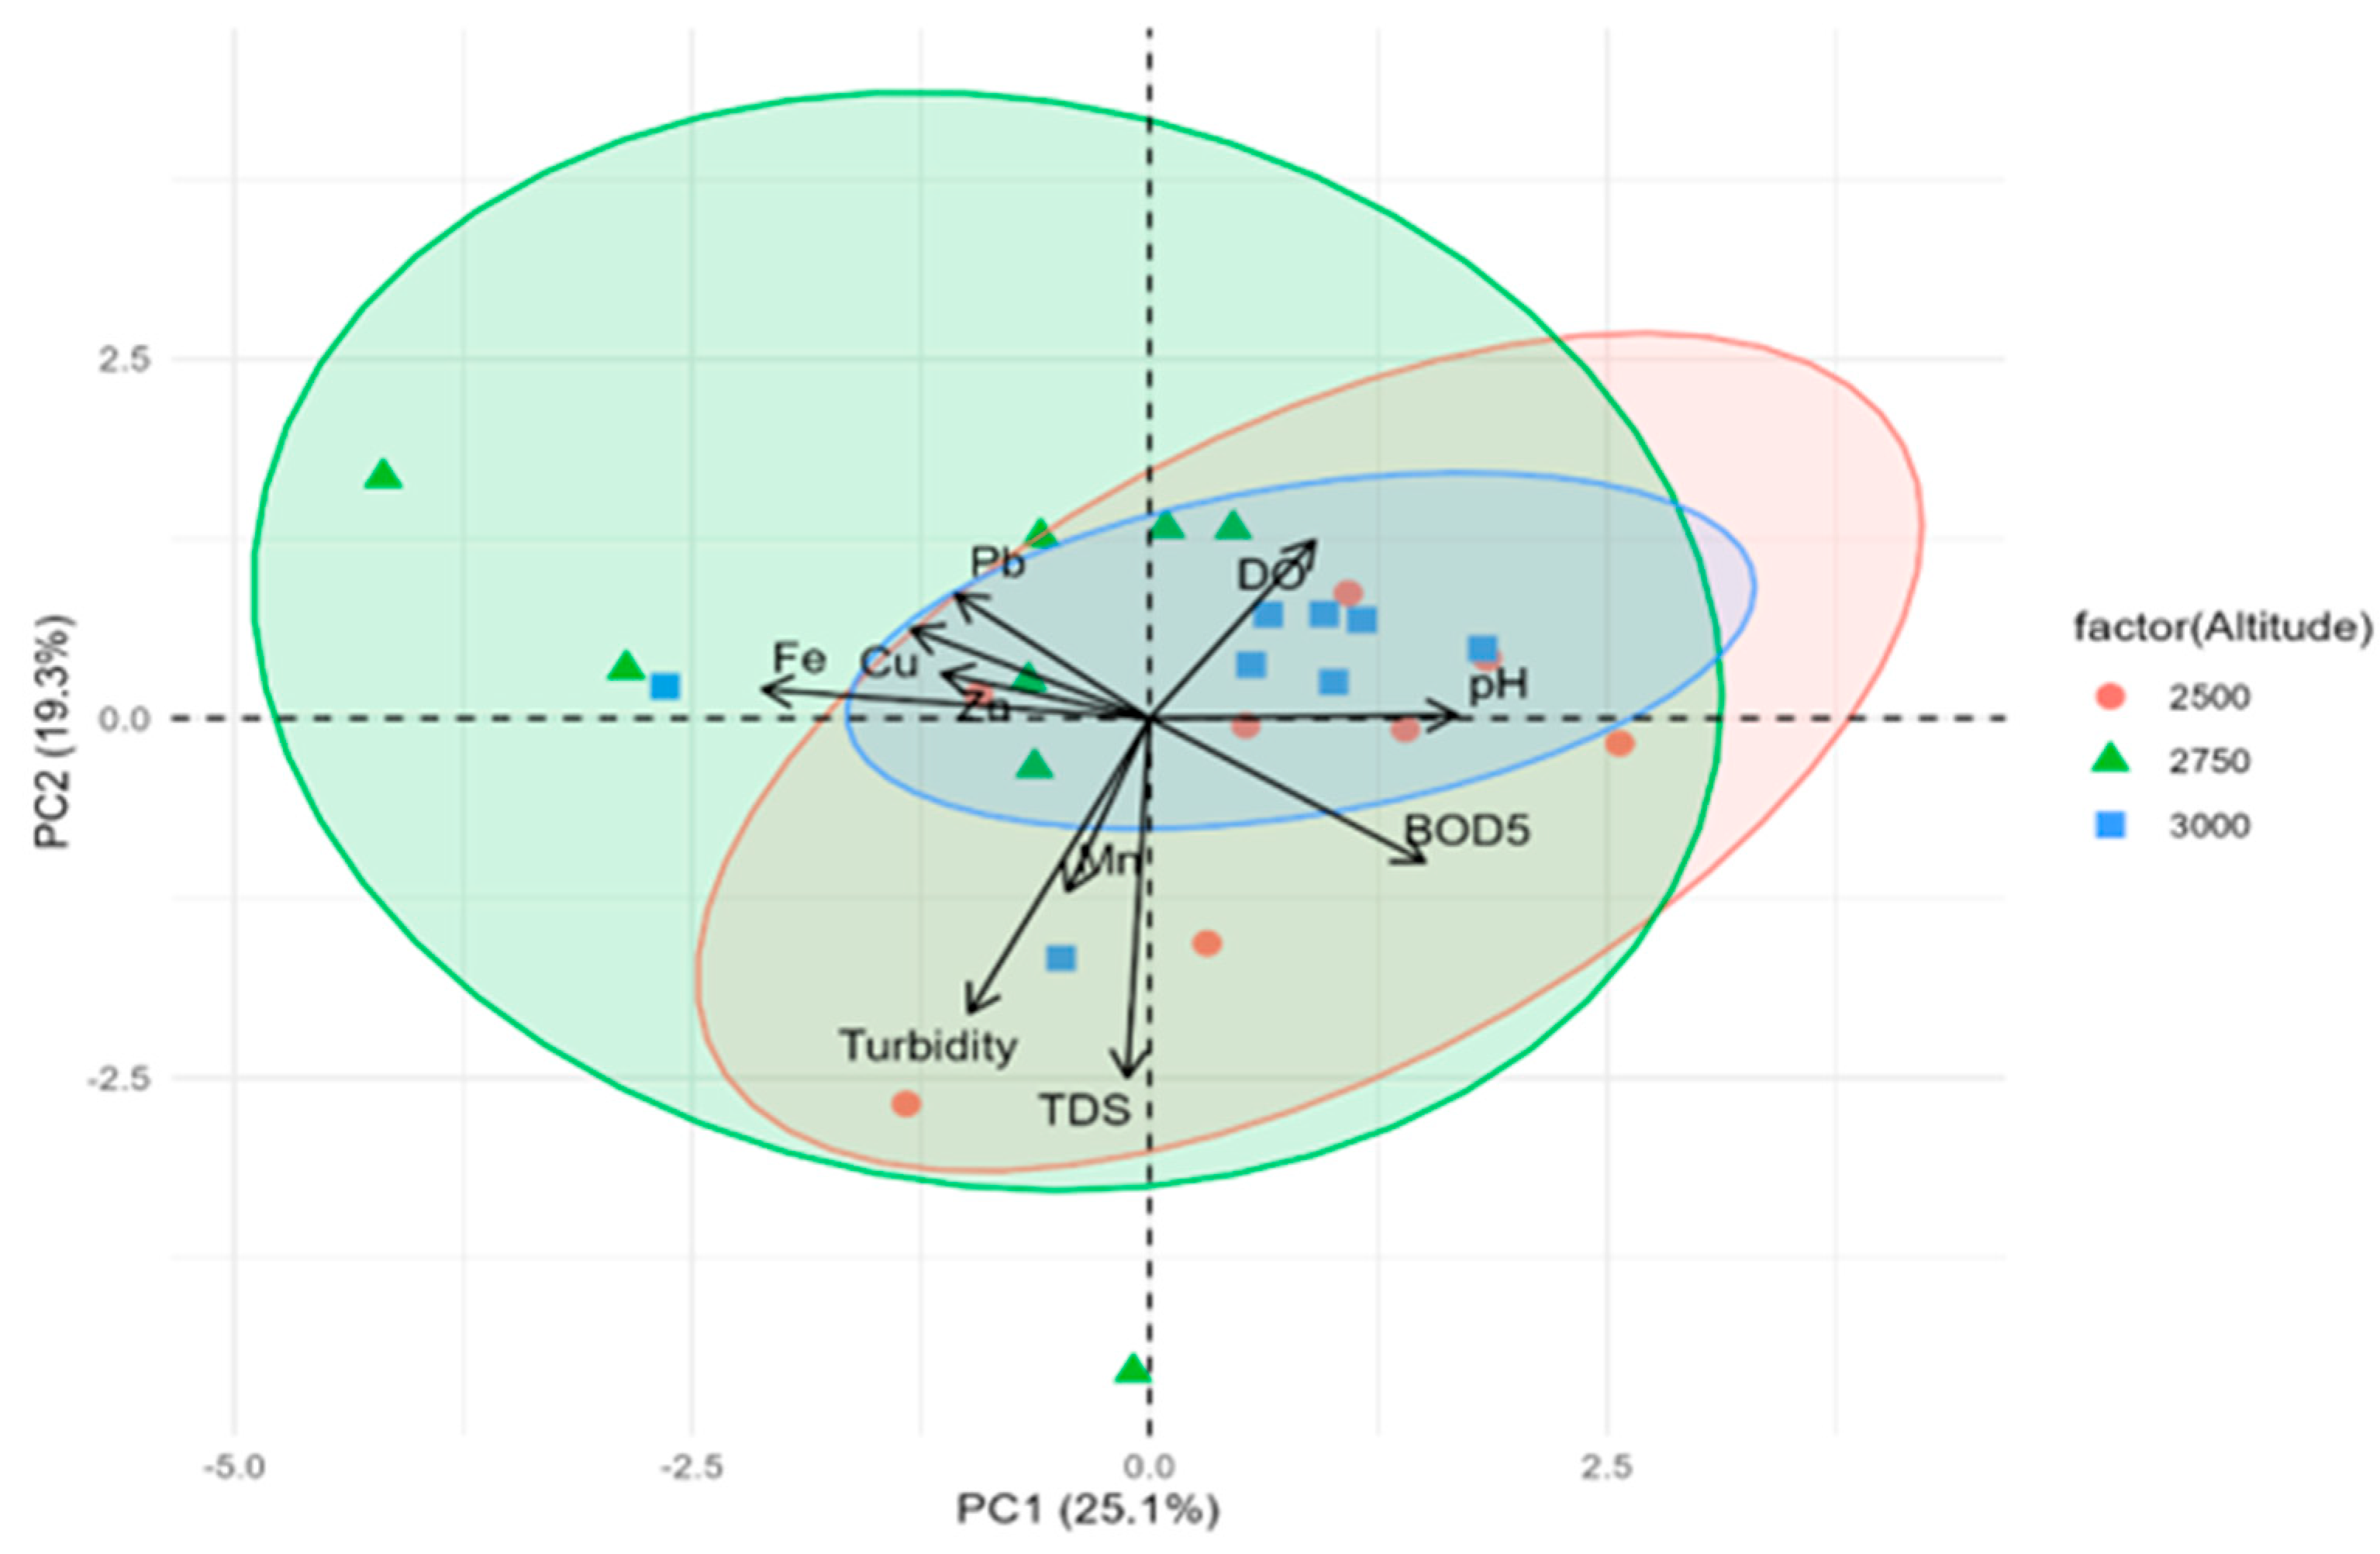
Figure 7.
RDA Triplot.
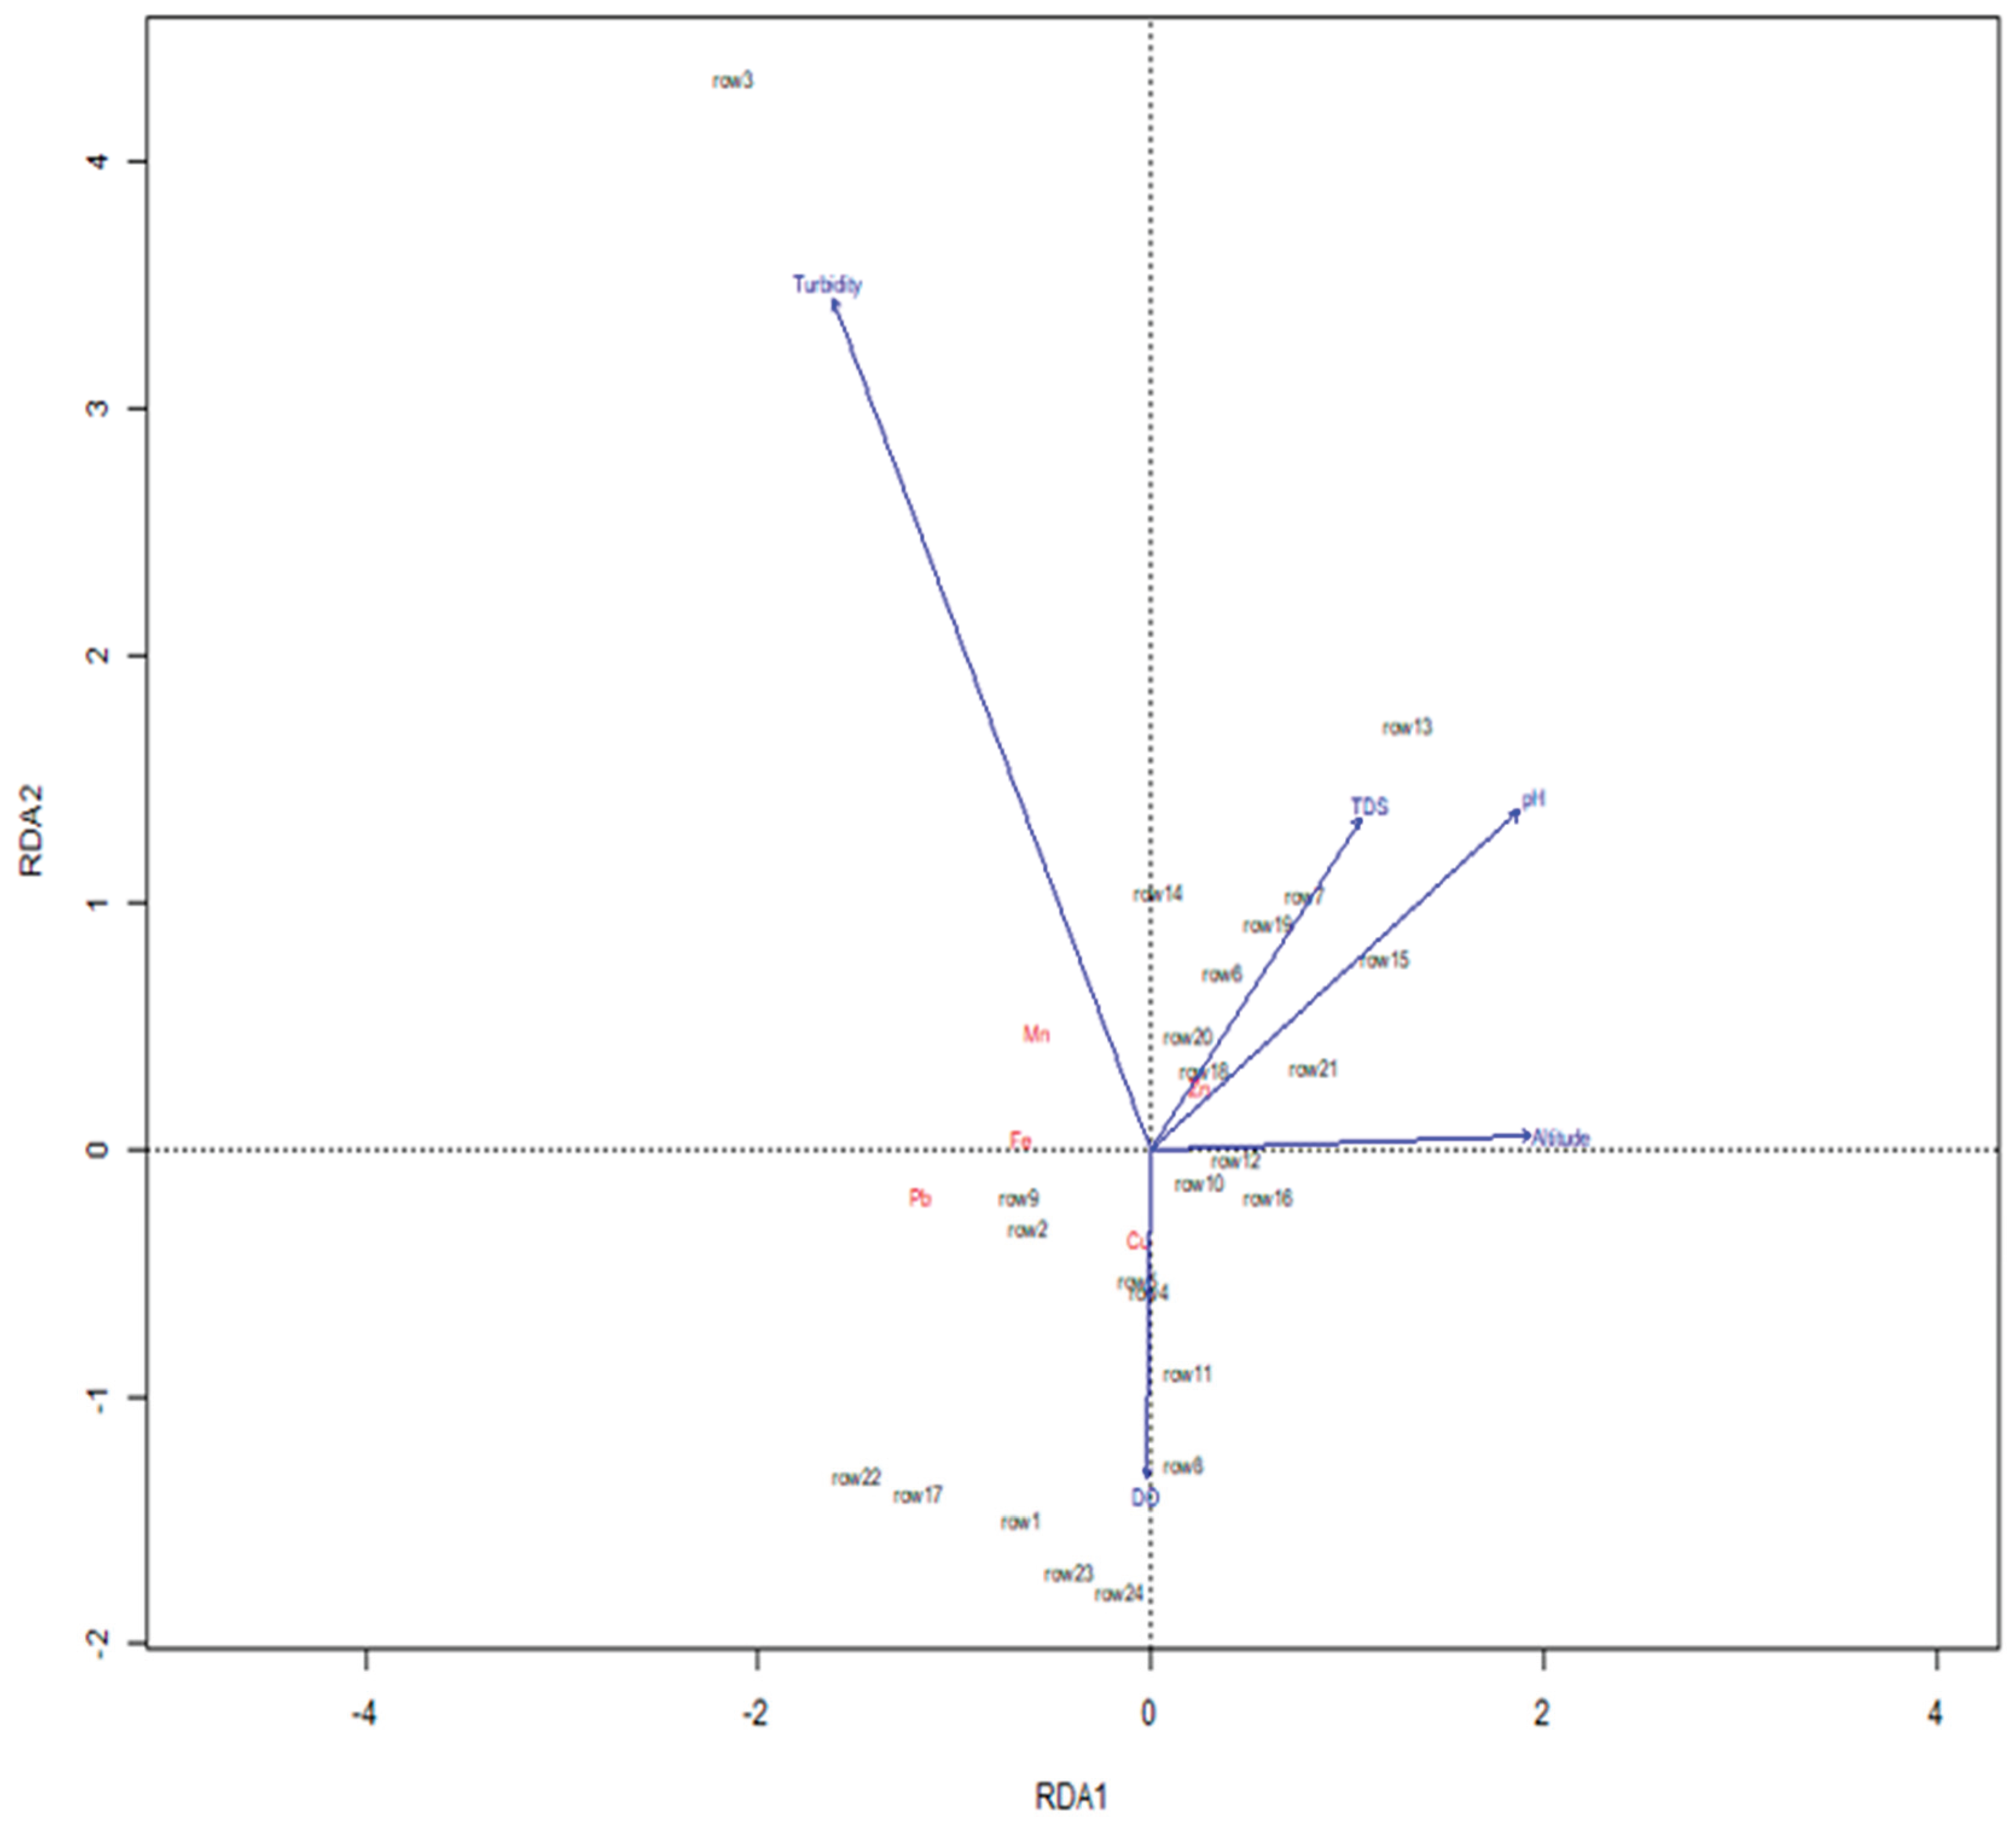
Figure 8.
Correlation Matrix.
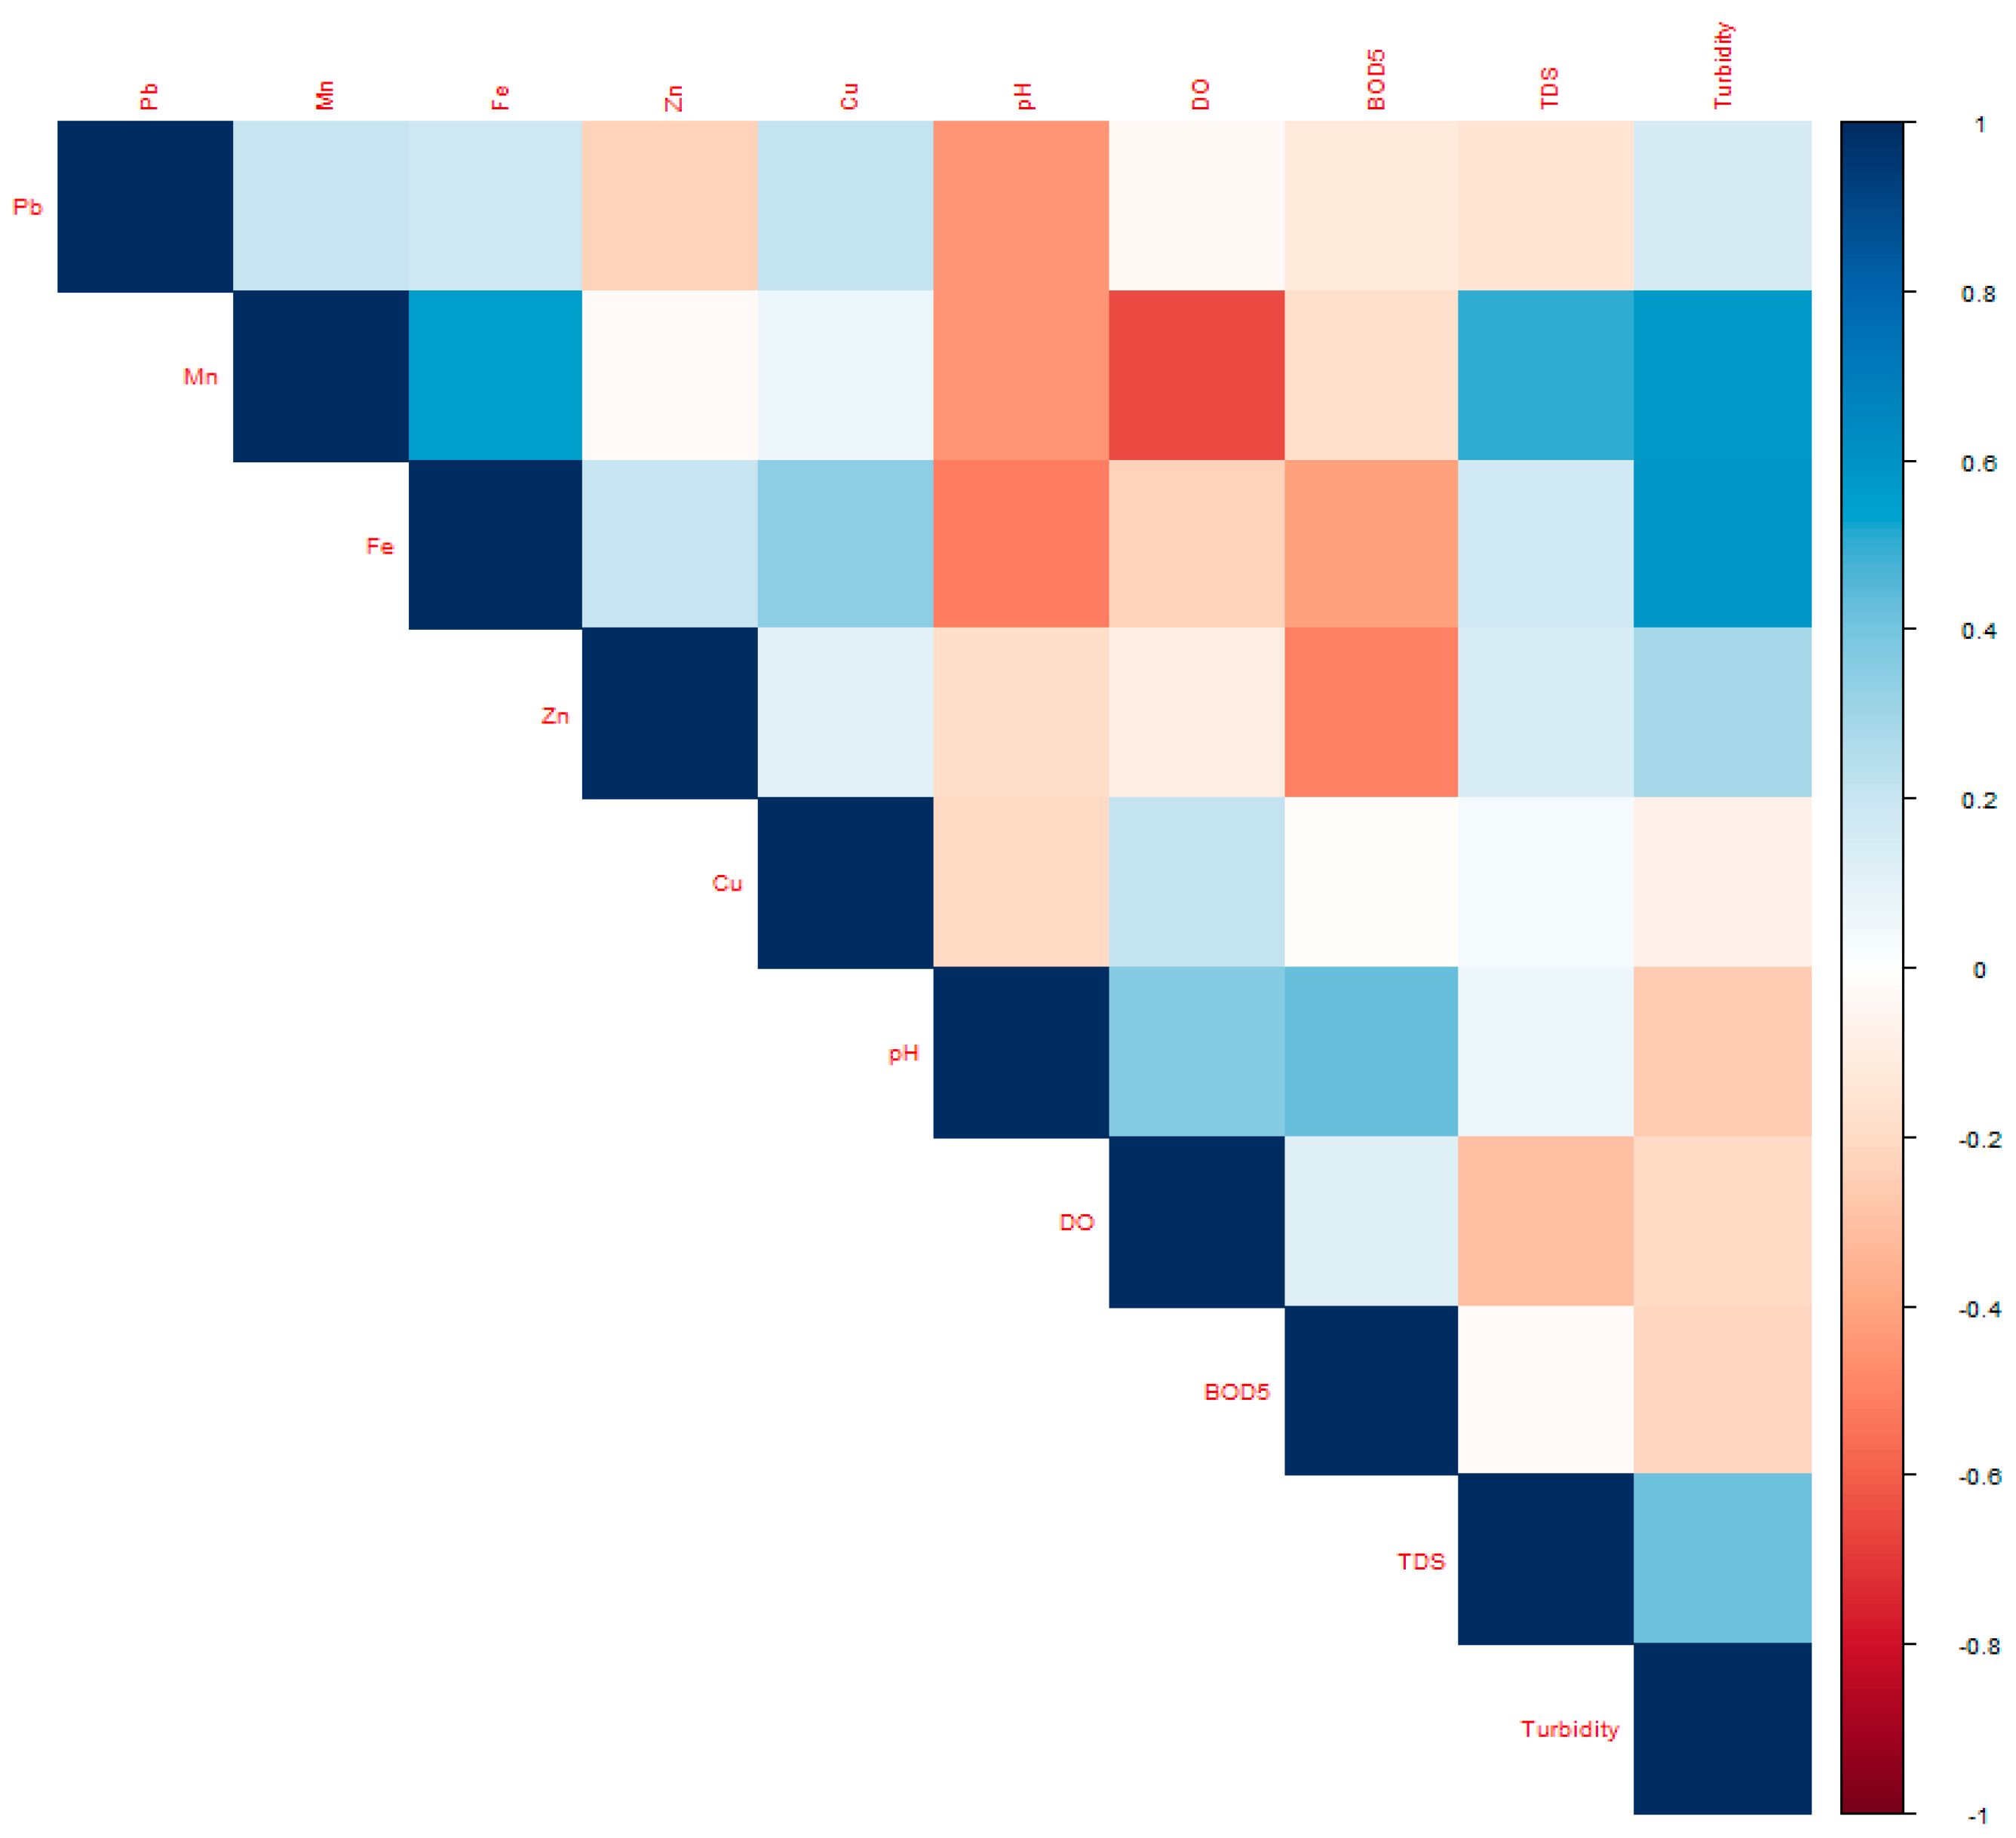

Table 1.
Elevations and geographic coordinates of the study [20] areas.
Table 1.
Elevations and geographic coordinates of the study [20] areas.
| Sub -catchment | Wetlands | Coordinates | Altitude (masl) | |
|---|---|---|---|---|
| Latitude | Longitude | |||
| Senqunyane | Khorong | −29.43708 | 28.26923 | 2500-2550 |
| Tenesolo | −29.44836 | 28.14759 | 2552-2600 | |
| Khubelu | Letšeng - La- Likhama | −29.076355 | 28.836095 | 3040-3800 |
| Koting -sa-ha Raramosetsana | −29.022686 | 28.871324 | 3087-3155 | |
| Sani Pass | Sani Top | −29.563552 | 29.247207 | 2891-2995 |
| Khamoqana | −29.457178 | 28.268094 | 2839-2880 | |
Table 2.
Drinking Water Permissible Limits [37].
Table 2.
Drinking Water Permissible Limits [37].
| Metal | WHO Limit (mg/L) |
|---|---|
| Lead (Pb) | 0.01 |
| Manganese (Mn) | 0.40 |
| Iron (Fe) | 0.30 |
| Zinc (Zn) | 3.00 |
| Copper (Cu) | 2.00 |
Table 3.
Water Quality PLI Categories.
| PLI score | Category |
|---|---|
| 0–1 | Unpolluted |
| 1–2 | Slightly polluted |
| 2–3 | Moderately polluted |
| 3–5 | Highly polluted |
Table 4.
Water Quality HPI Categories.
| HPI score | Category |
|---|---|
| 0–20 | Excellent |
| 21–40 | Good |
| 41–60 | Moderate |
| 61–80 | Bad |
| 81–100 | Severe |
Table 5.
Descriptive statistics results.
| Parameters | Mean | Std deviation | Median | Minimum | Maximum | Range | Skew |
|---|---|---|---|---|---|---|---|
| Pb | 0.11 | 0.06 | 0.11 | 0.00 | 0.26 | 0.26 | 0.12 |
| Mn | 49.46 | 236.99 | 0.04 | 0.00 | 1162.00 | 1162.00 | 4.30 |
| Fe | 0.98 | 1.63 | 0.15 | 0.01 | 6.59 | 6.58 | 1.97 |
| Zn | 0.09 | 0.05 | 0.08 | 0.02 | 0.20 | 0.18 | 0.36 |
| Cu | 0.01 | 0.01 | 0.01 | 0.00 | 0.03 | 0.03 | 1.27 |
| Turbidity | 201.90 | 312.56 | 40.80 | 0.00 | 954.00 | 954.00 | 1.37 |
| EC | 196.75 | 186.11 | 133.50 | 58.00 | 883.00 | 825.00 | 2.29 |
Table 6.
Pollution Load Index (PLI) by wetlands.
| Site | PLI | Pollution Level |
|---|---|---|
| Tenesolo | 3.04 | Highly high |
| Khorong | 1.04 | Slightly polluted |
| Letša-la-Likhama | 1.57 | Slightly polluted |
| Koting -sa-ha Raramosetsana | 1.33 | Slightly polluted |
| Khamoqana | 2.23 | Moderately polluted |
| Sani Top | 5.54 | Very highly polluted |
Table 7.
Heavy Metal Pollution Index (HPI) by site.
| Site | HPI | Interpretation |
|---|---|---|
| Tenesolo | 1,705.8 | Critically Polluted (≫100) |
| Khorong | 847.1 | Highly Polluted |
| Letša-la-Likhama | 951.3 | Highly Polluted |
| Koting -sa-ha Raramosetsana | 565.2 | Highly Polluted |
| Khamoqana | 1,058.2 | Critically Polluted |
| Sani Top | 1,451.4 | Critically Polluted |
Disclaimer/Publisher’s Note: The statements, opinions and data contained in all publications are solely those of the individual author(s) and contributor(s) and not of MDPI and/or the editor(s). MDPI and/or the editor(s) disclaim responsibility for any injury to people or property resulting from any ideas, methods, instructions or products referred to in the content. |
© 2026 by the authors. Licensee MDPI, Basel, Switzerland. This article is an open access article distributed under the terms and conditions of the Creative Commons Attribution (CC BY) license (http://creativecommons.org/licenses/by/4.0/).
Copyright: This open access article is published under a Creative Commons CC BY 4.0 license, which permit the free download, distribution, and reuse, provided that the author and preprint are cited in any reuse.


