
Submitted:
05 January 2026
Posted:
06 January 2026
You are already at the latest version
Abstract
Accurate detection of buried utilities and reliable characterization of shallow subsurface conditions are critical requirements in civil and industrial engineering projects, particularly in urban areas developed over conductive clay–marl formations. In such environments, commonly used electromagnetic techniques often fail due to severe signal attenuation, increasing uncertainty during excavation and infrastructure planning.
This study presents a high-resolution engineering workflow based on Electrical Resistivity Tomography (ERT) for the simultaneous detection of buried stormwater and sewer pipes and the geotechnical characterization of shallow subsurface materials. The methodology was applied in an industrial area southwest of Pamplona (Navarra, Spain), where Eocene marls and clays dominate the geological setting. Three ERT pro-files, each 23.5 m long, were acquired using a pole–dipole array with a dense electrode spacing of 0.5 m, allowing decimetric-scale resolution and investigation depths of up to 7–8 m. Data were processed and inverted using both smooth (L2-norm) and robust (L1-norm) inversion schemes to evaluate their influence on anomaly detection and stratigraphic imaging.
The resulting resistivity models clearly identified elongated conductive and resistive anomalies corresponding to known buried sewer and stormwater pipes, despite the highly conductive background. In addition, the ERT sections revealed lateral and vertical variations within the clay–marl sequence, including sandy and compact detrital facies of direct relevance for foundation design and excavation planning. Borehole data available in the study area corroborated the geophysical interpretation. A complementary Ground Penetrating Radar (GPR) survey confirmed the ineffectiveness of electromagnetic methods under the same conditions due to rapid signal attenuation.
Rather than focusing solely on utility detection, the proposed approach frames ERT as a dual-purpose engineering tool capable of providing continuous subsurface infor-mation that bridges the gap between sparse borehole data and construction needs. The workflow presented here is transferable and scalable, offering a practical protocol for urban and industrial projects in conductive soils where conventional techniques are limited.
Keywords:
buried utilities detection
; subsurface mapping
; urban geophysics
; clay-rich soils
1. Introduction
The identification and characterization of buried infrastructures constitute one of the main challenges in applied geophysics for civil engineering. The increasing complexity of urban and industrial environments, together with the growing demand for new infrastructures such as roads, pipelines, or buildings, has emphasized the need for non-invasive techniques capable of detecting underground utilities and characterizing the ground prior to excavation works [1]. In particular, the accurate mapping of stormwater and sewer pipes is essential, since their unawareness or accidental damage during construction can lead to significant delays, economic losses, and environmental problems related to wastewater discharge [2].
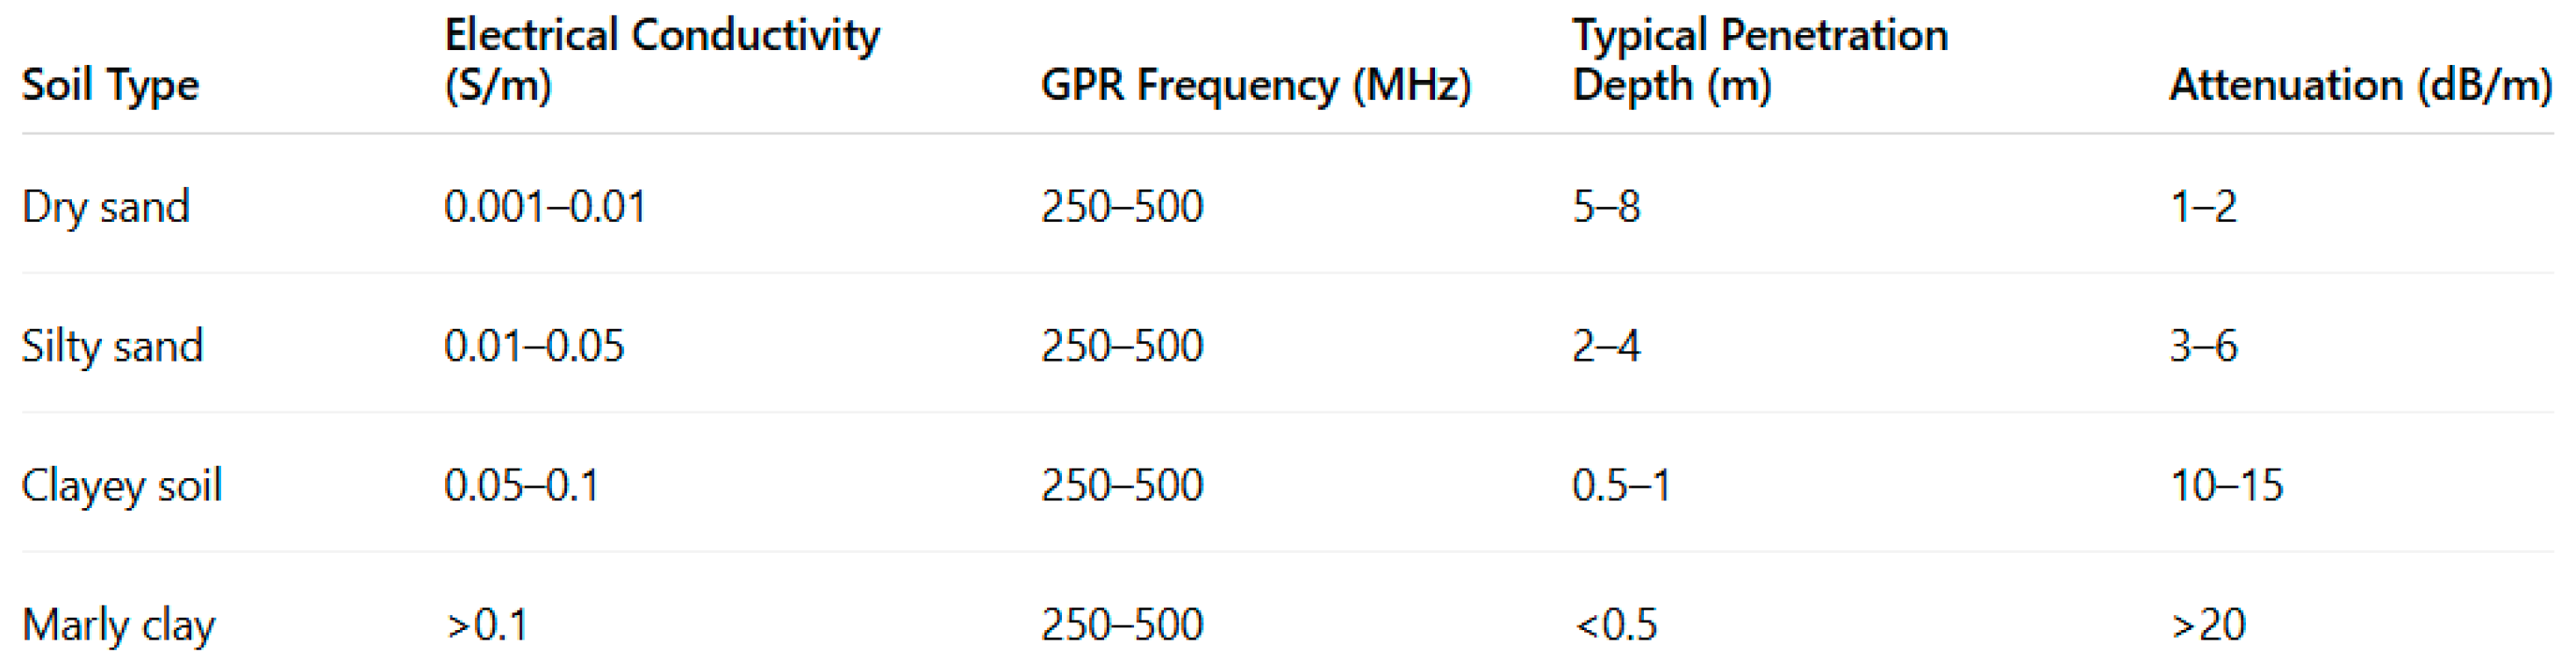
Among the available near-surface geophysical methods, Ground Penetrating Radar (GPR) has become one of the most commonly applied due to its high spatial resolution and the ability to produce rapid subsurface images [3,4]. However, the effectiveness of GPR depends critically on the electrical properties of the soil. In clay-rich or marly terrains, characterized by high electrical conductivity and strong dielectric attenuation, the penetration depth of the electromagnetic signal is severely limited, often reduced to a few decimeters [5,6]. The strong attenuation of radar waves in these materials is related to the high ionic content and water saturation of fine-grained soils, which cause conductive losses and dispersion [7]. Several studies have shown that, under these conditions, GPR surveys are frequently unable to detect buried structures located more than one meter below the surface [8]. Quantitative analyses in the literature show that the attenuation coefficient of electromagnetic waves in fine-grained soils can exceed 10–20 dB/m for frequencies between 250 and 500 MHz, limiting effective penetration to less than 0.5–1.0 m in highly conductive clays (conductivity > 0.1 S/m) [3,5,6,7]. In contrast, in dry sands or gravels, attenuation values below 2 dB/m allow penetration depths exceeding 5–8 m [4,6]. Table 1 summarizes representative values of penetration depth and signal attenuation reported for different soil types. This limitation was experimentally confirmed in the present study by performing a GPR survey under the same site conditions, where signal attenuation prevented the detection of buried structures.
To overcome these limitations, alternative geophysical methods based on different physical principles have been explored. Among them, electrical techniques, and particularly Electrical Resistivity Tomography (ERT), have gained increasing attention over the last two decades [9]. ERT consists of injecting direct or quasi-direct current into the subsurface and measuring potential differences at the surface, from which two or three dimensional resistivity models can be derived [10,11]. Unlike GPR, which relies on the propagation of high-frequency electromagnetic waves, ERT is governed by the distribution of electrical currents in the ground and is therefore less affected by dielectric attenuation or high moisture content [12]. As a result, ERT can provide useful information even in highly conductive environments dominated by clays or marls, where other methods such as radar are ineffective [13,14].
Other geophysical techniques, such as magnetic prospecting, can also be effective for detecting metallic or reinforced concrete utilities, offering fast and low-cost field surveys. However, magnetic methods do not provide information about the surrounding materials or the geometry and dimensions of the buried structures, which were key aspects in this research. For these reasons, Electrical Resistivity Tomography (ERT) was chosen as the most suitable technique for this case study.
Numerous applications in the literature confirm the potential of ERT in urban and industrial settings. Chambers et al. [12] demonstrated its usefulness for imaging buried metallic and concrete pipelines, while Capozzoli et al. [13] and Leucci et al. [14] showed that resistivity contrasts can reveal subsurface utilities and structural features. Additional research has highlighted that ERT can also contribute to the stratigraphic characterization of the subsurface, identifying lateral variations in detrital facies and providing information relevant to civil and geotechnical engineering [15,16,17]. Furthermore, combined ERT and GPR surveys have been used to illustrate how both methods can complement each other depending on soil conductivity and target depth [18].
In this framework, the present study aims to evaluate the applicability of Electrical Resistivity Tomography (ERT) for the detection of stormwater and sewer pipes in clay-rich soils located in the industrial area of Pamplona (Navarra, Spain). The objectives are threefold:
(1) to assess the capacity of ERT to detect and map known buried pipes under highly conductive conditions;
(2) to analyze the resistivity behavior of the marly-clayey formations typical of this region; and
(3) to explore the potential of ERT to provide additional stratigraphic information that may assist in civil engineering design and planning.
This study contributes to the ongoing discussion on the performance of GPR and ERT in conductive environments, offering a case context where radar limitations and electrical imaging capabilities can be critically analyzed within a well-documented geological framework.
Although ERT is widely recognized as a robust technique in conductive terrains, the present work does not merely compare its performance to GPR. Instead, it proposes a new operational methodology for urban and industrial geotechnical investigations in clay-rich soils, where ERT is used simultaneously for (i) the detection of buried pipes and utilities, and (ii) high-resolution geological and stratigraphic characterization relevant to civil engineering design. This dual-purpose framework, integrating dense-spacing ERT acquisition (0.5 m), inversion-scheme evaluation, GPR benchmarking, and borehole calibration, constitutes a replicable workflow specifically tailored for urban environments where traditional geotechnical reconstructions lack spatial continuity and GPR provides no usable penetration. The methodological contribution of this study therefore resides not only in reaffirming known physical principles, but in establishing a geophysical protocol that enhances and optimizes geotechnical investigations in complex conductive settings.
To clarify the methodological innovation of this study, Figure 1 presents the complete workflow developed for urban geotechnical investigations in conductive clay–marl environments. Unlike previous works that focus solely on utility detection, the methodology introduced here uses ERT as a dual-purpose tool capable of simultaneously (i) locating buried pipes and (ii) imaging the stratigraphic architecture with sufficient resolution for engineering design. This integrated workflow, combining dense-spacing ERT acquisition, QC procedures, smooth and robust inversion strategies, and geological, geotechnical interpretation, constitutes the main contribution of this research and defines a transferable protocol for civil-engineering applications in conductive terrains.
2. Materials and Methods
3.1. Study Area
The investigation was conducted near the industrial estates of Volkswagen Navarra and Arazuri–Orkoien, an area with strong industrial development and a high degree of urbanization (Figure 2). The site is characterized by geology dominated by Eocene marls and clays, interbedded with thin layers of sands and gravels, forming a medium with high electrical conductivity and low permeability [19]. These conditions, which hinder the use of Ground Penetrating Radar (GPR), provide an ideal context for evaluating the effectiveness of Electrical Resistivity Tomography (ERT).
In addition to its geological characteristics, the area presents a dense network of buried utilities (sewer, stormwater, and industrial pipelines), which poses an additional challenge for the construction of new infrastructures such as the planned railway line. The accurate location of these utilities is essential to avoid incidents during excavation and to ensure the safety of the works.
2.2. Applied Geophysical Method: Electrical Resistivity Tomography (ERT)
Resistivity Tomography (ERT) was selected as the main technique due to its suitability in conductive environments and its ability to provide two-dimensional images of subsurface resistivity (Figure 3). Unlike GPR, whose effectiveness is limited in marly and clayey terrains by strong electromagnetic wave attenuation, ERT is based on the injection of direct current into the ground and the measurement of the resulting potential differences between pairs of electrodes. This makes it less sensitive to the dielectric properties of the subsurface [20].
In this study, the pole–dipole configuration was used because it offers good vertical and lateral resolution, reaches greater depth than other configurations, allows a large number of measurements in a short time, and clearly detects elongated anomalies such as pipes [21].
2.3. Profile Design
A total of three ERT profiles were carried out, each 23.5 m long, arranged to intersect perpendicularly the known path of the pipes. The electrode spacing was 0.5 m, allowing a decimetric resolution in the models.
The profiles were designed to reach investigation depths between 7 and 8 m in their central parts, sufficient to intercept the levels where stormwater and sewer pipes are located. This depth also provided additional information about the local stratigraphy. The effective depth of investigation was estimated from the inversion model sensitivity and the Pole–Dipole array geometry computed by Electre Pro Software. For the 48-electrode layout with 0.5 m spacing, the maximum reliable depth is ~7–8 m in the central part of the spread, consistent with the theoretical sensitivity range of this array geometry [15].
Figure 4 shows the layout of the three ERT profiles together with the positions of boreholes BH-1, BH-2, and BH-3, which were used to validate the resistivity interpretation. The boreholes are located near the geophysical survey lines and provide lithological information consistent with the stratigraphic model inferred from ERT data. Their inclusion strengthens the geological interpretation and provides a more reliable correlation between geophysical and geotechnical observations.
2.4. Instrumentation
The measurements were acquired using a Syscal Pro multielectrode system (Iris Instruments), widely used in surveys. The equipment enabled automated acquisition sequences, ensuring sufficient data density for subsequent inversion.
A total of 1081 apparent resistivity measurements per profile were obtained (Figure 5), depending on the configuration used. These data were organized into pseudosections, which form the basis for the initial interpretation.
In the Syscal Pro system used in this study, typical injected currents ranged between 200 and 500 mA, depending on contact resistance, producing recorded voltages generally between a few millivolts and several hundred millivolts in clay-rich soils. These signal levels provide adequate signal-to-noise ratios for shallow ERT, particularly when combined with stacking and reciprocal measurements. For the pole–dipole array with 0.5 m spacing, the theoretical depth of investigation is approximately 7–8 m, and the intrinsic spatial resolution is on the order of one to two electrode spacings laterally, and roughly 20–25% of the investigation depth vertically. These values define the system’s measurement capability and allow realistic expectations regarding the detectability of buried pipes of the size encountered in this study.
2.5. Data Processing and Quality Control
Data processing included several steps to ensure data reliability and to obtain consistent apparent resistivity pseudosections (Figure 6). First, the raw data were visually inspected and filtered to remove spurious measurements caused by poor electrode contact, instrumental noise, or reciprocal errors exceeding 5%. When required, topographic corrections were applied using RTK-GPS data to ensure accurate representation of the surface geometry.
Additional robust filters were applied to minimize the influence of outliers without compromising the essential information contained in the dataset [22]. Both standard constrained (smooth, L2-norm) and robust (blocky, L1-norm) inversion schemes were tested to evaluate their effect on model stability and resolution (Figure 7). In general, the robust inversion enhances sharp contrasts and can be advantageous for identifying well-defined resistive or conductive bodies; however, in highly conductive environments it may also introduce artificial boundaries or noise amplification. This effect was observed, for example, in profile ERT-1, where the robust inversion exaggerated a conductive anomaly associated with the sewer pipe. Consequently, the inversion scheme was selected individually for each profile, choosing the model that best matched the local geology and the expected morphology of the pipe.
The inversion parameters (iteration number, damping factor, and convergence criteria) were kept consistent across all profiles to ensure comparable results.During all inversion processes, the Root Mean Square (RMS) misfit ranged between 2.3% and 15.4%, depending on the profile and inversion type, which is within the acceptable range reported for ERT studies [23].
The inversion of apparent resistivity data was performed using the Res2DInv software, which implements a classical least-squares Gauss–Newton optimization scheme. In this framework, the forward problem is solved iteratively and the model is updated by minimizing the misfit between measured and calculated apparent resistivities. Two regularization strategies were applied: (i) L2-norm smoothness-constrained inversion, which promotes gradual resistivity variations and produces geologically smooth models, and (ii) L1-norm (robust) inversion, which reduces the influence of outliers and enhances sharper boundaries, making it appropriate for localized anomalies such as buried pipes. Model convergence was controlled through the reduction of the RMS misfit and the stabilization of model updates, following standard criteria used in near-surface ERT applications. This algorithmic description is provided to clarify how the processed images are generated and to justify the selection of inversion schemes used in this study.
2.6. Data Inversion
The data were inverted (Figure 8) using the Res2DInv software [24], applying the least-squares inversion algorithm, which generates smooth and geologically plausible models [25]. This approach is particularly useful in sedimentary environments, where transitions are generally gradual rather than abrupt.
Both standard constrained (smooth, L2-norm) and robust (blocky, L1-norm) inversion schemes were tested to evaluate their influence on model stability and anomaly definition. Depending on the geological conditions and the morphology of each pipe, the most appropriate inversion scheme was selected for each profile. In some cases, the robust inversion enhanced the contrast of well-defined anomalies, whereas in others, the smooth inversion provided more stable and geologically consistent results. This profile-specific selection ensured optimal imaging of both the buried pipes and the surrounding stratigraphy.
3. Results
The three Electrical Resistivity Tomography (ERT) profiles acquired in the study area provided two-dimensional resistivity sections reaching investigation depths of up to 7–8 m. The resolution achieved was sufficient not only to detect the anomalies associated with the sewer and stormwater pipes, but also to characterize the predominantly marly–clayey stratigraphy of the subsurface, providing additional information of great relevance for any planned civil engineering project. The interpretation of each profile is described below.
3.1. ERT-1 Profile
The ERT-1 profile is 23.5 m long, with an electrode spacing of 0.5 m, acquired using a pole–dipole configuration. Figure 9 shows the results obtained for this survey, which display a geoelectrical model composed of several units with distinct characteristics.
The surface layer (1) is resistive in nature and consists of topsoil together with marly clays and fine gravels. Its thickness is variable, generally less than 1.20 m. Beneath this unit lies layer (2), characterized by a clearly conductive behavior with resistivity values below 20 Ω·m. It is composed mainly of fine-grained materials, predominantly marly clays and fine gravels, with an average thickness between 1 and 2 m.
Below this appears layer (3), which exhibits a resistive behavior, suggesting the presence of coarser materials, probably marly sandy clays and gravels. This layer shows an essentially horizontal morphology, consistent with a stable sedimentary arrangement.
At a depth of approximately 2.5 m in the central part of the profile, a conductive anomaly is observed, attributed to the Regional Sewer Pipe nº1, whose known dimensions are 2.10 m in height and 4.00 m in width. This anomaly stands out for its high conductivity, an opposite behavior to what would be expected (resistive). Based on our experience in similar contexts, this discrepancy could be related to possible leakages in the pipe or to a high density of structural reinforcement within it.
It should be emphasized that the interpretation of this conductive anomaly as a result of structural reinforcement or potential leakage is only a working hypothesis. No independent evidence confirming these mechanisms is available, and therefore this explanation must be considered speculative and acknowledged as a limitation of the interpretation.
3.2. ERT-2 Profile
The ERT-2 profile is 23.5 m long, with an electrode spacing of 0.5 m, also acquired using the pole–dipole configuration. Figure 10 shows the results obtained for this survey, which reveal a geoelectrical model composed of several units with well-defined characteristics.
The surface layer (1) is resistive and composed of topsoil, marly clays, and gravels. Its thickness is variable, generally less than 2.50 m. Below this layer, layer (2) develops, showing a conductive behavior with resistivity values below 30 Ω·m. It consists of fine-grained materials, mainly marly clays with scattered gravels, and exhibits an essentially horizontal morphology.
At an approximate depth of 2.8 m, a resistive anomaly was identified, associated with the Volkswagen Factory Stormwater Pipe, whose known dimensions are 2.00 m in height and 2.00 m in width. This anomaly clearly corresponds to the mentioned underground structure, showing a significant contrast with the surrounding materials.
3.3. ERT-3 Profile
The ERT-3 profile is 23.5 m long and was acquired with the same electrode spac-ing and configuration as the previous ones. Figure 11 shows the results obtained for this survey, where a geoelectrical model with distinct and clearly differentiated units can be observed.
The surface layer (1) exhibits conductive behavior and consists of topsoil, clays, and fine gravels. Its thickness is variable, generally less than 1.20 m. Below this unit lies layer (2), of resistive nature, with resistivity values above 50 Ω·m. It is composed of slightly coarser materials, mainly clays and gravels, with an average thickness of about 3 m.
Below this, a third and more conductive unit, layer (3), is identified and inter-preted as a marly limestone level.
At an approximate depth of 1.85 m, a resistive anomaly is detected, associated with the Regional Sewer Pipe nº2, whose known dimensions are 2.00 m in height and 3.00 m in width. Moreover, in the field pseudosection shown in Figure 6, the anomaly produced by this pipe can be clearly distinguished, a rare occurrence before pseudosection processing, demonstrating the high quality of the data acquisition.
3.4. GPR Profile
In order to complement the ERT survey and to verify the radar response under the same subsurface conditions, a Ground Penetrating Radar (GPR) profile was acquired parallel to the ERT-3 line (Figure 12). The measurements were carried out using a MALA X3M system equipped with 250 MHz and 500 MHz antennas, and processed with Reflex2DQuick software.
The resulting radargrams clearly show a strong signal attenuation within the first 0.5–0.8 m, characterized by flat and diffuse reflectors, indicating the absence of penetration below this depth. This behavior is consistent with the high electrical conductivity of the marly–clayey materials that dominate the site. The loss of high-frequency energy and the lack of well-defined hyperbolic reflections confirm that GPR is ineffective in this environment, even when using different frequency antennas.
These results validate the interpretation that ERT is the only technique capable of resolving the buried pipes in such conductive soils and provide direct evidence of the limited applicability of GPR in the study area.
3.5. General Interpretation
The apparent resistivity pseudosections showed a pattern dominated by low resistivity values (<50 Ω·m) across all profiles, consistent with the marly–clayey nature of the subsurface. Against this conductive background, localized and elongated anomalies were observed, with significantly higher or lower resistivity values, interpreted as the sewer and stormwater pipes. The strong resistivity contrast between these structures and the surrounding matrix enabled their clear identification in all three profiles.
In addition to the anomalies associated with the pipes, lateral resistivity variations were observed, attributable to facies changes within the detrital sequence. These transitions reflect the presence of interbedded sandy and compact silt layers, providing valuable information for understanding the mechanical heterogeneity of the ground.
Overall, the three profiles confirmed the location of the stormwater and sewer pipes, showing excellent agreement with their known construction characteristics. ERT not only enabled the detection of these structures but also provided geoelectrical cross-sections that reveal stratigraphic details impossible to obtain with other methods in such conductive soils.
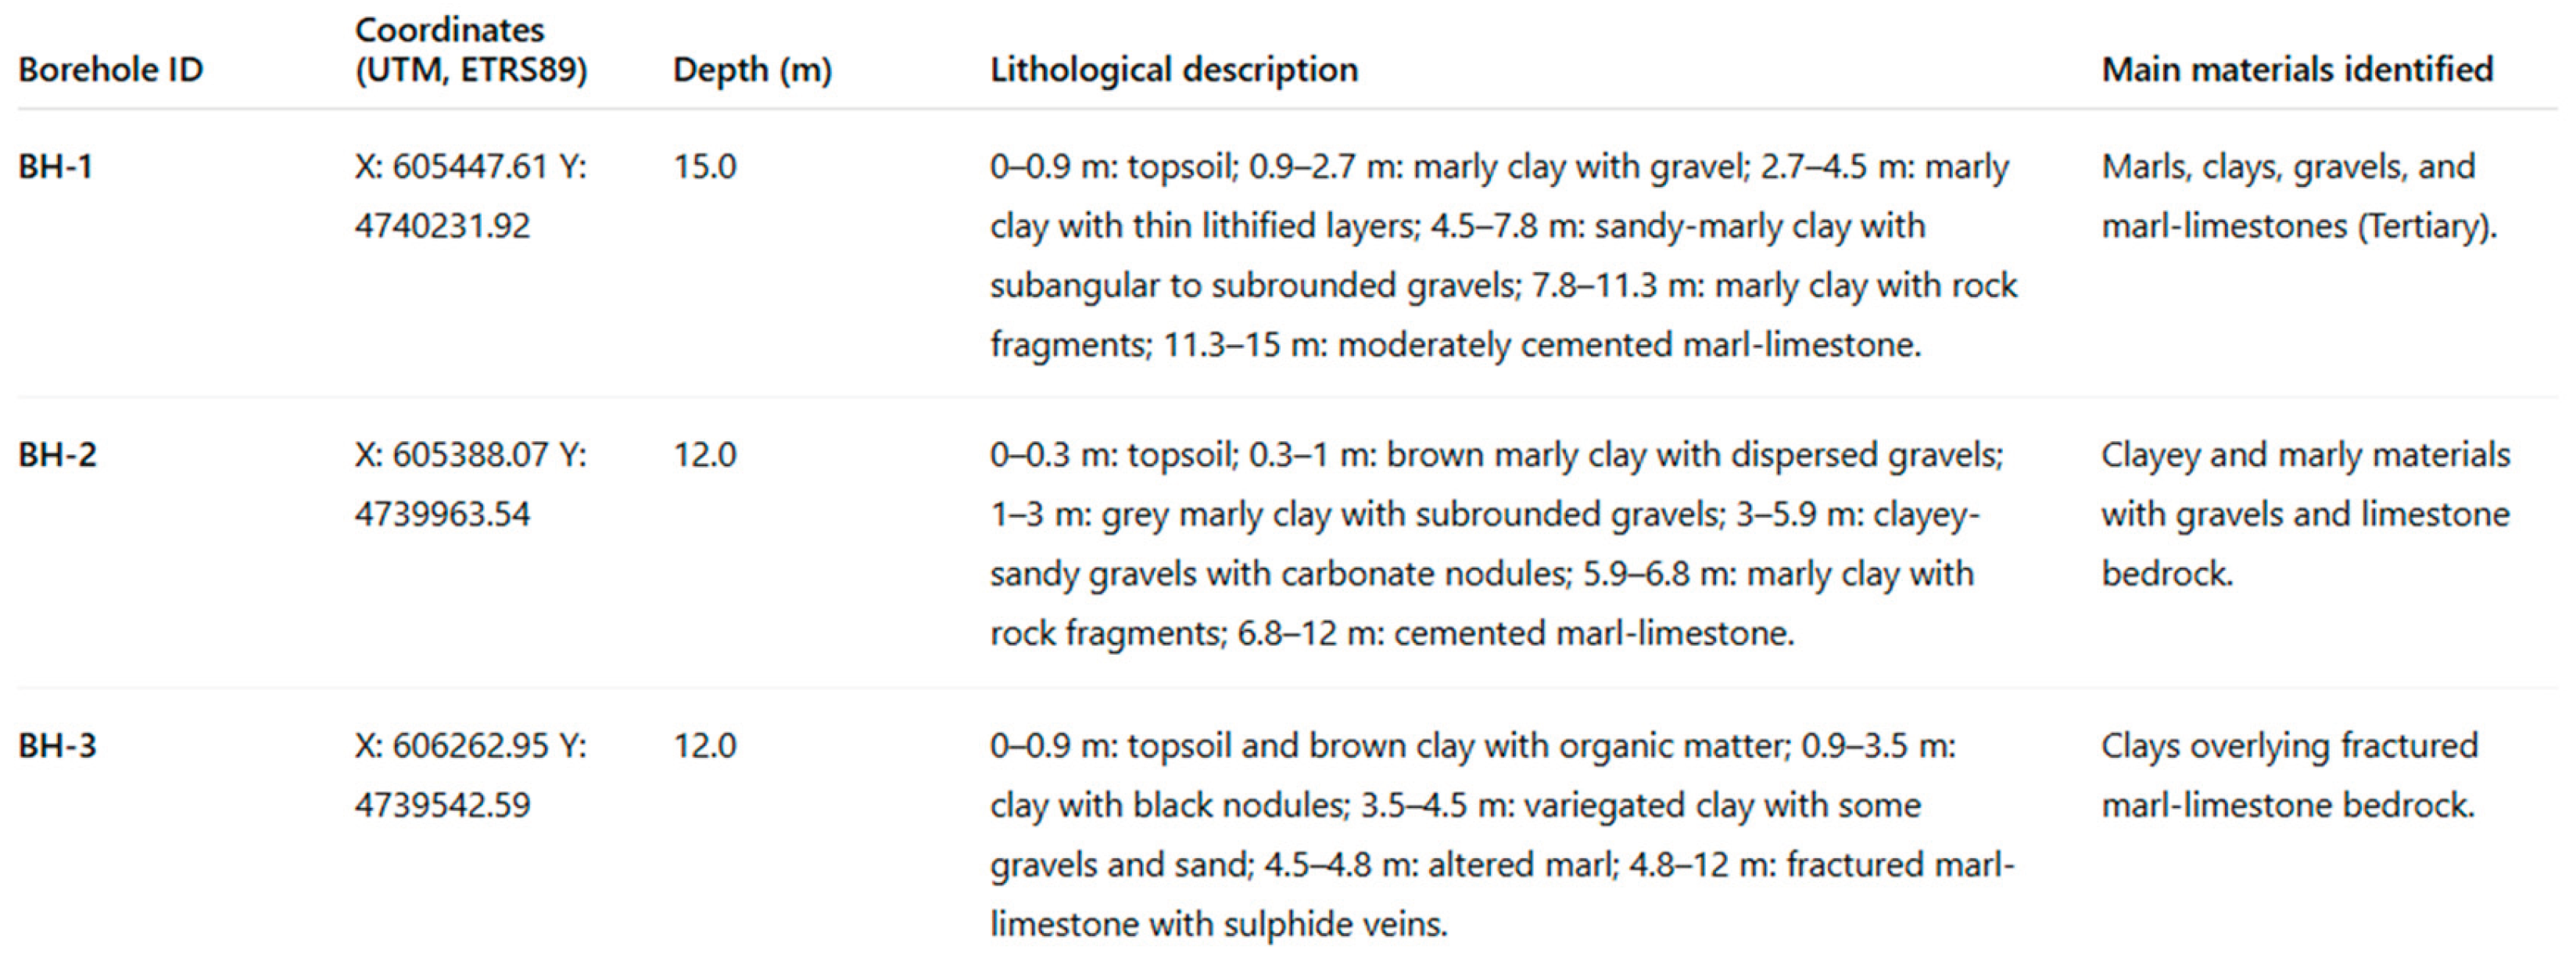
To validate the ERT interpretations, three boreholes located in the vicinity of the survey lines were considered (Table 2). The lithological logs confirm the stratigraphic model inferred from resistivity data, showing alternating layers of marly clays, sandy-marly deposits, and moderately cemented marl-limestone bedrock. The presence of clayey and marly materials with variable gravel content explains the relatively low resistivity values recorded in the upper 8 m, while the transition to cemented marl-limestone corresponds to the resistive layers identified in the inverted sections. These correlations provide ground truth support to the geophysical interpretation.
The spatial relationship between the ERT lines and the borehole locations is shown in Figure 4.
It should be noted that the borehole information used in this study is limited to three locations and is therefore not intended as a statistical validation dataset. Instead, the boreholes provide qualitative geological control that supports the main stratigraphic trends inferred from ERT, and their use is restricted to confirming the consistency of the interpreted units rather than establishing quantitative correlations.
4. Discussion
The inherent limitations of Ground Penetrating Radar (GPR) in clayey and marly environments are well documented in the geophysical literature. The high electrical conductivity of these materials causes strong attenuation of the high-frequency electromagnetic signal, drastically reducing both the penetration depth and the effective resolution of the method [5,6,18]. In soils with clay contents exceeding 15–20%, the GPR signal can be completely attenuated within the first few decimeters, making it impossible to detect buried infrastructures located several meters deep [7]. This phenomenon explains the ineffectiveness of radar in the study area, where the subsurface is dominated by high-conductivity marls and clays.
Under these specific geological conditions, Electrical Resistivity Tomography (ERT) emerges as a robust and efficient alternative, as it is based on a different physical principle, the controlled injection of electrical current, and does not depend on the propagation of electromagnetic waves, which are severely attenuated by the high dielectric permittivity of the medium [9,10]. In this study, ERT successfully identified the position of the stormwater and sewer pipes, demonstrating its suitability in contexts where GPR would have been inoperative.
The reliability of the applied methodology is supported by the consistency of the results obtained from the different profiles, which revealed well-defined conductive and resistive anomalies consistent with the known locations of the pipes. This consistency is further supported by the correlation between the resistivity models and the lithological descriptions obtained from the three boreholes. The borehole descriptions confirm that the lower resistivity values are associated with fine-grained clayey materials, whereas higher resistivity values correspond to sandy or marl-limestone layers. This quantitative agreement between ERT-derived resistivities and borehole lithologies provides a strong validation of the inversion approach and enhances the reliability of subsurface characterization
Both standard constrained (smooth, L2-norm) and robust (blocky, L1-norm) inversion schemes were tested to evaluate the influence of regularization on subsurface imaging. The results showed that each inversion type performed differently depending on the geological context and the morphology of the pipe. In some profiles, the robust inversion enhanced the definition of sharp contrasts and provided clearer boundaries of the buried structures. However, such as in Profile ERT-1, the robust inversion also introduced artificial boundaries and exaggerated conductive anomalies. In these cases, the smooth inversion produced more stable and geologically consistent models, better representing the gradual resistivity transitions expected in the subsurface. Therefore, the inversion scheme was selected individually for each profile, according to its geological characteristics and the expected morphology of the pipe, ensuring the most realistic imaging of both the infrastructures and the surrounding stratigraphy.
Although the conductive anomaly observed in Profile ERT-1 may also be influenced by local variations in soil moisture or water accumulation within the ditch, its geometry and position coincide precisely with the documented sewer pipe, supporting this interpretation. Nevertheless, performing an additional ERT line in the vicinity could have provided further confirmation, and this limitation is acknowledged. In addition, the conductive anomaly detected in Profile ERT-1, corresponding to a structure made of concrete, may appear counterintuitive since concrete is usually resistive. This behavior can be explained by several factors: possible water leakage from the pipe, the presence of steel reinforcement increasing the electrical conductivity, or the accumulation of moisture in the surrounding soils. Considering these factors, the interpretation remains consistent with the known position and characteristics of the sewer pipe and reinforces the methodological applicability of ERT for similar civil engineering contexts. Nevertheless, these explanations should be considered hypothetical, as no direct evidence confirming the presence of leakage or reinforcement was available.
The quantitative analysis of resistivity values supports the geological interpretation obtained from the ERT profiles. In the study area, resistivity values below 30 Ω·m are associated with clayey–marly layers rich in water and ions, whereas intermediate values between 30 and 80 Ω·m correspond to sandy–marly facies with moderate moisture content. Higher resistivity values, generally above 100 Ω·m, indicate compact limestone or cemented marl horizons. These ranges are consistent with those reported in previous studies carried out in similar geological settings [12,13,20]. This quantitative correspondence between resistivity ranges, borehole lithologies, and known subsoil behavior supports the robustness of the proposed interpretation.
The resistivity contrasts between the infrastructures and the surrounding ground are fully consistent with those reported in other studies focused on the detection of buried pipes and infrastructures in urban contexts [12,13,20]. The achieved precision is directly related to the instrumental configuration used: the reduced electrode spacing (0.5 m) provided decimetric resolution, which is essential in detailed investigations. This relationship between resolution and electrode density has been emphasized by Chambers et al. [12] and confirmed by subsequent research highlighting the need to optimize array design to maximize detection capability.
Beyond the location of pipes, one of the most valuable outcomes of this study was the ability of ERT to provide additional stratigraphic information about the subsurface. The inverted models revealed lateral transitions between marls, clays, and more compact sandy layers, highlighting lithological variations that not only enrich the geophysical interpretation but also add significant engineering value. In civil engineering projects, detailed knowledge of subsurface variability is essential, since mechanical properties such as compressibility, cohesion, and permeability are closely linked to the lithology and arrangement of materials [17]. Detecting sandy or compact detrital horizons allows anticipation of potential differential settlement problems, the design of more efficient foundations, and the identification of the need for specific drainage systems. In this way, ERT is consolidated as a multifunctional tool that not only identifies buried infrastructures but also provides a detailed geological view that complements information obtained from boreholes or test pits. This added value has also been highlighted in other studies [15,16], where ERT has been successfully applied for stratigraphic characterization.
The results of the present work also have important practical implications for civil engineering. First, the availability of accurate pipe mapping prevents accidental breakage during excavation, an event that can lead to severe economic losses, construction delays, and environmental risks associated with wastewater spills. Second, prior knowledge of the position of pipelines or drains is crucial in the planning of linear infrastructures, such as roads or railway lines, where underground interferences represent a major technical and economic constraint [2]. Moreover, the identification of stratigraphic variations provides essential information for controlling deep excavations and for designing containment and drainage systems adapted to the heterogeneity of the ground.
In these environments, the methodology can be effectively applied to the location of water supply and sewer networks, helping to prevent damage during renovation works or the installation of new utilities. Additionally, although it was not the focus of this study, the ability of ERT to detect resistive anomalies in conductive media opens possibilities for its application in preventive archaeology, where GPR often proves ineffective.
Comparison with other geophysical techniques highlights the advantages of ERT in such contexts. Although methods such as seismic refraction or microgravity can provide complementary information on mechanical properties or subsurface density, none offers the electrical resolution necessary to discriminate pipes or pipelines in clayey soils. In this study, a GPR profile acquired parallel to ERT-3 confirmed this limitation, showing total signal attenuation within the first meter of depth, with no detectable reflection associated with the pipes. From an operational standpoint, the choice of method should be based on a cost–benefit analysis: while ERT requires more acquisition time than GPR, in high-conductivity environments it is, in practice, the only technique capable of meeting both detection and characterization requirements.
The experience gained in this study confirms the replicability of the methodology in different scenarios. Its relatively low cost, equipment portability, rapid deployment, and robust results make it a technique that can be easily scaled to a wide range of projects.
Despite the satisfactory results, some inherent limitations of the method must be acknowledged. The maximum depth reached (around 7–8 m) is adequate for pipe detection but insufficient for characterizing deeper or large-scale structures. The resolution depends directly on the electrode spacing, which implies that studies requiring greater horizontal coverage will demand more complex logistics. Moreover, the interpretation of resistivity anomalies must always be validated against previous documentation or direct field information, since in some cases, resistivity variations may be caused by fill materials, abandoned pipes, or other unidentified structures.
These limitations do not diminish the value of the method but rather highlight the need to integrate ERT with auxiliary information (boreholes, geotechnical tests, construction models) in civil engineering projects. Within this framework, Electrical Resistivity Tomography stands out as an effective, reproducible, and versatile technique that significantly enhances the capacity of applied geophysics to solve real-world problems of planning, construction, and infrastructure management in complex environments.
The core contribution of this work extends beyond confirming the superior performance of ERT over GPR in clay-rich soils. What this study introduces is a new integrated methodology whereby ERT becomes a geotechnical tool capable of resolving both the presence of buried pipes and the lateral/vertical lithological heterogeneity that controls geomechanical behavior. Unlike most applied studies, the present work frames ERT not as a utility-detection method alone, but as a high-resolution extension for sparse borehole data in urban corridors, providing decimetric stratigraphic imaging to depths of 7–8 m. This dual-purpose approach—pipe detection + geotechnical characterization, addresses a significant operational gap in urban engineering, where conventional methods either lack continuity (boreholes) or fail entirely (GPR).
5. Conclusions
The research carried out highlights the high potential of Electrical Resistivity Tomography (ERT) as a tool for the detection of buried pipes in geological contexts where other methods, such as Ground Penetrating Radar (GPR), fail due to the high conductivity of the subsoil. The results obtained in the three profiles executed show that ERT is not only capable of accurately identifying the position and geometry of stormwater and sewer pipes, but also provides a complementary view of the marly–clayey stratigraphy, with direct implications for the planning and execution of civil engineering projects. The resistivity contrast between the pipes and the clayey matrix allowed a clear and repeatable identification in all cases, confirming the robustness of the methodology. The complementary GPR survey verified that electromagnetic methods are not suitable for such conductive soils, supporting the exclusive applicability of ERT in this context. The agreement between ERT results and borehole data confirms the reliability of the technique for subsurface characterization in conductive clayey–marly environments
A fundamental aspect of this work is the confirmation that ERT overcomes the limitations of GPR in conductive media. In soils with significant contents of clays and marls, the radar signal is rapidly attenuated and loses penetration capacity, being limited to the first decimeters [6,7]. In contrast, the direct current injection used in ERT is not affected in the same way, allowing investigation depths sufficient to intercept the levels where the pipes are located.
The value of the applied methodology is not limited to the detection of buried services. The ability of ERT to generate detailed geoelectrical cross sections makes it a multifunctional tool, also useful for characterizing the lateral heterogeneity of materials and anticipating possible problems during the construction phase. Thus, the identification of sandy intercalations or more compact zones provides additional knowledge that complements traditional geotechnical studies and contributes to a safer management of construction works. From a practical point of view, the application of ERT in this study offers multiple advantages, such as the prevention of damage to pipes during excavations, avoiding repair costs and delays in construction, the optimization of the layout of linear infrastructures (railways, roads, hydraulic pipelines) by allowing the anticipation of buried services, support for urban planning through the location of hidden networks in cities built on clayey terrains where other techniques are ineffective, and the added value for preventive archaeology, in environments where the identification of resistive anomalies could help locate buried archaeological remains without the need for invasive excavations.
In the specific case of Navarra, the applied methodology can be easily extended to railway and road corridors or to large-scale urban projects, offering an economical and efficient solution compared to more expensive or difficult-to-implement techniques. Its transferability to other contexts with conductive soils, such as, for example, the industrial areas of the Basque Country or the marly basins of Aragón, constitutes one of its main added values, reinforcing the idea that ERT can become an operational standard in civil engineering projects in clayey and marly environments.
Both standard constrained (smooth, L2-norm) and robust (blocky, L1-norm) inversion schemes were tested, and the most suitable approach was selected for each profile according to the geological conditions. In general, the robust inversion provided more stable and geologically consistent results, ensuring accurate detection of the buried pipes and reliable subsurface characterization.
This work constitutes an example of how applied geophysics can serve as a bridge between scientific research and the practice of civil engineering. ERT not only responds to an immediate need (the location of pipes) but also opens the door to its routine use in projects of great social and economic impact, contributing to a safer, more efficient, and sustainable management of infrastructures. In conclusion, this research demonstrates that the ERT technique with Pole–Dipole configuration constitutes a highly effective and context-appropriate methodology for urban and industrial environments established on conductive soils. Its capacity to detect pipes, provide geological control, and reduce the uncertainty of works makes it a tool of great potential, replicable and transferable, destined to play a key role in the future of infrastructure planning and management.
Beyond the specific results obtained in Pamplona, the main contribution of this work lies in the formulation of a new operational methodology for high-resolution geotechnical investigations in conductive urban environments. The proposed seven-step workflow integrates dense-spacing ERT acquisition, robust and smooth inversion strategies, stratigraphic interpretation and utility detection within a single framework, providing continuous subsurface information that complements and enhances traditional borehole-based characterizations. This dual-purpose approach, simultaneously resolving geological heterogeneity and buried pipelines, offers a transferable and scalable protocol for civil-engineering projects in clay-rich terrains.
Author Contributions
Conceptualization, P.C.-G.; methodology, P.C.-G.; software, P.C.-G.; validation, P.C.-G., A.Z., J.C.-G. and J.I.C.-P..; formal analysis, P.C.-G.; investigation, P.C.-G., A.Z., J.C.-G. and J.I.C.-P.; resources, P.C.-G., A.Z., J.C.-G. and J.I.C.-P..; data curation, P.C.-G., A.Z., J.C.-G. and J.I.C.-P.;.; writing—original draft preparation, P.C.-G.; writing—review and editing, P.C.-G., A.Z., J.C.-G. and J.I.C.-P.; visualization, P.C.-G., A.Z., J.C.-G. and J.I.C.-P.; supervision, P.C.-G.; project administration, P.C.-G.; funding acquisition, P.C.-G., A.Z., J.C.-G. and J.I.C.-P.;.. All authors have read and agreed to the published version of the manuscript.
Data Availability Statement
The original contributions presented in this study are included in the article. Further inquiries can be directed to the corresponding author.
Conflicts of Interest
The authors declare no conflicts of interest.
References
- Butler, D.K. Near-Surface Geophysics; Society of Exploration Geophysicists: Tulsa, OK, USA, 2005. [Google Scholar] [CrossRef]
- Famiglietti, N.A.; Miele, P.; Massa, B.; Memmolo, A.; Moschillo, R.; Zarrilli, L.; Vicari, A. Ground Penetrating Radar (GPR) Investigations in Urban Areas Affected by Gravity-Driven Deformations. Geosciences 2024, 14, 222. [Google Scholar] [CrossRef]
- Daniels, D.J. Ground Penetrating Radar, 2nd ed.; IET: London, UK, 2004. [Google Scholar] [CrossRef]
- Reynolds, J.M. An Introduction to Applied and Environmental Geophysics, 2nd ed.; Wiley-Blackwell: Chichester, UK, 2011. [Google Scholar]
- Annan, A.P. GPR—History, Trends, and Future Developments. Subsurf. Sens. Technol. Appl. 2002, 3, 253–270. [Google Scholar] [CrossRef]
- Jol, H.M. Ground Penetrating Radar: Theory and Applications; Elsevier: Amsterdam, The Netherlands, 2009. [Google Scholar] [CrossRef]
- Cassidy, N.J. Ground Penetrating Radar Data Processing, Modelling and Analysis. In Ground Penetrating Radar: Theory and Applications; Jol, H.M., Ed.; Elsevier: Amsterdam, The Netherlands, 2009; pp. 141–176. [Google Scholar] [CrossRef]
- Bellanova, J.; Loperte, A.; Satriani, A.; Rizzo, E.; Lapenna, V. GPR and ERT Investigations in Urban Areas: The Case-Study of Matera (Southern Italy). Remote Sens. 2020, 12, 1879. [Google Scholar] [CrossRef]
- Loke, M.H. Tutorial: 2-D and 3-D Electrical Imaging Surveys. Geotomo Software. 2016. Available online: http://www.geotomosoft.com (accessed on 10 October 2025).
- Loke, M.H.; Barker, R.D. Rapid least-squares inversion of apparent resistivity pseudosections by a quasi-Newton method. Geophys. Prospect. 1996, 44, 131–152. [Google Scholar] [CrossRef]
- Griffiths, D.H.; Barker, R.D. Two-dimensional resistivity imaging and modelling in areas of complex geology. J. Appl. Geophys. 1993, 29, 211–226. [Google Scholar] [CrossRef]
- Chambers, J.E.; Ogilvy, R.D.; Kuras, O.; Meldrum, P.I.; Hollands, J. Electrical Resistivity Tomography Applied to Geologic, Hydrogeologic, and Engineering Investigations at a Former Waste-Disposal Site. Geophysics 2006, 71, B231–B239. [Google Scholar] [CrossRef]
- Capozzoli, L.; De Martino, G.; Giampaolo, V.; Perciante, F.; Rizzo, E. ERT and GPR Prospecting Applied to Unsaturated and Subwater Scenarios for Archaeological Purposes. Appl. Sci. 2022, 12, 1126. [Google Scholar] [CrossRef]
- Leucci, G.; Miccoli, I.; Barbolla, D.F.; De Giorgi, L.; Ferrari, I.; Giuri, F.; Scardozzi, G. Integrated GPR and ERT Surveys for the Investigation of the External Sectors of the Castle of Melfi (Potenza, Italy). Remote Sens. 2023, 15, 1019. [Google Scholar] [CrossRef]
- Dahlin, T.; Zhou, B. A numerical comparison of 2D resistivity imaging with 10 electrode arrays. Geophysical Prospecting 2004, 52, 379–398. [Google Scholar] [CrossRef]
- Eissa, M.A.; et al. Electrical resistivity tomography array comparisons to detect cleared-wall foundations in brownfield sites. Quarterly J. Eng. Geol. & Hydrogeology 2019, 52, 565–579. [Google Scholar]
- Alao, J.O.; Aigbogun, C.O. Detection of shallow underground targets using electrical resistivity tomography and the implications in civil/environmental engineering. Discover Applied Sciences 2024. [Google Scholar] [CrossRef]
- Carrière, S.D.; Legchenko, A.; Descloitres, M.; Boucher, M.; Jacquinet, E.; Boisson, A.; Bour, O.; de Marsily, G. Combining Electrical Resistivity Tomography and Ground Penetrating Radar to Study Geological Structuring of Karst Unsaturated Zone. J. Appl. Geophys. 2013, 94, 31–41. [Google Scholar] [CrossRef]
- Alam, M.J.B.; Ahmed, A.; Alam, M.Z. Application of Electrical Resistivity Tomography in Geotechnical and Geoenvironmental Engineering Aspect. Geotechnics 2024, 4, 399–414. [Google Scholar] [CrossRef]
- Chambers, J.E.; Wilkinson, P.B.; Uhlemann, S.; Sorensen, J.P.R.; Roberts, C.; Newell, A.J.; Ward, W.; Binley, A.; Cooper, A.H.; Merritt, A.J.; et al. 4D Electrical Resistivity Tomography Monitoring of Soil Moisture Dynamics in an Operational Railway Embankment. Near Surf. Geophys. 2014, 12, 61–72. [Google Scholar] [CrossRef]
- Griffiths, D.H.; Turnbull, J.; Olayinka, A.I. Two-Dimensional Resistivity Mapping with a Computer-Controlled Array. First Break 1990, 8, 121–129. [Google Scholar] [CrossRef]
- Loke, M.H.; Dahlin, T. A comparison of the Gauss-Newton and quasi-Newton methods in resistivity imaging inversion. Journal of Applied Geophysics 2002, 49, 149–162. [Google Scholar] [CrossRef]
- Zhou, B.; Dahlin, T. A full-range gradient survey for 2D electrical resistivity imaging. Near Surface Geophysics 2020, 18, 567–582. [Google Scholar] [CrossRef]
- Cardarelli, E.; Cercato, M.; Cerreto, A.; Di Filippo, G. Electrical resistivity and seismic refraction tomography to detect buried cavities. Geophysical Prospecting 2010, 58, 685–695. [Google Scholar] [CrossRef]
- Sasaki, Y. Resolution of resistivity tomography inferred from numerical simulation. Geophysical Prospecting 1992, 40, 453–464. [Google Scholar] [CrossRef]
Figure 1.
Conceptual methodological workflow for ERT in urban geotechnical studies.
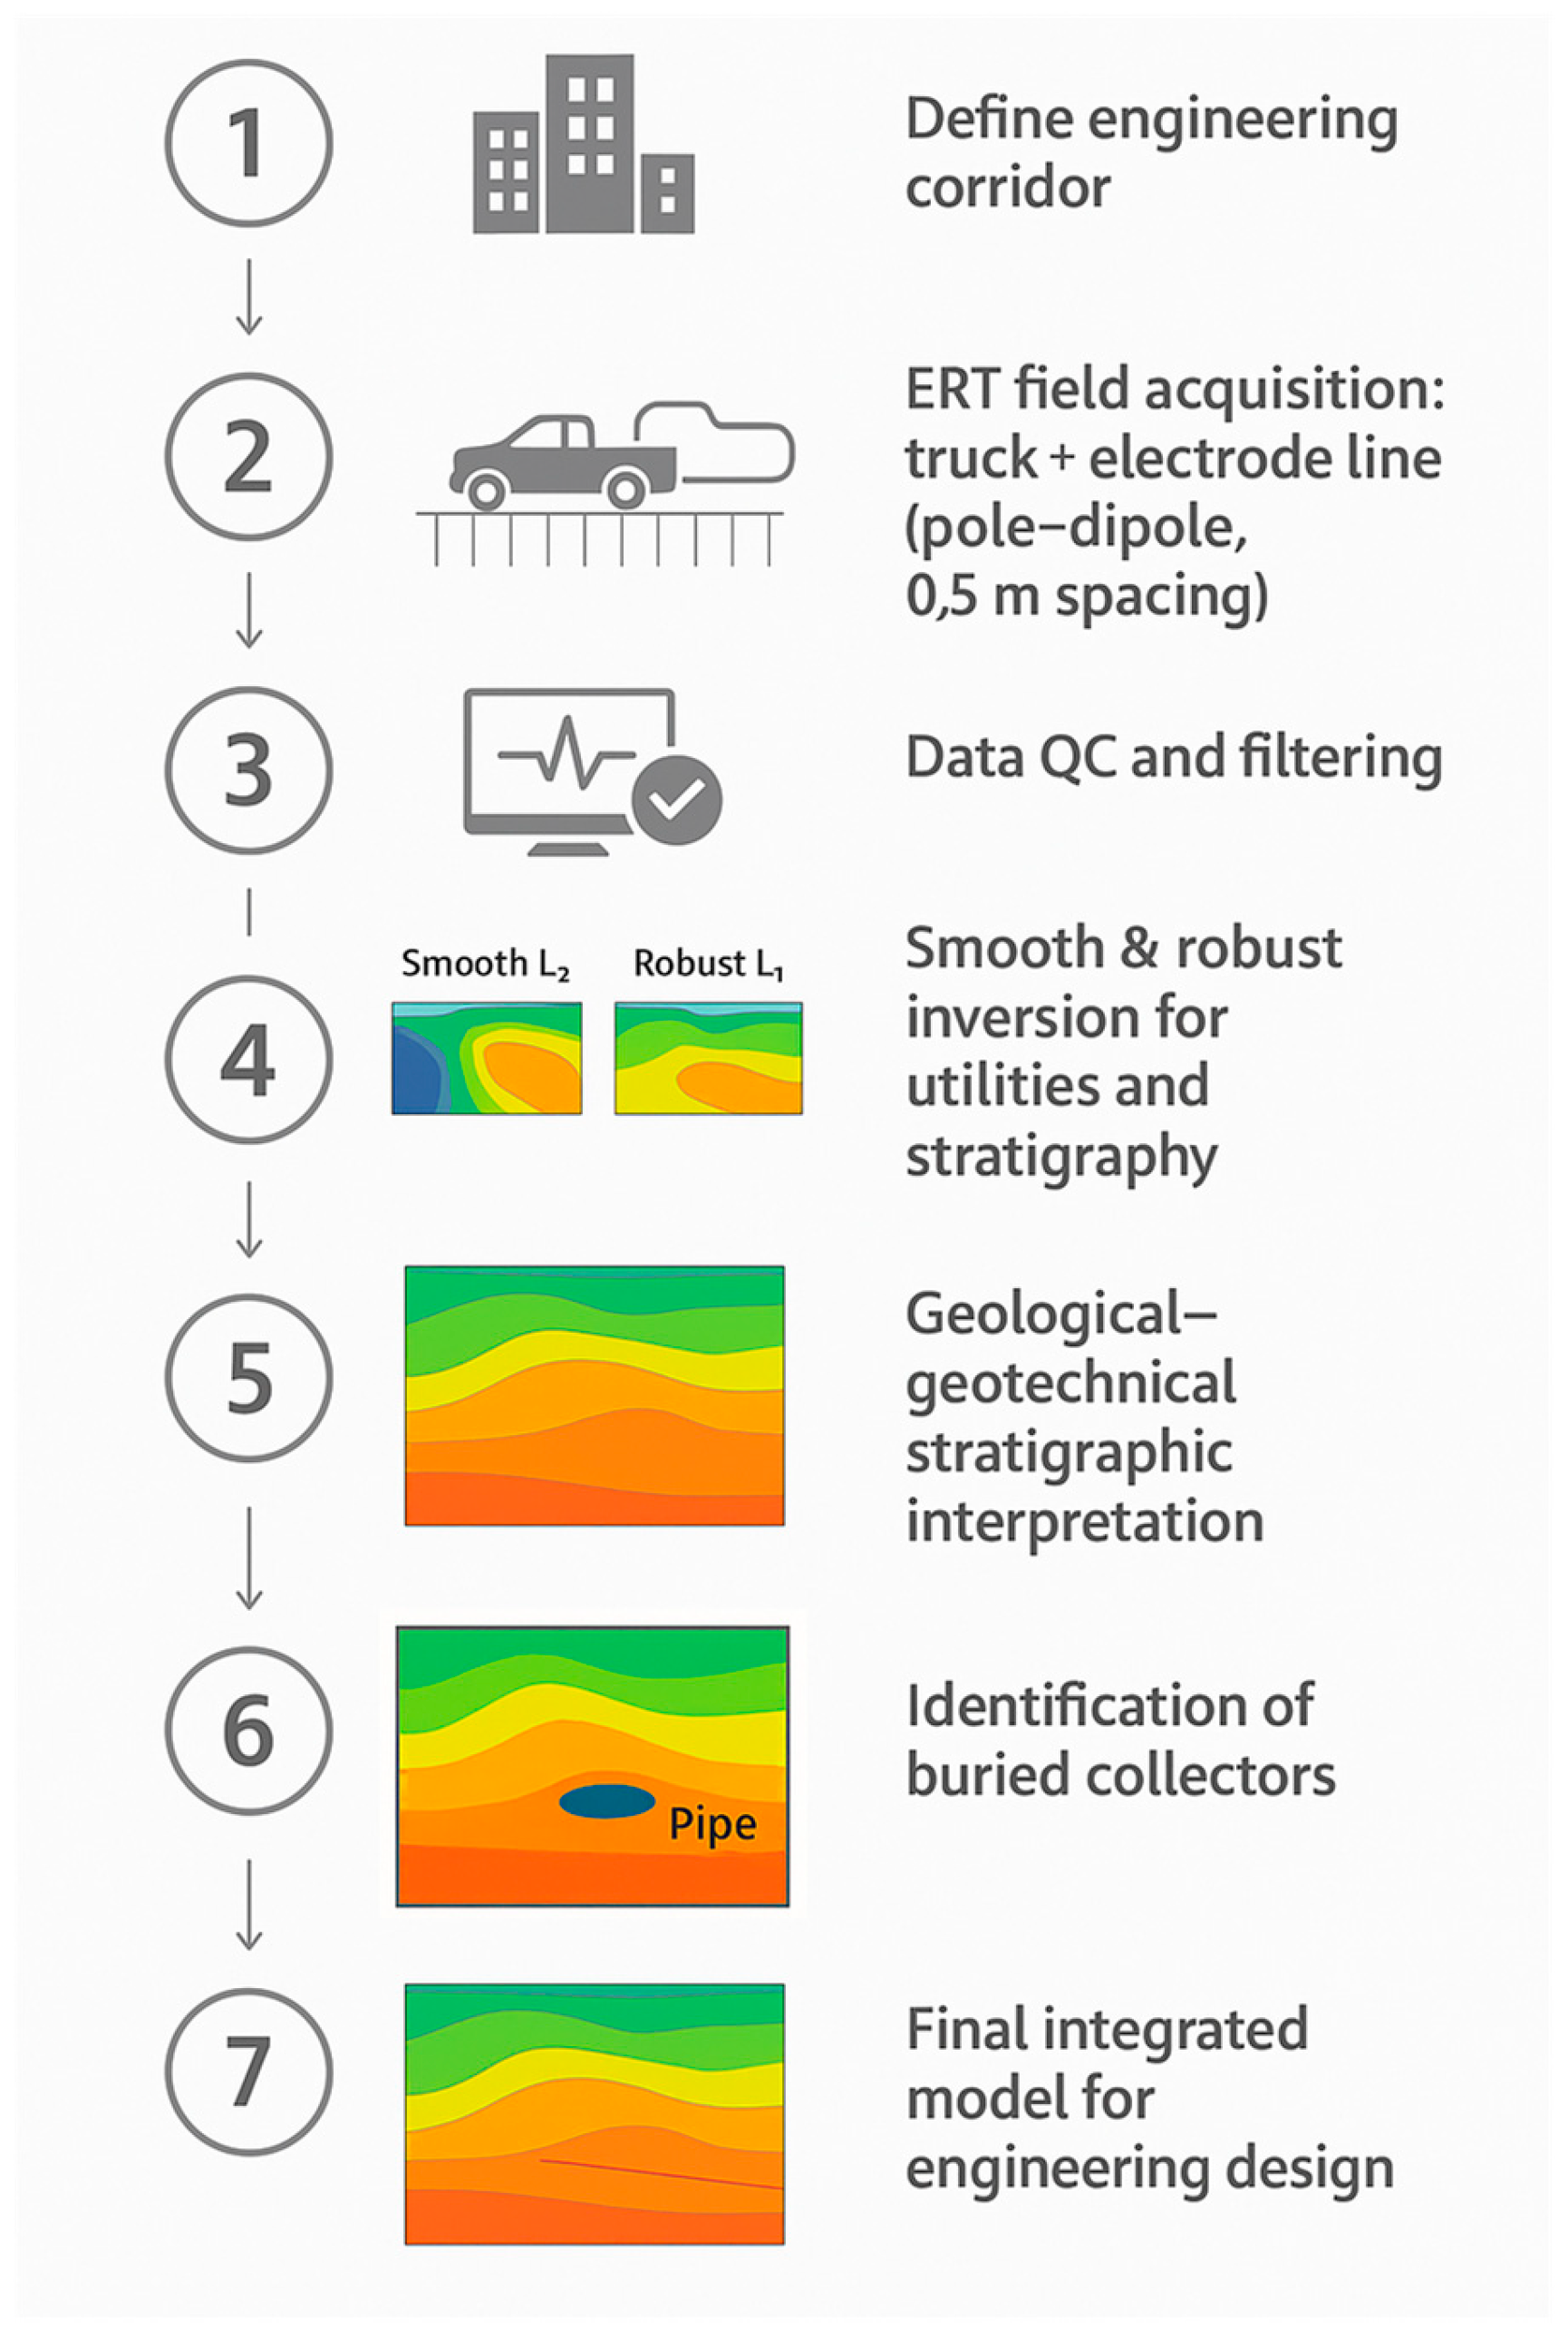
Figure 2.
Location map of the study area in Pamplona (Navarra, Spain). Source: Instituto Geográfico Nacional (IGN, Spain). Map elaborated by the authors.
Figure 2.
Location map of the study area in Pamplona (Navarra, Spain). Source: Instituto Geográfico Nacional (IGN, Spain). Map elaborated by the authors.
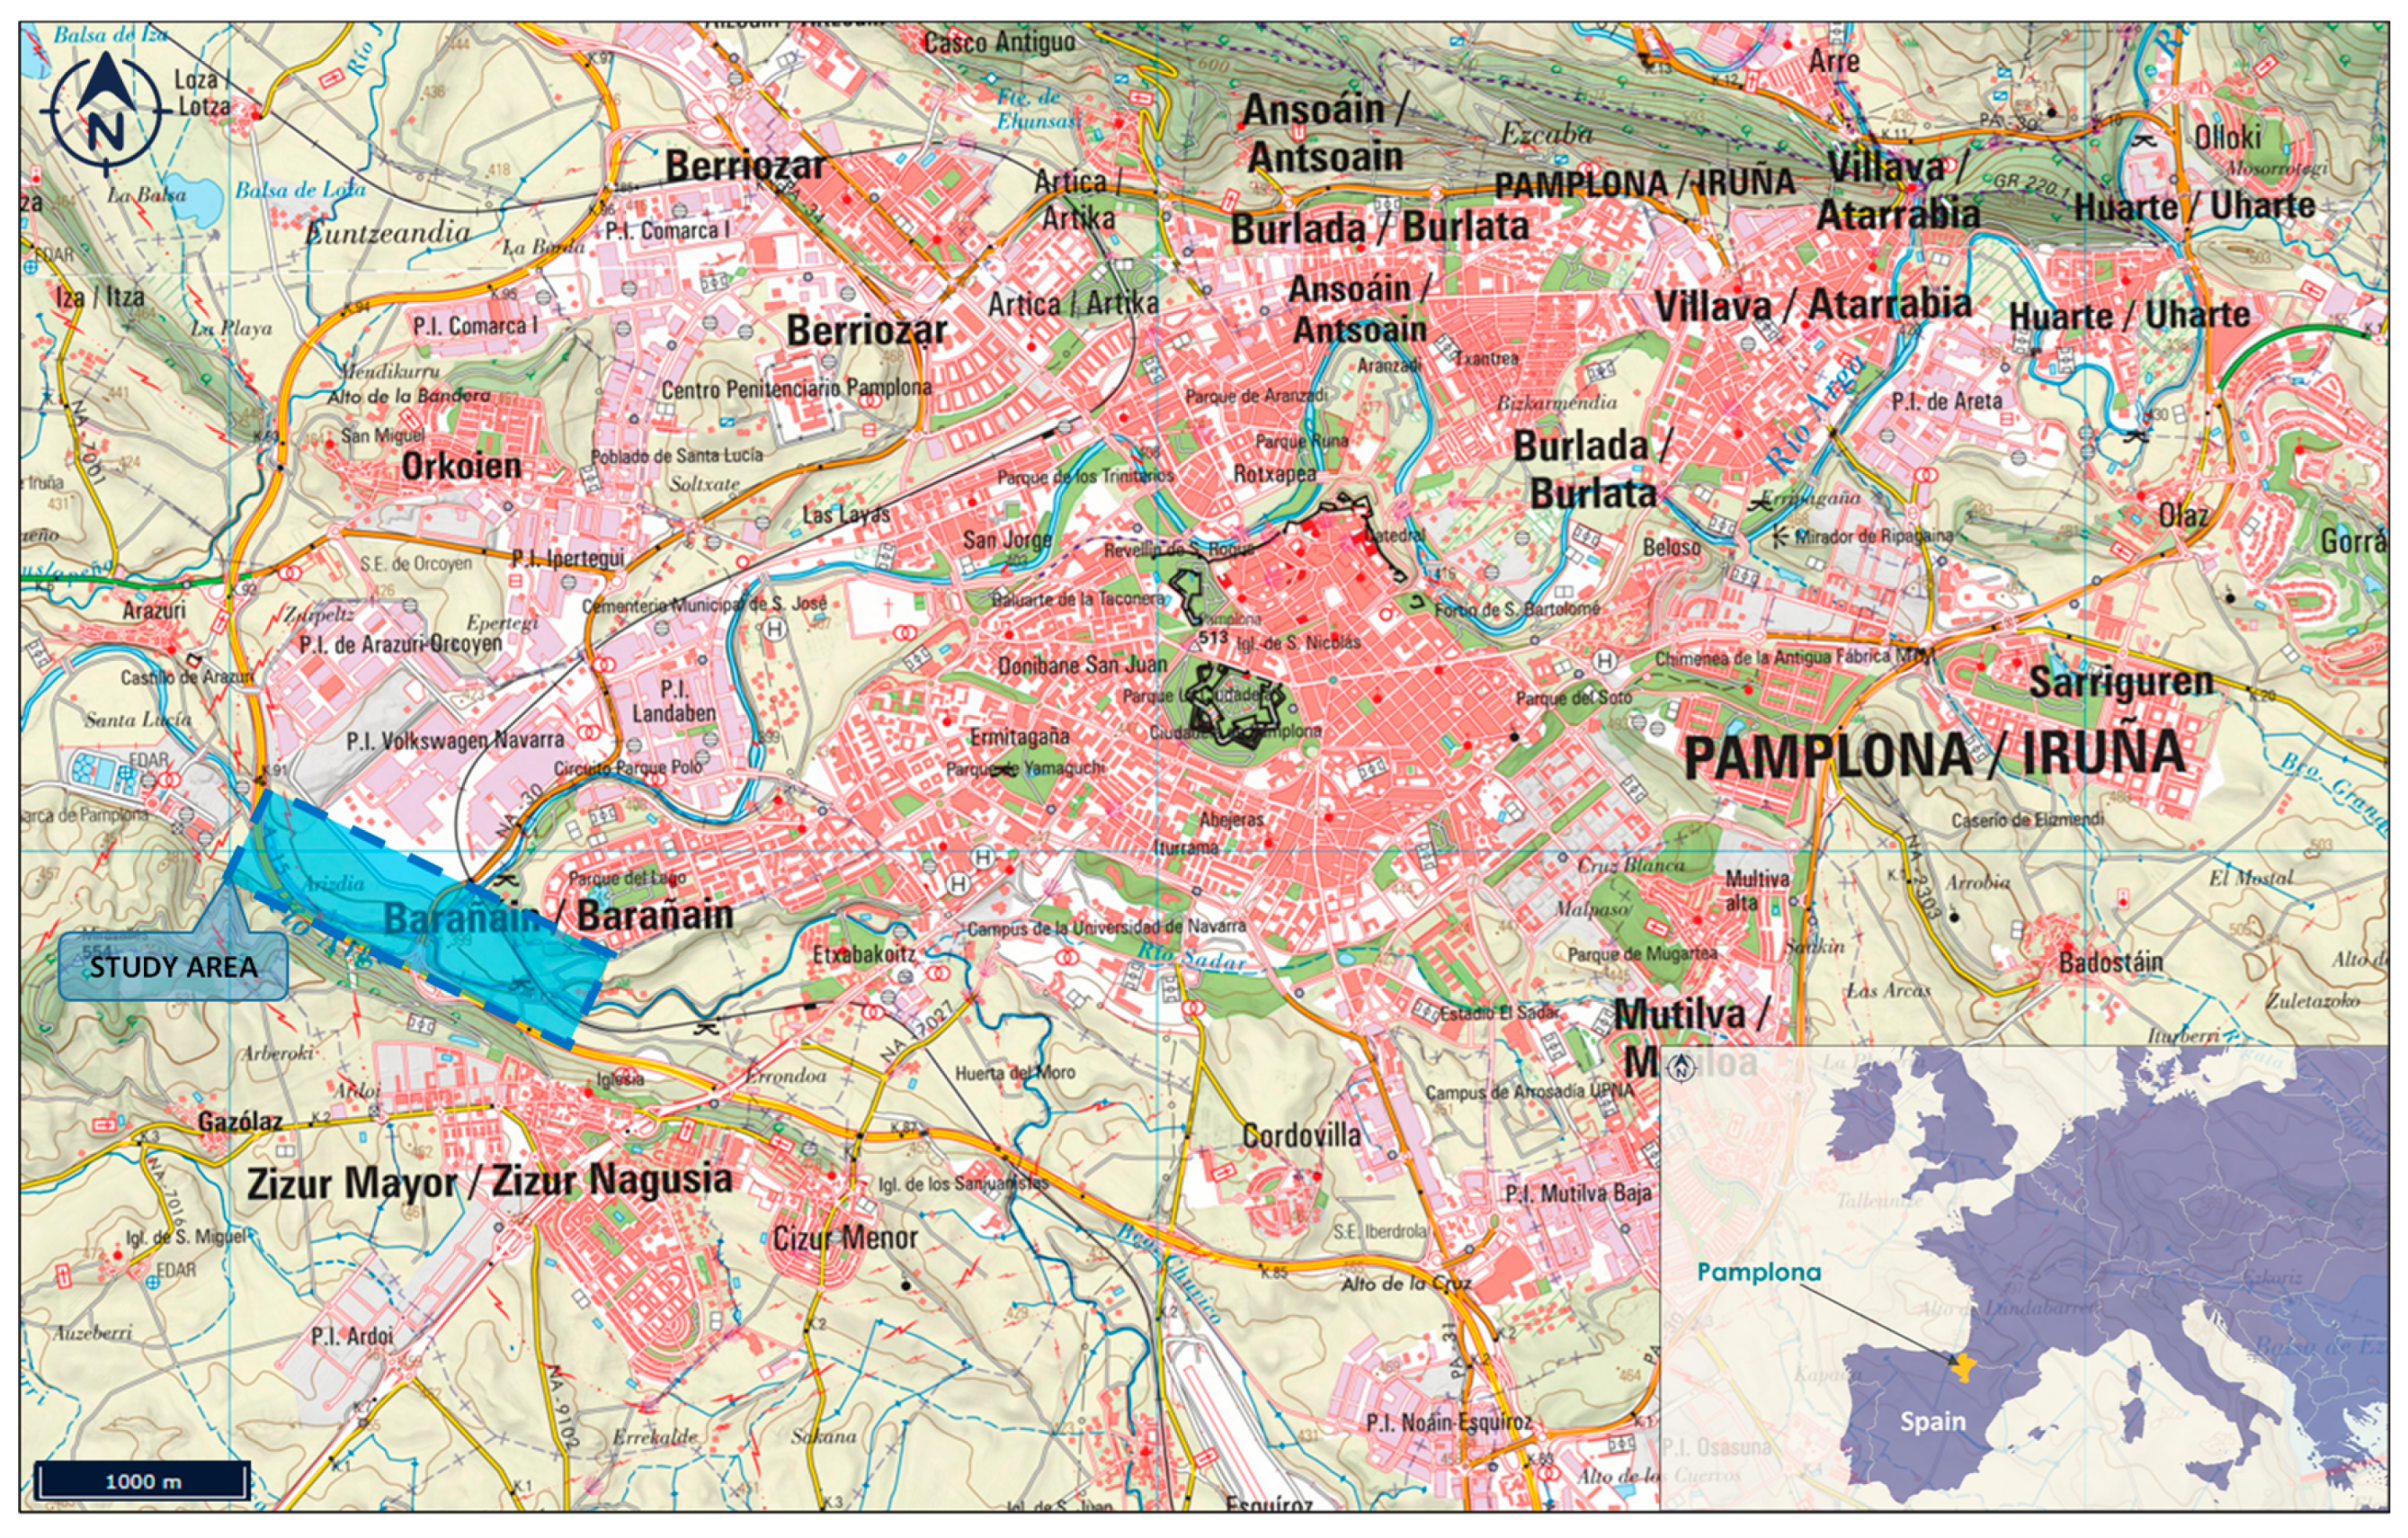
Figure 3.
Photographs of fieldwork carried out in the study area. Photos taken by the authors.
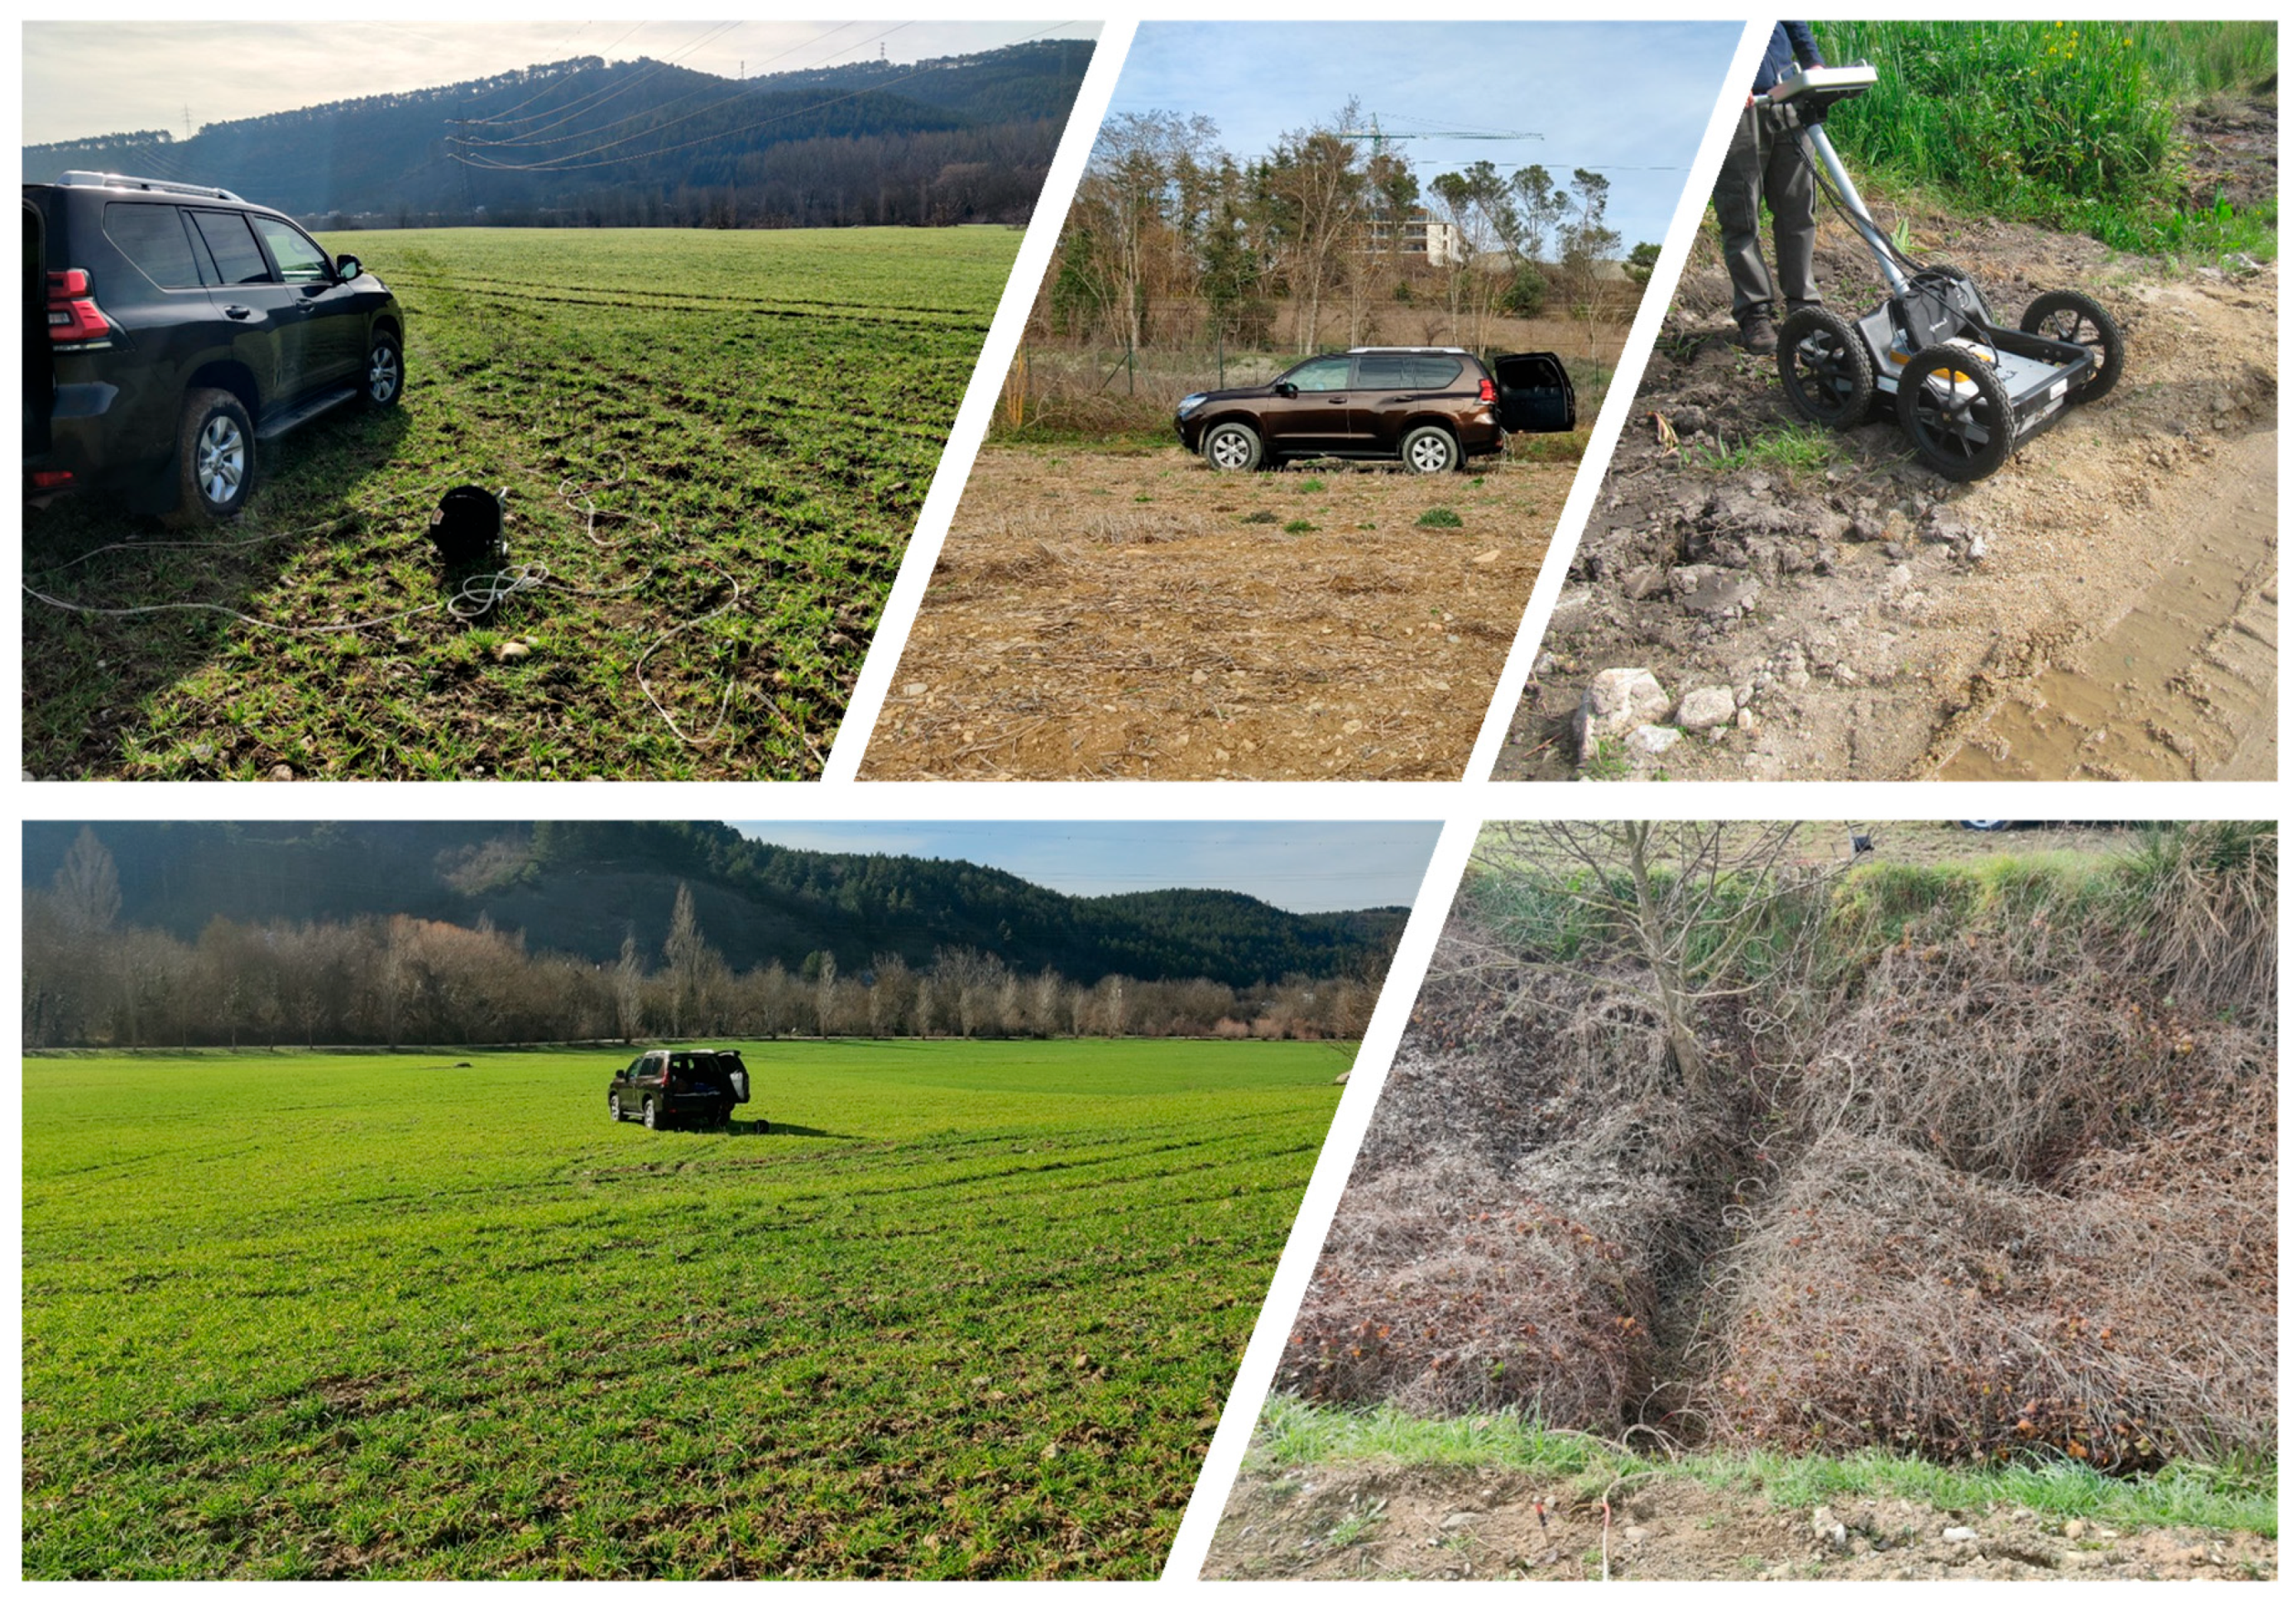
Figure 4.
Location of the ERT profiles and boreholes (BH-1, BH-2, and BH-3) within the study area. Source: Google Earth imagery. Map elaborated by the authors.
Figure 4.
Location of the ERT profiles and boreholes (BH-1, BH-2, and BH-3) within the study area. Source: Google Earth imagery. Map elaborated by the authors.
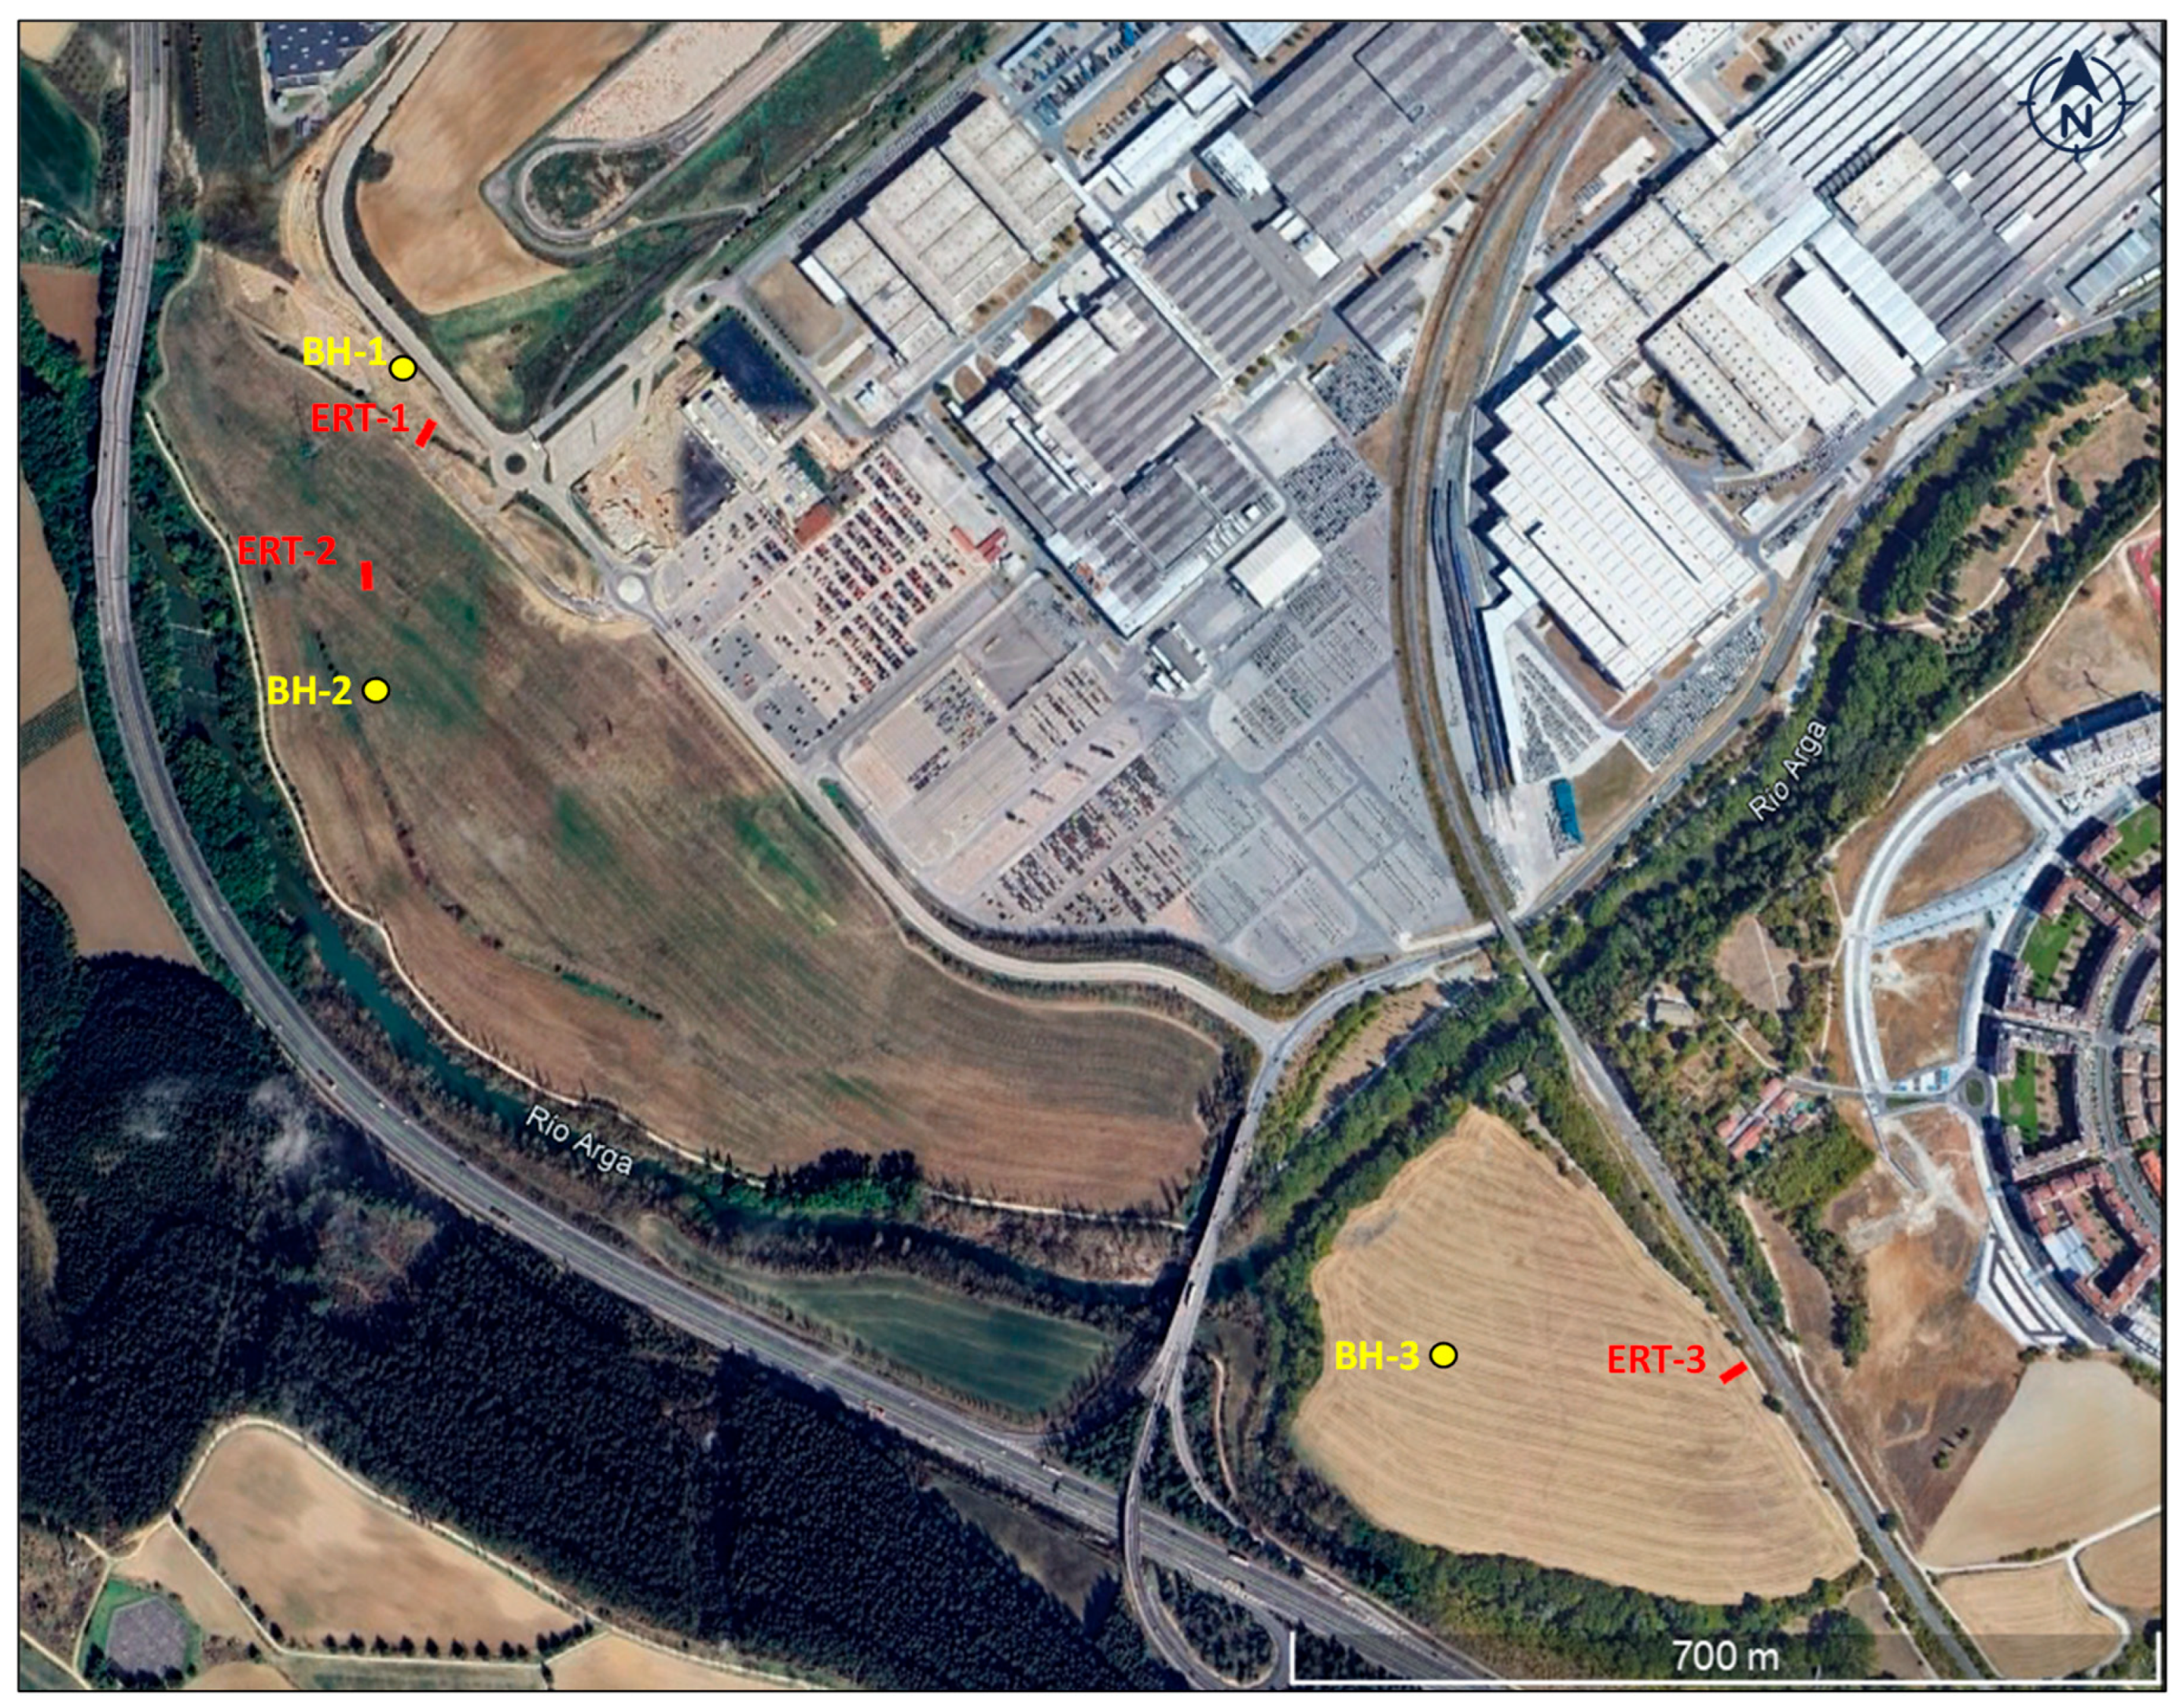
Figure 5.
Diagram of the 1081 measurement points generated using ElectrePro software (Iris Instruments) for the pole–dipole configuration used.
Figure 5.
Diagram of the 1081 measurement points generated using ElectrePro software (Iris Instruments) for the pole–dipole configuration used.
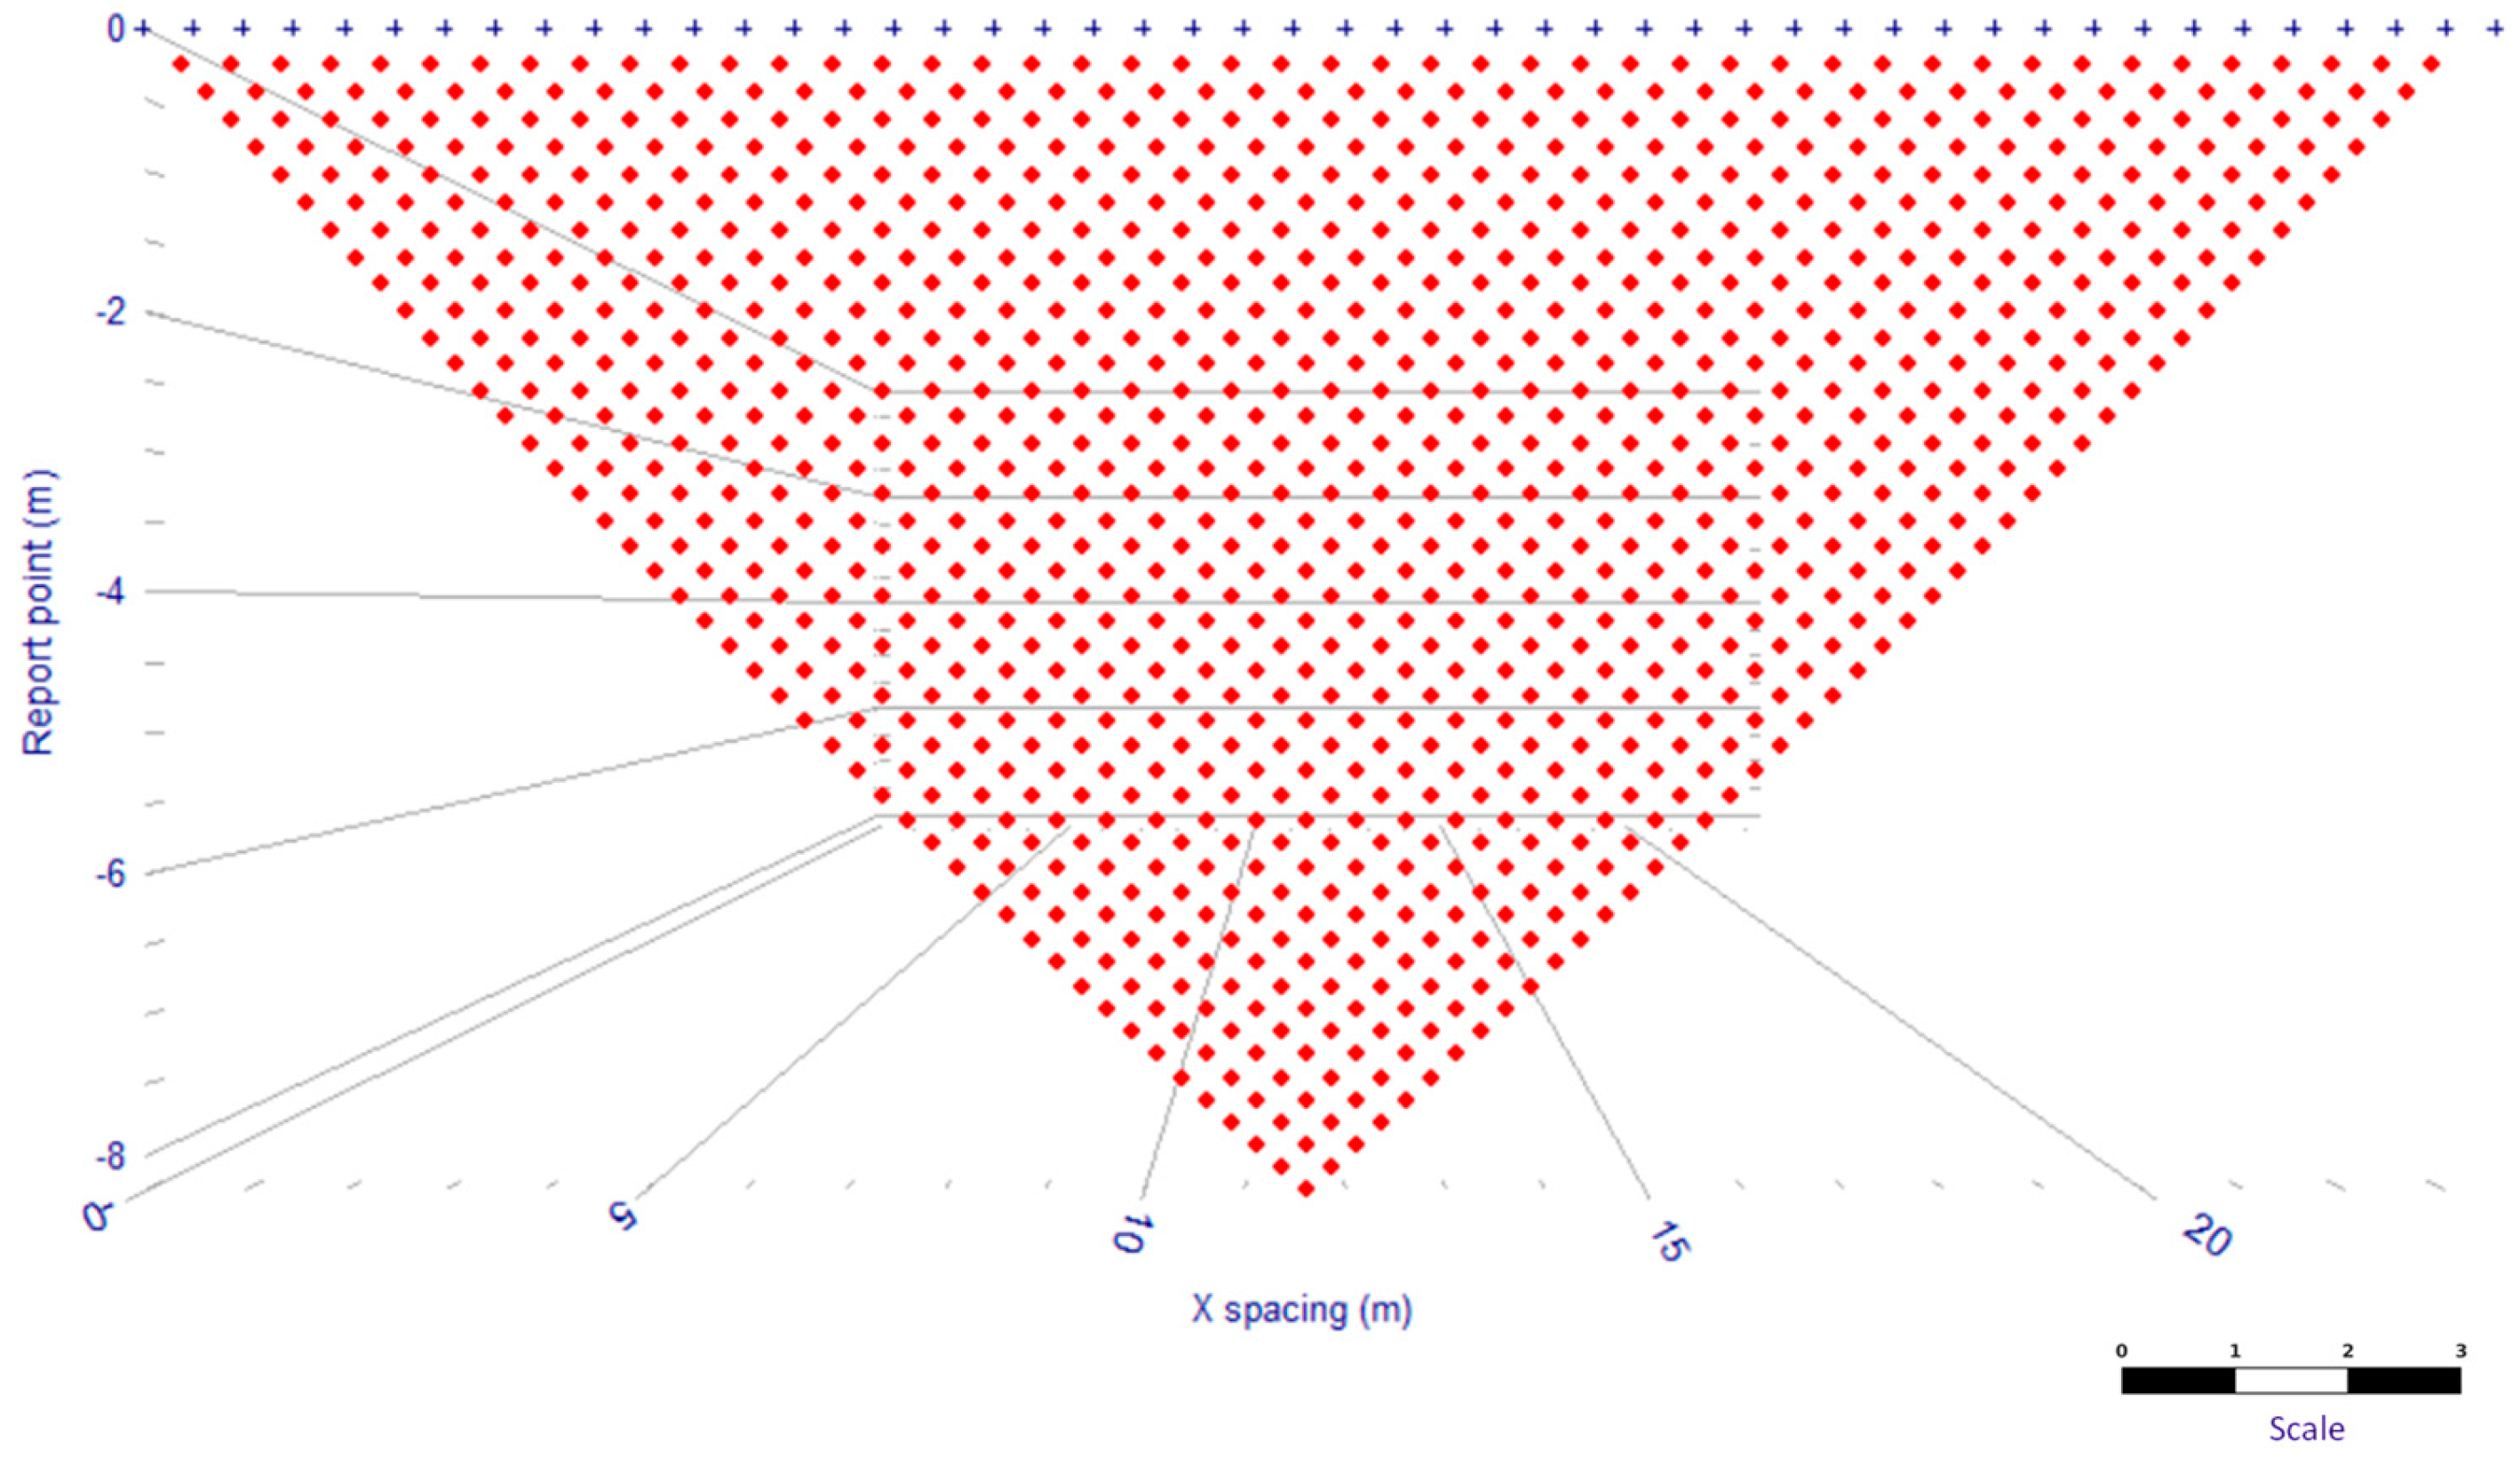
Figure 6.
Example of apparent resistivity pseudosection obtained in one of the profiles (ERT-3).
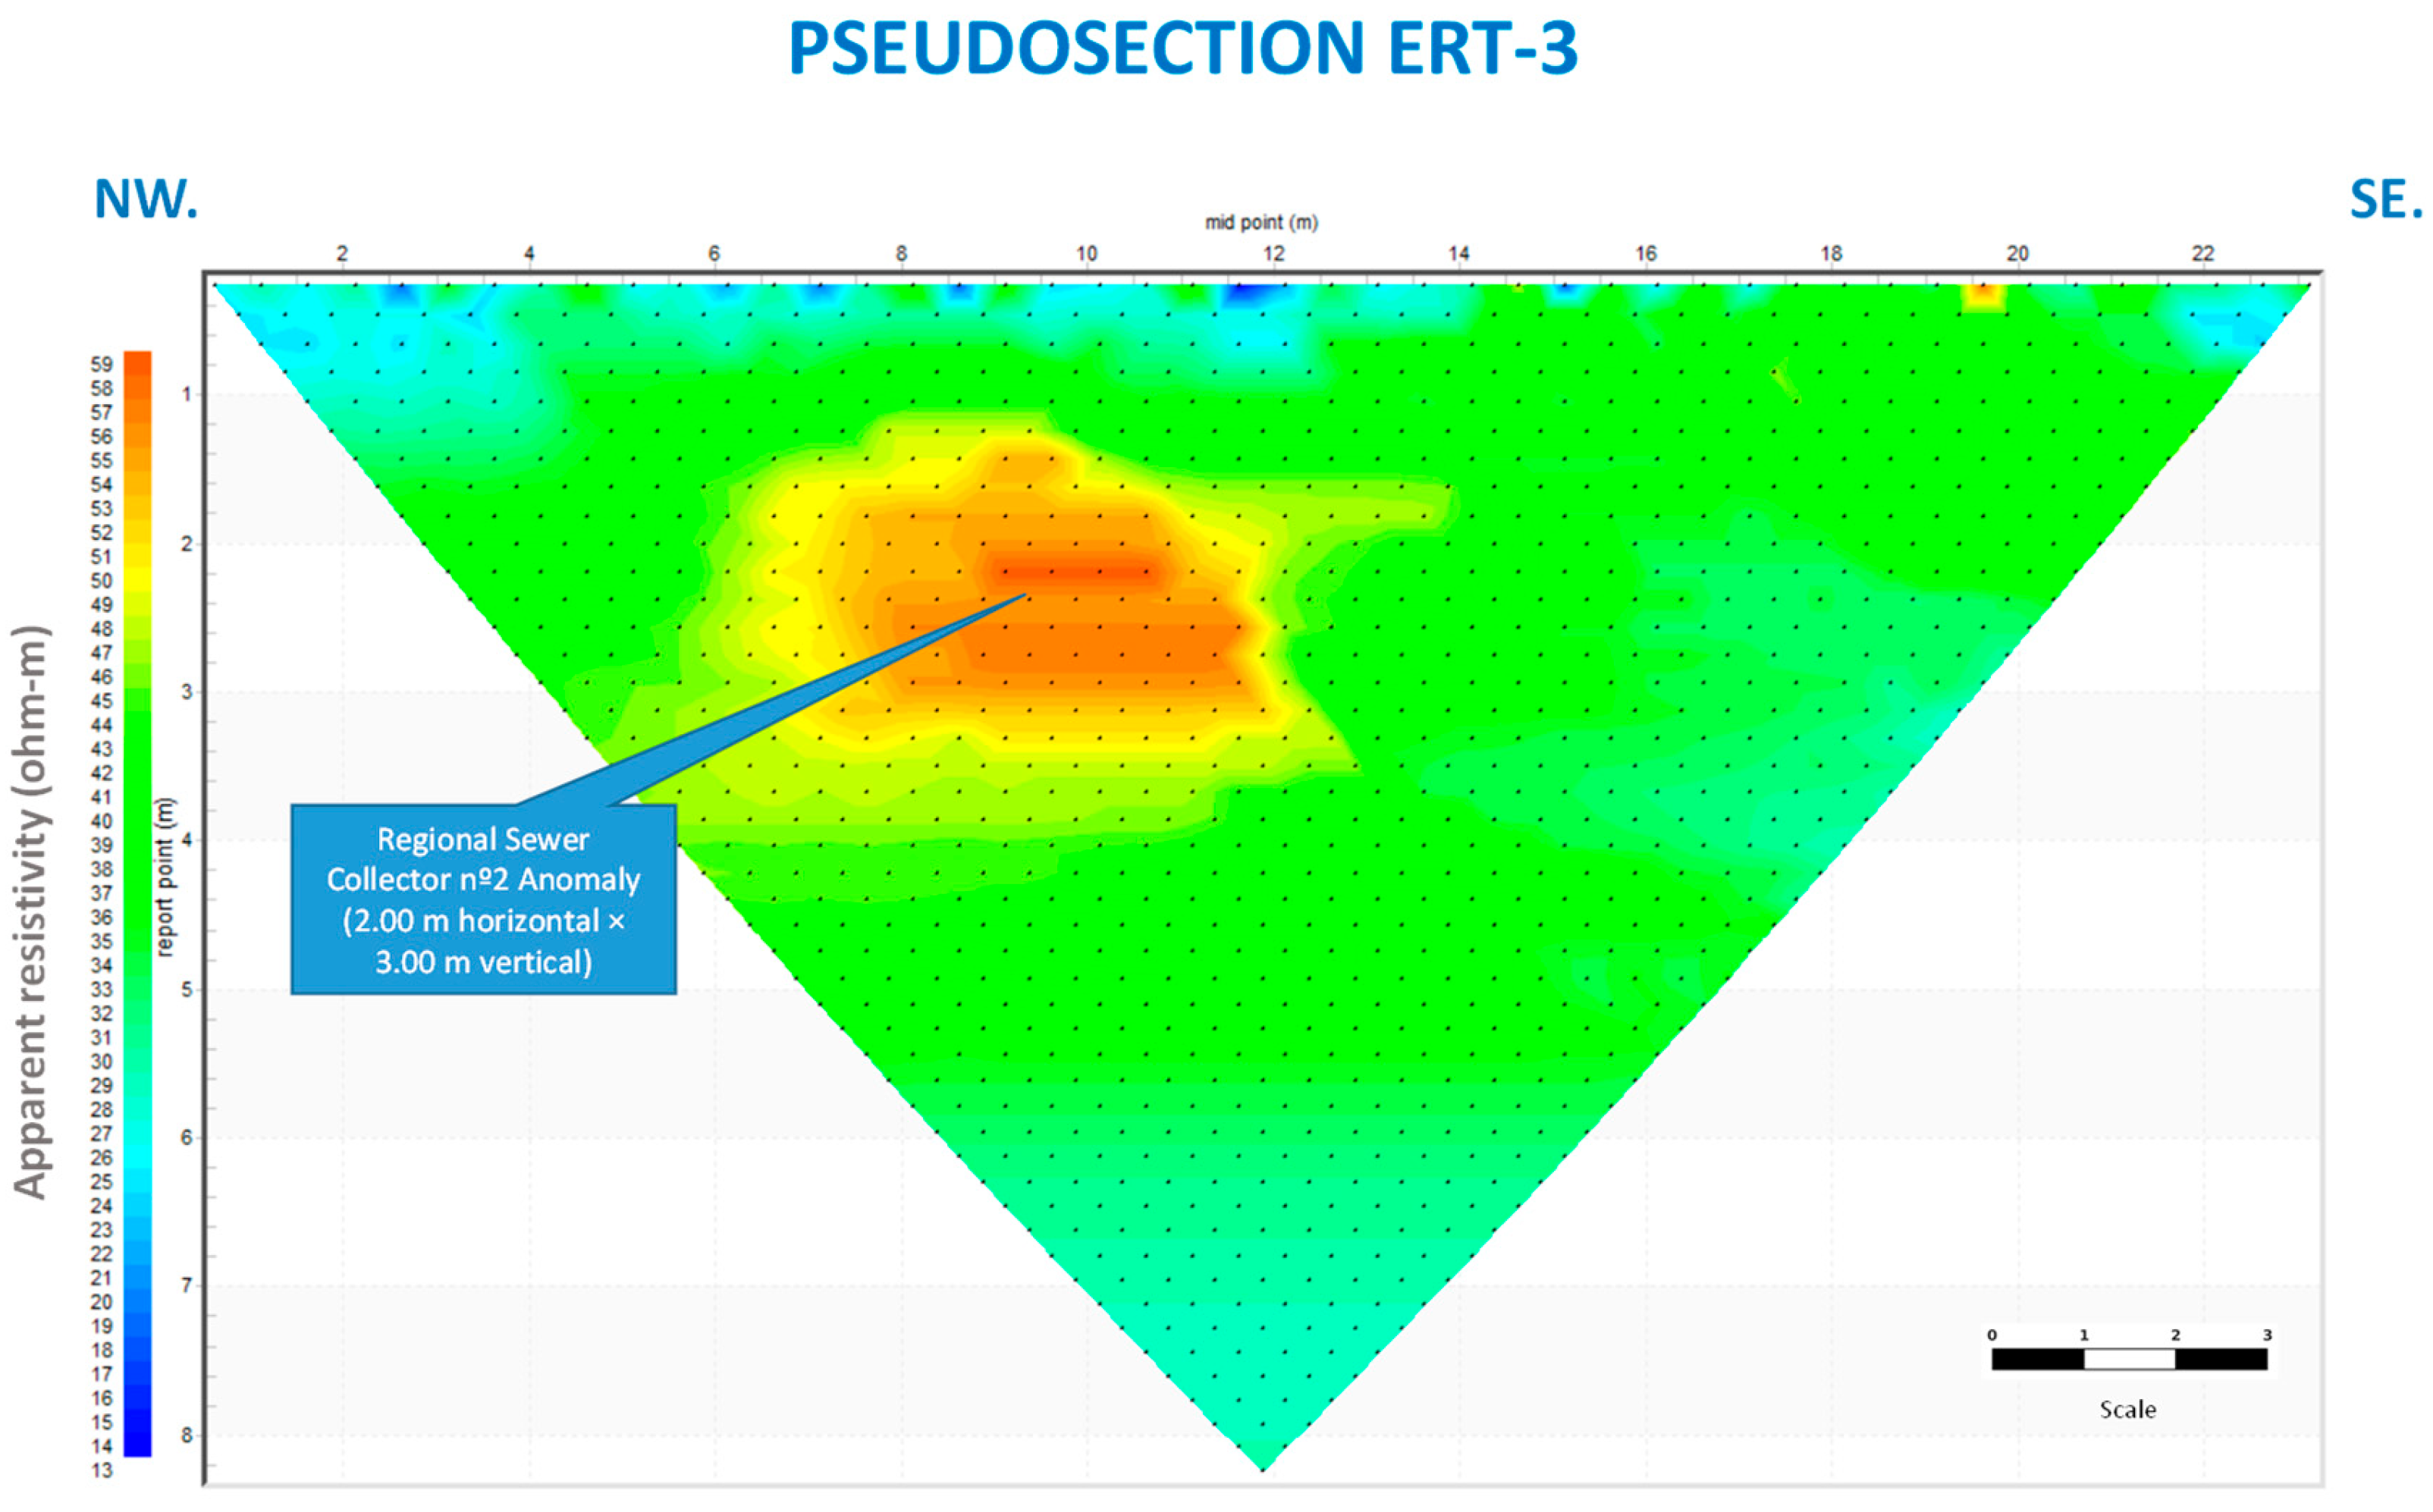
Figure 7.
Comparison of ERT inversion with and without robustness. Left panels (a, c, e): ): standard constrained inversion; right panels (b, d, f): robust inversion. The black squares indicate the position of the pipes. ERT-1 (a–b); ERT-2; (c–d) ERT-3; (e–f).
Figure 7.
Comparison of ERT inversion with and without robustness. Left panels (a, c, e): ): standard constrained inversion; right panels (b, d, f): robust inversion. The black squares indicate the position of the pipes. ERT-1 (a–b); ERT-2; (c–d) ERT-3; (e–f).
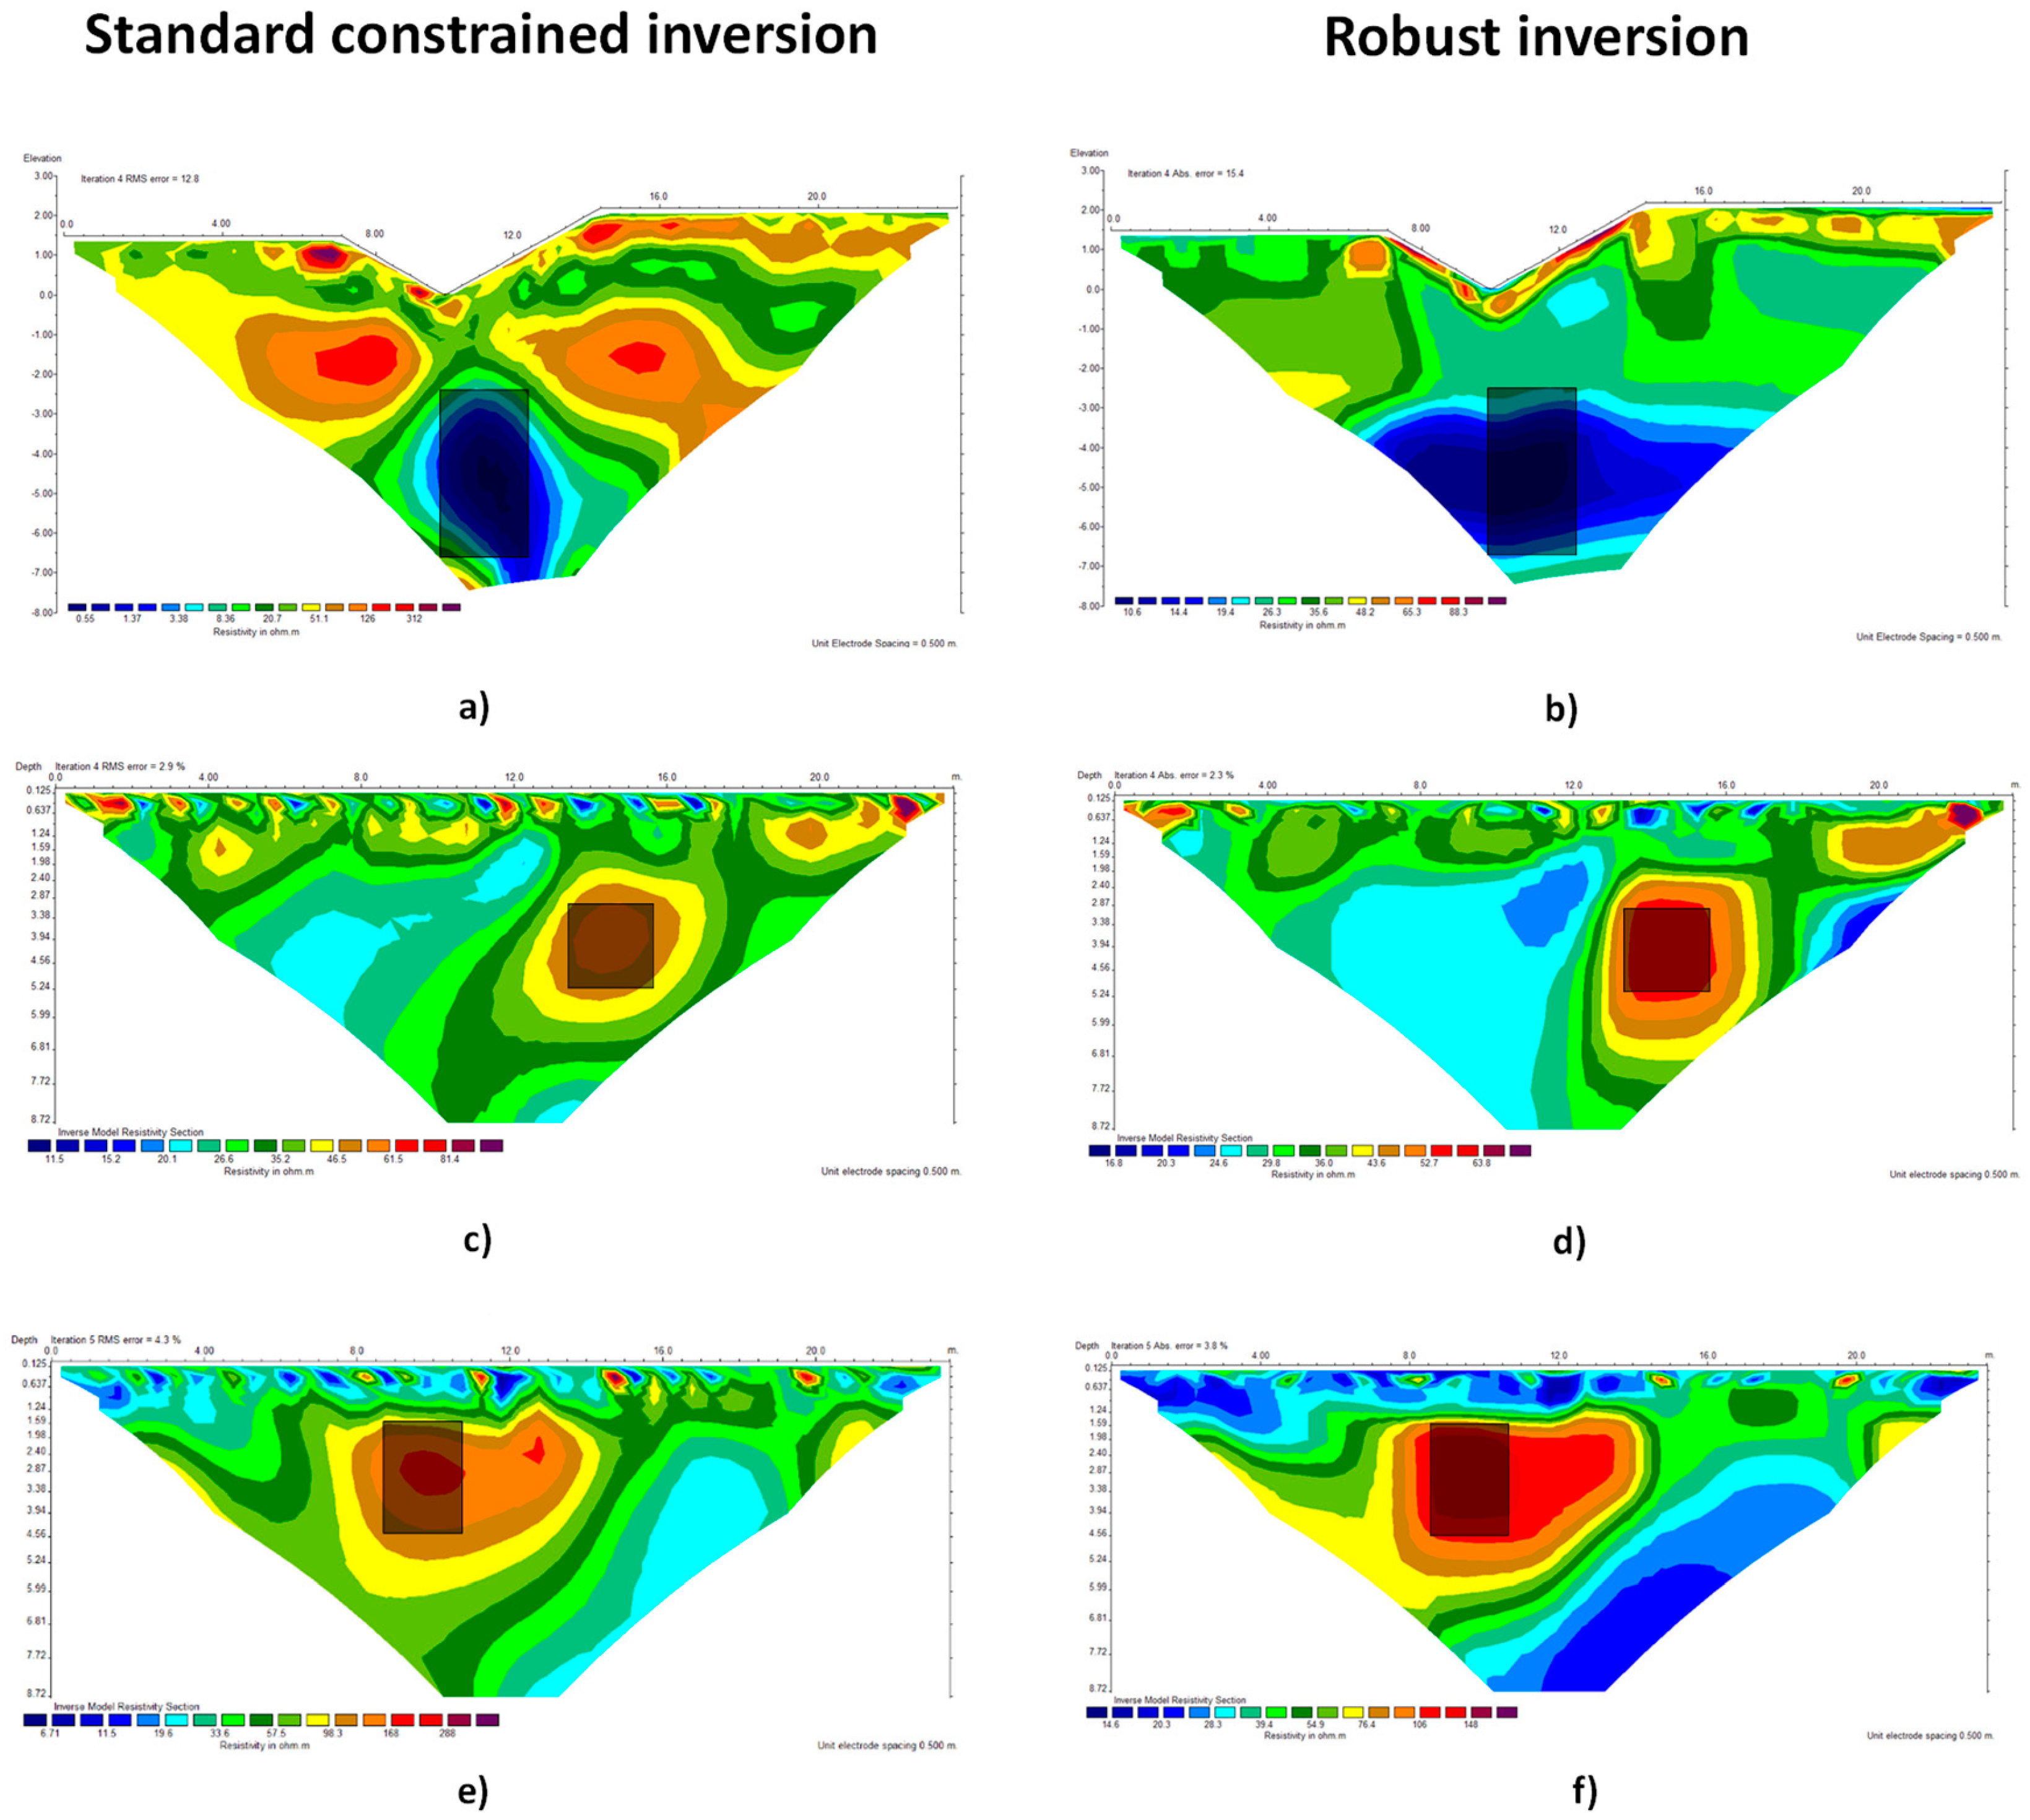
Figure 8.
Example of apparent resistivity pseudosection and corresponding inverted model for profile ERT-2, obtained using Res2DInv software.
Figure 8.
Example of apparent resistivity pseudosection and corresponding inverted model for profile ERT-2, obtained using Res2DInv software.
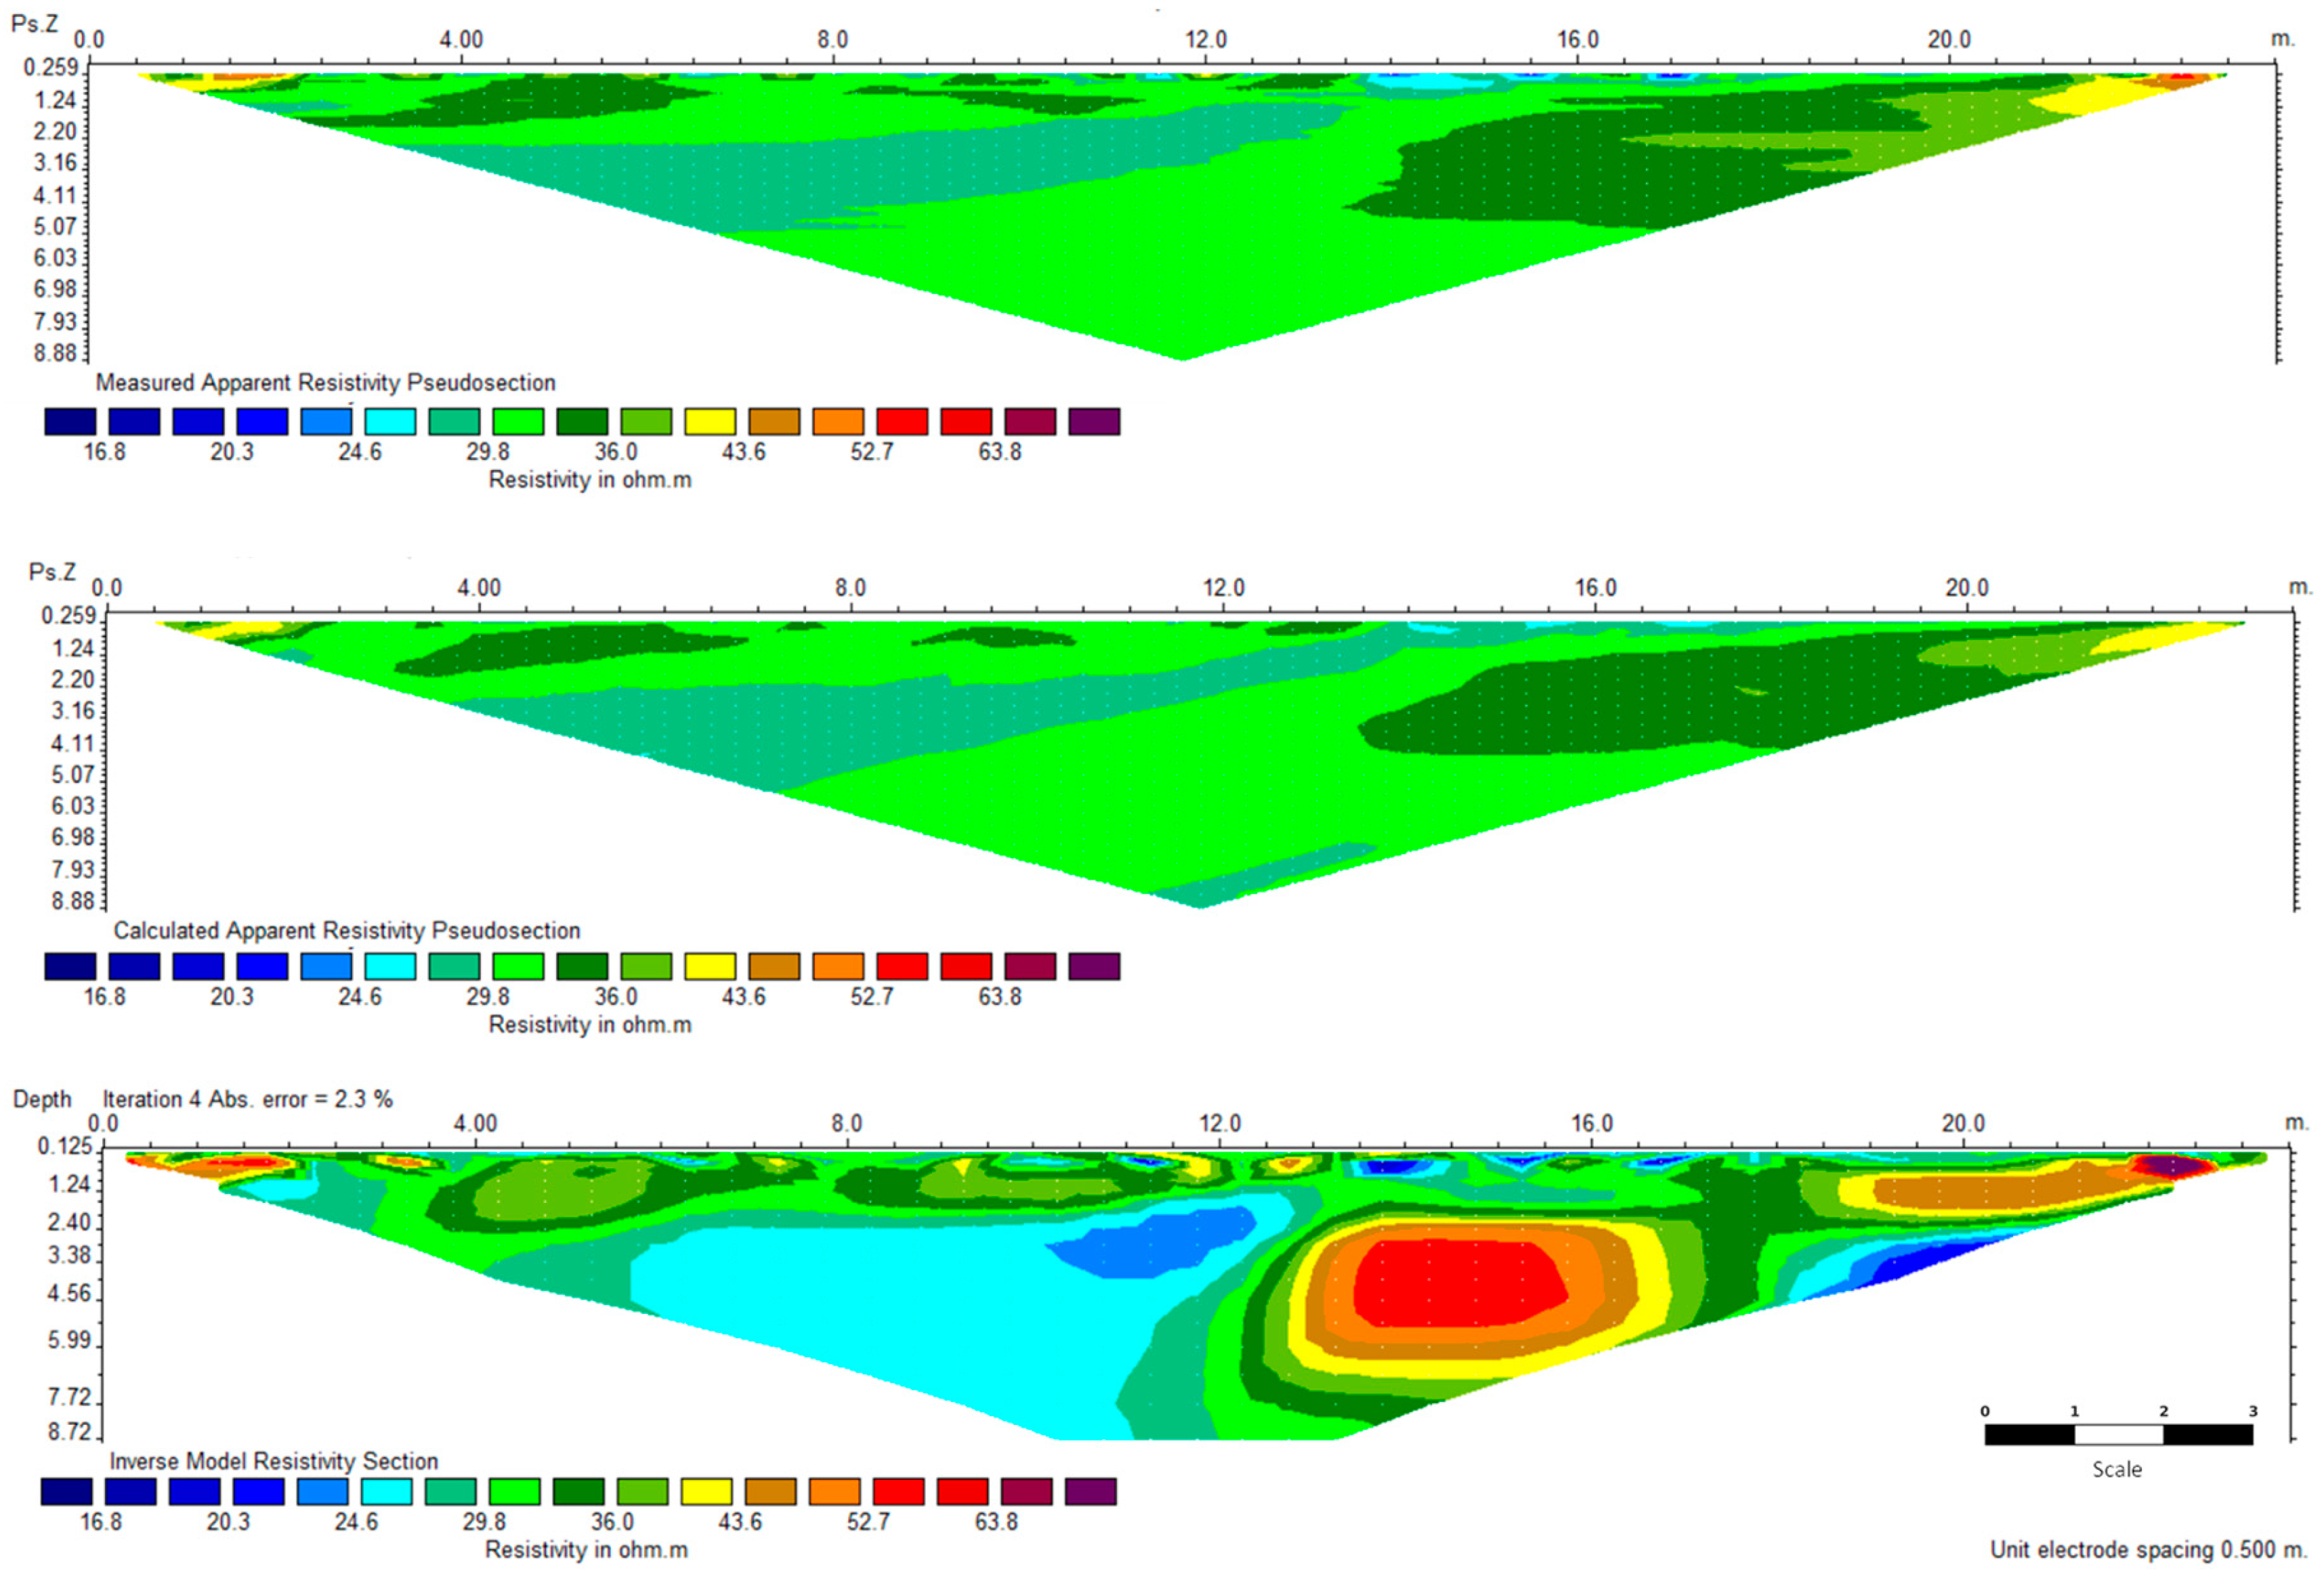
Figure 9.
Inverted model of ERT-1 profile showing the conductive anomaly attributed to the sewer pipe nº1.
Figure 9.
Inverted model of ERT-1 profile showing the conductive anomaly attributed to the sewer pipe nº1.
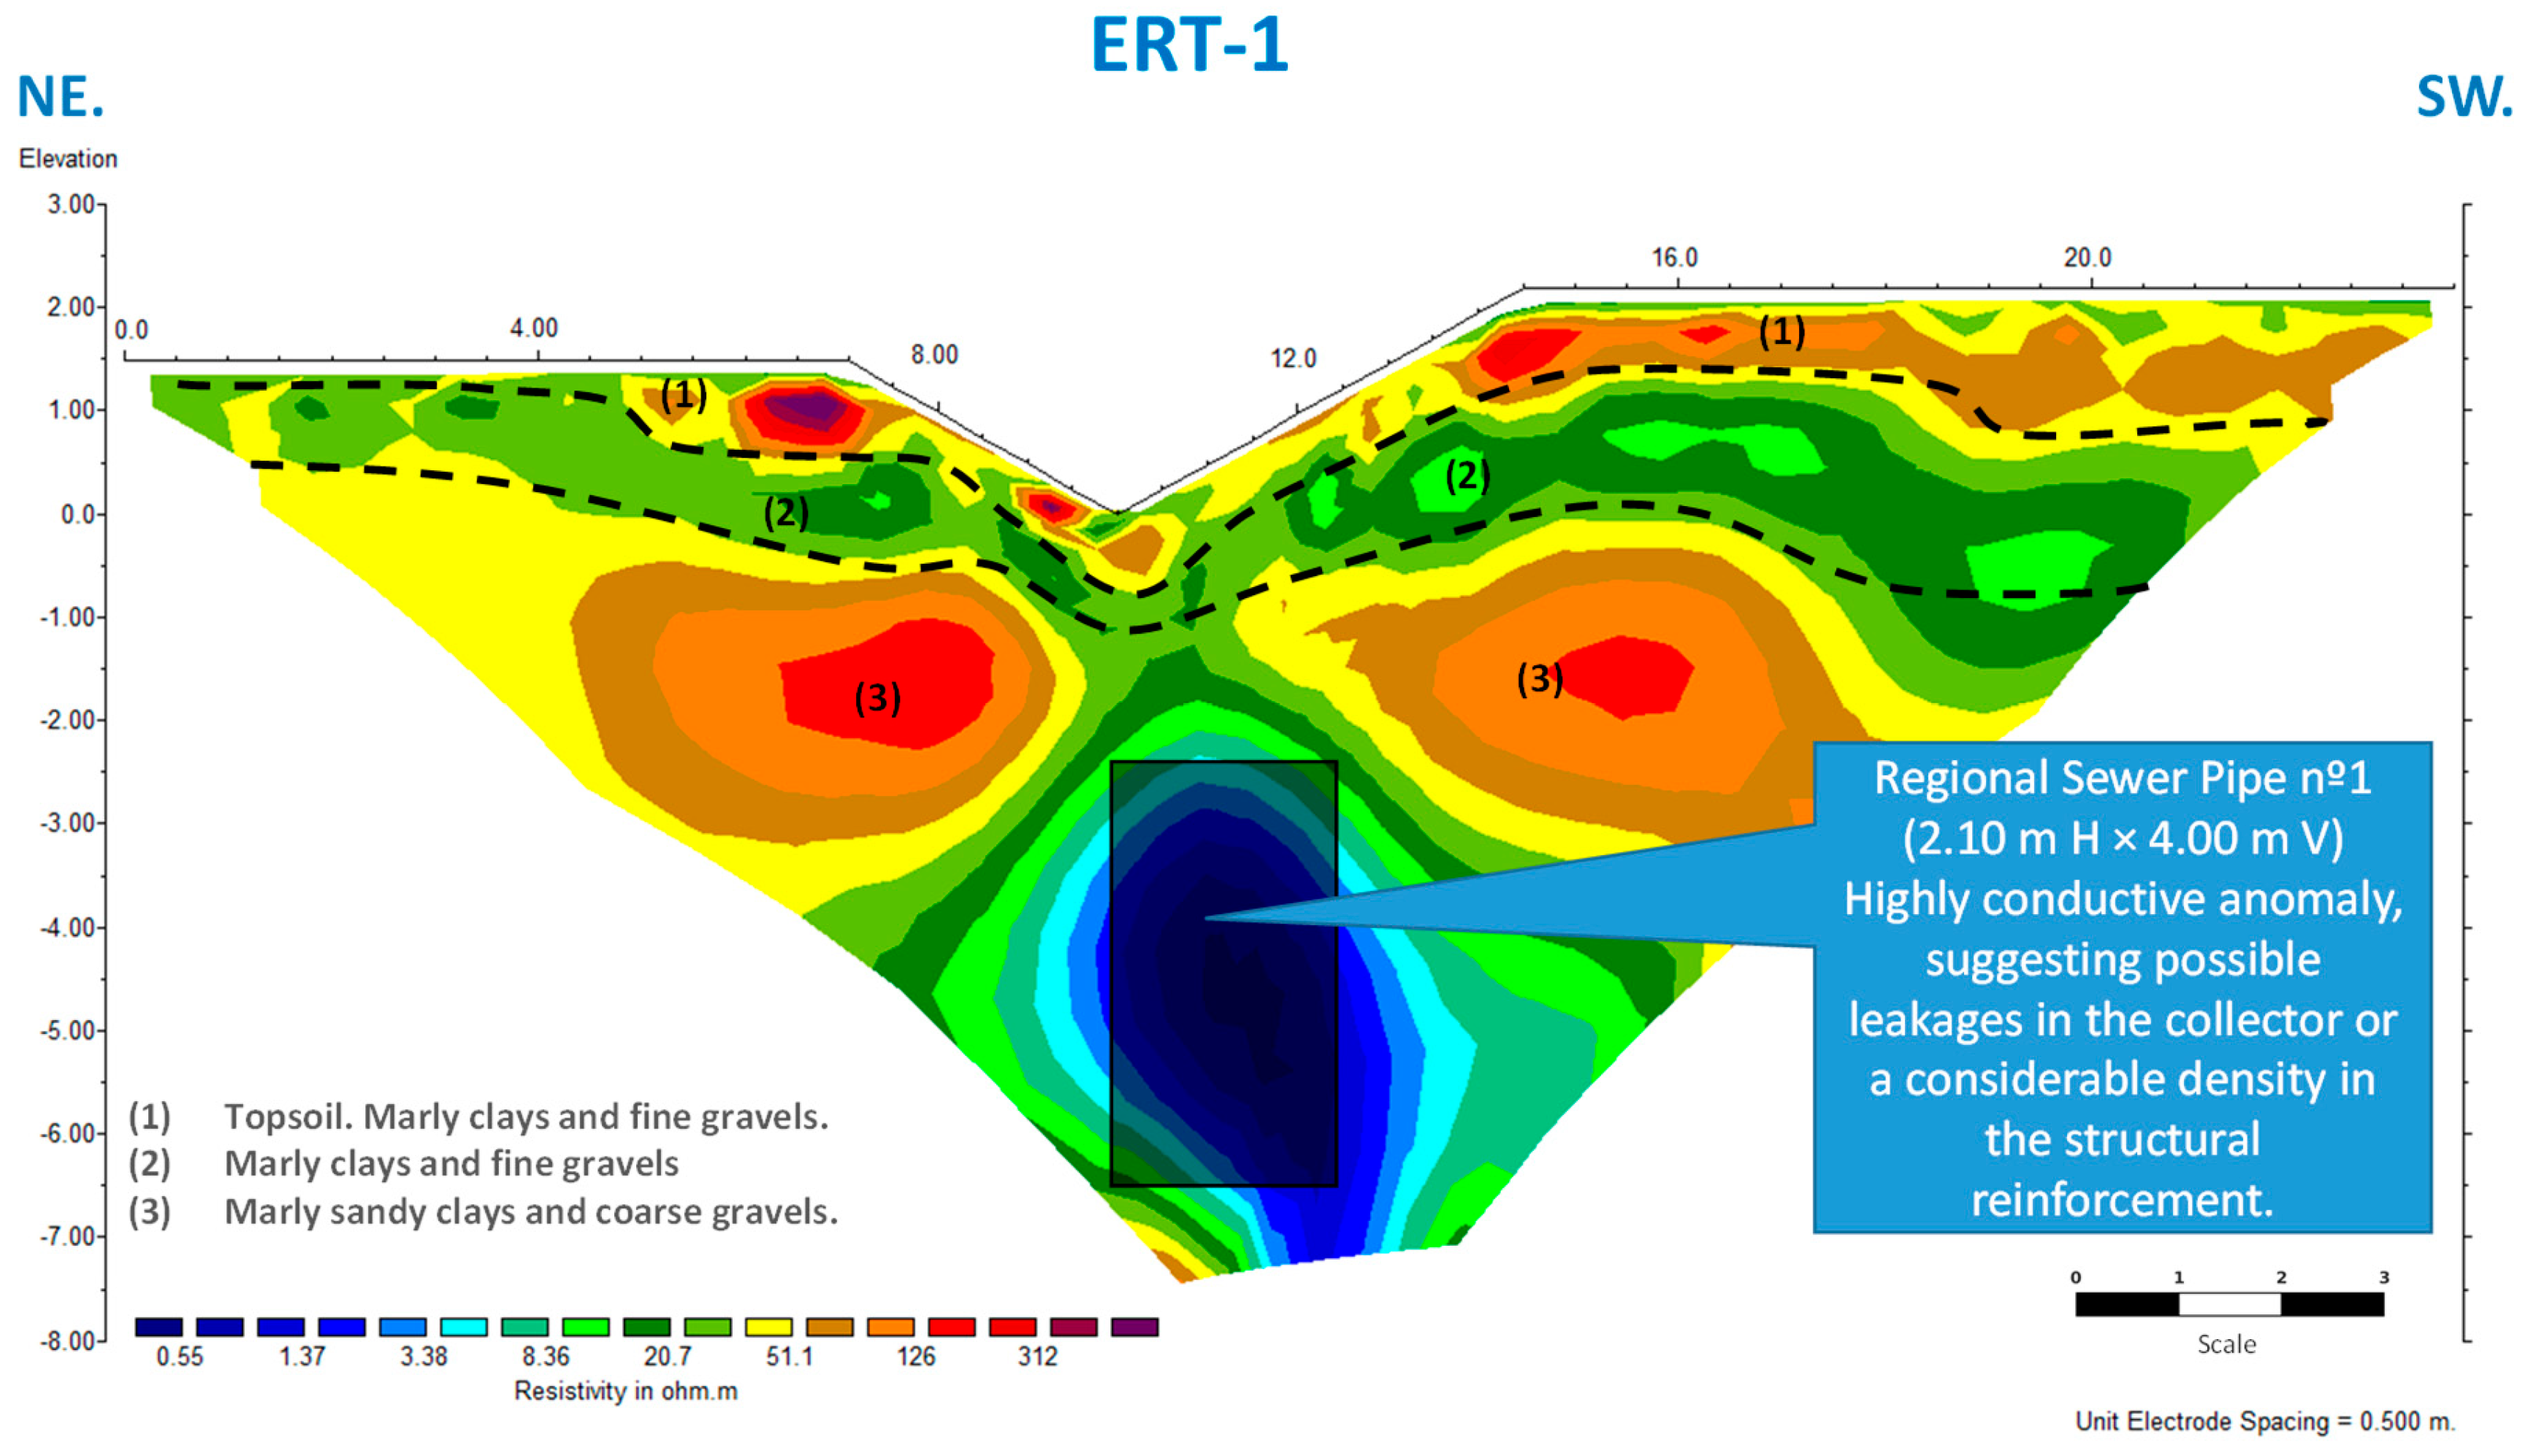
Figure 10.
Inverted model of ERT-2 profile showing the resistive anomaly attributed to the stormwater pipe.
Figure 10.
Inverted model of ERT-2 profile showing the resistive anomaly attributed to the stormwater pipe.
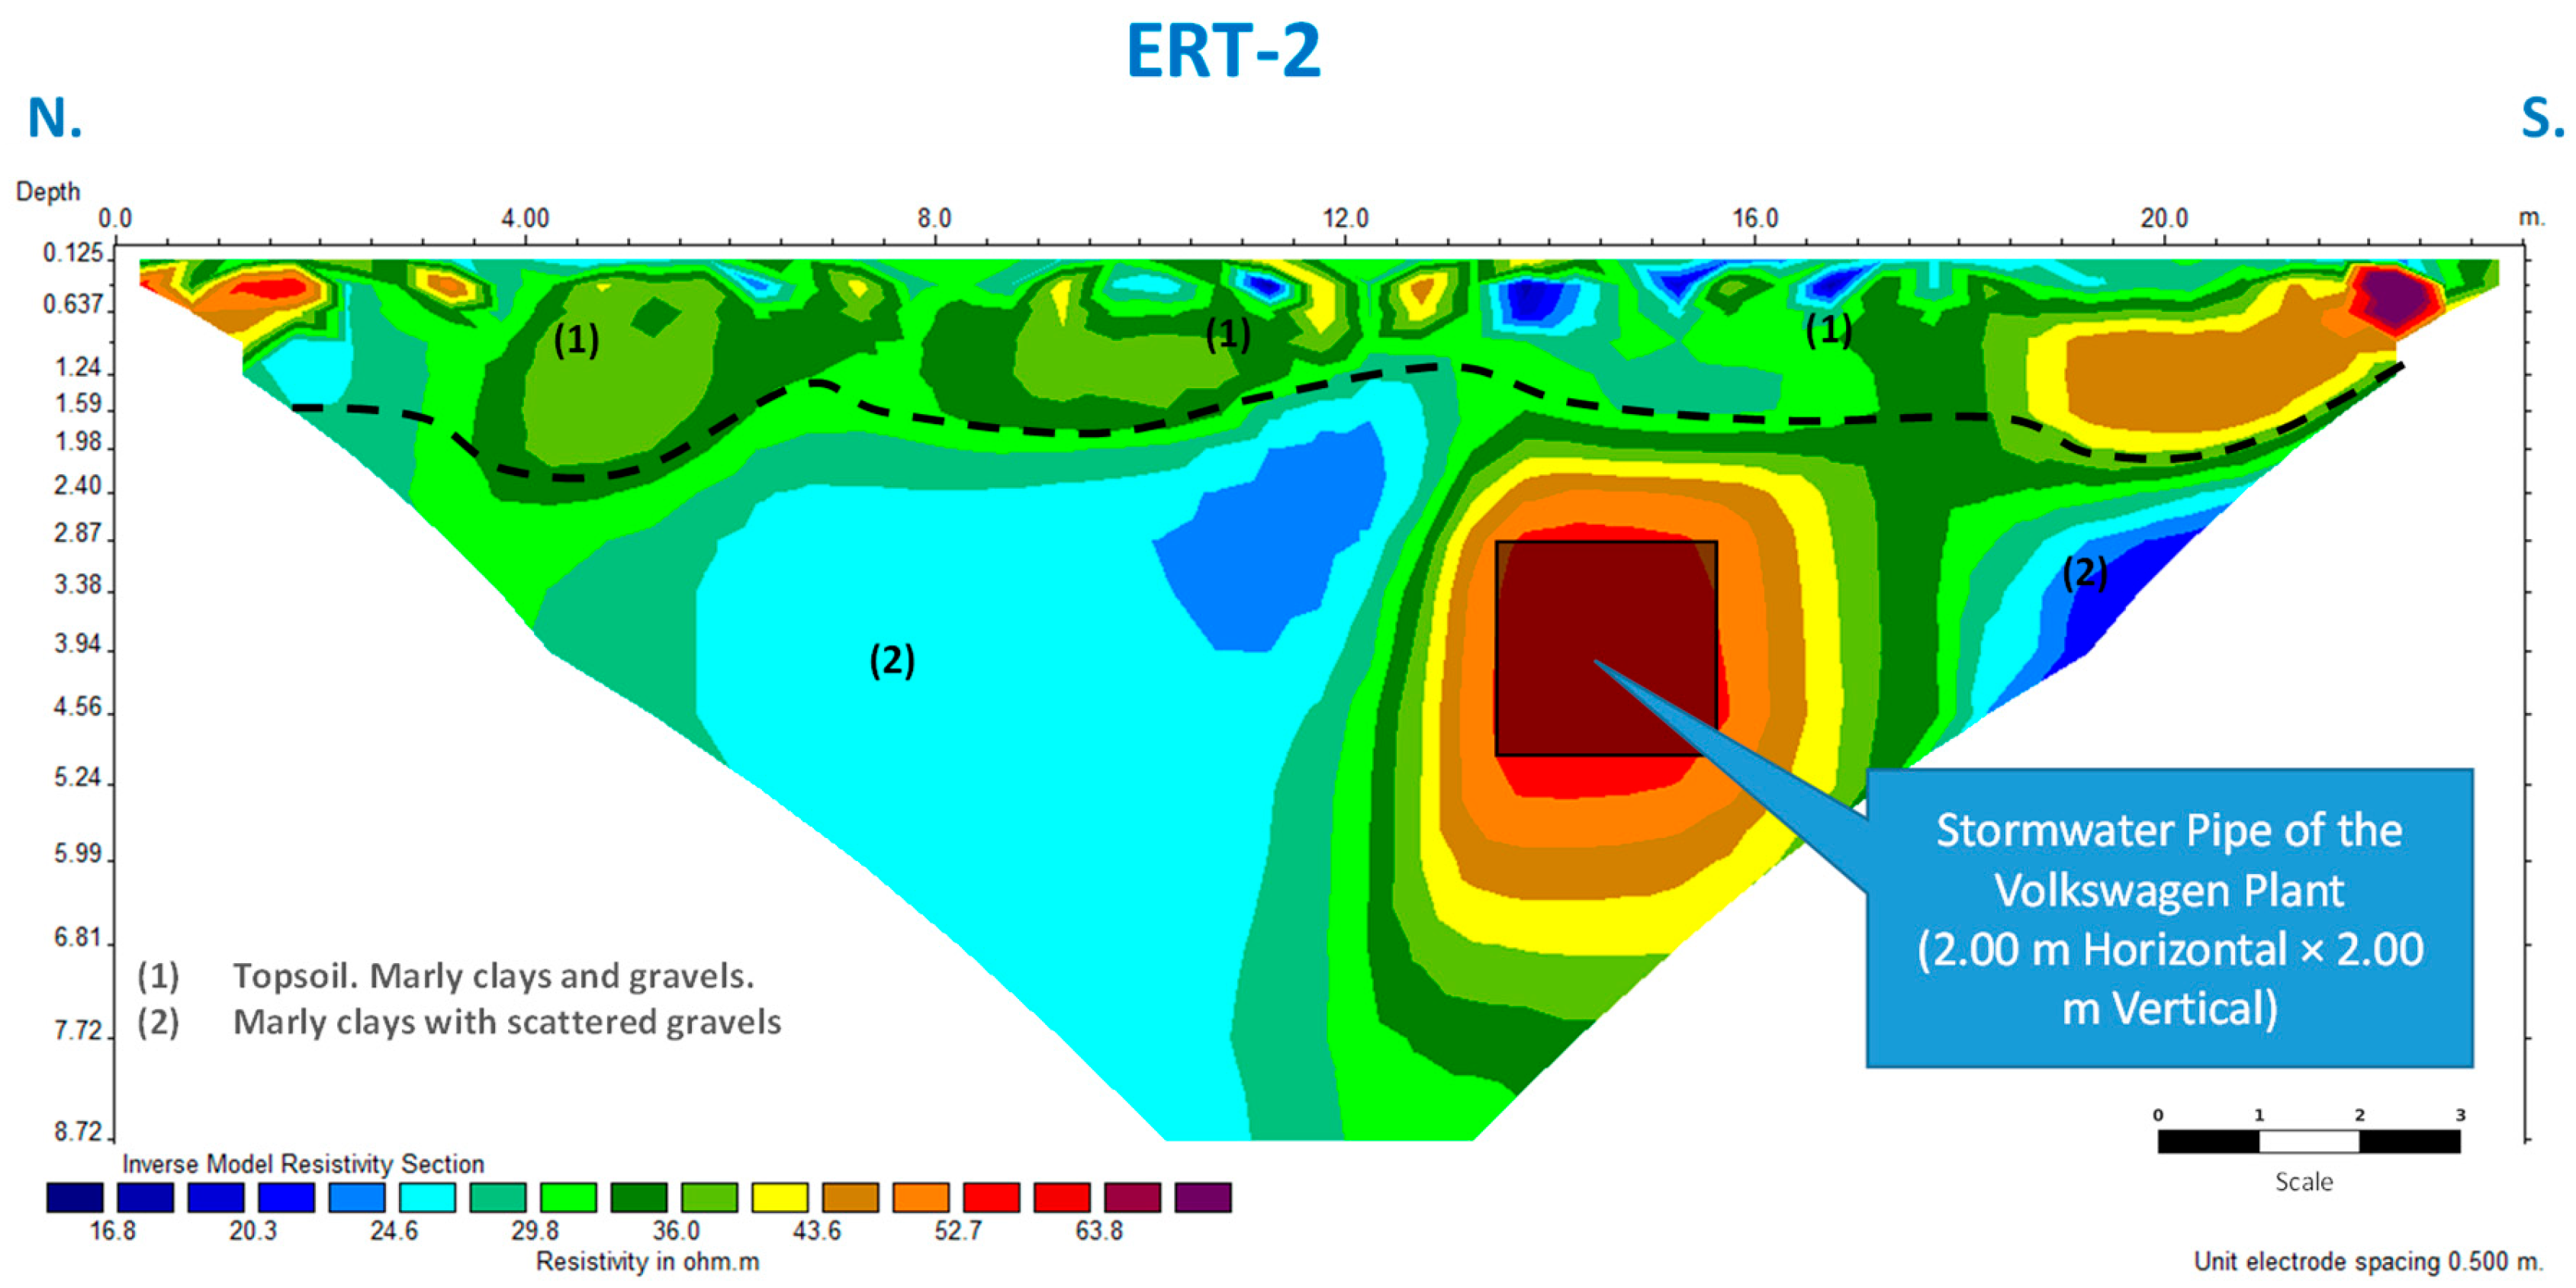
Figure 11.
Inverted model of ERT-3 profile showing the resistive anomaly attributed to the sewer pipe nº2.
Figure 11.
Inverted model of ERT-3 profile showing the resistive anomaly attributed to the sewer pipe nº2.
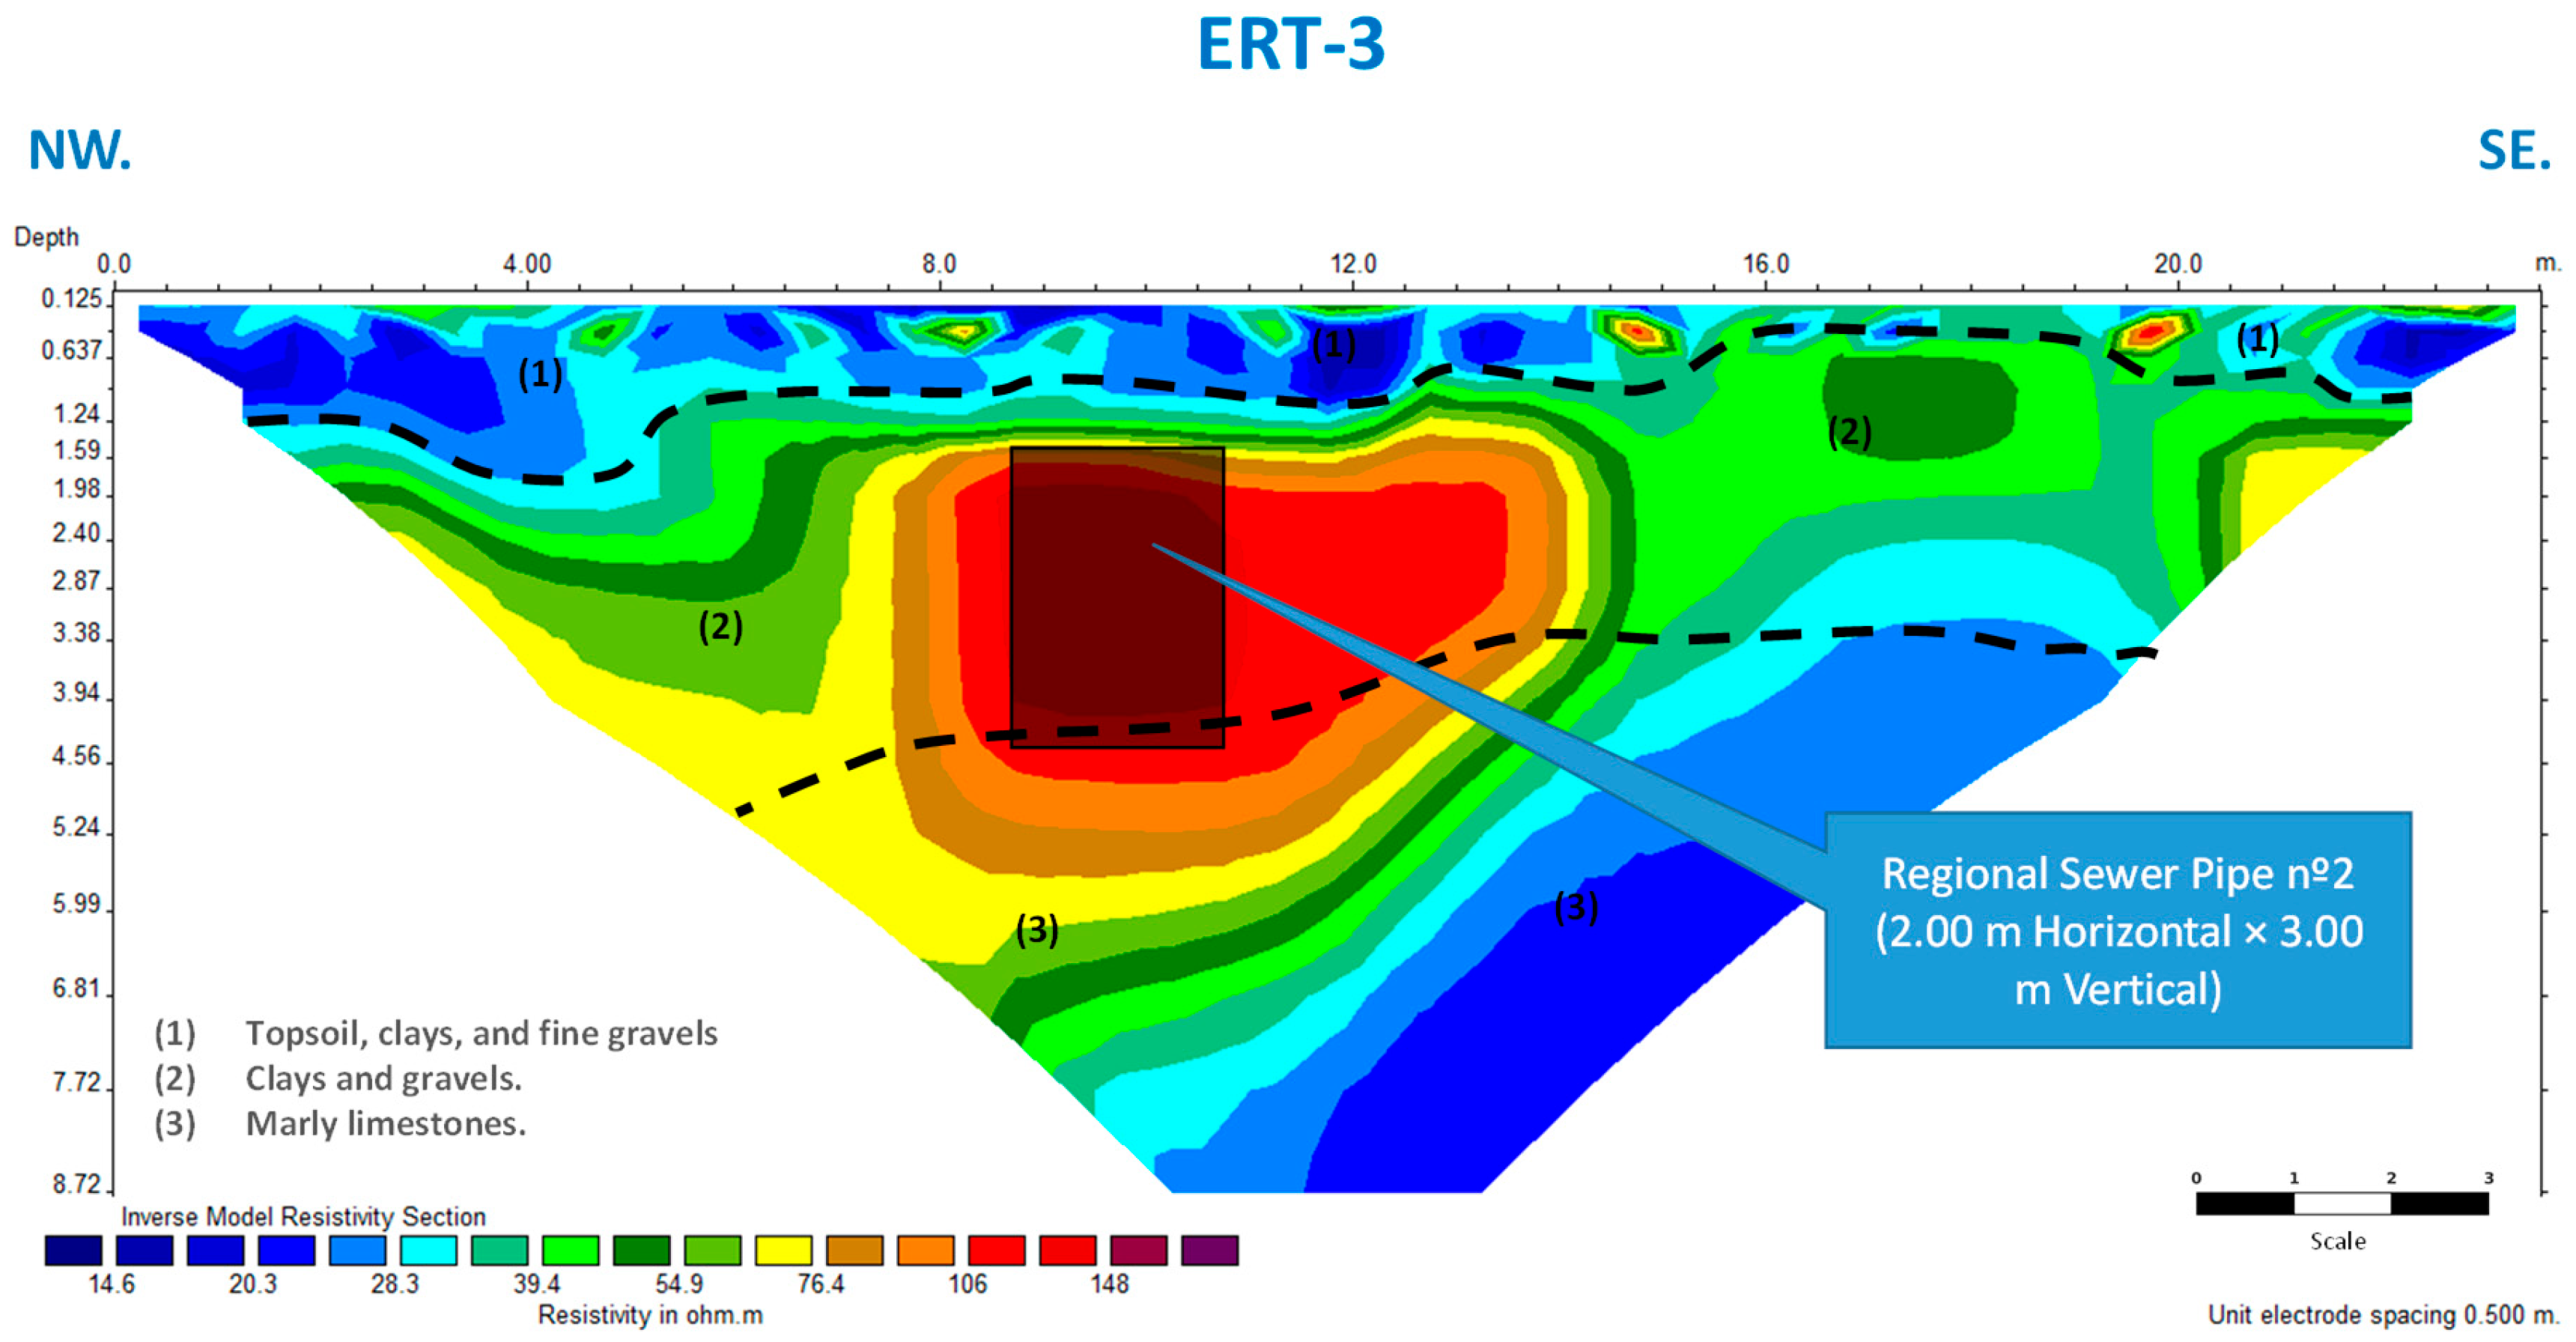
Figure 12.
Ground Penetrating Radar (GPR) profile acquired parallel to the ERT-3 line using 250 MHz and 500 MHz antennas. Source: field data collected by the authors. Processed with Reflex2DQuick software.
Figure 12.
Ground Penetrating Radar (GPR) profile acquired parallel to the ERT-3 line using 250 MHz and 500 MHz antennas. Source: field data collected by the authors. Processed with Reflex2DQuick software.
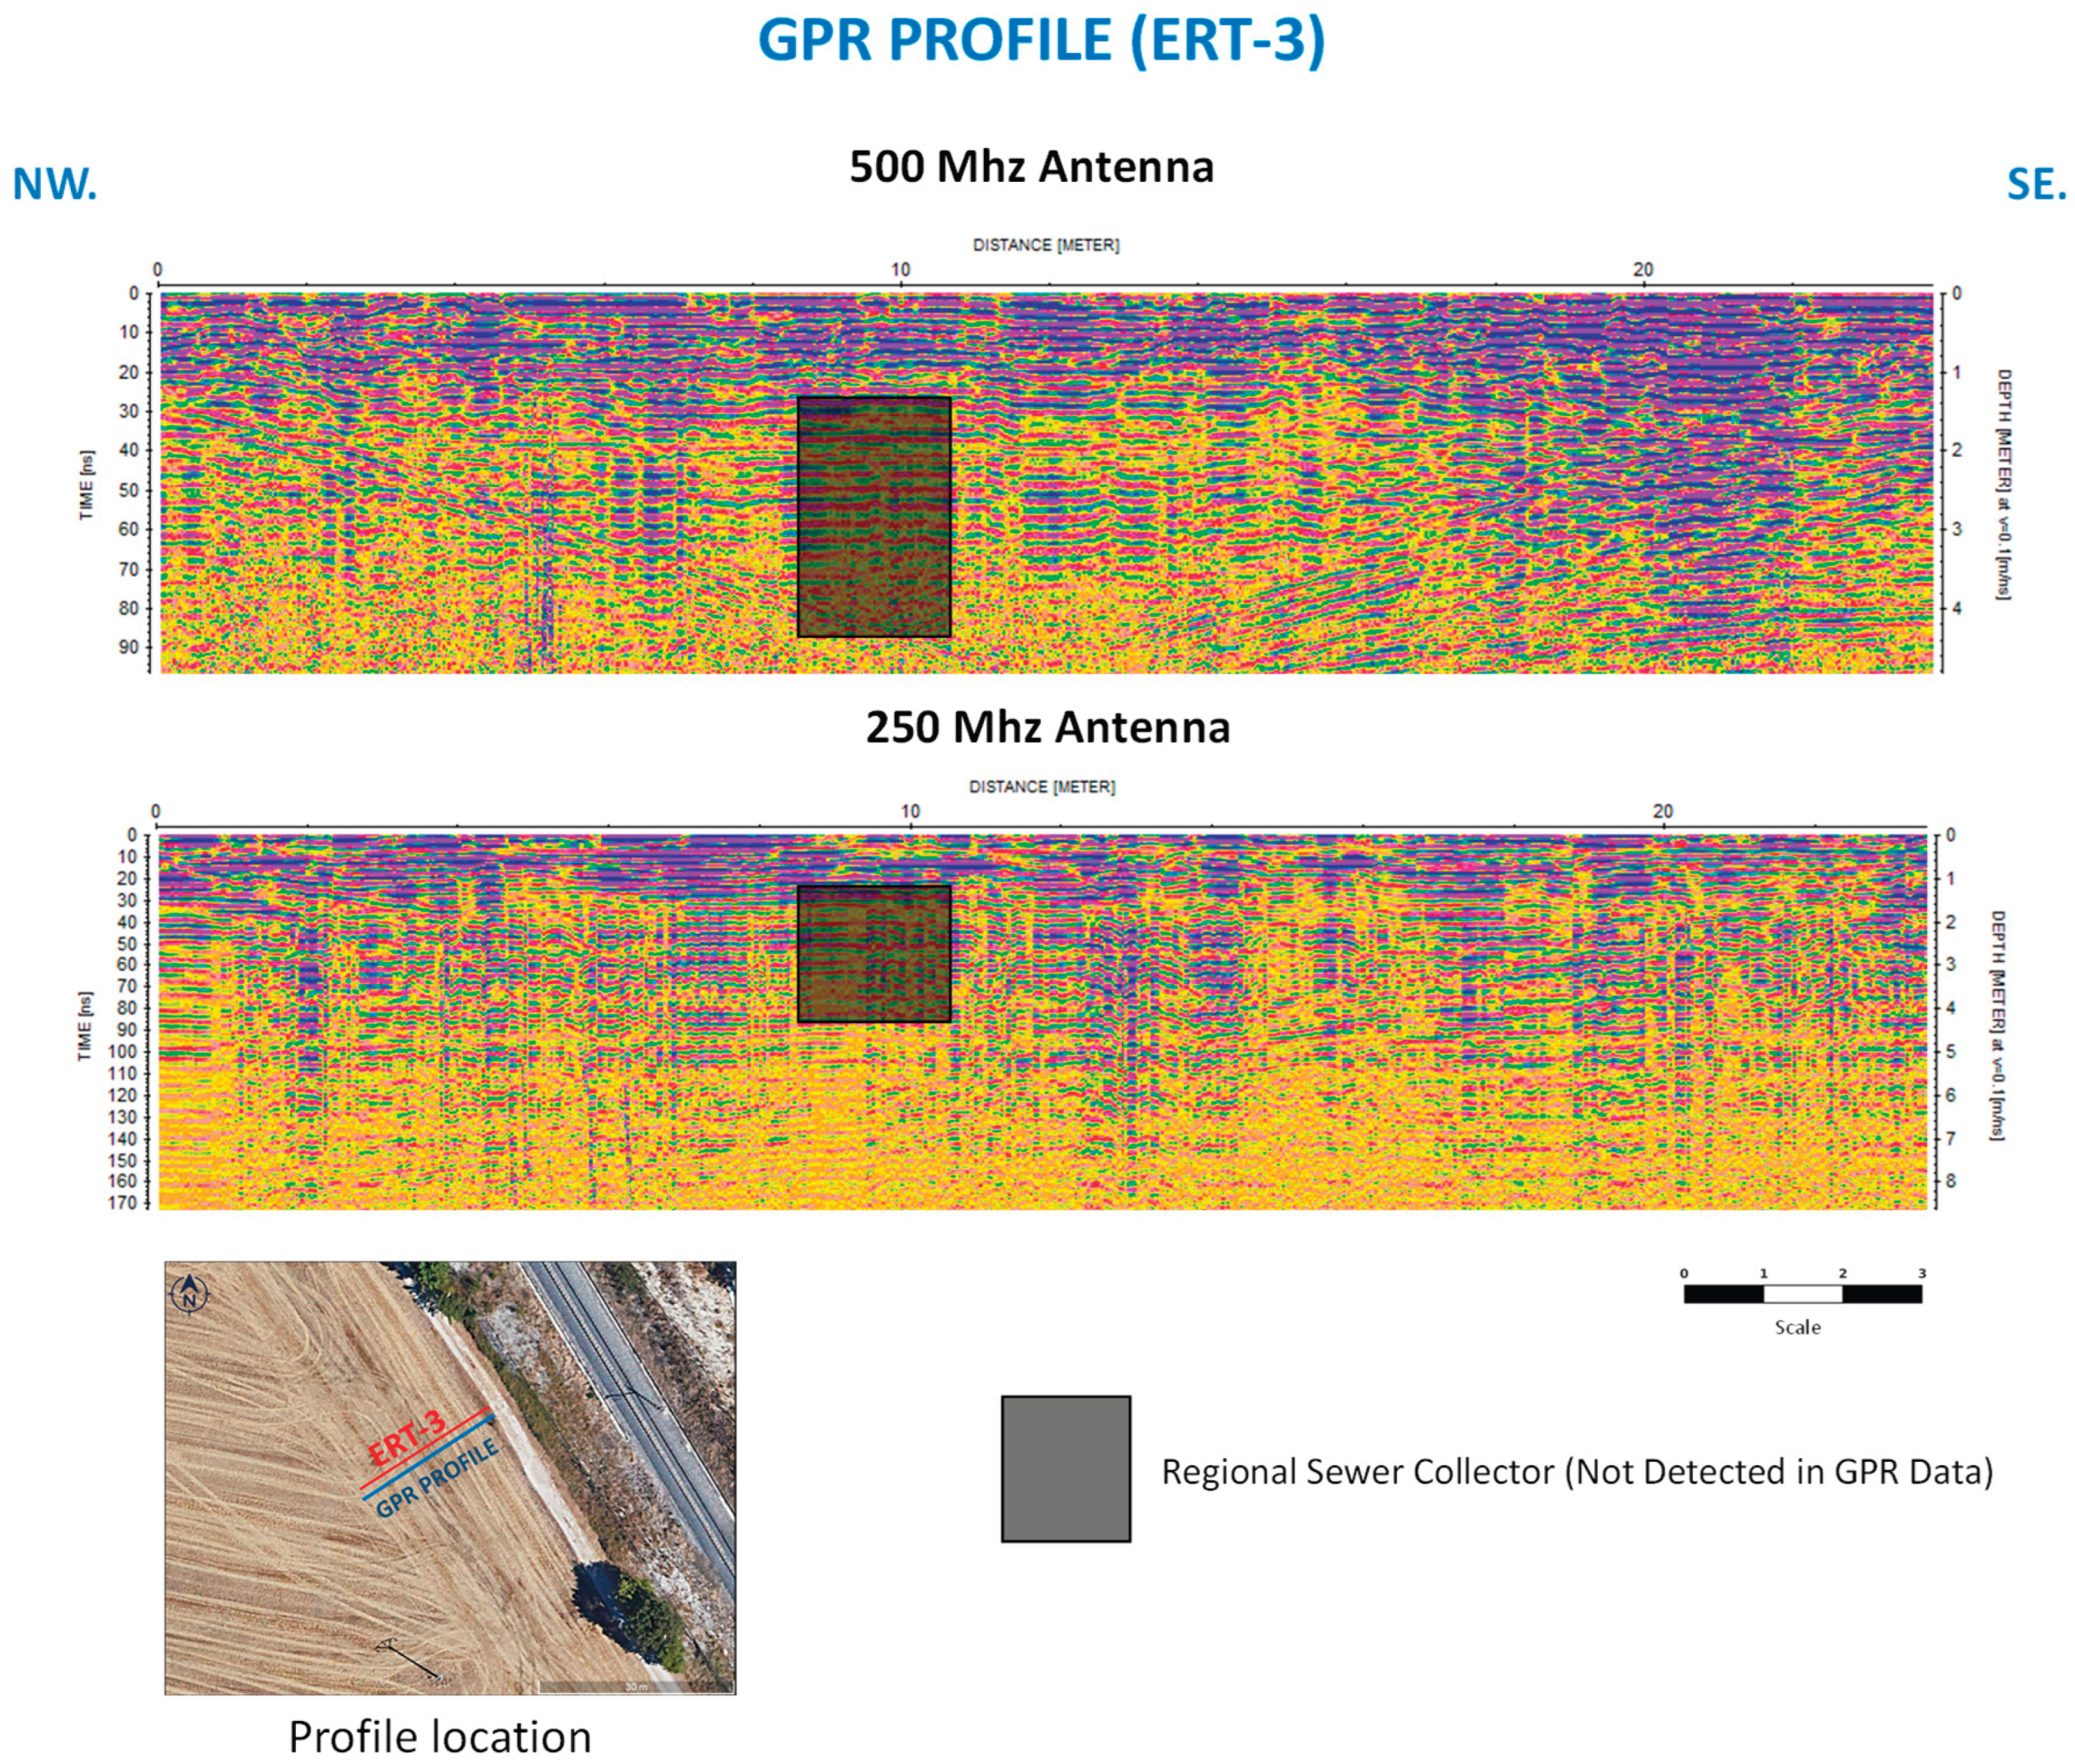

Table 1.
Representative ranges of GPR signal penetration and attenuation in different soil types based on their electrical conductivity.
Table 1.
Representative ranges of GPR signal penetration and attenuation in different soil types based on their electrical conductivity.
 |
|---|
Table 2.
Summary of borehole data used for geological validation of ERT interpretations.
 |
|---|
Disclaimer/Publisher’s Note: The statements, opinions and data contained in all publications are solely those of the individual author(s) and contributor(s) and not of MDPI and/or the editor(s). MDPI and/or the editor(s) disclaim responsibility for any injury to people or property resulting from any ideas, methods, instructions or products referred to in the content. |
© 2026 by the authors. Licensee MDPI, Basel, Switzerland. This article is an open access article distributed under the terms and conditions of the Creative Commons Attribution (CC BY) license (http://creativecommons.org/licenses/by/4.0/).
Copyright: This open access article is published under a Creative Commons CC BY 4.0 license, which permit the free download, distribution, and reuse, provided that the author and preprint are cited in any reuse.


