
Submitted:
04 January 2026
Posted:
06 January 2026
You are already at the latest version
Abstract
Aridity represents a fundamental climatic constraint governing water resources, eco-system functioning, and agricultural systems in transitional climate zones. This study examines the spatial organization and temporal variability of aridity and thermal con-tinentality in North Macedonia using observational records from 13 meteorological stations distributed across contrasting altitudinal and physiographic settings. The analysis is based on homogenized monthly and annual air temperature and precipitation series covering the period 1991–2020. Aridity and continentality were quantified using the De Martonne Aridity Index (IDM), the Pinna Combinative Index (IP), and the Johansson Continentality Index (JCI). Temporal consistency and trend behavior were evaluated using Pettitt’s nonparametric change-point test, linear regression, the Mann–Kendall test, and Sen’s slope estimator. Links between aridity variability and large-scale atmospheric circulation were examined using correlations with the North Atlantic Oscillation (NAO) and the Southern Oscillation Index (SOI). The results show a spatially consistent and statistically significant increase in mean annual air temper-ature, with a common change point around 2006, while precipitation displays strong spatial variability and limited temporal coherence. Aridity patterns display a strong altitudinal control, with extremely humid to very humid conditions prevailing in mountainous western regions and semi-humid to semi-dry conditions dominating lowland and southeastern areas, particularly during summer. Trend analyses do not reveal statistically significant long-term changes in aridity or continentality over the study period, although low-elevation stations exhibit weak drying tendencies. A mod-erate positive association between IDM and IP (r = 0.66) confirms internal consistency among aridity indices, while summer aridity shows a statistically significant relationship with the NAO. These results provide a robust climatic reference for North Mace-donia, establishing a first climatological baseline of aridity conditions based on multi-ple indices applied to homogenized observations, and contributing to regional assess-ments of hydroclimatic variability relevant to climate adaptation planning.
Keywords:
aridity
; meteorology
; Climate variability
; De Martonne index
; Pinna Combinative Index
; Johansson Continentality Index
; trend analysis
1. Introduction
In recent decades, climate variability and climate change have been central topics in numerous scientific studies. Global climate change, driven by both natural processes and anthropogenic influences, represents a major environmental challenge of the twenty-first century [1,2,3,4,5]. Increased attention from governments, the scientific community, and the general public underscores the urgency of understanding these changes and their effects [6,7]. Temperature fluctuations, the rate of change, and associated phenomena such as rising sea levels, floods, droughts, and aridity underscore the broader implications of climate change [8]. Seasonal analyses reveal a consistent warming trend in near-surface air temperatures, with the most pronounced increase occurring during winter [5].
Aridity plays a crucial role in understanding climatic conditions and natural processes, serving as both an indicator of plant growth and a determinant of landscape characteristics. Evaluation of the aridity can be managed through the widely used specific climatic parameters. Parameters in which there is a defined relationship between air temperature and precipitation are known as “aridity indices” and represent a useful tool in their quantification [9]. However, formulation of aridity indices is not straightforward due to the nature of aridity. Use of mean annual precipitation as an index of aridity ignores the importance of air temperature and evaporation. Aridity indexes that have gained widespread acceptance directly or indirectly take into account all three factors [10].
To quantify aridity, numerous climatic indices have been formulated, generally calculated as a ratio between some specific cli¬matic indicators. For example, the Lang Rain Factor [11], De Martonne Aridity Index [12], Emberger Aridity Index [13], Gračanin’s rain factor for the vegetation period (1950) [14], Seljanin’s hydrothermal coefficient (1958) [15], Erinç aridity index (Erinç, 1965) [16] and Pinna Combinative Aridity Index (Zambakas, 1992) [17] are calculated as the ratio of precipitation and air temperature. Since these indices are derived from different climatic variables (calculated at monthly, annual scale, vegetation period), they provide heterogenous perspectives in aridity analysis. Also, there are some different approaches in determining aridity such as: Thornthwaite aridity index (1948) [18], Budyko’s equation (1951) [19], UNESCO aridity index (UNESCO, 1979) [20] and FAO aridity index (FAO, 1989) [21]. Thornthwaite (1948) [18] introduced an aridity index as the ratio between annual precipitation and potential evapotranspiration. A few years later, Budyko (1951) [19] offered a new approach by considering the heat and water balance equations of the Earth’s surface. The Radiational Index of Dryness (RID) was the ratio of the mean annual net radiation (i.e. the radiation balance) to the product of the mean annual precipitation times the latent heat of vaporization for water. The UNESCO aridity index is based on the ratio of average annual precipitation to potential evapotranspiration. This index, originally developed by UNESCO (1979) [20] to map drylands, remains a widely used tool for assessing and projecting global aridity and its impacts. The FAO Aridity Index (1989) [21] measures a region's dryness by calculating the ratio of annual precipitation to potential evapotranspiration. This index is a critical tool for assessing moisture availability, managing land resources for agriculture, and understanding the long-term impacts of climate change on water resources and drylands.
Furthermore, some other indices, such as the Johansson Continentality Index and the Kerner Oceanity Index, differentiate continental and maritime climate [22,23]. Recent advances in the archiving and collection of data have allowed worldwide monitoring of aridity as opposed to hindsight assessments. The most commonly used satellite measure is the Normalized Difference Vegetation Index (NDVI). The assessment of aridity changes using remote sensing like NDVI measures vegetation greenness, which declines in dry conditions. However, this requires images of medium-high spatial resolution over a long period of time and high-quality data derived from Landsat [10,24].
Since the 1950s, aridity has increased across most of the Earth’s surface, a trend intensified by the ongoing effects of global warming induced by anthropogenic activities [25]. Sardans et al. (2024) [26] concluded that from 1960 to 2023, 27.9% of the global land surface became significantly more arid, while 20.5% became significantly less arid. This indicates a shift towards drier climates, with humid, semi-humid, and semi-arid areas decreasing by 8.51, 1.45, and 0.53 million-km², respectively, and arid and hyper-arid areas increasing by 6.34 and 4.18 million-km², respectively. Especially vulnerable regions on global scale according to this study are Europe, North Africa and the Middle East. The spatio-temporal dynamics and variability of the aridity was investigated in details on regional scale: Greece [27,28,29], Italy [30,31], the Iberian Peninsula [32,33], Turkey [23.34], Algeria [35], the Middle East [36], Lebanon [37], Iran [38,39] and Iraq [40]. Thornthwaite (1948) [18] introduced an aridity index as the ratio between annual precipitation and potential evapotranspiration. Other indices, such as the Johansson continentality index and the Kerner oceanity index, differentiate between continental and oceanic climates [22,23].
Additionally, Mărgărit-Mircea (2021) [41] used the Johansson Index of Continentality, the Kerner Index of Oceanity, the De Martonne Aridity Index, the Pinna Combinative Index and the UNEP Aridity Index. This study determined that the Southeastern Europe, the Balkan Peninsula, the Iberian Peninsula, the Apennine Peninsula, and Mediterranean islands consistently exhibit a dry climate according to all indices. Also, Beštáková et al. (2023) [42] assessed the spatial distribution of arid and humid regions in Europe using the Aridity Index (1950–2019) identifying the Balkan Peninsula as predominantly arid. Numerous authors dealt with aridity occurrence in the Balkan countries, for instance in Serbia (e.g., [43,44,45,46]), Montenegro [47], Croatia [48,49], Romania (e.g. [50,51,52]), Bulgaria [53].
However, it is difficult to identify similar and robust aridity research on national scale. Aridity in North Macedonia has been examined by using FAO Aridity Index in Agro-Ecological Atlas of North Macedonia [54]. In this study, authors revealed the classes of semi-arid and dry sub-humid climate. These two classes delineate most of the agriculture areas in the central and southeast part of the country, which covers the driest areas. On the other hand, the humid class covers also some important agriculture areas in the western part of the country with more humid climatic condition. Recent studies indicate increasing of the future aridity conditions (RCP8.5 scenario) in the Southeastern Europe, including territory of North Macedonia. The Balkan Peninsula, including North Macedonia, has experienced a moderate increase in extreme climate events, particularly since the 1980s [55]. Additionally, aridity trends are interpreted within the broader context of paleoclimatic phenomena, particularly those occurring during the Middle and Late Pleistocene. Carvalho et al. (2022) [56] suggest strong reduction of Aridity Index for South and Southeastern Europe (2081-2100). Furthermore, [57,58] observed semy-dry conditions (2071-2100) according to De Martonne classes in central, south and southeastern parts of North Macedonia. The lack of adequate recent studies and above-mentioned facts justify the importance of reseach the spatio-temporal aridity patterns in North Macedonia.
For the purpose of this study, the Johansson Continentality Index, the De Martonne Aridity Index and the Pinna Combinative Index were selected as the most suitable tools for analyzing spatio-temporal conditions in North Macedonia. These climate indices were calculated using air temperature and precipitation data from 13 meteorological stations over a 30-year standard climatological interval (1991-2020) providing insight into the aridity dynamics on national scale. By examining climate data spanning several decades, this research aims to provide valuable insights into the region’s recent climate variability. Additionally, the objectives of this study are: (1) to analyze and discuss the trend characteristics of selected climate indices in details using Mann-Kendall non-parametric test; (2) to quantify the significance of changes on monthly, seasonal and annual scale; (3) to provide insight into spatial changes of indices using GIS tools and suitable interpolation technique, (4) to correlate our findings with the North Atlantic Oscillation Index (NAOI) and Southern Oscillation Index (SOI). By evaluating long-term trends and identifying regional climate shifts, this research contributes to the broader understanding of climate variability and its potential impacts on natural ecosystems and human societies.
2. Materials and Methods
2.1. Study area and data
North Macedonia, covering approximately 25,713 km² in the southern Balkan Peninsula, is characterized by a predominantly mountainous landscape, accounting for nearly 79% of its territory. In contrast, lowland plains constitute approximately 19%, while lakes and reservoirs occupy the remaining 2% of the total land area (Figure 1). The region exhibits pronounced geomorphological variability, with frequent alternations between mountainous terrain and valley systems, resulting in a relatively high average slope of 15.4° [59]. The mountain ranges of North Macedonia are arranged in sequences, forming effective barriers that reduce the inflow of moist air masses, particularly from the west. This orographic influence increases aridity in the central part of the country. The country's climatic conditions are shaped by the interplay of Mediterranean, continental, and orographic influences, contributing to significant spatial and temporal variations in air temperature and precipitation patterns [60]. The semiarid nature of the region is reflected in an average annual precipitation of approximately 500–700 mm. For the purposes of this study, observational data from 13 meteorological stations operated by the Hydrometeorological Service of North Macedonia (UHMR) [61] were used (see Table 1). However, ongoing climatic shifts have intensified extreme weather events, with an observable increase in the frequency and magnitude of convective storms and heavy precipitation episodes over recent decades.
Based on the updated Köppen–Geiger classification [62], North Macedonia exhibits a complex climatic pattern resulting from the interaction of topography, continental influences, and Mediterranean air masses (see Table 2). Lowland regions and river valleys, including the Vardar and Strumica basins, are characterized by a Cfa climate, corresponding to a humid subtropical regime with hot, dry summers and mild, wet winters, and mean annual air temperatures around 11–12 °C. Higher western and northwestern areas, such as those surrounding Bitola, fall under the Cfb subtype, representing a temperate oceanic climate with moderate summers, cool winters, and relatively uniform precipitation throughout the year, with mean annual air temperatures near 10–11 °C. Northern and eastern parts of the country are dominated by the Dfb subtype, a humid continental climate with cold winters, warm summers, and pronounced seasonal air temperature contrasts, with mean annual air temperatures around 8 °C. This distribution reflects both altitudinal and latitudinal gradients, underscoring the spatial variability of climate across North Macedonia, and aligns with observed trends of regional warming and precipitation variability over recent decades.
2.2. Pettitt’s homogeneity test
To evaluate the homogeneity of the climatic time series and identify potential abrupt shifts, we employed Pettitt's nonparametric change-point detection method [63]. This approach is particularly valuable for pinpointing the onset of statistically meaningful alterations in long-term records, such as those of air temperature and precipitation, where gradual trends may be confounded by sudden discontinuities.
Pettitt's test operates under the premise that a change point divides the series of n observations into two segments: the initial portion (up to time t) governed by cumulative distribution F1, and the subsequent segment by F2. A true shift implies that F1 ≠ F2, manifesting as a non-random deviation in the central tendency at some point τ. The null hypothesis (H0) posits a single, uniform distribution across the entire series, indicative of homogeneity. The alternative (H1) posits a structural break at τ, driven by an exogenous factor altering the mean or median.
The test statistic for a given split t is the Mann-Whitney-type Ut,n, defined as:
where sgn denotes the sign function (+1 for positive differences, -1 for negative, and 0 otherwise). The overall test statistic K is then the maximum absolute deviation:
under H0, K follows an asymptotic distribution approximated by:
where ρ represents the two-tailed significance probability. Rejection of H0 occurs when p falls below a chosen α level (e.g., 0.05), with the corresponding t identifying the change point. All datasets underwent rigorous quality assurance by the UHMR [61]. We attribute any identified discontinuities to climatic signals rather than observational artifacts.
2.3. Johansson Continentality Index (JCI)
The Johansson Continentality Index (JCI) serves as a quantitative measure of the degree to which continental influences shape regional climatic conditions. It has been widely adopted in climatological and biogeographical research to characterize the transition between maritime and continental climates [22,64]. The index is determined using the following expression:
where: A represents the annual air temperature amplitude, calculated as the difference between the mean air temperature of the warmest and coldest months (°C); and φ denotes the geographical latitude of the location, expressed in radians. This formulation integrates both thermal variability and latitudinal position, enabling the classification of climatic regimes along a continuum from oceanic to strongly continental types. The corresponding intervals of JCI values and their interpretative classes are summarized in Table 3.
2.4. The De Martonne aridity index
The De Martonne Aridity Index (IDM) is a well-established and extensively utilized metric in applied climatology for assessing aridity and humidity conditions [66,67]. Despite being one of the earliest aridity indices, it remains a fundamental tool in climatic classification and is widely applied in contemporary research to delineate dry and humid regions across diverse geographical settings [22,35,68]. The annual IDM is defined as follows:
where, P represents the total annual precipitation (mm), and T denotes the mean annual air temperature (°C). The inclusion of a constant term in the denominator ensures numerical stability and prevents division by low-temperature values. The index can also be computed at shorter temporal scales, such as monthly and seasonal intervals. The monthly IDM is given by:
where Pm corresponds to the monthly precipitation (mm), and Tm represents the mean monthly air temperature (°C). For seasonal assessments, the index is expressed as:
where Ps and Ts refer to the seasonal precipitation (mm) and mean seasonal air temperature (°C), respectively. De Martonne's classification system categorizes climatic conditions based on IDM values, providing a systematic framework for distinguishing between arid, semi-arid, humid, and extremely humid regions. The classification scheme is presented in Table 4.
De Martonne developed a climate classification based on the values of the IDM, as shown in Table 4. This classification illustrates that an increase in IDM values, assuming a constant air temperature, corresponds to an increase in precipitation, and vice versa. Essentially, higher IDM values reflect more humid conditions, while lower values indicate drier climates. This relationship emphasizes the role of precipitation in shaping the moisture balance of a region, with IDM acting as a key indicator of climate classification.
2.5. The Pinna combinative index
Pinna’s combinative or multiannual aridity index [7,17,22,23,69] represents a climatological metric designed to integrate both long-term and seasonal hydrothermal characteristics. It is formally expressed as:
where:
Pma denotes the total annual precipitation (mm),
Tma represents the mean annual air temperature (°C),
P’d is the total precipitation during the driest month (mm),
T’d refers to the mean air temperature of the driest month (°C).
According to the interpretative framework proposed by Baltas (2010) [70], values of Ip < 10 signify arid climatic regimes. When Ip ranges between 10 and 20, the climate is categorized as semiarid Mediterranean, typically associated with sclerophyllous vegetation characteristic of the formal Mediterranean biome. In contrast, values of Ip > 20 denote humid conditions (Table 5).
Unlike the IDM, which allows for intra-annual temporal resolution, Pinna’s index is specifically calibrated for multiannual analyses. As such, it serves as a robust indicator for identifying climatological dryness during the most precipitation-deficient period of the year—an aspect of critical relevance in the context of agricultural planning and irrigation management.
2.6. Mann – Kendall trend test
Another widely used method for detecting temporal trends in hydrometeorological time series is the Mann–Kendall (MK) test, a non-parametric statistical approach commonly applied to air temperature, precipitation, and discharge records. In this study, it was employed to evaluate both the direction and the significance of monotonic trends, while the magnitude of the detected trends was estimated using Sen’s slope estimator [71]. The test assesses the relative ordering of data values by examining the number of positive and negative differences between subsequent observations. If a trend is present, the cumulative sign values exhibit a consistent tendency to either increase or decrease. The null hypothesis (H₀) posits the absence of a trend, whereas the alternative hypothesis (H₁) assumes the existence of a monotonic trend.
where the sign function sgn(xj−xi) is defined as
The variance of S, denoted as VAR (S), is given by:
where n is the sample size, g is the number of tied groups, and tp represents the number of observations in the ptℎ group. The standardized test statistic ZMK is calculated as:
A positive (negative) value of ZMK indicates an increasing (decreasing) trend over time. For a given significance level α1 where 0<α<0.5, and Z1−α is the (1−α)-quantile of the standard normal distribution, the null hypothesis H0 is rejected in favor of H1 when:
2.7. GIS software
To assess aridity in North Macedonia using the JCI, IDM, and IP indices, a custom C# software tool was developed to compute both indices annually for 13 meteorological stations, classifying their climate categories [72]. For spatial analysis, QGIS (v.3.38), an open-source geographic information system, was employed to map and interpolate aridity indices using the ordinary kriging method via its integration with SAGA GIS (v. 9.9.1) tools. Ordinary kriging was chosen for its ability to incorporate autocorrelation, considering both spatial arrangements and distances between points to minimize estimation errors, generating surface rasters with a spherical semivariogram model [73,74]. This approach, combining C# for index calculations with QGIS (v. 3.38) and SAGA (v. 9.9) for spatial interpolation and visualization, provides a robust framework for analyzing aridity trends across North Macedonia (Figure 2).
Pearson’s correlation coefficients [75] and associated p-values were computed using Python's scipy.stats.pearsonr function, which calculates rp as:
where xi represents IDM values and yi represents NAOI or SOI values, with means x̄ and ȳ. Statistical significance was tested at the 5% level (p < 0.05). All calculations were carried out in Python 3 using the SciPy package, specifically the Pearson’s function from the scipy.stats module.
3. Results and discussion
3.1. Pettitt’s homogeneity test
Before all calculation procedures the Pettitt’s homogeneity test was performed (Figure 3). Application of Pettitt’s nonparametric test to annual climate series (1991–2020) from 13 meteorological stations revealed contrasting change-point behavior for air temperature and precipitation. Annual mean air temperature (Tmean) exhibited a highly coherent response, with a statistically significant change point detected in 2006 at all stations. Test statistics (Kt) ranged from 160 to 204, with p-values between 0.00013 and 0.00406, indicating rejection of the homogeneity hypothesis at the 0.05 level. Positive Ut,n discontinuities indicate an abrupt post-2006 warming, with estimated increases of 0.8–1.5 °C relative to the pre-change period. The uniform timing and magnitude of these shifts suggest a dominant regional-scale forcing, consistent with the accelerated warming observed in the Balkan region since the early 2000s.
In contrast, annual total precipitation (Ptotal) showed pronounced spatial heterogeneity. Significant change points were identified at four stations (Mavrovo, Demir Kapija, Berovo, and marginally Prilep), all occurring in 2001, with Kt values between 117 and 149 and p-values below 0.05, except for the borderline case at Prilep. Negative Ut,n discontinuities indicate post-change decreases of approximately 150–300 mm yr⁻¹. No statistically significant shifts were detected at the remaining nine stations (p = 0.067–0.522). These results highlight a clear divergence between temperature and precipitation responses, with coherent regional warming contrasted by spatially variable and locally controlled precipitation changes.
3.2. Air temperature, precipitation, and aridity classification
To evaluate the spatial variation of aridity across North Macedonia, mean annual air temperature (MAT) and mean annual precipitation (MAP) were analyzed for the 1991–2020 reference period, providing critical insights into regional climatic patterns (Figure 4). These parameters underpin the calculation of the IDM. The IDM quantifies aridity, with higher values indicating more humid conditions and lower values denoting aridity. Data from 13 meteorological stations, spanning diverse topographic settings from low-elevation valleys to high-altitude mountainous regions, were used to assess spatial variability in these parameters.
The MAP values exhibit pronounced spatial heterogeneity, driven by topographic and geographic factors. The lowest MAP, 472.1 mm, is recorded at Štip, a station in the eastern lowlands at approximately 300 m elevation. This low precipitation reflects the region’s continental climate and rain-shadow effect, as it lies leeward of the western mountains. In contrast, the highest MAP, 1,058.5 mm, is observed at Lazaropole, located in the western mountainous region at <1,330 m elevation. This elevated precipitation results from orographic forcing, where moist air masses ascending the steep topography undergo adiabatic cooling, leading to enhanced condensation and rainfall. Other high-altitude stations, such as Mavrovo (<1,250 m), also exhibit high MAP values, reinforcing the role of elevation in amplifying precipitation through orographic effects.
Similarly, MAT values display significant spatial variability, primarily influenced by elevation and proximity to Mediterranean or continental climatic influences. The highest MAT, 15.5°C, is recorded in Gevgelija, a low-elevation station (<60 m) in the southeastern part of the country, which experiences a Mediterranean climate characterized by mild winters and warm summers. In contrast, the lowest MAT, 7.6 °C, is observed at Lazaropole and Mavrovo, both situated at high altitudes in the western mountains. This lower air temperature is attributed to the environmental lapse rate, approximately 6.5 °C per 1,000 m, which reduces air temperatures at higher elevations. Additionally, Lazaropole holds the record for the absolute minimum air temperature in North Macedonia, -31.2 °C, recorded during a winter period of intense radiative cooling under clear skies and stable atmospheric conditions. At higher altitudes, dynamic atmospheric circulation over steep slopes facilitates mixing and prevents prolonged stagnation of cold air, unlike in valleys and depressions, where cold air pooling can exacerbate low air temperatures.
As a major urban and industrial center, the climate of Skopje is significantly modified by the urban heat island (UHI) effect, a phenomenon where urban areas exhibit higher air temperatures than surrounding rural regions due to anthropogenic activities and infrastructure [76]. The UHI effect in Skopje, driven by heat-absorbing surfaces (e.g., concrete, asphalt), reduced vegetation, and waste heat from industrial and vehicular sources, elevates local air temperatures, particularly at night. Kaplan et al. (2018) [77] estimate that Skopje’s UHI can increase air temperatures by 1–3 °C compared to nearby rural areas, exacerbating aridity by enhancing evapotranspiration rates. This urban modification compounds the semi-dry conditions indicated by Skopje’s low IDM, posing challenges for urban water management and heat stress mitigation.
Lazaropole, with an MAT of 7.6 °C, is the meteorological station with the lowest mean annual air temperature in North Macedonia, tied with Mavrovo. Its high-altitude location fosters colder conditions, and it is also the site where the absolute minimum air temperature of North Macedonia, -31.2 °C, was recorded. This extreme is attributed to radiative cooling in winter, amplified by clear skies and the station’s elevated, exposed position. In contrast to high-altitude stations, low-elevation valleys and depressions, such as those near Skopje and Štip, experience prolonged cold air pooling due to topographic sheltering, which can lead to air temperature inversions and locally lower minimum air temperatures. However, the dynamic circulation processes over steep slopes at higher altitudes, such as in Lazaropole, promote air mixing, reducing the persistence of extreme cold compared to valley bottoms. Thus, the western mountainous stations, exemplified by Lazaropole and Mavrovo, exhibit markedly more humid climates due to high precipitation and lower air temperatures, as reflected in their elevated IDM values. In contrast, stations in the central and eastern lowlands, such as Štip and Skopje, are characterized by greater aridity, driven by lower precipitation, higher air temperatures, and, in Skopje’s case, urban-induced warming. These patterns align with regional topographic and climatic gradients, emphasizing the critical roles of elevation, continentality, and urbanization in shaping local aridity conditions across North Macedonia.
3.3. JCI distribution
The application of the Johansson Continentality Index (JCI) across North Macedonia reveals the presence of three of the four classical JCI climate classes—Moderate Marine, Transitional, and Continental—over both natural and agricultural areas (hereafter abbreviated as NatA and AgrA, respectively). The Marine class is notably absent, reflecting the minimal influence of maritime air masses within the national territory (Figure 5).
Moderate Marine climates are primarily observed in the western highlands and northeastern uplands, where topographic complexity and elevation act to moderate thermal extremes. Stations in this category include Mavrovo (30.1), Lazaropole (27.2), and Kriva Palanka (30.9). The reduced annual air temperature range in these areas reflects a substantial attenuation of continental effects, resulting in conditions partially influenced by distant maritime air masses (Table 6). Transitional climates occur predominantly in eastern peripheral and western regions, characterized by intermediate annual thermal amplitudes. Representative stations include Berovo (32.7) in the eastern highlands and Ohrid (32.4) in the southwestern region. These locations exhibit neither strongly continental nor distinctly marine characteristics, producing moderate seasonal air temperature variability. The Continental climate class is widespread, dominating the lowlands and central valleys of the country. Stations representing this regime include Bitola (39.4), Demir Kapija (39.7), Kumanovo (38.6), Skopje (38.8), Strumica (38.5), Štip (38.4), and Gevgelija (38.2). These areas are subject to pronounced seasonal air temperature contrasts, a consequence of their distance from maritime influences and the limited topographic shielding, which enhances the annual air temperature amplitude.
Analysis of the aggregated annual JCI revealed significant fluctuations in the thermal continental influence across the period of study. The highest JCI values were recorded in 2017 (approximately 49.33) and 2000 (approximately 47.05). These high index values indicate the most pronounced degree of continentality experienced in these specific years, reflecting maximum average annual air temperature amplitudes. Conversely, the lowest JCI value observed was 2014 (approximately 26.96). According to the categorization scheme adopted, this value places the year 2014 within the Moderate Marine climate category (JCI interval 20–32).
Thus, the JCI results demonstrate a distinct spatial gradient of continentality in North Macedonia. Moderate Marine climates are confined to the western highlands and northeastern uplands, Transitional climates are distributed in western peripheral and eastern border regions, while Continental climates dominate the central valleys and lowlands, encompassing the majority of the national territory. This spatial pattern emphasizes the integrative influence of latitude, topography, and distance from maritime sources in shaping the continentality regime across the country.
3.3. Monthly analysis
According to the monthly values of the IDM (ImDM), six out of seven climate types are recognized. January and December are considered extremely humid, with the maximal value of 71.9 (Figure 6). February, March, April, October, and November are very humid, where February has the highest value reaching 51.7. May is humid. September is characterized as semi-humid. June is Mediterranean, while July and August are semi-arid, both with a value of 14.6.
The IDM reveals distinct spatial differentiation in climatic conditions across North Macedonia. The highest IDM values, 72.9 at Lazaropole and 71.6 at Mavrovo, classify these locations as extremely humid (IDM > 55), reflecting their high precipitation and cooler air temperatures driven by mountainous topography. These conditions support lush vegetation and water availability, characteristic of humid climates. In contrast, Štip (IDM = 22.2) and Skopje (IDM = 22.3) exhibit the lowest IDM values, placing them within the Mediterranean climate category (20 ≤ IDM < 24), indicative of semi-dry conditions. These lowland stations experience lower precipitation and higher air temperatures, contributing to greater aridity compared to the western highlands.
3.3. Seasonal analyses
The seasonal distribution of the IsDM across North Macedonia reveals pronounced climatic variability controlled predominantly by topography, elevation, and regional meteorological influences (Figure 7).
Winter is generally humid across the country, with a national mean IsDM of 58.7 (Table 7). Mountainous stations show extremely high humidity, with Mavrovo reaching 148.5 and Lazaropole 134.0, due to substantial precipitation (>300 mm) combined with low air temperatures (-1.2 to -0.7 °C). Lowland stations, including Skopje (35.4), Kumanovo (39.6), Prilep (34.3), and Strumica (46.4), exhibit semi-humid conditions, reflecting lower precipitation and warmer air temperatures (1–3 °C).
Spring displays generally humid conditions, national IsDM 33.0, with the highest indices in mountainous stations: Mavrovo (66.8) and Lazaropole (65.1), supported by moderate precipitation (<270 mm) and rising air temperatures (<6–7 °C). Lowland areas such as Skopje (26.7), Kumanovo (26.6), and Strumica (26.0) experience semi-humid climates due to slightly reduced rainfall and warmer air temperatures (<12–13 °C).
Summer shows the highest climatic heterogeneity, national IsDM 16.1. Mountainous stations maintain humid to semi-humid conditions: Mavrovo (20.9), Lazaropole (23.4), while lowlands experience pronounced aridity, for example, Gevgelija (12.3), Bitola (18.6), and Štip (17.9). High air temperatures (up to 27 °C) combined with reduced precipitation (<100–130 mm seasonally) explain the low summer indices in low-altitude stations. (see Table 8).
Autumn signals a return to humid conditions, national IsDM 33.1. Mountainous regions such as Mavrovo (66.8), Lazaropole (70.8), Berovo (53.0), and Ohrid (49.6) show the highest seasonal indices. Lowland stations including Skopje (24.1), Kumanovo (25.9), Prilep (26.0), and Strumica (27.2) maintain semi-humid climates, reflecting moderate precipitation (<150–180 mm) and air temperatures (<12–14 °C).
This analysis emphasizes the critical influence of elevation, orography, and regional geography in shaping North Macedonia's climatic variability (see Figure 8). Humidity peaks consistently in northwestern mountainous regions during winter and spring, whereas lowlands and southern plains experience strong summer aridity. Autumn acts as a transitional season with spatial heterogeneity persisting. Such detailed seasonal patterns are crucial for hydrological heritage assessments, ecosystem management, agricultural planning, and climate adaptation strategies.
3.4. Annual De Martonne aridity index (IDM) analysis
The De Martonne aridity index (IDM) was calculated annually for 13 meteorological stations across North Macedonia, revealing significant spatial and temporal variability in hydrothermal conditions driven by altitude, precipitation patterns, and regional topography. Over the 30-year period from 1991 to 2020, annual IDM values ranged from 18.8 to 42.3, reflecting a spectrum of climatic conditions from semi-arid to very humid, with a clear spatial pattern influenced by elevation and atmospheric dynamics. The mean annual IDM across all stations, calculated as the average of the annual values, is 28.8, classifying North Macedonia’s overall climate as semi-humid on average, though with pronounced regional variations.
The highest IDM values, indicative of the most humid conditions, are observed in the mountainous regions of western and northwestern North Macedonia. Mavrovo, with an IDM of 75.7, and Lazaropole, with an IDM of 73.3, both located in high-altitude areas near Mount Korab and the Bistra Mountain range, exhibit extremely humid conditions due to high precipitation and cooler air temperatures associated with mountainous terrain. Very humid climates dominate mid-altitude and mountainous regions, including Berovo with an IDM of 44.6, Bitola at 42.1, Gevgelija at 37.1, Demir Kapija at 39.4, Kriva Palanka at 42.2, and Ohrid at 36.7, benefiting from consistent precipitation and moderate air temperatures (Table 9). In contrast, Strumica, with an IDM of 29.4, exhibits a humid climate, reflecting lower precipitation and warmer air temperatures compared to higher-altitude regions. Semi-humid conditions prevail in lowland areas, including Kumanovo with an IDM of 27.9, Prilep at 26.4, Skopje at 26.0, and Štip at 26.1, indicative of drier and warmer environments. Approximately 15% of the stations (two stations, Mavrovo and Lazaropole) are classified as extremely humid, 46% (six stations) as very humid, 8% (one station, Strumica) as humid, and 31% (four stations) as semi-humid, underscoring the dominance of humid conditions in North Macedonia’s climate.
The annual variations of the IDM over the 30-year period show significant temporal variability (Figure 9). Of the 30 years analyzed, five years were classified as very humid (IDM 35–55): 1995 with an IDM of 36.5, 2002 with 40.3, 2009 with 37.2, 2010 with 42.3, and 2014 with 40.2. Sixteen years were classified as humid (IDM 28–35): 1991 with 30.4, 1996 with 34.2, 1998 with 32.9, 1999 with 32.6, 2003 with 31.9, 2004 with 34.6, 2005 with 33.7, 2006 with 32.2, 2007 with 29.5, 2012 with 32.7, 2013 with 31.5, 2015 with 34.6, 2016 with 33.8, 2017 with 29.5, 2018 with 30.7 and 2020 with 28.4. Three years were classified as semi-humid (IDM 24–28): 1997 with 26.8, 2008 with 25.2, and 2019 with 27.4. Five years were classified as mediterranean (IDM (20–24): 1992 with 23.3, 1993 with 20.8, 1994 with 22.8, 2001 with 23.4, and 2011 with 20.8. One year, 2000, with an IDM of 18.8, was classified as semi-arid, reflecting notably dry conditions consistent with regional drought patterns in the Balkans, as reported in studies such as Lukovic et al. (2013) [78] and Milevski et al. (2015) [79], and corroborated by the National Hydrometeorological Service – Skopje (2021) [80]. This dry year likely resulted from significantly reduced precipitation and elevated air temperatures. The maximum IDM value was observed in 2014, with an IDM of 42.3, aligning with reports of exceptionally high precipitation across the region, as noted by the National Hydrometeorological Service – Skopje (2021) [80] and the Copernicus Climate Change Service (2022) [81]. No years were classified as arid (IDM < 10) or extremely humid (IDM ≥ 55), indicating that North Macedonia’s climate remains predominantly within the humid to semi-humid range.
Although this analysis provides a robust understanding of the spatial and temporal variability of the IDM, precise quantification of the area coverage for each climate type would require the development of a continuous annual IDM map using spatial interpolation methods, such as Inverse Distance Weighting or Kriging. Such mapping would enable a detailed assessment of hydrological and ecological variability, supporting improved water resource management, climate impact analysis, and sustainable land-use planning.
Overall, the annual IDM demonstrates a clear altitudinal control on climate, with elevated and mountainous regions maintaining extremely humid to very humid conditions, mid-altitude stations exhibiting very humid climates, and lowland areas displaying semi-humid characteristics (see Figure 10). The mean annual IDM of 28.8, classifying the country as semi-humid, reflects the balance between the wetter, high-altitude northwest and the drier, lowland southeast. The rarity of semi-arid conditions, occurring in only one year, underscores the mitigating influence of North Macedonia’s continental and mountainous climate, which ensures a degree of moisture even in the driest periods. This pattern emphasizes the significant influence of topography and precipitation on the spatial distribution of climatic conditions in North Macedonia, providing critical insights for hydrological studies, ecological assessments, and climate adaptation strategies.
3.5. Annual Pinna combinative index (IP) analysis
The Pinna combinative aridity index (IP) was calculated annually for 13 meteorological stations across North Macedonia, revealing a diverse range of hydrothermal conditions shaped by topography and regional climatic factors. Over the 30-year period from 1991 to 2020, IP values ranged from 9.4 to 37.7, reflecting a spectrum of climatic conditions from dry to humid, with a pronounced spatial pattern driven by elevation and atmospheric influences. The mean annual IP for the entire country, calculated as the average of the annual IP values over this period, is 18.2, indicating that North Macedonia’s overall climate is semi-dry (Mediterranean) on average, though significant spatial and temporal variations exist.
The highest IP values, which indicate the most humid conditions, are observed in the mountainous regions of western and northwestern North Macedonia. Lazaropole, located in the high-altitude Bistra Mountain range, recorded the highest station-specific IP at 39.5, followed closely by Berovo at 39.4 in the Maleševo Mountains and Mavrovo at 38.6 near Mount Korab, North Macedonia’s highest peak at 2,764 m. These stations experience substantial annual precipitation, such as 1058.5 mm at Lazaropole and 1046.0 mm at Mavrovo, combined with cooler mean annual air temperatures of 7.6°C at both locations, resulting in their classification as humid (IP ≥ 20). The high elevation in these areas enhances orographic precipitation, as moist westerly air masses are forced upward, cooling and condensing to produce significant rainfall. The most humid year in the dataset was 2006, with an IP of 37.7, likely most pronounced at Lazaropole due to its consistently high IP values driven by elevation and precipitation.
In contrast, the lowest IP values are found in the southeastern lowlands, where Demir Kapija recorded an IP of 17.0, Gevgelija 18.2, and Strumica 19.1, all classified as semi-dry (Mediterranean) with IP values between 10 and 20. These stations, situated in the Vardar River Valley near the Aegean Sea, experience higher mean annual air temperatures, such as 15.5°C at Gevgelija and 14.3°C at Demir Kapija, and lower precipitation in their driest months, for example, 25.8 mm in August at Gevgelija and 30.8 mm at Demir Kapija. The driest year recorded was 2000, with an IP of 9.4, likely most pronounced at Demir Kapija, which consistently exhibits the lowest station-specific IP due to its warm, dry conditions. This year marked the only instance of fully dry conditions (IP < 10) in the 30-year period, likely driven by anomalously low precipitation and elevated air temperatures influenced by strong Mediterranean air masses. The lowest IP value, 9.4 in 2000 at Demir Kapija, reflects the extreme aridity in the southeastern lowlands during that year.
Central and northern stations, including Kumanovo with an IP of 25.4, Skopje at 23.9, Ohrid at 21.5, and Štip at 21.5, are classified as humid, with IP values ranging from 21.5 to 25.4. Prilep, with an IP of 30.6, and Kriva Palanka, with an IP of 35.7, also exhibit humid conditions, the latter driven by substantial annual precipitation of 661.1 mm despite a moderate mean air temperature of 10.7°C. Bitola, with an IP of 20.3, lies in a transitional zone between the humid northwest and semi-dry southeast.
Over the 30-year period, climatic conditions varied significantly (Figure 11). Dry conditions, defined as IP values below 10, occurred only in 2000 with an IP of 9.4, representing just one year or 3.3% of the period. This exceptionally dry year, likely most pronounced at Demir Kapija, was driven by significantly reduced precipitation and higher air temperatures, possibly due to strong Mediterranean air masses affecting the southeastern lowlands. Semi-dry conditions, with IP values between 10 and 20, were observed in 20 years, accounting for 66.7% of the period: 1992 with an IP of 11.7, 1993 with 10.4, 1994 with 13.4, 1995 with 18.2, 1996 with 18.3, 1997 with 14.2, 1999 with 18.0, 2001 with 13.0, 2003 with 16.3, 2007 with 14.7, 2008 with 13.1, 2011 with 10.5, 2012 with 16.3, 2013 with 16.4, 2015 with 17.2, 2016 with 16.9, 2017 with 17.8, 2018 with 15.3, 2019 with 14.0, and 2020 with 14.5. These years were characterized by warmer, drier Mediterranean influences, particularly affecting southeastern stations like Demir Kapija, Gevgelija, and Strumica. Humid conditions, with IP values of 20 or greater, prevailed in 9 years, representing 30.0% of the period: 1991 with an IP of 25.5, 1998 with 20.3, 2002 with 25.5, 2004 with 25.4, 2005 with 27.6, 2006 with 37.7, 2009 with 28.0, 2010 with 21.2, and 2014 with 21.1. These years corresponded to periods of higher precipitation and cooler air temperatures, particularly in the mountainous northwest, with stations like Lazaropole and Mavrovo experiencing the most pronounced humidity.
The spatial distribution of IP values reveals a clear gradient from the humid northwest to the semi-dry southeast. High mountains in the west, such as Korab, Bistra, and Šar Planina, act as barriers that capture moisture from westerly air masses, resulting in higher precipitation and cooler air temperatures. Conversely, the southeastern lowlands, influenced by the Vardar valley’s channeling of warm, dry Mediterranean air from the Aegean Sea, experience reduced precipitation and higher air temperatures, leading to semi-dry conditions. The Aegean Sea’s proximity exacerbates aridity in the southeast, particularly in summer months, as evidenced by low precipitation values. The mean annual IP of 18.2, classifying North Macedonia as semi-dry on average, reflects the balance between the humid, high-altitude northwest and the drier southeast. The rarity of fully dry conditions, occurring in only one year, underscores the mitigating influence of the country’s continental and mountainous climate, which ensures a degree of moisture even in the driest regions (Figure 12). The marked humidity at Lazaropole, Mavrovo, and Berovo emphasize the critical role of elevation, while the semi-dry conditions in the southeast, particularly at Demir Kapija, reflect the Aegean Sea’s influence, creating a distinct climatic gradient across North Macedonia (Table 10).
3.6. Aridity trend
Aridity trends in North Macedonia were analyzed using the JCI, IDM, and IP indices through three statistical methods. First, linear trend equations were derived from mean annual JCI, IDM, and IP values across the region, graphically illustrating aridity changes [43,82,83]. Second, the Mann-Kendall test assessed significant trends, testing the null hypothesis (H0: no trend) against the alternative (Ha: significant trend) at α = 0.05. A p-value < α rejects H0, confirming a trend, while p ≥ α retains H0 [84,85,86,87,88]. This robust approach, effective for missing data [43], enhances understanding of North Macedonia’s climatic trends. Third, to refine the analysis and detect possible shifts in aridity over the study period, Pettitt’s nonparametric test was employed.
The temporal variation of aridity in North Macedonia was further analyzed using linear regression. For the IDM, the obtained regression equation was: y = 0.028x − 25.65 and for the IP: y = −0.011x + 37.15, where t is the time in years. For the JCI, the obtained regression equation was: y = 0.1514x +33.78. Trend lines are shown in Figure 13. IDM equation indicates a weak positive tendency in the IDM, while IP equation reflects a very weak negative tendency in the IP, and JCI equation shows a very weak positive tendency in continentality. In all cases, the trends are extremely weak.
The Mann–Kendall (MK) test was applied to determine the statistical significance of the observed tendencies (Table 11). As the obtained probabilities were greater than the significance level (α = 0.05, i.e. 5%), the null hypothesis H0 of no trend cannot be rejected. The risks of committing a Type I error (rejecting H0 while it is true) were 48.6% for the IDM, 85.8% for the IP, and 72.4% for the JCI, respectively. Consequently, the MK test showed that, considering all values of both indices, there is no statistically significant change in aridity trends in the last 30 years in North Macedonia.
The table summarizes Mann-Kendall trend analyses for the JCI, IDM, and IP, across 13 meteorological stations in North Macedonia (1991–2020), reporting annual averages and Sen's slope (β) estimates of long-term change. It shows no significant trends in aridity or continentality (all ZMK < 1.96, p > 0.05), underscoring overall climatic stability, with minor negative β values in low-elevation sites indicating subtle drying tendencies. This spatial pattern—characterized by wetter mountainous areas and drier, more vulnerable valleys—provides an essential reference point for understanding how ongoing climate warming may influence agricultural productivity and water availability across the region.
3.7. Correlation
Analysis of the IDM and IP for North Macedonia from 1991 to 2020 reveals stable climatic conditions, with no significant trend in aridity, indicating consistent precipitation and air temperature patterns across the region (Figure 14). Both indices demonstrated comparable values in spatial distribution and no notable change in aridity, prompting a correlation analysis between them. The Pearson correlation coefficient r has a value of 0.66. The coefficient of determination r2 is 0.437 when the regression type is linear, as shown in Figure 14, with the equation y = 0.691x – 3.108.
Correlation coefficients between the North Atlantic Oscillation Index – NAO [89], El Niño-Southern Oscillation Index – SOI [90], and seasonal and annual IDM were determined to investigate possible relationships between aridity and atmospheric variability. To ensure transparency and reproducibility, NAOI and SOI data were sourced from NOAA's Climate Prediction Center (for NAOI) (National Centers for Environmental Information, 2023) and Physical Sciences Laboratory (for SOI) [91], with monthly values averaged to derive seasonal indices (Winter: December–February, Spring: March–May, Summer: June–August, Autumn: September–November).
Annual correlations were derived by averaging seasonal IDM, NAOI, and SOI values for each year. Results are shown in Table 12. The correlation between the IDM and the NAOI is significant (at the 5.0% level of significance) in summer (0.45). The positive correlation coefficient in summer indicates a drying effect on the IDM in North Macedonia, potentially due to reduced precipitation under positive NAOI phases. A negative correlation coefficient in winter (−0.31, p = 0.098) suggests a wetting effect on the IDM, though not statistically significant, reflecting increased moisture during negative NAOI phases. Since precipitation is one of the key components of the IDM, the response of the IDM to the NAOI can be associated with the established links between this index and precipitation dynamics [92]. Our results align with findings from regional studies on summer precipitation patterns in the Southeastern Europe [93]. For the SOI, a weak positive correlation in autumn (0.19) suggests minor ENSO influence during spring-like transitions in North Macedonia.
Coefficients significant at the 5% level (α = 0.05), indicating less than a 5% probability of Type I error, are presented in bold
Finding similar or identical results at regional and national scales is challenging and difficult. However, certain spatio-temporal patterns of aridity can be identified. This difficulty largely stems from the nature of the climate indices chosen for the study, as well as the specific selection criteria employed by the authors.
The spatial and temporal patterns of continentality and aridity in North Macedonia, derived from the JCI, IDM, and IP, reveal semi-dry conditions in lowland southeastern areas and semi-humid conditions in highlands during summer. These patterns are consistent with observations in neighboring countries. In Bulgaria, analysis of the IDM index during 1961–2015 revealed semi-arid to arid conditions, while multiannual variability indicated decreasing aridity over the last three decades [53]. Serbia shows pronounced continentality in lowlands with semi-dry to semi-humid climates and an absence of Mediterranean-type dry zones [45]. In Kosovo and Metohija, semi-dry and semi-humid climates dominated during 1965–1999, with no significant aridity change [44]. Montenegro exhibits generally humid to extremely humid conditions, except for semi-arid summer periods in coastal and adjacent inland areas, with trends indicating increasing aridity in April and August over the last sixty years [47]. North Macedonia’s lowland summer aridity and highland semi-humid conditions correspond closely to these regional observations, supporting the consistency of hydroclimatic patterns across the region.
Expanding to South-Eastern Europe, Turkey exhibits semi-arid and dry sub-humid conditions in continental interiors and Mediterranean regions, with decreasing annual and winter precipitation since the 1970s, and seasonal increases in spring precipitation in some areas [34]. Iraq, in contrast, is characterized by arid and semi-arid conditions covering 97% of the country, with increased dryness after 1997, particularly in northern regions [40]. These findings reflect the sensitivity of lowland North Macedonia to summer water deficits, highlighting comparable responses to hydroclimatic variability in continental interiors and semi-arid zones.
Projections for South-Eastern Europe (1961–2050) based on multiple climate indices, including the JCI, IDM, and IP, indicate that the overall spatial pattern of aridity remains relatively stable, yet marked shifts toward more arid conditions are expected in the Balkan Peninsula, including North Macedonia [65]. These large-scale trends are corroborated by ultrahigh-resolution analyses of regional bioclimate. Charalampopoulos et al. (2023) [57], using the IDM, projected future bioclimate changes across natural and agricultural areas, highlighting a pronounced expansion of semi-dry conditions in central, southern, and southeastern parts of North Macedonia under high-emission scenarios for the period 2071–2100. In addition, Charalampopoulos and Droulia (2025) [58] reported increasing aridity and continentality patterns over South-Eastern Europe from 1964–2023, with semi-dry conditions expanding notably over agricultural and natural areas, particularly in Bulgaria, Serbia, and North Macedonia. The results of the present study align with these projections, demonstrating that lowland areas in North Macedonia are increasingly affected by summer aridity, whereas highlands remain comparatively buffered. This agreement underscores the robustness of the applied indices for capturing hydroclimatic gradients and supports the broader regional relevance of observed seasonal and spatial aridity trends.
Regional studies across the South-Eastern European and Mediterranean domains indicate that topography, latitude, and continentality strongly modulate seasonal aridity. In Southern Bulgaria, decreasing multiannual aridity trends were observed [53], whereas Montenegro’s coastal summer zones exhibited semi-arid conditions [47]. Southwestern Spain experienced increasing aridity between 1951 and 2010, particularly in historically humid northern regions, with spring and summer showing the highest water deficits [94]. Italy shows a progressive reduction in precipitation and increasing temperatures between 1951 and 2010, leading to a widening gap between water demand and rainfall in agricultural systems [30]. North Macedonia similarly displays summer lowland aridity, while highlands retain semi-humid conditions, confirming the generality of seasonal patterns across Mediterranean and South-Eastern European terrains. Furthermore, Greece demonstrates a gradual shift from moderate marine climates to more continental and semi-dry classes in northern and central regions, while islands remain stable [95]. Comparable continentality–oceanity gradients were observed in the Iberian Peninsula, with maritime northern areas and continental interiors, reflecting similar topographic and latitudinal modulation of climate as seen in North Macedonia [96]. These observations corroborate the influence of topography and latitude on spatial aridity variability, which aligns with the patterns observed in North Macedonia.
Moving eastward, Central Kazakhstan exhibits a northeast–southwest aridity gradient, with southern desert areas becoming drier and northern highlands more humid between 1960 and 2022 [97]. Seasonal analysis revealed winter moisture gains contrasted by extreme summer aridity, consistent with North Macedonia, where lowlands are semi-dry in summer, and highlands maintain semi-humid conditions. Similarly, recent analyses across the Middle East and North Africa [98] indicate increasing continental influences and modest aridity trends, particularly over humid regions such as the Ethiopian Highlands and Fertile Crescent, underscoring the role of large-scale circulation patterns in modulating spatial hydroclimatic.
At the European scale, continental and Mediterranean regions display heterogeneous aridity trends. In Italy, high spatial variability in aridity and continentality indices reflects mountain-induced precipitation gradients [99]. Across Europe, long-term datasets indicate expansion of dry regions since the 1980s, particularly at low and medium altitudes in Western, Central, and Eastern Europe [100]. According to high-resolution projections of aridity under climate change, the South Balkan Peninsula, including North Macedonia, experiences dry climates across all indices, with southern lowlands classified as semi-dry and highlands maintaining semi-humid conditions. Our findings in this study overlap with these continental-scale projections, confirming the reliability and regional representativeness of the applied indices.
Yet, certain limitations are inherent in this study. The analysis is restricted to the period 1991–2020, which constrains the assessment of longer-term trends and decadal variability. While station-based observations provide high-resolution and reliable data for the examined period, extending the temporal coverage to include earlier records or climate projections would allow a more comprehensive evaluation of hydroclimatic changes. One of the limitations is the small number of meteorological stations (13) used in the study, leading to a high degree of generalization and interpolation. Furthermore, the integration of satellite-derived datasets, such as MERRA-2 or ERA5 reanalysis products, alongside geospatial platforms like Google Earth Engine (GEE), would enable cross-validation, spatial extrapolation, and the construction of broader temporal and spatial scenarios [4]. Incorporating these approaches would enhance the robustness and representativeness of regional aridity assessments, thereby supporting improved water resource management and climate adaptation strategies [5,101].
Thus, the North Macedonian patterns of semi-dry lowlands and semi-humid highlands, with summer as the critical period for water deficits, are broadly consistent with regional and extra-regional studies across South-Eastern Europe, the Mediterranean, and Central Europe and Asia. This congruence validates the applicability of the JCI, IDM, and IP, indices for regional hydroclimatic assessment and underscores the relevance of these findings for water resource management, agriculture, and climate adaptation strategies.
4. Conclusions
In this study, the long-term spatio-temporal variability of aridity indices in North Macedonia from 1991 to 2020 was analyzed. For the purpose of the study datasets from 13 meteorological stations were used. Certain patterns can be identified so general conclusions can be summarized as follows:
Mean annual temperatures and mean annual precipitation sums showed spatial variability influenced by hypsometry and the proximity of major water aquatories such as Mediterranean basin. Therefore, the study area has diverse climate (from continental to mild, Mediterranean influences). However, the urban agglomeration of Skopje is affected by UHI phenomenon which leads to increasing of mean annual temperature. This fact is the cause of pronounced continentality and semi-dry conditions.
On a temporal scale the highest JCI values were recorded in 2017 and 2000 which suggest high continentality. The lowest JCI value observed was during 2014 (Moderate Marine climate class). The spatial distribution of the JCI detected three classes – moderate Marine, Transitional, and Continental climate. Moderate Marine climates are observed in the western highlands and northeastern uplands. Transitional climates is present in eastern and western regions while continental climate is dominant in the central parts of the country and in central valleys.
The monthly IDM values show the increasing of aridity from June to September. July and August belong to semi-arid classes while June is Mediterranean. This fact could have influence on agriculture in North Macedonia and create a need for expanding areas under irrigation. The seasonal values of this index indicate extremely humid climate during winter season, spring and autumn are characterized by a humid climate, while summer is characterized as semi-arid. In term of spatial changes, summer season indicates semi-arid conditions in most of North Macedonia. The annual values of the IDM indicate the following: 5 years were very humid, 16 humid, 3 semi-humid, 5 mediterranean and only one year (2000) belongs to the semi-arid category. In general, according to the IDM, North Macedonia has humid to semi-humid conditions on annual scale. Spatial distribution of the IDM indicates dominant humid, very humid and extremely humid classes.
Mean annual value of the Ip reveals dominant semi-dry (Mediterranean) influences – 20 years. Humid classes are pronounced during nine years. Similarly, just one year based on the Pinna combinative index belongs to the semi-dry conditions (2000). Spatial distribution of Ip detected humid class on almost whole meteorological stations in the country. However, three meteorological stations (Gevgelija, Demir Kapija and Strumica) showed different aridity patterns – semi-dry (Mediterranean) climate.
The MK test indicates no pronounced statistical significance in the aridity trends. The Pearson correlation test between the IDM and the NAOI is statistically significant in summer. The positive correlation in summer indicates a drying effect on the IDM in study area (linked to reduced precipitation under positive NAOI phases). A negative correlation coefficient in winter displays a wetting effect on the IDM (no statistical significance) reflecting increased moisture during negative NAOI phases.
The results of this research provide a solid basis for future studies of aridity in North Macedonia and can be of importance in numerous aspects of anthropogenic activities. Here, policy planning on a national scale, sustainable agricultural production and sustainable management of water resources (monitoring of irrigation conditions) are emphasized. Considering that increasing of aridity can be expected in the future, this will have a negative impact on traditional agriculture, which is the most widespread in the study area. Consequently, state and local authorities need to implement measures and develop plans for sustainable agriculture, particularly for crops reliant on summer precipitation (e.g. using drought-resistant crops).
Future investigations of aridity variability in North Macedonia must include a wider set of different aridity indices or implementation of remote sensing techniques in aridity detection. Also, a long-term assessment of aridity changes is desirable (by expanding used time series to the historical data). Since the aridity conditions are related to drought conditions, this phenomenon should be investigated by using the appropriate empirical methods such as: for meteorological drought (Standardized Precipitation Index, SPI), Standardized Precipitation-Evapotranspiration Index, SPEI), for hydrological drought (Palmer Hydrological Drought Index, PHDI, Streamflow Drought Index SDI), for agricultural drought (Crop Moisture Index, CMI and Vegetation Condition Index, VCI). This approach provides the opportunity of comparing results between the aridity and drought and could give a valuable insight into the moisture deficit and its dynamics on a national scale.
Author Contributions
Conceptualization, B.A.; methodology, B.A.; software, B.A.; validation, I.M.; formal analysis, B.A., N.M., U.D. S.S. and I.M.; investigation, B.A.; resources, B.A.; data curation, B.A and I.M.; writing—original draft preparation, B.A.; writing—review and editing, B.A., N.M., U.D., I.M.; visualization, B.A. and U.D.; supervision, I.M., N.M. and S.S.; project administration, B.A.; funding acquisition, B.A. All authors have read and agreed to the published version of the manuscript.
Funding
Please add: This research received no external funding.
Data Availability Statement
The data supporting the findings of this study are available from the corresponding author upon reasonable request.
Acknowledgments
The authors would like to thank the anonymous reviewers for their constructive comments, which helped to improve the quality of this manuscript. The author B.A. also acknowledge the Hydrometeorological Service of North Macedonia (UHMR) for providing meteorological data used in this study.
Conflicts of Interest
The authors declare no conflicts of interest.
References
- Alley, R.B., Marotzke, J., Nordhaus, W.D., Overpeck, J.T., Peteet, D.M., Pielke, R.A., Pierrehumbert, R.T., Rhines, P.B., Stocker, T.F., Talley, L.D. and Wallace, J.M., 2003: Abrupt climate change. Science 299 (5615), 2005–2010. [CrossRef]
- IPCC (2007) Climate change 2007: mitigation. Contribution of Working Group III to the fourth assessment report of the Intergovernmental Panel on Climate Change. Cambridge University Press, Cambridge.
- Philandras, C.M., Nastos, P.T., Kapsomenakis, J., Douvis, K.C., Tselioudis, G., and Zerefos, C.S., 2011: Long term precipitation trends and variability within the Mediterranean region. Nat. Hazards Earth Syst. Sci. 11, 3235–3250. [CrossRef]
- Velichkova, T., Kilifarska, N., & Mokreva, A. (2025). Study of the North Atlantic Oscillation Influence on the Climate of Europe and Balkan Peninsula. Proceedings of the Bulgarian Academy of Sciences, 78(6), 862–872. [CrossRef]
- Tang, T., Alasgah, A.A., Ahmad, I. et al. Tracing the global climate footprint: four decades of evolving air temperature and ozone dynamics (1980–2024) using satellite-based MERRA-2 data. Rend. Fis. Acc. Lincei (2025). [CrossRef]
- Alexandrov, V., Schneider, M., Koleva, E., and Moisselin, J.M., 2004: Climate variability and change in Bulgaria during the 20th century. Theor. Appl. Climatol. 79, 133–149. [CrossRef]
- Croitoru АЕ, Piticar А, Imbroane АМ, Burada DC (2012) Spatiotemporal distribution of aridity indices based on temperature and precipitation in the extra-Carpathian regions of Romania. Theor Appl Climatol.
- CRU (2003) Global average temperature change 1856–2003. http://www.cru.uea.ac.uk/cru/data/temperature/. Accessed 6 Mar 2025.
- American Meteorological Society. (2000). Glossary of meteorology. American Meteorological Society.
- Oliver, E. J. (2005). Aridity Indexes. In E. J. Oliver (Eds.), Encyclopedia of World Climatology (pp. 89-94). Dordrecht, The Netherlands: Springer.
- Lang, R. (1915). Versuch einer exakten Klassifikation der Boden in klimatischer und geologischer Hinsicht. Internationale Mitteilungen für Bodenkunde, 5, 312.
- De Martonne E (1926) Une nouvelle fonction climatologique:L’indice d’aridite ́. La Meteorol, pp 449–458.
- Emberger, L., 1930. La végétation de la région méditerranéenne, essai d’une classification des groupements végétaux. Rev. Gén. Bot. 42: 641–662. 705–721.
- Gračanin, M. (1950). Monthly rainfall factors and their significance in pedological research. Publishing Institute of the Yugoslav Academy of Sciences and Arts. Agricultural Scientific Review, 12, 51–66 (in Serbian).
- Selyaninov, G. T, 1958: The nature and dy-namics of the droughts. In Droughts in the USSR, their Nature, Recurrences and Impact on Crops Yields (in Russian), Gidro-meteoizdat, Leningrad.
- Erinç S. (1965). An Attempt on precipitation efficiency and a new index. Istanbul University Institute Release, Baha Press.
- Zambakas J. 1992. General Climatology. Department of Geology, National & Kapodistrian University of Athens: Athens, Greece.
- Thornthwaite, C. W. (1948). An approach toward a rational classification of climate. Geographical Review, 38(1), 55–94.
- Budyko, M. I. (1951). On climatic factors of runoff. (in Russian). Probl. Fiz. Geogr., 16, 41–48.
- UNESCO, United Nations Educational, Scientific and Cultural Organization. (1979). Map of the world distribution of arid regions: map at scale 1:25,000,000 with explanatory note, MAB technical notes 7. UNESCO, Paris.
- Food and Algriculture Organization (FAO), (1989). Arid Zone Forestry: A Guide for Field Technicians; FAO: Rome, Italy.
- Nistor, M.-M. High-resolution projections of aridity in Europe under climate change. In Climate and Land Use Impacts on Natural and Artificial Systems: Mitigation and Adaptation; Elsevier: Amsterdam, The Netherlands, 2021; pp. 73–90. [CrossRef]
- Deniz, A., Toros, H., & Incecik, S. (2011). Spatial variations of climate indices in Turkey. International Journal of Climatology, 31(3), 394–403. [CrossRef]
- Herraiz, A. D., Salazar-Zarzosa, P., Acosta-Muñoz, C., Hernández-Clemente, R. & Villar,R. (2025). Aridity-induced phenological shifts and greening trends in Mediterranean forest species: Insights from 28 years of Landsat data in southern Spain. Ecological Indicators, 171, 113115. [CrossRef]
- Trenberth, K., Dai, A., van der Schrier, G., et al. (2014). Global warming and changes in drought. Nature Climate Change, 4, 17–22. [CrossRef]
- Sardans, J., Miralles, A., Tariq, A., Zeng, F., Wang, R. & Peñuelas, J. (2024). Growing aridity poses threats to global land surface. Communications Earth and Environment, 5, 776. [CrossRef]
- Baltas, E. (2007). Spatial distribution of climatic indices innorthern Greece. Meteorological Applications, 14, 69–78. [CrossRef]
- Maris, F., Matzarakis, A. & Paparrizos, S. (2016). Integrated analysis and mapping of aridity over Greek areas with different climate conditions. Global NEST Journal, 18(1), 131-145. [CrossRef]
- Tsiros, I. X., Nastos, P., Proutsos, N. D. & Tsaousidis, A. (2020). Variability of the aridity index and related drought parameters in Greece using climatological data over the last century (1900–1997), Atmospheric Research, 240, 104914. [CrossRef]
- Salvati, L., Zitti, M., Di Bartolomei, R., & Perini, L. (2013). Climate aridity under changing conditions and implications for the agricultural sector: Italy as a case study. Geography Journal, 2013(1), Article ID 923173. [CrossRef]
- Pellicone, G., Caloiero, T. & Guagliardi, I. (2019). The De Martonne aridity index in Calabria (Southern Italy). Journal of Maps, 15(2), 788–796. [CrossRef]
- Andrade, C., & Corte-Real, J. (2016). Aridity conditions in the Iberian peninsula during the XX century. International Journal of Environmental Science, 1, 52–58.
- Paniagua, L. L., García–Martín, A., Moral, F. J. & Rebollo, F. J. (2019) Aridity in the Iberian Peninsula (1960–2017): distribution, tendencies, and changes. Theoretical and Applied Climatology, 138, 811–830. [CrossRef]
- Türkeş, M. (2003). Spatial and Temporal Variations in Precipitation and Aridity Index Series of Turkey. In: Bolle, HJ. (eds) Mediterranean Climate. Regional Climate Studies. Springer, Berlin, Heidelberg. [CrossRef]
- Derdous, O., Tachi, S. E., & Bouguerra, H. (2020). Spatial distribution and evaluation of aridity indices in Northern Algeria. Arid Land Research and Management, 35(1), 1–14. [CrossRef]
- Sahour, H., Vazifedan, M., & Alshehri, F. (2020). Aridity trends in the Middle east and adjacent areas. Theoretical and Applied Climatology, 142, 1039–1054. [CrossRef]
- Shaban, A., Awad, M., Ghandour, A. J., & Telesca, L. (2019). A 32-year aridity analysis: A tool for better understanding on water resources management in Lebanon. Acta Geophysica, 67, 1179–1189. [CrossRef]
- Araghi, A., Martinez, C. J., Adamowski, J., & Olesen, J. E. (2018). Spatiotemporal variations of aridity in Iran using high-resolution gridded data. International Journal of Climatology, 38(6), 2701–2717. [CrossRef]
- Pour, S. H., Abd Wahab, A. K., & Shahid, S. (2020). Spatiotemporal changes in aridity and the shift of drylands in Iran. Atmospheric Research, 233, 104704. [CrossRef]
- Şarlak, N., & Mahmood Agha, O. M. A. (2018). Spatial and temporal variations of aridity indices in Iraq. Theoretical and Applied Climatology, 133, 89–99. [CrossRef]
- Mărgărit-Mircea, N. (2021). High-resolution projections of the aridity in Europe under climate change. Climate and Land Use impacts on Natural and Artificial systems. Ed.: Mărgărit-Mircea. Elsevier, pp. 73–90. [CrossRef]
- Bešt́áková, Z., Strnad, F., Vargas Godoy, M.R. et al. Changes of the aridity index in Europe from 1950 to 2019. Theor Appl Climatol 151, 587–601 (2023). [CrossRef]
- Hrnjak, I., Lukić, T., Gavrilov, M. B., Marković, S. B., Unkašević, M., & Tošić, I. (2014). Aridity in Vojvodina, Serbia. Theoretical and Applied Climatology, 115, 323–332. [CrossRef]
- Bačević, N., Vukoičić, D., Nikolić, M., Janc, N., Milentijević, N., & Gavrilov, M. B. (2017). Aridity in Kosovo and Metohija, Serbia. Carpathian Journal of Earth and Environmental Sciences, 12(2), 563–570.
- Burić, D., Mihajlović, J., Ducić, V., Milenković, M., & Anđelković, G. (2023). Contribution to the study of climate change in Serbia using continentality, oceanity, and aridity indices. Időjárás, 127(3), 379–399. [CrossRef]
- Milentijević, N., Martić-Bursać, N., Gocić, M., Ivanović, M., Strålman Obradović, S., Pantelić, M., Milošević, D. & Stričević, Lj. (2025). Spatio-Temporal Variability of Aridity and Humidity Indices in Bačka (Serbia). Pure and Applied Geophysics, 182, 705–728. [CrossRef]
- Luković, J., Burić, D., Mihajlović, J. et al. Spatial and temporal variations of aridity-humidity indices in Montenegro. Theor Appl Climatol 155, 4553–4566 (2024). [CrossRef]
- Perčec Tadić, M., Gajić-Čapka, M., Zaninović, K., & Cindrić, K. (2014). Drought Vulnerability in Croatia. Agriculturae Conspectus Scientificus, 79(1), 31-38.
- Ugarković, D., Paulić, V., Šapić, I., Poljak, I., Ančić, M., Tikvić, I., & Stankić, I. (2022). Climatic Relationship of Vegetation in Forest Stands in the Mediterranean Vegetation Belt of the Eastern Adriatic. Atmosphere, 13(10), 1709. [CrossRef]
- Croitoru, A. E., Piticar, A., Imbroane, A. M., & Burada, D. C. (2013). Spatiotemporal distribution of aridity indices based on temperature and precipitation in the extra-carpathian regions of Romania. Theoretical and Applied Climatology, 112(3–4), 597–607. [CrossRef]
- Vlăduţ, A.Ș., & Licurici, M. Aridity conditions within the region of Oltenia (Romania) from 1961 to 2015. Theoretical and Applied Climatology, 140, 589–602. [CrossRef]
- Bărbulescu, A., & Dumitriu, C. Ș. (2025). Assessing the Changes in Precipitation Patterns and Aridity in the Danube Delta (Romania). Journal of Marine Science and Engineering, 13(8), 1529. [CrossRef]
- Nikolova, N., & Yanakiev, D. (2020). Climate aridity in southern Bulgaria for the period 1961-2015. Forum geografic, XIX(1), 10-17. [CrossRef]
- Aksoy, E., Arsov, S., Mincev, I., & Fang C. (2020). Agro-ecological atlas of the Republic of North Macedonia. Rome, FAO.
- Zanchetta, G., Isola, I., Hu, H.-M., Bini, M., Columbu, A., Drysdale, R. N., Luppichini, M., Natali, S., Regattieri, E., Shen, C.-C., De Santis, N., Hellstrom, J., Pennos, C., Perchiazzi, N., Masi, A., Wagner, B., Milevski, I., Temovski, M., & Izdebski, A. (2023). The Medieval Climate Anomaly in the Balkans: Evidence from Golubarnica Cave in the Jakupica Massif (North Macedonia). SSRN. [CrossRef]
- Carvalho, D., Pereira, S. C., Silva, R., & Rocha, A. (2022). Aridity and desertification in the Mediterranean under EURO-CORDEX future climate change scenarios. Climatic Change, 174, 28. [CrossRef]
- Charalampopoulos, I., Droulia, F., & Tsiros, I. X. (2023). Projecting Bioclimatic Change over the South-Eastern European Agricultural and Natural Areas via Ultrahigh-Resolution Analysis of the de Martonne Index. Atmosphere, 14(5), 858. [CrossRef]
- Charalampopoulos I, Droulia F. Climate Evolution of Agricultural and Natural Areas of Southeastern Europe According to Pinna, Johansson and Kerner Climate Indices. Climate. 2025; 13(6):121. [CrossRef]
- Milevski I. General geomorphological characteristics of the Republic of Macedonia. Geographical Rev. 2015;48:5–25.
- Zikov, M. (1995). Climate and climatic regionalization of the Republic of Macedonia. Geographical Review, 30, 13–23 (in Macedonian).
- Hydrometeorological Service of North Macedonia (UHMR). Meteorological and climatological data of North Macedonia. Available online: https://uhmr.gov.mk (accessed on 05 March 2025).
- Mimić, G., Podraščanin, Z., & Basarin, B. (2024). Change detection of the Köppen climate zones in Southeastern Europe. Atmospheric Science Letters, 25(11), e1270. [CrossRef]
- Pettitt AN (1979) A non-parametric approach to the change-point problem. Appl Stat 28(2):126–135.
- Gorczyński, L. Sur Le Calcul Du Degré Du Continentalisme et Son Application Dans La Climatologie. Geogr. Ann. 1920, 2, 324–331.
- Cheval, S.; Dumitrescu, A.; Birsan, M.-V. Variability of the Aridity in the South-Eastern Europe over 1961–2050. CATENA 2017, 151, 74–86. [CrossRef]
- De Martonne, E. (1925). Traité de Géographie Physique, Vol I: Notions generales, climat, hydrographie. Geographical Review, 15(2), pp. 336–337.
- Croitoru, A. E., Piticar, A., Imbroane, A. M., & Burada, D. C. (2013). Spatiotemporal distribution of aridity indices based on temperature and precipitation in the extra-carpathian regions of Romania. Theoretical and Applied Climatology, 112(3–4), 597–607. [CrossRef]
- Crespo-Cotrina, N.; Pádua, L.; Claro, A.M.; Fonseca, A.; Rebollo, F.J.; Moral, F.J.; Paniagua, L.L.; García-Martín, A.; Santos, J.A.; Fraga, H. A Simple Aridity Index to Monitor Vineyard Health: Evaluating the De Martonne Index in the Iberian Peninsula. Appl. Sci. 2025, 15, 10605. [CrossRef]
- Gebremedhin, M. A., Kahsay, G. H. & Fanta, H.G. (2018). Assessment of spatial distribution of aridity indices in Raya valley, northern Ethiopia. Applied Water Science, 8, 217. [CrossRef]
- Baltas, E., 2010. Surface representation of climatic variables and indices in Greece using GIS methods. International Journal of Meteorology, 35,123–136.
- Kendall, M.G. (1948) Rank Correlation Methods. Charles Griffin, London. https://www.scirp.org/reference/referencespapers?referenceid=2275550.
- Sharp J (2010) Microsoft Visual C# 2010 step by step. Microsoft Press, Redmond, WA.
- Johnston K, Ver Hoef JM, Krivoruchko K, Lucas N (2001) Using ArcGIS geostatistical analyst. ESRI, Redlands.
- Hutchinson MF, Gessler PT (1994) Splines—more than just a smooth interpolator. Geodema 62:45–67.
- Pearson K (1908) On a mathematical theory of determinantal inheritance, from suggestions and notes of the late W.F.R. Weldon. Biometrika 6:80–93. [CrossRef]
- Milica, V., Jelena, D., Stevan, S. & Ondřej, D. (2025). Applications of local climate zone classification in European cities: A review of in situ and mobile monitoring methods in urban climate studies. Open Geosciences, 17(1), 20250878. [CrossRef]
- Kaplan, G., Avdan, U., & Avdan, Z. Y. (2018). Urban Heat Island Analysis Using the Landsat 8 Satellite Data: A Case Study in Skopje, Macedonia. Proceedings, 2(7), 358. [CrossRef]
- Lukovic, J., Buric, D., Ducic, V., Doderovic, M., Milevski, I. (2013). Assessment on Temperature Extremes in Montenegro. In: Helmis, C., Nastos, P. (eds) Advances in Meteorology, Climatology and Atmospheric Physics. Springer Atmospheric Sciences. Springer, Berlin, Heidelberg. [CrossRef]
- Milevski, I.; Radevski, I.; Dimitrovska, O.; Gorin, S. Digital Model of the Mean Annual Temperature and Precipitation of the Republic of Macedonia. Geogr. Rev. 2015, 48, 33–38. Available online: https://igeografija.mk/reviews/wp-content/uploads/2022/01/GR48-Climate-models_Ivica_Milevski.pdf (accessed on 10 March 2025).
- National Hydrometeorological Service - Skopje. (2021). Analysis and interpretation of climate variability and climate change in the Republic of North Macedonia. Skopje, North Macedonia. https://api.klimatskipromeni.mk/data/rest/file/download/91ad28e2000147448bfa00c1814110a6bc2f1868adaf2fad571f5828051e6828.pdf.
- Copernicus Climate Change Service (C3S). (2022, January 10). Copernicus: Globally, the seven hottest years on record were the last seven; carbon dioxide and methane concentrations continue to rise. European Centre for Medium-Range Weather Forecasts (ECMWF). https://climate.copernicus.eu/copernicus-globally-seven-hottest-years-record-were-last-seven.
- Mudelsee, M. (2019). Trend analysis of climate time series: A review of methods. Earth-Science Reviews, 190, 310-322. [CrossRef]
- Milentijević, N., Valjarević, A., Bačević, N.R., Ristić, D., Kalkan, K., Cimbaljević, M., Dragojlović, J., Savić, S., & Pantelić, M. (2022). Assessment of observed and projected climate changes in Bačka (Serbia) using trend analysis and climate modeling. Idȍjárás, 126(1), 47–68. [CrossRef]
- Kendall M (1938) A new measure of rank correlation. Biometrika30:81–89.
- Mann, H.B., 1945: Nonparametric tests against trend. Econometrica: J. Econometric Soc. 13, 245–259. [CrossRef]
- Gilbert RO (1987) Statistical methods for environmental pollution monitoring. Van Nostrand Reinhold, New York.
- Matenge, R.G.; Parida, B.P.; Letshwenyo, M.W.; Ditalelo, G. Impact of Climate Variability on Rainfall Characteristics in the Semi-Arid Shashe Catchment (Botswana) from 1981–2050. Earth 2023, 4, 398-441. [CrossRef]
- Dan'azumi, S., Mamudu, L., & Aldrees, A. (2025). Climate change detection and attribution: Bayesian estimation of abrupt change, seasonality and trend model, and Mann–Kendall trend test approaches. Journal of Water and Climate Change, 16(5), 1895–1911. [CrossRef]
- Li, J., & Wang, J. (2003). A new and optimal North Atlantic Oscillation index and its variability. Geophysical Research Letters, 30(24), 2294. https://agupubs.onlinelibrary.wiley.com/doi/10.1029/2003GL018726.
- Bureau of Meteorology. (2023). Southern Oscillation Index (SOI) since 1876. Retrieved from https://www.bom.gov.au/climate/enso/soi/.
- National Centers for Environmental Information. (2023). North Atlantic Oscillation (NAO). Retrieved from https://www.ncei.noaa.gov/access/monitoring/nao/.
- Vicente-Serrano, S.M., García-Herrera, R., Barriopedro, D. et al. The Westerly Index as complementary indicator of the North Atlantic oscillation in explaining drought variability across Europe. Clim Dyn 47, 845–863 (2016). [CrossRef]
- Leščešen I, Basarin B, Podraščanin Z, Mesaroš M. Changes in Annual and Seasonal Extreme Precipitation over Southeastern Europe. Environmental Sciences Proceedings. 2023; 26(1):48. [CrossRef]
- Moral, F.J., Paniagua, L.L., Rebollo, F.J. et al. Spatial analysis of the annual and seasonal aridity trends in Extremadura, southwestern Spain. Theor Appl Climatol 130, 917–932 (2017). [CrossRef]
- Kiorouktsidou, A.; Droulia, F.; Charalampopoulos, I. An Evolution of Climate in Greece by the Johansson, Kerner and Pinna Indices. Environ. Earth Sci. Proc. 2025, 35, 26. [CrossRef]
- Andrade, C., & Corte-Real, J. A. (2015). Spatial distribution of climate indices in the Iberian Peninsula. AIP Conference Proceedings, 1648, 110006. [CrossRef]
- Bissenbayeva, S., Shokparova, D., Abuduwaili, J., Samat, A., Ma, L., & Ge, Y. (2025). Spatiotemporal Dynamics of the Aridity Index in Central Kazakhstan. Sustainability, 17(15), 7089. [CrossRef]
- El Kenawy, A. M., McCabe, M. F., Vicente-Serrano, S. M., Robaa, S. M., & Lopez-Moreno, J. I. (2016). Recent changes in continentality and aridity conditions over the Middle East and North Africa region, and their association with circulation patterns. Climate Research, 69, 25–43. [CrossRef]
- Mărgărit M. Nistor (2016). Spatial distribution of climate indices in the Emilia-Romagna region. Meteorological Applications, 23(2), 304–313. [CrossRef]
- Bešt́áková, Z., Strnad, F., Vargas Godoy, M. R. et al. (2023). Changes of the aridity index in Europe from 1950 to 2019. Theoretical and Applied Climatology, 151, 587–601. [CrossRef]
- Hanberry, B.B. Global Climate Classification and Comparison to Mid-Holocene and Last Glacial Maximum Climates, with Added Aridity Information and a Hypertropical Class. Earth 2023, 4, 552-569. [CrossRef]
Figure 1.
Location of North Macedonia and distribution of meteorological stations.
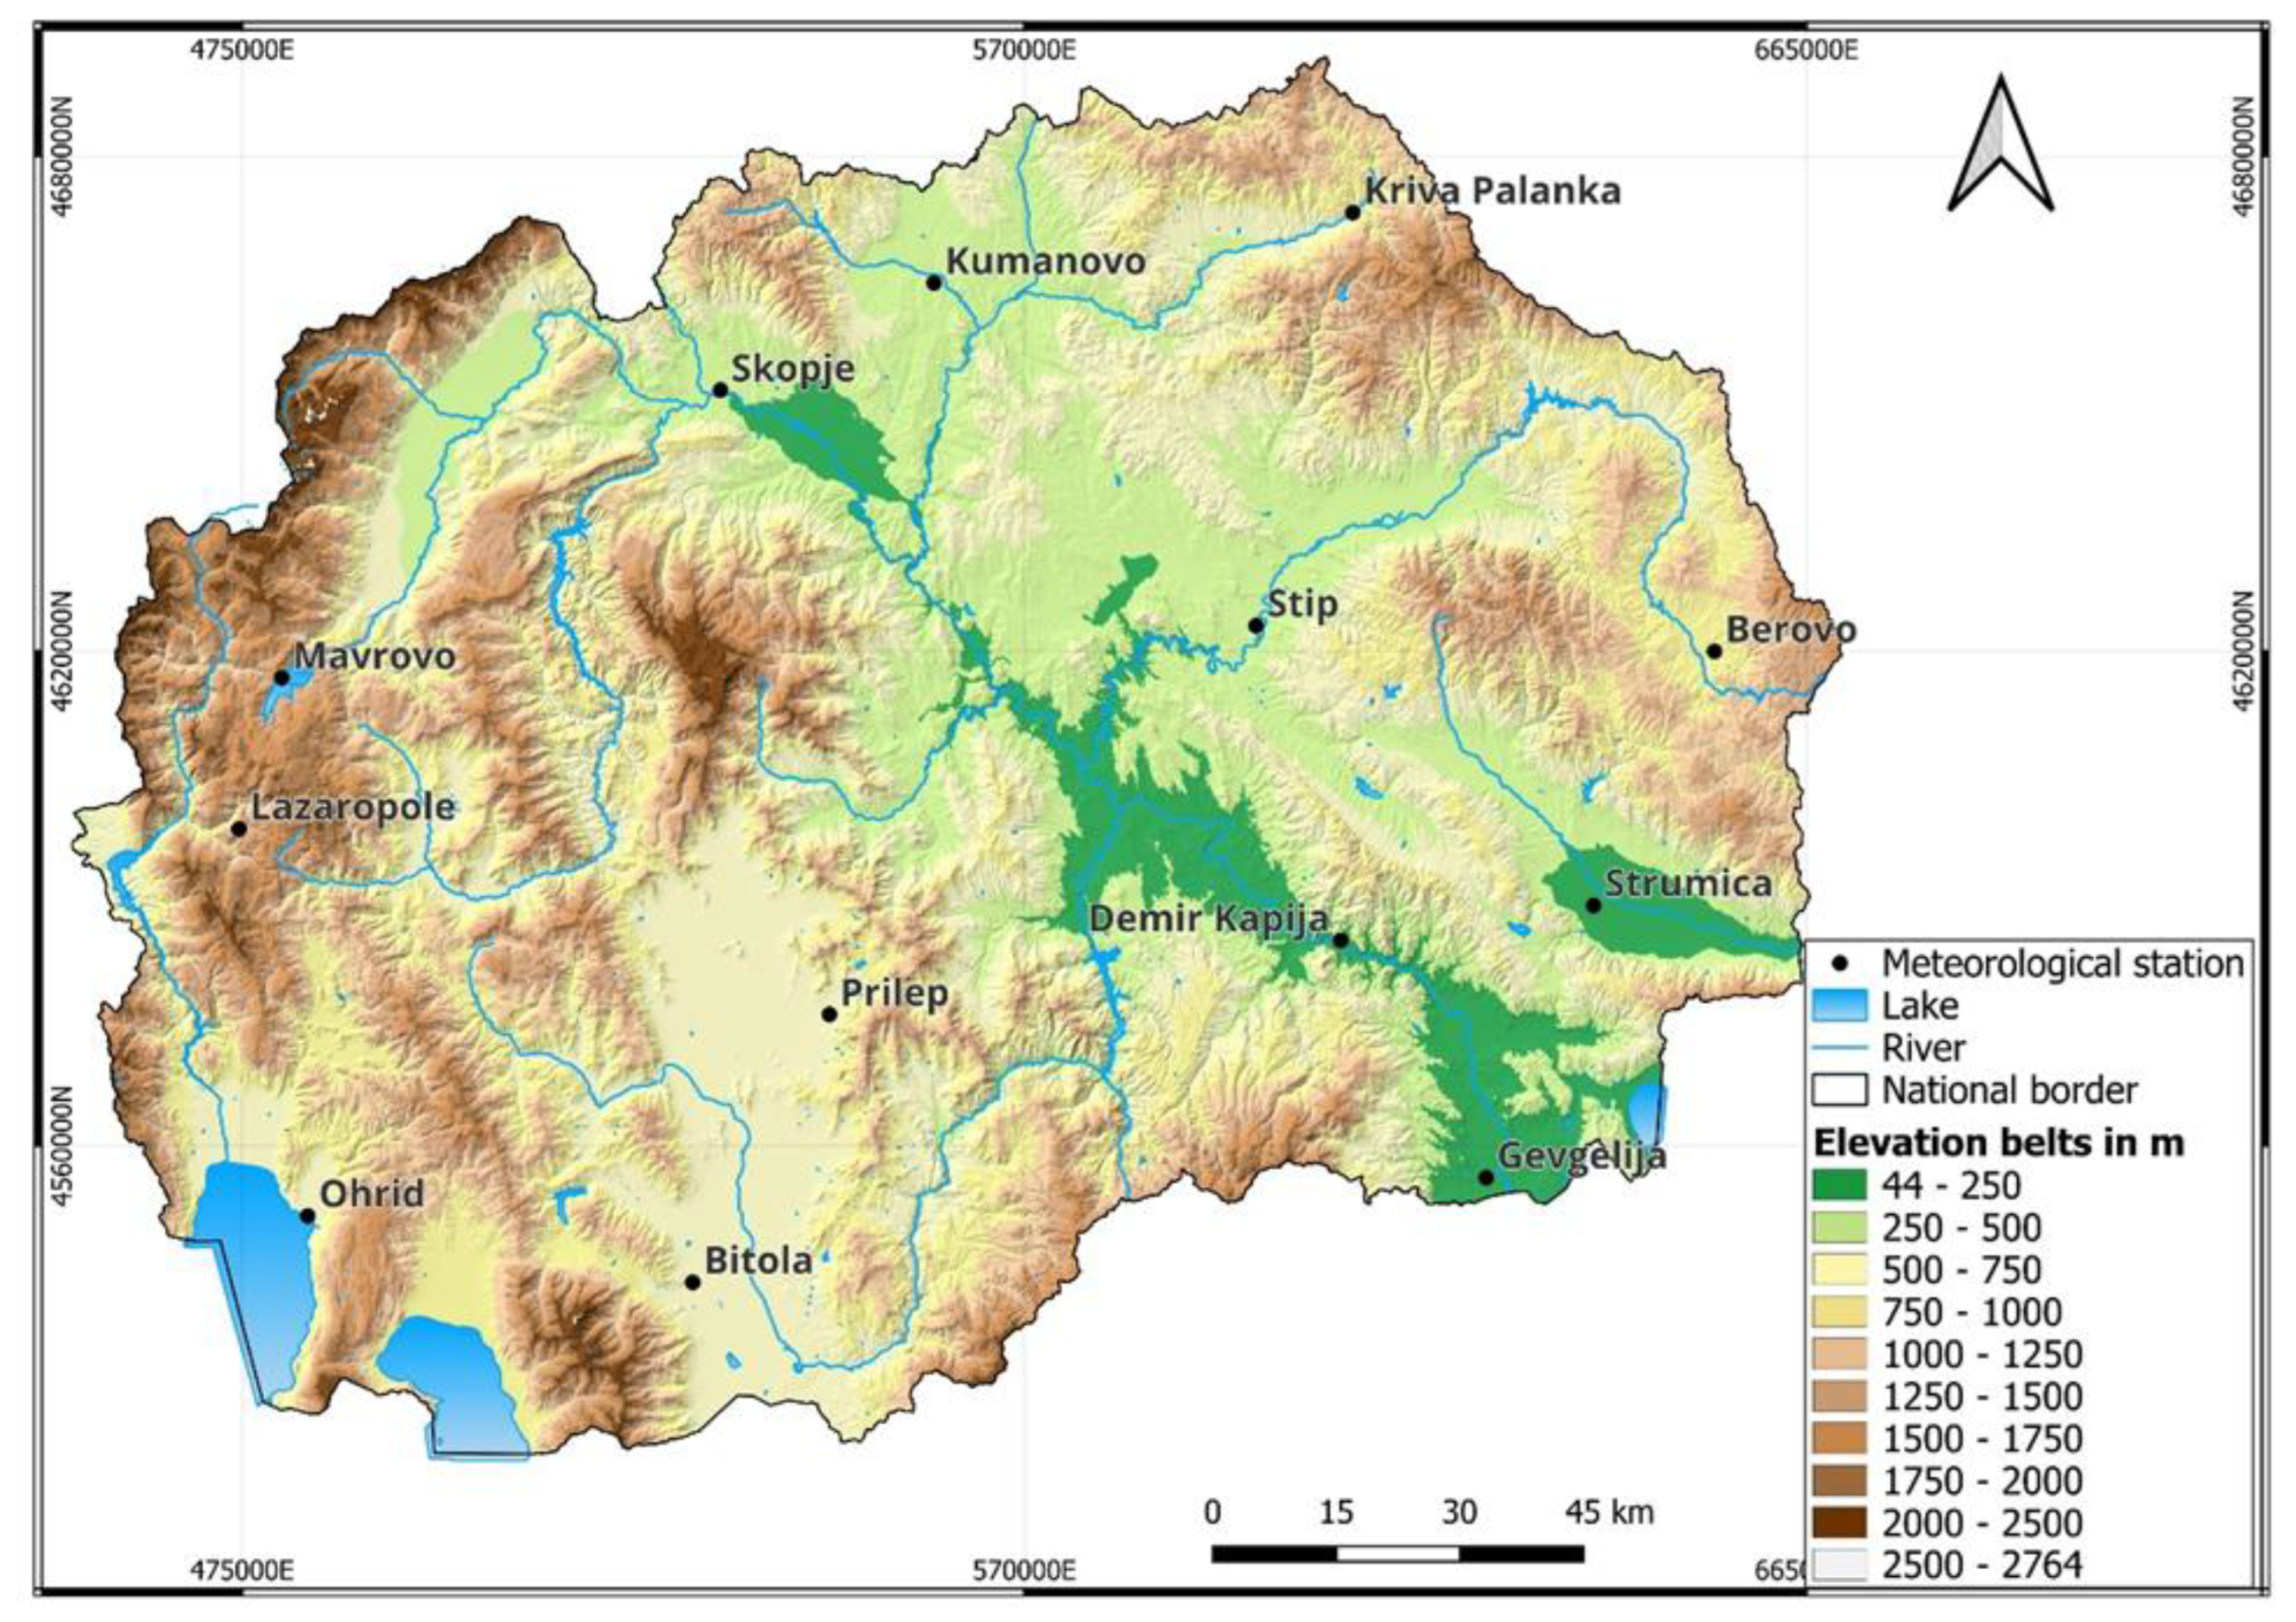
Figure 2.
Conceptual flowchart of used methodology in this study.
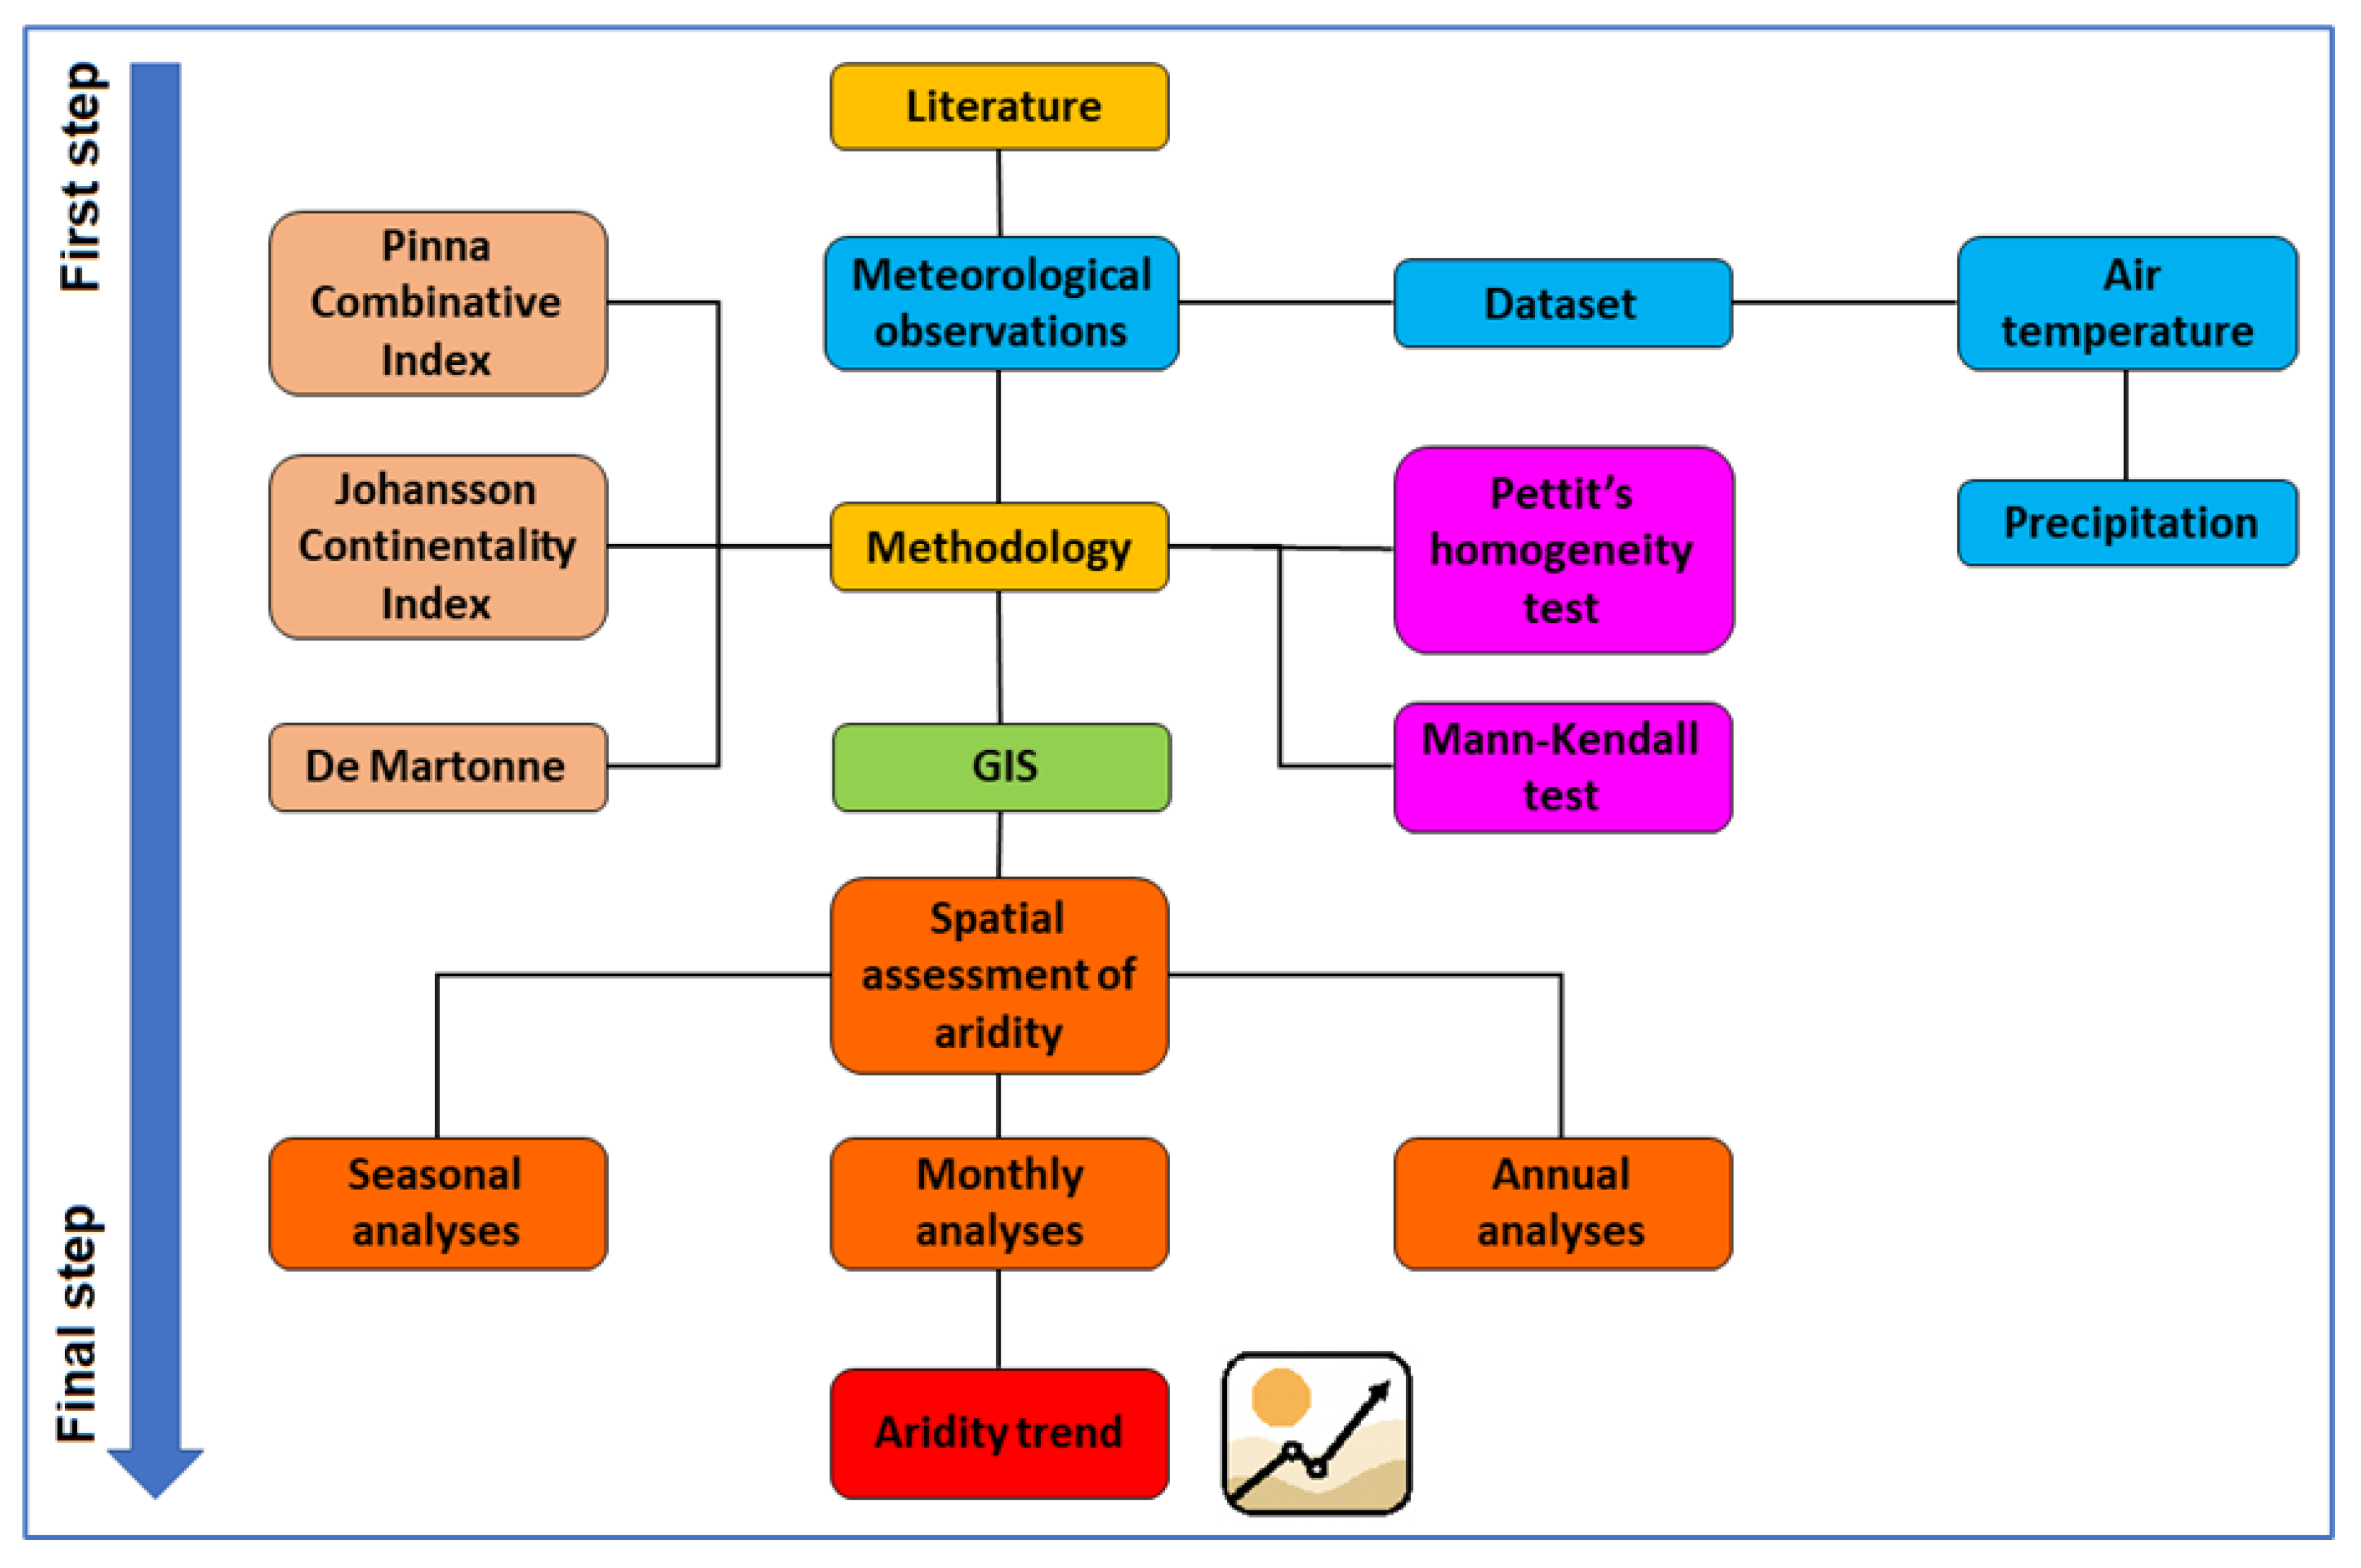
Figure 3.
Pettitt’s homogeneity test (1991-2020).
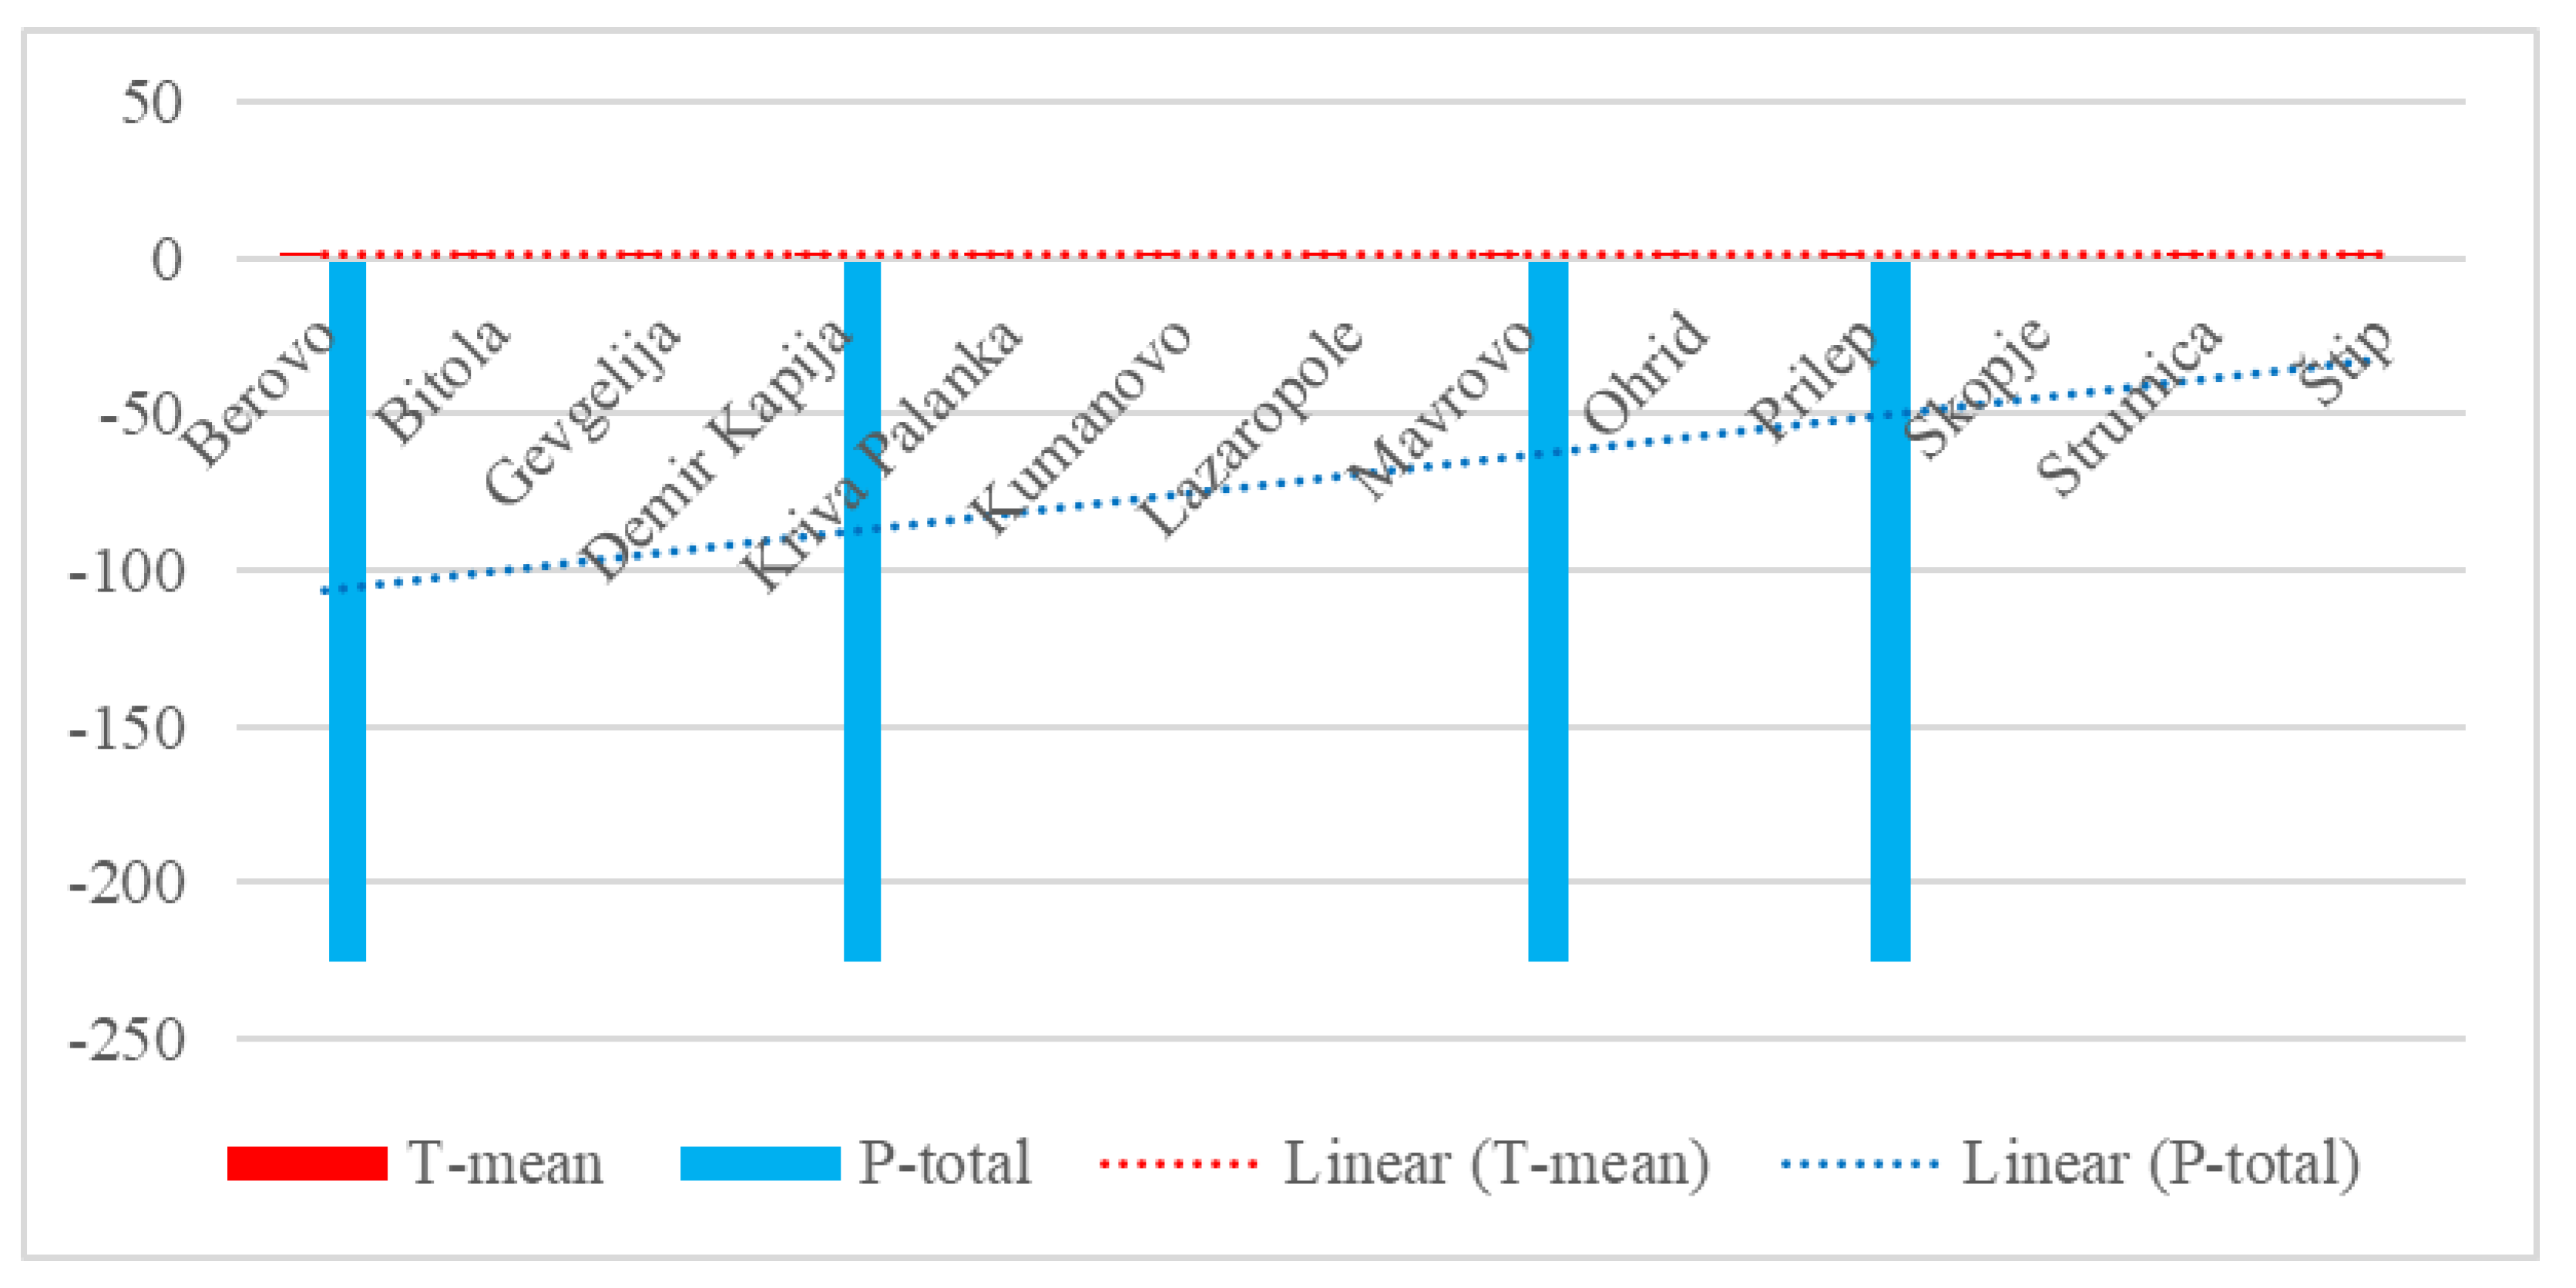
Figure 4.
Spatial variability of MAT (A) and MAP (B) in North Macedonia for the period 1991–2020 (according to the analyzed meteorological stations data) [61].
Figure 4.
Spatial variability of MAT (A) and MAP (B) in North Macedonia for the period 1991–2020 (according to the analyzed meteorological stations data) [61].
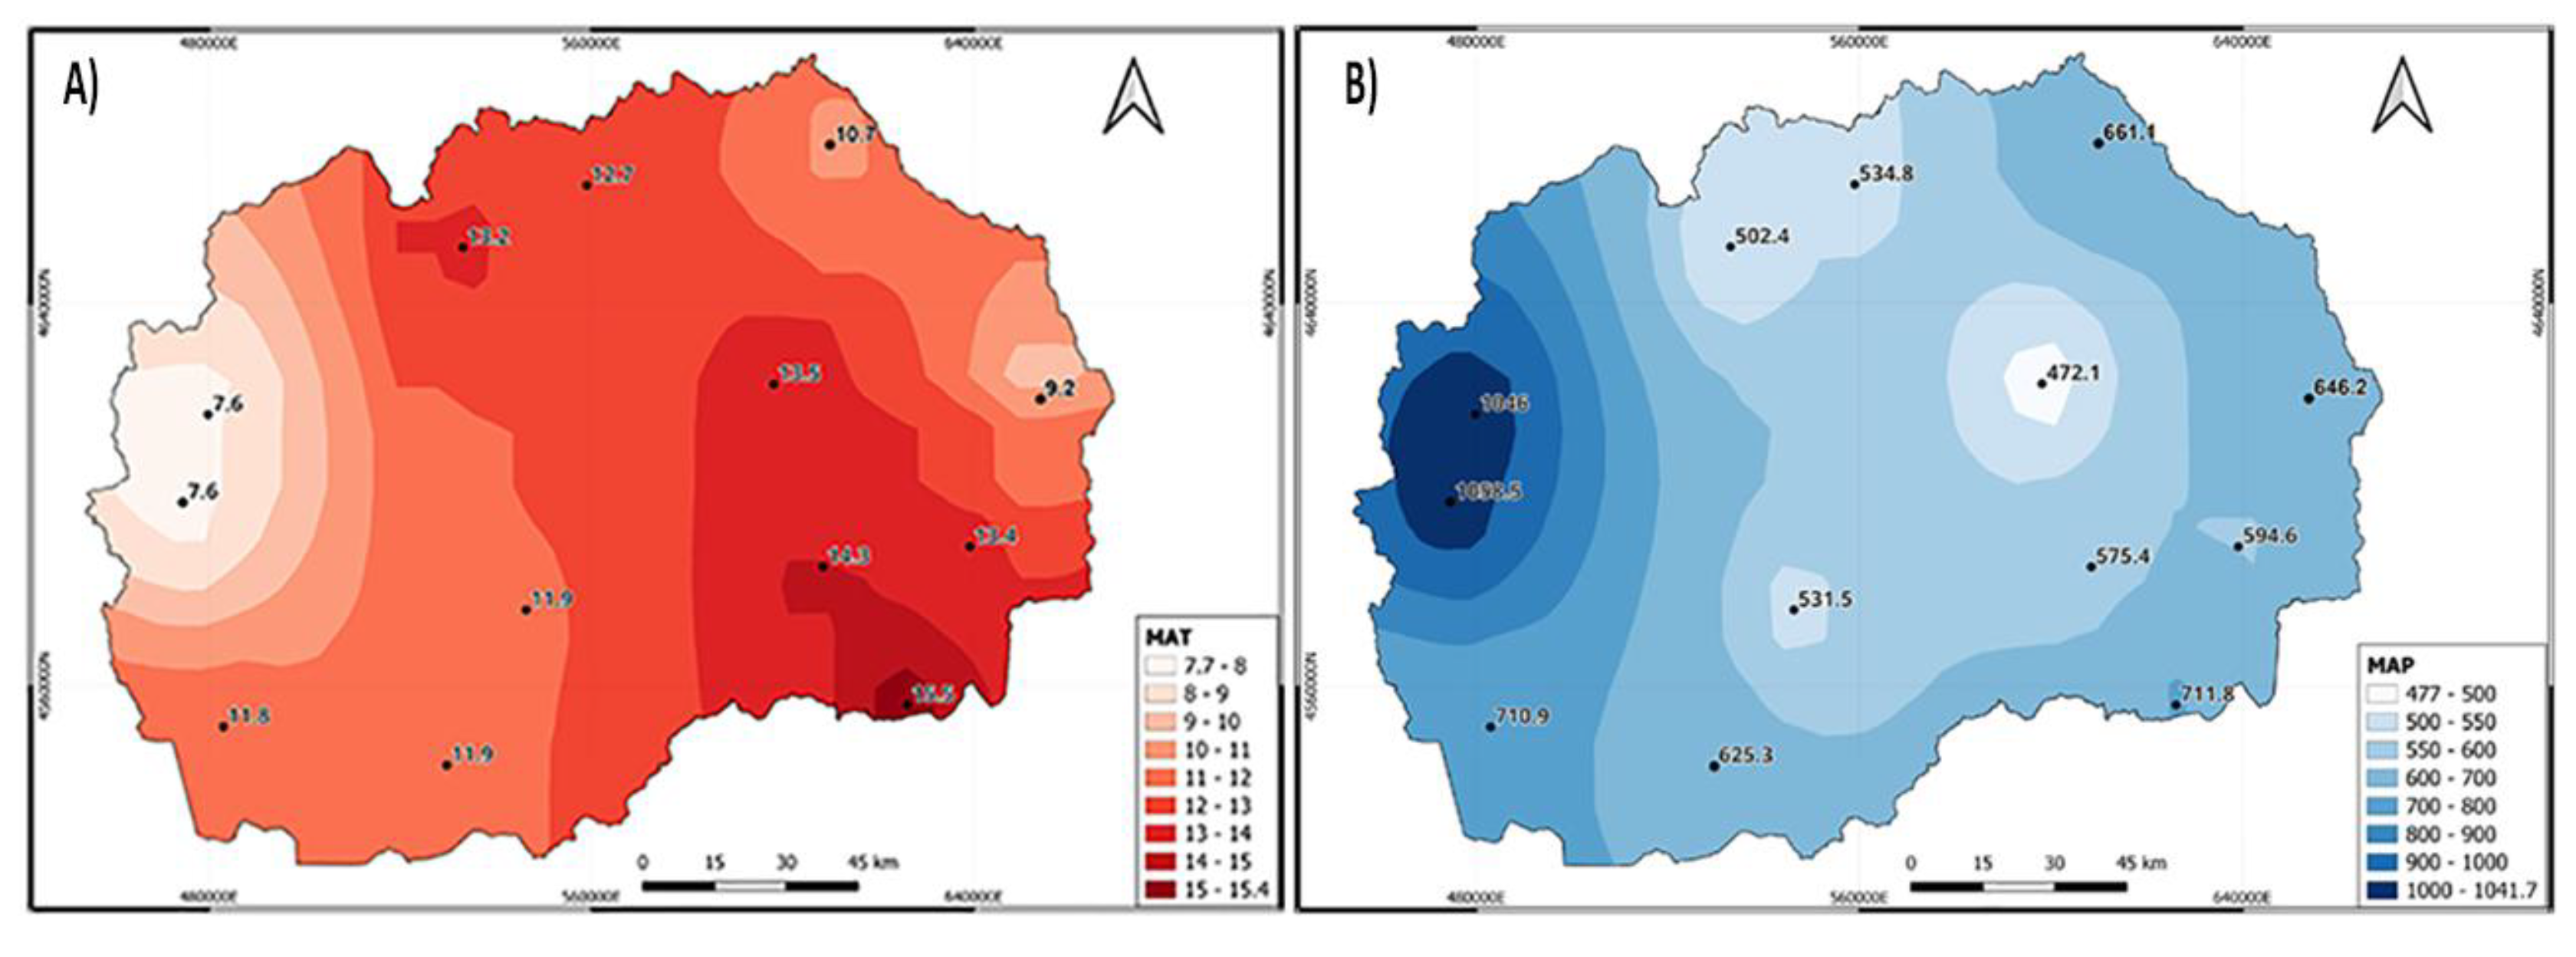
Figure 5.
The JCI distribution over the study area (1991–2020).
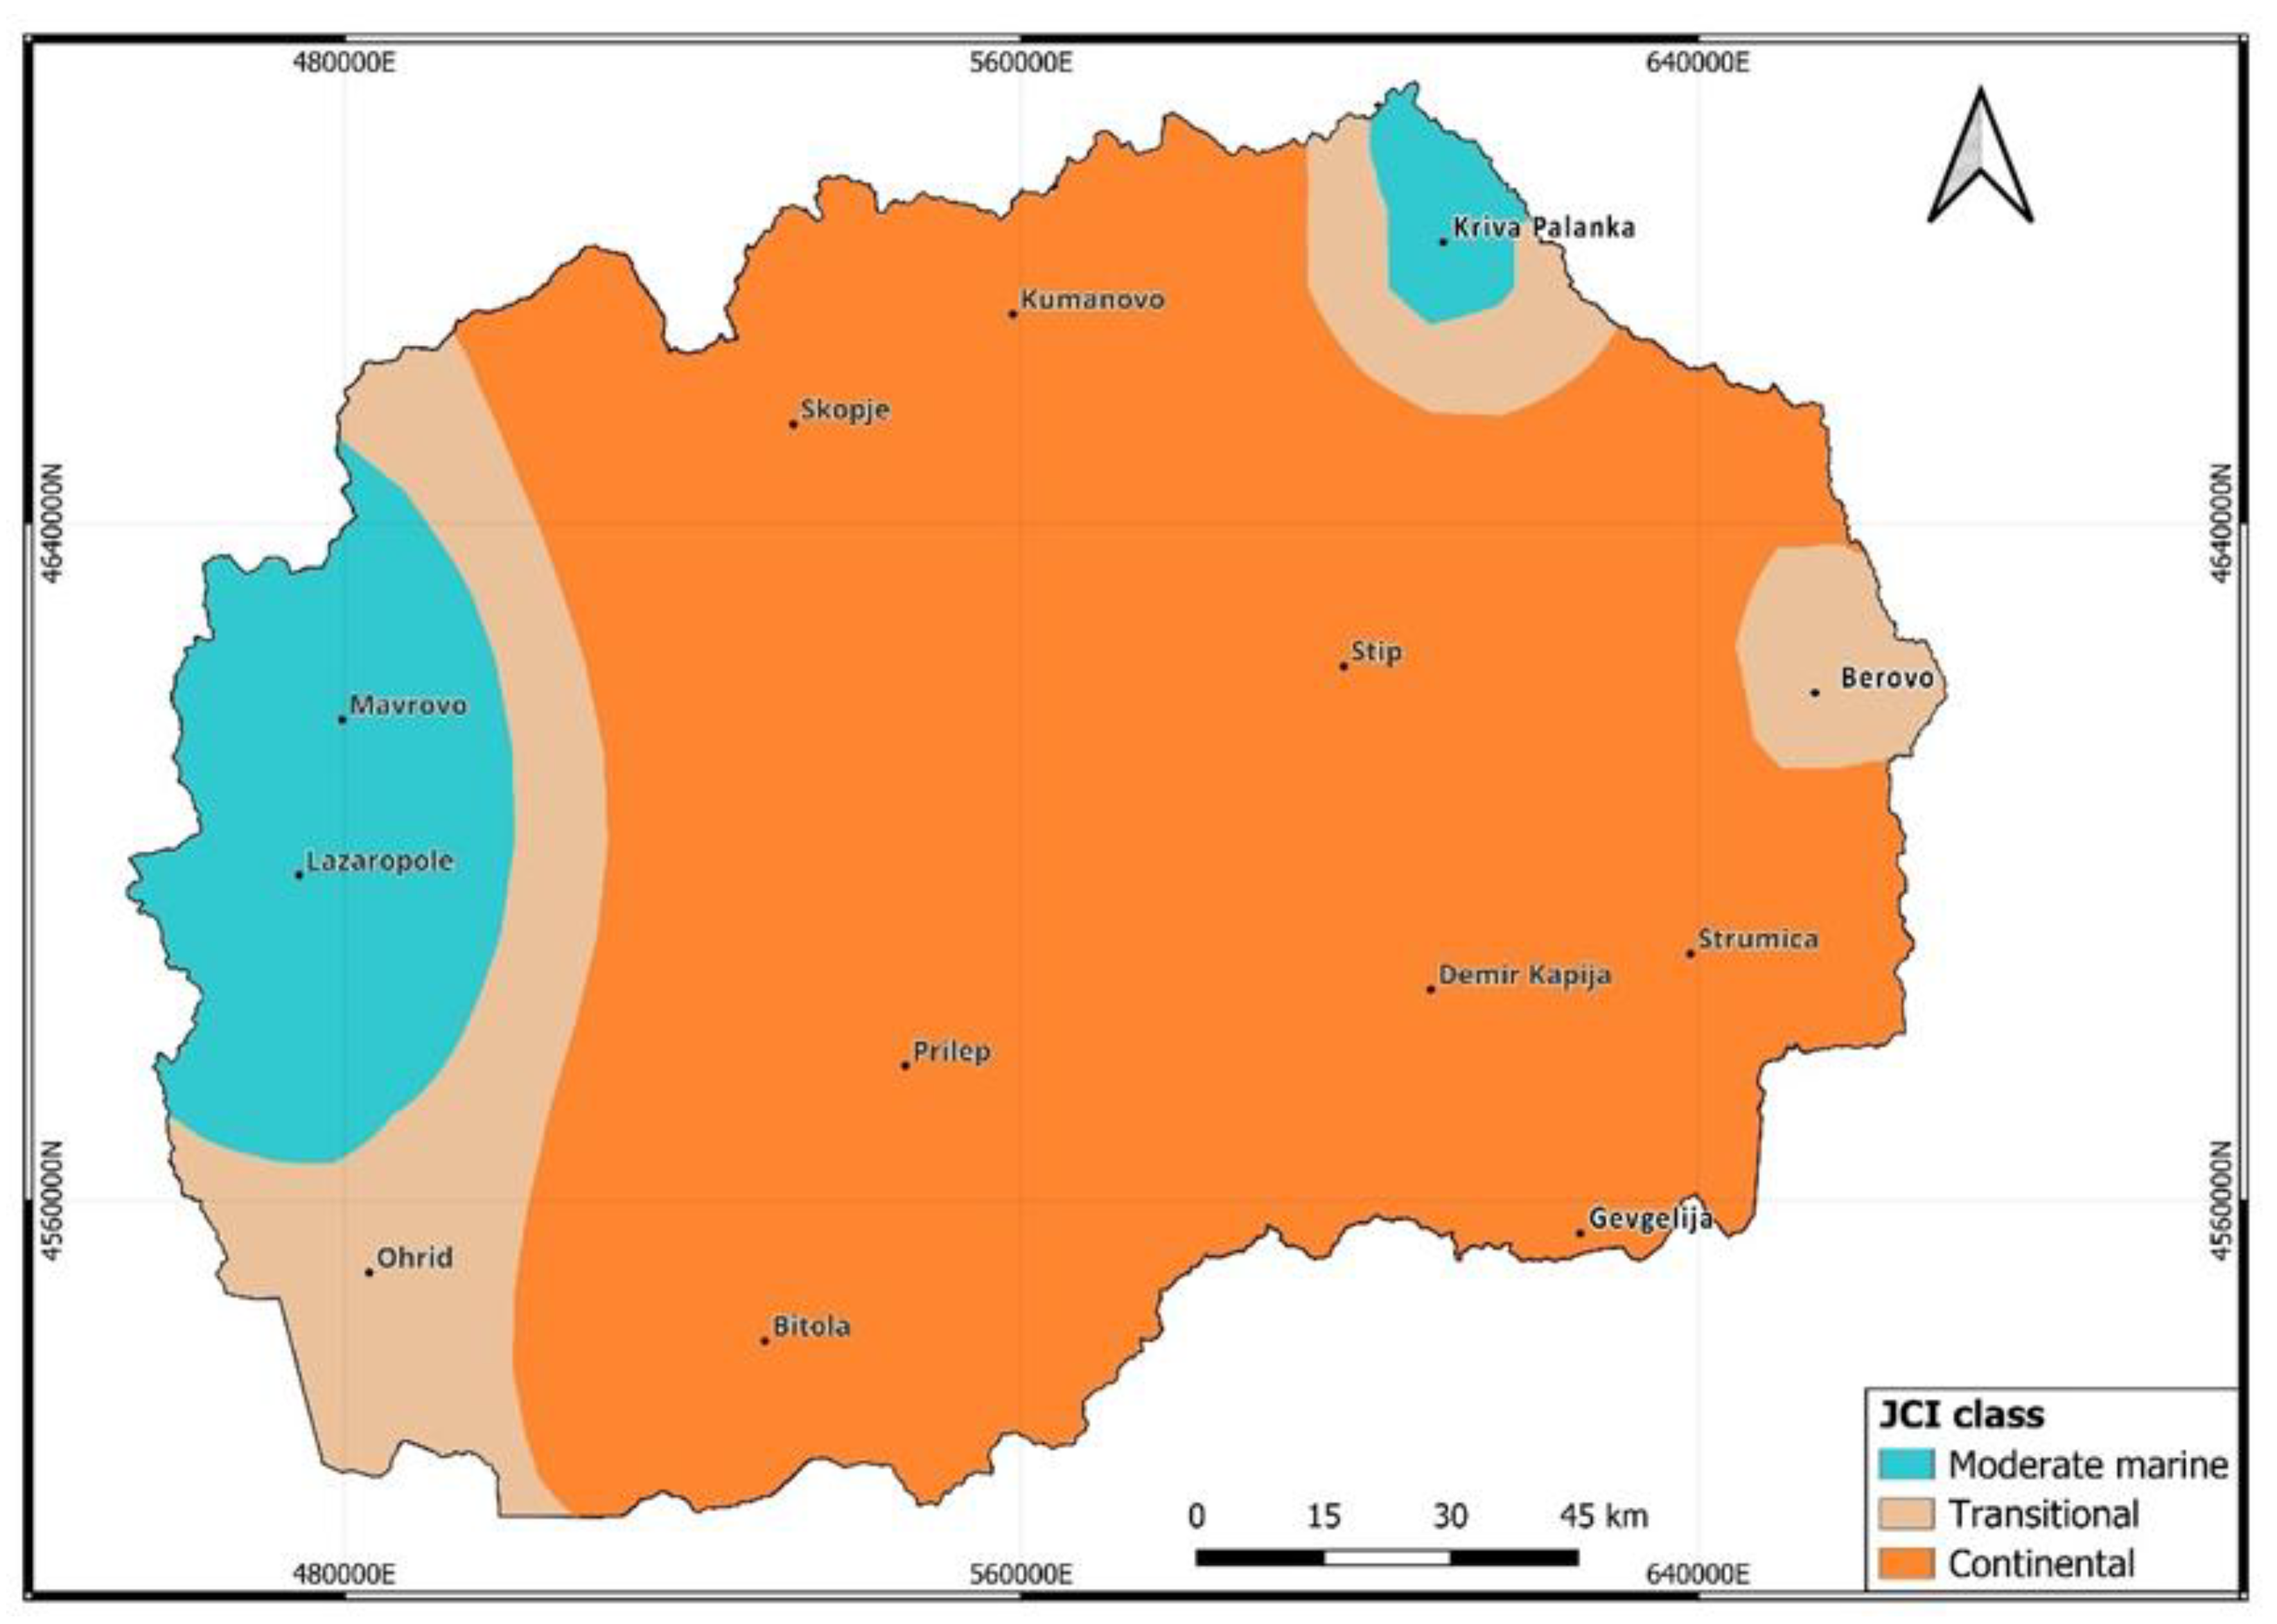
Figure 6.
Monthly distribution of the De Martonne aridity index.
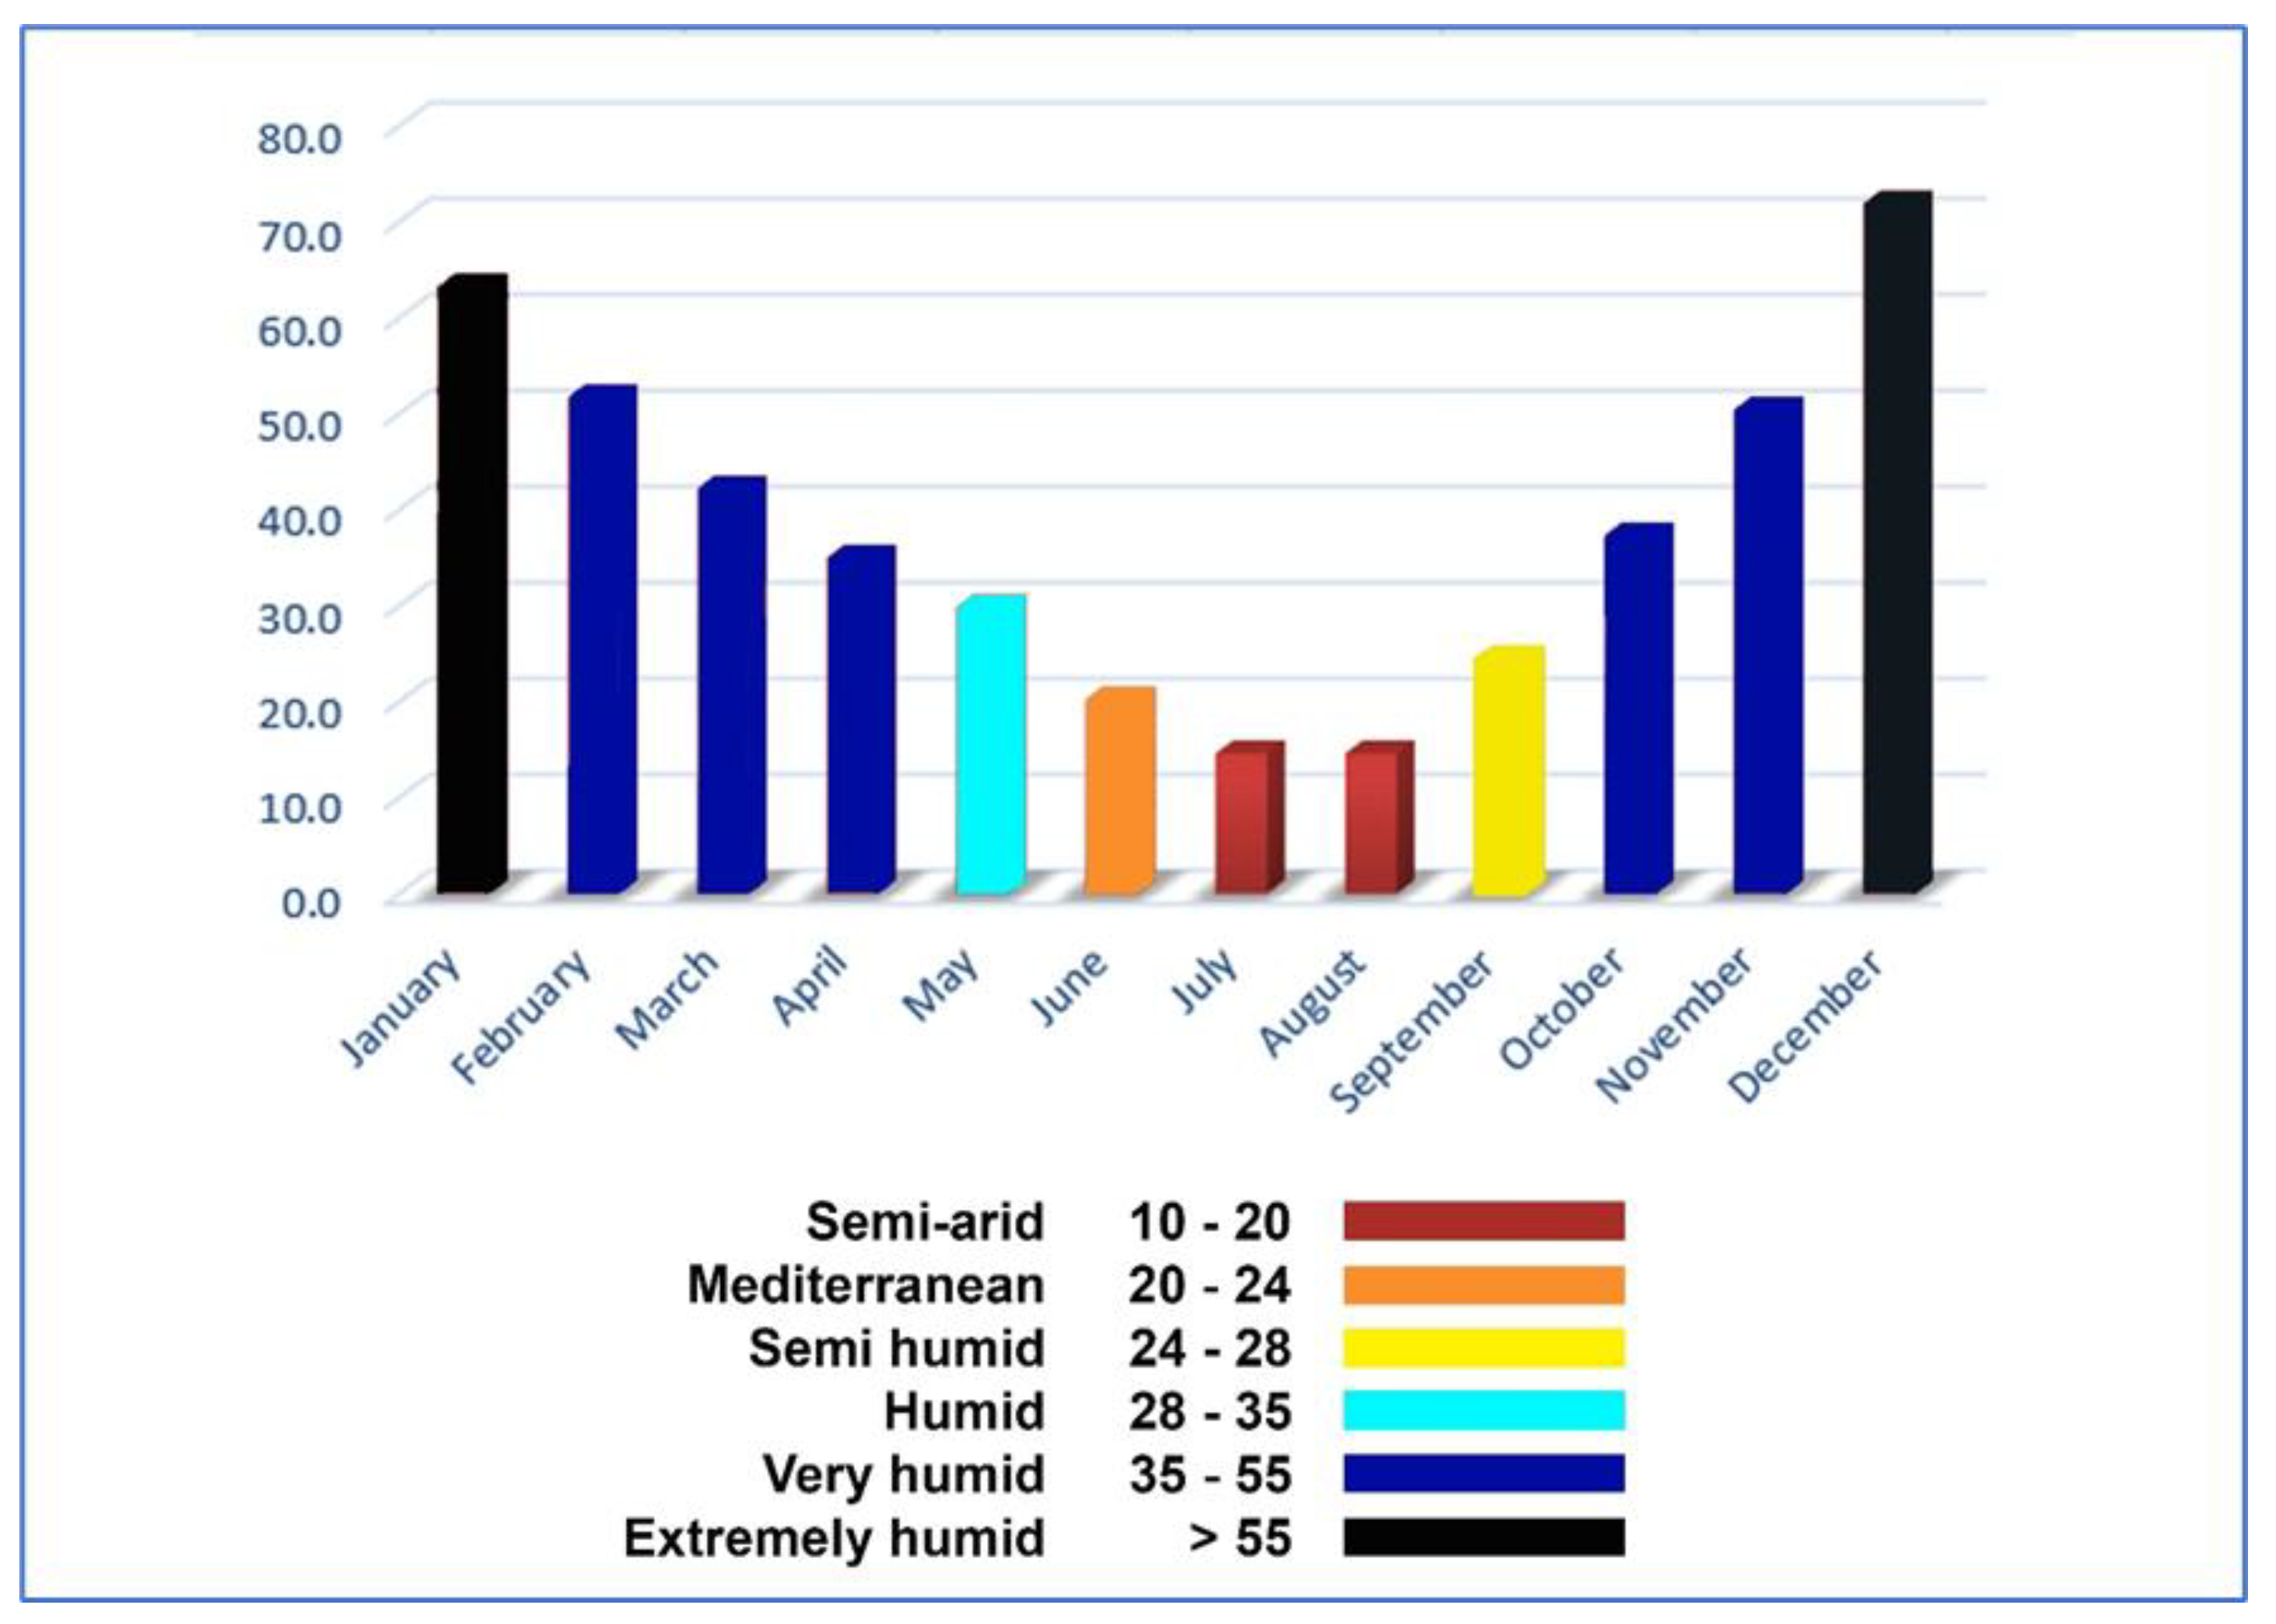
Figure 7.
Seasonal De Martonne aridity index values.
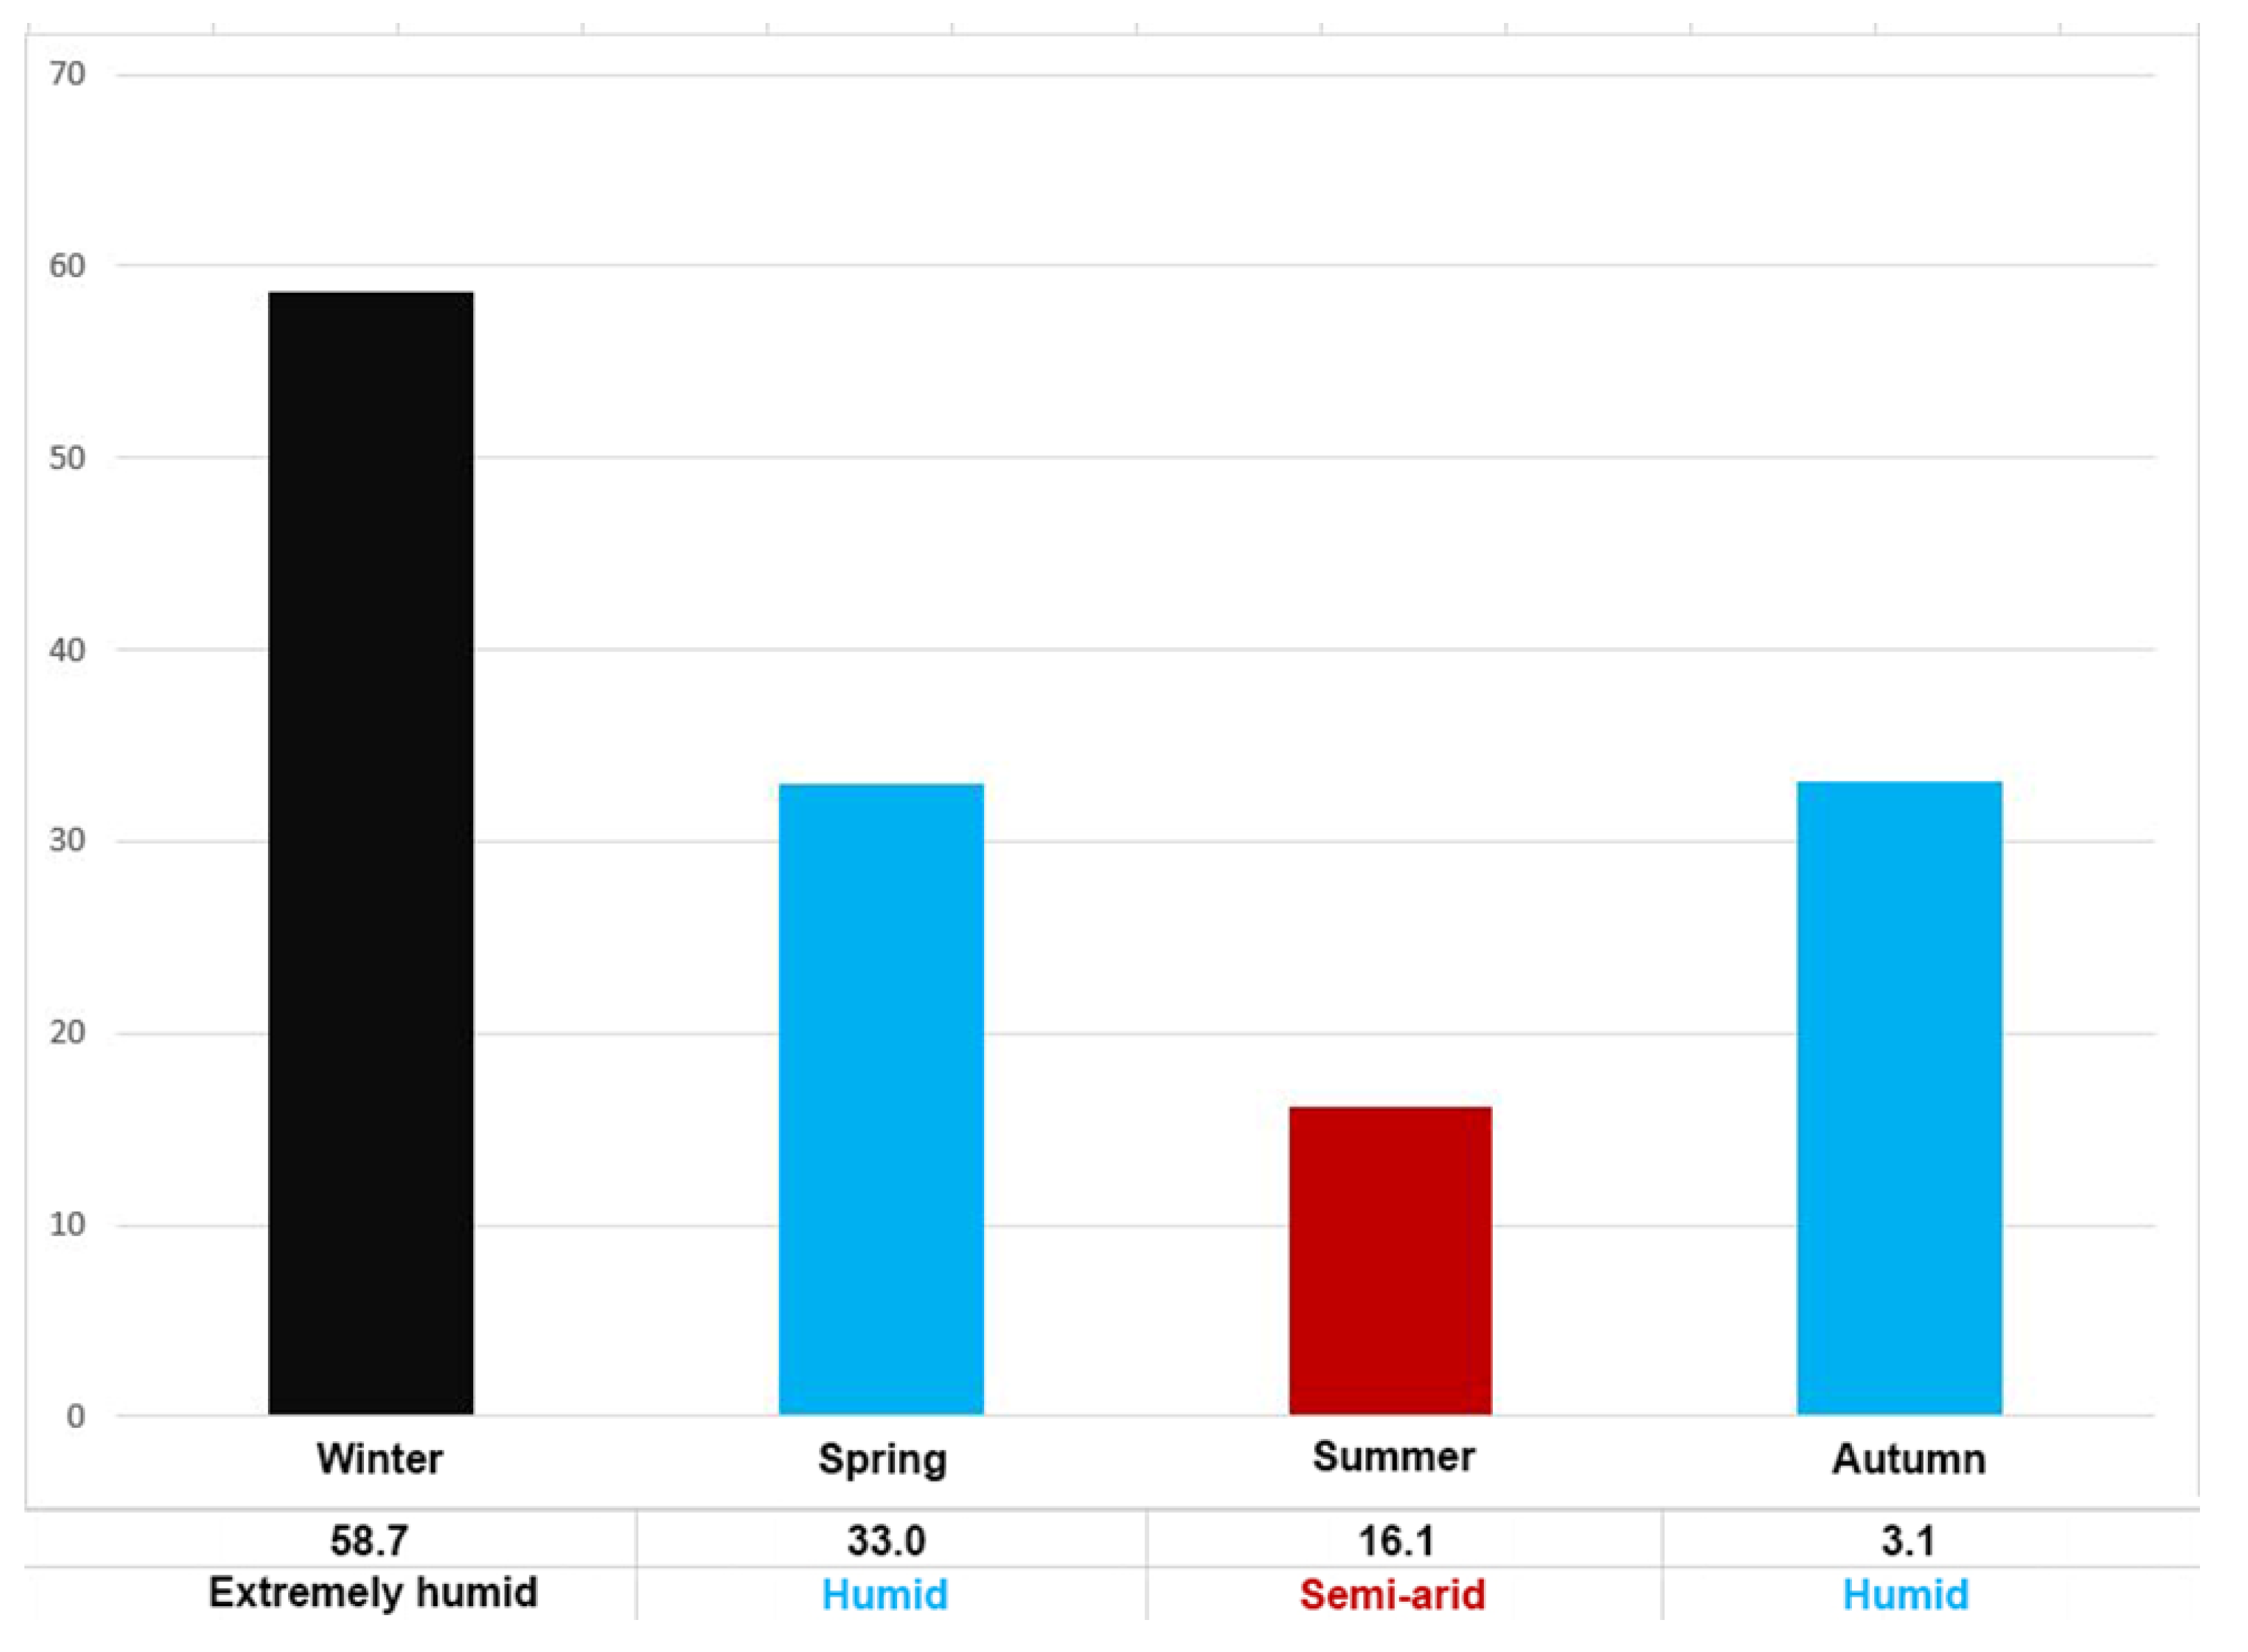
Figure 8.
Seasonal spatial distribution of IsDM; Winter (A); Spring (B); Summer (C) and Autumn (D) according to the data of meteorological stations [61].
Figure 8.
Seasonal spatial distribution of IsDM; Winter (A); Spring (B); Summer (C) and Autumn (D) according to the data of meteorological stations [61].
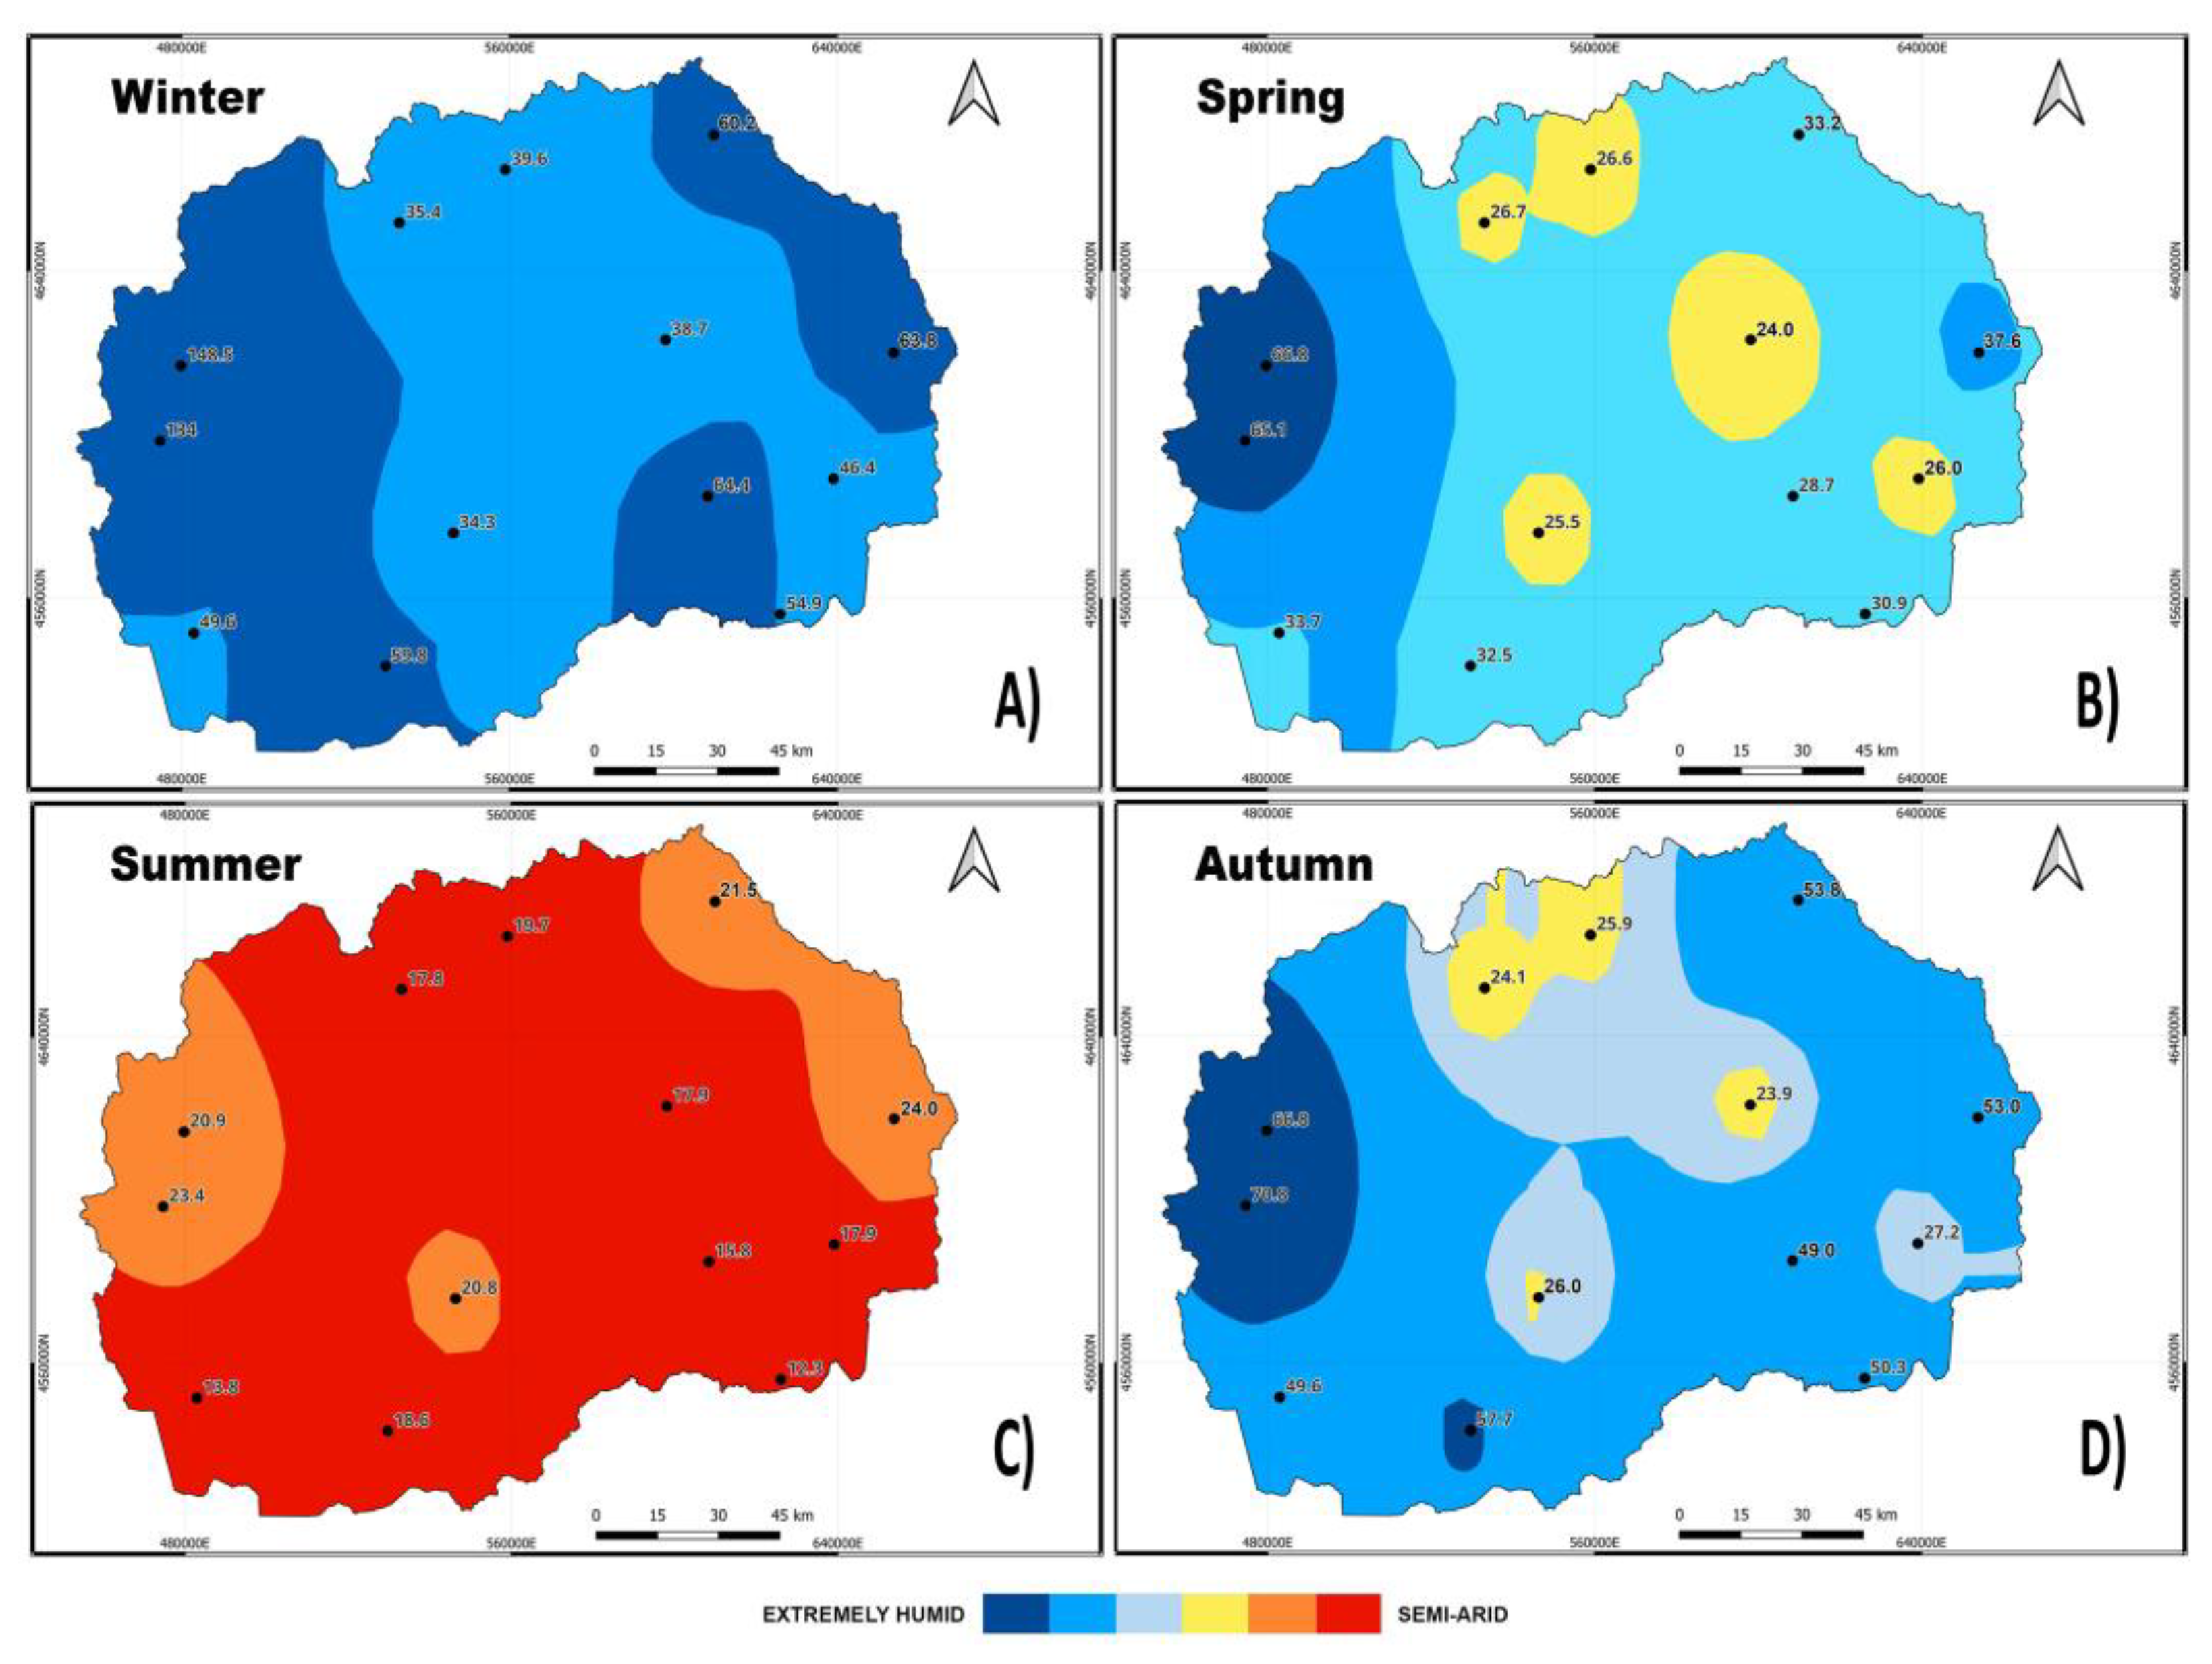
Figure 9.
Annual variation of the IDM trend in North Macedonia (1991–2020).
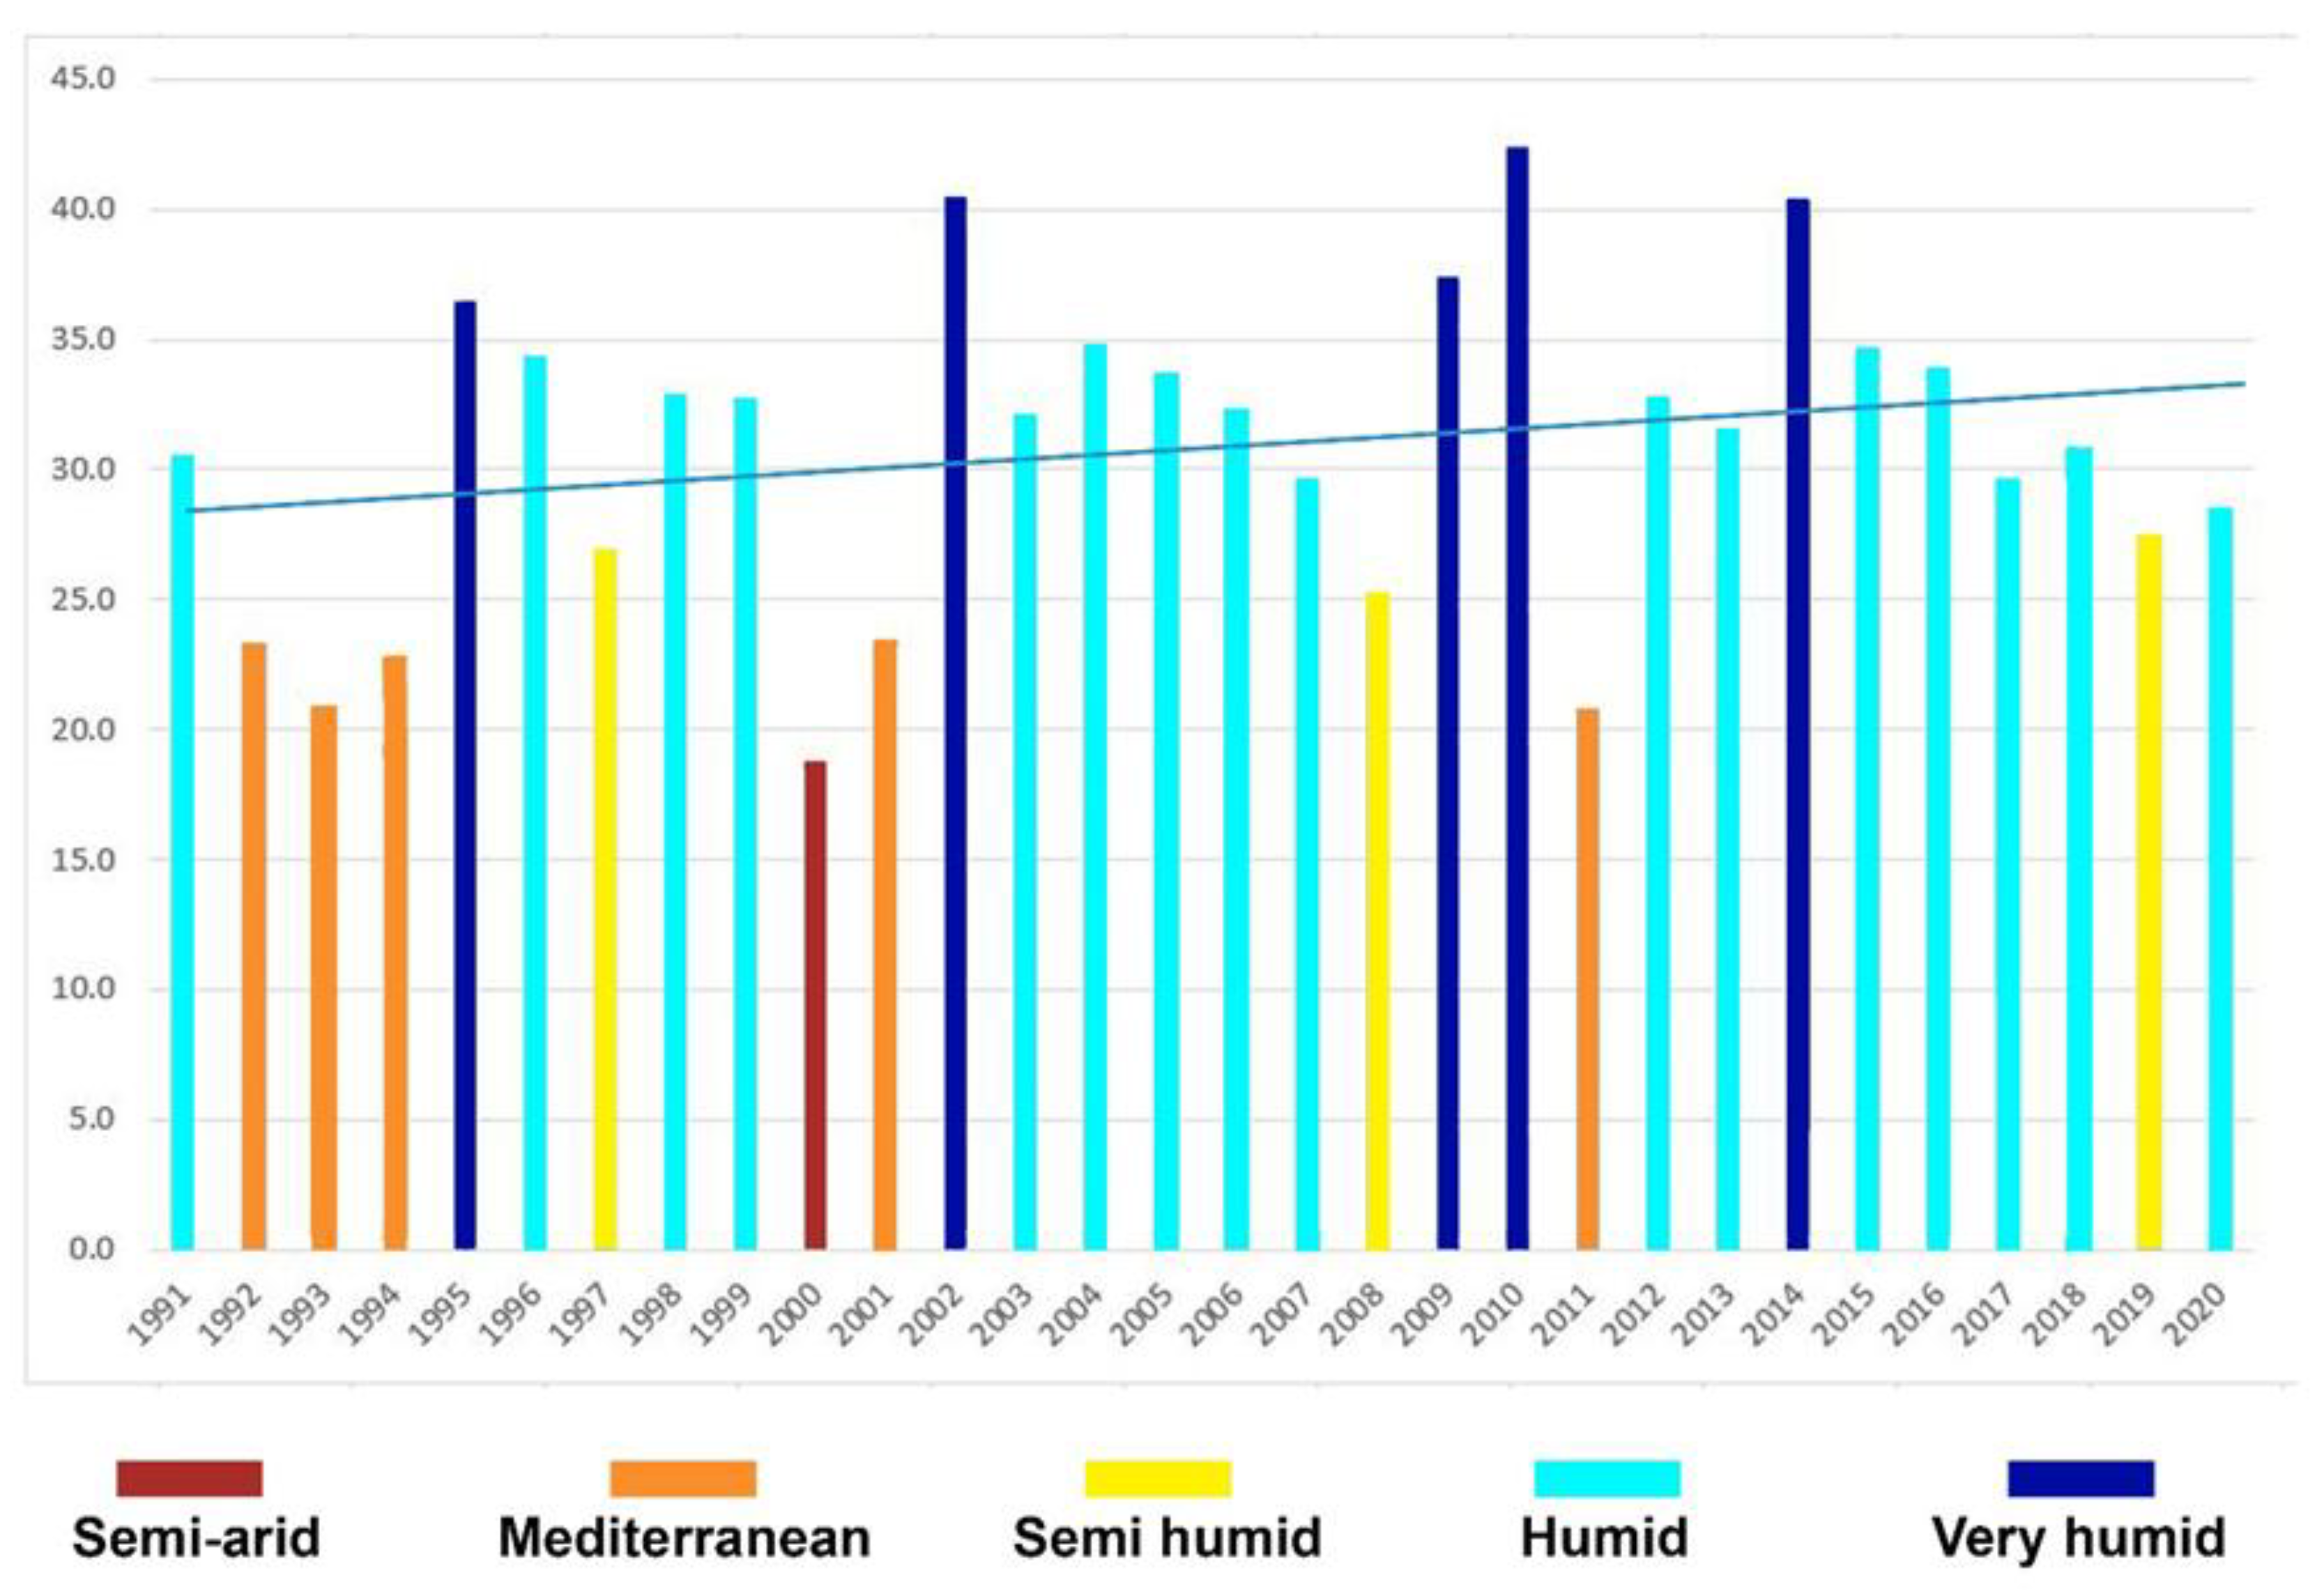
Figure 10.
Annual variation of the IDM in North Macedonia (1991–2020).
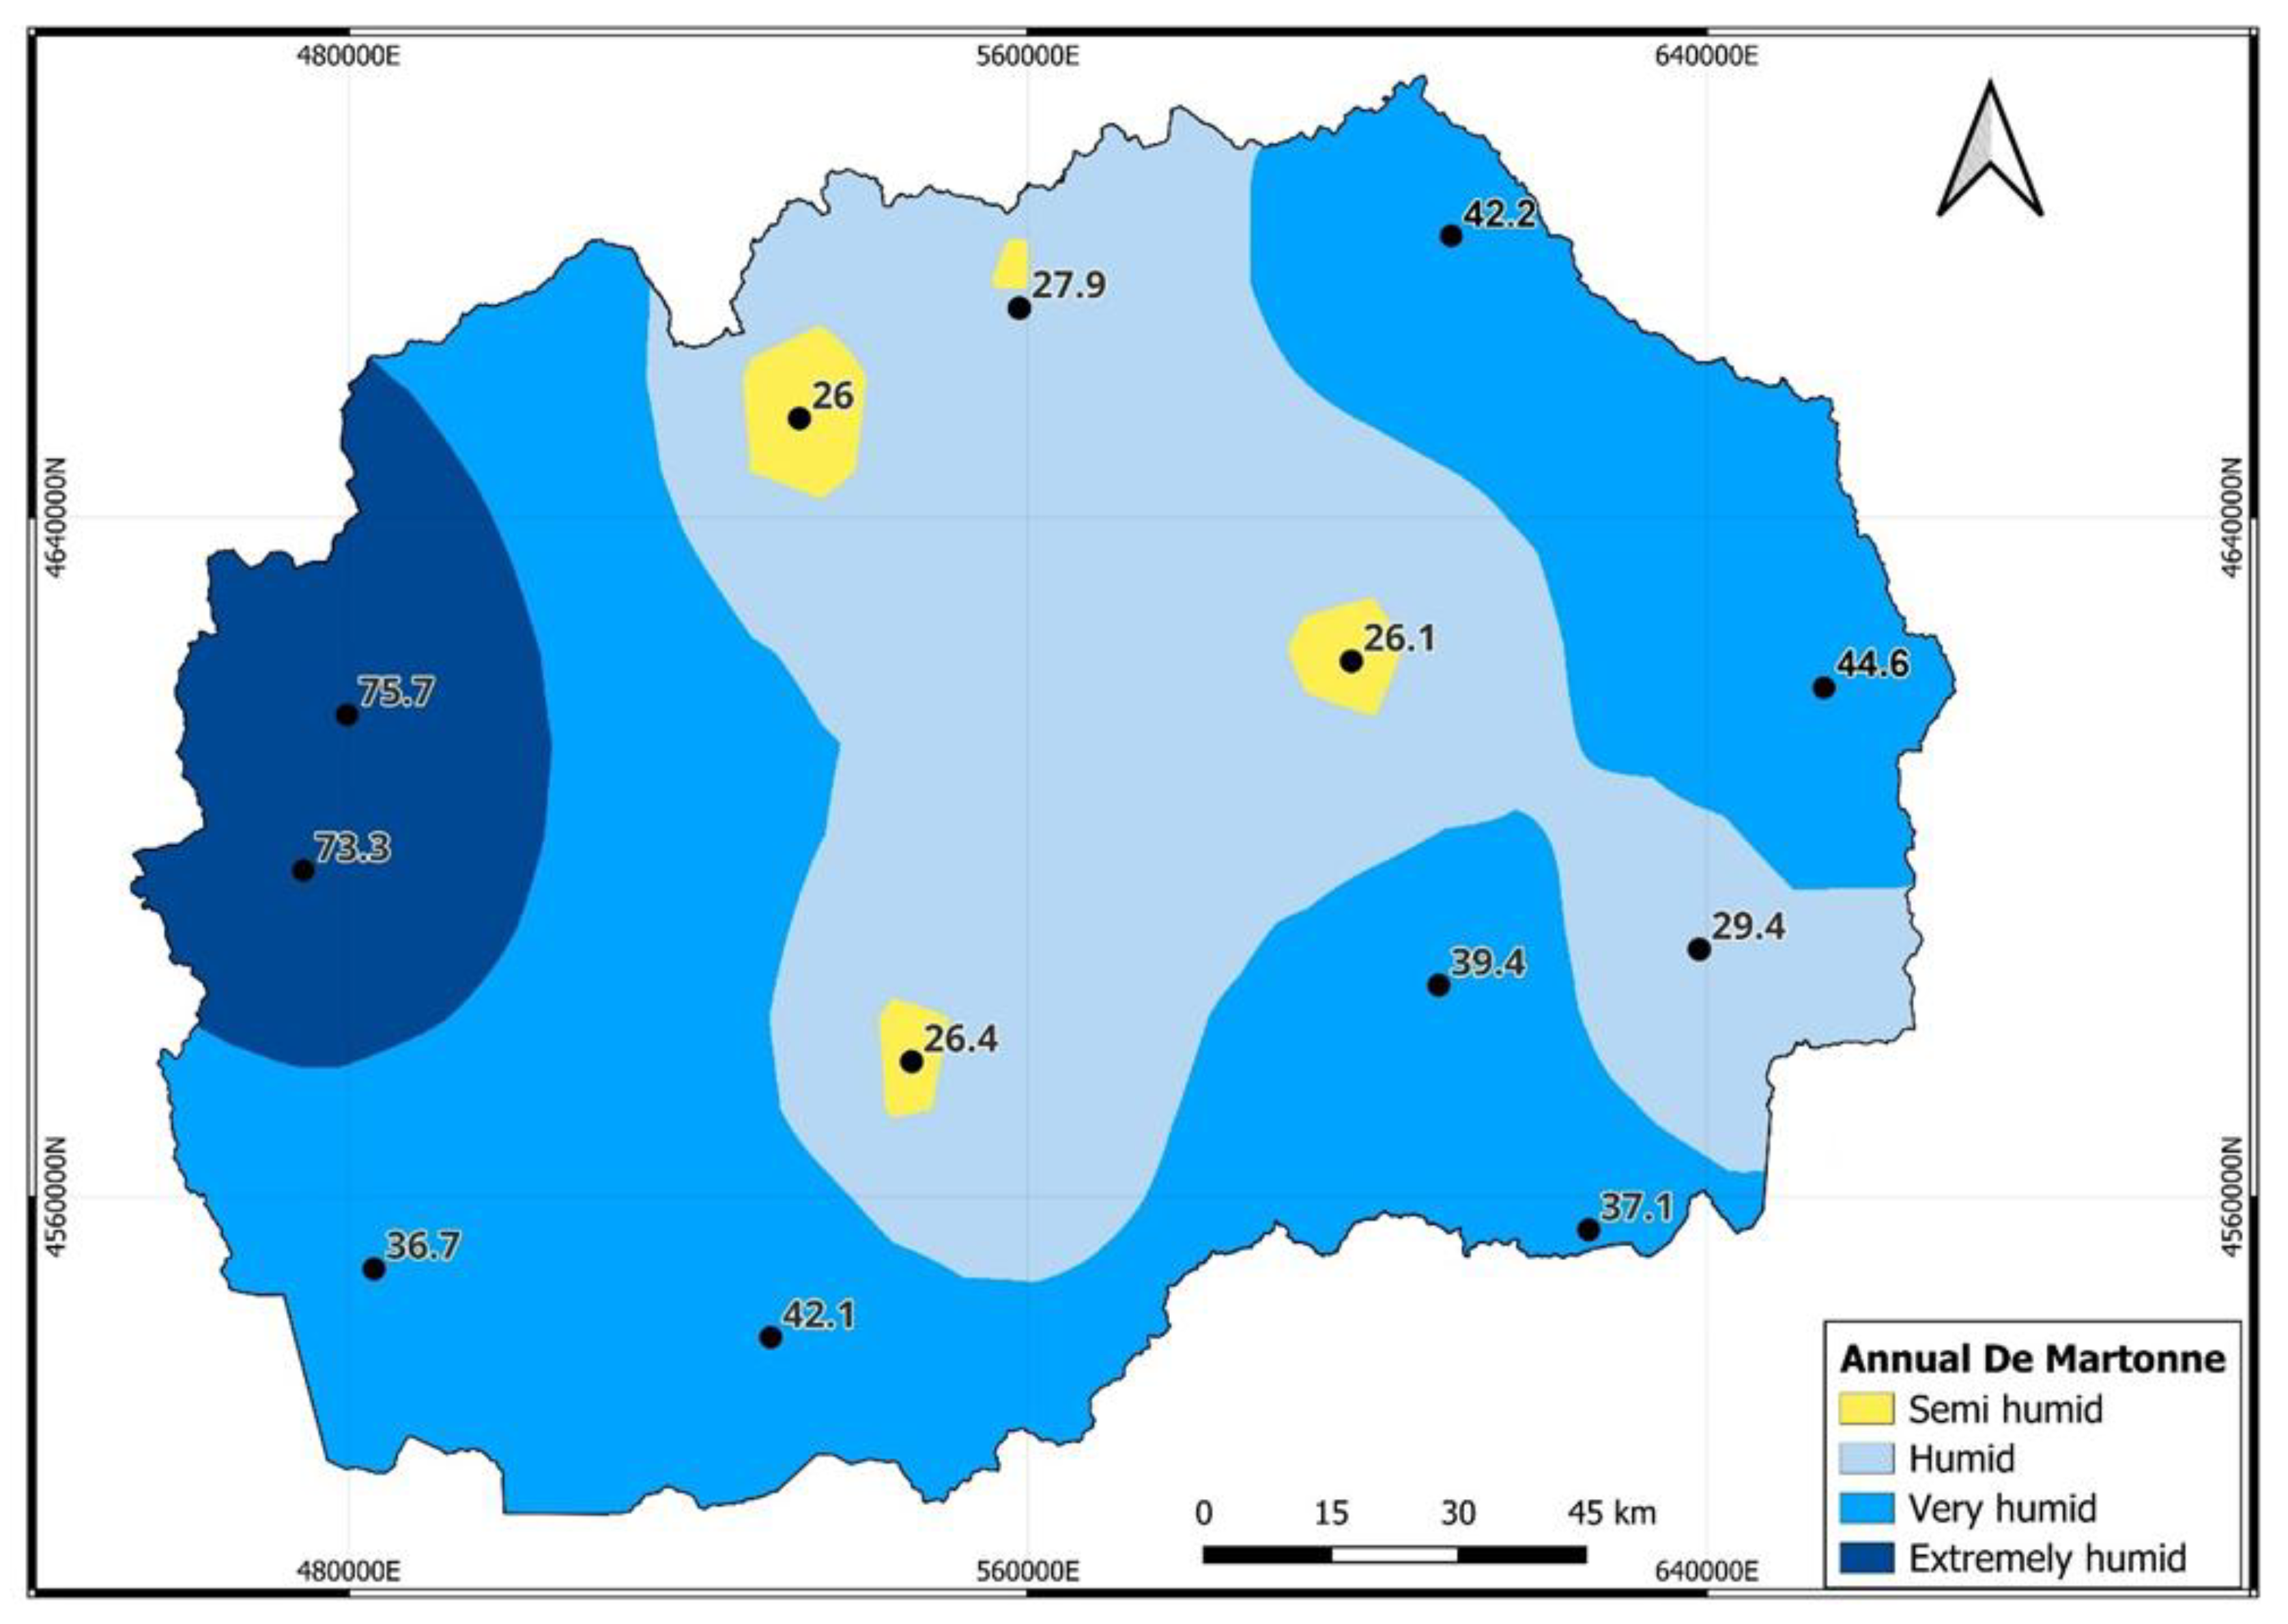
Figure 11.
Annual variation of the IP trend in North Macedonia (1991–2020).
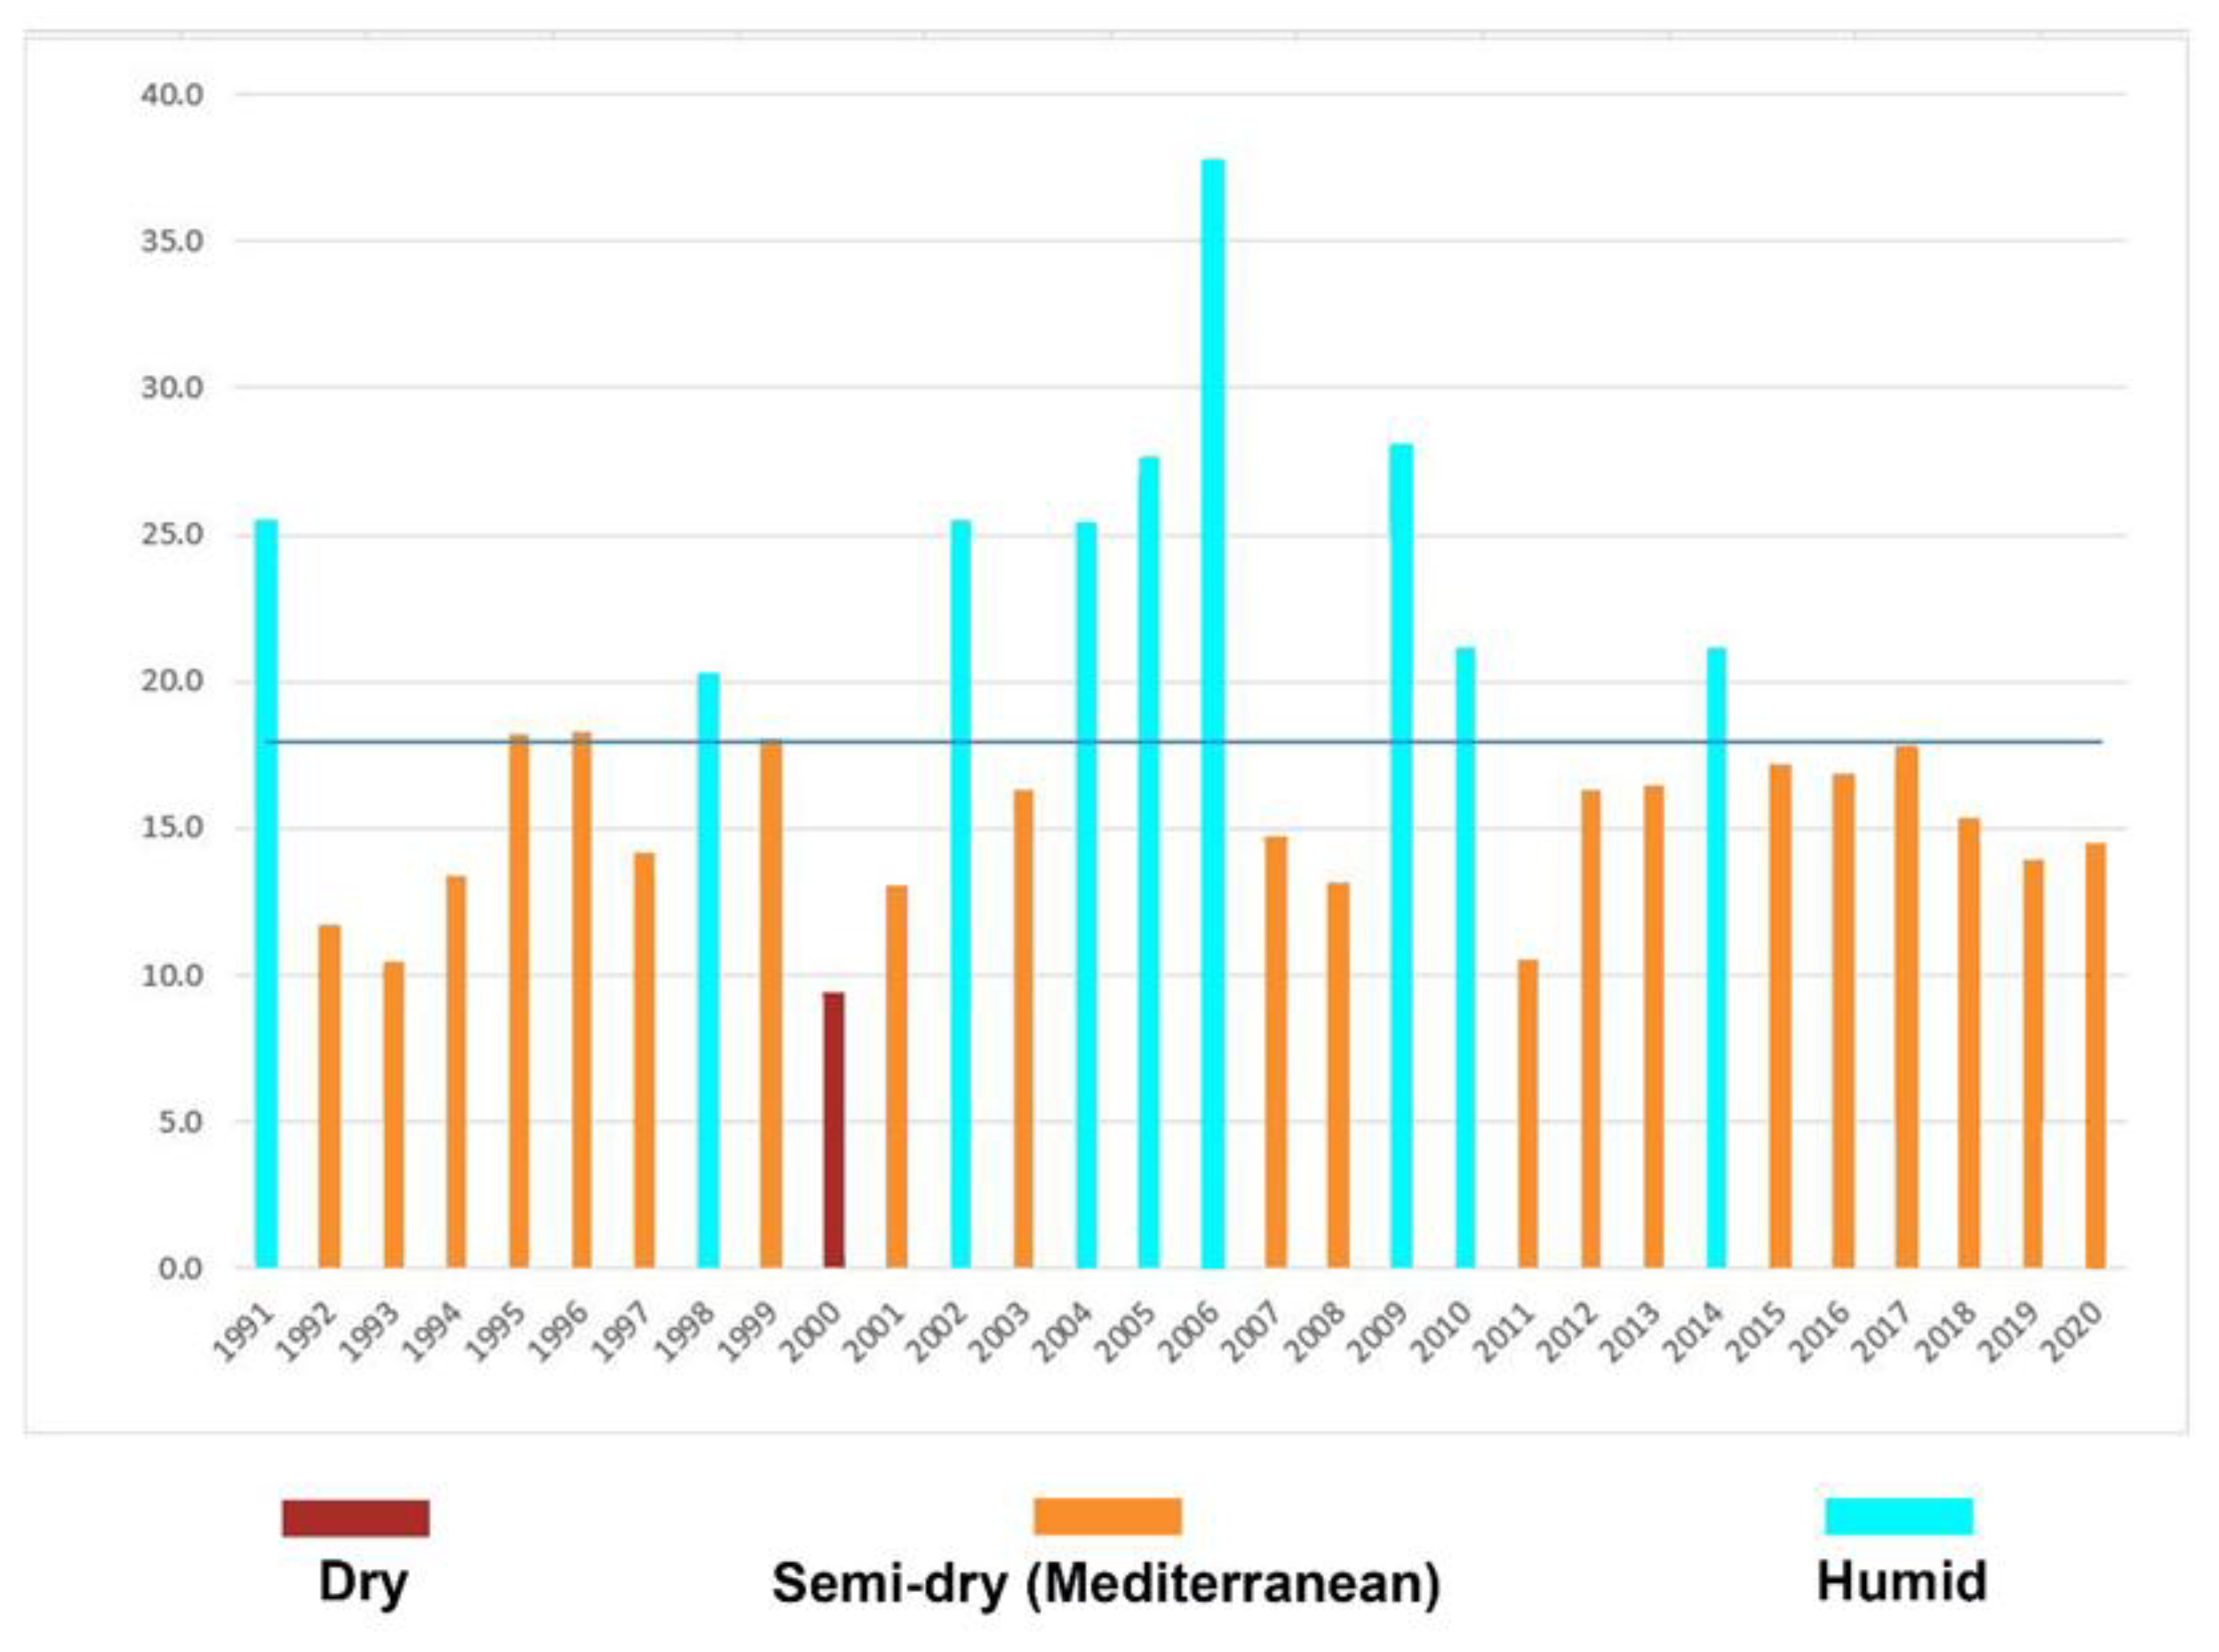
Figure 12.
Annual variation of the IP in North Macedonia (1991–2020).
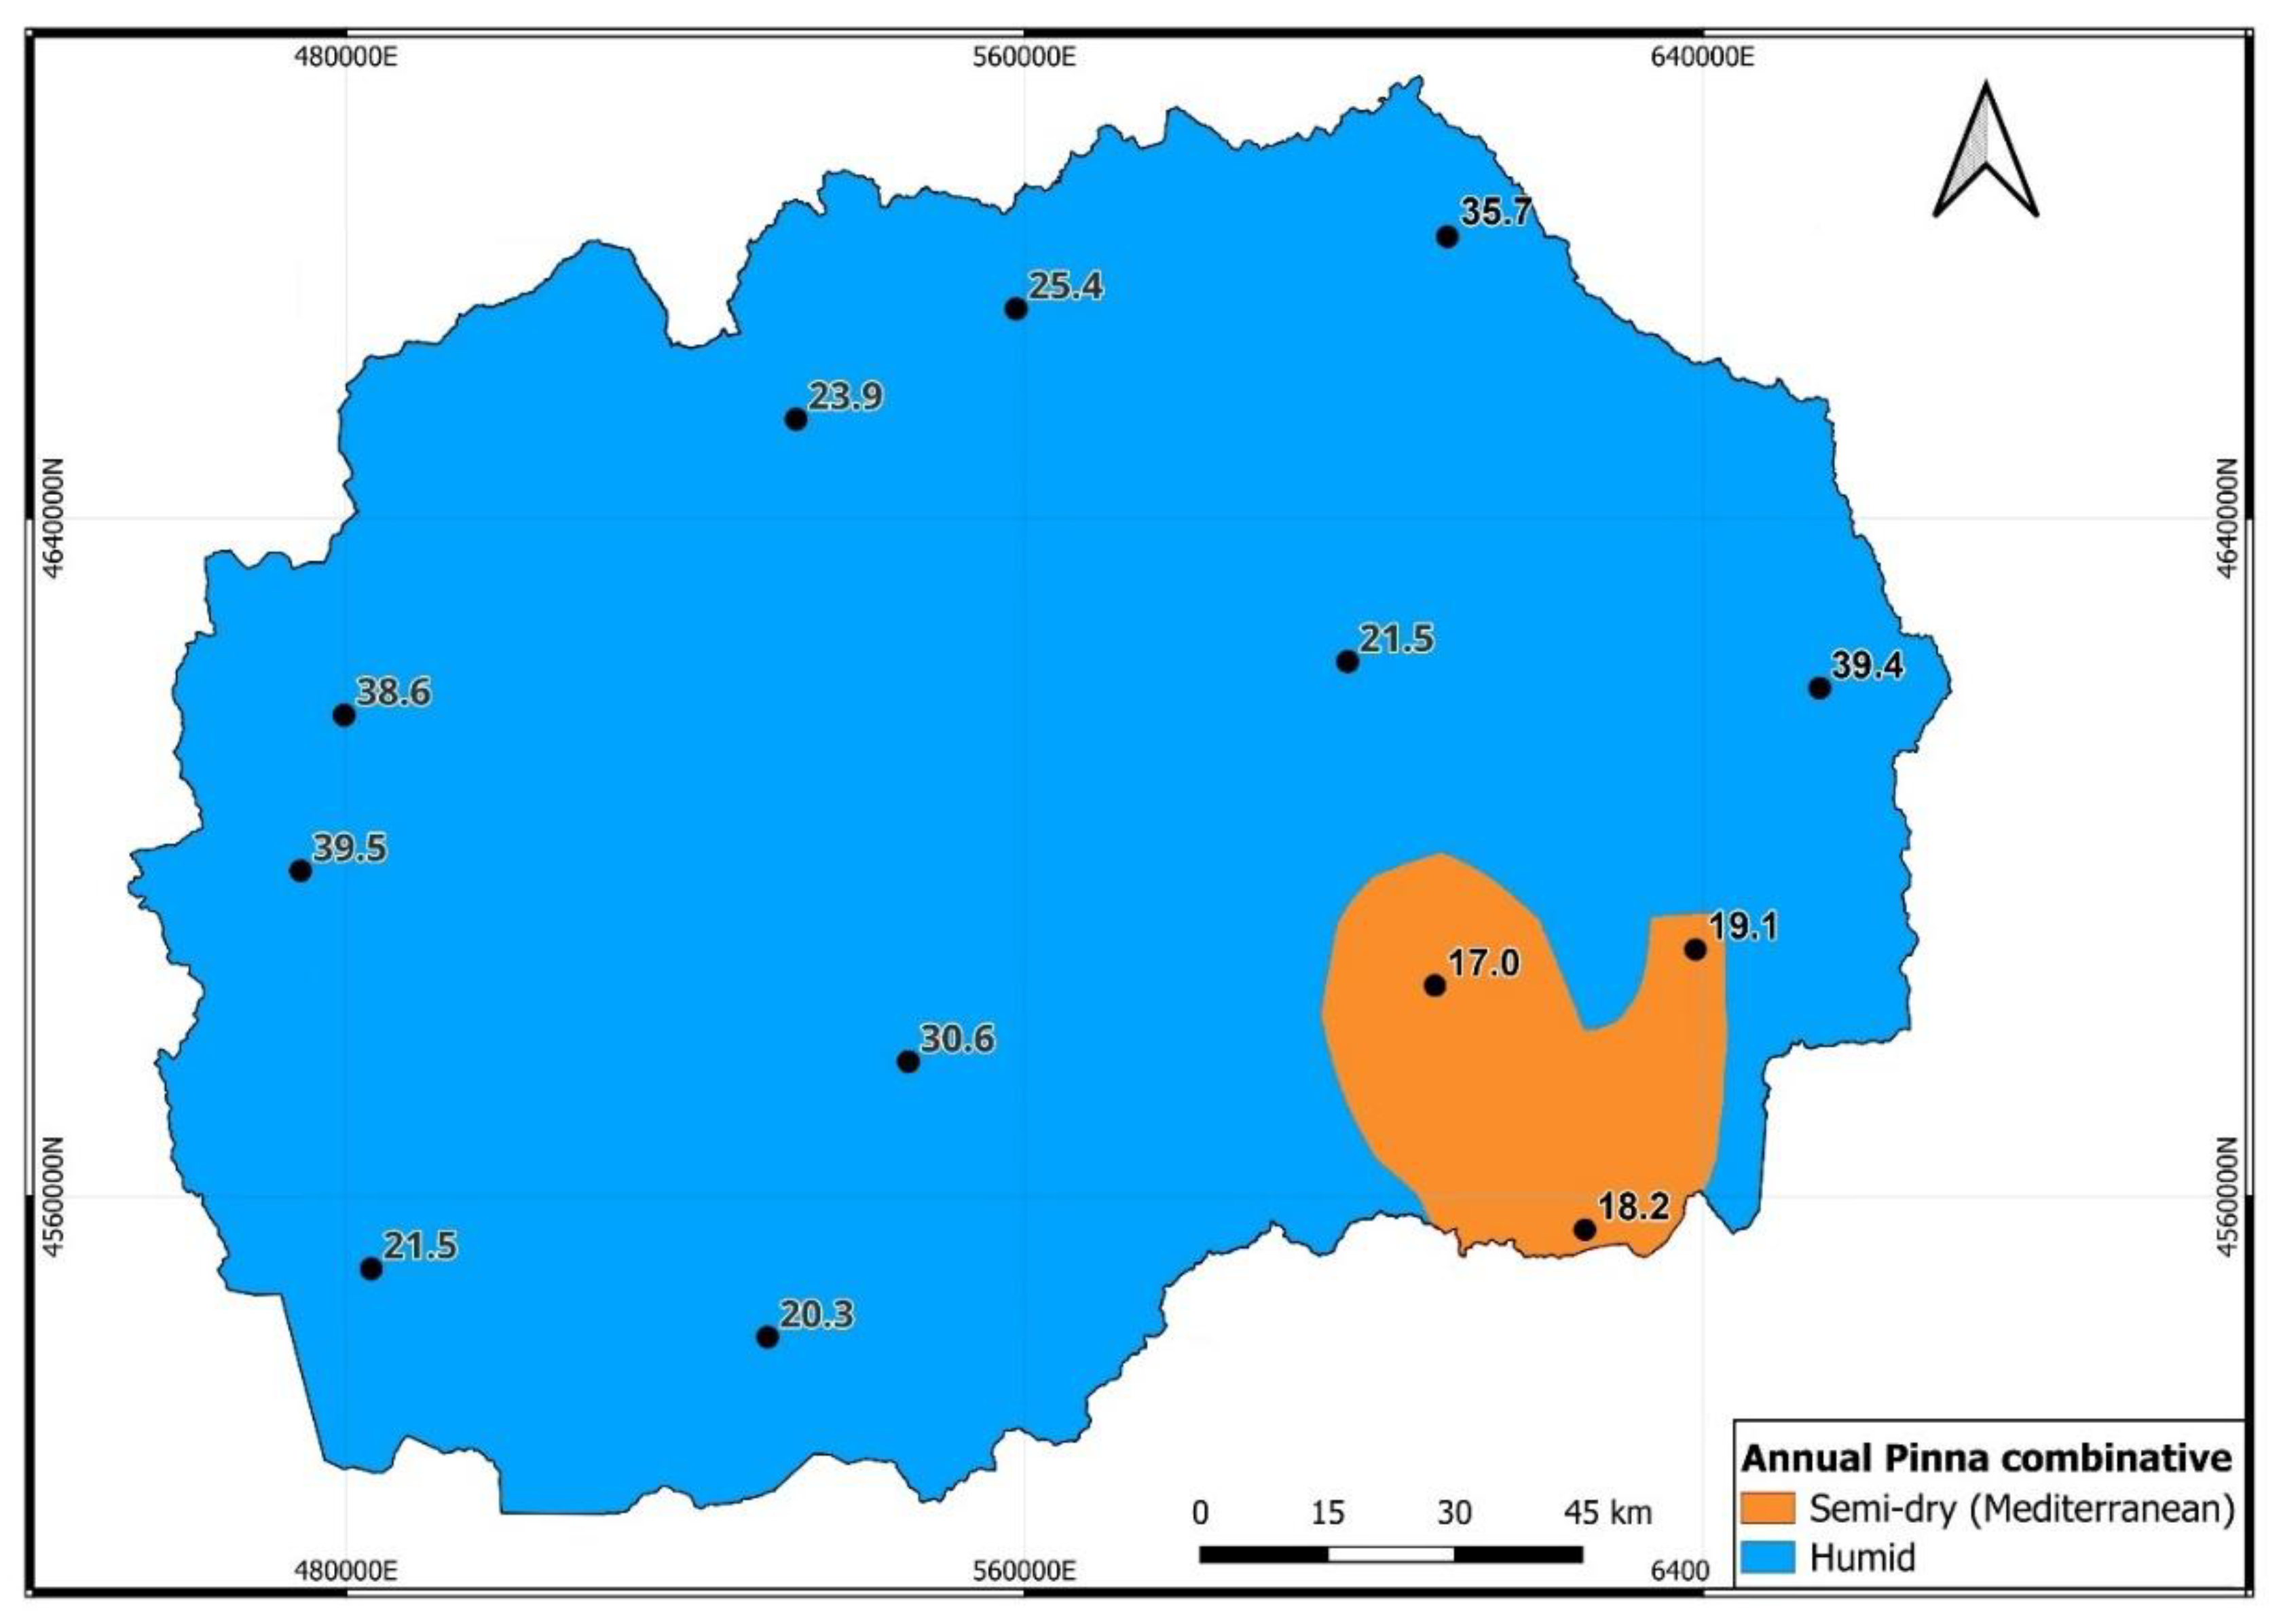
Figure 13.
The JCI (upper), IDM (middle) and IP (bellow) graph.
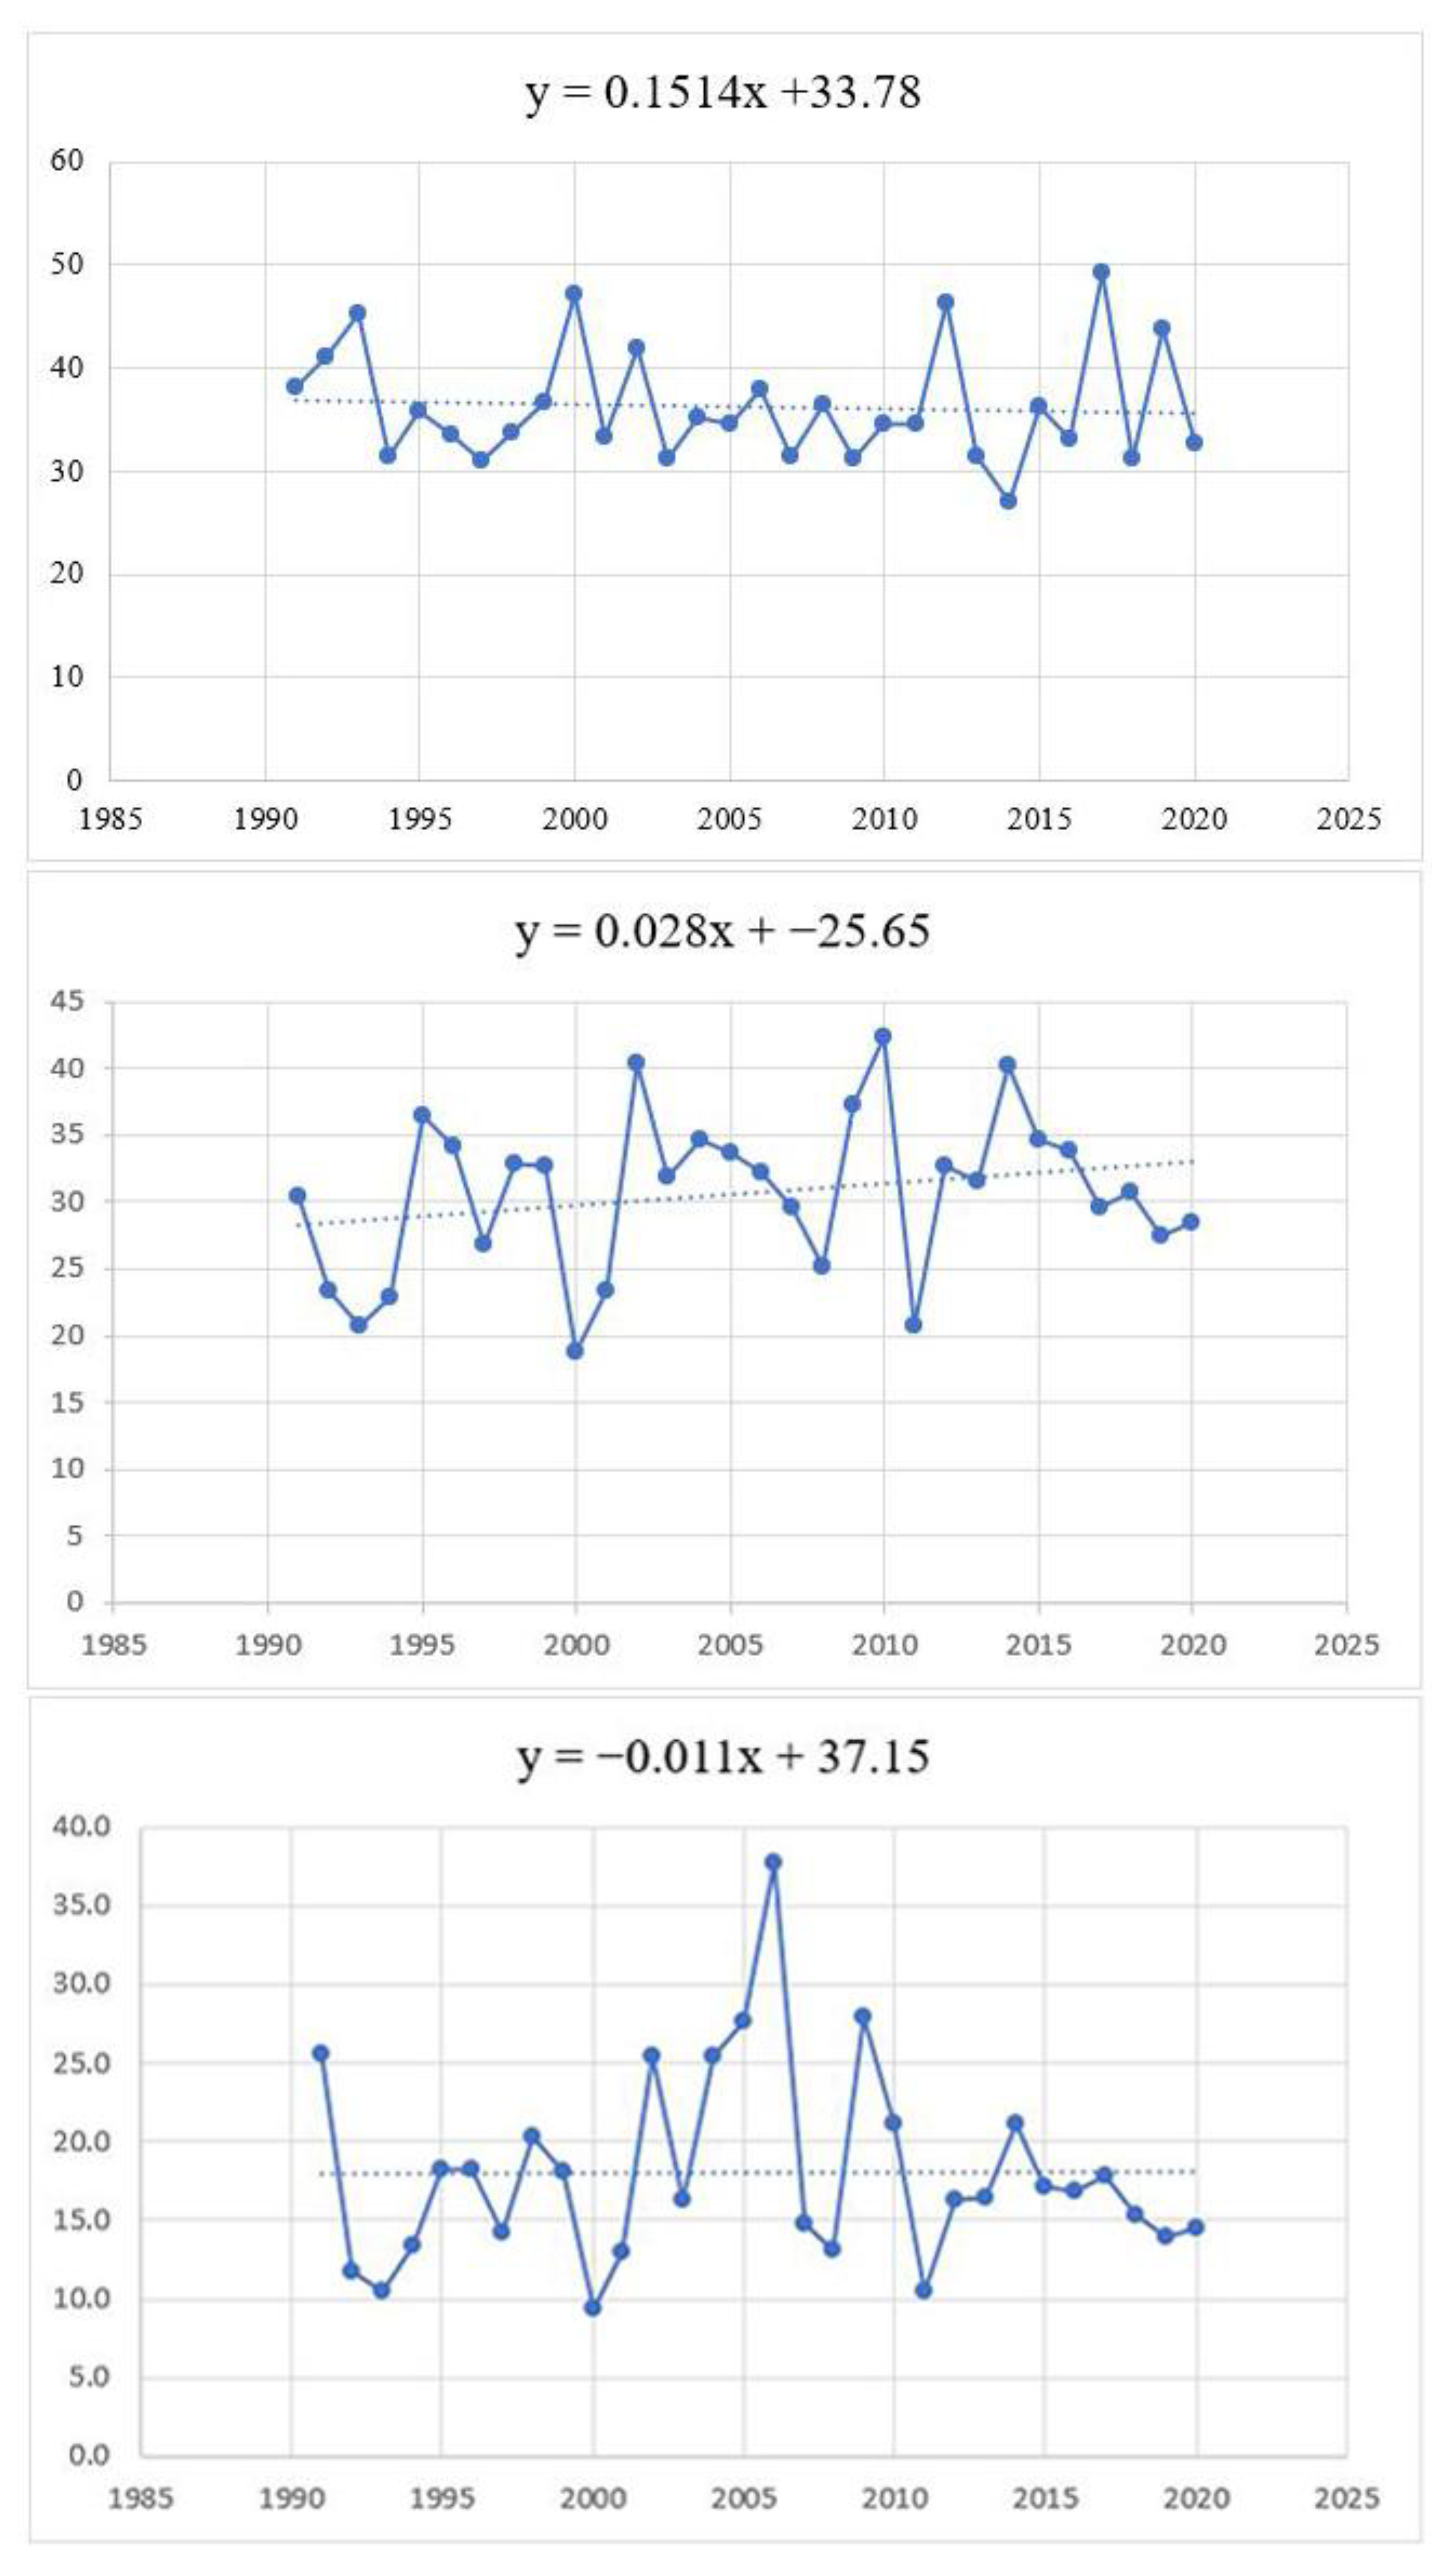
Figure 14.
Linear regression between IDM and IP for North Macedonia (1991–2020).
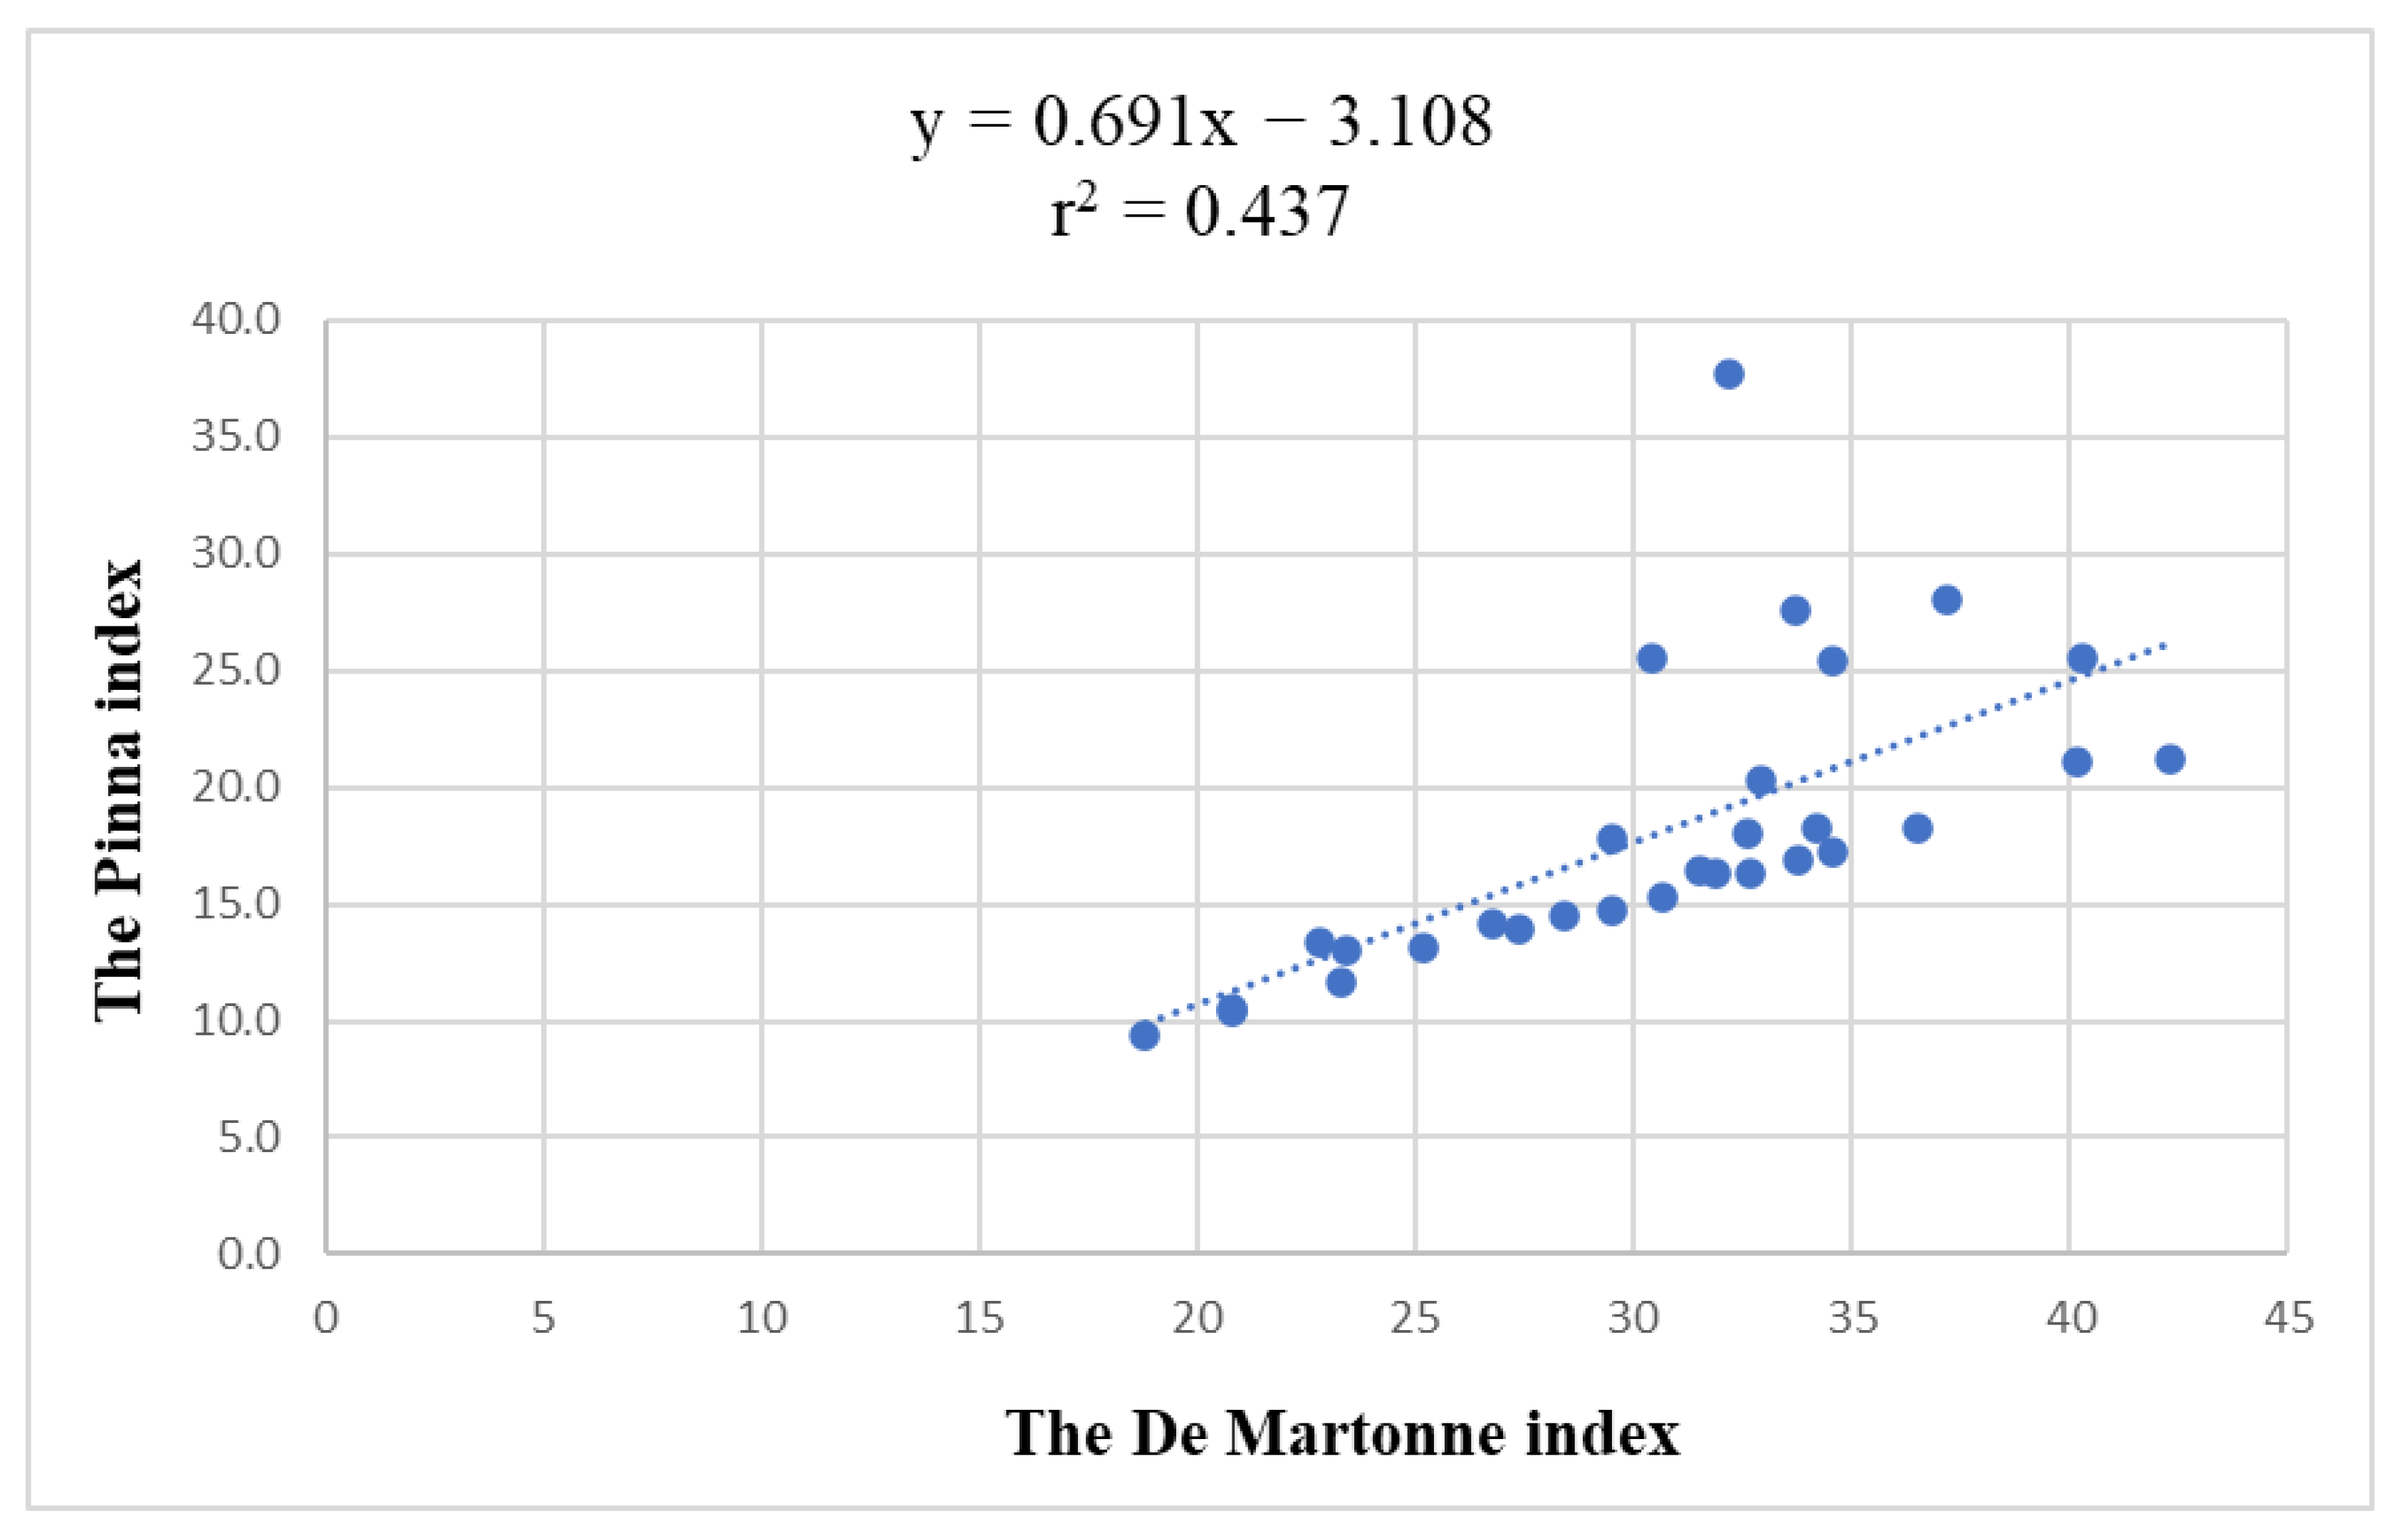

Table 1.
List of meteorological stations.
| No. | Meteorological station | Latitude | Longitude | Altitude (m) |
|---|---|---|---|---|
| 1 | Berovo | 41°43'00" | 022°50'56" | 837.0 |
| 2 | Bitola | 41°02'30" | 021°21'13" | 589.0 |
| 3 | Gevgelija | 41°08'48" | 022°30'09" | 61.0 |
| 4 | Demir Kapija | 41°24'31" | 022°17'50" | 126.0 |
| 5 | Kriva Palanka | 42°12'12" | 022°19'52" | 690.0 |
| 6 | Kumanovo | 42°07'55" | 21°42'51" | 340.0 |
| 7 | Lazaropole | 41°32'14" | 020°41'45" | 1337.0 |
| 8 | Mavrovo | 41°42'09" | 020°45'26" | 1281.0 |
| 9 | Ohrid | 41°06'53" | 020°47'50" | 758.0 |
| 10 | Prilep | 41°20'01" | 021°33'13" | 675.0 |
| 11 | Skopje | 42°00'59" | 021°23'59" | 302.0 |
| 12 | Strumica | 41°26'31" | 022°39'55" | 223.5 |
| 13 | Štip | 41°45'13" | 022°10'49" | 326.6 |
Source: UHMР – National Hydrometeorological Service of North Macedonia [61].
Table 2.
Köppen climate type.
| Köppen climate type | Description | Mean annual temp. (°C) |
|---|---|---|
| Cfa | Humid subtropical, hot summers, mild wet winters | 11–12 |
| Cfb | Temperate oceanic, moderate summers, cool winters, uniform precipitation | 10–11 |
| Dfb | Humid continental, cold winters, warm summers, pronounced seasonal contrasts | <8 |
Source: Authors modified according to [62].
Table 3.
Johansson continentality index categories by [65].
Table 3.
Johansson continentality index categories by [65].
| JCI | Climate classification |
| >20 | Marine |
| (20 – 32) | Moderate marine |
| (32–34) | Transitional |
| <34 | Continental |
Table 4.
De Martonne index climatic classification [50].
Table 4.
De Martonne index climatic classification [50].
| Climate type | Values of IDM |
|---|---|
| Arid | IDM < 10 |
| Semi-arid | 10 ≤ IDM < 20 |
| Mediterranean | 20 ≤ IDM < 24 |
| Semi-humid | 24 ≤ IDM < 28 |
| Humid | 28 ≤ IDM < 35 |
| Very-humid | 35 ≤ IDM ≤ 55 |
| Extremely humid | IDM > 55 |
Table 5.
The Pinna combinative index (Ip) classification [65].
Table 5.
The Pinna combinative index (Ip) classification [65].
| Climate type | Values of Ip |
|---|---|
| Dry | Ip < 10 |
| Semi-dry (Mediterranean) | 10 < Ip < 20 |
| Humid | Ip > 20 |
Table 6.
Climate classification according to JCI.
| Station | JCI | Climate classification |
|---|---|---|
| Berovo | 32.7 | Transitional |
| Bitola | 39.4 | Continental |
| Gevgelija | 38.2 | Continental |
| Demir Kapija | 39.7 | Continental |
| Kriva Palanka | 30.9 | Moderate marine |
| Kumanovo | 38.6 | Continental |
| Lazaropole | 27.2 | Moderate marine |
| Mavrovo | 30.1 | Moderate marine |
| Ohrid | 32.4 | Transitional |
| Prilep | 37.1 | Continental |
| Skopje | 38.8 | Continental |
| Strumica | 38.5 | Continental |
| Štip | 38.4 | Continental |
Table 7.
Seasonal De Martonne index (IsDM) for each meteorological station.
| Station | Winter IsDM | Spring IsDM | Summer IsDM | Autumn IsDM |
|---|---|---|---|---|
| Berovo | 63.8 | 37.6 | 24.0 | 53.0 |
| Bitola | 59.8 | 32.5 | 18.6 | 57.7 |
| Gevgelija | 54.9 | 30.9 | 12.3 | 50.3 |
| D. Kapija | 64.4 | 28.7 | 15.8 | 49.0 |
| K. Palanka | 60.2 | 33.2 | 21.5 | 53.8 |
| Kumanovo | 39.6 | 26.6 | 19.7 | 25.9 |
| Lazaropole | 134.0 | 65.1 | 23.4 | 70.8 |
| Mavrovo | 148.5 | 66.8 | 20.9 | 66.8 |
| Ohrid | 49.6 | 33.7 | 13.8 | 49.6 |
| Prilep | 34.3 | 25.5 | 20.0 | 26.0 |
| Skopje | 35.4 | 26.7 | 17.8 | 24.1 |
| Strumica | 46.4 | 26.0 | 17.9 | 27.2 |
| Štip | 38.7 | 24.0 | 17.9 | 23.9 |
Table 8.
Seasonal IDM per year (1991-2020).
| Year | Winter | Spring | Summer | Autumn |
|---|---|---|---|---|
| 1991 | 116.32 | 118.55 | 50.04 | 97.09 |
| 1992 | 123.50 | 112.55 | 34.84 | 105.74 |
| 1993 | 110.15 | 84.39 | 15.46 | 88.22 |
| 1994 | 65.13 | 78.67 | 27.64 | 82.51 |
| 1995 | 106.33 | 85.34 | 41.49 | 91.24 |
| 1996 | 95.66 | 102.32 | 39.52 | 88.75 |
| 1997 | 83.65 | 71.39 | 15.82 | 102.04 |
| 1998 | 93.88 | 81.04 | 16.51 | 126.98 |
| 1999 | 111.45 | 86.17 | 32.55 | 97.22 |
| 2000 | 94.75 | 70.66 | 12.57 | 80.33 |
| 2001 | 93.12 | 80.70 | 13.84 | 73.07 |
| 2002 | 109.91 | 84.51 | 23.94 | 112.92 |
| 2003 | 119.55 | 80.05 | 11.23 | 95.53 |
| 2004 | 78.83 | 77.58 | 24.59 | 100.83 |
| 2005 | 90.06 | 83.17 | 19.64 | 90.62 |
| 2006 | 87.21 | 83.61 | 23.47 | 85.29 |
| 2007 | 92.21 | 81.71 | 9.99 | 102.21 |
| 2008 | 75.45 | 78.69 | 22.56 | 93.22 |
| 2009 | 100.08 | 81.65 | 19.33 | 99.62 |
| 2010 | 95.34 | 72.19 | 12.79 | 114.73 |
| 2011 | 71.29 | 65.05 | 14.28 | 78.33 |
| 2012 | 99.70 | 80.59 | 9.61 | 100.28 |
| 2013 | 90.96 | 83.16 | 17.80 | 85.49 |
| 2014 | 80.12 | 93.88 | 29.75 | 124.93 |
| 2015 | 114.65 | 81.68 | 12.42 | 91.17 |
| 2016 | 84.45 | 80.64 | 22.84 | 79.40 |
| 2017 | 87.16 | 84.09 | 14.28 | 92.38 |
| 2018 | 106.82 | 84.60 | 20.44 | 70.21 |
| 2019 | 92.05 | 88.62 | 14.27 | 76.02 |
| 2020 | 88.94 | 84.28 | 16.63 | 76.84 |
Table 9.
Annual IsDM and climate type by station.
| Station | Annual IsDM | Climate Type |
|---|---|---|
| Berovo | 44.6 | Very-humid |
| Bitola | 42.1 | Very-humid |
| Gevgelija | 37.1 | Very-humid |
| D. Kapija | 39.4 | Very-humid |
| K. Palanka | 42.2 | Very-humid |
| Kumanovo | 27.9 | Semi-humid |
| Lazaropole | 73.3 | Extremely humid |
| Mavrovo | 75.7 | Extremely humid |
| Ohrid | 36.7 | Very-humid |
| Prilep | 26.4 | Semi-humid |
| Skopje | 26.0 | Semi-humid |
| Strumica | 29.4 | Humid |
| Štip | 26.1 | Semi-humid |
Table 10.
Annual IP and climate type by station.
| Station | Pma (mm) | Tma (°C) | P′d (mm) | T′d (°C) | Ip | Climate type |
|---|---|---|---|---|---|---|
| Berovo | 646.2 | 9.2 | 40.2 | 0.7 | 39.4 | Humid |
| Bitola | 625.3 | 11.9 | 32.9 | 22.7 | 20.3 | Humid |
| Gevgelija | 711.8 | 15.5 | 25.8 | 26.7 | 18.2 | Semi-dry (Mediter.) |
| D. Kapija | 575.4 | 14.3 | 30.8 | 25.9 | 17.0 | Semi-dry (Mediter.) |
| K. Palanka | 661.1 | 10.7 | 39.4 | 2.0 | 35.7 | Humid |
| Kumanovo | 534.8 | 12.7 | 30.1 | 3.3 | 25.4 | Humid |
| Lazaropole | 1058.5 | 7.6 | 42.2 | -0.7 | 39.5 | Humid |
| Mavrovo | 1046.0 | 7.6 | 40.8 | -1.1 | 38.6 | Humid |
| Ohrid | 710.9 | 11.8 | 27.5 | 3.4 | 21.5 | Humid |
| Prilep | 531.5 | 11.9 | 32.0 | 2.0 | 30.6 | Humid |
| Skopje | 502.4 | 13.2 | 34.1 | 1.1 | 23.9 | Humid |
| Strumica | 594.6 | 13.4 | 36.5 | 2.9 | 19.1 | Semi-dry (Mediter.) |
| Štip | 472.1 | 13.5 | 27.2 | 3.1 | 21.5 | Humid |
Table 11.
Statistical summary of Johansson Continentality Index (JCI), De Martonne aridity index (IDM), and Pinna index (Ip) based on Mann–Kendall statistics, and the magnitude of trends (β) calculated by Sen’s slope estimator.
Table 11.
Statistical summary of Johansson Continentality Index (JCI), De Martonne aridity index (IDM), and Pinna index (Ip) based on Mann–Kendall statistics, and the magnitude of trends (β) calculated by Sen’s slope estimator.
| Station | Elevation (m a.s.l.) | Index | ZMK | Annual Mean | Sen's Slope β (units/yr) | Trend significance (α=0.05) |
|---|---|---|---|---|---|---|
| Mavrovo | 1250 | JCI | 0.52 | 30.1 | 0.007 | No |
| IDM | -0.21 | 71.6 | -0.015 | No | ||
| IP | -0.14 | 28.4 | -0.010 | No | ||
| Lazaropole | 1330 | JCI | 0.15 | 27.2 | 0.004 | No |
| IDM | 0.09 | 72.9 | 0.008 | No | ||
| IP | 0.18 | 29.1 | 0.012 | No | ||
| Berovo | 837 | JCI | -0.08 | 32.7 | -0.002 | No |
| IDM | 0.32 | 35.2 | 0.022 | No | ||
| IP | 0.27 | 24.8 | 0.018 | No | ||
| Bitola | 688 | JCI | -0.62 | 39.4 | -0.008 | No |
| IDM | -0.44 | 32.1 | -0.030 | No | ||
| IP | -0.36 | 23.5 | -0.025 | No | ||
| Gevgelija | 61 | JCI | -0.85 | 38.2 | -0.012 | No |
| IDM | -0.62 | 24.8 | -0.040 | No | ||
| IP | -0.53 | 19.2 | -0.035 | No | ||
| D. Kapija | 165 | JCI | -0.98 | 39.7 | -0.015 | No |
| IDM | -0.75 | 23.4 | -0.048 | No | ||
| IP | -0.68 | 18.1 | -0.042 | No | ||
| K. Palanka | 485 | JCI | 0.28 | 30.9 | 0.005 | No |
| IDM | 0.14 | 34.7 | 0.010 | No | ||
| IP | 0.21 | 24.3 | 0.015 | No | ||
| Kumanovo | 324 | JCI | -0.45 | 38.6 | -0.006 | No |
| IDM | -0.32 | 30.5 | -0.022 | No | ||
| IP | -0.27 | 22.1 | -0.018 | No | ||
| Ohrid | 695 | JCI | 0.22 | 32.4 | 0.003 | No |
| IDM | 0.39 | 36.8 | 0.028 | No | ||
| IP | 0.36 | 25.6 | 0.025 | No | ||
| Prilep | 625 | JCI | -0.12 | 37.2 | -0.001 | No |
| IDM | -0.18 | 33.4 | -0.012 | No | ||
| IP | -0.09 | 23.9 | -0.008 | No | ||
| Skopje | 247 | JCI | -1.41 | 38.8 | -0.009 | No |
| IDM | -0.50 | 22.3 | -0.035 | No | ||
| IP | -0.39 | 18.7 | -0.030 | No | ||
| Strumica | 268 | JCI | -0.75 | 38.5 | -0.010 | No |
| IDM | -0.57 | 28.6 | -0.038 | No | ||
| IP | -0.50 | 21.4 | -0.032 | No | ||
| Štip | 300 | JCI | -0.68 | 38.4 | -0.011 | No |
| IDM | -0.98 | 22.2 | -0.065 | No | ||
| IP | -0.85 | 18.2 | -0.055 | No |
Table 12.
Seasonal and annual correlation coefficients between the IDM and the North Atlantic Oscillation Index (NAOI) and Southern Oscillation Index (SOI).
Table 12.
Seasonal and annual correlation coefficients between the IDM and the North Atlantic Oscillation Index (NAOI) and Southern Oscillation Index (SOI).
| Index | Winter | Spring | Summer | Autumn | Year |
|---|---|---|---|---|---|
| NAOI | -0.31 | -0.18 | 0.45 | -0.14 | -0.16 |
| SOI | 0.13 | -0.05 | 0.03 | 0.19 | 0.14 |
Disclaimer/Publisher’s Note: The statements, opinions and data contained in all publications are solely those of the individual author(s) and contributor(s) and not of MDPI and/or the editor(s). MDPI and/or the editor(s) disclaim responsibility for any injury to people or property resulting from any ideas, methods, instructions or products referred to in the content. |
© 2026 by the authors. Licensee MDPI, Basel, Switzerland. This article is an open access article distributed under the terms and conditions of the Creative Commons Attribution (CC BY) license (http://creativecommons.org/licenses/by/4.0/).
Copyright: This open access article is published under a Creative Commons CC BY 4.0 license, which permit the free download, distribution, and reuse, provided that the author and preprint are cited in any reuse.


