
Submitted:
19 October 2023
Posted:
20 October 2023
You are already at the latest version
Abstract
Ethiopia has been known for its recurrent droughts and poverty due to extreme climate change and variability affecting agricultural production. This study was, therefore, conducted to analyze the seasonal and inter-annual variability in rainfall and temperature v over the past three decades in western Tigray. The study consisted of 34 years of temperature and rainfall data from nine stations in two administrative zones in the western part of Tigray. The climate data was obtained from the National Aeronautic Space Administration (NASA) from 1983 to 2016. Total rainfall, simple daily intensity index, Rx1day and Rx5day, and maximum and minimum temperature, tropical nights, diurnal temperature range, cold spell and warm spell duration indicator values, cold days and cold nights, warm days, and warm nights were analyzed. RClimDex software was employed to analyze the trends and quality control of the extreme rainfall and temperature indices; in addition, the Mann-Kendall test was also used to detect the changes and variability of the variables. The trend analysis showed that there was significant (p<0.05) variability in extreme temperatures, with maximum and minimum temperatures varying from 0.04 to 0.051 0C, and 0.022 to 0.031 0C, respectively. The results also revealed that there was a negative trend in extreme rainfall, with no uniform pattern. The highest and smallest reduction in the annual rainfall was 14.6 mm and 8.4 mm, which were observed at Maygaba and Adigoshu, respectively. More than 60% of the total rainfall was received in July and August throughout the study areas, with the maximum monthly rainfall of 294.2 mm observed at Adiremets. Finally, this study demonstrated that areas in the northwestern and western zones of Tigray were significantly affected by extreme rainfall and temperature variability, which subsequently affected crop yield, natural resources, food security, and the livelihood of the community during the last three decades.
Keywords:
Rainfall
; Mann-Kendall test
; Temperature
; Spatial interpolation
; Temporal variability
; Tigray
1. Introduction
Globally, climate change has been causing significant warming through changes and variability in rainfall and temperature [1,2], and recent studies revealed that Africa is also experiencing extreme warming due to changes in extreme temperature variables [3,4,5,6]. Therefore, Africa is one of the most vulnerable continents to climate change due to its high exposure and low adaptive capacity [7] particularly the Sub-Saharan African countries [8,9,10]. The East African countries faced extreme warming, with an increasing trend in maximum and minimum temperatures varying between 1.9 and 1.2 0C, respectively from 1979 to 2010 [8].
Nowadays, global warming increases with temperatures varying from 1.5 and 2 0C, and this will expose a higher number of people to poverty in Africa and Asia, having a considerable negative impact on crop production like maize, wheat, and rice in Sub-Saharan Africa, Southeast Asia, and Central and South America [11]. In line with this, East Africa has been described as a region frequently prone to frequent droughts and poverty, which might be associated with climate change and variability as a result of poor management of natural resources, resettlements, and changing natural forests to grazing and cropping lands [9].
Sub-Saharan African countries, including Ethiopia, showed an increasing tendency in extreme temperature and rainfall indices [12,13,14,15]. The long-term climate changes and variability in temperature and rainfall are most likely increasing recurrent droughts in many parts of Ethiopia [16].
Recent studies indicated that there was extreme temperature and rainfall variability in different parts of Ethiopia [16,17,18,19,20,21]; affecting crop production [1,22] and food security [23,24]. The country's heavy dependency on rain-fed and subsistence agriculture aggravates its vulnerability to the adverse effects of these changes [25].
It has been traced that there was a high annual rainfall and temperature variability over the past 30 years in the Tigray region [20], with a coefficient of variation (CV) for precipitation varying from 33.7 to 233% [26]; on the other hand, high rainfall variability was experienced in different parts of Tigray from 1980 to 2009 [27]. High rainfall variability, prolonged dry spells, and short growing periods have negative impacts on the growth and yield of crops [16,22]. Similarly, climate change has also been negatively affecting agricultural productivity and food security in the World and will also severely affect the sector, especially in developing countries with growing economies, towards 2050 unless climate adaptation measures are undertaken [28]. It has also been stated that that climate change is affecting food security and nutirtion and posing direct and indirect impacts on agricultural production and crop yield [29].
There is high vulnerability to climate change and variabilty in different parts of Tigray, which has subsequently affected social and economic developments in different areas of the region [30]. It has also been stated that there is considerable temperature variability in the western part of Tigray, with temperatures varying from 0.5 to 1.65 0C, and slight changes in rainfall from 1980 to 2010, affecting the production of cotton in the area [31], and yield of sesame was also highly affected by climate change and variability in western part of Tigray, where the crop is cultivated as a major cash crop [32].
Even though annual temperature and rainfall variability and trend analysis were analyzed and reported by different scholars in the Tigray region [19,20,20,27], and it is also commendable to analyze seasonal and intra-annual changes and variability in rainfall and temperature variables. Characterization of the seasonal and inter-annual climatic variables in the context of a changing climate in semiarid areas is very important to assess climate-induced changes and adaptation strategies for agricultural practices [16]. This study was therefore conducted to analyze the temporal and spatial variability in extreme rainfall and temperature variables in the semi-arid areas of western Tigray using long-term climate data.
2. Materials and Methods
The The current study was conducted in the semiarid areas of the northwestern and western zones of Tigray. The study area consisted of nine observation stations: Maytsebri, Dedebit, Adigoshu, Adiremets, Badme, Dansha, Humera, Maygaba, and Sheraro (Figure 1). The study area lies between 13037’ North latitudes and 36037’ East longitudes at Humera, 14043’ North latitudes, and 3704’ East longitudes at Badme, and 13035’ North latitudes and 38043’ East longitudes at Maytsebri. The study areas have varying altitudinal setups, ranging from 600 meters above sea level at Humera to 2014 meters above sea level at Adiremets.
Based on the annual rainfall distribution, the study area is characterized by a uni-modal rainfall pattern, which is a typical characteristic of the northern part of Ethiopia. The mean annual rainfall across the stations ranges from 626 mm to 960 mm per year, and the average maximum and minimum temperatures vary from 30 to 34 0C, and 18 to 23 0C, respectively [33]. Mixed crop-livestock agriculture is the dominant agricultural practice in the study area, where crop production is mainly rain-fed-based production systems coupled with livestock production, where cattle and goats are the mainstays of livelihoods. of livelihoods.
As it was difficult to obtain long-term observed historical climate data from the National Meteorological Agency of Ethiopia for all nine stations in the study area (Table 1), we used satellite-derived climate data obtained from the National Aeronautic Space Administration (NASA) [http://power.larc.nasa.gov/common/AgroclimatologyMethodology/]. It has been recommended that climate data obtained from the NASA database can be used for climate change and variability [34,35] The procedures for archiving and data accuracy of the climate data at 10 latitude and 10 longitude spatial resolutions can be found in the Agro-climatology Archive [36].
Data Quality Control
Before the start of the analysis, the daily time series on daily rainfall and temperature of each station were inspected and detected for outliers and missing data to avoid erroneous data that can cause changes in the seasonal cycle or variance of the data [13,37].
For further quality control of the data, the procedure in RClimDex 1.10 software was applied [38]. RClimDex was developed by the Expert Team on Climate Change Detection Monitoring and Indices (ETCCDMI) at the Climate Research Branch of the Meteorological Service of Canada. Daily rainfall amounts less than zero were removed, and both daily maximum and minimum temperatures were set to a missing value if the daily maximum temperature was less than the respective daily minimum temperature. Outliers in daily maximum and minimum temperatures were also assessed as values outside of four standard deviations of the climatological mean of the value for the day [38].
Outliers are values that are outside of a region defined by the user, which is the mean plus or minus n times the standard deviation of the value for the day (mean-n*Std, or mean+n*Std). Standard deviation (Std) represents the standard deviation of the day and n is an input value selected by the user, and mean is the computed value from the climate data of the day [38]. Therefore, the number of standard deviations was set to four, as the software identifies the values that lie outside four standard deviations of the mean of the time series.
Trend Analysis
The Mann-Kendal (MK) trend test was applied to detect the changes and variability of selected temperature and rainfall variables (Table 2). The Mk test is a non-parametric test with no requirement for the data to be normal [39]. The MK test was widely applied in various trend detection studies [1,13,16]. The MK statistic (S) measures the time series trend of the different temperature and rainfall extreme indices. The MK test statistic, S is calculated, [39] while the magnitude of the trend was calculated using the Sen’s slope estimator. The application of the trend test is done to a time series Xi that is ranked from i = 1, 2 … n-1, and Xj, which is ranked from j = i + 1, 2 …. n. Each of the data points Xi is taken as a reference point which is compared with the rest of the data point's Xj [16.
Where Xj and Xi are sequential data values for the time series data of length n. The Sgn series is defined as:
Where Xi and Xj are the annual values in years i and j (j > i) respectively, sign (Xj-Xi) is equal to +1, 0 or -1, and assign the integer 1, 0 or -1 to positive difference, no difference, and negative differences, respectively.
The Z statistic (Equation 4) is also another important parameter to measure significance of the trend for each parameter. When the number of observations is more than 10 (n > 10), the statistic, S is assumed to be normally distributed with the mean and E(S) becomes 0 [40]. In this case, the variance statistic (variance of S) can be computed in Equation 3:
Where N is the number of observations, m is the number of tied groups in the data set and ti are the ties of the sample time series; ∑ti denotes the summation over all ties and is only used if the data series contains tied values.
On the other hand, where Z (Equation 4) follows a normal distribution, a positive Z and a negative Z depict an upward and downward trend for the period, respectively [16]. For n larger than 10, ZMK approximates the standard normal distribution [41,42] and hence, the standard normal variate ZMK is calculated by:
In a two-sided test for trend, the null hypothesis Ho should be accepted if at a given level of significance. Z1-α/2 is the critical value of ZMK from the standard normal table. For instance, for 5% significance level, the value of Z1-α/2 is 1.96 [33].
If there is a linear trend in a time series, then both the slope (i.e. the linear rate of change) and the intercept can be computed using Sen's Slope estimation test [43]. Therefore, the present study’s magnitude of the slope of the trends from temperature and rainfall extremes was calculated using the following formulas [3,16,33].
Where xj and xi are data values at times tj and tk (j>k) respectively. The median of these N values of βmed is a Sen's estimator of slope. If N is odd Sen’s estimator is computed using equation 6, and using equation 7 if N is even.
Spatial Interpolation of Extreme Temperature and Rainfall Indices
3. Results
3.1. Extreme Temperature Variability
In this study, maximum temperature, monthly minimum temperature, number of cool nights and cool days, number of warm nights, and warm days, warm spell duration indicator, cold spell duration indicator, and tropical nights are presented in Table 1 and Table 2. Summary of the results from the trend analysis on the extreme temperature indices in the study area are presented in Table 3 and Table 4; and the results on maximum and minimum temperature are presented separately in Table 4.
- Tropical Nights (TR20)
The results on TR20 showed that there was a positive trend throughout the study area; varying from 0.58 days at Adigoshu to 2.14 night days at Badime (Table 2). The smallest changes on TR20 were recorded at Adigoshu, and Maygaba with 0.58, and 0.99 nights, respectively; which indicated that TR20 was increasing from 0.58 to approximately 1.0 day per year from 1983 to 2016. However, there was extreme warming at Adiremets, Badime, Dansha, Dedebit, Humera, Maytsebri, and Sheraro, where TR20 was linearly increasing from 1.69 to 2.14 days per year, due to the rising temperature beyond 20 0C (Figure 2).
- 2.
- Trends on the Minimum (Tmin) and Maximum (Tmin) Temperatures
The trends on the Tmax and Tmin temperatures (Table 4) indicated that there was a highly significant positive trend (p<0.01) in the majority of the study areas from 1983-2016. The Tmax varied from 0.04 to 0.051 0C per year from 1983 to 2016 across the stations. Similarly, the Tmin also showed a significant variability from 0.022 to 0.031 0C per year in the same time span.
On the other hand, an increase in the Tmax of the study sites (Figure 3) was observed in May with a Tmax of 42 0C obtained at Humera; whereas, the highest value of Tmin was observed in August with 25.920C at Maygaba. Similarly, the results on the Tmin showed that the coolest month was January in the majority of the study areas, except in Maygaba where December was the coolest month with the smallest change of 15.70 0C of the minimum temperature. The changes in the Tmax and Tmin revealed that the months April to May, and December to January were found the hottest and coolest months throughout the study areas, respectively.
- 3.
- Diurnal temperature range (DTR)
The results on the DTR showed that there was a positive trend across all stations from 1983 to 2016 (Table 2 and Figure 5). The trend analysis revealed that there was a significant (p<0.05) positive trend at Humera, Adiremets, and Dansha. The annual DTR variability at Adiremets and Badime varied from 11.86 to 14.240C, and 11.8 and 13.50C, respectively from 1983 to 2016. On the other hand, the highest inter-annual TDR variability was higher during November, December, January, February, March, and April varying from 13 to 18.36 0C; whereas, the smallest DTR variability was observed in July and August ranging from 6.250C to 10.50C; with intermediate changes in May, June, September, October, and November (Figure 4).
- 4.
- Warm spell (WSDI) and cold spell duration indicator (CSDI)
The linear trends on WSDI revealed that there was a positive trend throughout the study areas from 1983 to 2016. The highest increase in the WSDI was recorded 3.16 days per year in the last 34 years; whereas, the smallest increase in WSDI of 0.53 days was recorded at SHeraro during the time course. Maytsebri and Dedebit also experienced a similar increase in WSDI of 2.39 days per year; and WSDI values at Adiremets, Adigoshu, Dansha, and Badime were 2.18, 1.53, 2.23, and 2.10 days per year, respectively (Table 2). The results of the trend analysis indicate that there was a consistent increase in WSDI throughout the study areas from 2002 to 2005, with the maximum increase in WSDI of 208 days observed at Humera; whereas, the WSDI was null revealing that there was no change in WSDI throughout the study areas from1985 to 1987, except at Humera with WSDI of 19 days recorded in 1987 (Figure 6).
Conversely, the trend analysis in CSDI showed (Figure 7) that there was a negative trend throughout the study areas, except at Adigoshu, where a positive trend was observed. The changes in CSDI values varied from -0.25 days at Adiremets, and Maygaba to -0.60 days at Sheraro. However, CSDI at Adigoshu was positively increasing with 0.013 days per year; which is similar to 0.13 days per decade. The changes in CSDI at Maytsebri, and Dedebit were similar with -0.36 days; and CSDI at Humera, and Badime were decreasing by -0.32, and -0.41 days, respectively.
The results on CSDI showed that the maximum decrease in CSDI observed at Badime with 60 days was observed in 1987. The highest CSDI values observed from 1983 to 2016 at Adiremets, Humera, Maygaba, and Maytsebri were observed in 1986 with 47, 43, 42, and 54 days, respectively. The maximum CSDI values of 30 days at Sheraro, and 27 days at Adiremets were observed in 1986, and 1988, and 1992, respectively.
- 5.
- Cold days (TX10p) and cold nights (TN10p)
The results on the TX10p, and TN10p (Table 2) showed a negative linear trend across all stations. The highest, and smallest TN10p values of 0.44 and 0.29 days per year, were observed at Sheraro, and Adigoshu, respectively. Similarly, the TN10p at Dedebit, Humera, and Maytsebri was 0.38 days per year. On the other hand, the annual TX10p showed a negative trend, which was linearly decreasing from -0.23 at Adigoshu to -0.46 days per year at Maygaba, and Maytsebri. Likewise, the results revealed that the TX10p at Badime, Humera, and Dansha were varying from -0.32 days per year at Sheraro to -0.39 days per year at Dansha.
Except at Adigoshu, and Sheraro, the highest number of cold days per month occurred during March, and August. The highest and smallest number of TX10P was observed at Humera with 28.27 days per year in January and 3.24 days per year in September, respectively. The smallest number of cold days was observed in April and September throughout the study areas, except at Adigoshu and Sheraro. The highest number of cold days 15.5 days at Adigoshu, were observed in January, whereas, the smallest number of cold days 5.4 days were observed in September (Figure 8).
- 6.
- Warm days (TX90p) and warm nights (TN90p)
The results on the TX90p and TN90p (Table 2) showed that there was a positive trend throughout the study area. The TX90p was increased between 0.38 days at Sheraro to 0.71days at Humera. TX90P was increasing by 0.43 days at Adigoshu; and 0.65 days at Dedebit and Dansha. There was also an increasing trend on TX90P at Adiremets, Badme, Maygaba, and Maytsebri with 0.64, 0.57, 0.61, and 0.59 days per year, respectively.
On the other hand, there was also a positive trend in TN90p; which was significantly (p<0.05) increasing across all stations. The highest increase in TN90p was observed at Humera with 0.62 days per year, and the smallest TN90p values were 0.31 and 0.33 days per year were observed at Sheraro, and Adigoshu stations, respectively. The changes and variability on TN90p across the stations were relatively similar during January and March. Except at Maygaba and Sheraro, the highest changes occurred during July, September, and October with the highest values 60.53 and of 61.20 days observed at Dansha, and Humera, respectively. The inter-annual variability on TN90p (Figure 9) revealed that there was comparatively consistent warming at Maygaba, and Sheraro from 1983 to 2016; with the smallest change of 9.2 days per annum occurring in February at Maygaba followed by 9.46 days at Sheraro.
In addition, the spatial interpolation for extreme temperature indices (Figure 10) also revealed that there was a high spatial variability across the study areas. The highest spatial variability on Tmax was observed in areas around Humera, and Dansha; whereas, areas around Adigoshu, and Sheraro experienced the smallest variability from 1983-2016. Areas around Badime, and some parts around Sheraro, Dedebit, Maytsebri, and Maygaba experienced a moderate change in Tmax. On the other hand, the smallest Tmin variability was observed in areas around Adigoshu with an increasing trend of 0.022 0C per year from 1983-2016; and the highest Tmin variability was observed in areas around Badime with Tmin rising by 0.03 0C per year. There was also a relatively lower variability in Tmin in areas around Humera, Dansha, Adiremets, and some parts around Maygaba. Besides, areas around Dedebit, Maygaba, and Maytsebri experienced a relatively moderate change and variability in Tmin during the last three decades.
The results also showed that there was a significant variability on warm days and warm nights across the study areas from 1983 to 2016. Warm days and warm days were apparently smaller in areas around Adigoshu and Sheraro when compared with areas around Humera, Dansha, Adiremets, Dedebit, Maygaba, and Maytsebri; where there was an increasing trend in warm days and warm days; with 0.7 and 0.61 days per year. The spatial interpolation on WSDI and CSDI was considerably increased in the majority of the study areas, except in areas around Adigoshu where there was a relatively mild variability in WSDI, and CSDI since the last three decades. The highest rise in a WSDI value of 3.15 days was observed in areas around Humera, whereas, the smallest WSDI of 0.53 days per year was observed in areas around Adigoshu.
Annual and Inter-Annual Rainfall Variability
The results on the extreme rainfall indices showed that there was significant variability over the past three decades in the western part of Tigray. The trend analysis revealed that there was a negative trend in majority of the stations from 1983 to 2016. The summary for PRCPTOT, SDII, Rx1day, and Rx5day are presented in Table 5.
- Total rainfall (mm)
The results on the total rainfall revealed that there was a negative trend across the study area (Table 5), with no uniform pattern. There was no significant (p>0.05) variability in total rainfall at Adigoshu, Badme, and Sheraro; whereas, total rainfall showed significant (p<0.05) variability at Adiremets, Dansha, Dedebit, Humera, Maygaba, and Maytsebri since 1983-2016. Total rainfall at Maytsebri, Maygaba, Humera, Dedebit, and Dansha significantly (p<0.05) decreased by 10.9, 14.6, 15.3, 10.9, 15.3, and 16.5 mm per year. Whereas, there was no significant (p>0.05) variability in the total rainfall at Badme, Sheraro, and Adigoshu with 11.4 mm, 8.83 mm, and 8.44 mm per year, respectively.
The results showed that more than 60% of the annual rainfall was received between July and August (Figure 11) throughout the study areas. The inter-annual rainfall variability also revealed that there was high variability on rainfall across the study areas. The maximum monthly rainfall was observed in August with 294.2 mm at Adiremets and 289.8 mm at Maygaba. However, monthly rainfall observed throughout the stations during November, December, January, and February were below 10 mm; which are considered dry seasons.
- 2.
- Simple daily intensity index (SDII)
The trend analysis on SDII (Table 5 and Figure 12) showed a negative trend from 1983 to 2016 throughout the study areas. The results indicated that there was no uniform pattern on the SDII in the study area; where there was a significant (p<0.05) change at Adiremets, Dansha, Dedebit, Humera, Maygaba, and Maytsebri; whereas, there was no significant change at Adigoshu, and Sheraro. The SDII was decreasing by 0.07 and 0.06 at Maygaba and Adiremets, respectively every year over the last three decades. However, the smallest change -0.03 was observed at Sheraro and Badime followed by 0.04 at Adigoshu from 1983 to 2016 (Table 5).
On the other hand, the maximum SDII observed in 1986; with the highest values of 10.1 (Adiremets), 6.9 (Adigoshu), 8.9 (Badime), 9.6 (Dansha), 9.0 (Dedebit), 9.3 (Humera), 10.1 (Maygaba), 9.0 (Maytsebri), and 9 mm/day at Sheraro. Whereas, the smallest SDII in Adigoshu, Badme, Dedebit, Maygaba, Maytsebri, and Sheraro; with 3, 3.1, 3.2, 3.6, 3.2, and 3.2 mm/day, respectively were observed in 2004. Similarly, the smallest SDII value of 3.9 mm/day at Dansha, and Humera was observed in 2011.
- 3.
- Rx1day and Rx5 day (mm)
The results indicated that there was no significant variability on the linear trend of Rx1Day and Rx5Day throughout the study areas; except at Maygaba where significant (p<0.05) variability was observed. The maximum annual 1xday rainfall showed a negative trend in the majority of the study areas (Table 4), except at Humera, Dansha, and Adiremets. The maximum one-day (Rx1day) rainfall in Humera, Dansha, and Adiremets areas showed a positive trend varying from 0.1 to 0.037 mm per year. The maximum Rx5 day rainfall varied from -0.33 mm at Adigoshu to -1.14 mm per year at Maygaba; which were the highest, and smallest changes, respectively. On the other hand, there was also a -0.35 mm per year change at Badime, and Sheraro from 1983 to 2016. While, changes in the maximum Rx5day at Dansha, and Humera was -0.66 mm per year; however, Rx5day values at Dedebit and Maytsebri were -0.66 and -0.78 mm per year, respectively (Table 4).
The monthly Rx1day rainfall (Figure 13) showed that the maximum amount of Rx1day rain was observed during July and August, with the magnitude varying from 21.5 to 30.2 mm per day, at Adigoshu and Adiremets, respectively. The results on the maximum Rx1day rainfall at Badime, Dansha, Dedebit, Humera, Maygaba, Maytsebri, and Sheraro were 23.58, 27.94, 22.62, 28.00, 26.58, 22.62, and 23.61 mm, respectively. However, the total amount of rainfall received in May, June, September and October was comparatively small when compared with the daily Rx1day rainfall received in July and August at all stations; indicating July and August are the months, which maximum rainfall is received in the study areas.
The results also revealed that there was a strong inter-annual variability on Rx1day and Rx5day in the study areas. The maximum Rx5days rains in the study area was also concentrated in July and August; with the highest amounts 87.7mm at Adiremets, and 87.3 mm at Maygaba which were observed in August. Whilst, both the highest amount of Rx1day and Rx5day rainfall were observed at Adiremets in July, and August, during which more than 60% of the annual rainfall was received (Figure 13).
On the other hand, the spatial interpolation on the different extreme rainfall indices showed that there was a high variability across the stations from 1983-2016 (Figure 14). The spatial analysis on SDII showed that there was highly negative variability in areas around Humera, Dansha, Adiremets, and Maygaba, whereas, SDII was moderately varying in areas around Maytsebri, and Dedebit, with comparatively small variability around Badime, Sheraro, and Adigoshu. Likewise, seasonal rainfall variability across the study areas was observed in the time course. Figure 14 illustrates that there was high rainfall variability in areas around Humera, Dansha, Adiremets and Maygaba; whereas, areas around Maytsebri, Dedebit, and areas Adigoshu showed moderate variability when compared with areas in the western parts around Humera, Dansha, and Adiremets, and areas around Badime, Sheraro, and areas around Adigoshu towards the northeastern part of the study area.
Similarly, the spatial interpolation on R10mm and R20mm showed that there was high spatial variability in areas around Humera, Dansha, Adiremets and Maygaba; whereas small variability was observed in areas around Badime, Sheraro and Adigoshu. Comparatively, there was a moderate spatial variability on R10mm and R20mm in areas around Dedebit and Maytsebri from 1983-2016. There was also a significant spatial variability on Rx1day and Rx5day in the study areas from 1983-2016 (Figure 14). The highest spatial variability on Rx5day was observed in areas around Maygaba from 1983 to 2016; whereas, areas around Badime, Sheraro and Adigoshu experienced a relatively lower variability on Rx5day. Likewise, there was a relatively moderate variability on Rx5day in areas around Humera, Dansha, Adiremets, Maygaba, Dedebit, and Maytsebri in the last three decades.
4. Discussion
4.1. Changes in extreme temperature
The present study demonstrated that there was continuous warming over the study areas from 1983 to 2016. Recent studies indicate that there was extreme warming in different areas around the globe [3,8,37,46,47,48]; which are in line with the results obtained in this study. A recent study indicated that the mean, minimum, and maximum temperatures were linearly increasing by 0.046, 0.067, and 0.026 0C per decade in northcentral Ethiopia from 1901 to 2014 [16]. Similarly, there was also a significant increase in the annual maximum temperature in Tana areas in Ethiopia, with maximum and minimum positive slopes of 0.03 and 0.05 0C per year, respectively [49]. It also been stated that there was a significant increase in the inter-annual and seasonal trends on maximum and minimum temperatures in different parts of Ethiopia [8].
Similarly, the results also indicate that warming indicator values of extreme temperature indices such as warm days, warm nights, and WSDI revealed significant (p<0.01) positive trends throughout the study areas. In line with the results obtained in this study, a linear increasing trend in WSDI, warm days, and warm nights, coupled with up to 22% increase in warm days; and a decreasing trend on cold days and cold nights were observed in different parts of Ethiopia [12]. Similarly, there was also a negative trend on cold nights, cold days, and CSDI; and a positive linear trend on warm days, warm nights, and WSDI in different parts of Ethiopia from 1967-2008 [50]. On the other hand, increasing trend in warm days and warm nights varying from 0.38 to 0.71 days per year, and 0.31 to 0.62 days per year, respectively were observed over the last three decades in the lowland areas of Tigray [33]. On the other hand, the trends on the DTR also revealed that there was a linearly increasing trend over the study areas with magnitude varying from 0.013 0C at Sheraro to 0.025 0C at Dansha in the time span; while there was a high falloff during July and August.
The increase in warm days and warm nights might be due to global warming, deforestation, and/or urbanization. In the majority of the study areas, deforestation was extensively increasing due to expansions for arable land and resettlements. In line with this, there is strong evidence that anthropogenic factors affect warm days and warm nights [51].
Increasing warming indicator values might negatively affect the growth and development [52], and grain yield of different crops [53,54], and increase in distribution, and severity of infectious diseases like Leishmaniasis [55,56], and malaria [57] during the main cropping season in the study areas. Subsequently, such circumstances might affect the socio-economy and multifaceted challenges of the livelihood in the study area.
4.2. Changes in extreme rainfall
The current study presented that there was high rainfall variability in the lowland areas the Western Tigray, with no uniform pattern. The linear trend analysis on PRCPTOT, SDII, Rx1Day, and Rx5Day showed that there was a negative trend in the majority of the stations from 1983-2016 (Table 5). The results indicated that more than 60% of the annual rainfall was received was occurred in July and August at all stations. There was a decreasing trend in the annual rainfall, SDII, Rx1day, and Rx5 day across all stations. Trends on rainfall showed that there was a decreasing tendency over the past four decades in the Tigray around the Geba river basin [19], which was in agreement with results obtained in this study. Recent studies confirm that there was seasonal and inter-annual rainfall variability in different parts of the East African region including Ethiopia [8,12,19,20,47]. On the other hand, trend analysis in the annual rainfall showed that there was strong variability with a coefficient of variation from 33.77 to 233% from 1981-2010 [20]; and the annual and inter-annual variability exceeds 9-30% annually, 9-69% during the main rainy season (Kiremt) and 15-55% during the short rainy season (Belg) in different parts of the country [58]. It has also been stated that there was a significant reduction in the season rainfall variability in Welega in Oromiya national regional state between -5.92 to -9.74 mm per year [49], which is similar to the results obtained in this study.
In line with the results obtained in this study, research studies indicated that there was a decreasing trend on maximum Rx1day and Rx5day rainfall in different agro-ecologies in Ethiopia [46,50]. In this study, we found that there was no uniform rainfall variability in the study areas in the last three decades, which similar to the changes and variability on the maximum Rx1day and Rx5day rainfall indices; with negative trends on Rx1day at Adigudem, Adigrat, Mekelle, and Sinkata, and positive trends at Abiadi, Hawzen, and Wukro; whereas, the author also indicated that there was a negative trend was observed on the maximum Rx5Day at Adigudem, Mekelle, and Sinkata, except at Abiadi, Hawzen and Wukro [19].
Overall, the results on extreme temperature and rainfall showed that the Northwestern and Western parts of Tigray experienced seasonal and inter-annual variability, coupled with extreme warming, which could substantially affect crop production and food security in the study areas.
5. Conclusions
In the current study, we analyzed the trends and the temporal and spatial variability in rainfall and temperature. Hence, this study demonstrated that the northwestern and western zones of Tigray experienced extreme warming over the last three decades. There was an increasing trend on maximum and minimum temperature, warm days and warm nights; however, there was a negative trend on cold days and cold nights. There was also a significant reduction in the annual and inter-annual rainfall across the study area, with no uniform pattern. Based on the results obtained in this study, it is important to apply suitable climate change adaptation strategies for improved and climate-smart agricultural production, food security, and livelihood of the community in the study area. The results obtained in this study might be helpful for devising appropriate climate change adaptation strategies and decision-making on policy implications for improved and sustainable agriculture in the study area. Providing further research inputs are important to better understand the changes and variability of extreme climatic variability in the study area.
Author Contributions
For AB conceptualized, and drafted the manuscript by collected, analysed and interpreted the data. TT contributed in editing and revising the manuscript, and finally both authors approved the submitted manuscript.
Funding
This research received no external funding.
Data Availability Statement
Primary data are available in the hands of the corresponding author and can be obtained on confidential request.
Acknowledgments
The authors would like to thank Mr. Kinfe Welay for his technical assistance during the spatial interpolation of the different climate variables.
Conflicts of Interest
The authors declare that the research was conducted in the absence of any commercial or financial relationships that could be construed as a potential conflict of interest.
References
- Alexander, L. V., X. Zhang, T. C. Peterson, J. Peterson, J. Caesar, B. Gleason, A. M. G. Klein Tank, et al. 2006. Global Observed Changes in Daily Climate Extremes of Temperature and Precipitation. Journal of Geophysical Research (American Geophysical Union) 111: 1-22. [CrossRef]
- Frich, P., L. V. Alexander, P. Della-Marta, B. Gleason, M. Haylock, A.M.G. Klein Tank, and T. Peterson. 2002. Observed Coherent Changes in Climatic Extremes During the Second Half of the Twentieth Century. Climate Research 19: 193-212. [CrossRef]
- Adeyeri, O.E. E. Lawin, P. Laux, K.A. Ishola, and S.O. Ige. 2019. Analysis of climate extreme indices over the Komadugu-Yobe basin, Lake Chad region: Past and future occurrences. Weather and Climate Extremes, 23, 1–21. [CrossRef]
- Barry, A. A., J. Caesar, A. M. G. Klein Tank, E. Aguilar, Carol McSweeney, Ahmed M. Cyrrille, M. P. Nikeima, et al. 2018. West Africa Climate Extremes and Climate Change Indices. International Journal of Climatology 38 (1): 921-938. [CrossRef]
- Byakatonda, Jimmy, B P Parida, Piet K Kenabatho, and D B Moalafhi. 2018. Analysis of rainfall and temperature time series to detect long-term climatic trends and variability over semi-arid Botswana. Journal of Earth System Science 127 (25): 1-20. [CrossRef]
- Halimatou, Toure A., Traore Kalifa, and N. Kyei-Baffour. 2017. Assessment of Changing Trends of Daily Precipitation and Temperature Extremes in Bamako and Segou in Mali from 1961- 2014. Weather and Climate Extremes (ELSEVIER) 18: 8-16.
- IPCC. 2014. Climate Change: Synthesis Report. Fifth Assessment Synthesis Report.
- Gebrechorkos, Solomon H., Stephan Hülsmann, and Christian Bernhofer. 2019. Long-term trends in rainfall and temperature using high-resolution climate datasets in East Africa. Scientific Reports 9: 1-9. [CrossRef]
- Haile, Gebremedhin Gebremeskel, Quihong Tang, Siao Sun, Zhongwei Huang, Xuejun Zhang, and Xingcai Lie. 2019. Droughts in East Africa: Causes, impacts and resilience. Earth Science Reviews (ELSEVIER) 193: 146-161. [CrossRef]
- Adhikari, Umesh, A. Pouyan Nejadhashemi, and Sean A. Woznicki. 2015. Climate change and eastern Africa: a review of impact on major crops. Food and Energy Security 4 (2): 110-132.
- IPCC. 2018. Global Warming of 1.5 0C: Summary for Policy Makers. Switherland: Inter-Governmental Panel on Climate Change.
- Gebrechorkos, Solomon H., Stephan Hulsmann, and Chritian Bemofer. 2018. Changes in Temperature and Precipitation Extremes in Ethiopia, Kenya and Tanzania. International Journal of Climatology (Royal Meteorological Society (RMetS)) 39: 18-30. [CrossRef]
- Kassie, B. T. , Rötter, R. P., Hengsdijk, H., Asseng, S., Ittersum, M. K., Kahiluoto, H., & Keulen, H. V. (2014). Climate variability and change in the Central Rift Valley of Ethiopia: challenges for rainfed crop production. Journal of Agricultural Science, 152. [CrossRef]
- Ayalew, D., Tesfaye, K., Mamo, G., Yitaferu, B., & Bayu, W. (2012). Variability of rainfall and its current trend in Amhara region, Ethiopia. African Journal of Agricultural Research, 7(10), 1475-1486.
- Thornton, Philip K., Polly J. Ericksen, Mario Herrero, and Andrew J. Challinor. 2014. Climate Variability and Vulnerability to Climate: A Review. Global Change Biology 20: 3313-3328. [CrossRef]
- Asfaw, Amogne, Belay Simane, Ali Hassen, and Amare Bantider. 2018. Variability and Time Series Trend Analysis of Rainfall and Temperature in North central Ethiopia: A Case Study in Woleka Sub-basin. Weather and Climate Extremes (ELSEVIER) (19): 29-41.
- Dalle, D. , Gecho, Y., & Bedeke, S. B. (2023). Spatiotemporal Variability and Trends in Rainfall and Temperature in South Ethiopia: Implications for Climate Change Adaptations in Rural Communities. Advances in Meteorology, 2023, 1-21. [CrossRef]
- Gedefaw, M. , Yan, D., Wang, H., Qin, T., & Wang, K. (2019). Analysis of the Recent Trends of Two Climate Parameters over Two Eco-Regions of Ethiopia. Water, 11(161), 1-12. [CrossRef]
- Kiros, Gebremedhin, Amba Shetty, and Lakshman Nandagiri. 2017. Extreme rainfall signatures under changing climate in semi-arid northern highlands of Ethiopia. Cogent Geoscience 3: 1-20. [CrossRef]
- Hayelom, B., Chen, Y., Marsie, Z., & Birega, M. (2017). Temperature and Precipitation Trend Analysis over the last 30 years in Southern Tigray regional State, Ethiopia. Journal of Atmospheric Pollution, 5(1), 18-23. [CrossRef]
- Addisu, Solomon, Yihenew G.Selassie, Getachew Fissha, and Birhanu Gedif. 2015. Time series trend analysis of Temperature and Rainfall in Lake Tana Sub-basin, Ethiopia. Environmental Systems Research 4 (25): 1-12.
- Berhe, Amdom Gebremedhin, Solomon Habtu Misgna, Girmay Gebre-Samuel Abraha, and Amanuel Zenebe Abraha. 2023. Variability and trend analysis of temperatures, rainfall, and characteristics of crop-growing season in the eastern zone of Tigray region, northern Ethiopia. Theoretical and Applied Climatology 152: 25-43. [CrossRef]
- Mekonnen, A., Tessema, A., Ganewo, Z., & Haile, A. (2021). Climate change impacts on household food security and farmers adaptation strategies. Journal of Agriculture and Food Research, 6, 1-9. [CrossRef]
- Alemu, M. M., & Bawoke, G. T. (2020). Analysis of spatial variability and temporal trends of rainfall in Amhara region, Ethiopia. 11(4), 1505–1520. [CrossRef]
- Tarkegn, G. B., & Jury, M. R. (2020). Changes in the Seasonality of Ethiopian Highlands Climate and Implications for Crop Growth. Atmosphere, 11(892), 1-17. [CrossRef]
- Alemu, Tadesse, and Alemayohu Mengistu. 2019. Impacts of climate change on food security in Ethiopia: Adaptation and Mitigation options: A Review. In Climate Change-Resilient Agriculture and Agroforestry. Climate Change Management, edited by P. Castro, A. Azul and U. Azeiteiro W. Leal Filho. Springer, Cham. [CrossRef]
- Hadgu, Gebre, Kindie Tesfaye, Girma Mamo, and Belay Kassa. 2013. Trend and Variability of Rainfall in Tigray, Northern Ethiopia: Analysis of Meteorological data and Farmers’ Perception. Academia Journal of Agricultural Research 1 (6): 88-100.
- Wiebe, Keith, Sherman Robinson, and Andrea Cattaneo. 2019. Climate Change, Agriculture, and Food Security: Impacts the Potential for Adaptation and Mitigation. In Sustainable Food and Agriculture, by Clayton Cam-panhola and Shivaji Pandey, 55-74. Academic Press. [CrossRef]
- FAO. 2015. Climate change and Food Security: Risks and Responnses. FAO.
- Gebrehiwot, Tagel, and Anne van der Veen. 2013. Climate change vulnerability in Ethiopia: disaggregation of Tigray Region. Journal of Eastern African Studies (Tylor and Fransis Online) 7: 607-629.
- Asaminew, T G, A Araya, G Atkilt, and H Solomon. 2017. Modeling the Potential Impact of Climate Change on Cotton (Gossypium hirsutum) Production in Northeastern Semi-Arid Afar and Western Tigray Regions of Ethiopia. Journal of Earth Science and Climatic Change 8 (3): 1-7. [CrossRef]
- Niguse, Awetehegn, and Araya Alemie. 2015. Climate Characterization of the Western Zone of Tigray Region, Humera. Journal of Environment and Earth Science 5 (17): 24-29.
- 33. Berhane, Abadi, Gebre Hadgu, Walelign Worku, and Berhanu Abrha. 2020. Trends in extreme temperature and rainfall indices in the semi-arid areas of Western Tigray, Ethiopia. Environmental Systems Research. [CrossRef]
- Wart, Justin Van, Patricio Grassini, Haishun Yang, Lieven Claessens, Andrew Jarvis, and Kenneth G. Cassman. 2015. Creating long-term Weather Data from Thin Air for Crop Simulation Modeling. Agricultural Water Meteorology (ELSEVIER) 209-210: 49-58. [CrossRef]
- White, Jeffrey W., Gerrit Hoogenboom, Paul W. Jr. Stackhouse, and James M. Hoell. 2008. Evaluation of NASA Satellite and Assimilation Model-derived Long-term Daily Temperature Data over the Continental US. Agricultural and Forest Meteorology (ELSEVIER) 148: 1574-1584.
- Stackhouse, Paul W., Jr David Westberg, William S. Chandler, Taiping Zhang, and James M. Hoell. 2017. Prediction of Worldwide Energy Resource (POWER): Agro-climatology Methodology (1.0o Latitude by 1.0o Longitude Spatial Resolution). 1-52.
- Abbas, Farhat. 2013. Analysis of a Historical (1981-2010) Temperature Record of the Punjab Province of Pakistan. Earth Interactions 17: 1-15.
- Zhang, Xuebin, and Feng Yang. 2004. RClimDex (1.0) User Manual. Climate Research Branch, Environment Canada, Ontario (Canada).
- Yue, Sheng, and Chunyuan Wang. 2004. The Mann-Kendall Test Modified by Effective Sample Size to Detect Trend in Serially Correlated Hydrological Series. Water Resources Management (Kluwer Academic Publishers) 18: 201-218.
- Kendall, M. (1975). Rank Correlation Methods (4th ed.). London: Charles Grifin.
- Partal, Turgay, and Ercan Kahya. 2006. Trend Analysis in Turkish Precipitation Data. Hydrological Processes 20: 2011-2026.
- Yenigun, K., v. Gums, and H. Mulut. 2008. Trends in Streamflow of the Euphrates basin, Turkey.Water Management: Proceedings of the Institution of Civil Engineering. 189-198. [CrossRef]
- Sen, K. K. (1968). Estimates of the Regression Coefficient Based on Kendall's Tau. American Journal of Statistical Association, 63(324), 1379-1389. [CrossRef]
- Panigrahi, N. n.d. Inverse Distance Weight. In Encyclopedia of Mathematical Geosciences. Encyclopedia of Earth Sciences Series., edited by B. Daya Sagar, Q. Cheng, J. McKinley and F. Agterberg. Springer, Cham. [CrossRef]
- Maleika, Wojciech. 2020. Inverse distance weighting method optimization in the process of digital terrain model creation based on data collected from a multibeam echosounder. Applied Geomatics 12: 397-407. [CrossRef]
- Worku, Gebrekidan, Ermias Teferi, Amare Bantidere, and Yihun T. Dile. 2019. "Observed changes in extremes of daily rainfall and temperature in Jemma Sub-basing, Upper Blue Nile Basin, Ethiopia." Theoretical and Applied Climatology 135: 839-854. [CrossRef]
- Cattani, Elsa, Andrés Merino, José A. Guijarro, and Vincenzo Levizzani. 2018. East Africa Rainfall Trends and Variability 1983–2015 Using Three Long-Term Satellite Products. Remote Sensing 10 (931): 2-26. [CrossRef]
- Rahimzadeh, Fatemeh, Ahmad Asgari, and Ebrahim Fattahi. 2009. Variability of extreme temperature and precipitation in Iran during recent decades. International Journal of Climatology (Royal Meteorological Sciety) 29: 329-343. [CrossRef]
- Birara, H., Pandey, R. P., & Mishra, S. K. (2018). Trend and Variability Analysis of Rainfall and Temperature in the Tana basin region. Journal of Water and Climate Change, 9, 555-569. [CrossRef]
- Mekasha, Aklilu, Kinde Tesfaye, and Alan J. Duncan. 2014. Trends in Daily Observed Temperature and Precipitation Extremes over Three Ethiopian Eco-envirnments. International Journal of Climatology (Royal Meteorological Society) 34: 1990-1999. [CrossRef]
- IPCC. 2013. The Physical Science Bais. Contribution of Working Group I to the Fifth Assessment Report of the Intergovernmental Panel on Climate Change. Cambridge UK and New York, USA: Cambridge University press, 1552.
- Hatfield, Jerry L., and John H. Prueger. 2015. Temperature Extremes: Effect on Plant Growth and Development. Weather and Climate Extremes 10: 4-10.
- P.V.V. Prasad, Maduraimuthu Djanaguiraman, Ramasamy Perumal, and Ignacio A. Ciampitti. 2015. Impact of high temperature stress on floret fertility and individual grain weight of grain sorghum: Sensitive stages and thresholds for temperature and duration. Frontiers in Plant Science 6 (820): 2-11. [CrossRef]
- Tacarindua, Custodio R.P., Tatsuhiko Shiraiwa, Koki Homma, Etsushi Kumagai, and Ryoji Sameshima. 2012. The response of soybean seed growth characteristics to increased temperature under near-field conditions in a temperature chamber. Field Crops Research (ELSEVIER) 131: 26-31. [CrossRef]
- Tedla, Dawit gebremichael, Fshatsion Hailemariam Bariagabr, and Hagos Hadgu Abreha. 2018. Incidence and Trends of Leishmaniasis and Its Risk Factors in Humera, Western Tigray. Journal of Parasitology Research 10: 1-9. [CrossRef]
- Cardenas, Rocio, Claudia M. Sandoval, Alfonso J. Rodriguez-Morales, and Carlos Franco-Paredes. 2006. Impact of Climate Variability in the Occurrence of Leishmaniasis in Northern Colombia. American Journal of Tropical Medicine and Hygiene 72 (2): 273-277.
- Blanford, J. I., Blanford, S., Crane, R. G., Mann, M. E., Paaijmans, K. P., Schreiber, K. V., & Thomas, M. B. (2013). Implications of temperature variation for malaria parasite development across Africa. Scientific Reports, 3, 1-11. [CrossRef]
- Gummadi, Srdhar, K. P.C. Rao, Jemal Seid, Gizachew Legesse, M. D. M. Kadiyala, Robel Takele, Tilahun Amede, and Anthony Whitbread. 2017. Spatio-temporal Variability and Trends of Precipitation and Extreme Rainfall Events in Ethiopia in 1980-2010. Theoretical and Applied Climatology (Springer Link) 134 (3-4): 1315-1328. [CrossRef]
Figure 1.
Location map of the study area.
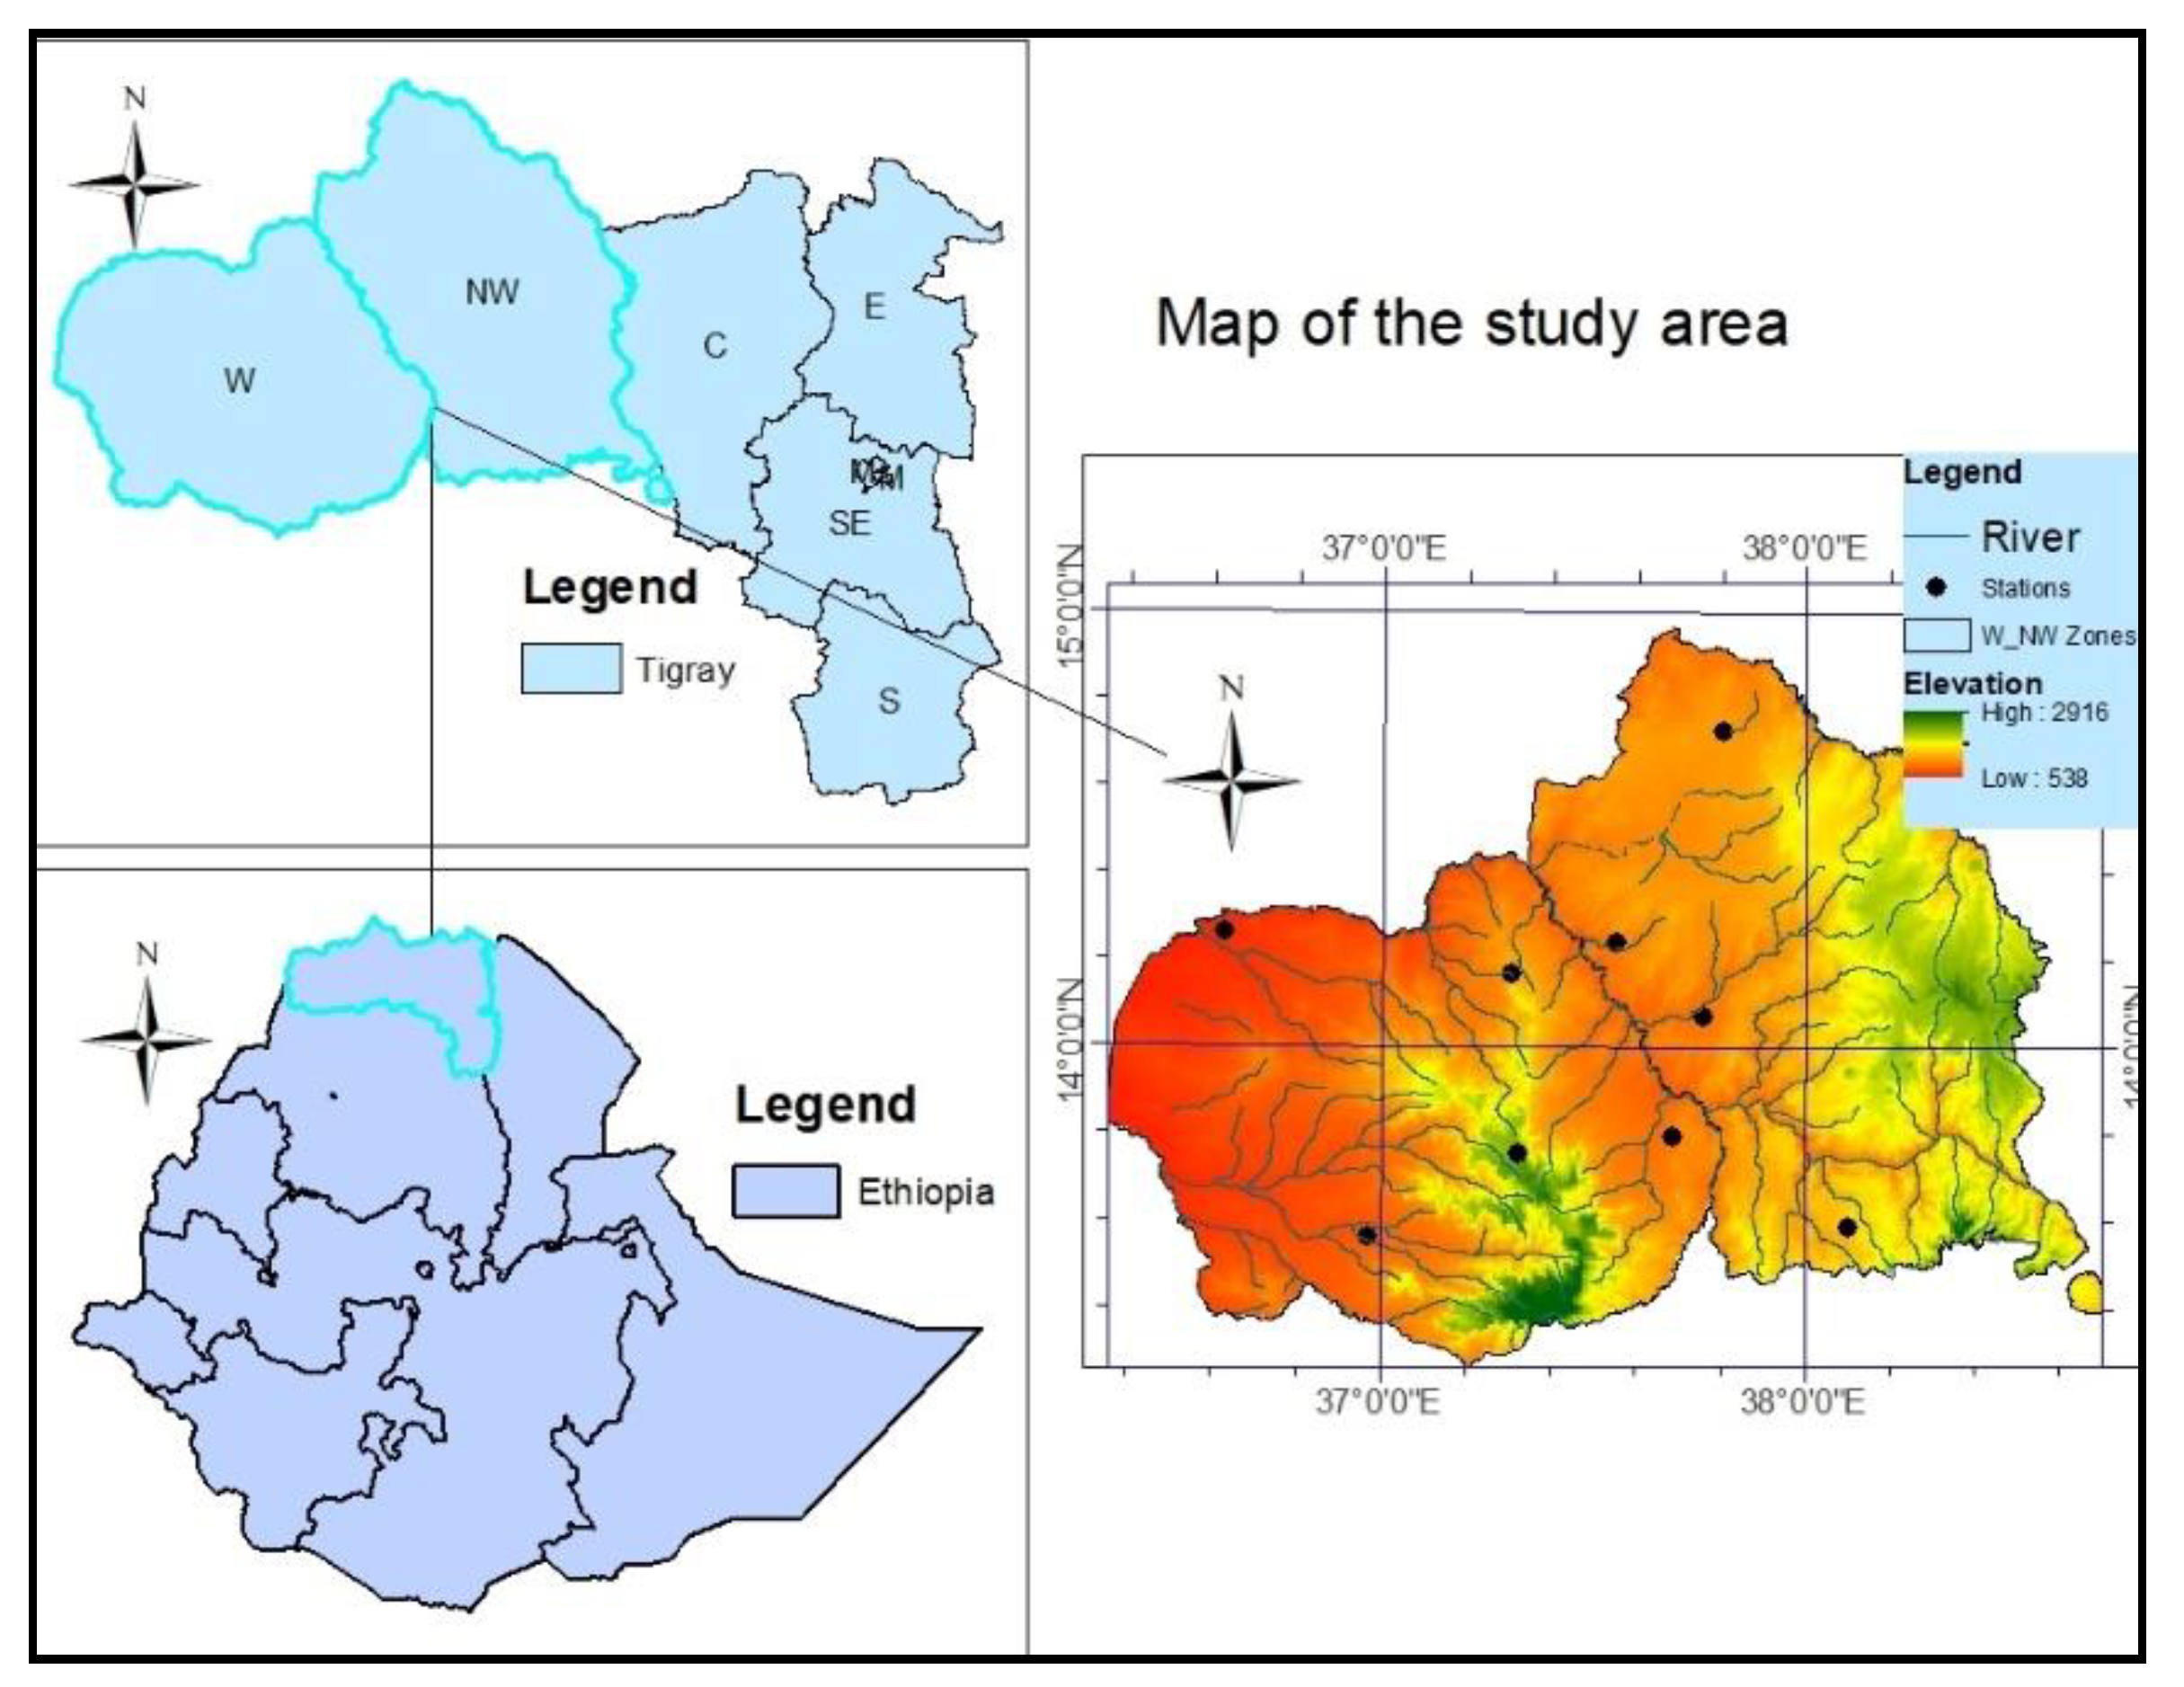
Figure 2.
Tropical nights of the study areas from 1983 to 2016. (A) Adigoshu (B) Badme (C) Adiremets (D) Dansha (E) Dedebit (F) Humera.
Figure 2.
Tropical nights of the study areas from 1983 to 2016. (A) Adigoshu (B) Badme (C) Adiremets (D) Dansha (E) Dedebit (F) Humera.
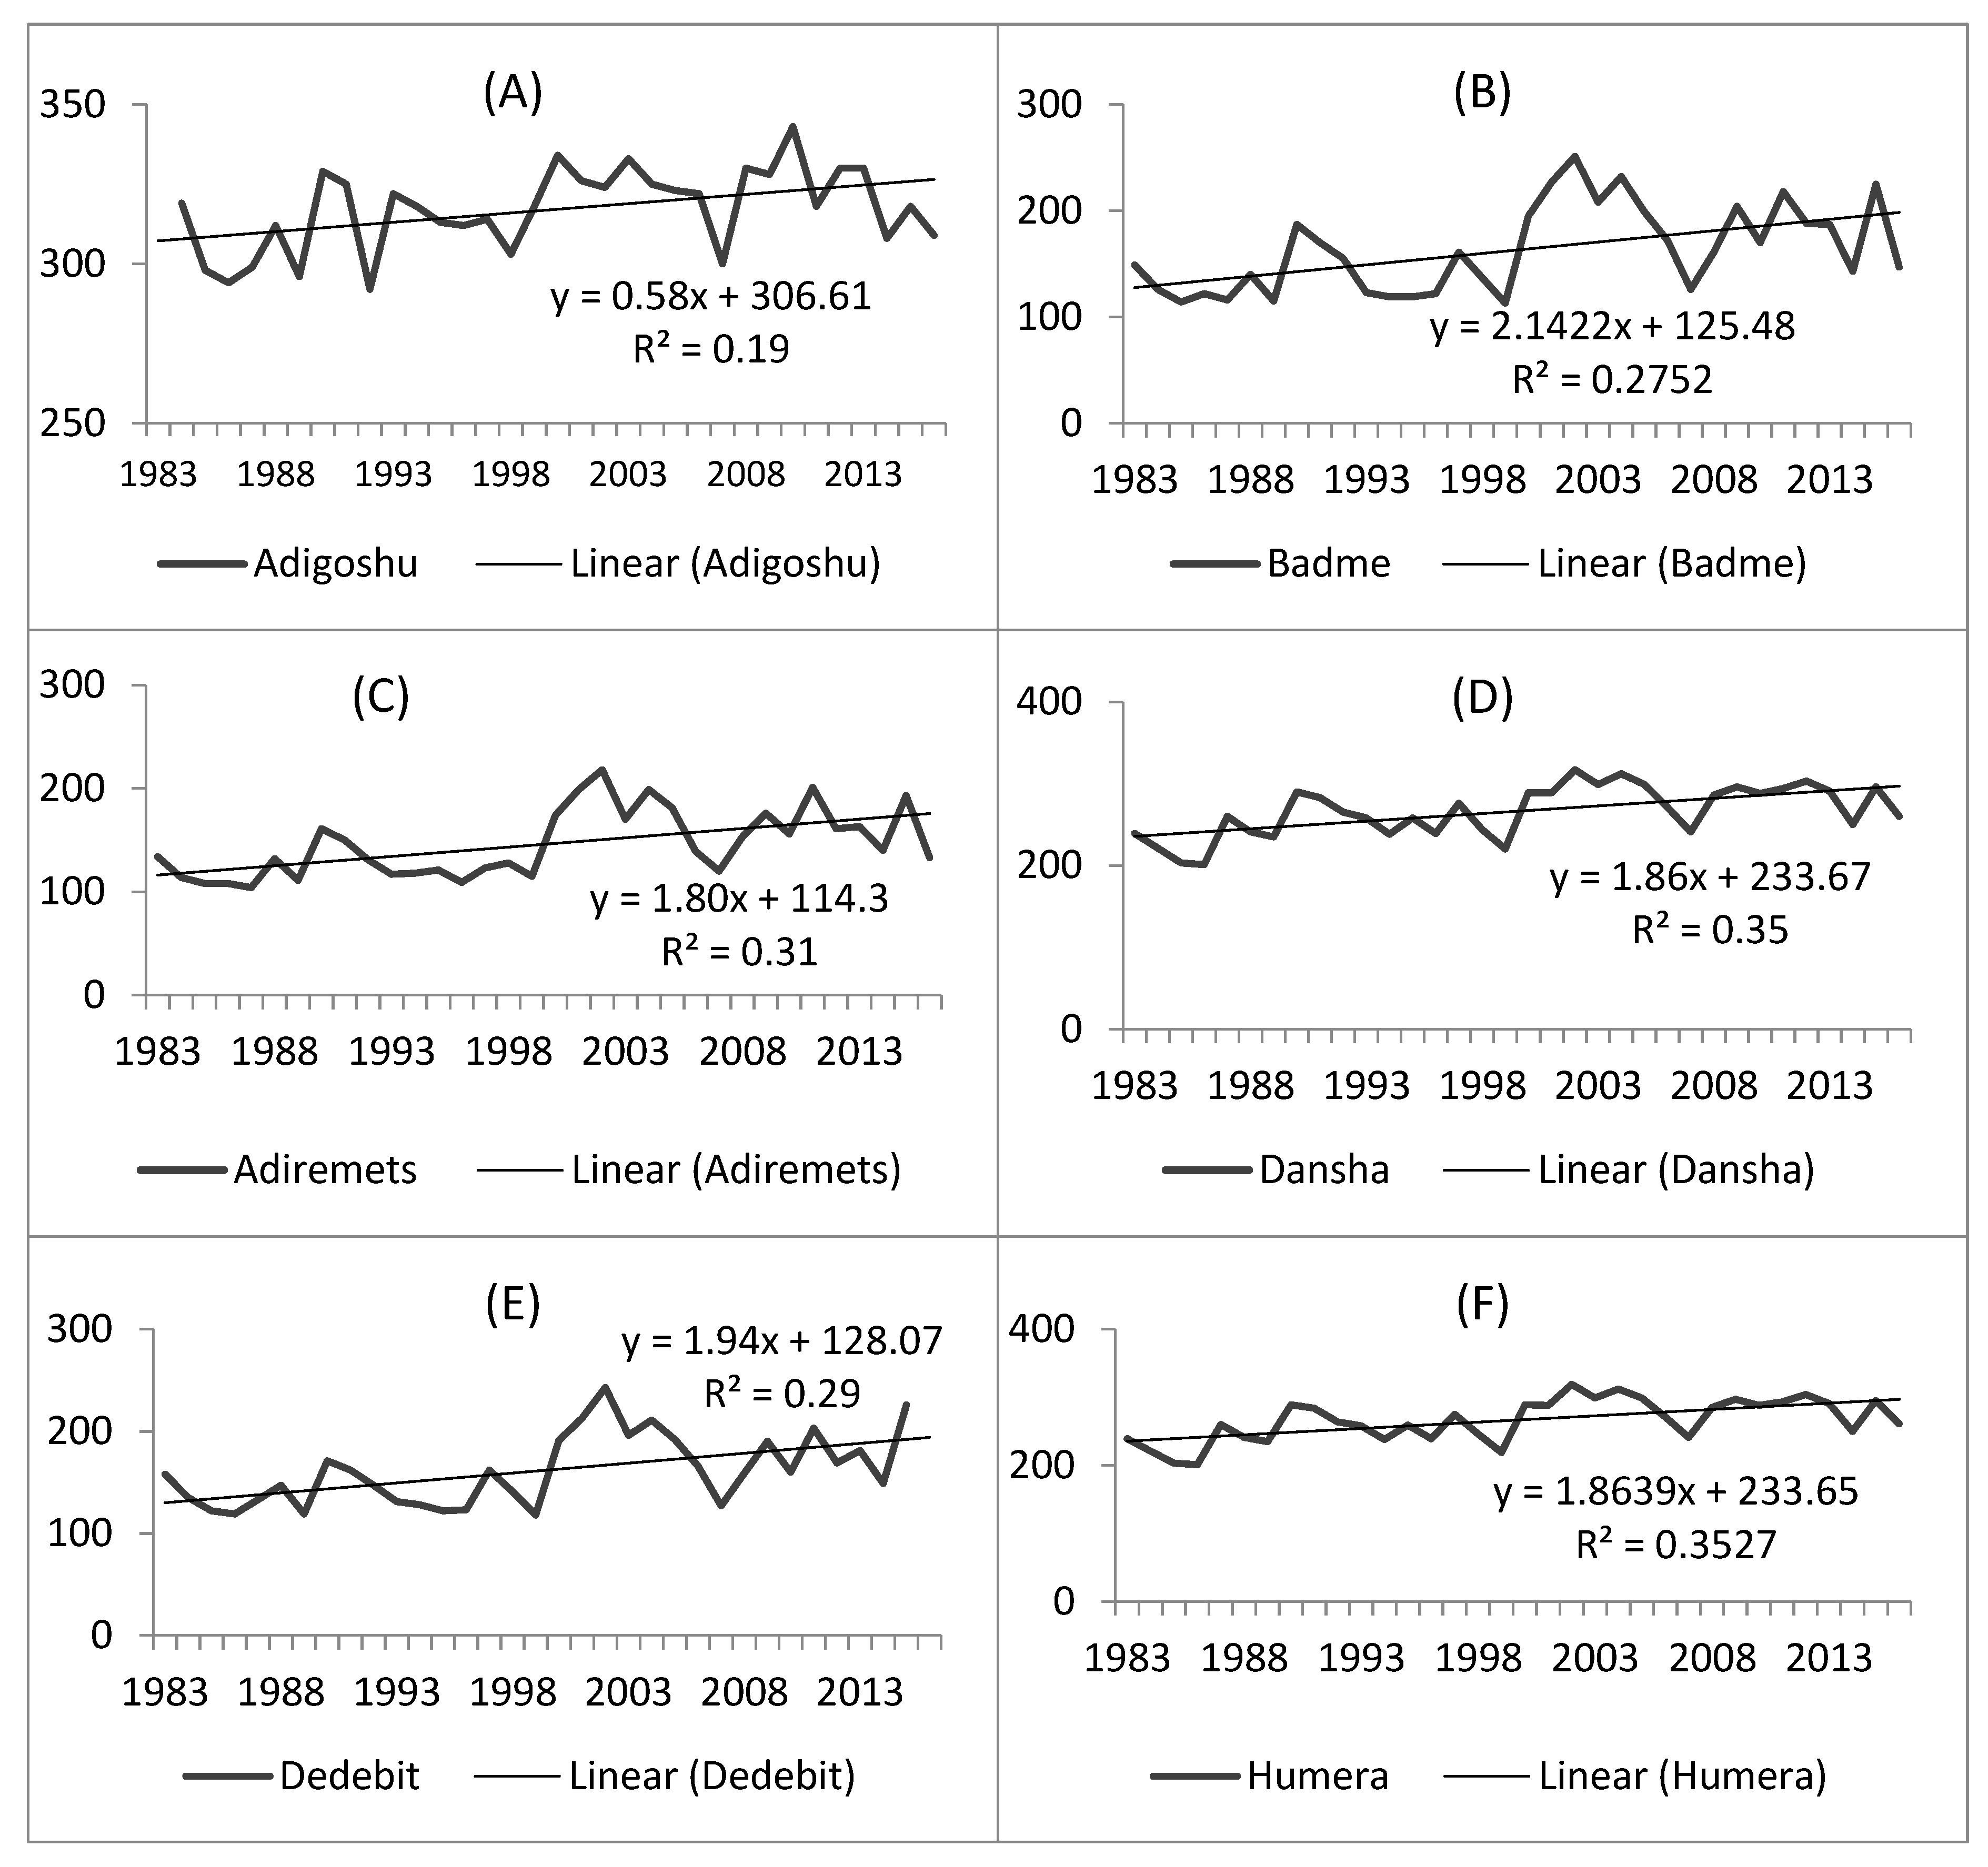
Figure 3.
Average monthly maximum (A) and minimum (B) temperatures from 1983-2016.
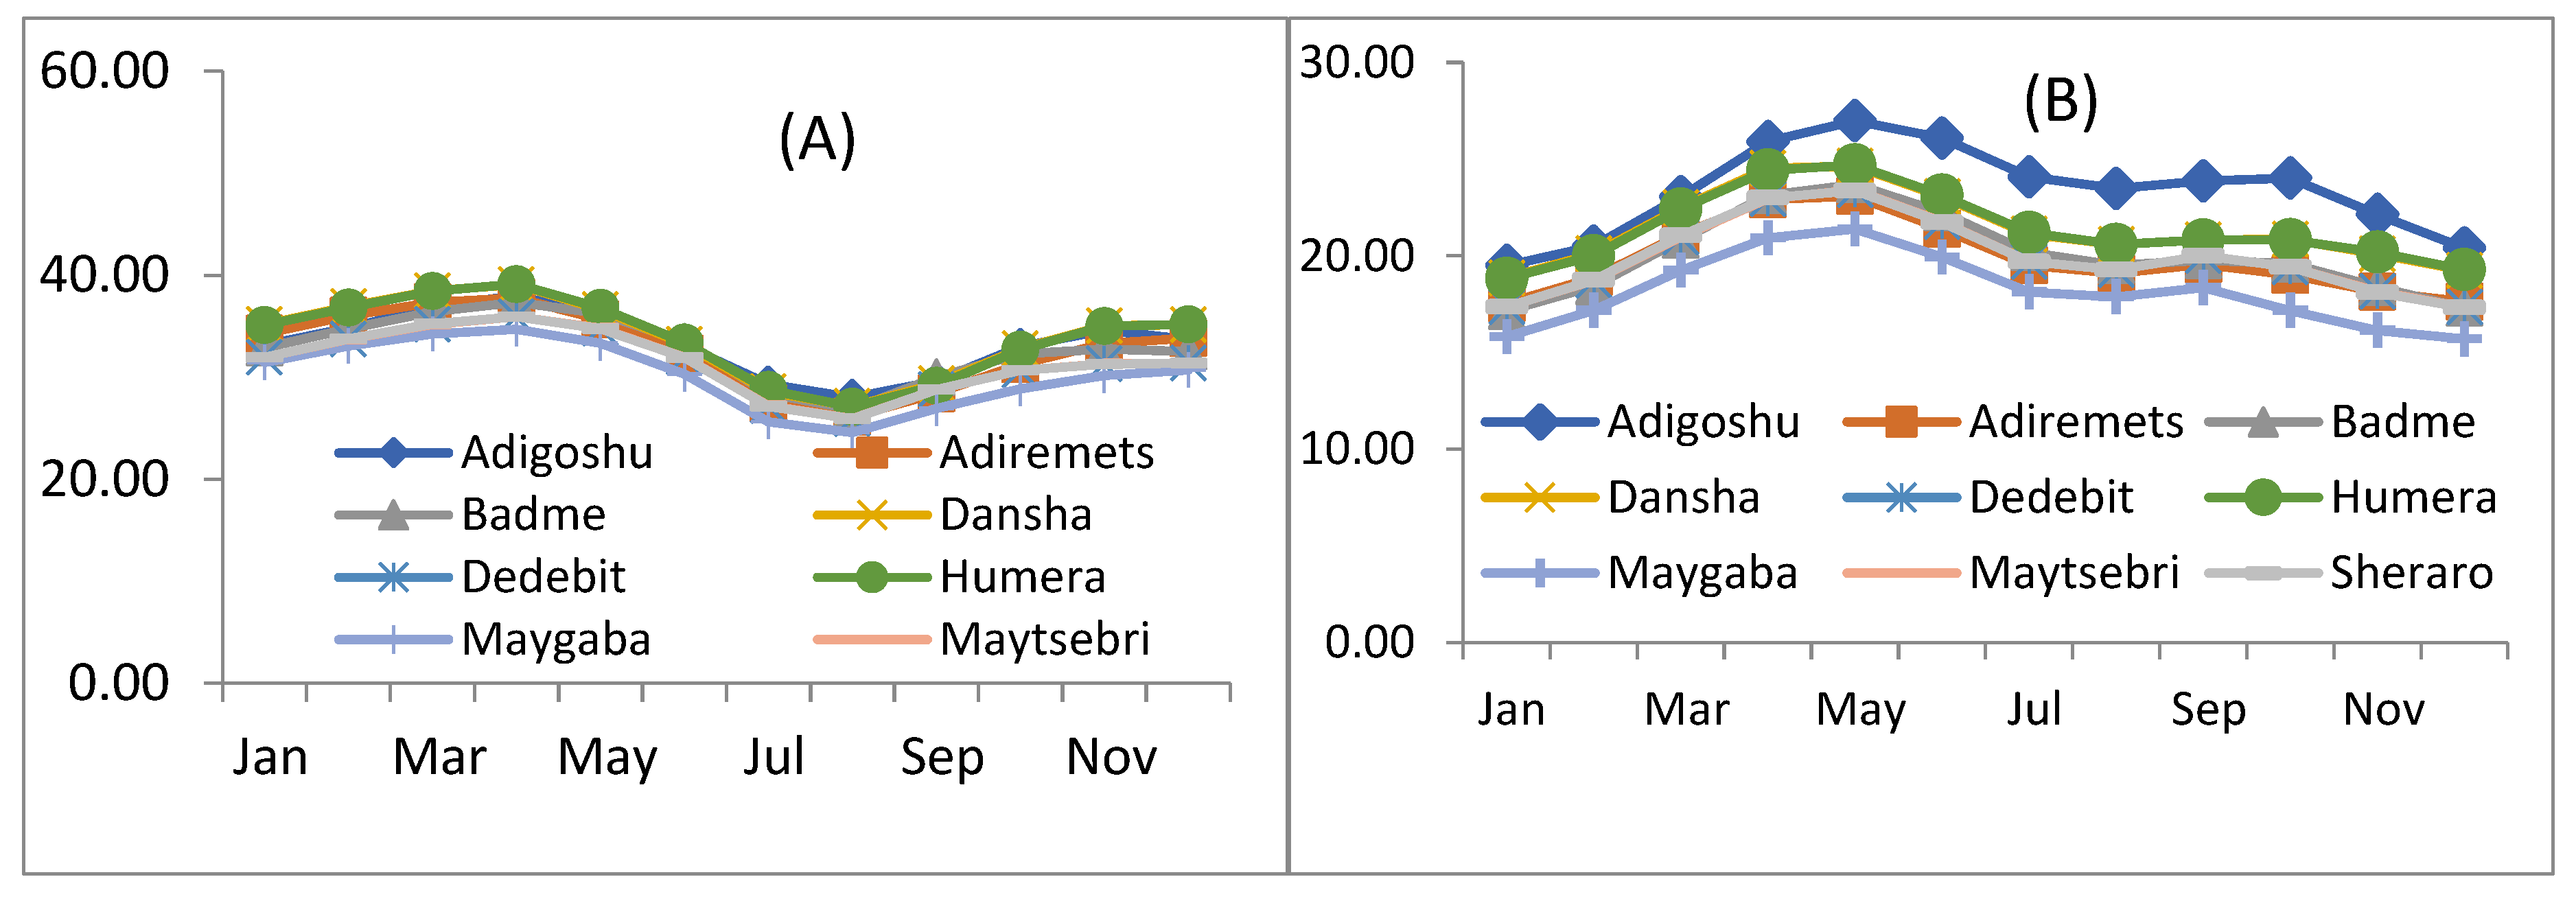
Figure 4.
Average monthly DTR variability from 1983 to 2016.
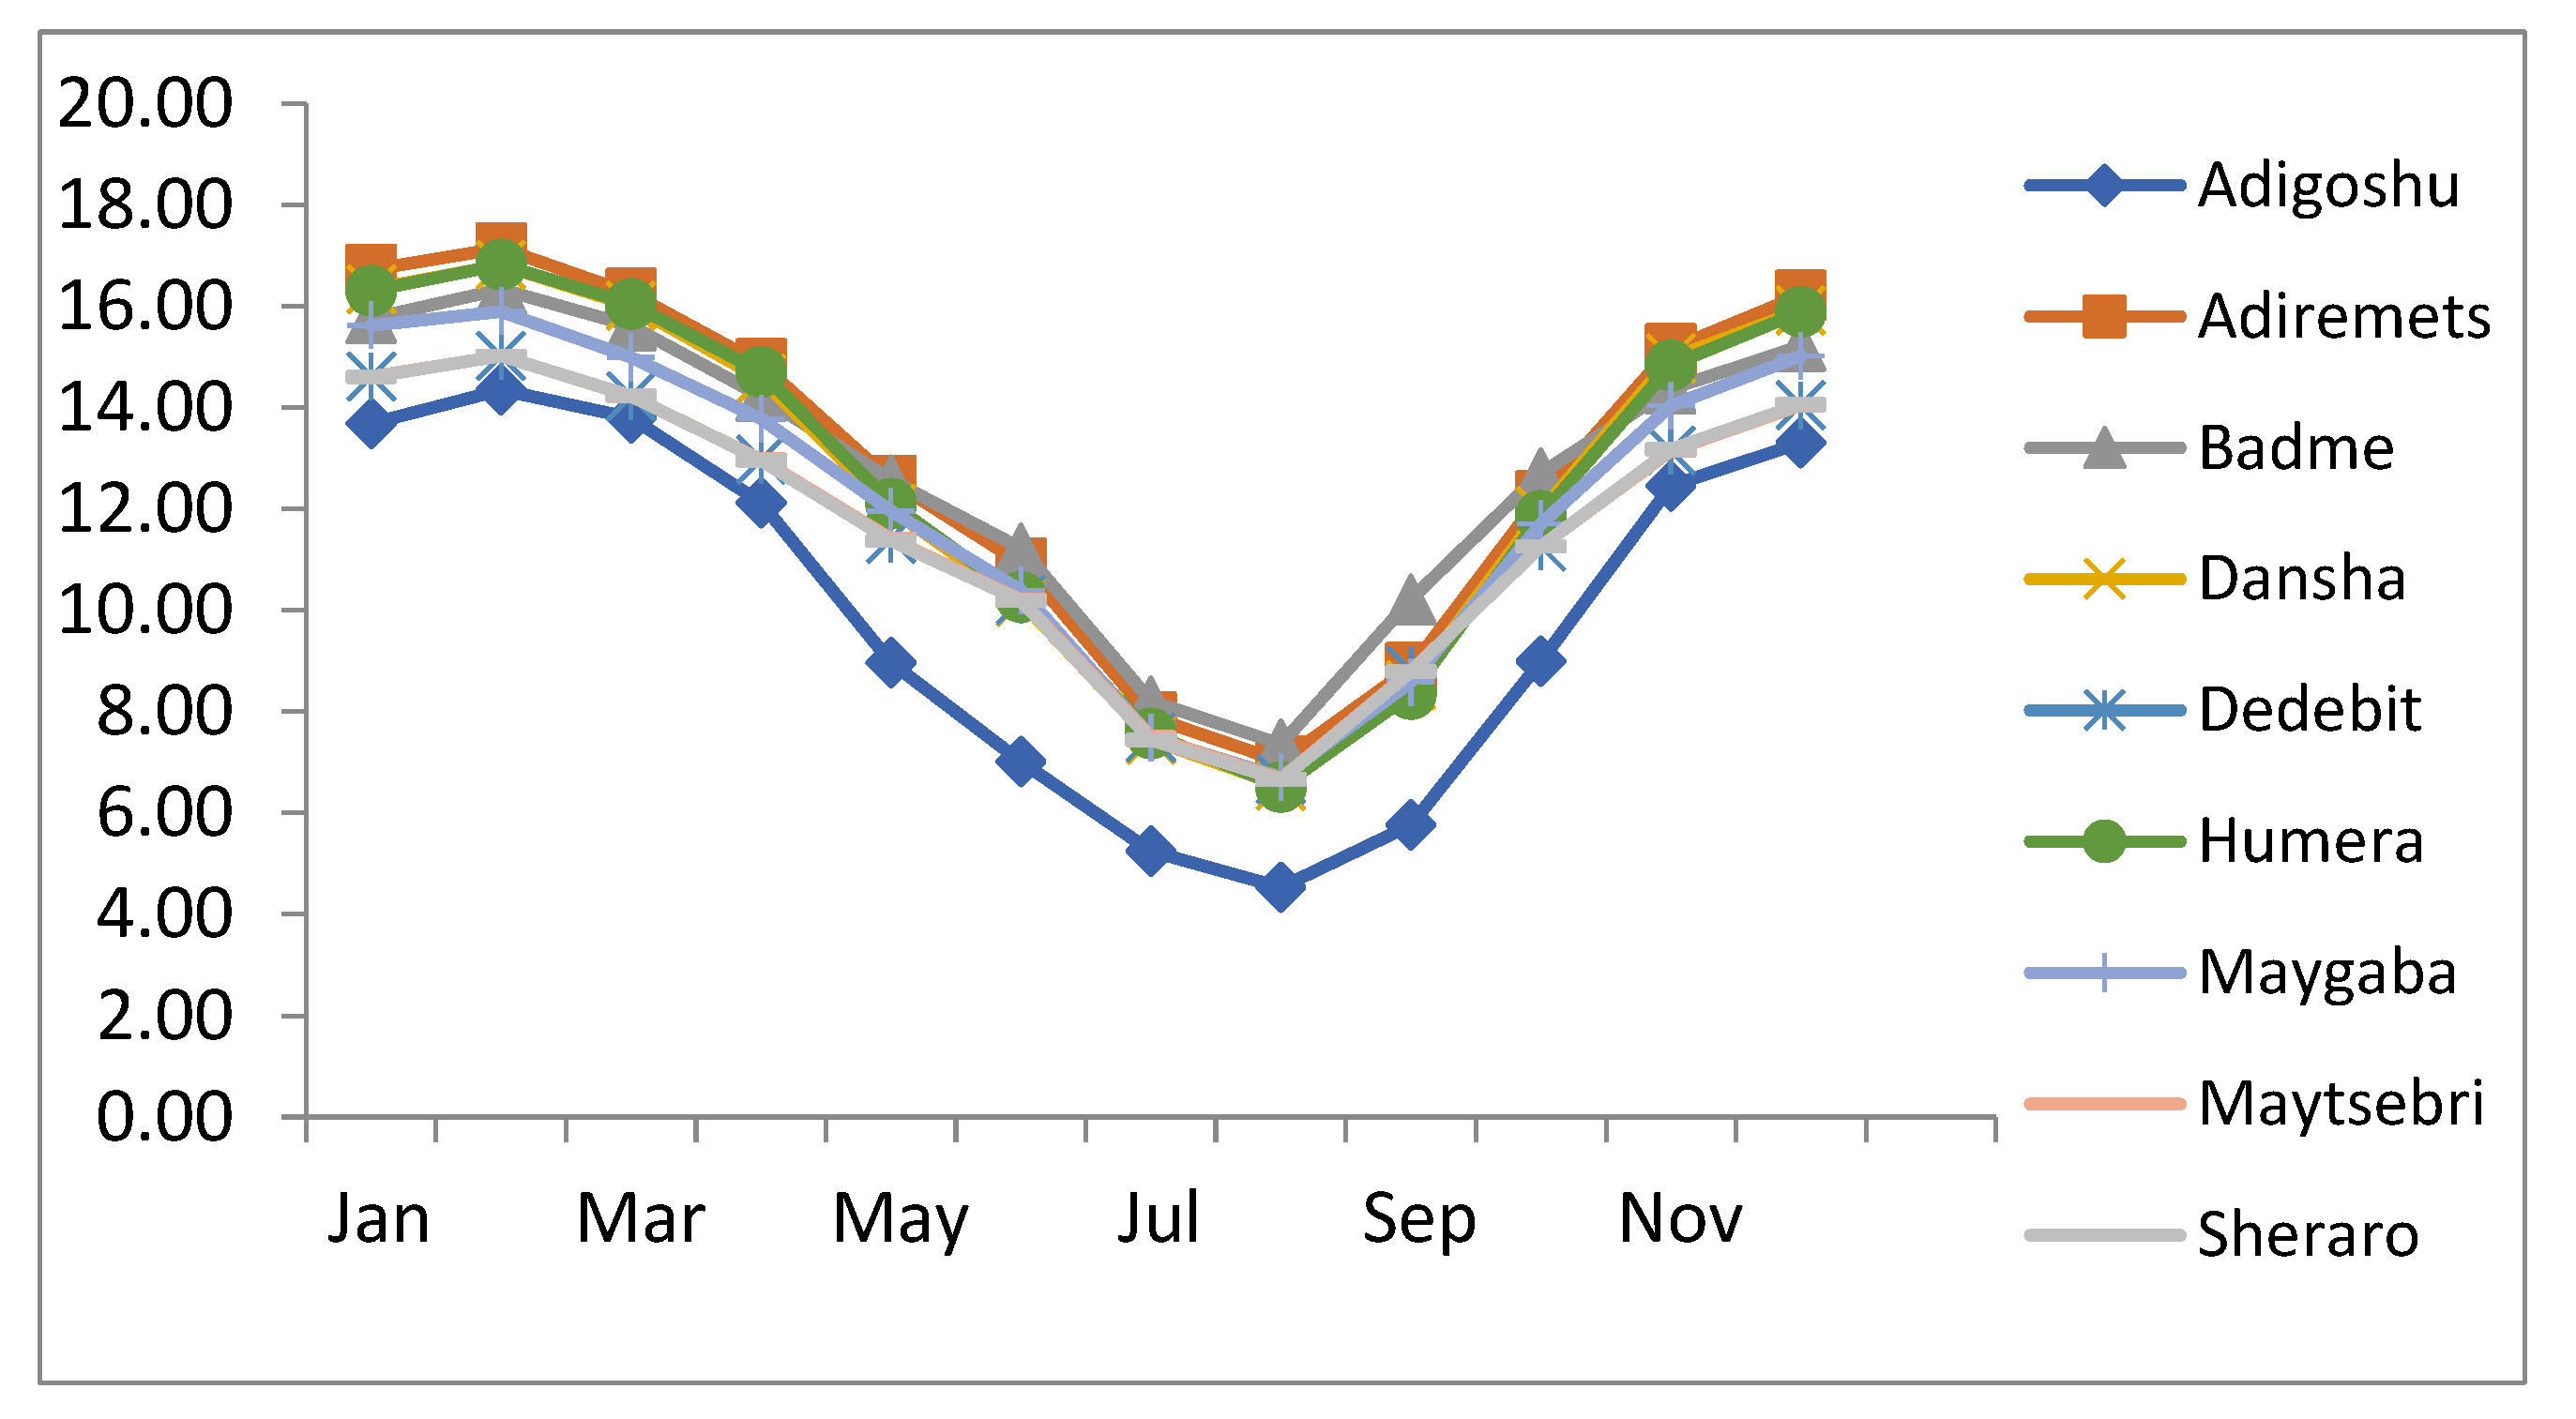
Figure 5.
Diurnal temperature range (DTR) (A) Adigoshu (B) Adiremets (C) Dansha (D) Dedebit (E) Humera (F) Sheraro.
Figure 5.
Diurnal temperature range (DTR) (A) Adigoshu (B) Adiremets (C) Dansha (D) Dedebit (E) Humera (F) Sheraro.
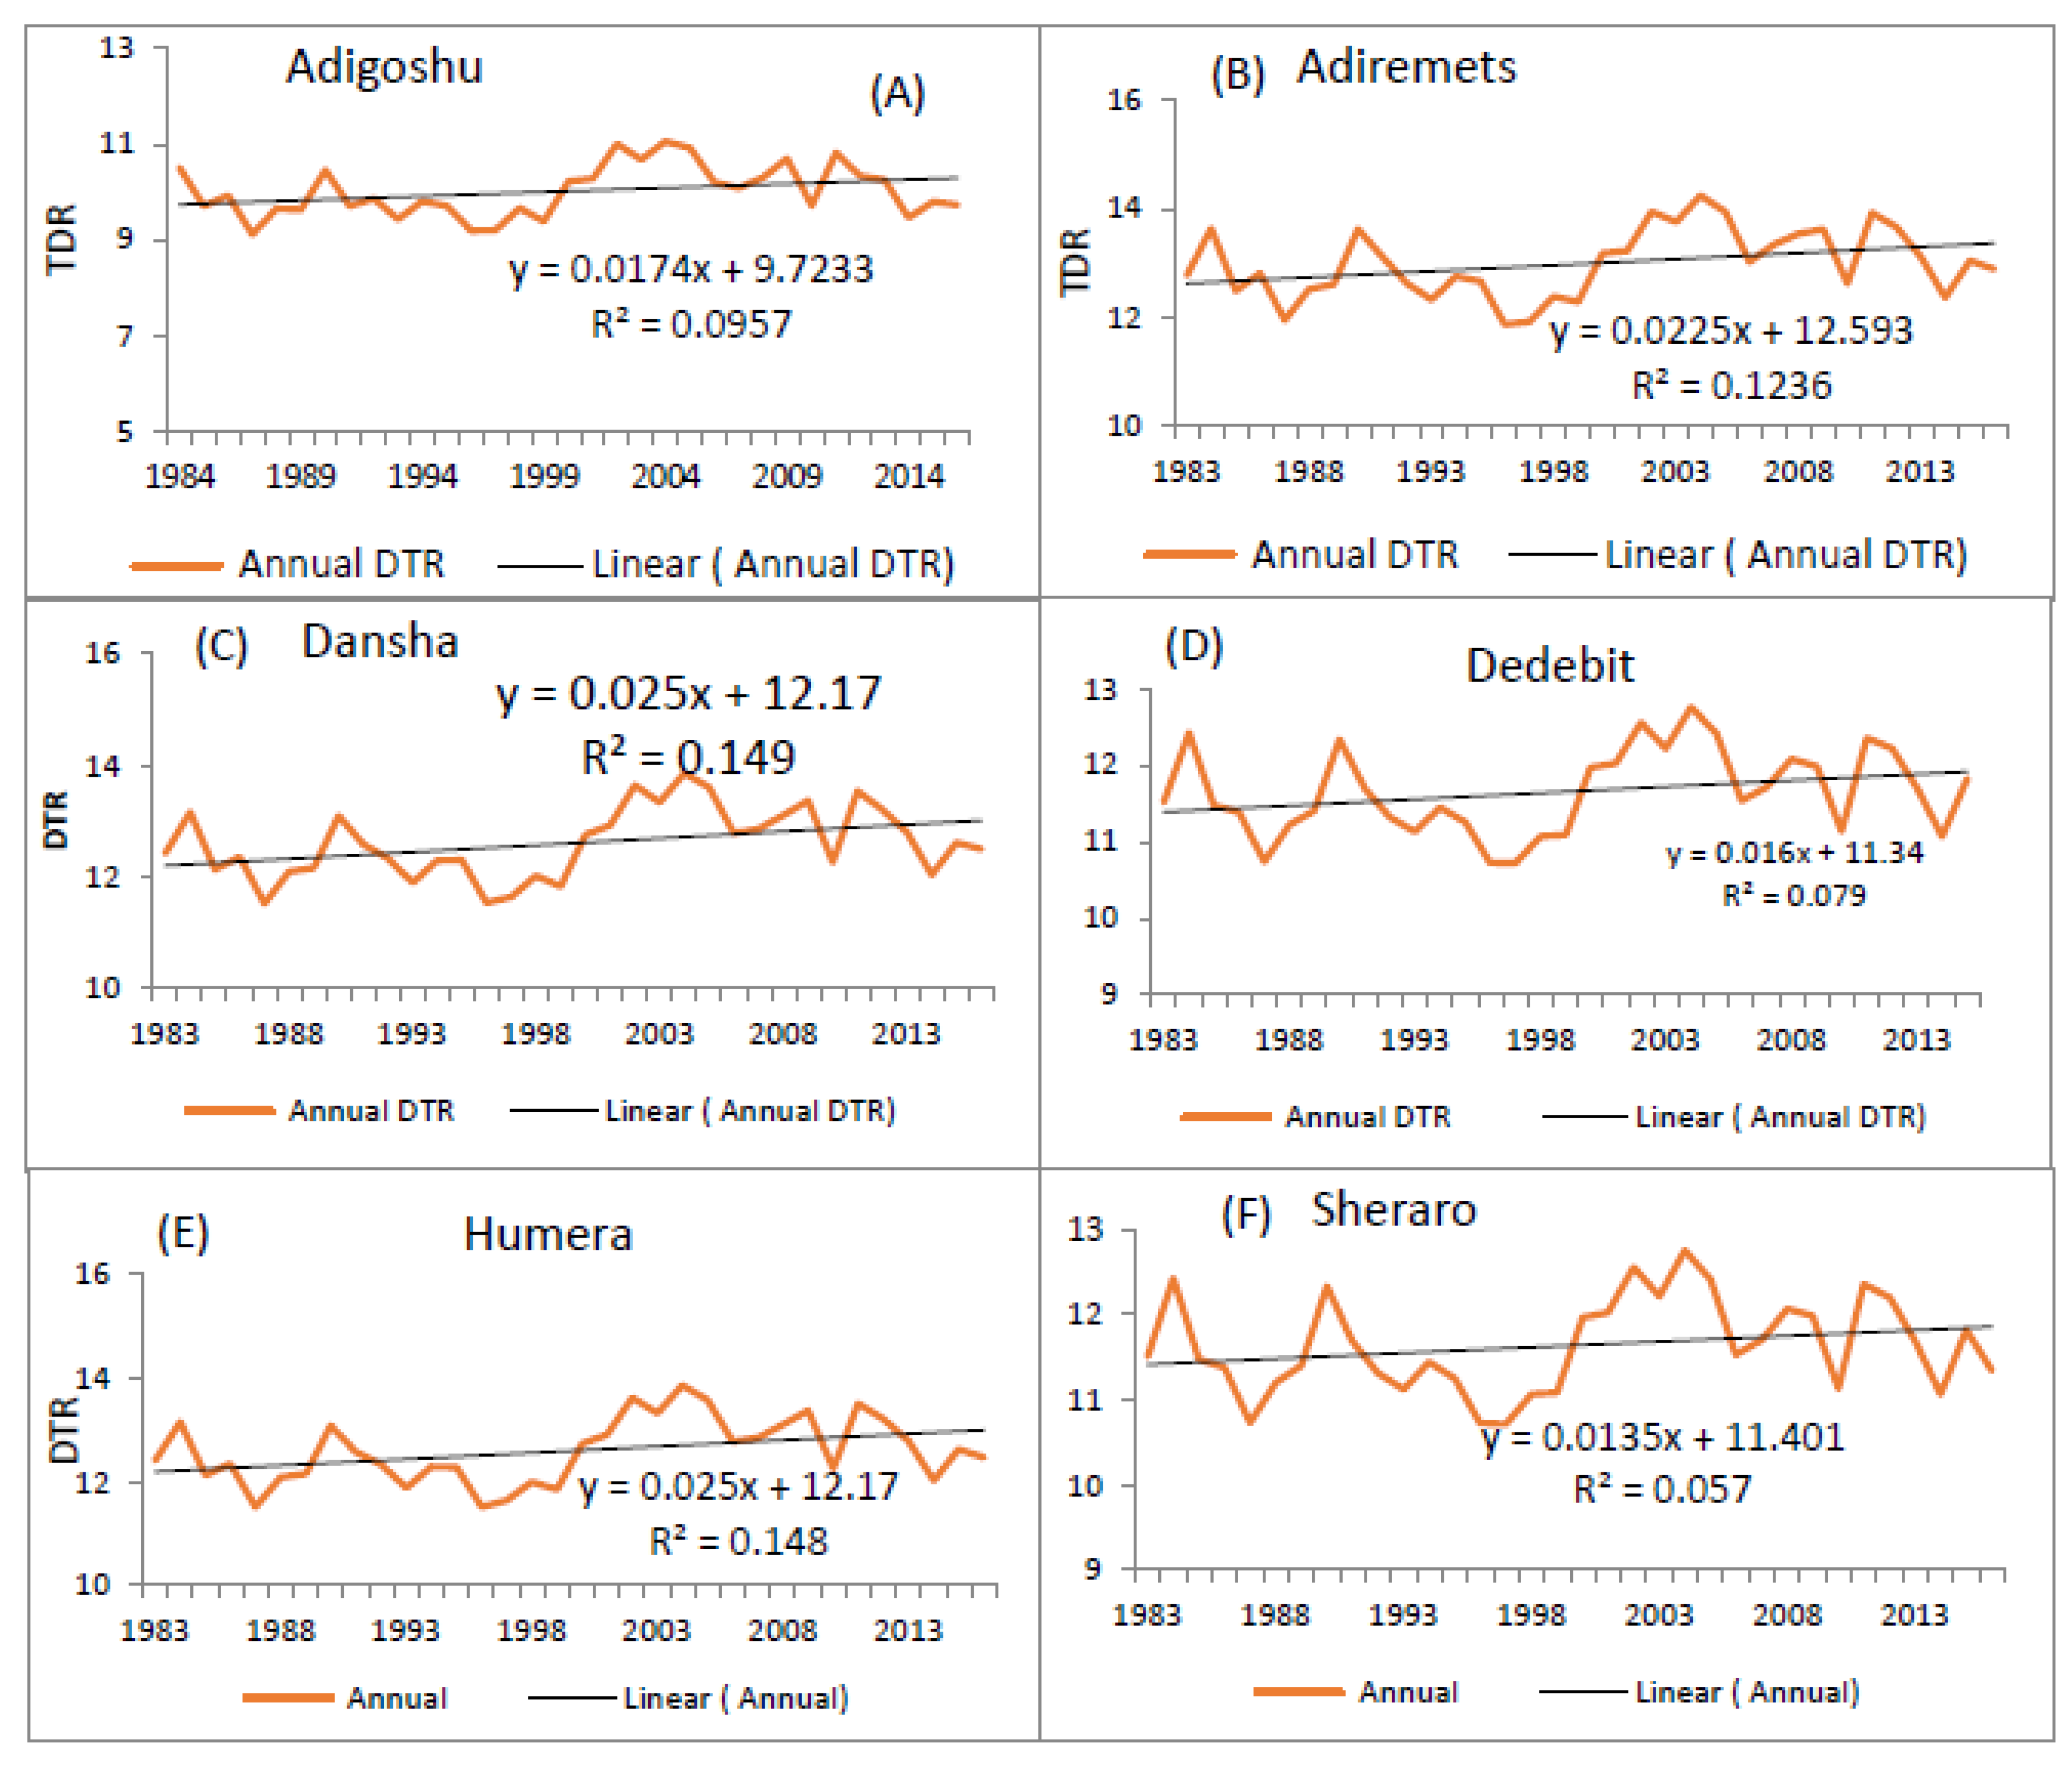
Figure 6.
Warm spell duration indicator (A) Adiremets (B) Badme (C) Humera (D) Sheraro (E) Maytsebri (F) Maygaba.
Figure 6.
Warm spell duration indicator (A) Adiremets (B) Badme (C) Humera (D) Sheraro (E) Maytsebri (F) Maygaba.
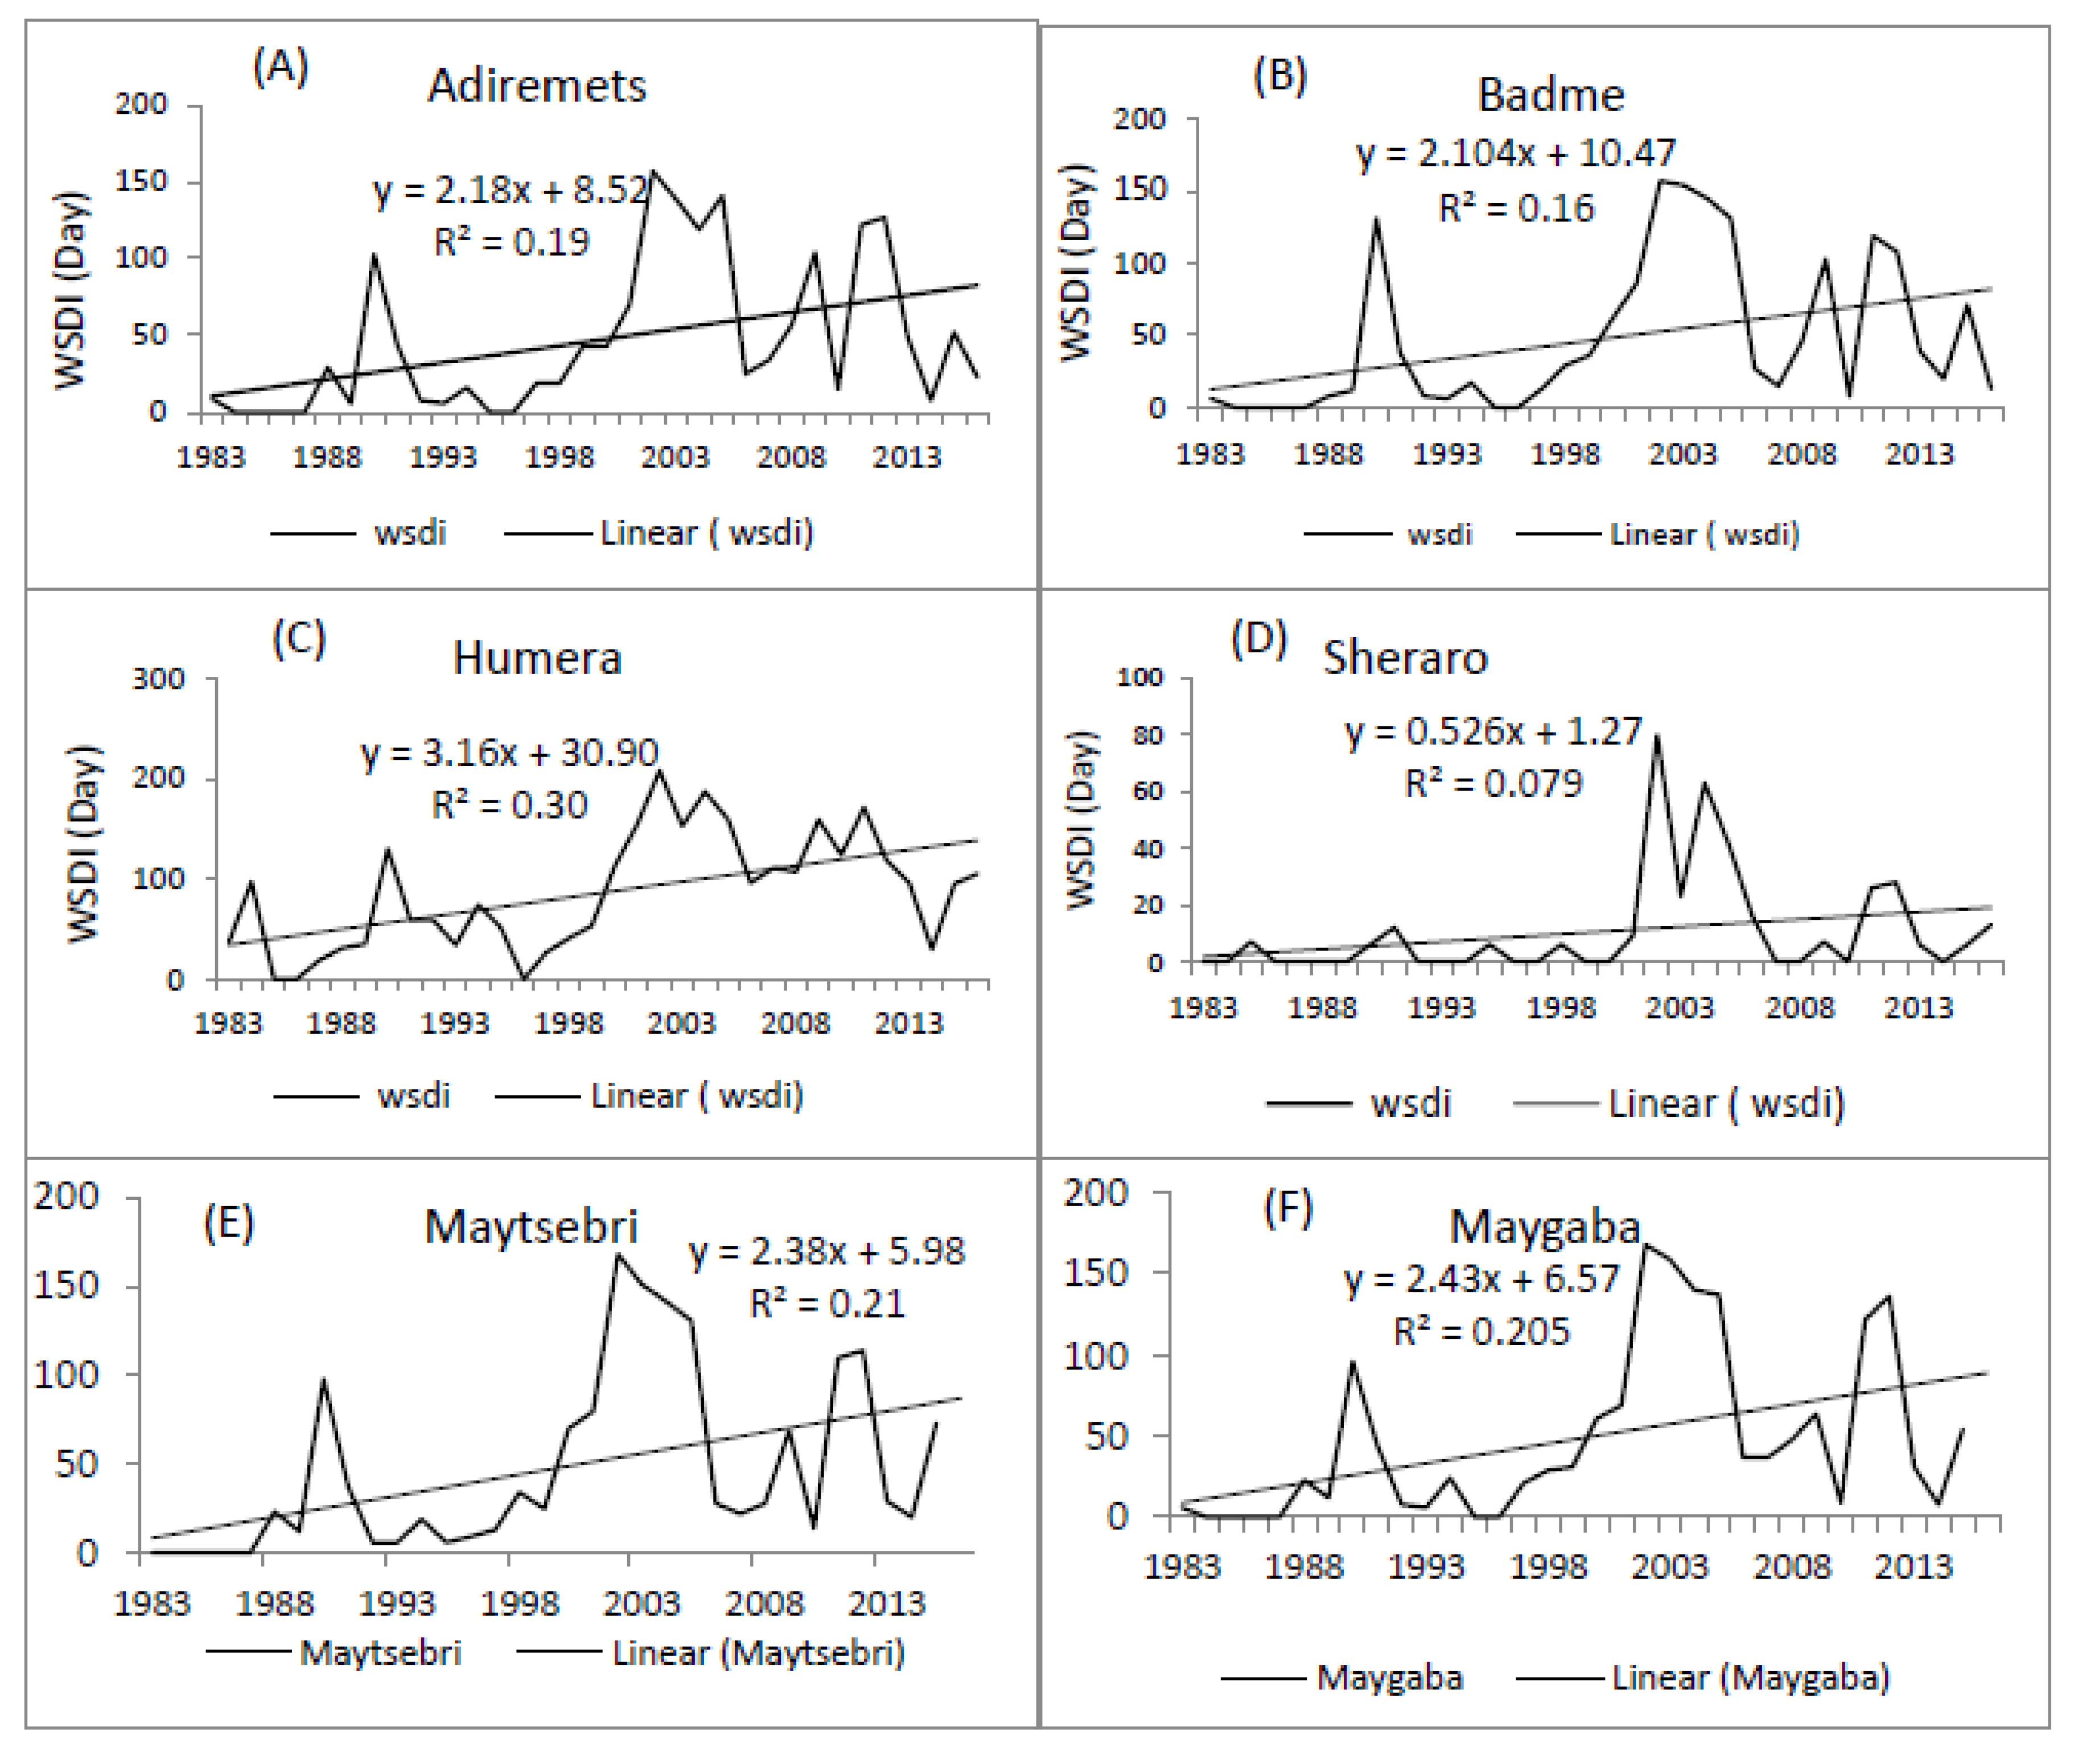
Figure 7.
Cold spell duration indicator (A) Adiremets (B) Adigoshu (C) Badme (D) Humera (E) Sheraro (F) Maytsebri.
Figure 7.
Cold spell duration indicator (A) Adiremets (B) Adigoshu (C) Badme (D) Humera (E) Sheraro (F) Maytsebri.
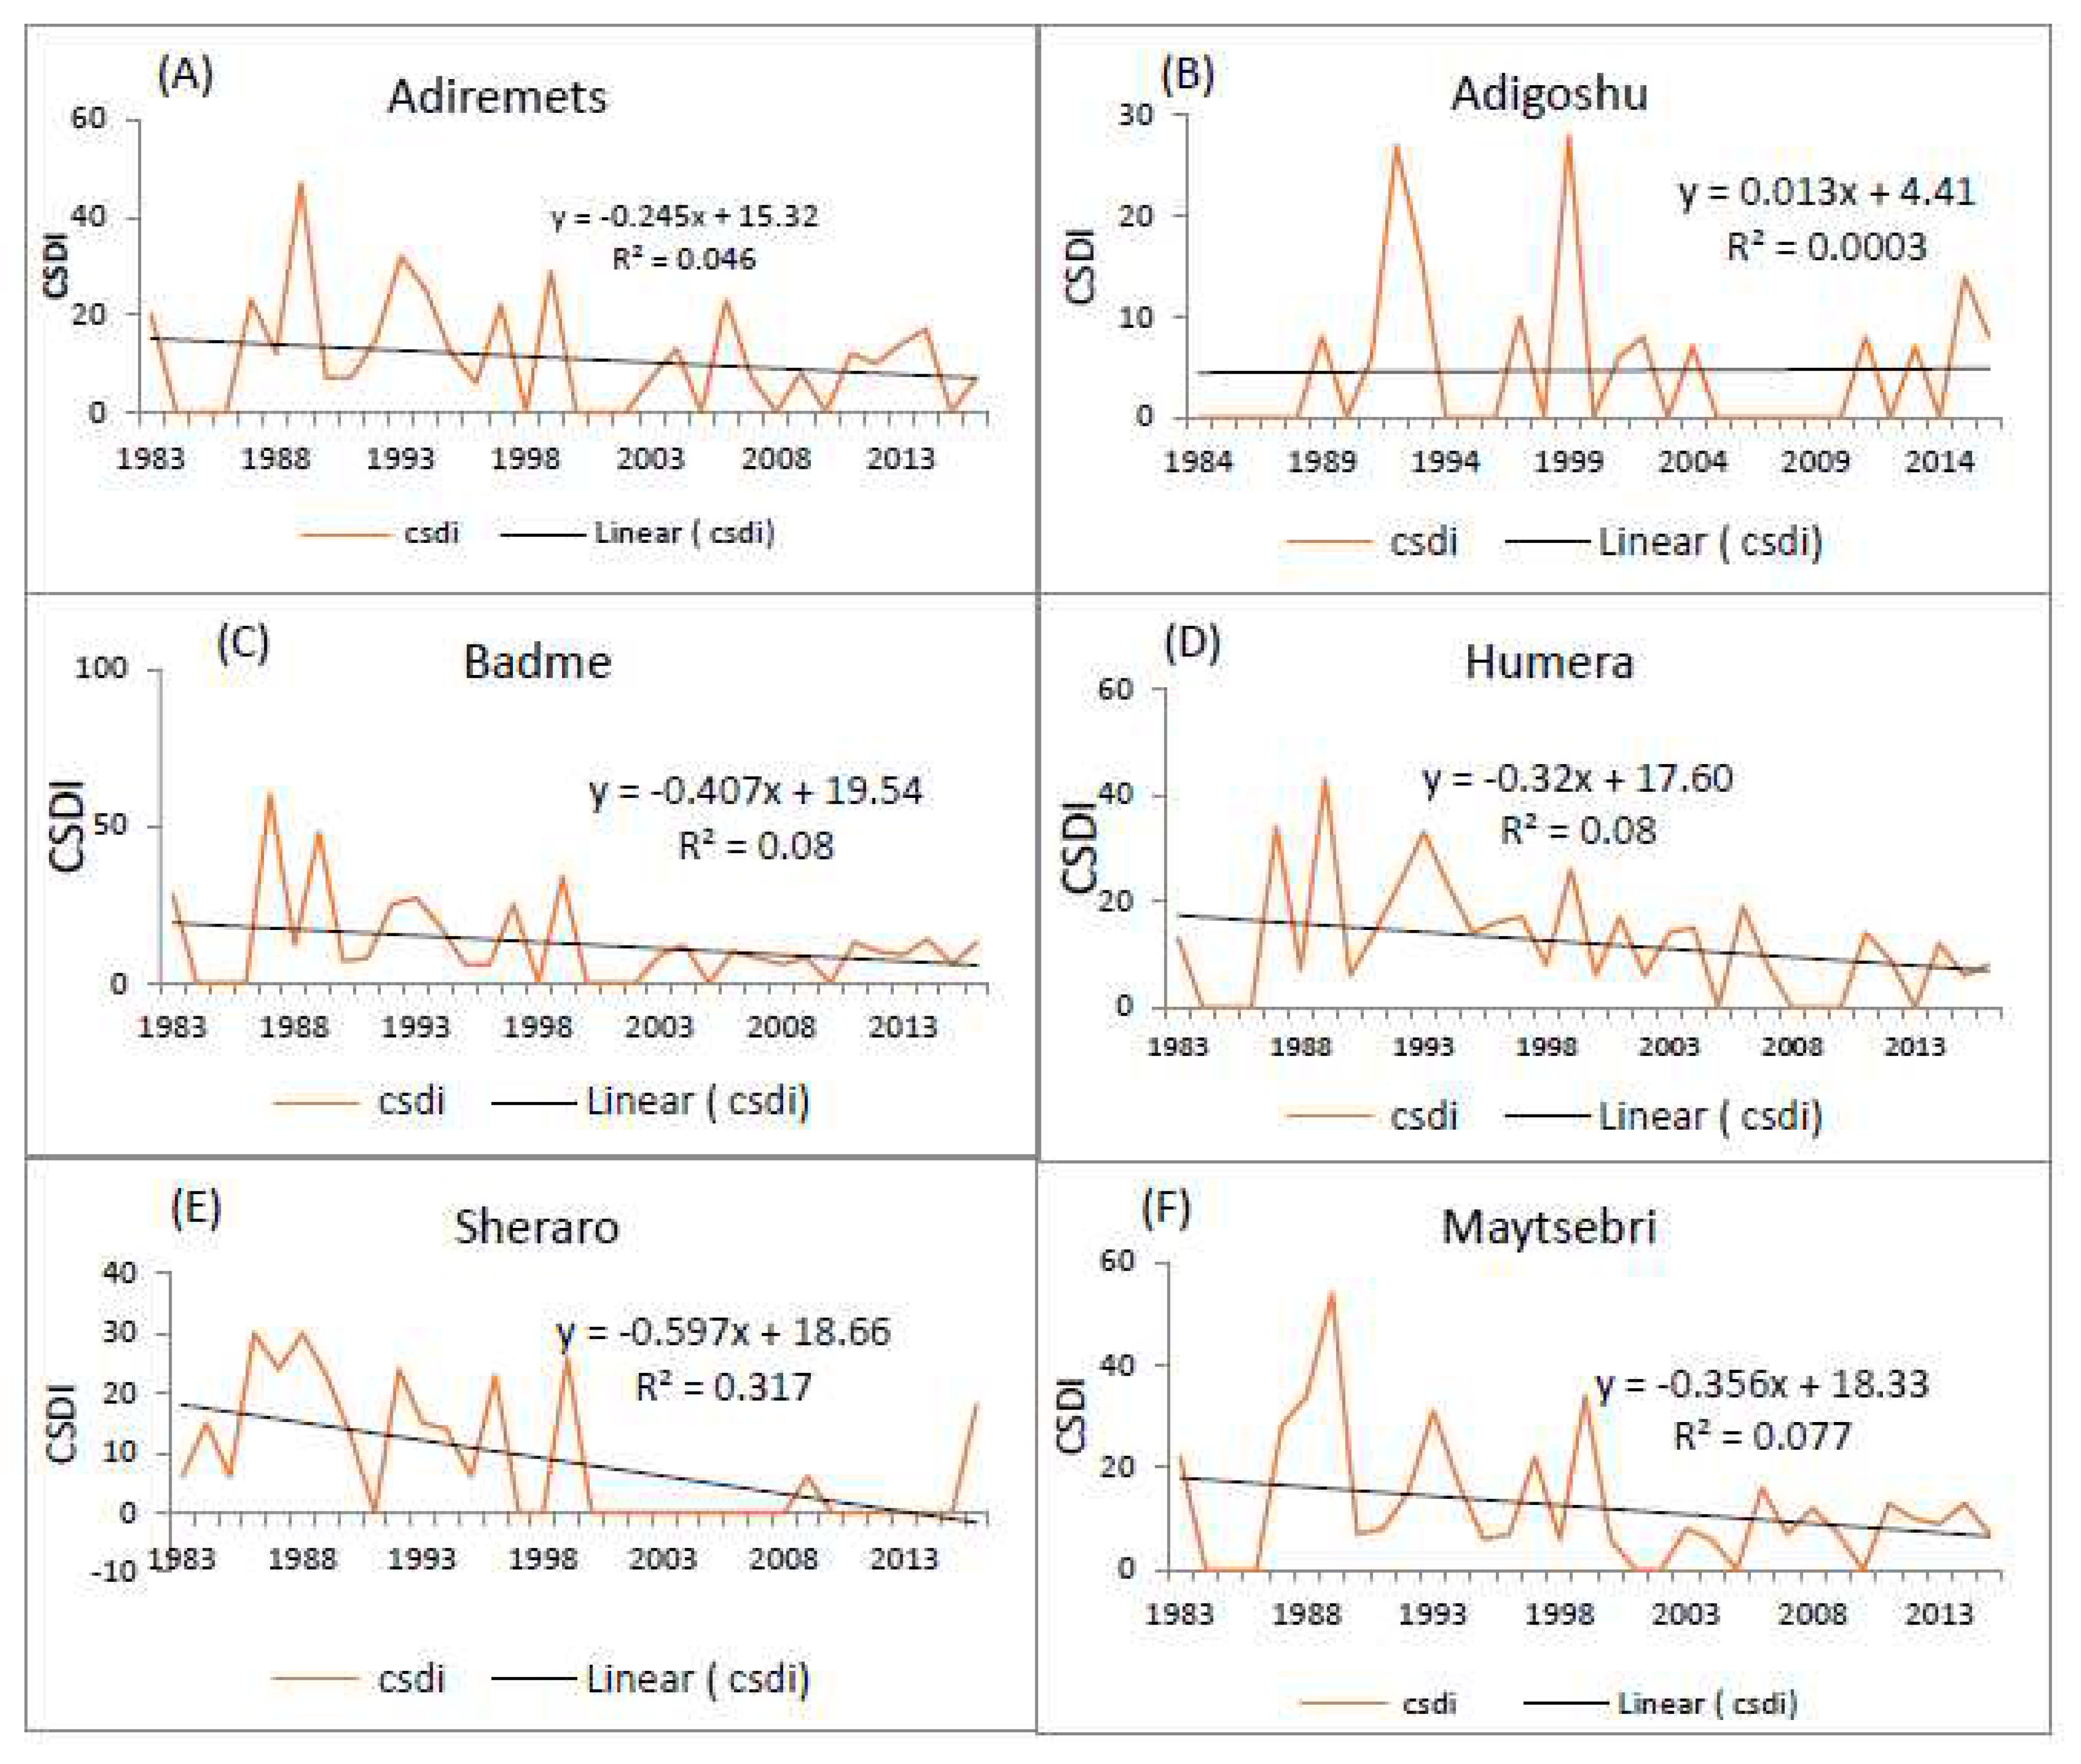
Figure 8.
Monthly (A) cold days (TX10P) and (B) cold nights (TN10P) of nine stations averaged from 1983 to 2016.
Figure 8.
Monthly (A) cold days (TX10P) and (B) cold nights (TN10P) of nine stations averaged from 1983 to 2016.
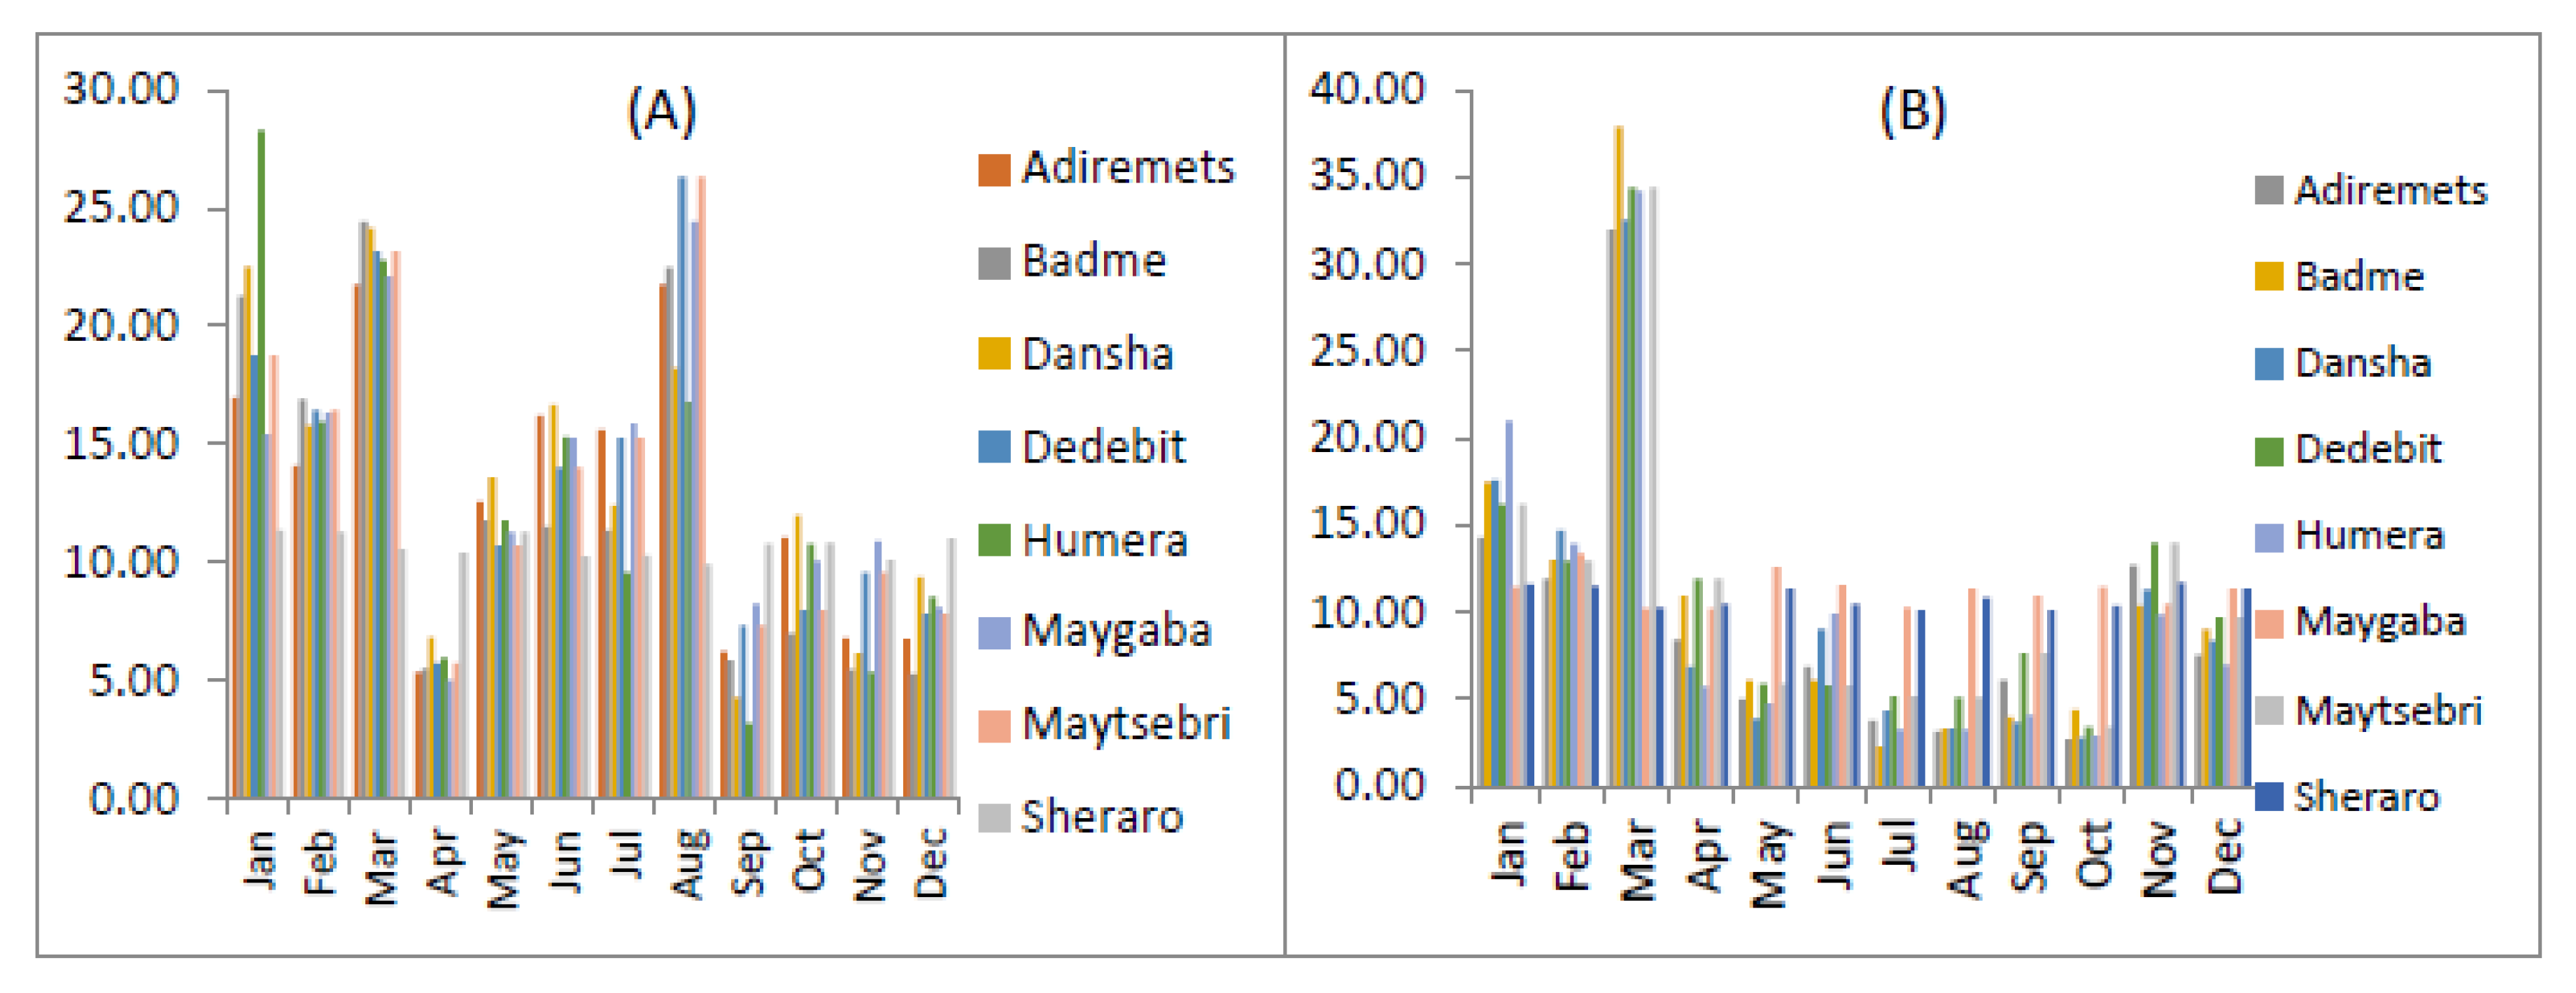
Figure 9.
(A) monthly average monthly warm days (TX90P) and (B) monthly average monthly warm nights (TN90P) from 1983 to 2016.
Figure 9.
(A) monthly average monthly warm days (TX90P) and (B) monthly average monthly warm nights (TN90P) from 1983 to 2016.
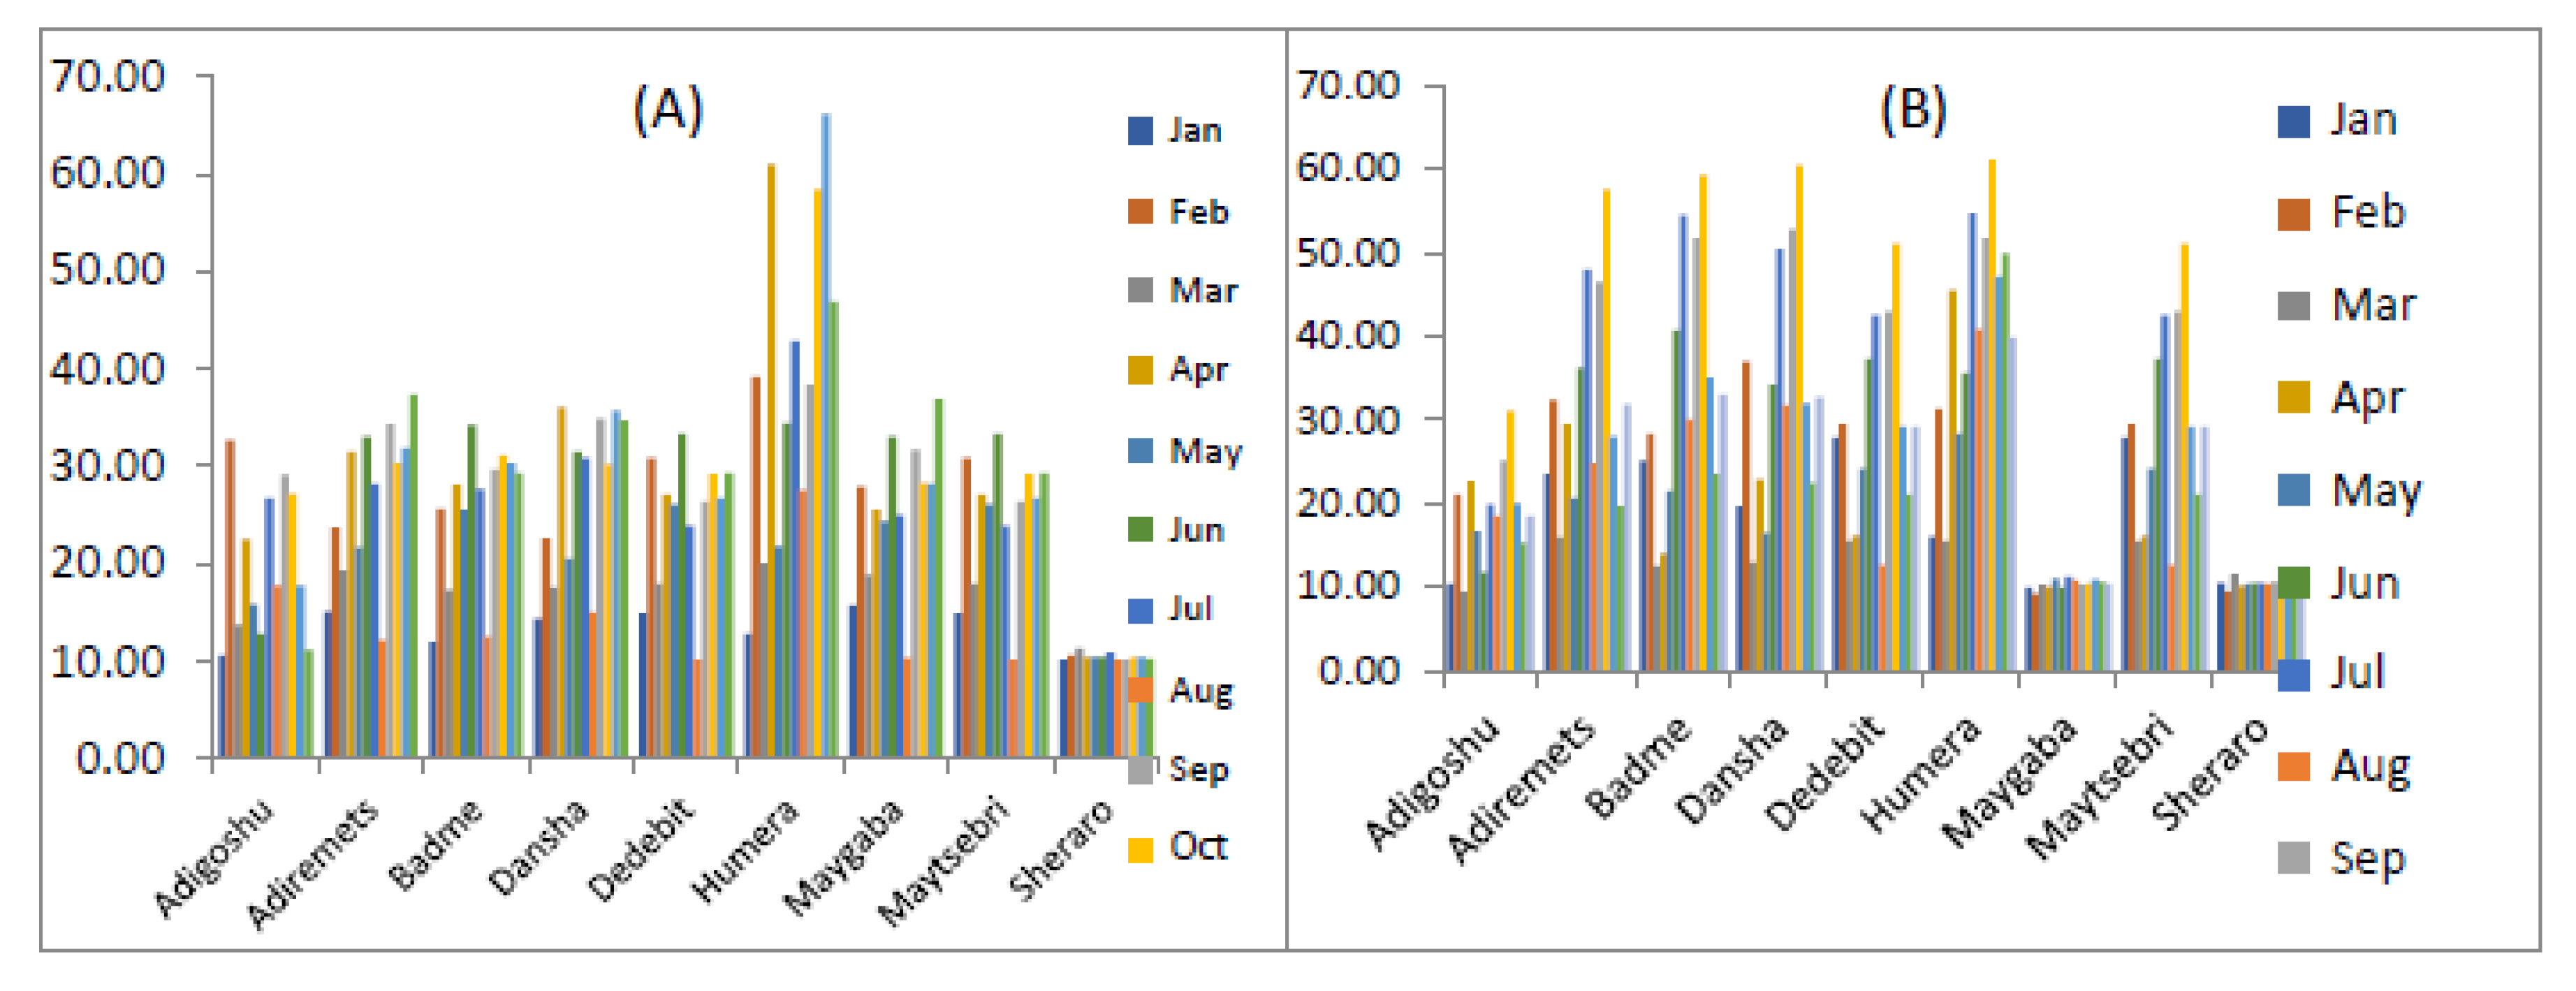
Figure 10.
Spatial variability on extreme temperature indices over study area from 1983-2016.
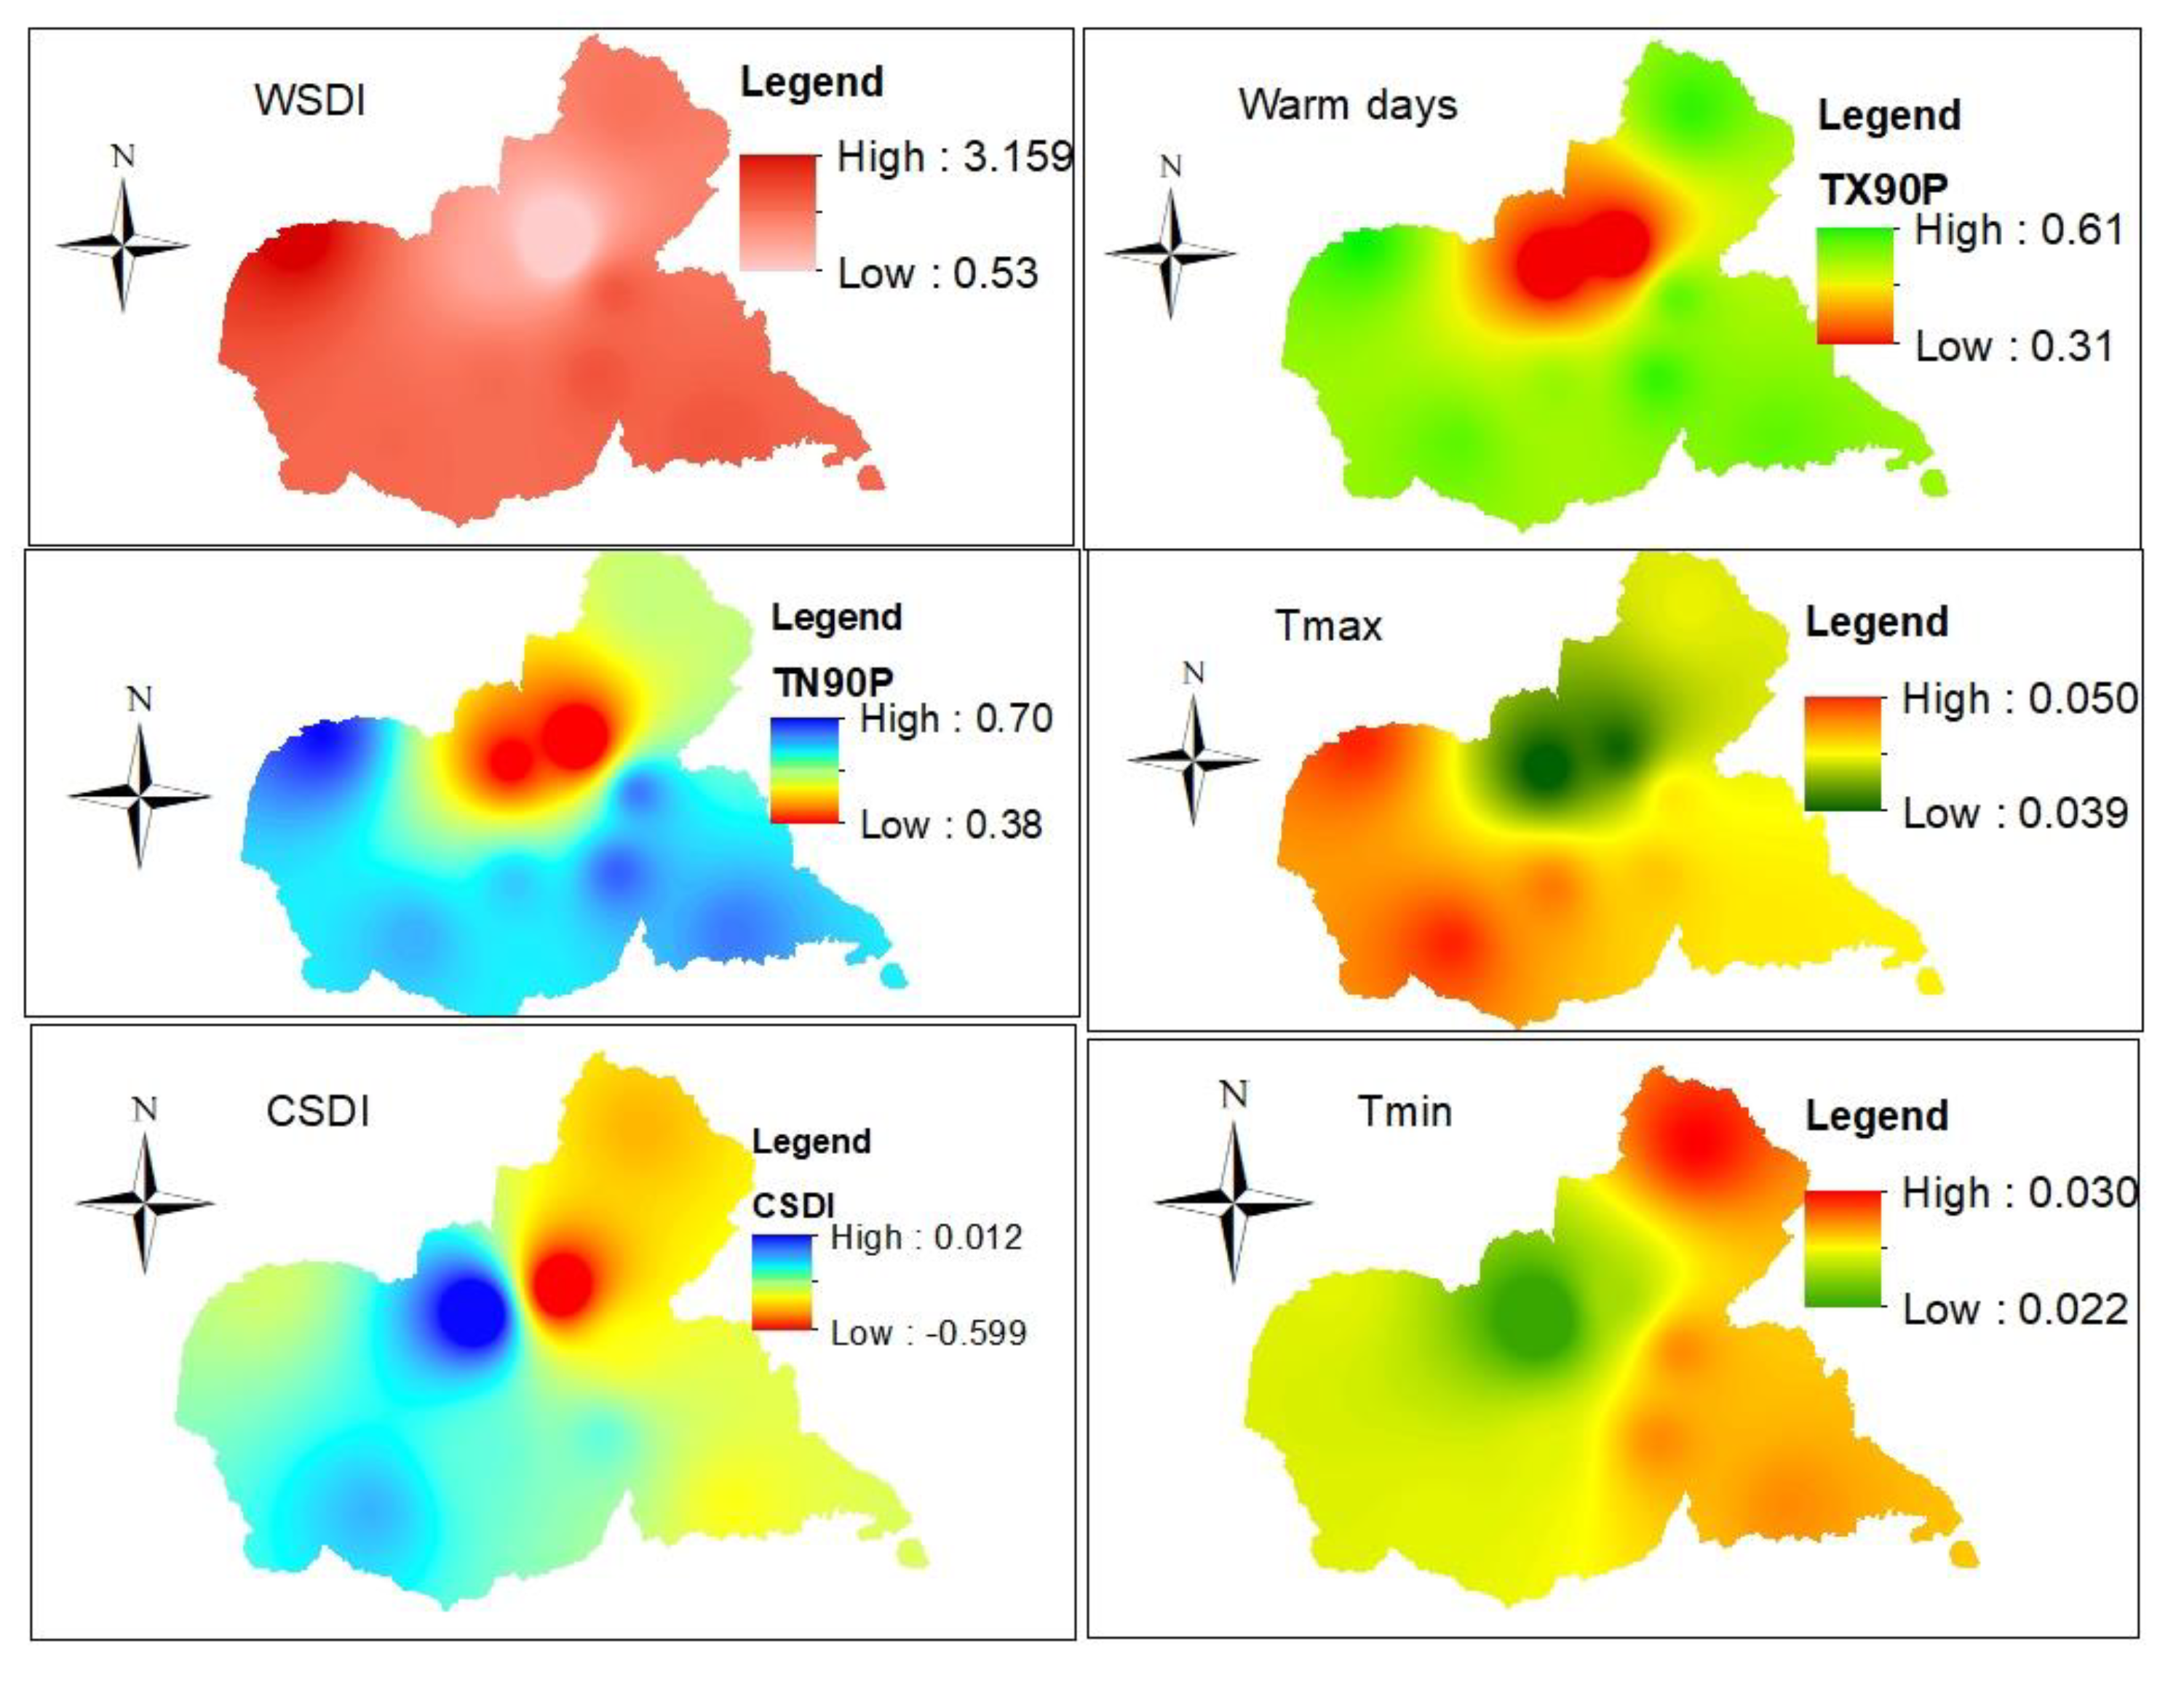
Figure 11.
Mean annual and monthly variability of rainfall of the study area from 1983 to 2016.
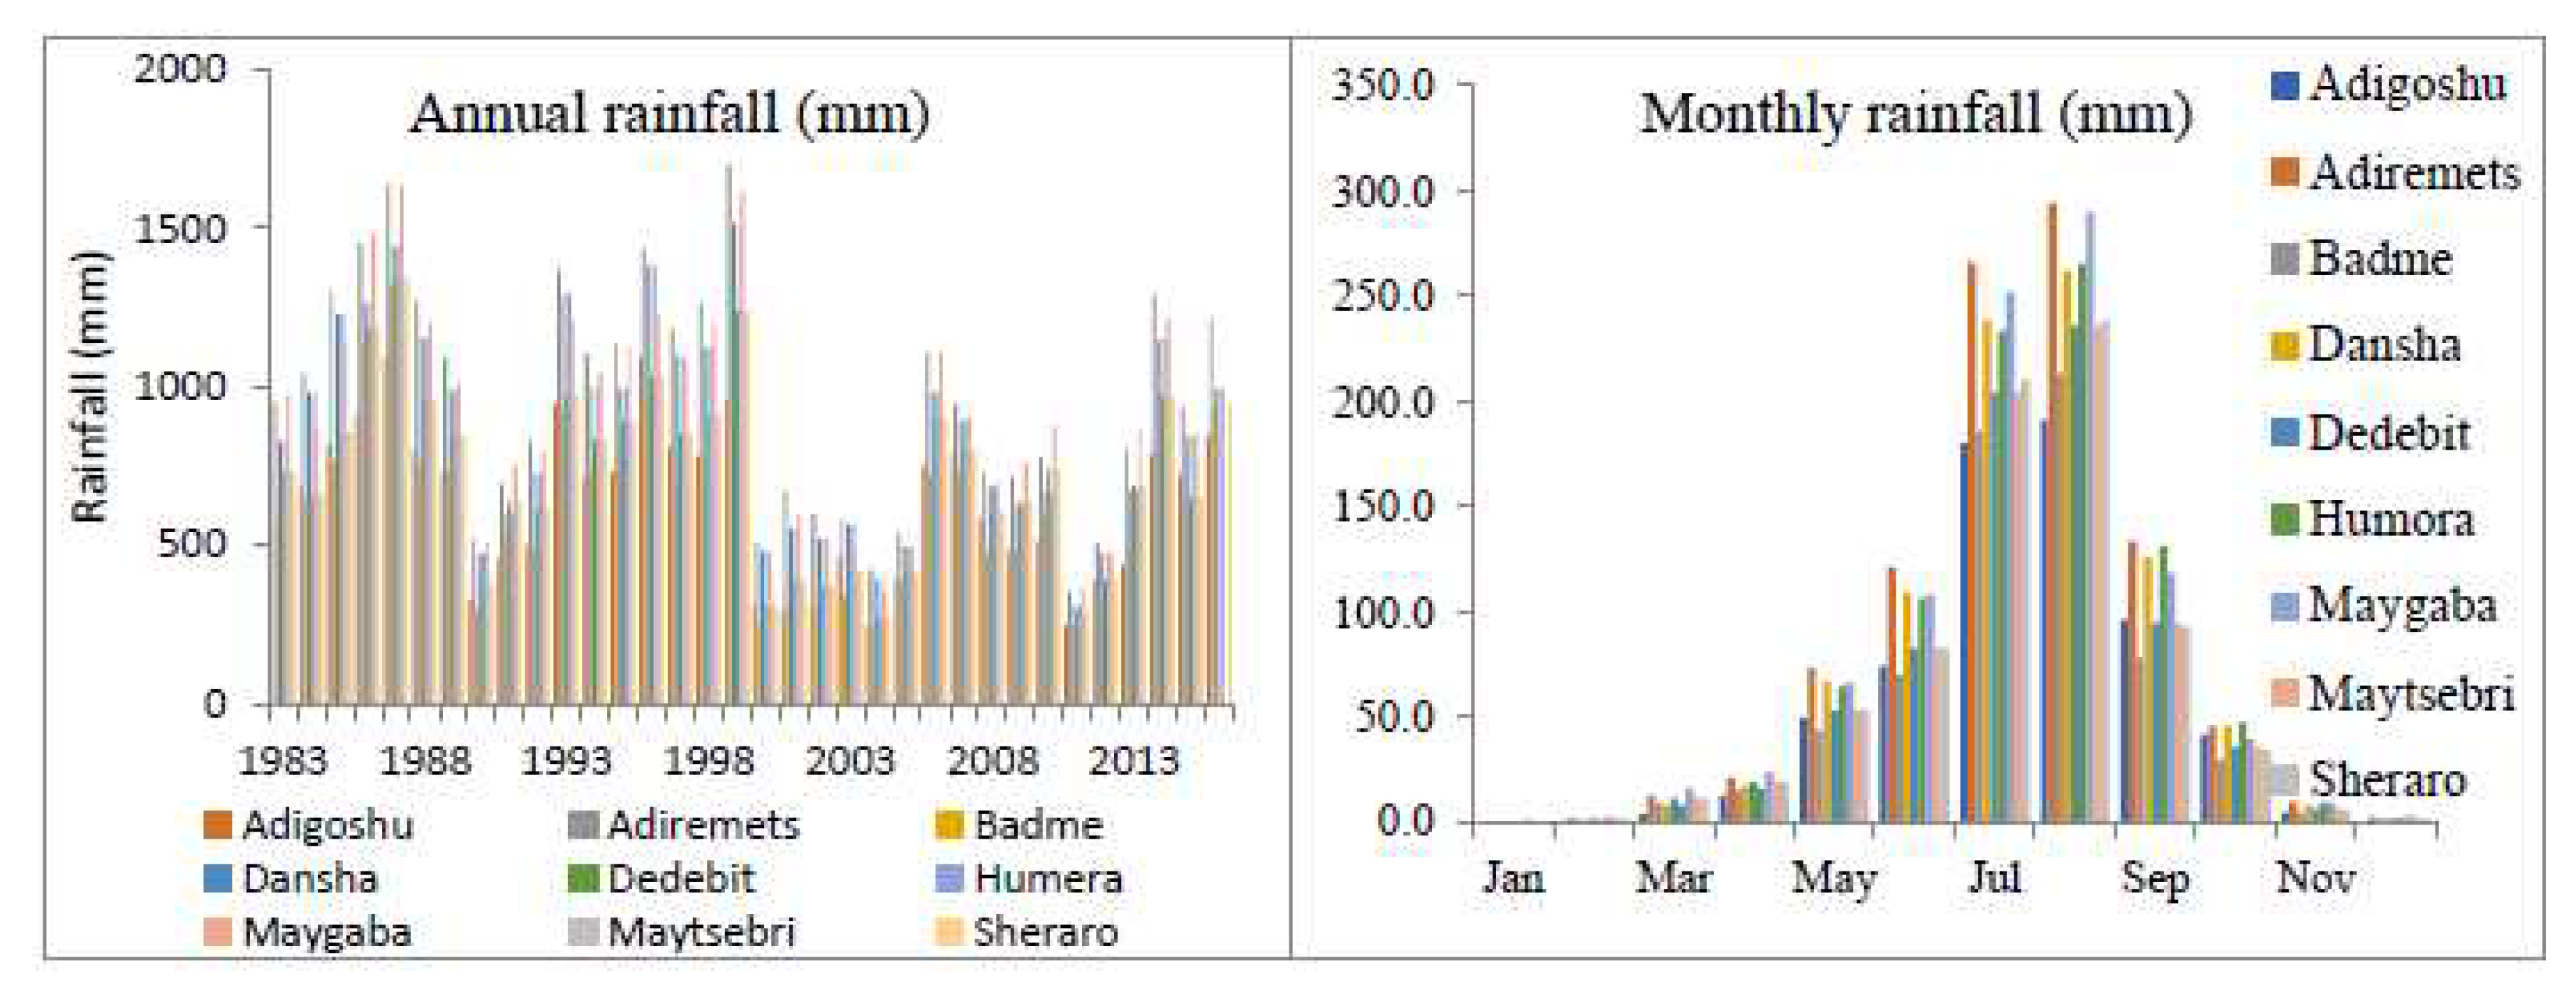
Figure 12.
SDII of the study area from 1983-2016.
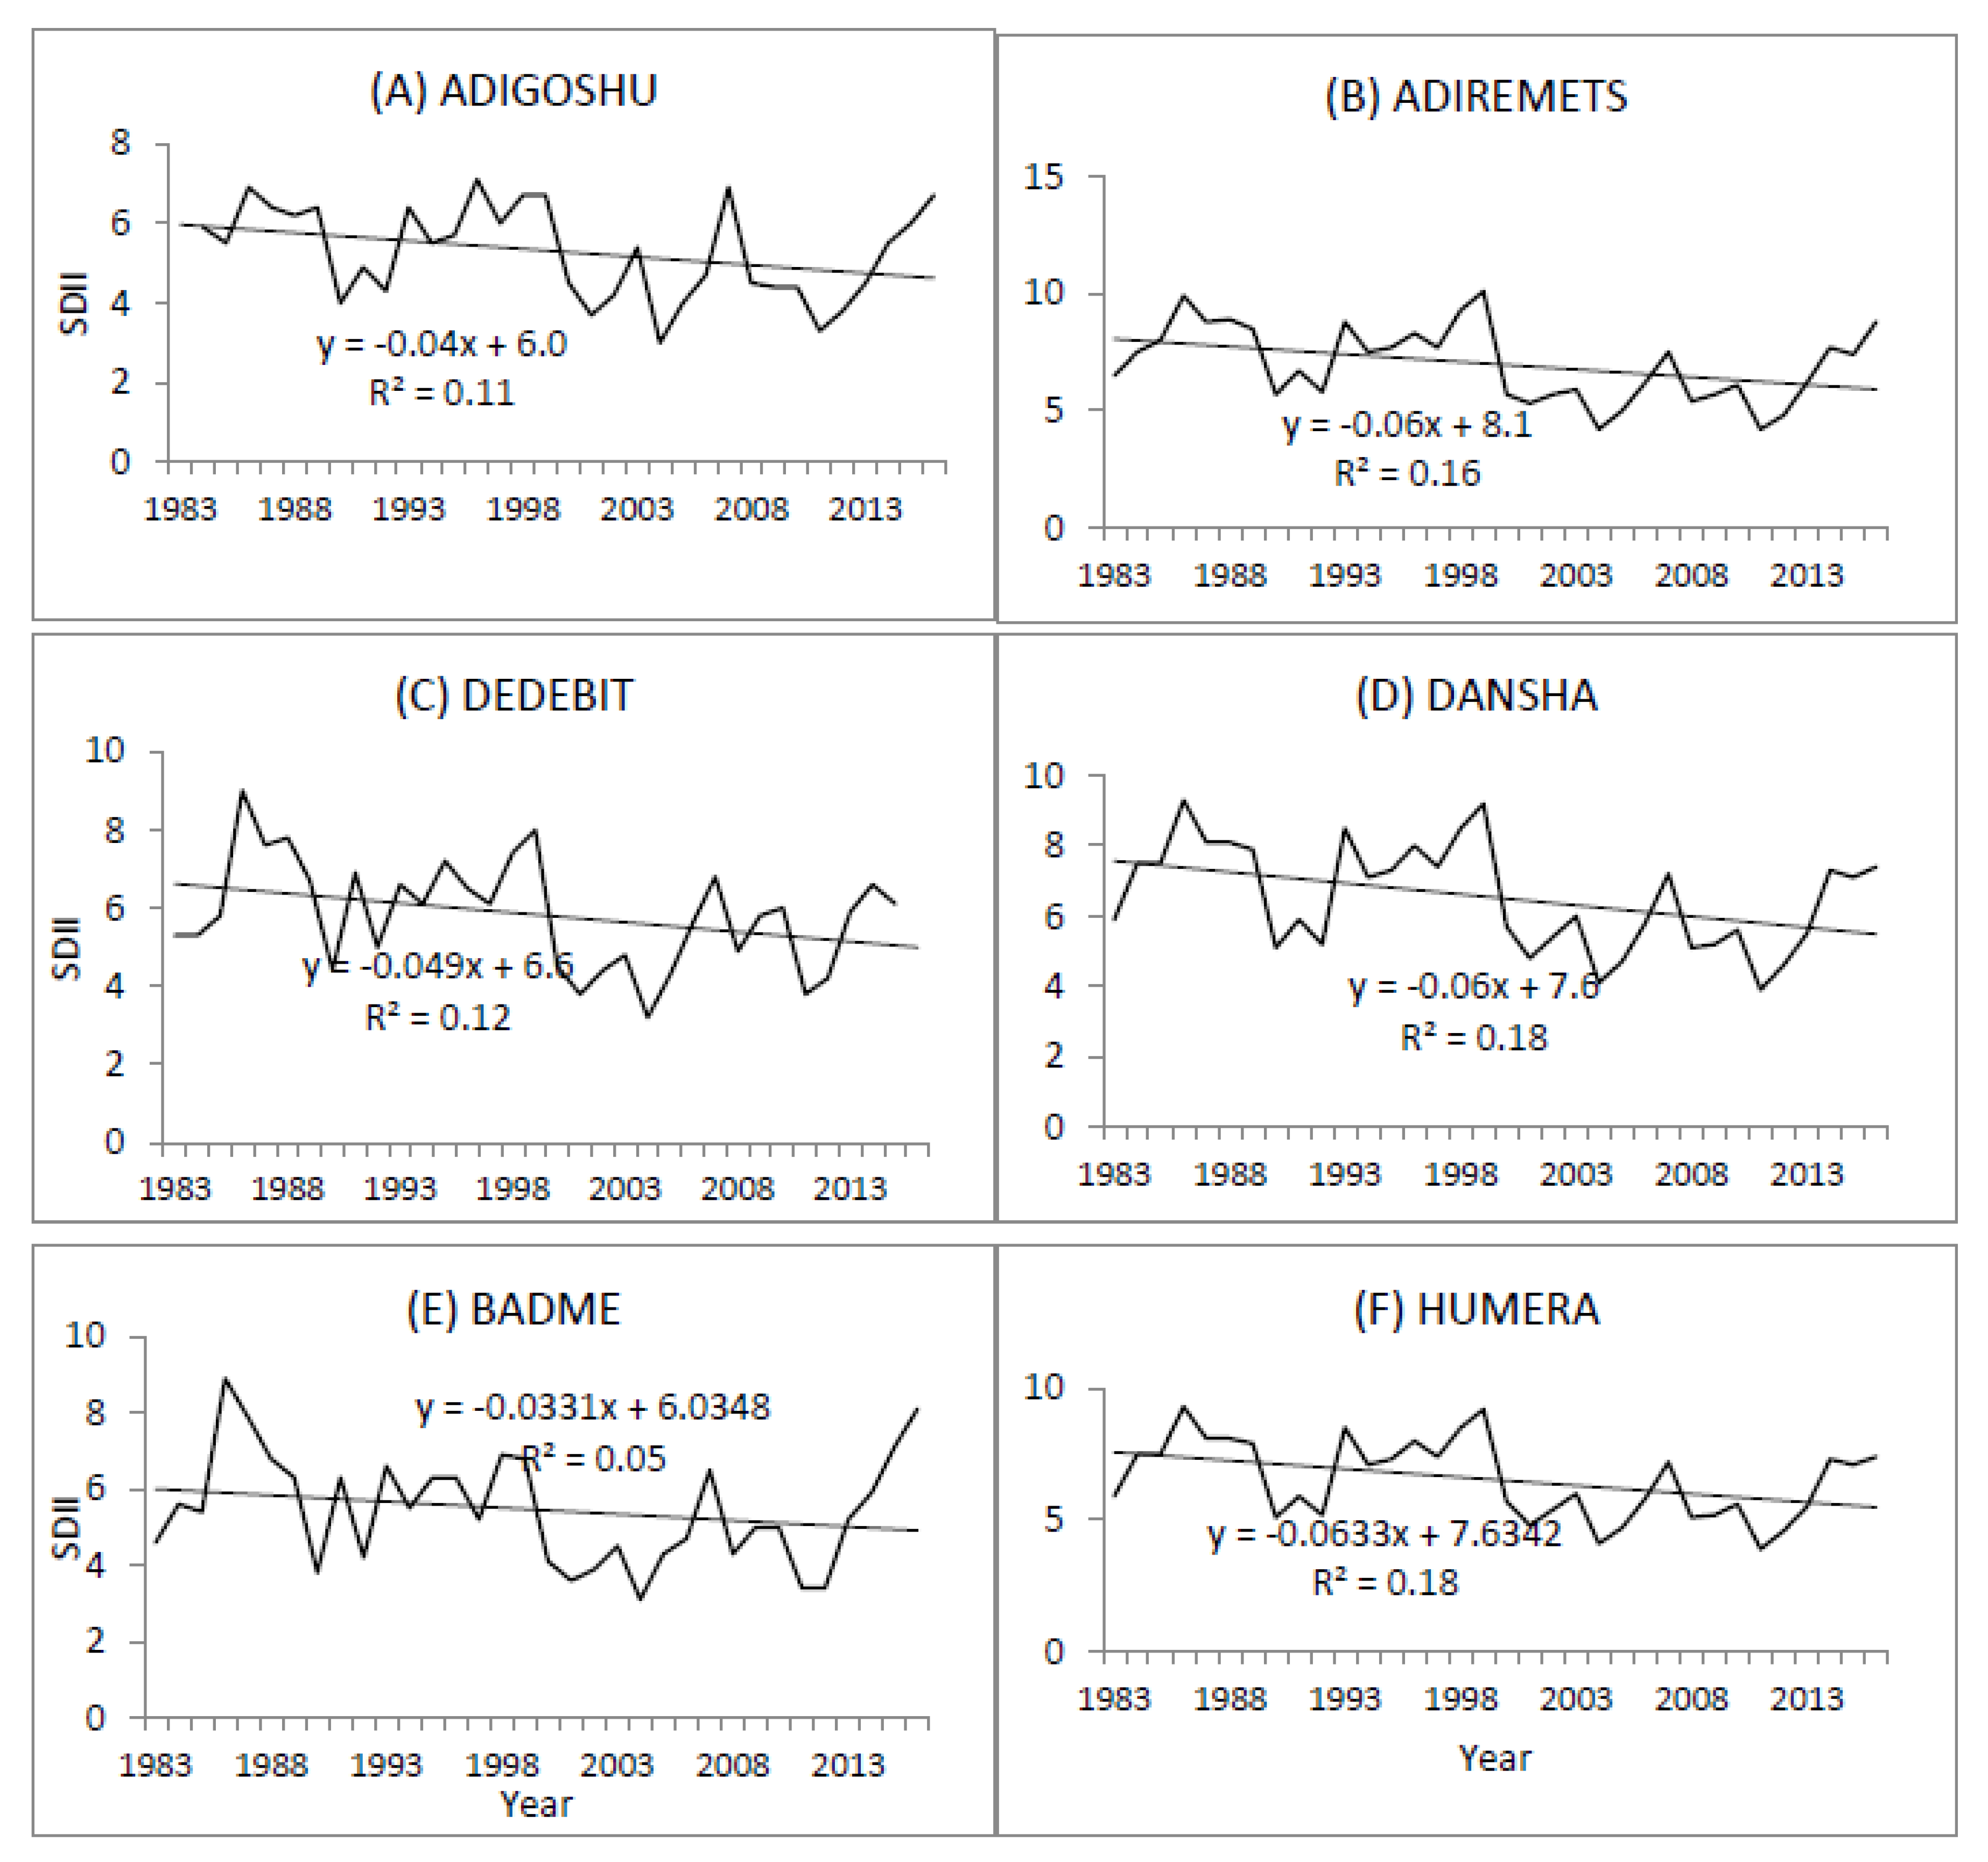
Figure 13.
Monthly Rx1day and Rx5day of the study areas during the short and main rainy seasons.
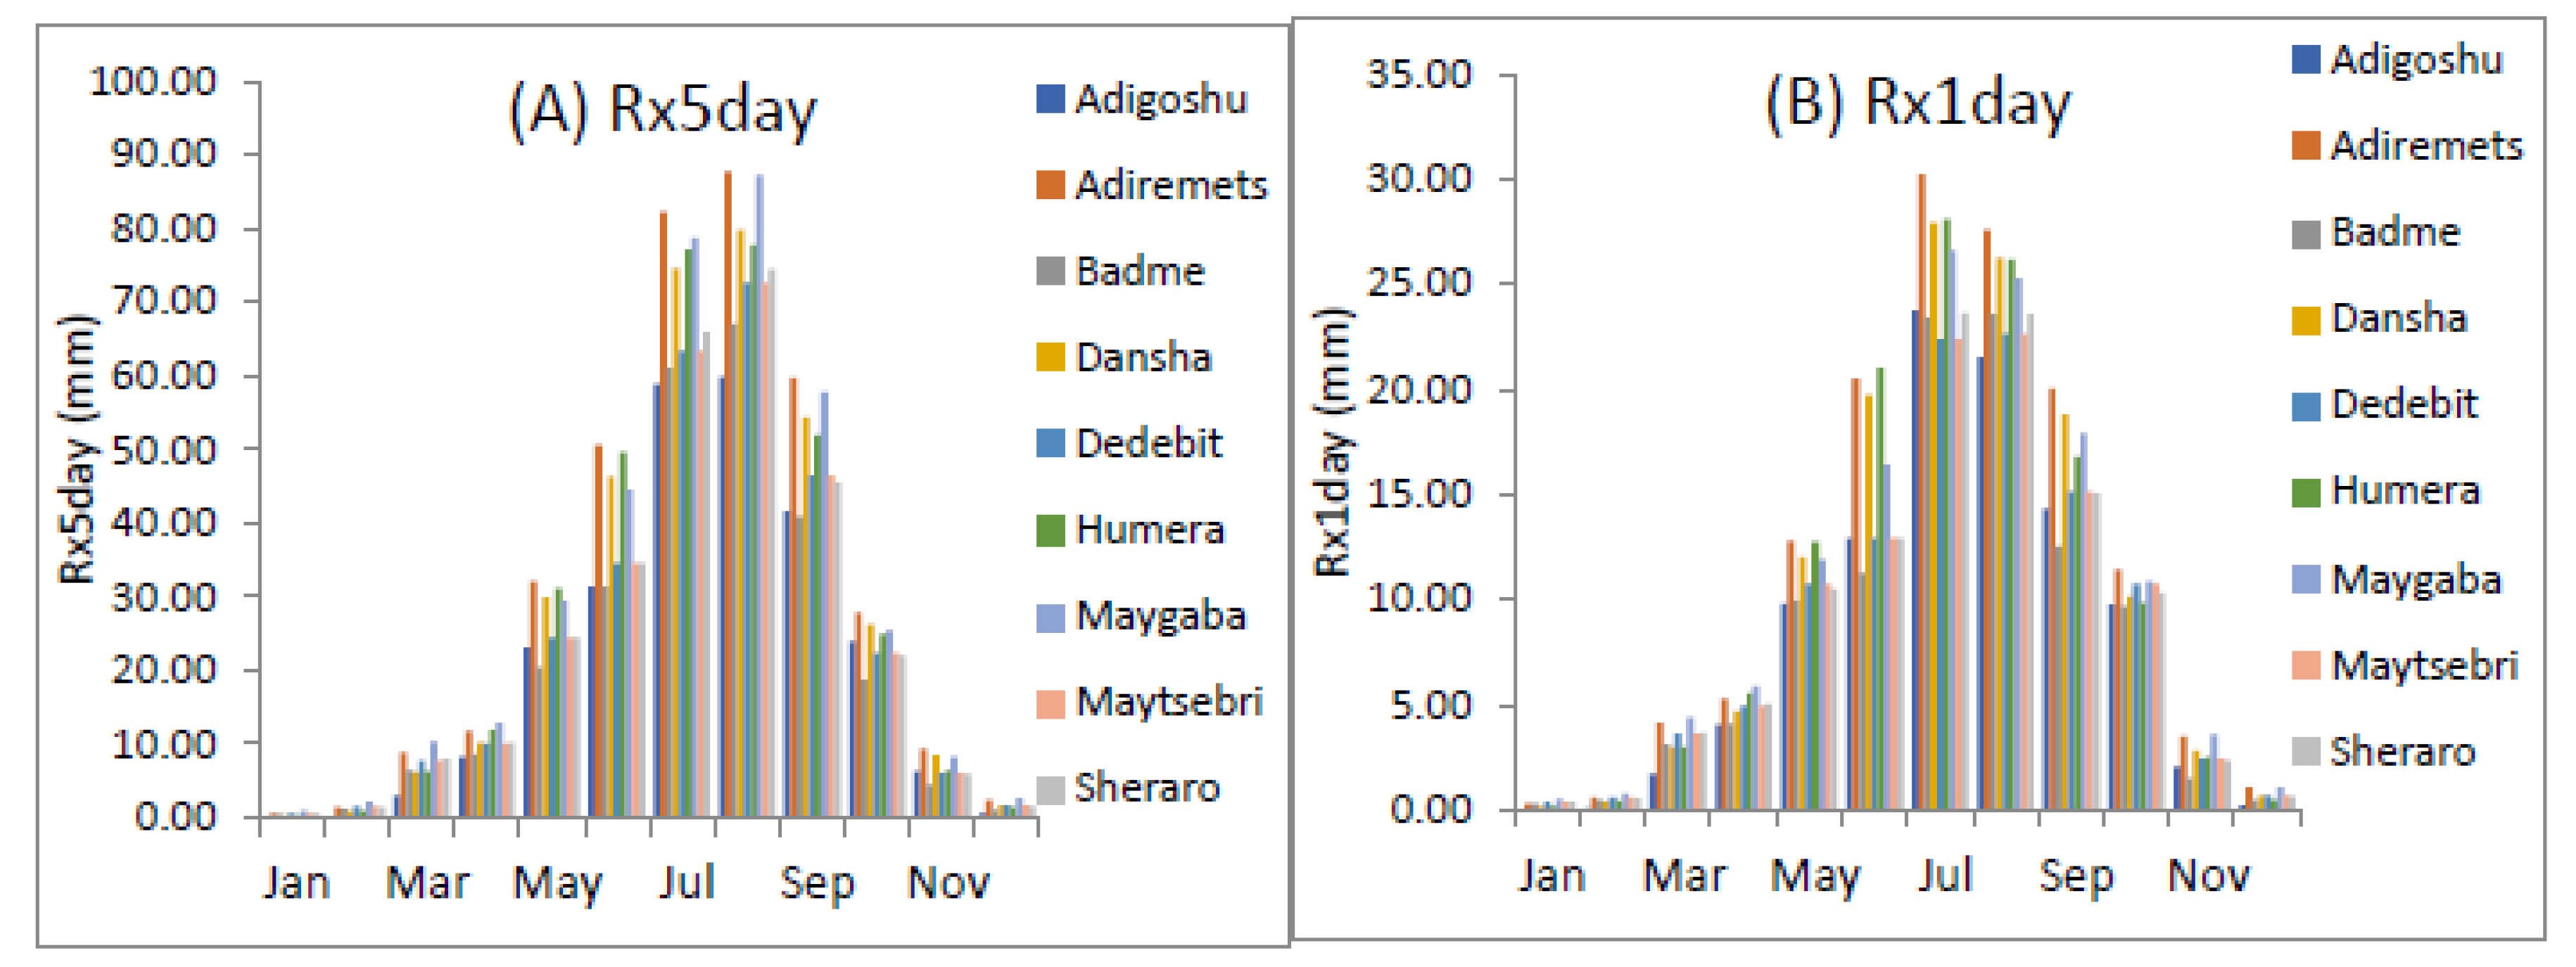
Figure 14.
Spatial variability on extreme rainfall indices over study area since 1983-2016.
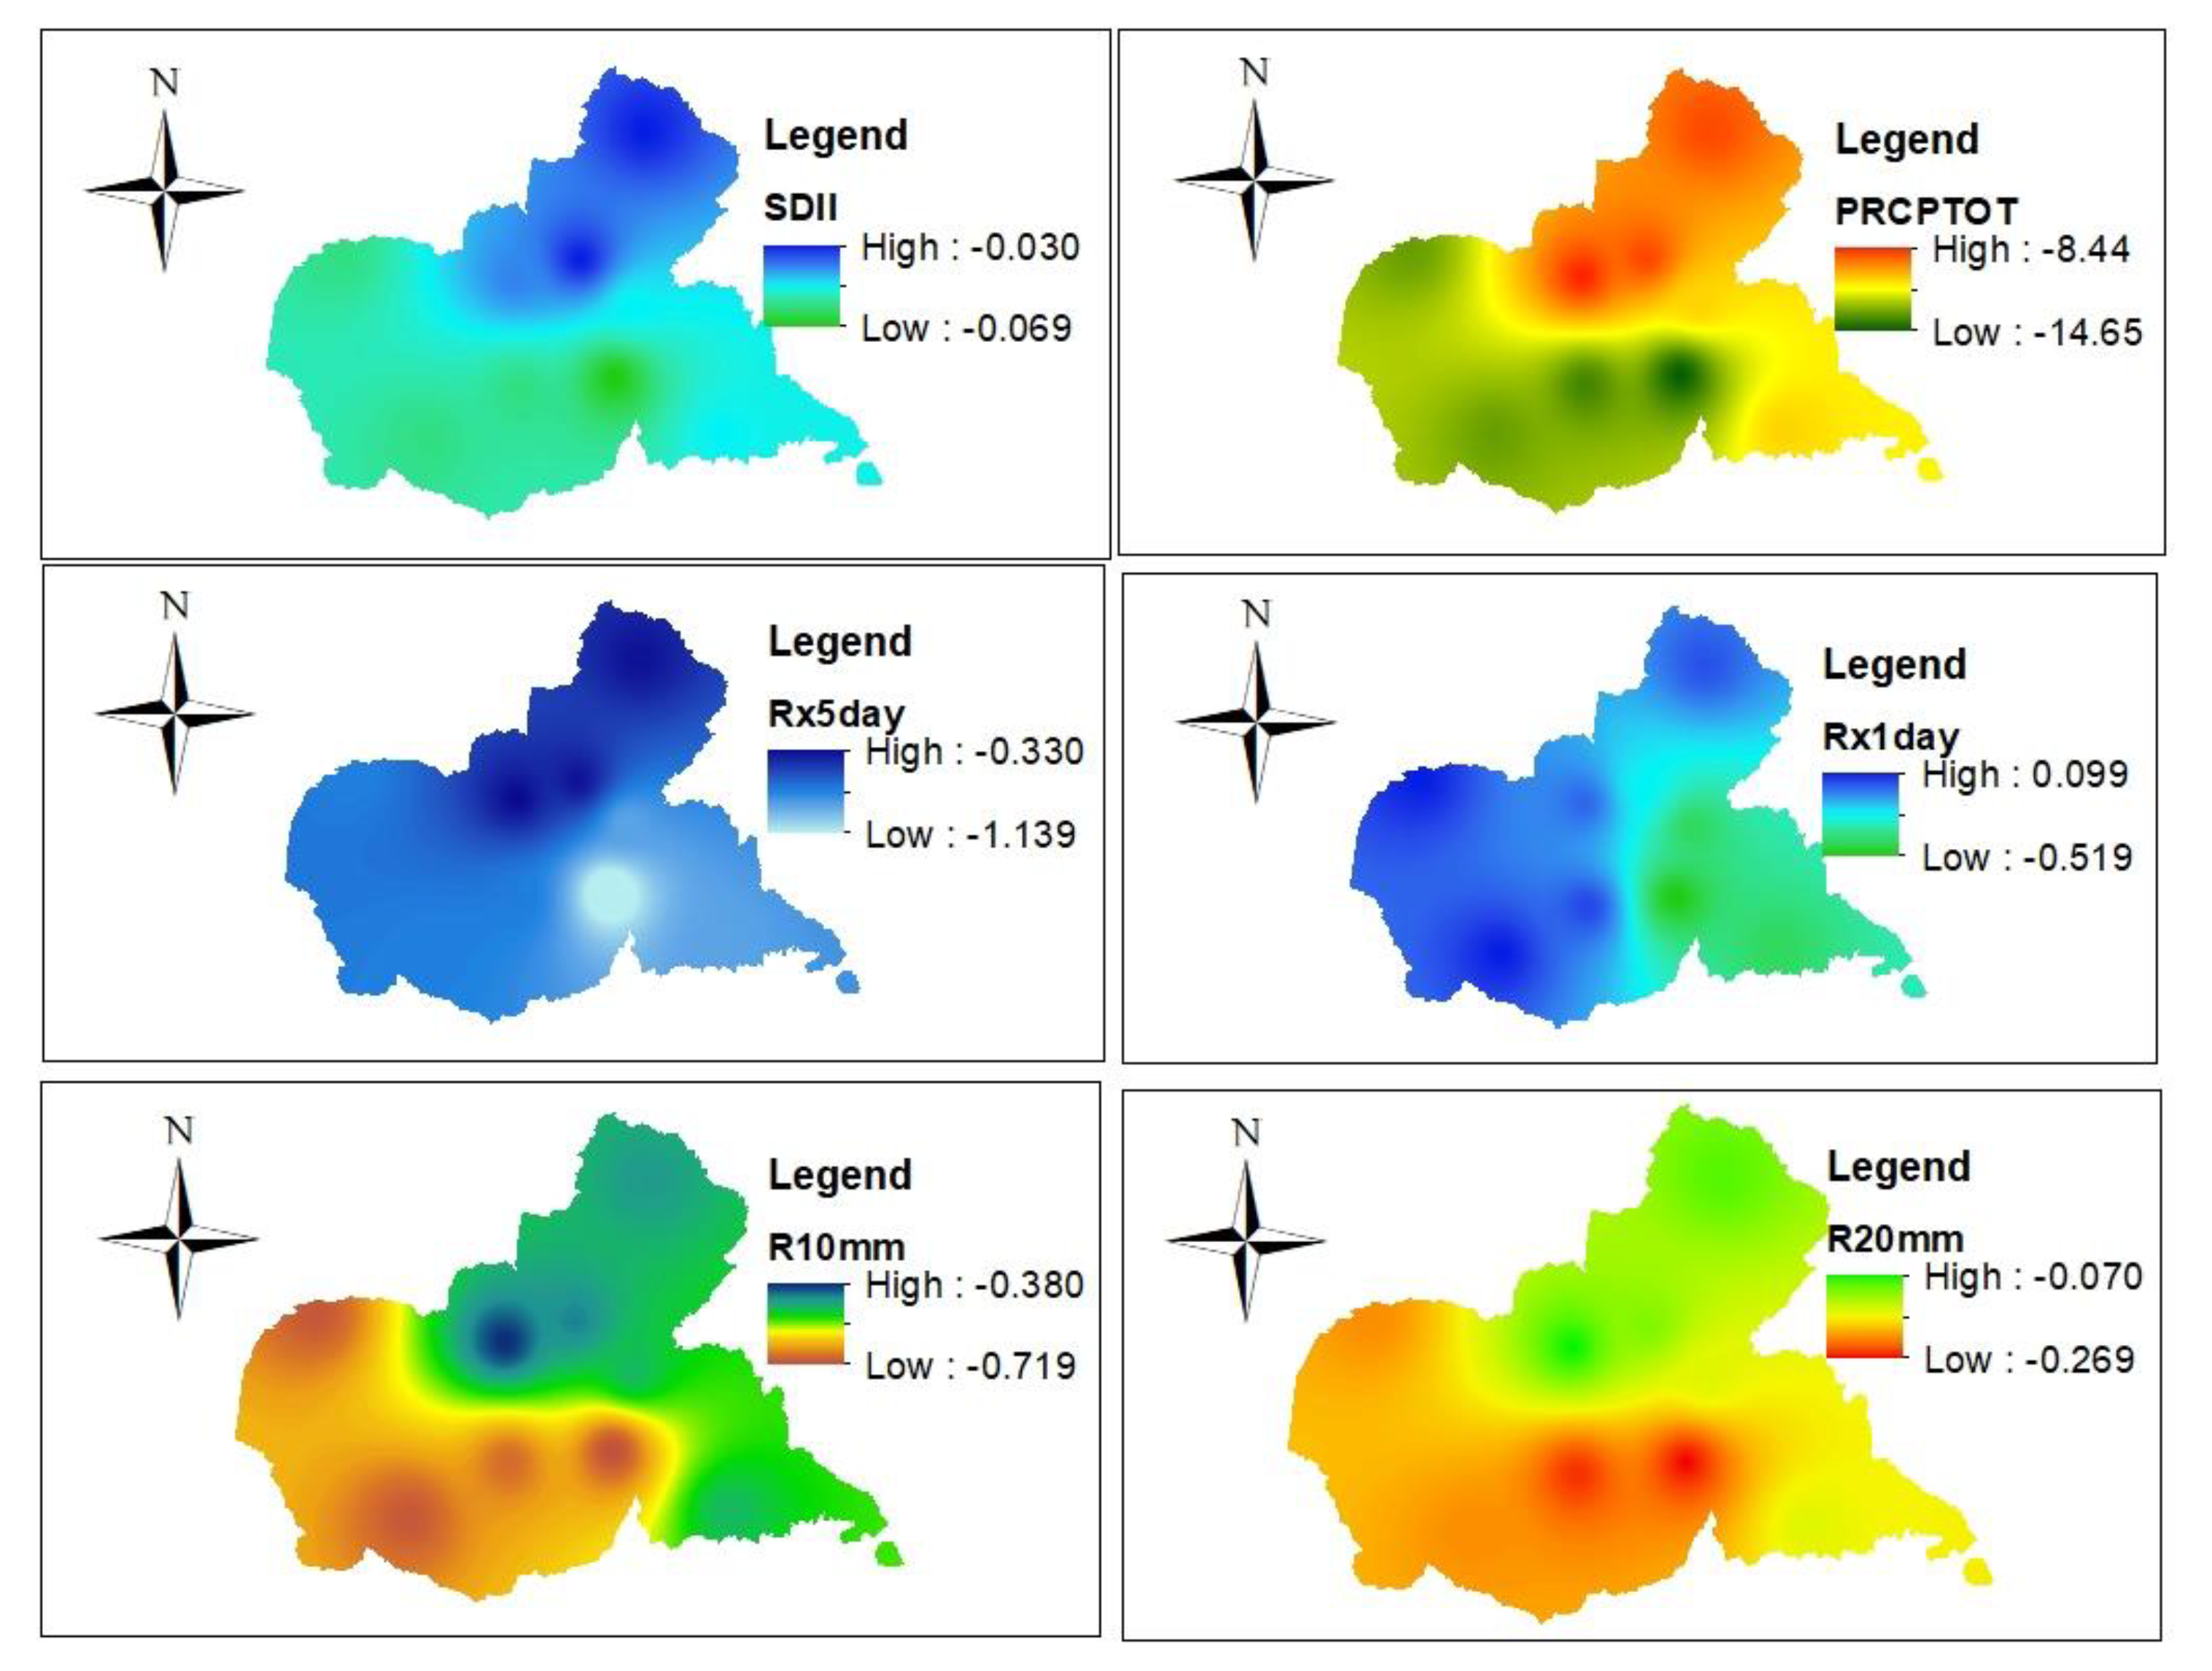

Table 1.
Geographical location, data type, and database availability of the study area.
| Weather station | Elevation (m) | Latitude (Decimal) |
Longitude (Decimal) |
Data Availability |
| Sheraro | 1031 | 14.240 | 37.555 | 1983-2016 |
| Badme | 1080 | 14.725 | 37.804 | 1983-2016 |
| Humera | 600 | 14.580 | 36.62 | 1983-2016 |
| Adiremets | 2014 | 13.751 | 37.324 | 1983-2016 |
| Dansha | 780 | 13.540 | 36.969 | 19832016 |
| Adigoshu | 1115 | 14.167 | 37.306 | 1984-2016 |
| Dedebit | 897 | 14.068 | 37.760 | 1983-2015 |
| Maytsebri | 1350 | 13.586 | 38.143 | 1983-2015 |
| Maygaba | 914 | 13.793 | 37.690 | 1983-2015 |
Table 2.
List of temperature and rainfall indices.
| ID | Indicator name | Definition | Units |
| Temperature indices | |||
| TXx | Max Tmax | Monthly maximum value of daily maximum temperature | 0C |
| TNx | Max Tmin | Monthly maximum value of daily minimum temperature | 0C |
| TXn | Min Tmax | Monthly minimum value of daily maximum temperature | 0C |
| TNn | Min Tmin | Monthly minimum value of daily minimum temperature | 0C |
| TN10p | Cool nights | Percentage of days when TN<10th percentile | Day |
| TX10p | Cool days | Percentage of days when TX<10th percentile | Day |
| TN90p | Warm nights | Percentage of days when TN>90th percentile | Day |
| TX90P | Warm days | Percentage of days when TX>90th percentile | Day |
| WSDI | Warm spell duration indicator | Annual count of days with at least 6 consecutive days when TX >90th percentile | Day |
| DTD | Diurnal temperature range | Monthly mean difference between the maximum and minimum temperatures | 0C |
| CSDI | Cold spell duration indicator | Annual count of days with at least 6 consecutive days when TN<10th percentile | Day |
| Rainfall indices | |||
| RX1day | Max 1-day precipitation amount | Monthly maximum 1-day precipitation | mm |
| RX5day | Max-5day precipitation amount | Monthly maximum consecutive 5-day precipitation | mm |
| R10mm | Number of heavy precipitation days | Annual count of days when PRCP=10mm | Day |
| R20mm | Number of very heavy precipitation days | Annual count of days when PRCP=20mm | Day |
| CDD | Consecutive dry days | Maximum number of consecutive days with RR>=1mm | Day |
| CWD | Consecutive wet days | Maximum number of days with RR>=1mm | Day |
| R95p | Very wet days | Annual total PRCP when RR>95th percentile | Day |
| PRCPTOT | Total precipitation | Annual total PRCP in wet days (RR>=1mm) | mm |
Table 3.
Trends on extreme temperature in the Western Tigray.
| Station | TR20 | TN10P | TX10P | TN90P | TX90P | WSDI | CSDI | DTR |
| Adigoshu | 0.58 | -0.29 | -0.23 | 0.33 | 0.43 | 1.52 | 0.013 | 0.017 |
| Adiremets | 1.8 | -0.31 | -0.41 | 0.56 | 0.64 | 2.18 | -0.25 | 0.023 |
| Badime | 2.14 | -0.36 | -0.44 | 0.61 | 0.57 | 2.1 | -0.41 | 0.014 |
| Dansha | 1.86 | -0.33 | -0.39 | 0.59 | 0.65 | 2.23 | -0.19 | 0.025 |
| Dedebit | 1.9 | -0.38 | -0.45 | 0.59 | 0.67 | 2.39 | -0.36 | 0.016 |
| Humera | 1.86 | -0.38 | -0.37 | 0.62 | 0.71 | 3.16 | -0.32 | 0.024 |
| Maygaba | 0.99 | -0.35 | -0.46 | 0.61 | 0.68 | 2.43 | -0.25 | 0.018 |
| Maytsebri | 1.9 | -0.38 | -0.46 | 0.59 | 0.67 | 2.39 | -0.36 | 0.016 |
| Sheraro | 1.69 | -0.44 | -0.32 | 0.31 | 0.38 | 0.53 | -0.60 | 0.013 |
Table 4.
trends on maximum (Tmax) and minimum (Tmin) temperature.
| Station | Tmax (0C) | Tmin (0C) | ||
| Adigoshu | 0.040* | 0.022** | ||
| Adiremets | 0.049** | 0.027** | ||
| Badme | 0.045* | 0.031** | ||
| Dansha | 0.051** | 0.027** | ||
| Dedebit | 0.046** | 0.029** | ||
| Humera | 0.051** | 0.027** | ||
| Maygaba | 0.047** | 0.029** | ||
| Maytsebri | 0.046** | 0.029** | ||
| Sheraro | 0.040* | 0.026** | ||
Note: significance level at p<0.05 (*) and p<0.01 (**).
Table 5.
Trends on extreme rainfall indices of the study areas from 1983-2016.
| Station | PRCPTOT | SDII | Rx1day | Rx5day |
| Adigoshu | -8.4ns | -0.04ns | -0.013 | -0.33 |
| Adiremets | -13.8* | -0.06* | 0.037 | -0.65 |
| Badme | -8.8ns | -0.03ns | 0.02 | -0.35 |
| Dansha | -13.3* | -0.06* | 0.10 | -0.66 |
| Dedebit | -10.9* | -0.05* | -0.42 | -0.78 |
| Humera | -13.3* | -0.06* | 0.10 | -0.66 |
| Maygaba | -14.6* | -0.07* | -0.52* | -1.14* |
| Maytsebri | -10.9* | -0.05* | -0.42 | -0.78 |
| Sheraro | -8.826ns | -0.03ns | -0.21 | -0.35 |
Significant at p<0.05 (*) non-significant (ns). Rx1Day and Rx5Day were ns except at Maygaba.
Disclaimer/Publisher’s Note: The statements, opinions and data contained in all publications are solely those of the individual author(s) and contributor(s) and not of MDPI and/or the editor(s). MDPI and/or the editor(s) disclaim responsibility for any injury to people or property resulting from any ideas, methods, instructions or products referred to in the content. |
© 2023 by the authors. Licensee MDPI, Basel, Switzerland. This article is an open access article distributed under the terms and conditions of the Creative Commons Attribution (CC BY) license (http://creativecommons.org/licenses/by/4.0/).
Copyright: This open access article is published under a Creative Commons CC BY 4.0 license, which permit the free download, distribution, and reuse, provided that the author and preprint are cited in any reuse.


