Submitted:
03 January 2026
Posted:
05 January 2026
You are already at the latest version
Abstract
Connecting rod bushings are core friction-pair components in diesel engine crank-connecting rod mechanisms, and their loosening failure—causing lubrication failure, accelerated wear, and even catastrophic damage. To address this critical issue, this study systematically investigates the influence of key structural parameters (inner diameter, wall thickness, width) on the retention force of the bushing’s interference fit. Through a combination of theoretical analysis, finite element analysis (FEA), and experiments, the safe interference range for typical bushing geometries is determined to be 0.08–0.11 mm (corresponding to a retention force range of 33.61–46.25 kN). Further parametric studies reveal that the retention force decreases with increasing inner diameter while increasing significantly with greater wall thickness and width, with wall thickness identified as the most influential parameter. For bushings featuring a large inner diameter, thin wall, and narrow width, stricter interference tolerance is required to ensure connection reliability. These findings establish a reliable parametric design framework, providing actionable engineering guidance for optimizing bushing structural design, controlling assembly processes, and mitigating loosening risks in similar heavy-duty equipment components.
Keywords:
connecting rod bushing
; interference-fit reliability
; retention force
; parametric design
; finite element analysis (FEA)
1. Introduction
Diesel engines, as core power units for heavy-duty vehicles, construction machinery, and marine equipment, their reliability is critical to overall system performance, operational safety, and industrial production efficiency[1,2,3,4]. A key component within these engines is the connecting rod bushing—a vital friction-pair element in the crank-connecting rod mechanism that performs the dual function of transmitting complex alternating loads and protecting the connecting rod small-end interface. The integrity of its interference-fit connection with the small end is fundamental to ensuring stable operational performance [5,6,7]. Under actual service conditions, the bushing endures continuous high temperatures, high pressures, and severe vibrations, which impose significant demands on its structural integrity and assembly stability. Despite its critical role, bushing loosening failures occur frequently in engineering practice: such failures not only precipitate lubrication failure and accelerated wear but may also trigger catastrophic events such as cylinder pounding [8,9,10,11]. Consequently, bushing loosening represents a key technical bottleneck impeding the development of highly reliable diesel engines.
To address this engineering challenge, scholars have conducted in-depth research from multiple perspectives. First, in the areas of interference-fit design and structural parameter optimization, studies have primarily focused on determining a reasonable interference range, optimizing key structural dimensions, and improving assembly processes [12,13,14,15,16]. As the core parameter, the interference value must strike a balance between providing sufficient contact pressure for torque transmission and avoiding plastic yielding of the components, forming a clear "design window" . Finite element simulations and theoretical analyses have defined suitable interference ranges for bushings made of different materials, revealing that both insufficient and excessive interference accelerate the loosening process through different mechanisms [17,18,19]. Furthermore, the bushing's oil groove design, wall thickness uniformity, and the machining accuracy of the connecting rod small-end bore (such as cylindricity and surface roughness) have been proven to critically affect the uniformity of contact pressure distribution and assembly consistency. Insufficient accuracy is a primary cause of increased failure dispersion in mass production [20,21,22].
Secondly, the influence of the operating temperature field and its thermal failure mechanisms is another key research focus. High-temperature environments reduce the strength of the bushing material. More critically, the mismatch in thermal expansion coefficients between the bushing and the connecting rod small end leads to non-uniform thermal deformation, which irreversibly weakens or even relaxes the initial contact pressure of the interference fit. Experimental data indicate that the push-out force of the bushing significantly decreases after reaching a specific temperature threshold. Furthermore, after repeated thermal cycles, the relaxation of residual stresses and the degradation of surface properties further compromise the stability of the connection and may induce additional wear [23,24,25].
Additionally, prospective analysis from the perspectives of system dynamics and reliability provides a theoretical basis for preventing loosening. By constructing multi-body dynamics models of the crank-connecting rod mechanism, the complex load spectrum borne by the bushing can be precisely obtained, providing boundary conditions for strength design [26,27,28]. Combining finite element analysis with probabilistic statistical methods (e.g., reliability assessment) can quantify the effects of design parameter and material property variations, thereby validating the safety margin and robustness of the interference-fit design under alternating loads in a probabilistic sense. This represents a shift in design philosophy from failure remediation to proactive prevention [29,30,31,32].
In summary, existing research has laid a solid foundation by addressing interference design, thermo-mechanical coupling, and system-level analysis. However, a significant gap remains: most studies treat key bushing structural parameters—such as inner diameter, wall thickness, and width—as fixed. Consequently, there is a lack of systematic understanding regarding the quantitative influence of these geometric parameters on the retention force and its stability under dynamic loads. A comprehensive design mapping that explicitly links structural parameters to allowable interference and resulting retention force performance is also absent.
To bridge this gap and address persistent small-end bushing loosening, this study establishes a systematic parametric finite element analysis (FEA) framework using the ABAQUS software platform. A refined FEA model of the connecting rod small end, bushing, and piston pin assembly is developed to systematically investigate the influence of three critical geometric parameters (inner diameter, wall thickness, width) on retention force. The findings aim to establish a parametric design framework for engine connecting rod bushings, providing actionable engineering guidance for structural optimization and interference-fit assembly process control. Ultimately, this work seeks to effectively control bushing loosening failure risks, extend engine service life, and offer scalable references for similar interference-fit components in heavy-duty equipment.
2. Finite Element Model Development and Validation
2.1 Interference-Fit Finite Element Model
A finite element model was developed based on a specific engine connecting rod assembly. To simplify the analysis and focus on the core interference mechanics, secondary features including oil holes, oil grooves, and edge chamfers were omitted. The connecting rod small end has an outer diameter (OD) of 74 mm, an inner diameter (ID) of 49 mm, an axial length of 34 mm, and features an 8° taper. The bushing has an ID of 44 mm,and a wall thickness of 2.5 mm. The piston pin has an OD of 43 mm, an ID of 23 mm, and an axial length of 80 mm.
The material properties assigned in the model are as follows: the connecting rod small end is made of alloy steel (Elastic modulus, E = 209 GPa; Poisson's ratio, μ = 0.29); the bushing is made of tin bronze QSn7-0.2 (E = 129 GPa, μ = 0.27); and the piston pin is modeled as a high-strength steel (E = 210 GPa, μ = 0.28). The assembled finite element model, including its mesh, of the connecting rod small end, bushing, and piston pin is presented in Figure 1.
Following model development, interference-fit simulations were performed for the bushing with interference values ranging from 0.04 mm to 0.07 mm in increments of 0.01 mm. For each simulated case, the contact pressure distribution on the bushing outer surface was extracted and averaged to obtain the simulated mean contact pressure for each interference level. The corresponding theoretical contact pressure on the bushing outer surface was calculated using established thick-walled cylinder interference-fit formulas. The error between the theoretical and simulated mean contact pressure values was then computed to validate the accuracy and feasibility of the finite element model.
The theoretical contact pressure for the interference fit is derived from the thick-walled cylinder theory and is expressed as follows:
Where is the inner radius of the connecting rod small end; is the outer radius of the connecting rod small end; is the inner radius of the connecting rod bushing; and are the elastic moduli of the connecting rod small end and the bushing, respectively; and are the Poisson's ratios of the connecting rod small end and the bushing, respectively; Δ is the interference between the connecting rod small end and the bushing.
2.2 Retention Force Simulation Model
The simulation of bushing push-out and retention force calculation was performed in two sequential analysis steps. First, the interference fit between the bushing and the connecting rod small end was simulated. Subsequently, the bushing was displaced axially, and the resulting contact reaction force—namely, the axial retention (push-out) force—was extracted from the model.
2.2.1 Theoretical Benchmark and Model Validation
To validate the retention force simulation model, the simulated retention force is benchmarked against its theoretical counterpart under identical interference conditions. A low relative error between the two confirms the model's reliability and, concurrently, provides a theoretical foundation for designing subsequent bushing push-out experiments.
The maximum theoretical push-out force is determined by the product of the frictional shear stress at the interface and the effective contact area during axial displacement. As the bushing is displaced by a distance , the effective contact area is given by:
Where is the nominal inner diameter of the connecting rod small end; is the axial contact width of the bushing (equivalently, the width of the small end bore); is the axial displacement ().
The retention force at the interface is given by:
where is the average contact pressure due to the interference fit; is the coefficient of friction between the tin bronze bushing and the alloy steel bore, and is the effective contact area. For the steel–bronze pair under dry conditions, typically ranges from 0.1 to 0.3. A value of , consistent with typical literature values [33,34], is adopted for this study as the sensitivity of the interference fit to the exact friction coefficient is low.
Table 2 summarizes the relative error between the theoretical and simulated retention forces for interference values from 0.04 mm to 0.07 mm. All values are rounded to two significant figures.
The relative errors between theoretical and simulated retention forces, all below 4% (Table 2), confirm the accuracy of the simulation. Thus, the push-out model is validated, thereby providing a reliable basis for the subsequent parametric analysis.
2.2.2 Experimental Validation of the Retention Force Model
To further validate the accuracy of the finite element retention force model under practical conditions and to verify the subsequent parametric simulation results, a physical push-out test was conducted on an actual bushing assembly.
The test setup consisted of an MSY-20T hydraulic press (maximum capacity: 60 MPa), a calibrated pressure sensor (maximum capacity: 5 tons), and an XMT808-I intelligent display controller. The pressure sensor was calibrated prior to testing, achieving a maximum accuracy error of 0.3%, which met the experimental requirements. The test procedure was as follows: (1) The hydraulic press was activated to bring its ram into contact with the pressure sensor. (2) Pressure was continuously applied to displace the bushing axially until it was completely pushed out from the connecting rod small end. (3) The force readings from the pressure sensor were recorded in real-time, and the peak value—corresponding to the bushing retention force—was identified.
Figure 3.
Connecting rod bushing (a) before and (b) after the push-out test.
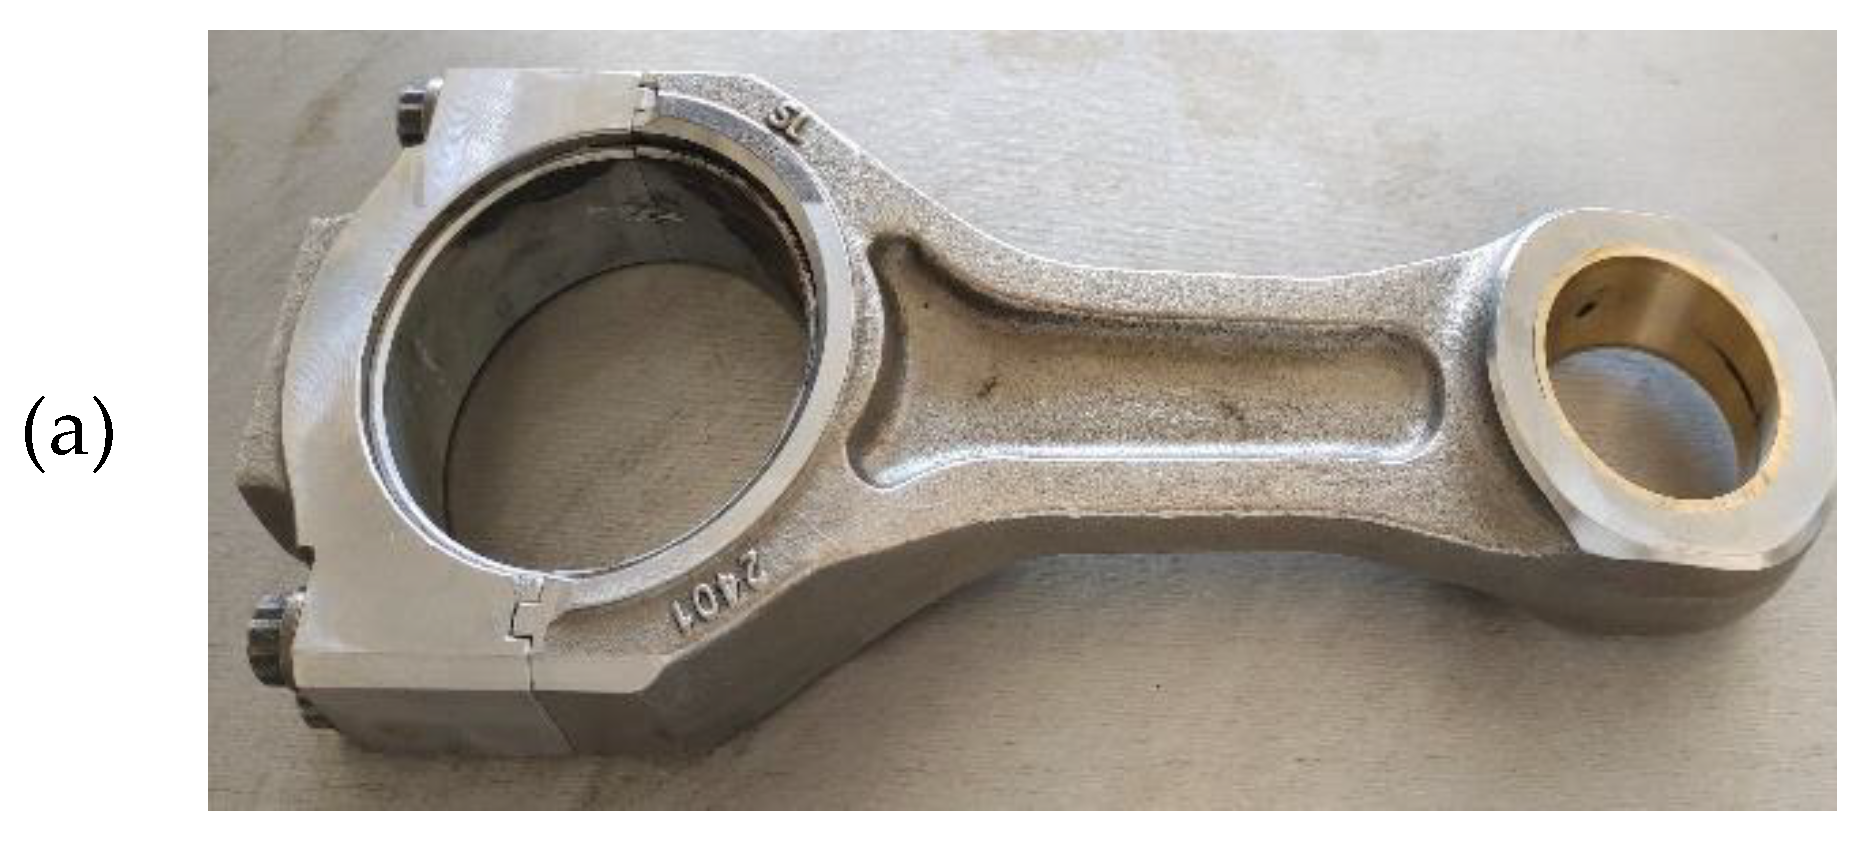
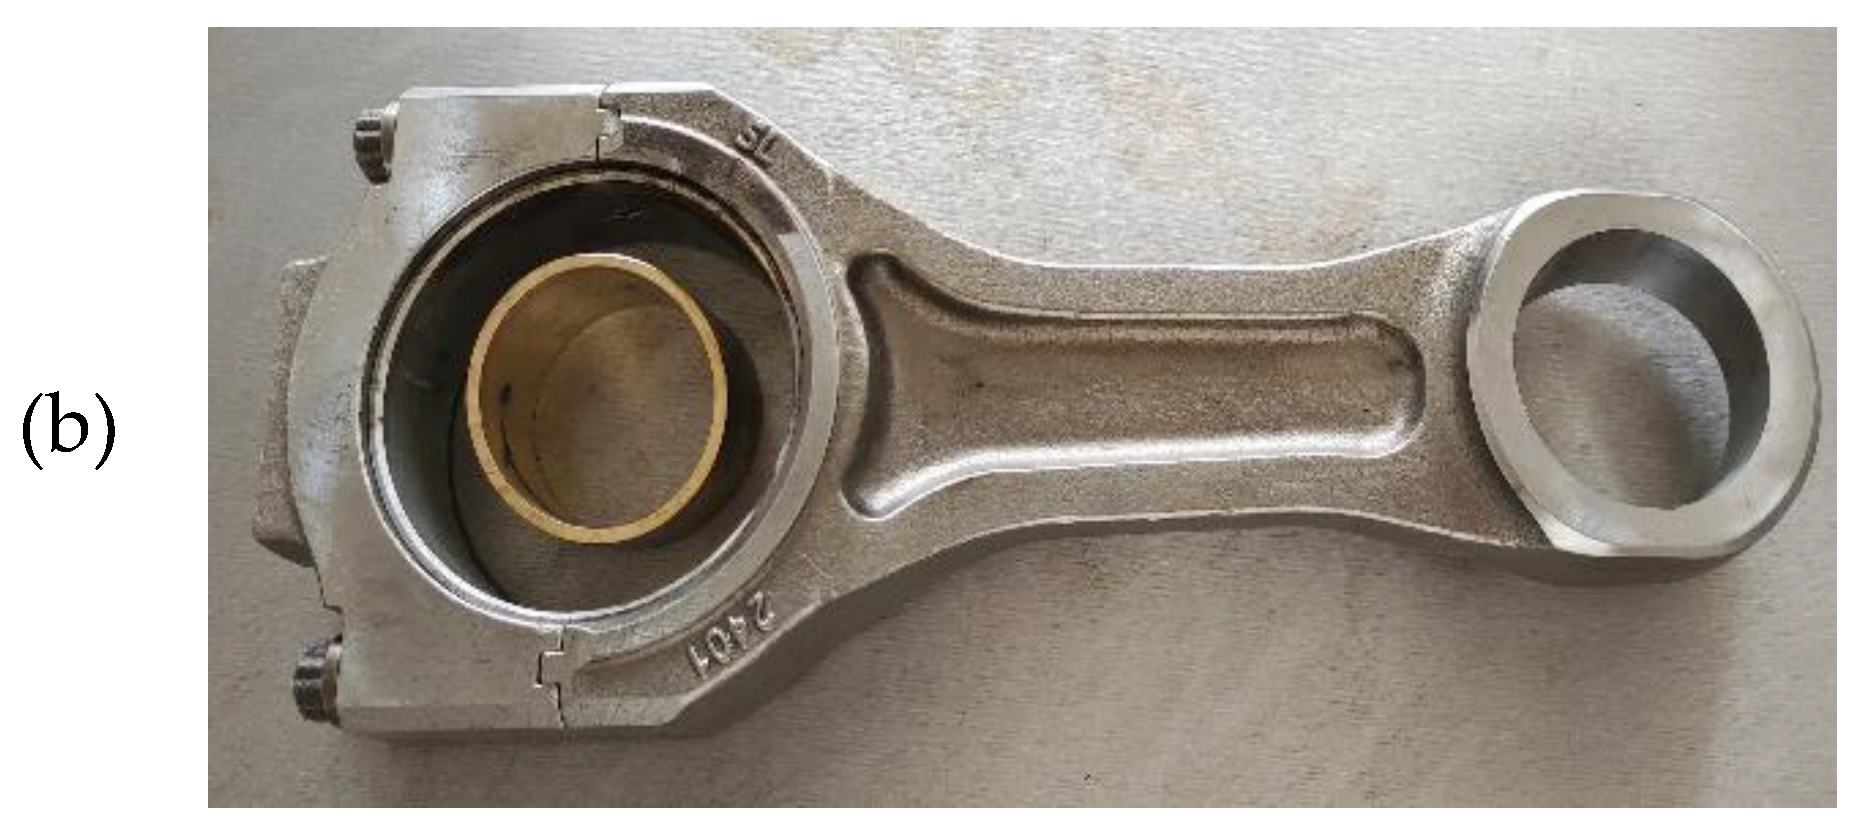
Figure 4.
(a) Schematic of the push-out test setup; (b) Measured retention force for a bushing with 0.04 mm interference.
Figure 4.
(a) Schematic of the push-out test setup; (b) Measured retention force for a bushing with 0.04 mm interference.
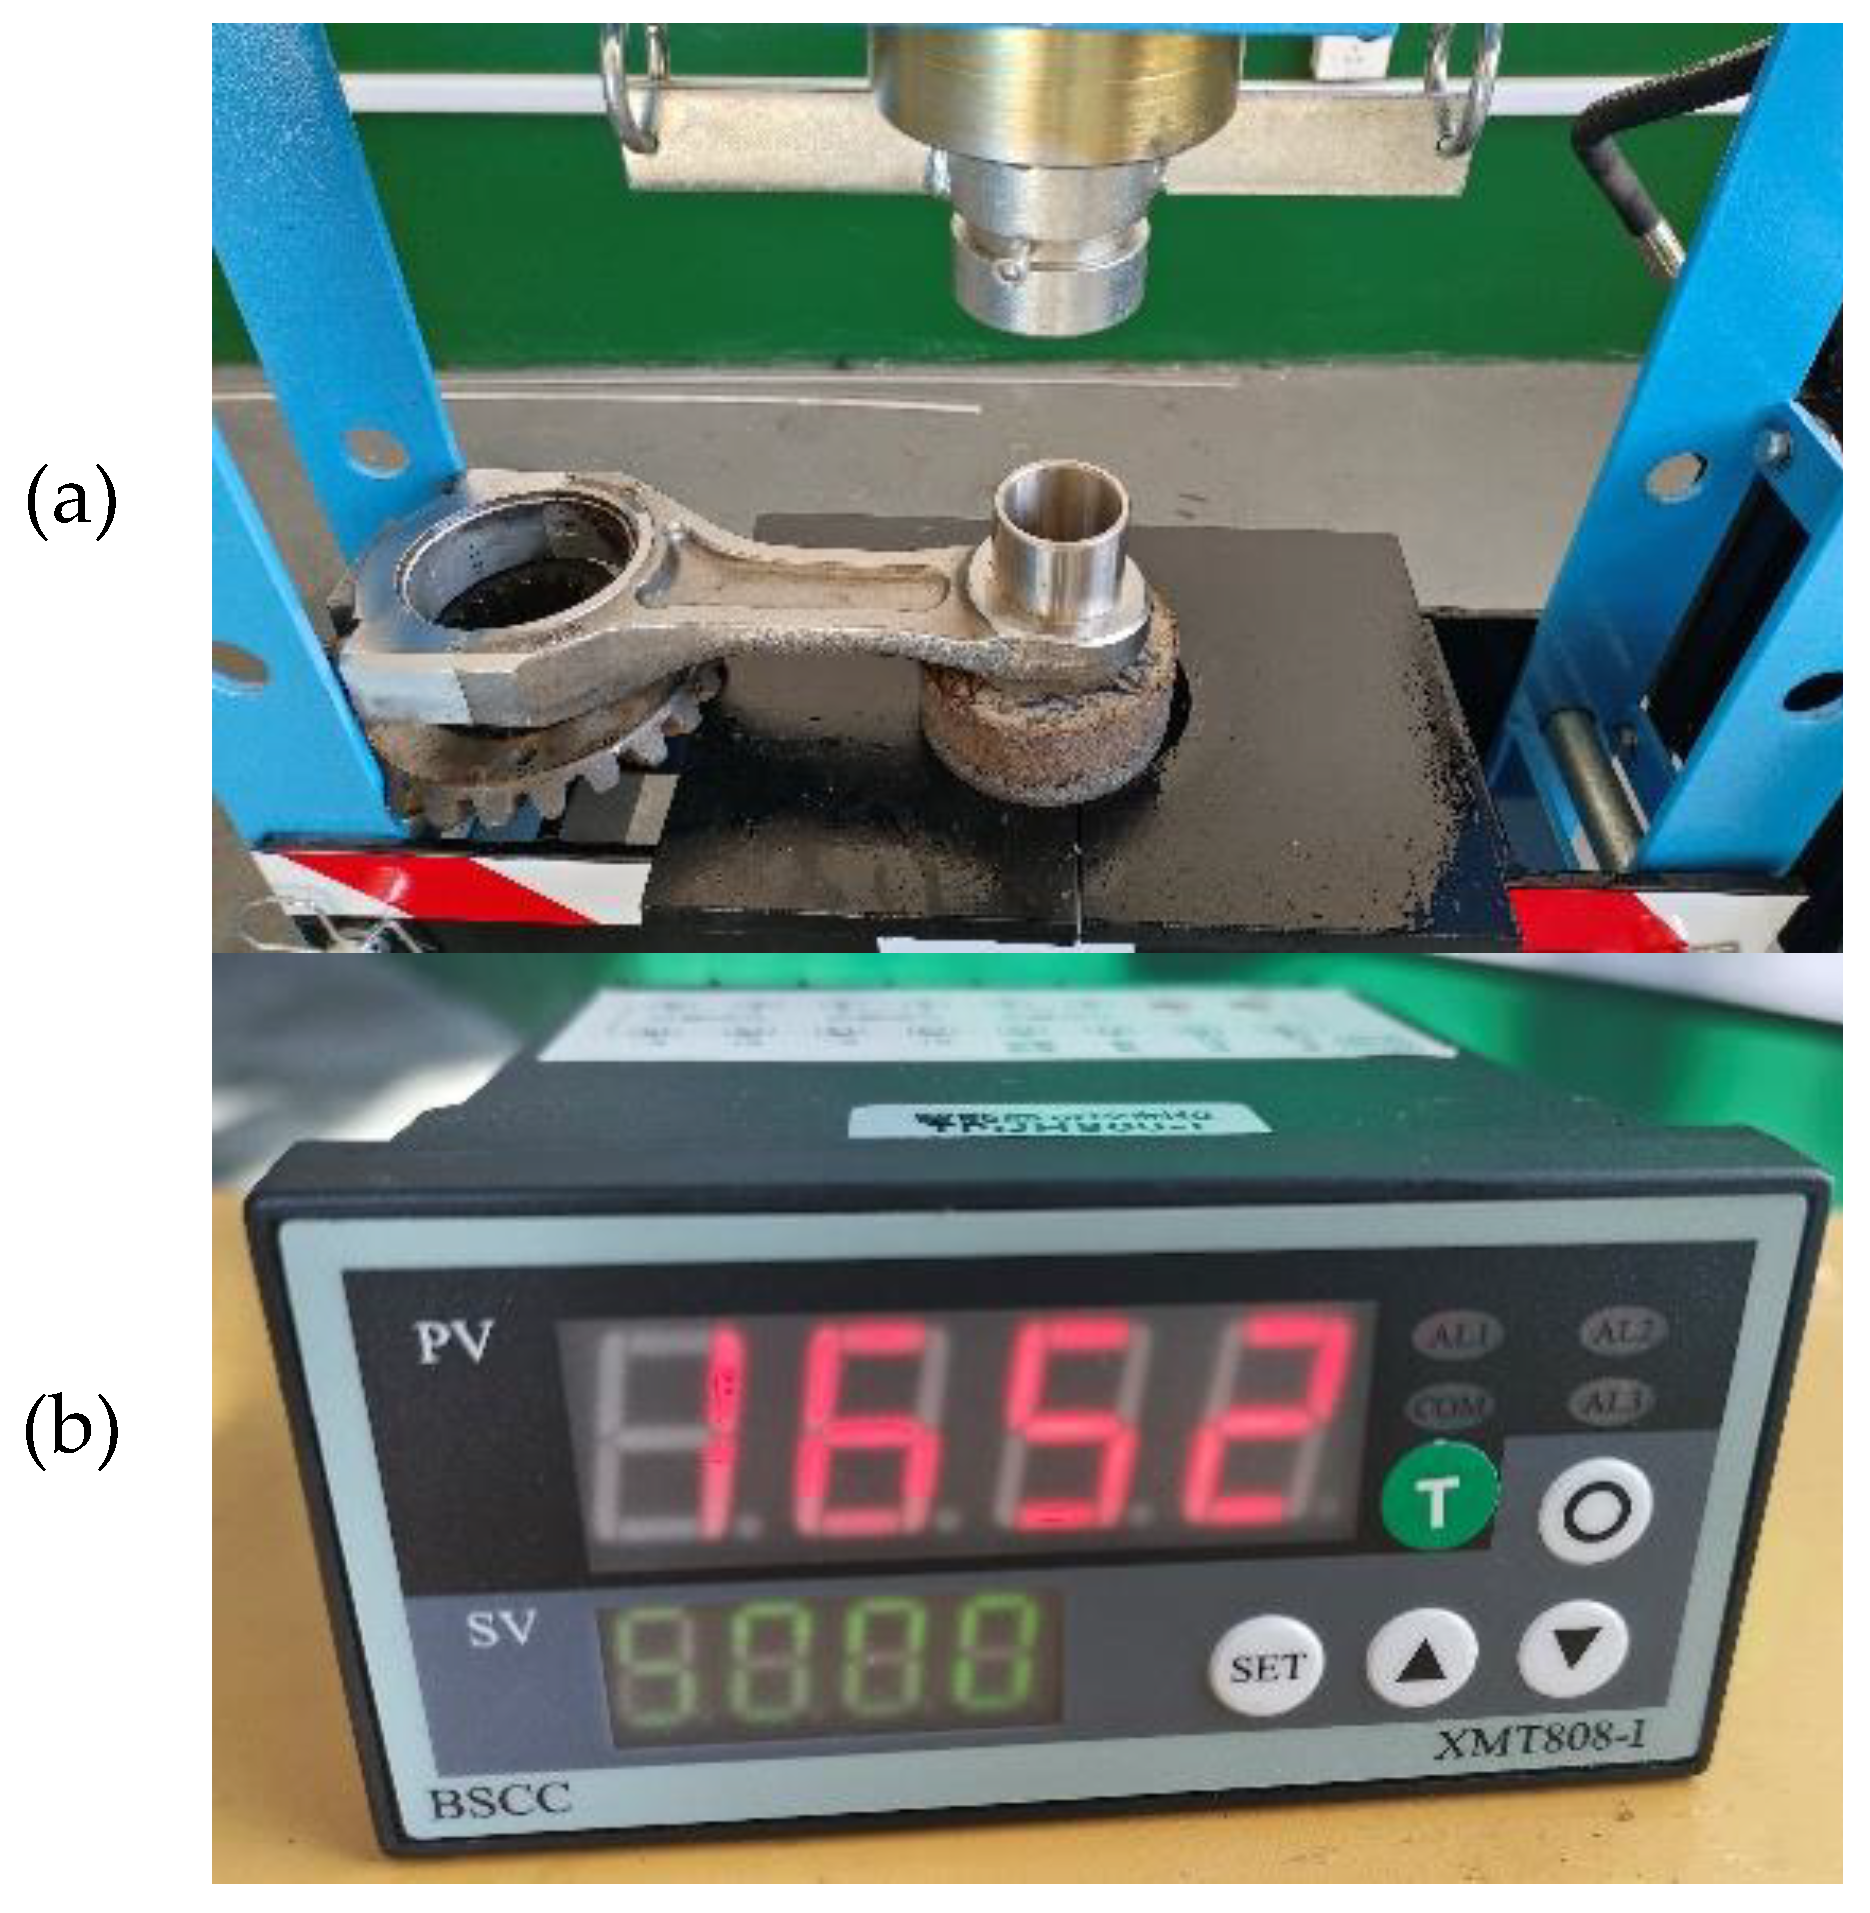
As indicated in Figure 4(b), the peak push-out force for a bushing with an interference of 0.04 mm was obtained from the test setup's intelligent display. The readings in kilograms (kg) were converted to Newtons (N), yielding a maximum retention force of 16,520 N.
To further validate the reliability of the retention force model, the experimentally measured force was compared against both the theoretical and simulated values. The relative errors between experimental-theoretical and experimental-simulated results were calculated and are presented in Table 3, with all values rounded to two decimal places.
Based on the comparative analysis in Table 3, two key conclusions are drawn. First, the experimental retention force shows excellent agreement with both theoretical and simulated values, with maximum relative errors of only 2.1% and 1.2%, significantly below the 5% engineering allowance. The even lower simulation error indicates superior predictive capability. Furthermore, the model’s reliability is comprehensively validated through the consistent alignment of theory, simulation, and experiment. This validated framework effectively mitigates the limitations of purely theoretical approaches and provides a robust foundation for systematic parametric analysis and the optimization of bushing design and assembly processes.
3. Determination of the Retention Force Range
3.1 Determination of the Interference Fit Range
Finite element simulations for the connecting rod bushing were performed under two distinct conditions to determine a safe operational interference range:1.Assembly Condition: Simulating the press-fit process with no external constraints or loads applied.2.Peak Operating Condition: Simulating the engine firing load, with the connecting rod small end fixed and the peak combustion pressure applied.For both conditions, key outputs including the contact pressure, von Mises stress, and equivalent plastic strain on the bushing outer surface were analyzed to establish the allowable interference limits.
3.1.1 Theoretical Interference Range Calculation
- (1)
- Contact Pressure of the Interference Fit between the Connecting Rod Small End and the Bushing
Given that the load on the oil film is 182 kN (under test condition loading) and the yield strength of the tin bronze bushing material is 620 MPa [35,36], the contact pressure range for the interference fit between the connecting rod small end and the bushing is to be determined.
The axial retention is provided by the static friction force, calculated as:
Where is the friction coefficient between the bushing and the small end, and represents the peak axial load of 182 kN, which corresponds to the maximum oil film pressure in the test.
The maximum torque that can be transmitted by the contact surface of the interference fit is given by:
where is the contact radius at the interface between the connecting rod small end and the bushing, with a value of 24.5 mm.
The minimum required contact pressure, calculated based on the maximum load under peak combustion pressure, is:
Where is the small end inner diameter and is the contact length.
The maximum contact pressure occurs when the equivalent stress under load reaches the respective material's yield strength. This limiting pressure is given by:
where is the bushing wall thickness (2.5 mm), is the yield strength of the bushing material (approximately 620 MPa), and is the inner radius of the bushing.
Combining the above equations, the contact pressure range for the tin bronze QSn7-0.2 bushing manufactured by the high-pressure spin forming process is determined to be 34.77–66.67 MPa.
- (2)
- Theoretical Calculation of the Bushing Interference
The contact pressure range of 34.77–66.67 MPa is obtained from Equations (4) to (7). Substituting this range into Equation (8) yields a theoretical interference range of 0.07–0.14 mm.
where = interference; = small end inner radius (24.5 mm); = small end outer radius (37.0 mm); = bushing inner radius (22.0 mm); = elastic moduli (209 GPa, 129 GPa); = Poisson‘s ratios (0.29, 0.27); and = average contact pressure on the bushing outer surface.
3.1.2 Simulation Analysis Under Assembly Conditions
Based on the established finite element model and the theoretically calculated interference range of 0.07–0.14 mm, a series of simulations was performed. The interference was varied from 0.07 mm to 0.14 mm in increments of 0.01 mm to assess the connection reliability under each condition.
The bushing loosening failure criteria were defined as follows:
1.Minimum Interference Criterion: At the lower bound of the interference range, the contact pressure on the bushing outer surface must exceed 34.77 MPa. This ensures sufficient frictional resistance to transmit the peak operational load of 182 kN without slippage.
2.Maximum Interference Criterion: At the upper bound, the equivalent plastic strain in the bushing must be negligible, ensuring the material remains within its elastic limit to avoid permanent deformation or damage.
The simulation results at the lower and upper bounds of the theoretical interference range (0.07 mm and 0.14 mm) were analyzed to assess their viability.
1.At 0.07 mm Interference: As depicted in Figure 5(a), the minimum contact pressure on the bushing outer surface is 30.04 MPa, falling below the required theoretical minimum of 34.77 MPa. This insufficient pressure occurs primarily in the larger cross-section region of the trapezoidal bushing. Consequently, an interference of 0.07 mm is inadequate to prevent slippage under the design load. The maximum contact pressure is localized at the upper and lower edges of the smaller cross-section, likely due to stress concentration from the modeled geometry. Figure 5(b) shows that the maximum von Mises stress reaches 373.28 MPa. This stress is concentrated on the inner surface of the bushing's smaller cross-section, exhibiting an I-shaped distribution pattern.
2.At 0.14 mm Interference: Stress and Plasticity: Figures 5(c) and 5(d) indicate that the maximum von Mises stress exceeds the yield strength (620 MPa) of the tin bronze bushing material. Significant plastic deformation occurs on the inner wall of the smaller cross-section, with a maximum equivalent plastic strain of 0.00299.Since this interference level induces yielding and permanent deformation, a value of 0.14 mm is unacceptable for a safe, elastic design.
Conclusion: Both the lower bound (0.07 mm) and upper bound (0.14 mm) of the initial theoretical range fail to meet the design criteria—one due to insufficient contact pressure and the other due to material yielding.
Figure 6 presents the simulated results across the interference range of 0.07 to 0.14 mm, showing curves for the maximum von Mises stress, equivalent plastic strain, and outer-surface contact pressure of the bushing.
Analysis of Figure 6 yields the following insights for determining the safe interference range:Figure 6(a) shows that the maximum von Mises stress in the bushing increases linearly with interference until reaching the material yield strength (620 MPa) at 0.12 mm interference. Beyond this point, the onset of plastic deformation alters the stress trend. The stress increases by 246.72 MPa as interference rises from 0.07 mm to 0.12 mm.Figure 6(b) confirms that plastic strain occurs once the yield strength is exceeded, with a maximum value of 0.00299 observed at 0.14 mm interference.The contact pressure distribution (Figure 6(c)) is consistent across the range: higher at both axial ends and uniform in the middle. Although the pressure at 0.08 mm interference (34.42 MPa) is marginally below the theoretical minimum (34.77 MPa), this occurs only over a negligible portion of the contact area. Therefore, 0.08 mm is considered acceptable. Increasing interference to 0.14 mm raises the contact pressure to 58.82 MPa (an increase of 28.78 MPa compared to 0.07 mm), confirming that greater interference enhances connection reliability within the elastic design limits.Based on this analysis, interference values of 0.07 mm (insufficient contact pressure) and 0.12–0.14 mm (causing yielding and plastic strain) are excluded from the allowable range.
Based on the preceding analysis, a safe interference range of 0.08–0.11 mm is established for assembly. This range ensures reliable performance without risk of loosening.
3.1.3 Simulation Analysis Under Peak Combustion Pressure
The peak combustion (firing) pressure condition imposes the most severe loading on the connecting rod bushing, resulting in its maximum von Mises stress. In the simulation, this load is applied as a compressive force at both ends of the piston pin, which subsequently transmits the load to the bushing.
Under peak combustion pressure conditions, the applied load causes bending deformation of the piston pin, fundamentally altering the load transfer and stress state of the bushing assembly. As shown in Figure 7(a), the bending of the piston pin results in contact with the bushing only at the end adjacent to the connecting rod, with the contact area covering approximately one-quarter of the axial length of the bushing. Within this contact zone, the contact pressure distribution is non-uniform: it reaches a maximum of 630.52 MPa at the upper and lower edges of the inner surface of the bushing, while being lower in the central region. The remaining three-quarters of the inner surface of the bushing experience zero contact pressure.
This localized loading leads to a characteristic stress distribution. Figure 7(b) indicates that the maximum von Mises stress (449.47 MPa) occurs at the edges of the inner surface within the contact zone. A secondary stress concentration (417.25 MPa) is observed at the edges of the smaller trapezoidal cross-section of the bushing. The axial stress distribution is symmetric, being higher at both ends and lower in the middle. The elevated stress at the edges can be attributed to the geometric simplification of chamfers in the finite element model.
Validation results for the upper limit of the allowable interference range (0.11 mm) confirm its safety. Figure 7(c) shows that the maximum von Mises stress is 572.44 MPa, located in the smaller cross-section and still below the material yield strength. Importantly, Figure 7(d) shows no equivalent plastic strain (zero values throughout the field), confirming that the bushing remains within the elastic range under this extreme operating condition and will not experience loosening.
Figure 8(a) indicates that under mechanical load, the maximum von Mises stress in the bushing decreases by approximately 10 MPa compared to the assembly-only condition. This reduction is attributed to a slight elliptical deformation of the connecting rod small end under combustion pressure, which elongates along the load direction. This deformation alleviates the localized assembly-induced constraint, promoting a more uniform load distribution and thus reducing the local peak stress.
As shown in Figure 8(b), at 0.08 mm interference, the minimum contact pressure is 32.85 MPa. Although marginally below the required 34.77 MPa, this occurs over a negligible area. The pressure across the remainder of the surface sufficiently exceeds the requirement, ensuring no loosening. In contrast, at 0.11 mm interference, the minimum contact pressure rises significantly to 49.52 MPa—an increase of about 17 MPa—which further enhances connection security.
Therefore, the allowable interference range for the connecting rod bushing under peak combustion pressure is conclusively determined to be 0.08–0.11 mm. This range ensures reliable assembly with no risk of loosening failure.
3.2 Determination of the Retention Force Range
Based on the work above, the optimal interference range for reliable bushing performance under both assembly and operating conditions is 0.08–0.11 mm. Accordingly, push-out simulations were conducted across this range to obtain the corresponding retention force, the results of which are presented in Figure 9.
Figure 9 shows that for a bushing with 0.08 mm interference, the push-out force attains its peak value of 33.61 kN at the onset of displacement. The force then decreases continuously with further displacement until it drops to zero upon complete ejection of the bushing. The push-out force versus displacement curves for all interference levels within the 0.08–0.11 mm range exhibit a consistent pattern. Notably, at the upper limit of this range (0.11 mm interference), the simulated retention force reaches 46.25 kN.
Therefore, the optimal retention force range corresponding to the 0.08–0.11 mm interference is determined to be 33.61–46.25 kN.
4. Influence of Bushing Structural Parameters on Retention Force
Following the validation of the interference-fit and push-out force models, this section investigates the influence of key bushing structural parameters. The validated model is employed to systematically vary three geometric parameters—inner diameter, wall thickness, and width—and calculate the corresponding retention force for each configuration. Analysis of the results reveals the quantitative influence and trends of these parameters on the retention force. This parametric study aims to provide theoretical support and design data for optimizing engine connecting rod bushings to mitigate loosening failure.
4.1 Determining the Interference Range for Varied Structural Parameters
4.1.1 Theoretical Calculation of the Interference Range
- (1)
- Theoretical Interference Range for Bushings with Different Inner Diameters
The theoretical interference range was calculated for bushings with inner diameters of 40 mm, 42 mm, 46 mm, and 48 mm using Equations (4) through (8). The results are summarized in Table 4.
The results indicate that the allowable interference range shifts to slightly higher values for larger inner diameters (46 mm and 48 mm). This trend occurs because, for a constant wall thickness, a larger inner diameter reduces the radial stiffness of the bushing. Consequently, a marginally greater interference is required to generate the contact pressure necessary for load transfer, while still ensuring that stresses remain within the material's yield strength limit.
- (2)
- Theoretical Interference Range for Bushings with Different Wall Thicknesses
The theoretical interference range was calculated for bushings with wall thicknesses of 2 mm, 2.25 mm, 2.75 mm, and 3 mm, with the results summarized in Table 5.
The results indicate that increasing the bushing wall thickness reduces its radial stiffness. This lower stiffness results in reduced contact pressure under the same interference fit, thereby gradually lowering the minimum required contact pressure for effective load transfer. At the same time, the allowable elastic deformation range of the bushing widens, which increases the maximum permissible interference before yielding occurs. Consequently, the overall allowable interference range broadens with increasing wall thickness.
- (3)
- Theoretical Interference Range for Bushings with Different Widths
The theoretical interference range was calculated for bushings with widths of 32 mm, 33 mm, 35 mm, and 36 mm, and the results are presented in Table 6.
The results indicate that increasing the bushing width enlarges the load-bearing contact area. This expansion promotes a more uniform contact pressure distribution, which consequently reduces the minimum required contact pressure for effective load transfer. In contrast to inner diameter and wall thickness, the allowable interference range remains largely unaffected by changes in width, indicating that width has a comparatively minor influence on this parameter.
4.1.2 Interference Range Simulation for Different Bushing Inner Diameters
- (1)
- Simulation Analysis under Assembly Conditions
Simulations were performed for bushings with different inner diameters across their respective theoretical interference ranges. The reliability of each configuration was evaluated based on the simulated von Mises stress, outer-surface contact pressure, and equivalent plastic strain. Representative results for an interference of 0.09 mm are presented in Figure 10 and Figure 11.
Figure 10 indicates that, for all inner diameters studied, the maximum von Mises stress is localized on the inner surface of the bushing—specifically at the upper and lower edges of its smaller trapezoidal cross-section. As the inner diameter increases, the maximum stress exhibits a decreasing trend, with an approximate reduction of 20 MPa per diameter increment.
Figure 11 shows that the maximum contact pressure on the outer surface also occurs at the upper and lower edges of the smaller trapezoidal section, a concentration attributed to the absence of chamfers in the model. With increasing inner diameter, the outer-surface contact pressure decreases progressively, by roughly 8 MPa per step.
Analysis of Figure 12 confirms that the maximum von Mises stress decreases linearly with increasing inner diameter, at a rate of approximately 20 MPa per step. More critically, the onset of plastic strain defines the upper interference limit for each diameter: yielding begins at 0.11 mm (40 mm ID), 0.12 mm (42 mm ID), and 0.13 mm (for both 46 mm and 48 mm ID). These interference levels and all greater values must be excluded to prevent permanent deformation.
Figure 13(a) shows that for a 40 mm inner diameter, the minimum contact pressures at 0.06 mm and 0.07 mm interference (31.13 MPa and 36.44 MPa) are below the required 37.86 MPa. However, at 0.07 mm, the area experiencing sub-threshold pressure is negligible; therefore, this interference level is retained.For inner diameters of 42 mm and 46 mm (Figures 13(b) and 13(c)), the minimum pressures at 0.07 mm and 0.08 mm interference fall below their respective required minima (36.25 MPa and 33.41 MPa). Consequently, these interference values are discarded.Similarly, for a 48 mm inner diameter (Figure 13(d)), the minimum pressures at 0.08 mm and 0.09 mm interference (28.50 MPa and 32.13 MPa) are both below the required 32.15 MPa. Following the rationale applied to the 40 mm case, the 0.08 mm interference is excluded.
In summary, finite element simulation under assembly conditions establishes the allowable interference ranges for bushings of different inner diameters, as summarized in Table 7. These ranges ensure safe and reliable bushing operation.
- (2)
- Simulation Analysis under Combustion Pressure Conditions
A mechanical load of 182 kN was applied to bushings with different inner diameters. Based on the interference ranges established in the previous section, further simulation analysis was conducted, with the results presented in Figure 14 and Figure 15.
As shown in Figure 14, the maximum von Mises stress under the 182 kN load remained within the material's yield strength (620 MPa) across all cases. This confirms that the applied mechanical load did not induce plastic deformation, and the stress trend with increasing inner diameter remained consistent with the assembly condition.
Analysis of contact pressure (Figure 15) shows that for specific interferences—0.07 mm (40 mm ID), 0.08 mm (42 mm ID), and 0.09 mm (48 mm ID)—the minimum pressures (33.90 MPa, 36.49 MPa, and 30.41 MPa, respectively) were below their theoretical minima. However, in each case, the area experiencing this sub-critical pressure was sufficiently limited; therefore, these interference levels were retained as acceptable.
In conclusion, the allowable interference ranges for different bushing inner diameters, validated through simulation under combustion pressure, are established in Table 7. These ranges are confirmed to prevent loosening failure, providing comprehensive verification for both assembly and operational reliability.
4.1.3 Simulation of Interference Ranges for Bushings with Different Wall Thicknesses
Simulation results indicated that applying the operational mechanical load had a negligible effect on the allowable interference range determined under assembly conditions. Therefore, the subsequent analysis of wall thickness effects and all associated data presented are based solely on simulations performed under the assembly condition.
As shown in Figure 16, for bushing wall thicknesses of 2 mm, 2.25 mm, 2.75 mm, and 3 mm, the maximum von Mises stress decreases linearly with increasing wall thickness under the same interference level, at a rate of approximately 10 MPa per mm increment. Notably, yielding initiates at an interference of 0.12 mm. Therefore, this interference level and all higher values must be excluded to avoid plastic deformation.
Figure 17 shows that the minimum contact pressure at the lower bound of the interference range varies with wall thickness. For thicknesses of 2 mm, 2.25 mm, 2.75 mm, and 3 mm, the minimum pressures at interferences of 0.09 mm, 0.08 mm, 0.07 mm, and 0.06 mm are 33.04 MPa, 31.98 MPa, 32.00 MPa, and 28.82 MPa, respectively. All these values fall below their corresponding theoretical minimum required contact pressures (35.50 MPa, 35.13 MPa, 34.42 MPa, and 34.08 MPa). Consequently, these specific interference levels are deemed unacceptable and are excluded from the allowable range.
In summary, the optimal interference ranges for bushings of different wall thicknesses, established through simulation under both assembly and operational conditions, are summarized in Table 7 and are applicable to both load cases.
4.1.4 Simulation of Interference Ranges for Bushings with Different Widths
Consistent with the previous analysis on wall thickness, the influence of bushing width was evaluated under interference-fit assembly conditions. The corresponding simulation results are shown in Figure 18 and Figure 19.
According to Figure 18, the maximum von Mises stress is largely insensitive to changes in bushing width under a given interference, indicating that stress levels remain nearly constant. Analysis of the equivalent plastic strain contour reveals that yielding consistently initiates at an interference of 0.12 mm across all widths studied. Consequently, the upper limit of the allowable interference range is conservatively set at 0.11 mm to prevent plastic deformation.
Figure 19 shows that for bushing widths of 32 mm, 33 mm, 35 mm, and 36 mm, the minimum contact pressures at interferences of 0.07 mm and 0.08 mm are insufficient. Specifically, these pressures fall below their respective theoretical minimum required values of 36.95 MPa, 35.83 MPa, 33.80 MPa, and 32.84 MPa. Since such pressures cannot reliably prevent loosening, these interference levels are excluded from the acceptable range.
The final allowable interference ranges for connecting rod bushings with different widths, integrating the constraints from both stress and contact pressure analyses, are consolidated in Table 7.
The data in Table 7 reveals that structural parameters influence the allowable interference range in distinct ways. The range shifts toward larger values with increasing inner diameter, a trend attributable to decreased bushing radial stiffness. In contrast, greater wall thickness substantially lowers the minimum required interference, demonstrating its capacity to enhance load transfer and expand the processing window. Width variation exhibits a relatively limited effect. The most significant finding is the complete consistency between the allowable ranges under combustion pressure and assembly conditions across all designs. This demonstrates that the static assembly condition—requiring adequate contact pressure without plastic strain—is the governing design criterion, as it inherently encompasses the demands of the most severe dynamic operation. Consequently, Table 7 serves as an essential design guide, enabling reliable parameter selection and process control to prevent loosening failure, thereby streamlining the design process by focusing on assembly condition validation.
4.2 Determination of the Retention Force Range for Different Structural Parameters
Based on the allowable interference ranges established under combustion pressure conditions (Table 7), a series of push-out simulations was conducted. For each structural parameter set, the interference was varied within its respective range at 0.01 mm intervals to calculate the corresponding retention force. This systematic approach enabled the determination of the allowable retention force range associated with each design configuration.
4.2.1 Retention Force Simulation for Different Bushing Inner Diameters
As shown in Figure 20, the simulated retention force for a bushing with a 40 mm inner diameter increases with interference. The maximum forces are 33.14 kN at 0.07 mm interference, 37.91 kN at 0.08 mm, 42.69 kN at 0.09 mm, and 47.44 kN at 0.10 mm. The push-out force versus displacement curves across this range exhibit consistent behavior.
The corresponding allowable retention force ranges for inner diameters of 40 mm, 42 mm, 46 mm, and 48 mm are 33.14–47.44 kN, 35.60–49.25 kN, 35.49–47.49 kN, and 33.39–44.74 kN, respectively. A key trend is observed: under the same interference level, the retention force decreases by approximately 2 kN with each incremental increase in inner diameter. This trend is consistent with the reduced radial contact stiffness associated with larger diameters, which diminishes the frictional resistance under axial push-out loading.
4.2.2 Simulation of Retention Force for Bushings with Different Wall Thicknesses
As shown in Figure 21, the push-out force versus displacement curves follow consistent trends across all wall thicknesses. The determined retention force ranges are 35.24–38.82 kN for 2 mm, 34.74–42.63 kN for 2.25 mm, 35.97–49.60 kN for 2.75 mm, and 33.39–52.72 kN for 3 mm wall thickness. A clear trend emerges: under the same interference level, the retention force increases by approximately 3 kN with each incremental step in wall thickness. This increase is attributed to the enhanced radial stiffness and resultant higher contact pressure provided by a thicker bushing wall, which improves frictional resistance during push-out.
4.2.3 Simulation of Retention Force for Bushings with Different Widths
As shown in Figure 22, the push-out force versus displacement curves exhibit consistent behavior across all bushing widths studied. The corresponding retention force ranges are determined as follows: 34.88–42.80 kN for a width of 32 mm, 36.28–44.46 kN for 33 mm, 34.69–47.92 kN for 35 mm, and 35.95–49.64 kN for 36 mm. Under a constant interference level, the retention force demonstrates a gradual increase with wider bushings, at an average rate of approximately 1.3 kN per incremental step in width. This positive correlation is attributed to the enlarged effective contact area, which enhances the total frictional resistance during axial push-out.
The simulation results in Table 8 demonstrate that wall thickness is the most influential parameter for retention force. Its increase directly enhances bushing radial stiffness and load-bearing capacity, leading to a significant rise in the upper force limit—for instance, from 38.82 kN at 2.00 mm to 52.72 kN at 3.00 mm. Conversely, the effects of inner diameter and width are more limited: a larger inner diameter marginally reduces the force due to lower stiffness, while a greater width offers a modest increase via a larger contact area. In summary, this table provides a crucial design nexus, quantitatively connecting geometric parameters with safe interference ranges and resultant retention force, thereby enabling targeted structural optimization and process selection.
5. Conclusions
This study systematically investigated the interference-fit characteristics and retention-force range of a diesel-engine connecting-rod bushing through an integrated approach combining theoretical analysis, finite-element simulation, and experimental validation. The main conclusions are as follows:
(1) For the typical bushing geometry (inner diameter: 44 mm, wall thickness: 2.5 mm, width: 34 mm), a safe interference range of 0.08–0.11 mm was determined. This range satisfies both assembly safety and operational reliability, corresponding to a retention-force range of 33.61–46.25 kN. It ensures sufficient contact pressure to prevent loosening while avoiding plastic deformation caused by excessive interference.
(2) The influence of three key structural parameters—inner diameter, wall thickness, and width—on retention force was clarified. Wall thickness is the most influential factor: increasing it significantly raises the retention force by improving the bushing’s radial stiffness. In contrast, a larger inner diameter slightly reduces the force due to decreased stiffness, while greater width provides a limited positive effect through an enlarged contact area.
(3) When the bushing exhibits a “large inner diameter, thin wall, and narrow width” configuration, stricter control must be applied to interference-fit accuracy and associated manufacturing processes (including dimensional and geometric tolerances as well as surface roughness). This ensures that the bushing remains secure under operational loads and meets safety requirements.
(4) A comprehensive design mapping linking structural parameters, safe interference ranges, and retention force envelopes is established. This mapping provides actionable engineering guidance for the parametric optimization of connecting rod bushings and the precise control of assembly processes in practical production. It enables engineers to quickly determine the optimal structural parameters and interference fit range during the preliminary design stage, thereby proactively mitigating the risk of bushing loosening failure and extending the service life of diesel engines. The proposed research framework and design method can also be extended to the interference fit design of similar components (e.g., piston pins, hydraulic cylinder bushings) in heavy-duty equipment, demonstrating broad application prospects.
References
- Tian, S.; Shen, J.; Wang, C.; et al. Influence of Low-Pressure Lubrication System on Reliability and Economy of Diesel Engine. Internal Combustion Engine & PowerPlant 2024, 41, 30–34+41. [Google Scholar] [CrossRef]
- Cui, Y.; Liu, J.; Wang, C.; et al. Research on the Impact of Low-Viscosity Lubricating Oil on Energy Saving, Emission Reduction and Reliability of Heavy-Duty Commercial Diesel Engines. Automotive Engineering 2024, 46, 935–944+922. [Google Scholar] [CrossRef]
- Chen, J.; Bai, C. Kinematics and Dynamics Simulation and Reliability Analysis of Crankshaft-Connecting Rod Mechanism of a Single-Cylinder Four-Stroke Internal Combustion Engine. Neijiang Science & Technology 2024, 45, 87–90+115. [Google Scholar]
- Liu, K.; Liu, X. Research on Mechanical Fatigue Damage and Reliability of Internal Combustion Engine Piston. Internal Combustion Engine & Parts 2023, (18), 44–46. [Google Scholar] [CrossRef]
- Fu, H.; Zhang, H.; Zhang, L.; et al. The Loosening Mechanism of Tin-Bronze Bushing Assembled by Interference at Connecting Rod Small End of Heavy-Duty Diesel Engines. International Journal of Engine Research 2025, 26, 289–298. [Google Scholar] [CrossRef]
- Mo, C.; Li, J.; Li, W. Analysis and Improvement Research on Slippage Fault of Connecting Rod Bushing in a V-Type Engine. Internal Combustion Engine & Parts 2025, (18), 92–94. [Google Scholar] [CrossRef]
- Shi, Y. Simulation Study on Structural Strength Reliability of Diesel Engine Connecting Rod Bushing under Interference Fit. Master's Thesis, North University of China, Taiyuan, China, 2018. [Google Scholar]
- Fan, X. Simulation Analysis of Bore Shrinkage for Diesel Engine Connecting Rod Bushing under Interference Fit. Master's Thesis, North University of China, Taiyuan, China, 2011. [Google Scholar]
- Chen, G.; Liao, R.; Jiang, X. Calculation and Study of the Failure of the Connecting-Rod Small End Based on Thermoelastic Plasticity. Proceedings of the Institution of Mechanical Engineers, Part D: Journal of Automobile Engineering 2017, 231, 1489–1499. [Google Scholar] [CrossRef]
- Jiao, X. Optimization and Verification of Bushing Press-In Force. Automobile Applied Technology 2021, 46, 151–154. [Google Scholar] [CrossRef]
- Liu, L. Design of Engine Connecting Rod Bushing Pressing Mechanism. Computer Fan 2021, (11), 3433–3434. [Google Scholar] [CrossRef]
- Pang, Q.; Liu, Q.; Peng, H. Interference Fit Design Based on Workbench. Modern Manufacturing Engineering 2021, (04), 83–89. [Google Scholar] [CrossRef]
- Ji, W.; Hu, J.; Liu, H.; et al. Contact Analysis and Optimization of Track Link Interference Fit under Press-Fitting Process. Modern Manufacturing Engineering 2020, (05), 108–112. [Google Scholar] [CrossRef]
- Cao, C.; Fan, W.; Yang, H.; et al. Solution and Analysis of Interference Fit for Engine Connecting Rod Bushing. Tool Engineering 2017, 51, 52–55. [Google Scholar] [CrossRef]
- Cao, Y.; Liang, L.; Ye, Z.; et al. Simulation and Experimental Study on Bore Shrinkage during Press-Fit Assembly. Machinery 2024, 62, 39–43. [Google Scholar]
- Liu, J.; Wang, J.; Zhang, P.; et al. Load Analysis of Connecting Rod Small End Bearing and Study on Influencing Factors of Loosening. Machinery Design & Manufacture 2023, (02), 215–218. [Google Scholar] [CrossRef]
- Xu, L. Finite Element Strength Analysis of a Diesel Engine Connecting Rod. Internal Combustion Engine & Parts 2024, (05), 1–4. [Google Scholar] [CrossRef]
- Mao, X. Simulation Analysis of Structural Strength of Automotive Engine Connecting Rod. Machinery 2022, 60, 37–42+55. [Google Scholar]
- Li, X.; Zhao, J.; Wang, X. Experimental Study on Tribological Properties of Tin Bronze Connecting Rod Bushing. Journal of Plasticity Engineering 2019, 26, 267–273. [Google Scholar]
- Xiang, J.; Liu, J.; Zhong, C.; et al. Study on Structural Strength of Connecting Rod Swinging Pair Bushing under Optimization of Process Parameters. Journal of Beijing Institute of Technology 2021, 41, 1154–1161. [Google Scholar] [CrossRef]
- He, J.; Bai, L. Experimental Study on the Influence Law of Press-Out Force for Interference Fit Assembly of Connecting Rod Bushing. Mechanical and Electrical Information 2020, (35), 41–42. [Google Scholar] [CrossRef]
- Feng, Y. Simulation and Analysis of Interference Fit Assembly for Engine Connecting Rod Bushing. Master's Thesis, North University of China, Taiyuan, China, 2011. [Google Scholar]
- Jiang, X. Thermo-Elasto-Plastic Mechanical Analysis of Loosening Problem in Connecting Rod Small End Bushing. Master's Thesis, Beijing Institute of Technology, Beijing, China, 2015. [Google Scholar]
- Liu, J.; Xiang, J.; Qin, W.; et al. Effect of Temperature Increase on the Looseness of Connecting Rod Small End Bushing. Engineering Failure Analysis 2022, *138*, 106195. [Google Scholar] [CrossRef]
- Wei, M.H.; Xiang, J.H.; Liu, J.; et al. Analysis of Stiffness and Strength Characteristics of Connecting Rod Bushing under Material Thermal Degradation. Chin. Intern. Combust. Engine Eng. 2020, *41*, 39–45. [Google Scholar] [CrossRef]
- Xu, H. Analysis of Contact Characteristics and Reliability Study of Gear and Shaft Interference Fit Assembly. Master's Thesis, Hubei University of Automotive Technology, Shiyan, China, 2023. [Google Scholar] [CrossRef]
- Liu, X.; Zhong, J.; Zhou, L. Stress Study Based on Interference Fit of Marine Turbocharger Spindle-Thrust Block System. Internal Combustion Engine & Parts 2025, (20), 22–24. [Google Scholar] [CrossRef]
- Li, Y.; Fan, W.; Zhang, H.; et al. Research on Yield Strength of Power Spinning QSn7-0.2 Connecting Rod Bushing Based on Response Surface Methodology. Journal of Plasticity Engineering 2020, 27, 72–78. [Google Scholar] [CrossRef]
- Marmorini, L.; Baldini, A.; Bertocchi, E.; et al. On the Loosening Mechanism of a Bush Press-Fitted in the Small End of a Connecting Rod. Proceedings of the Institution of Mechanical Engineers, Part D: Journal of Automobile Engineering 2012, 226, 312–324. [Google Scholar] [CrossRef]
- Xiao, J.; Qin, W.; Xu, S. Interference and Thickness Design of Bushing of Connecting Rod Small End for Anti-Loosening. Engineering Failure Analysis 2021, *127*, 105556. [Google Scholar] [CrossRef]
- Jotawar, C.K.; Chethan, B.R.; Pawan, C.H. Stress Distribution in Interference Fitted Assemblies with Different Material. International Journal of Mechanical Engineering and Robotics Research 2014, 3, 129. [Google Scholar]
- Petrova, I.M.; Filimonov, M.A. Reliability Assessment of the Compressor Connecting Rods. Journal of Machinery Manufacture and Reliability 2018, 47, 142–146. [Google Scholar] [CrossRef]
- Qiao, W. Analysis and Research on Interference Contact of Connecting Rod Bushing Based on Workbench. Master's Thesis, North University of China, Taiyuan, China, 2017. [Google Scholar]
- Wang, Z. Simulation and Experimental Study on Optimal Interference Fit of Copper-Nickel-Tin and Tin Bronze Connecting Rod Bushings Based on Workbench. Master's Thesis, North University of China, Taiyuan, China, 2022. [Google Scholar]
- Liu, K. Simulation Study on Loosening of Connecting Rod Small End Bushing Considering Mixed Lubrication. Master's Thesis, Beijing Institute of Technology, Beijing, China, 2015. [Google Scholar]
- Zhang, H. Research and Optimization on Reliability of Interference Fit Assembly for Connecting Rod Bushing. Master's Thesis, North University of China, Taiyuan, China, 2020. [Google Scholar] [CrossRef]
Figure 1.
Finite element model assembly and mesh of the connecting rod small end, bushing, and piston pin.
Figure 1.
Finite element model assembly and mesh of the connecting rod small end, bushing, and piston pin.
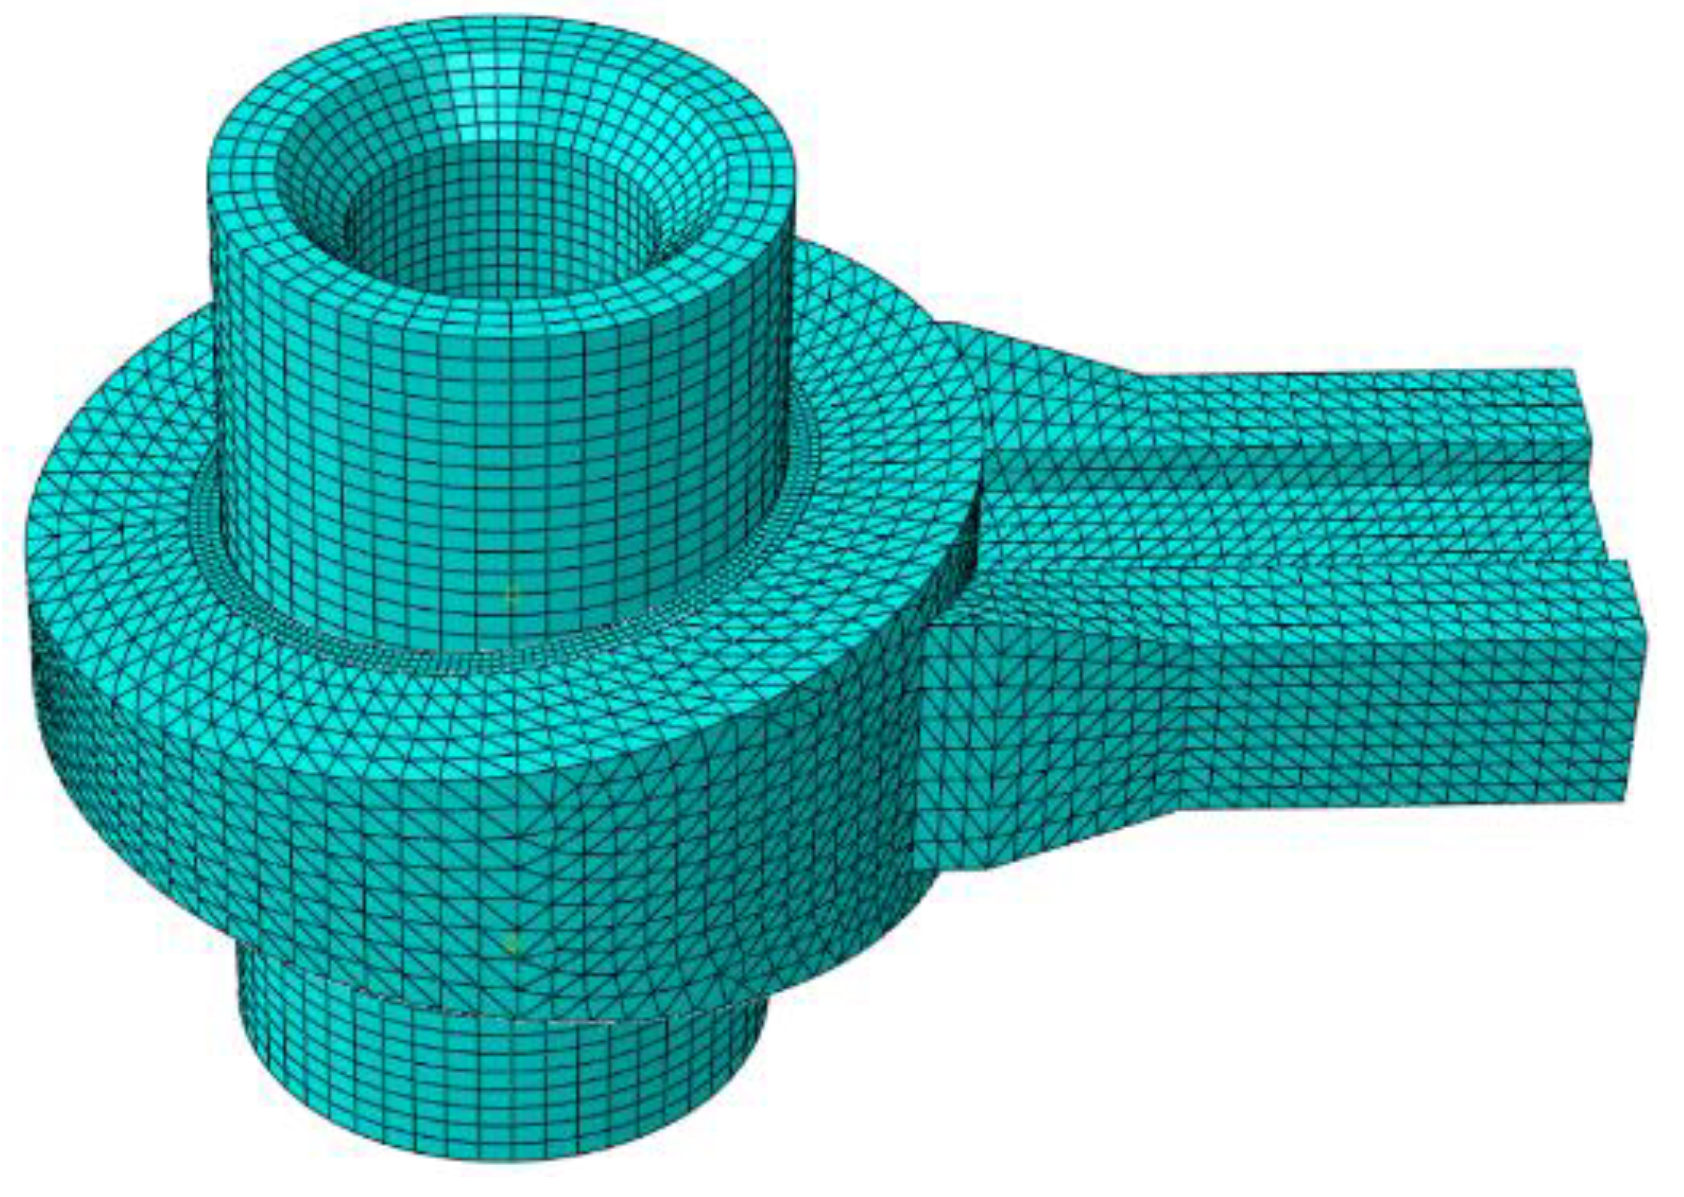
Figure 2.
Validation of finite element model: theoretical versus simulated contact pressure on the bushing outer surface.
Figure 2.
Validation of finite element model: theoretical versus simulated contact pressure on the bushing outer surface.
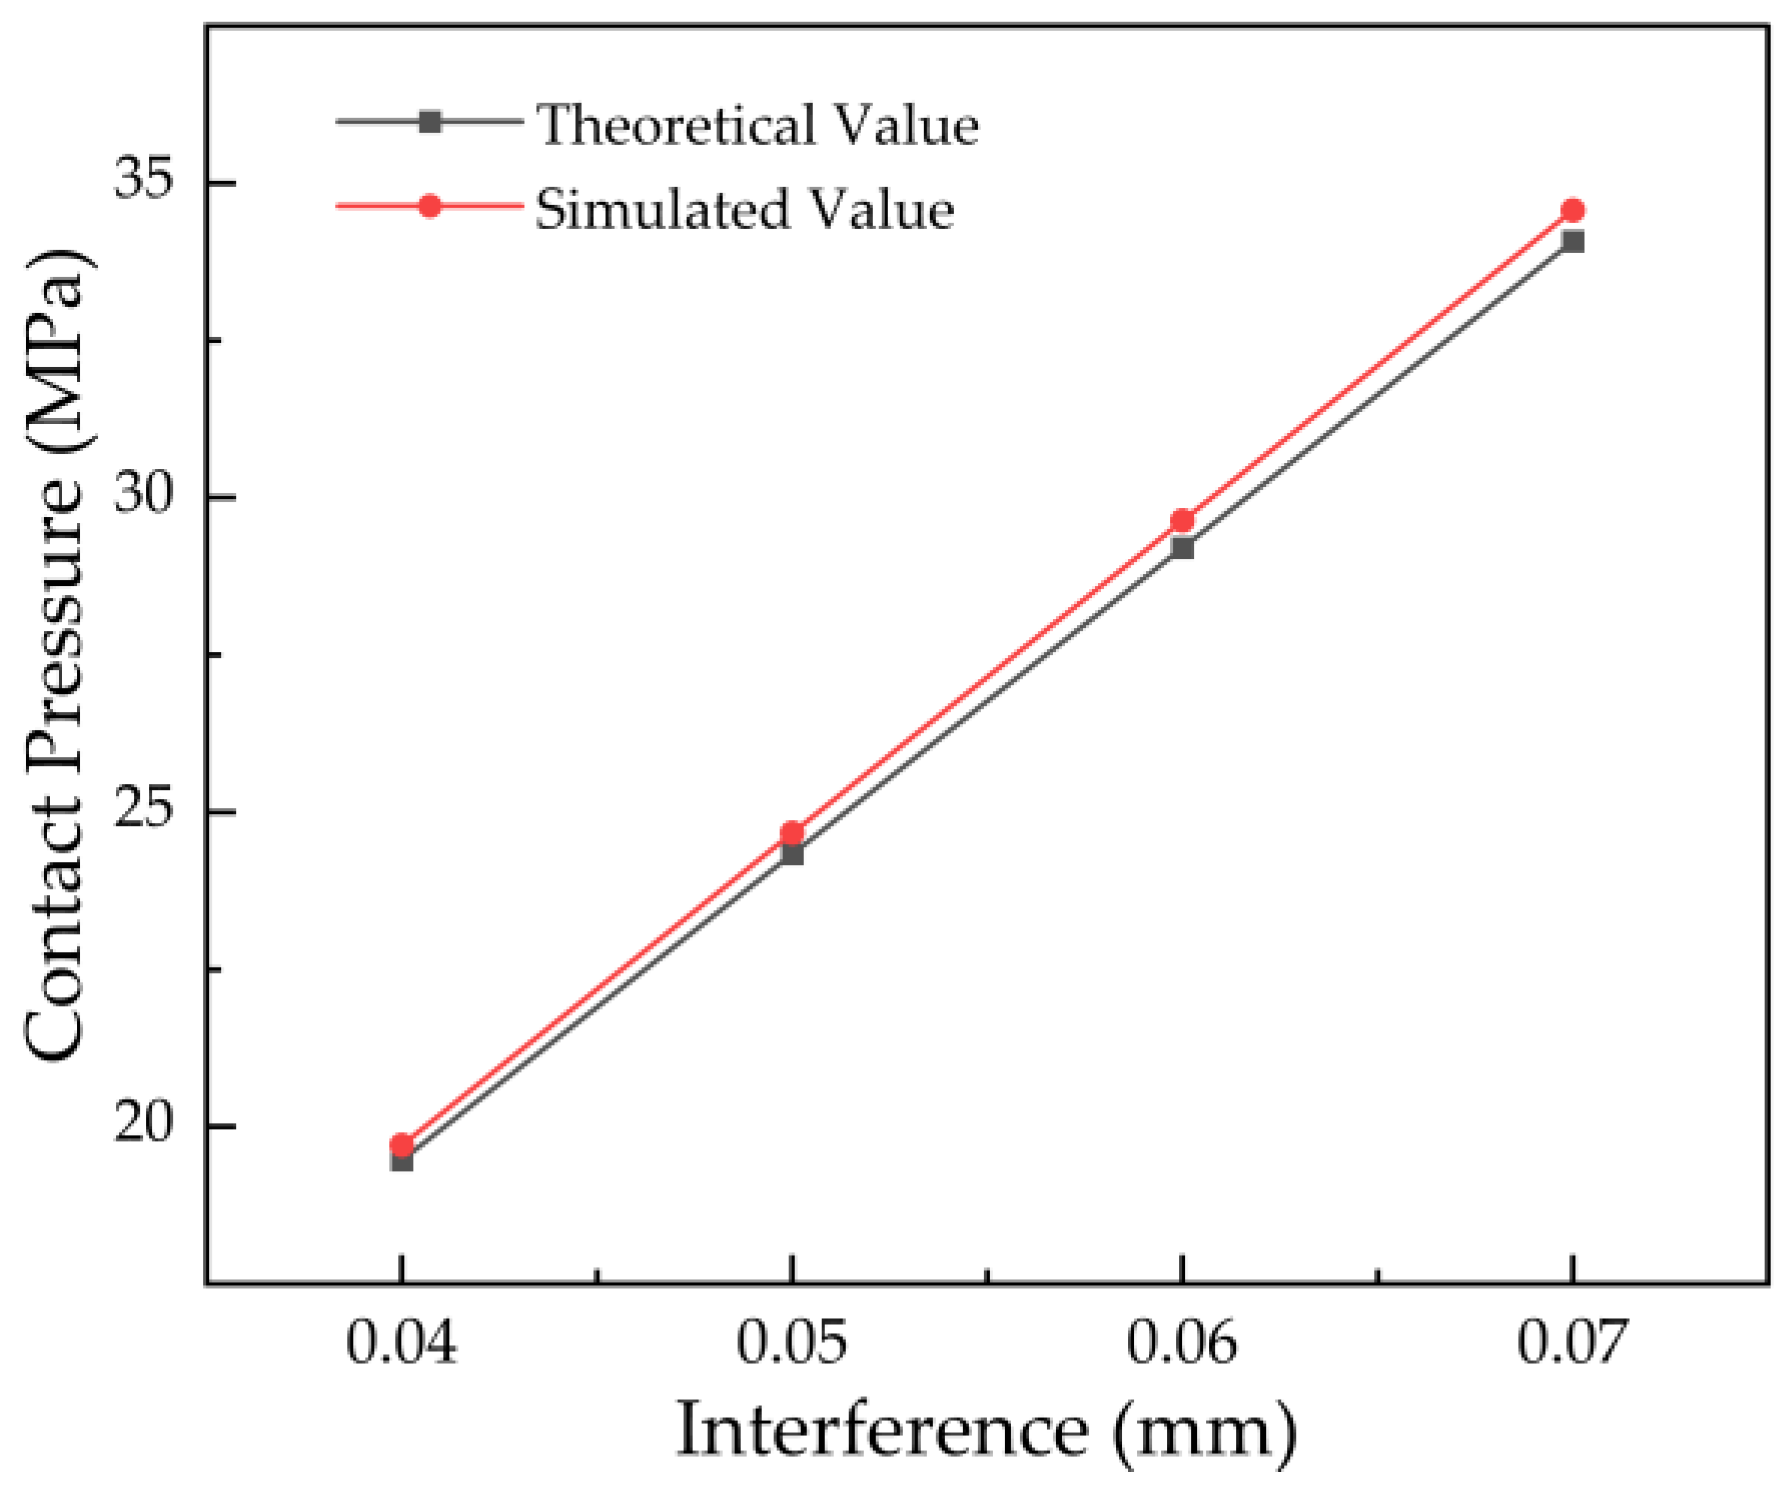
Figure 5.
Simulation results for the connecting rod bushing at interference levels of 0.07 mm and 0.14 mm: (a) contact pressure distribution (0.07 mm); (b) von Mises stress (0.07 mm); (c) von Mises stress (0.14 mm); (d) equivalent plastic strain (0.14 mm).
Figure 5.
Simulation results for the connecting rod bushing at interference levels of 0.07 mm and 0.14 mm: (a) contact pressure distribution (0.07 mm); (b) von Mises stress (0.07 mm); (c) von Mises stress (0.14 mm); (d) equivalent plastic strain (0.14 mm).
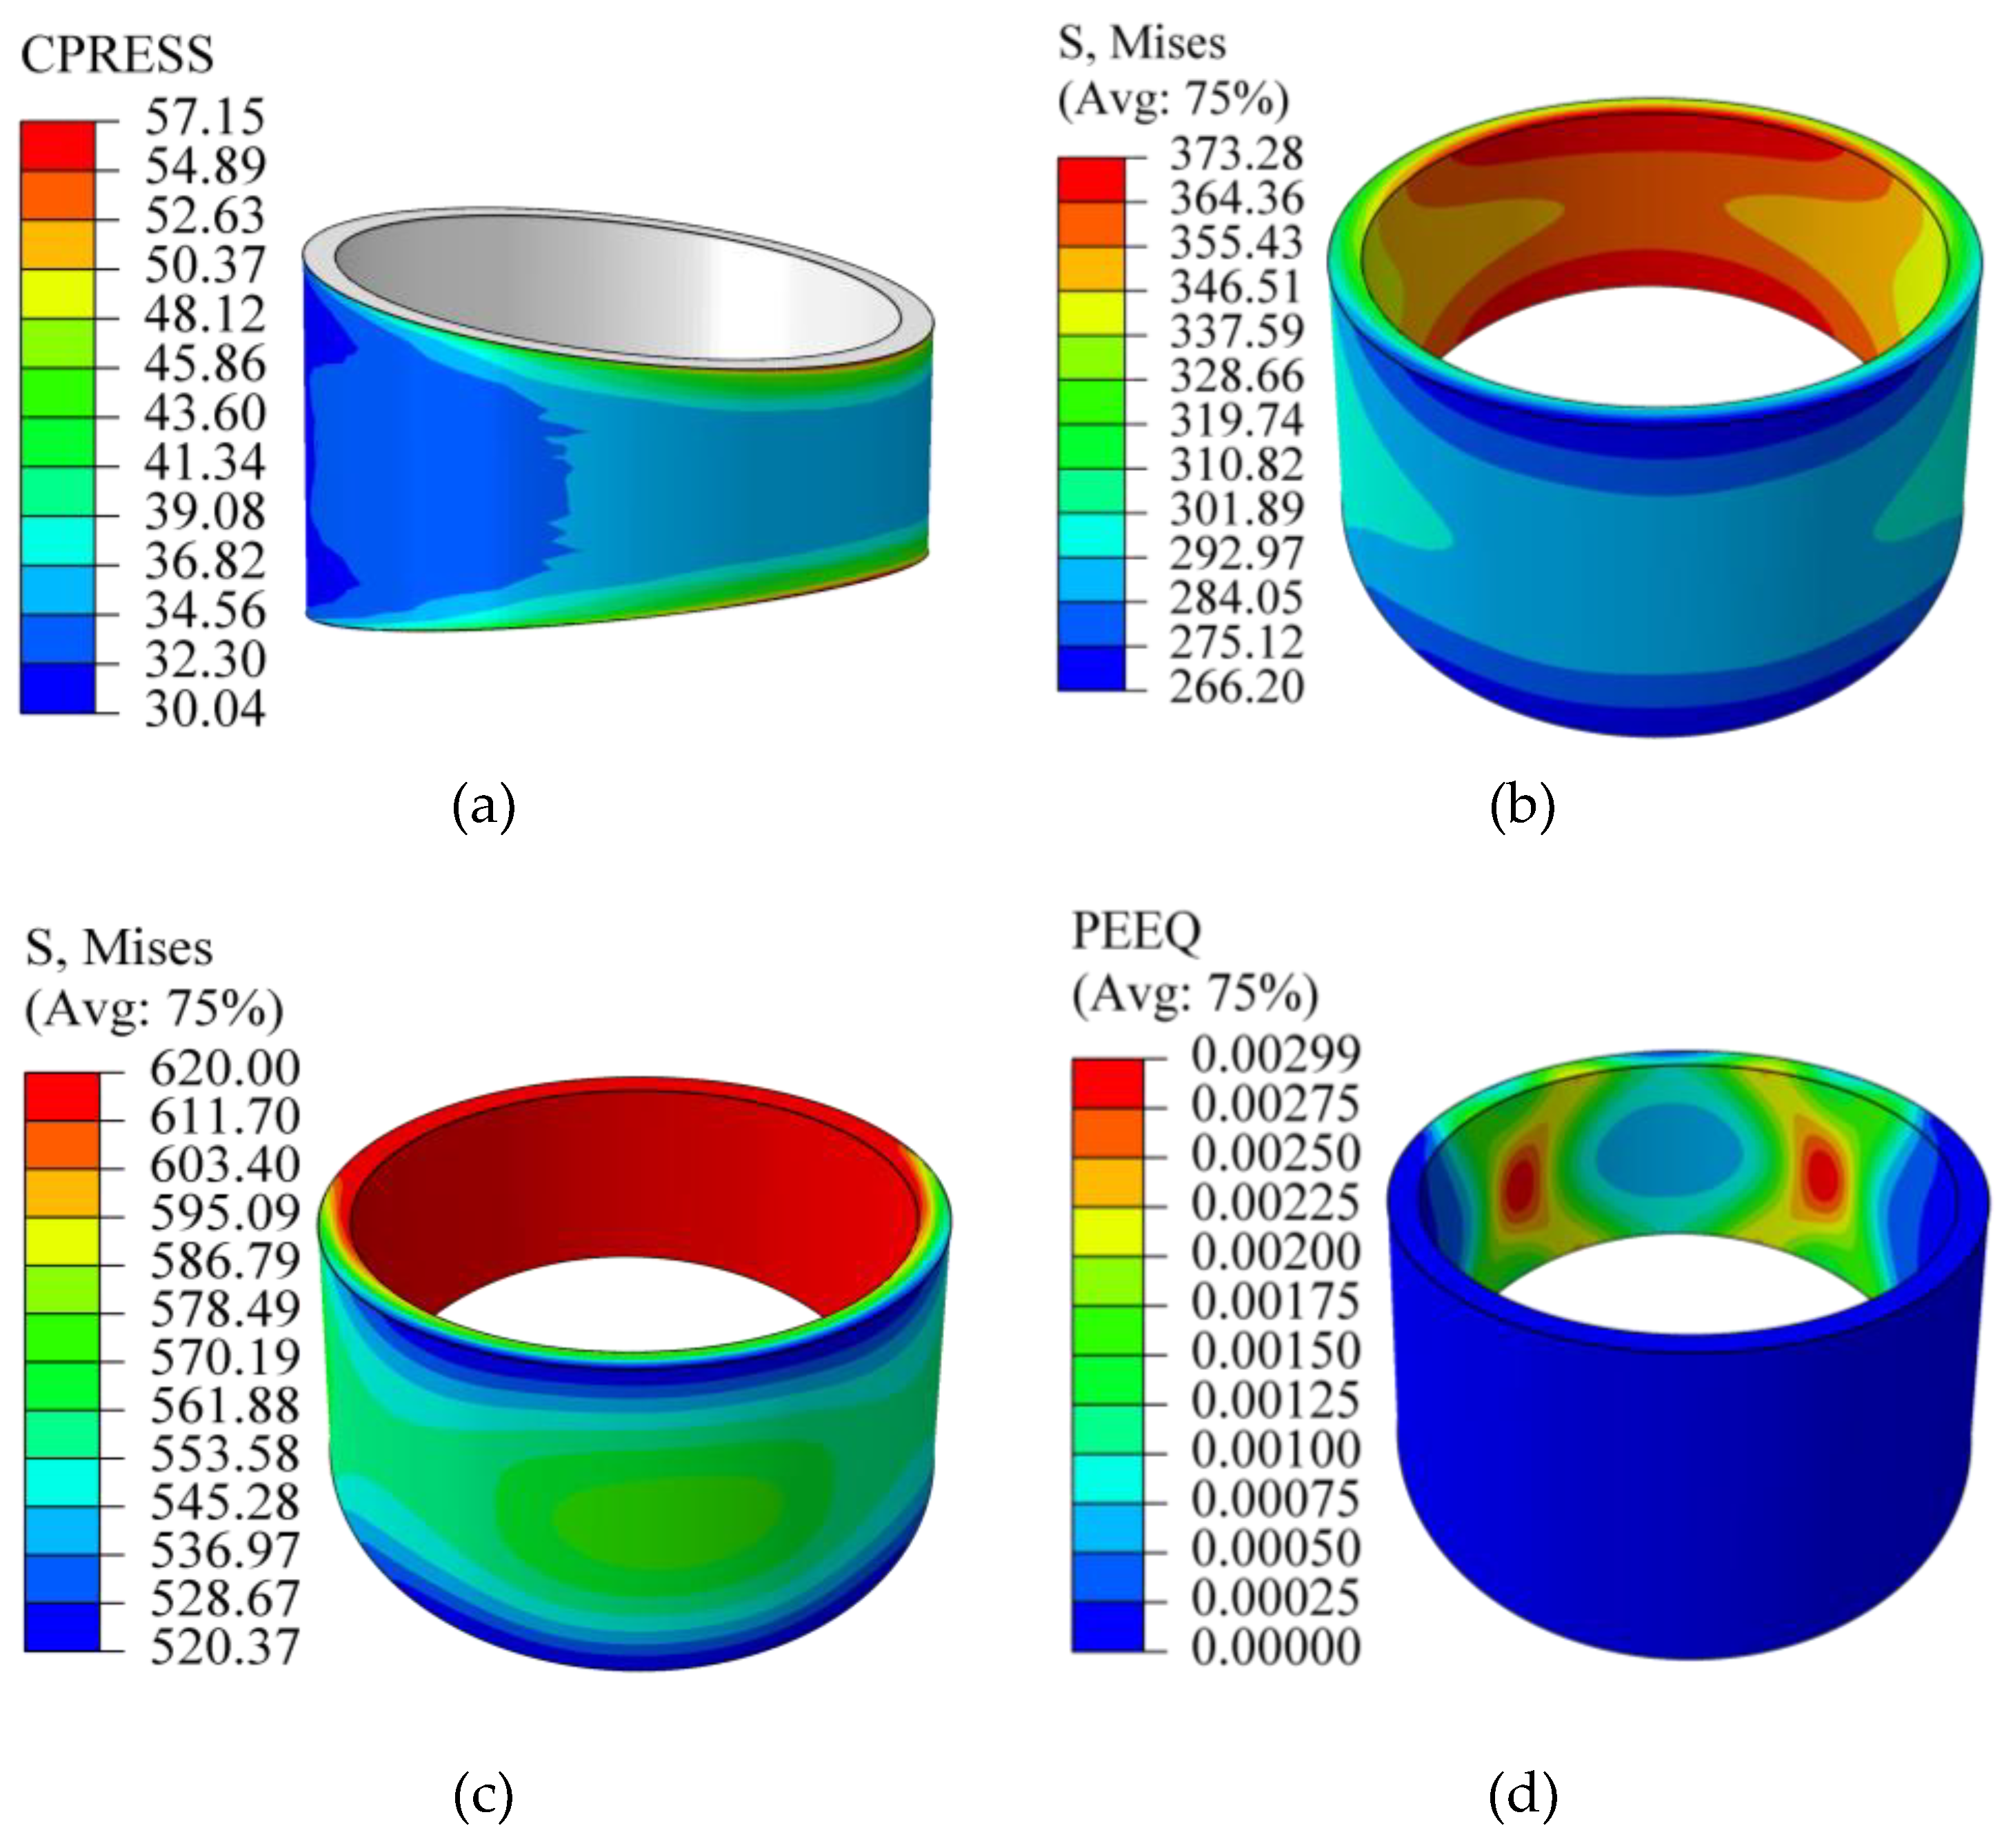
Figure 6.
Parametric simulation results for the bushing over an interference range of 0.07–0.14 mm: (a) maximum von Mises stress; (b) equivalent plastic strain; (c) outer-surface contact pressure distribution.
Figure 6.
Parametric simulation results for the bushing over an interference range of 0.07–0.14 mm: (a) maximum von Mises stress; (b) equivalent plastic strain; (c) outer-surface contact pressure distribution.
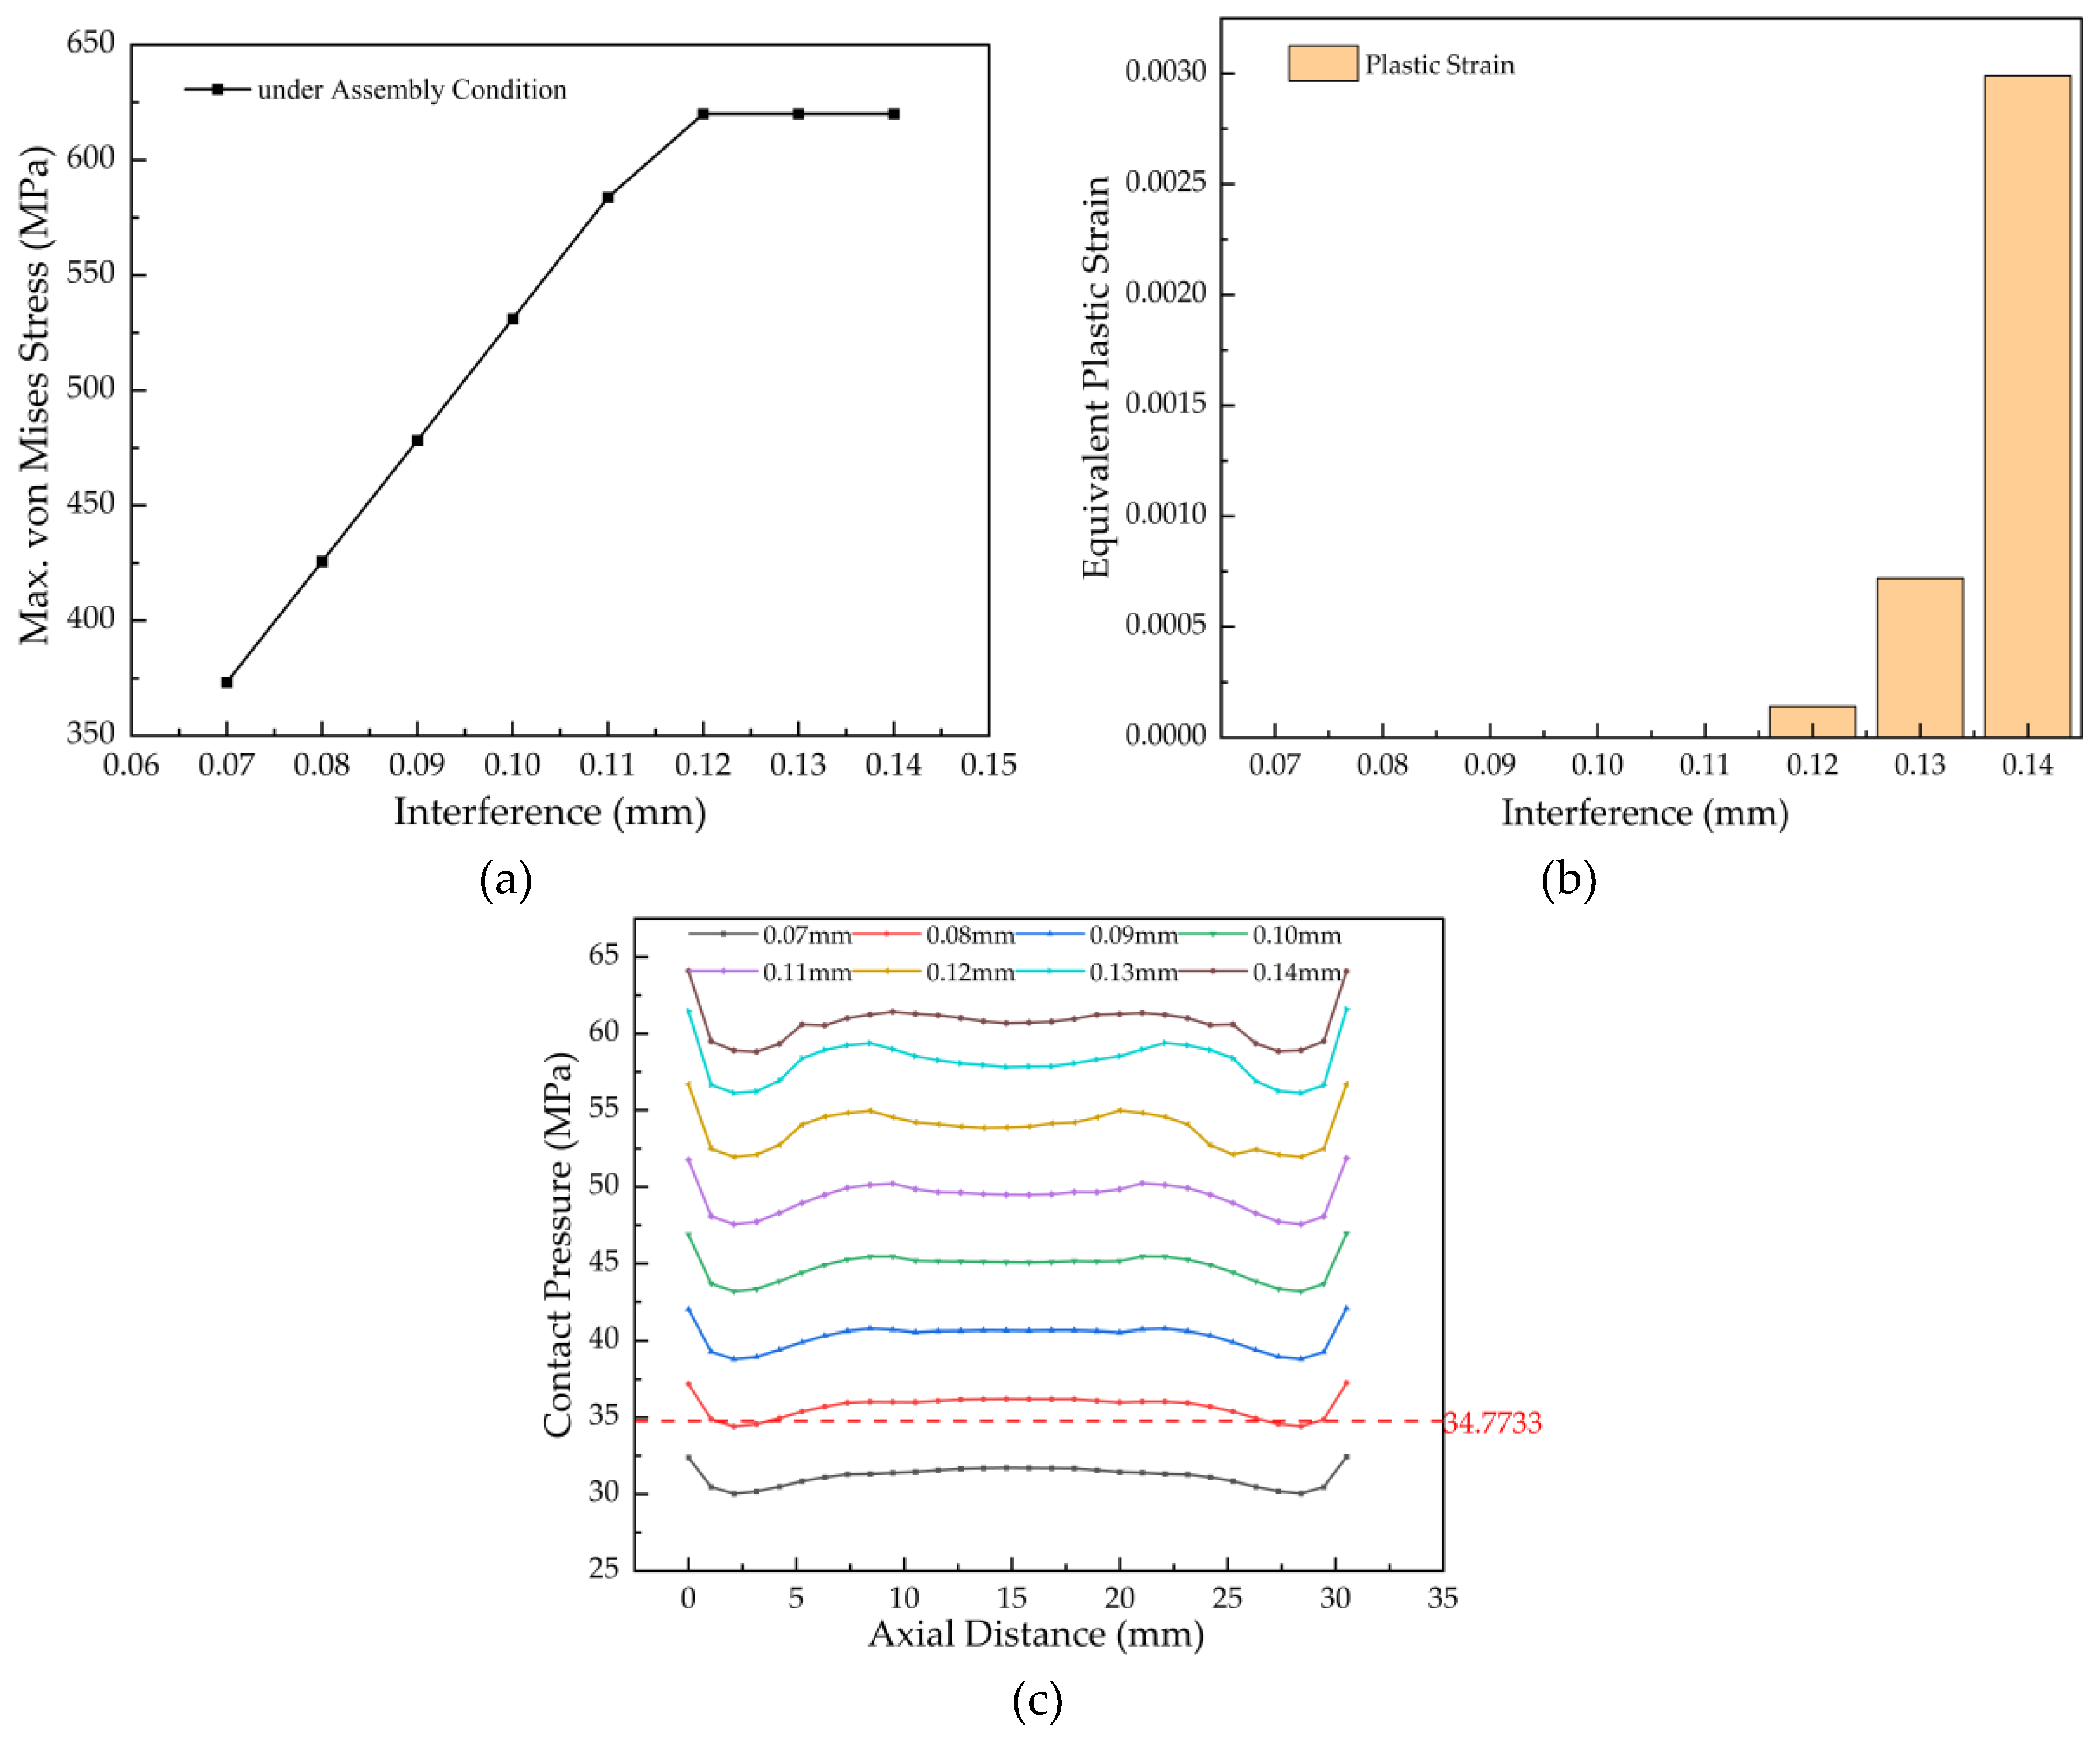
Figure 7.
Simulation results for the bushing under peak combustion pressure at interferences of 0.08 mm and 0.11 mm: (a) contact pressure distribution (0.08 mm); (b) von Mises stress (0.08 mm); (c) von Mises stress (0.11 mm); (d) equivalent plastic strain (0.11 mm).
Figure 7.
Simulation results for the bushing under peak combustion pressure at interferences of 0.08 mm and 0.11 mm: (a) contact pressure distribution (0.08 mm); (b) von Mises stress (0.08 mm); (c) von Mises stress (0.11 mm); (d) equivalent plastic strain (0.11 mm).
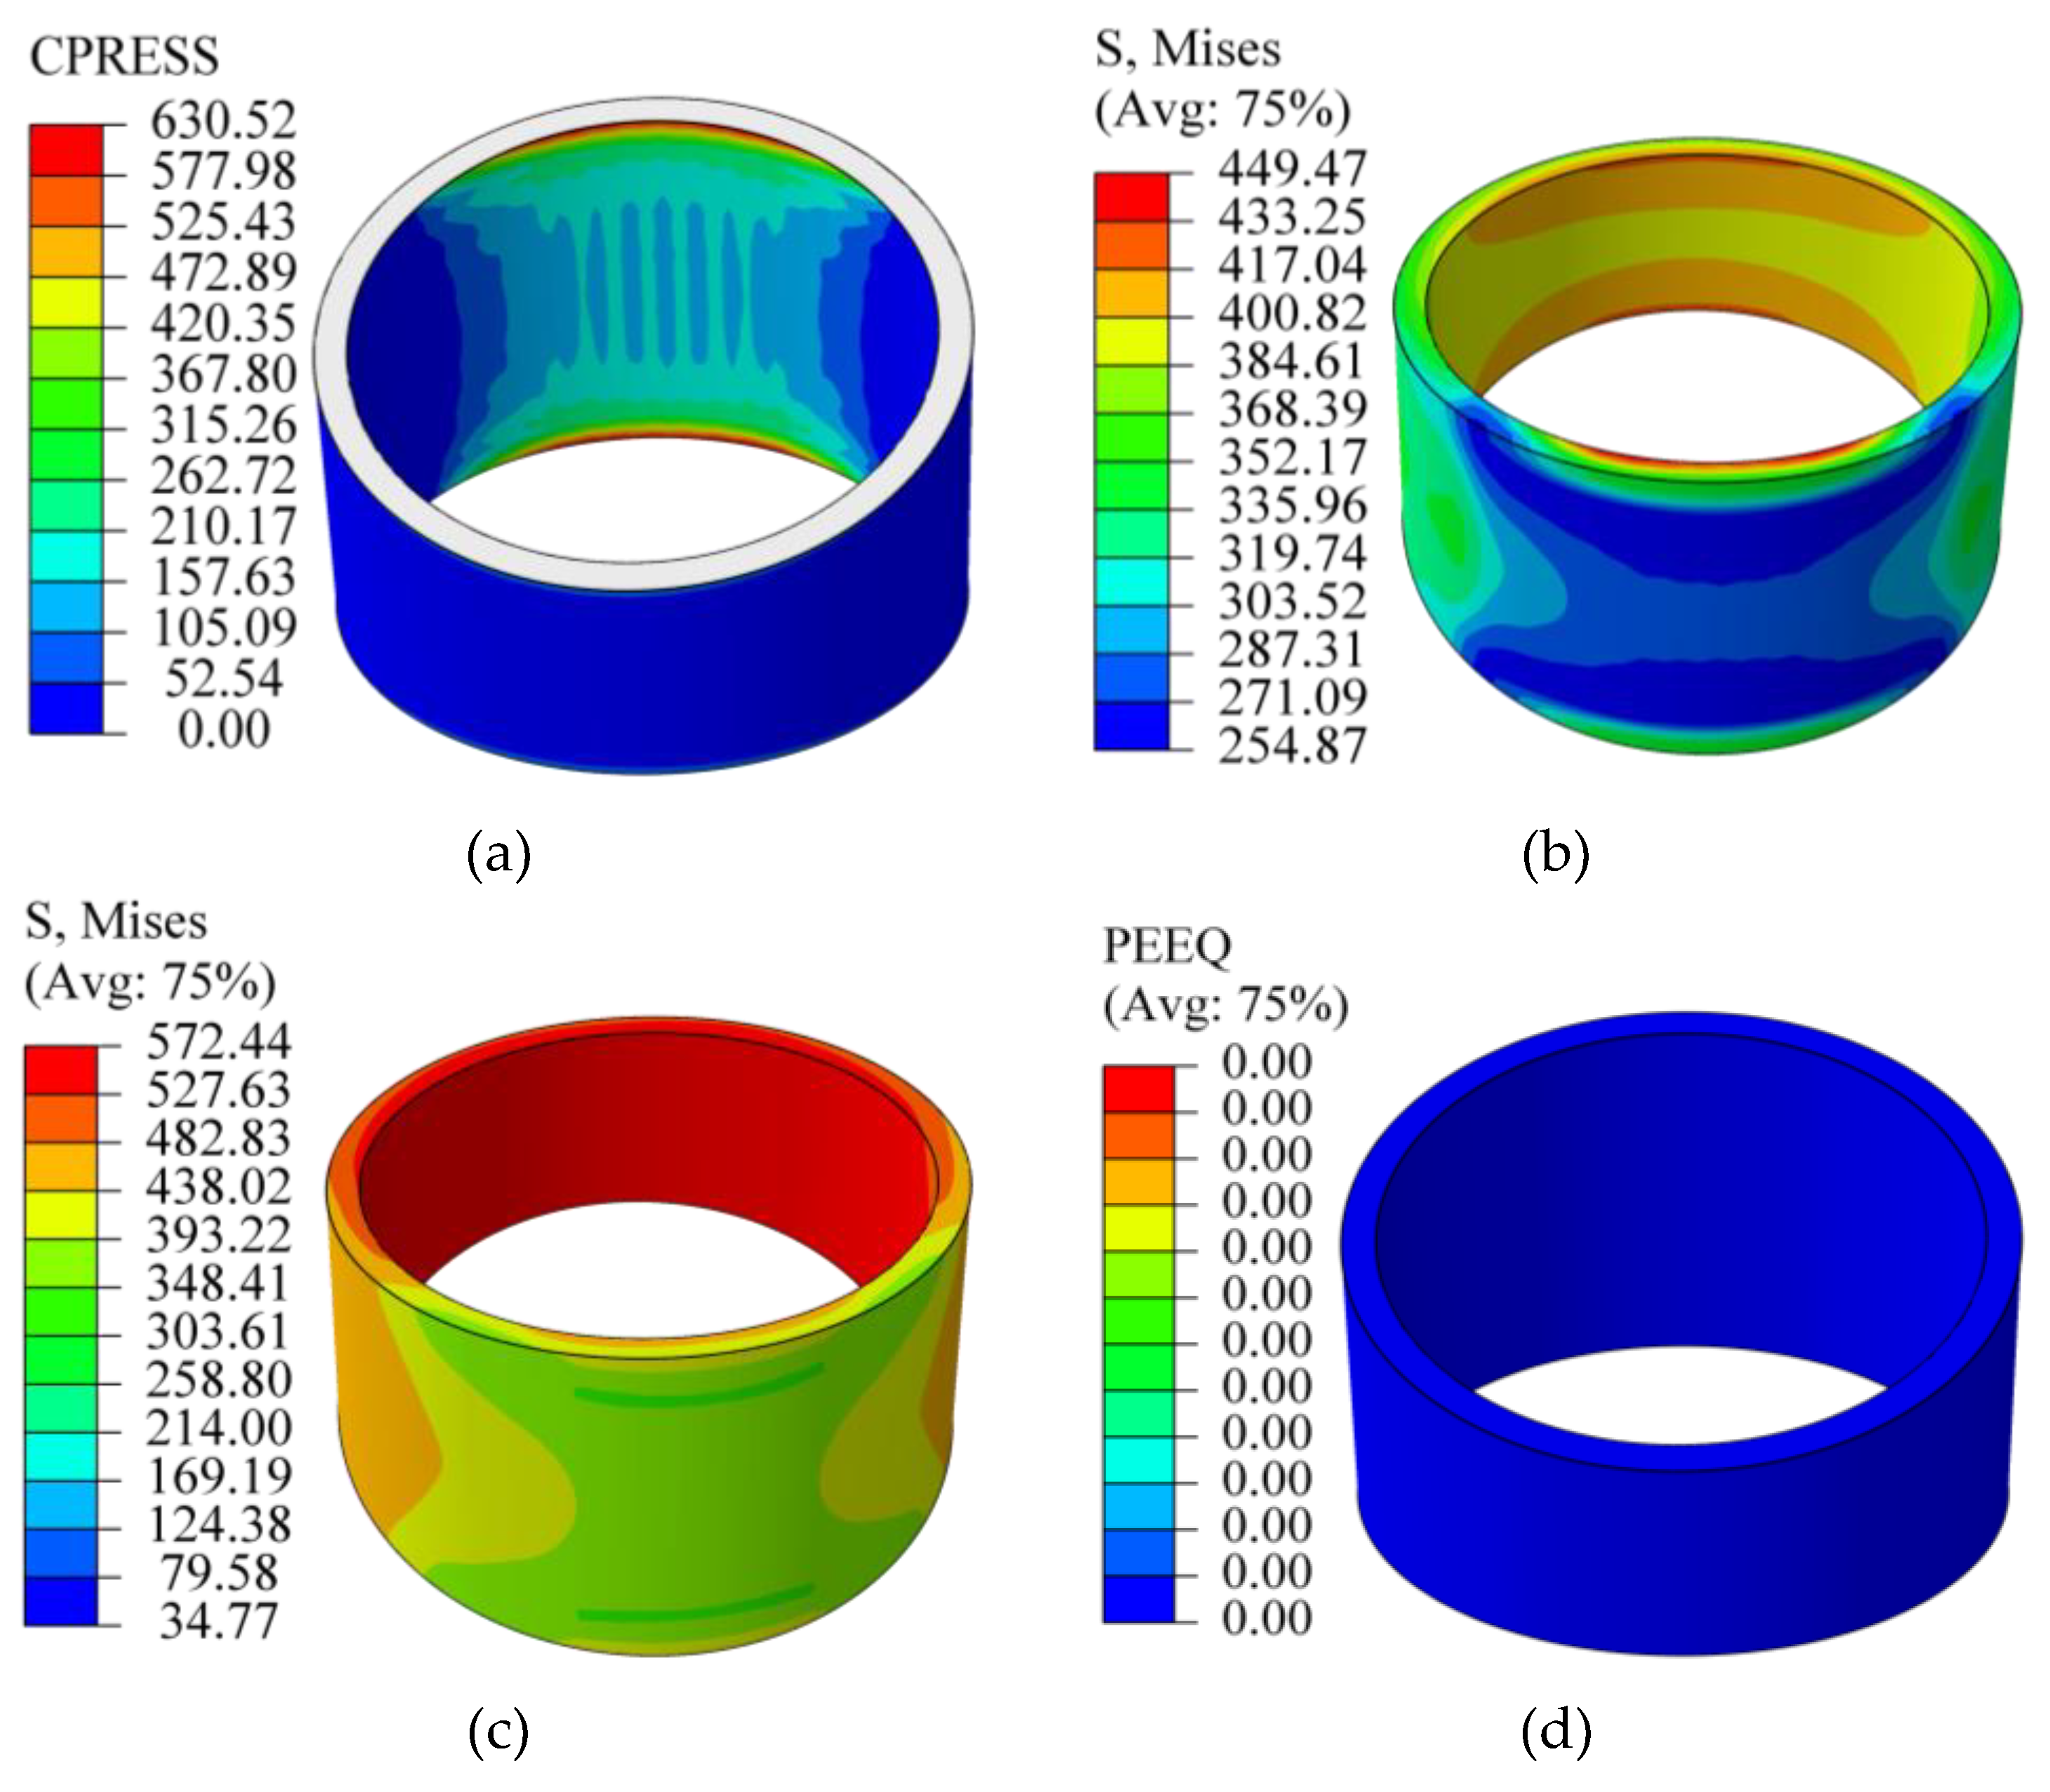
Figure 8.
Parametric simulation results for the bushing over an interference range of 0.08–0.11 mm: (a) maximum von Mises stress comparison; (b) outer-surface contact pressure distribution.
Figure 8.
Parametric simulation results for the bushing over an interference range of 0.08–0.11 mm: (a) maximum von Mises stress comparison; (b) outer-surface contact pressure distribution.

Figure 9.
Family of push-out force versus displacement curves for the connecting rod bushing at interferences of 0.08–0.11 mm.
Figure 9.
Family of push-out force versus displacement curves for the connecting rod bushing at interferences of 0.08–0.11 mm.
Figure 10.
von Mises stress contour in the bushing at 0.09 mm interference.
Figure 11.
Contact pressure contour on the bushing outer surface at 0.09 mm interference.
Figure 12.
Comparison of maximum von Mises stress for bushings with different inner diameters.
Figure 13.
Comparison of outer-surface contact pressure for bushings with different inner diameters.
Figure 13.
Comparison of outer-surface contact pressure for bushings with different inner diameters.

Figure 14.
Comparison of maximum von Mises stress in bushings with different inner diameters under combustion pressure.
Figure 14.
Comparison of maximum von Mises stress in bushings with different inner diameters under combustion pressure.
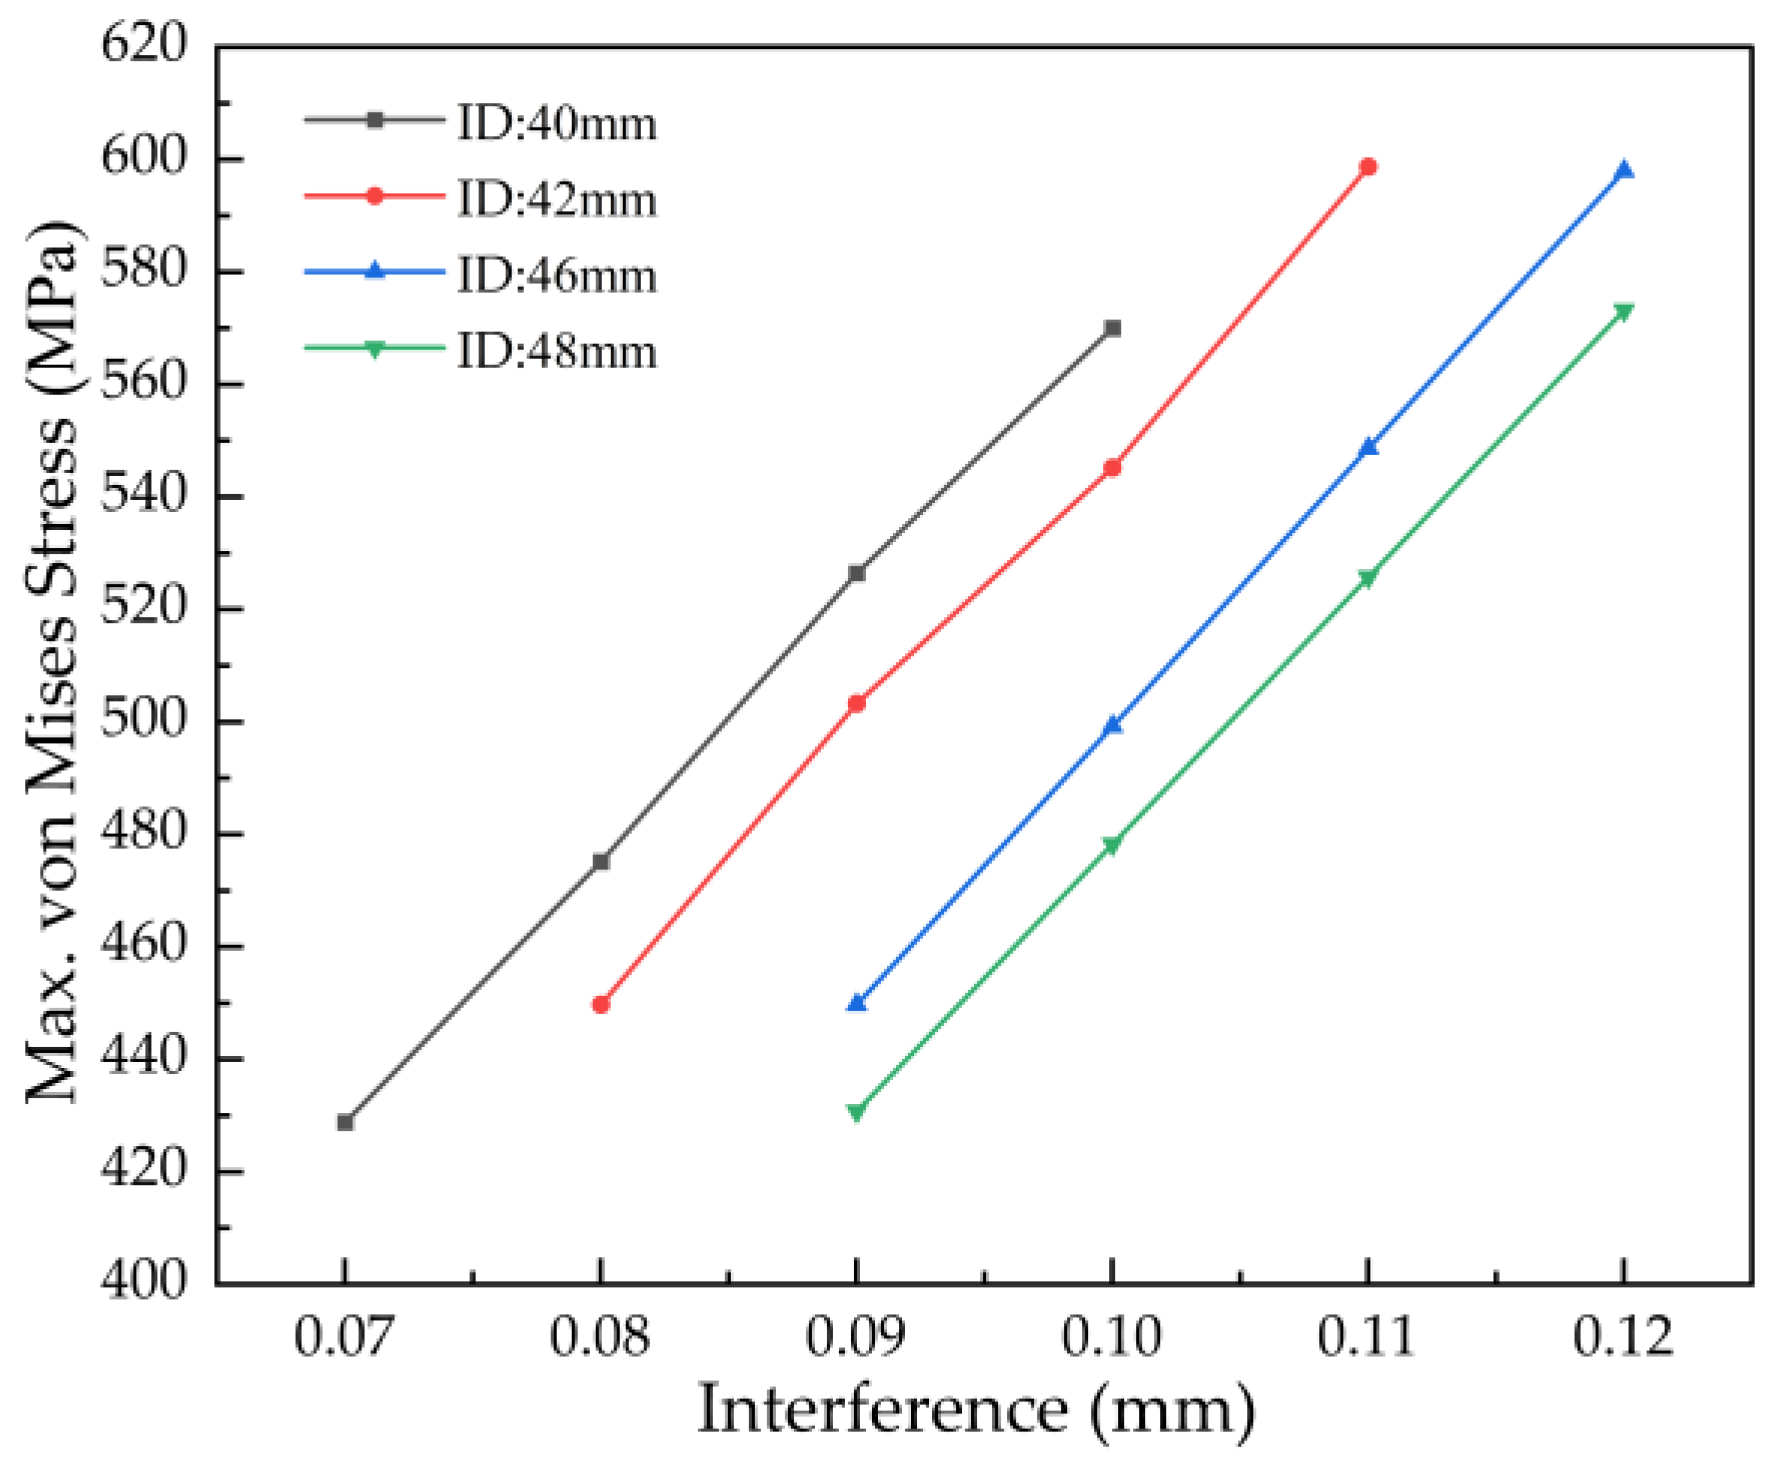
Figure 15.
Comparison of contact pressure on the outer surface of bushings with different inner diameters under combustion pressure.
Figure 15.
Comparison of contact pressure on the outer surface of bushings with different inner diameters under combustion pressure.
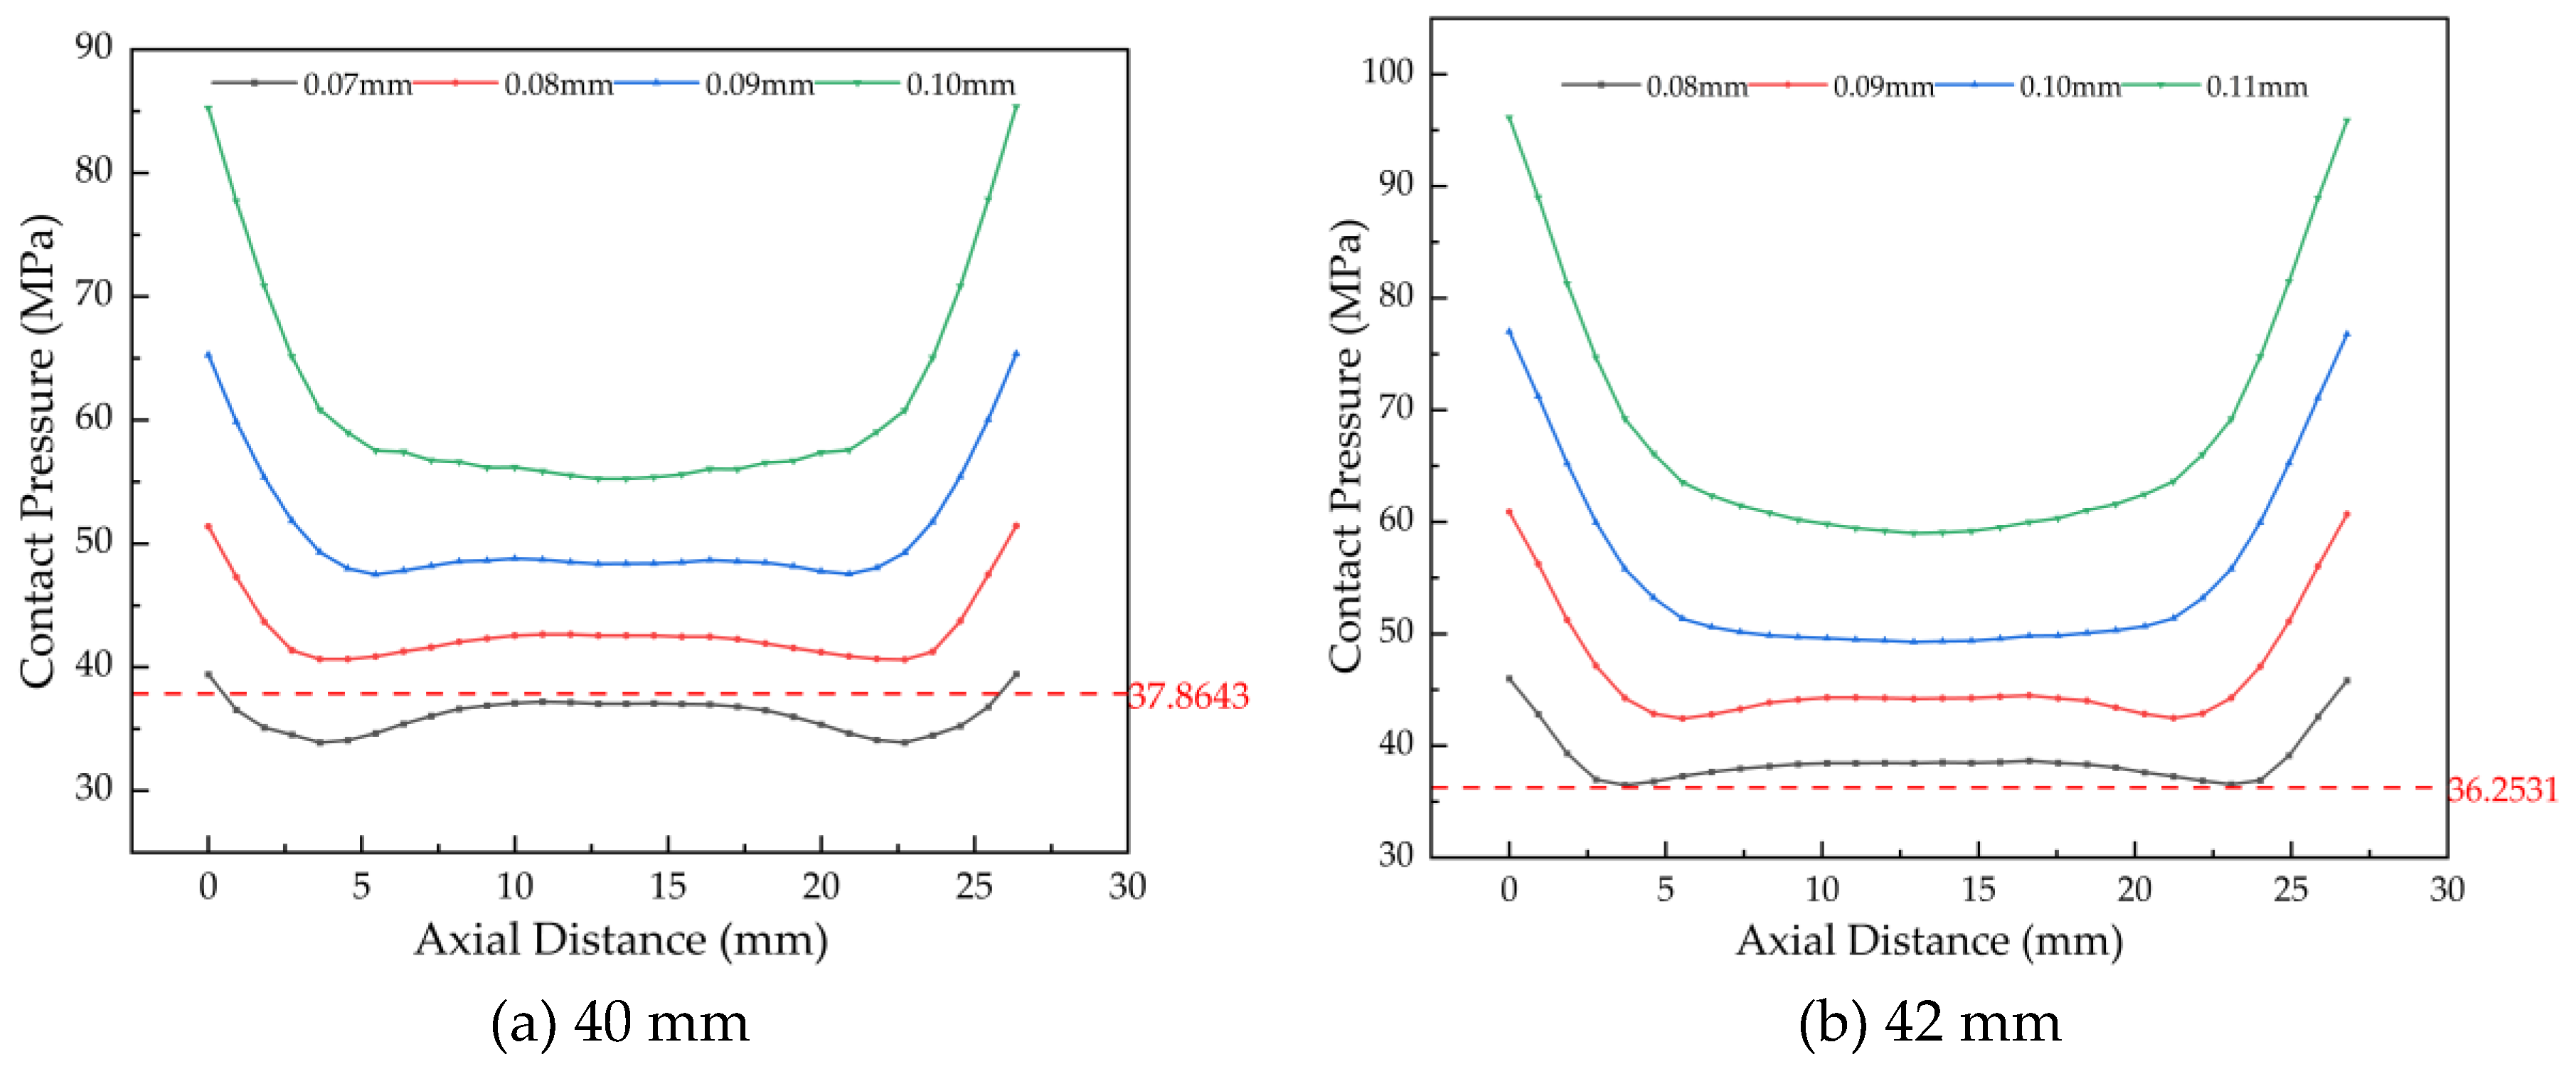
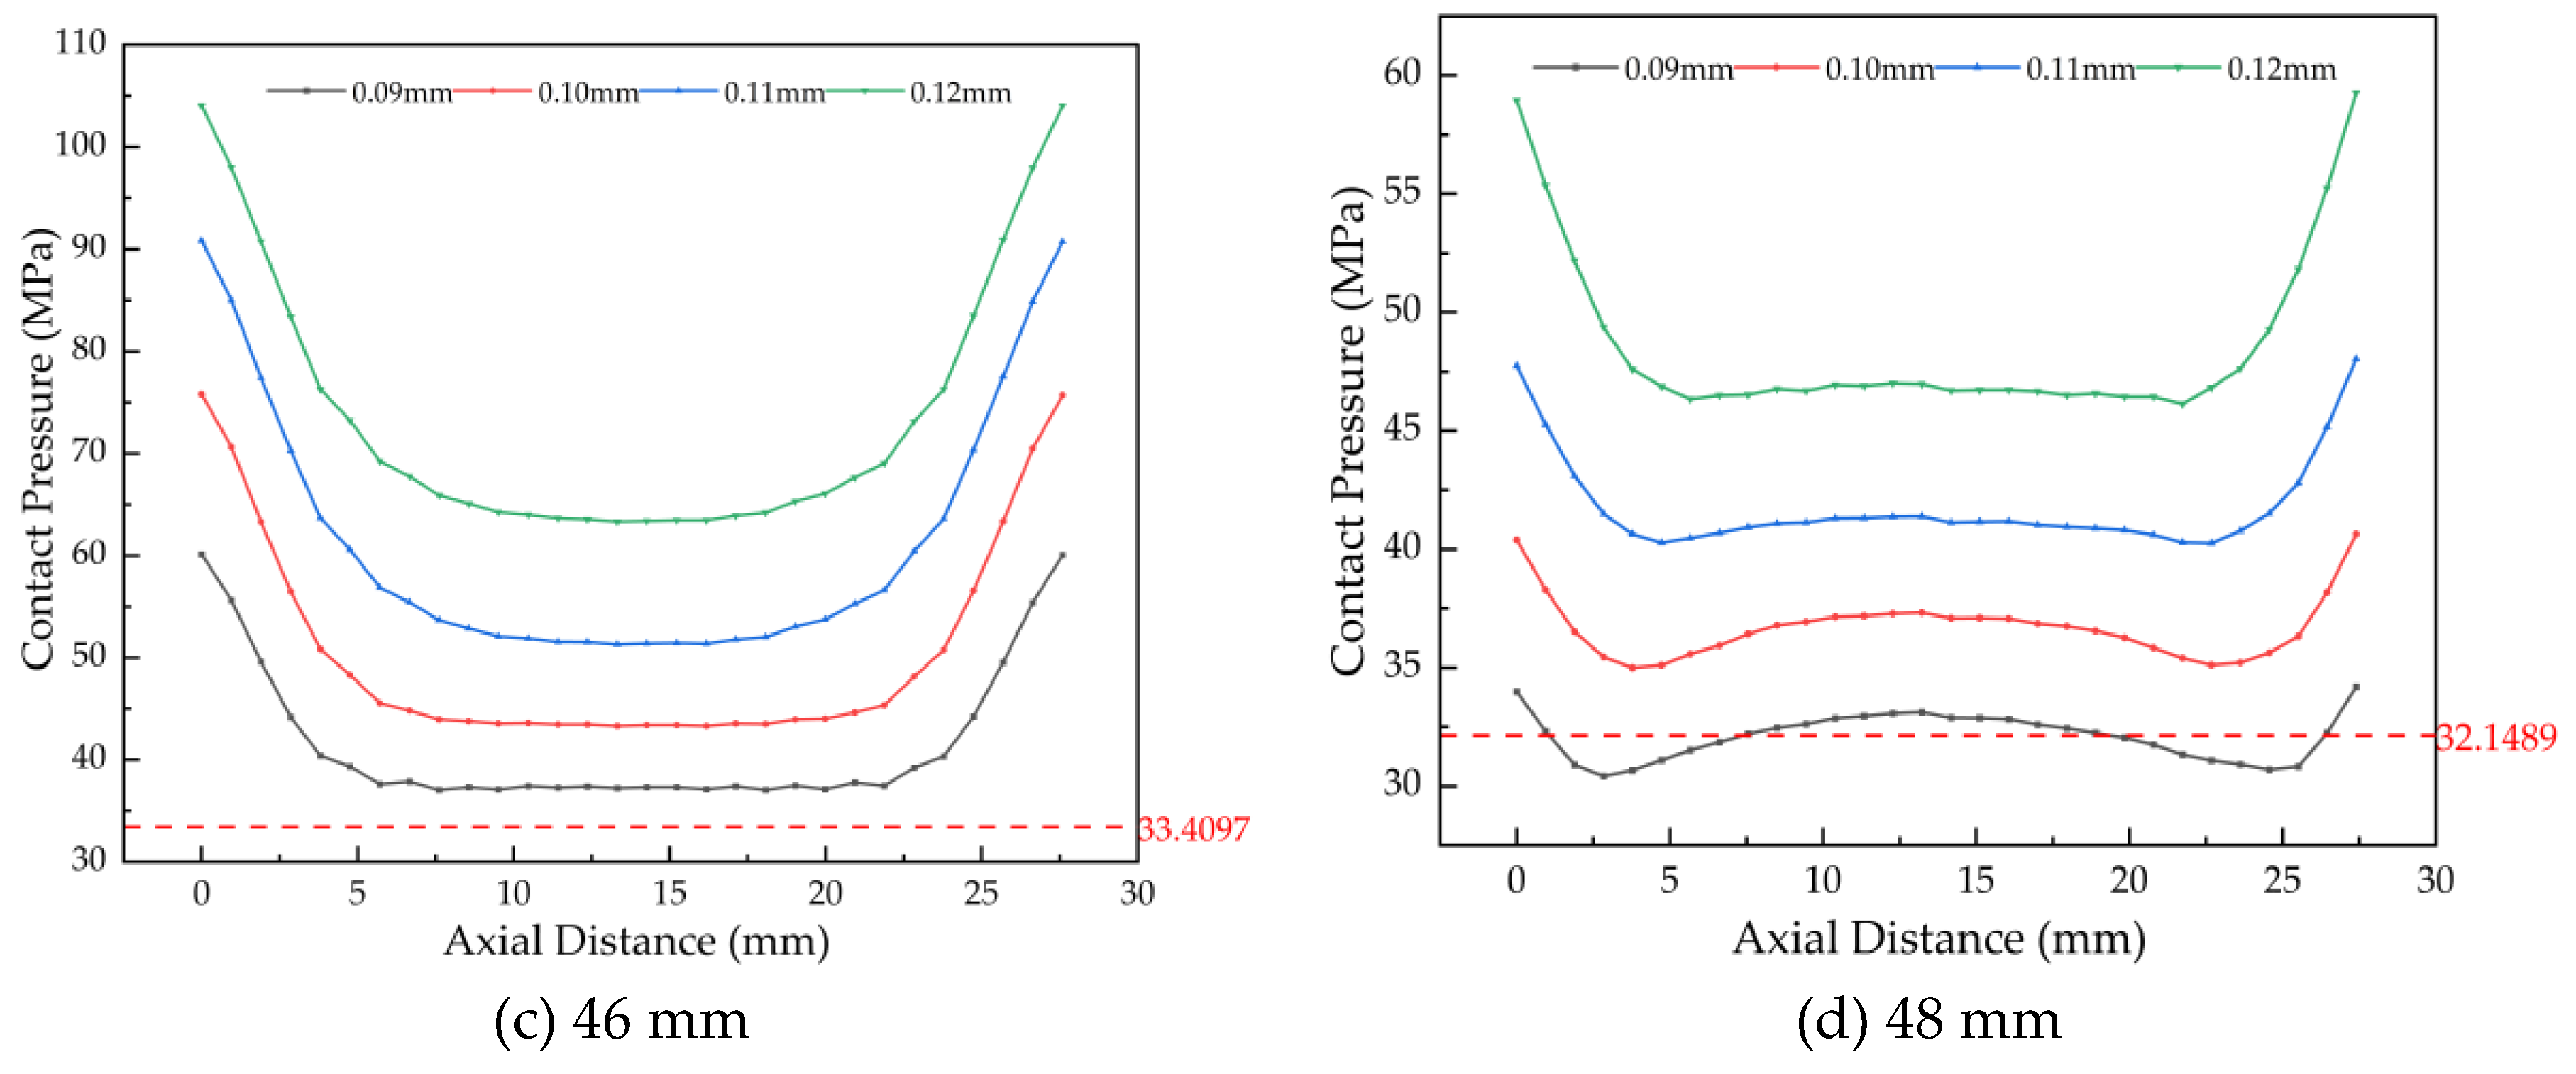
Figure 16.
Comparison of maximum von Mises stress for bushings with different wall thicknesses.
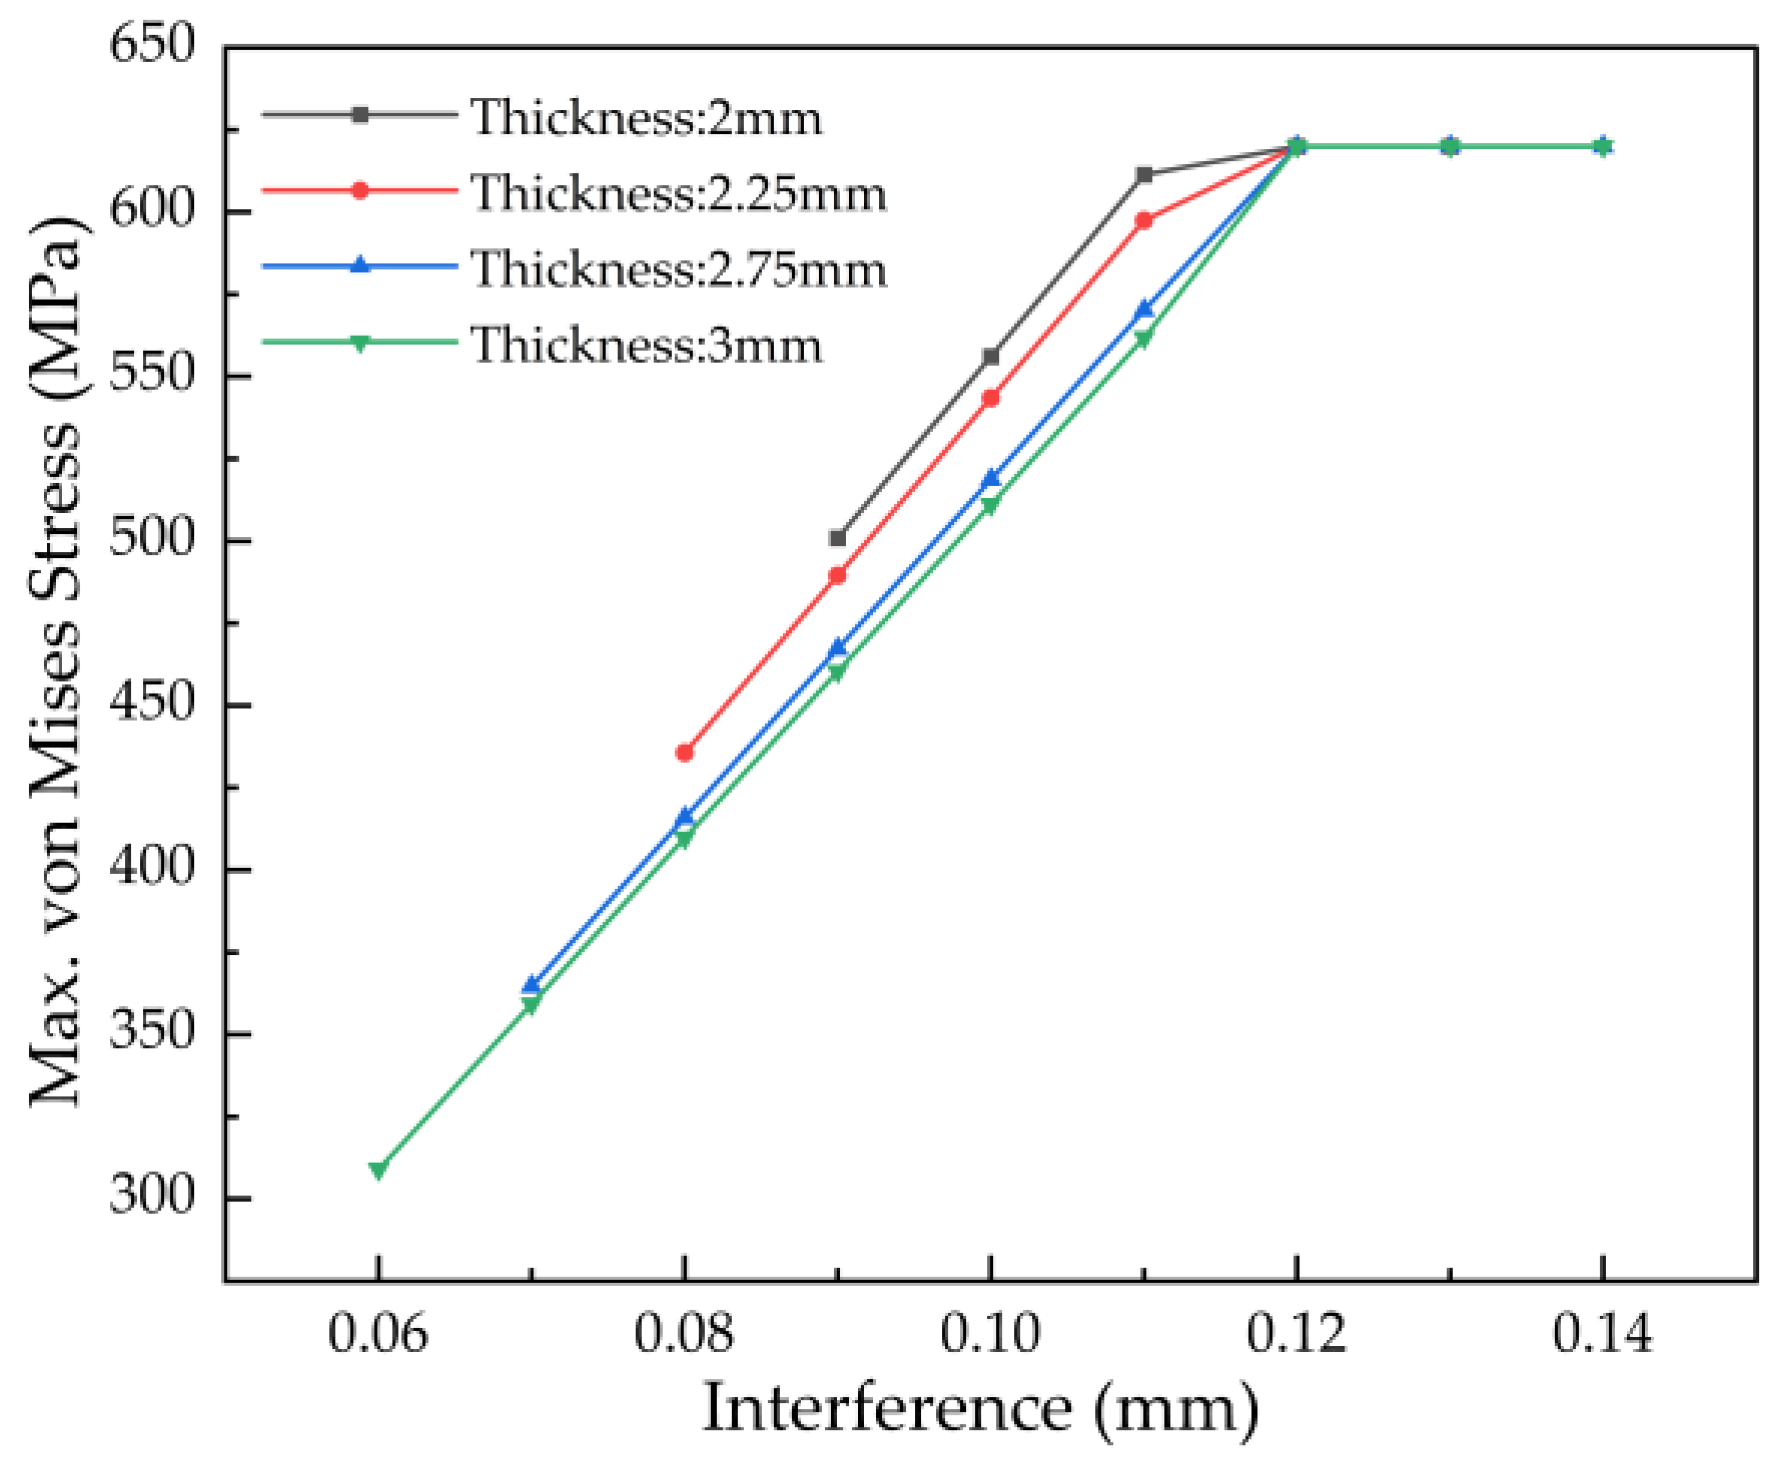
Figure 17.
Comparison of contact pressure on the outer surface of bushings with different wall thicknesses.
Figure 17.
Comparison of contact pressure on the outer surface of bushings with different wall thicknesses.
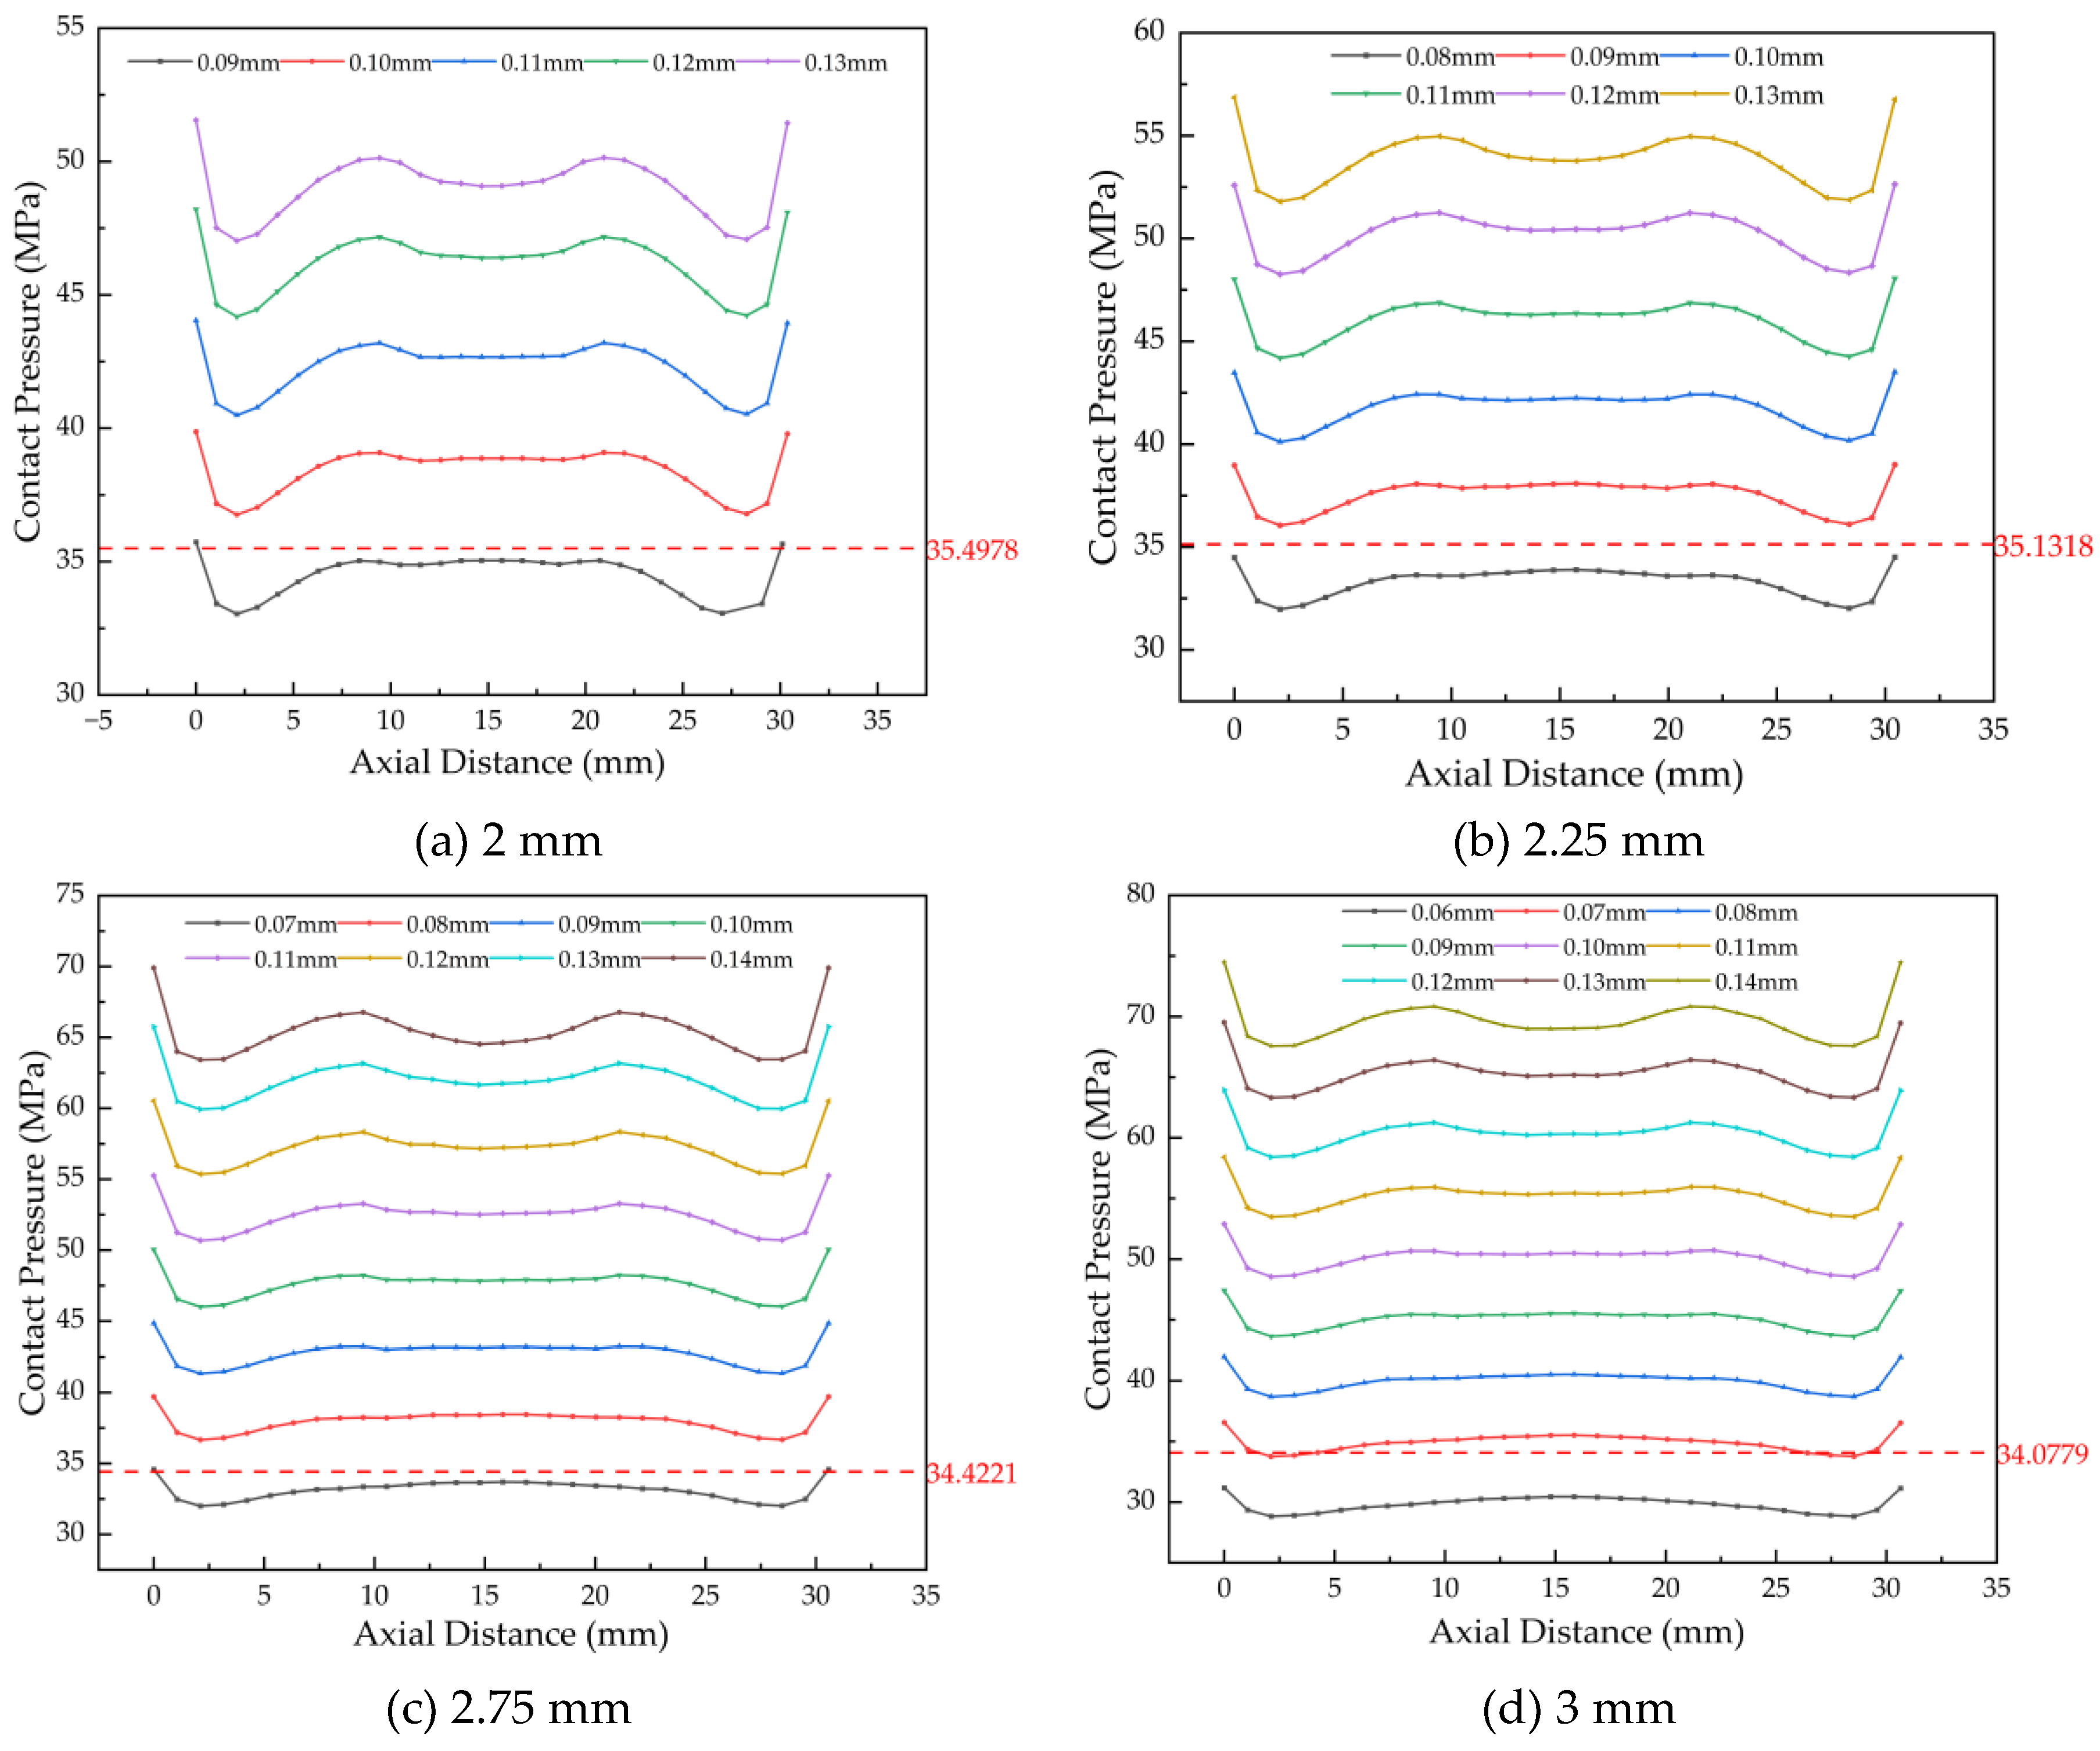
Figure 18.
Comparison of maximum von Mises stress for bushings with different widths.
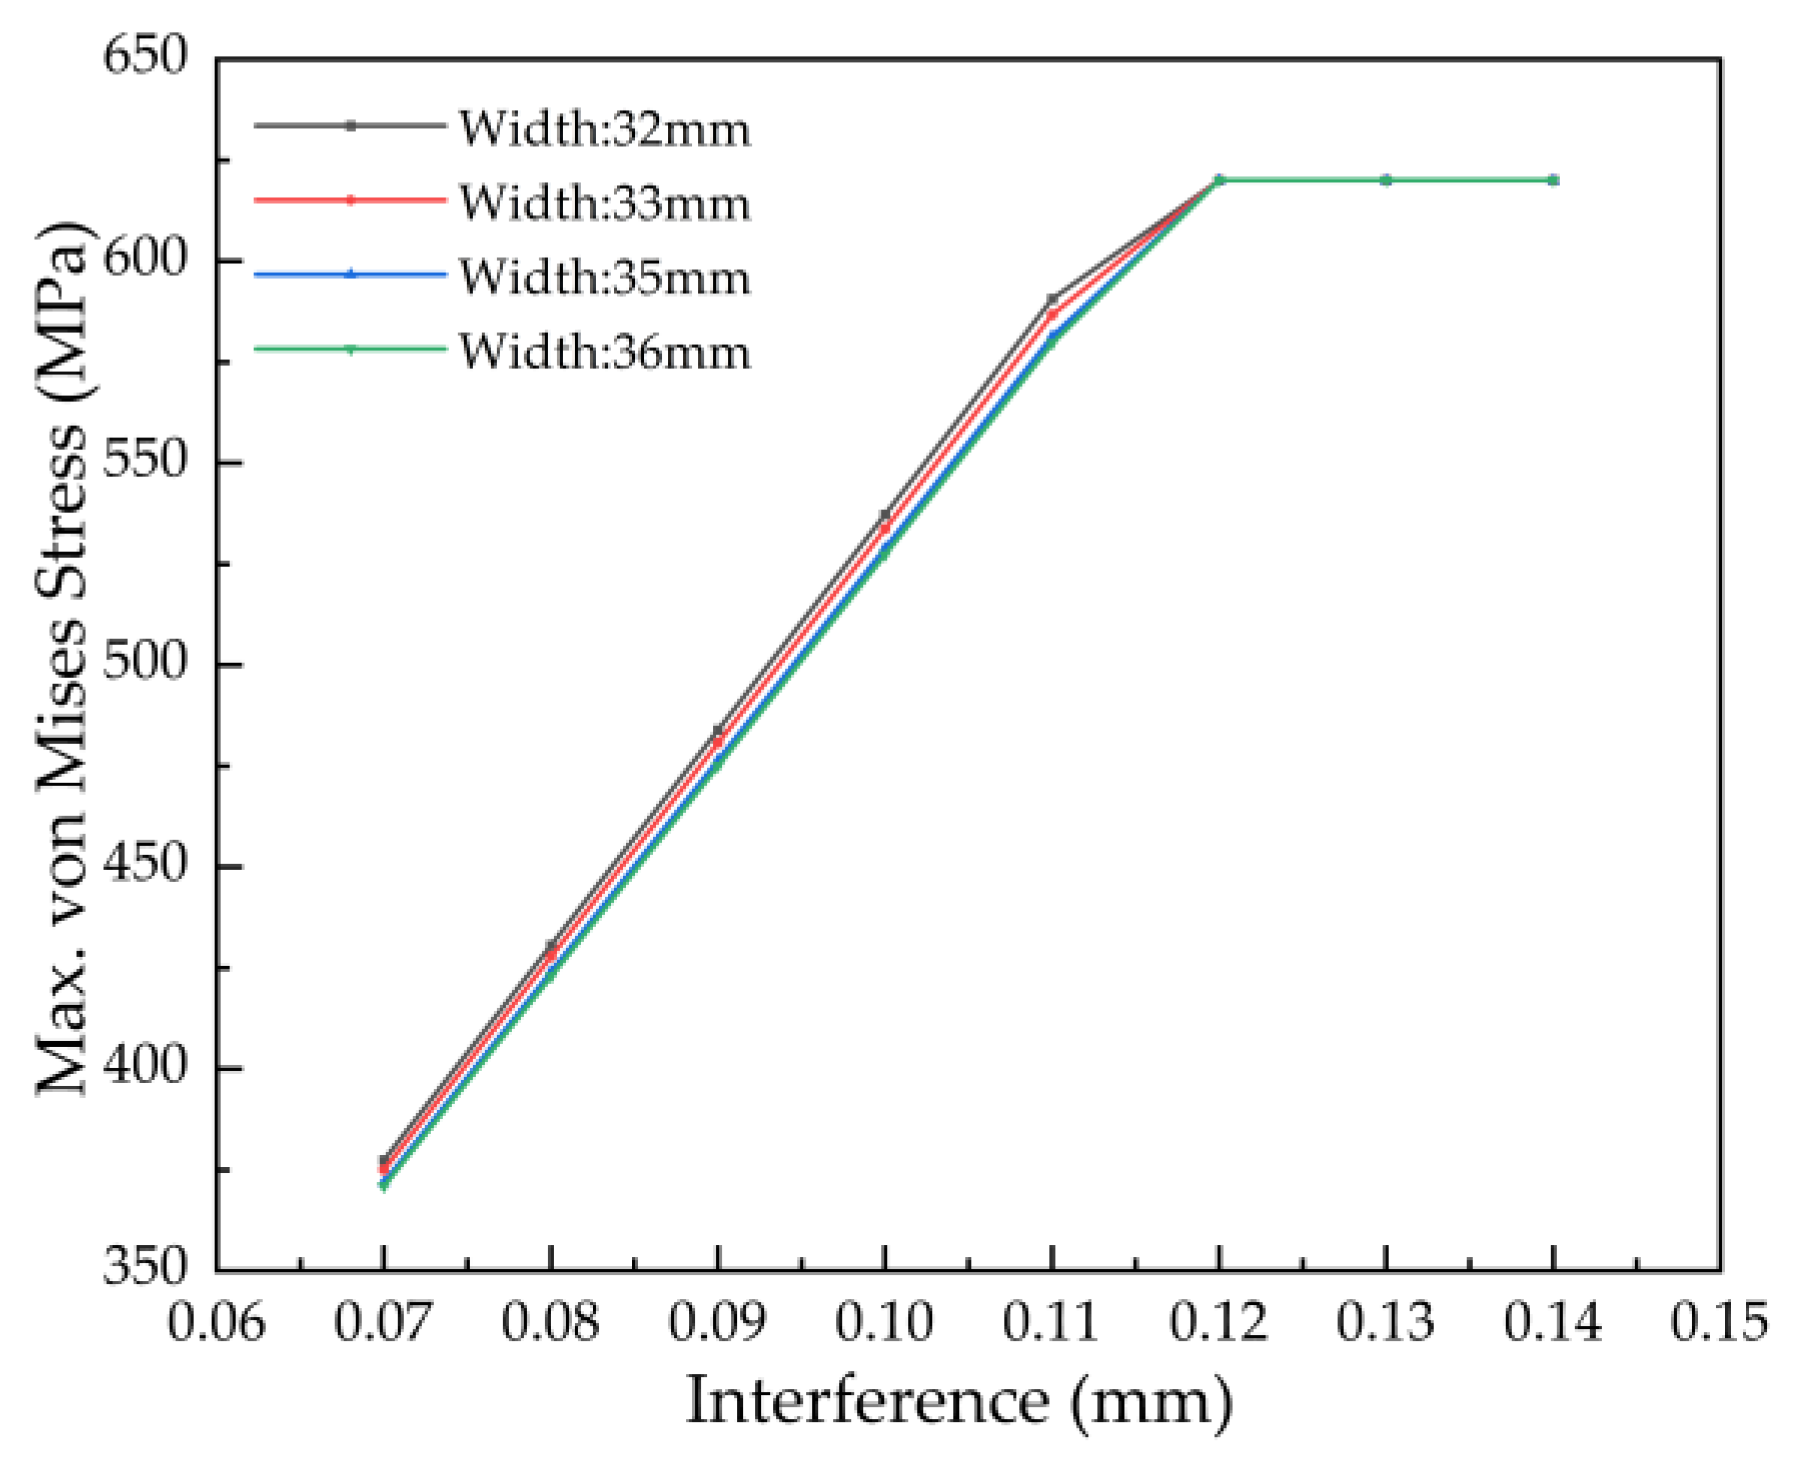
Figure 19.
Comparison of contact pressure on the outer surface of bushings with different widths.

Figure 20.
Family of push-out force vs. displacement curves for bushings with varying inner diameters.
Figure 20.
Family of push-out force vs. displacement curves for bushings with varying inner diameters.
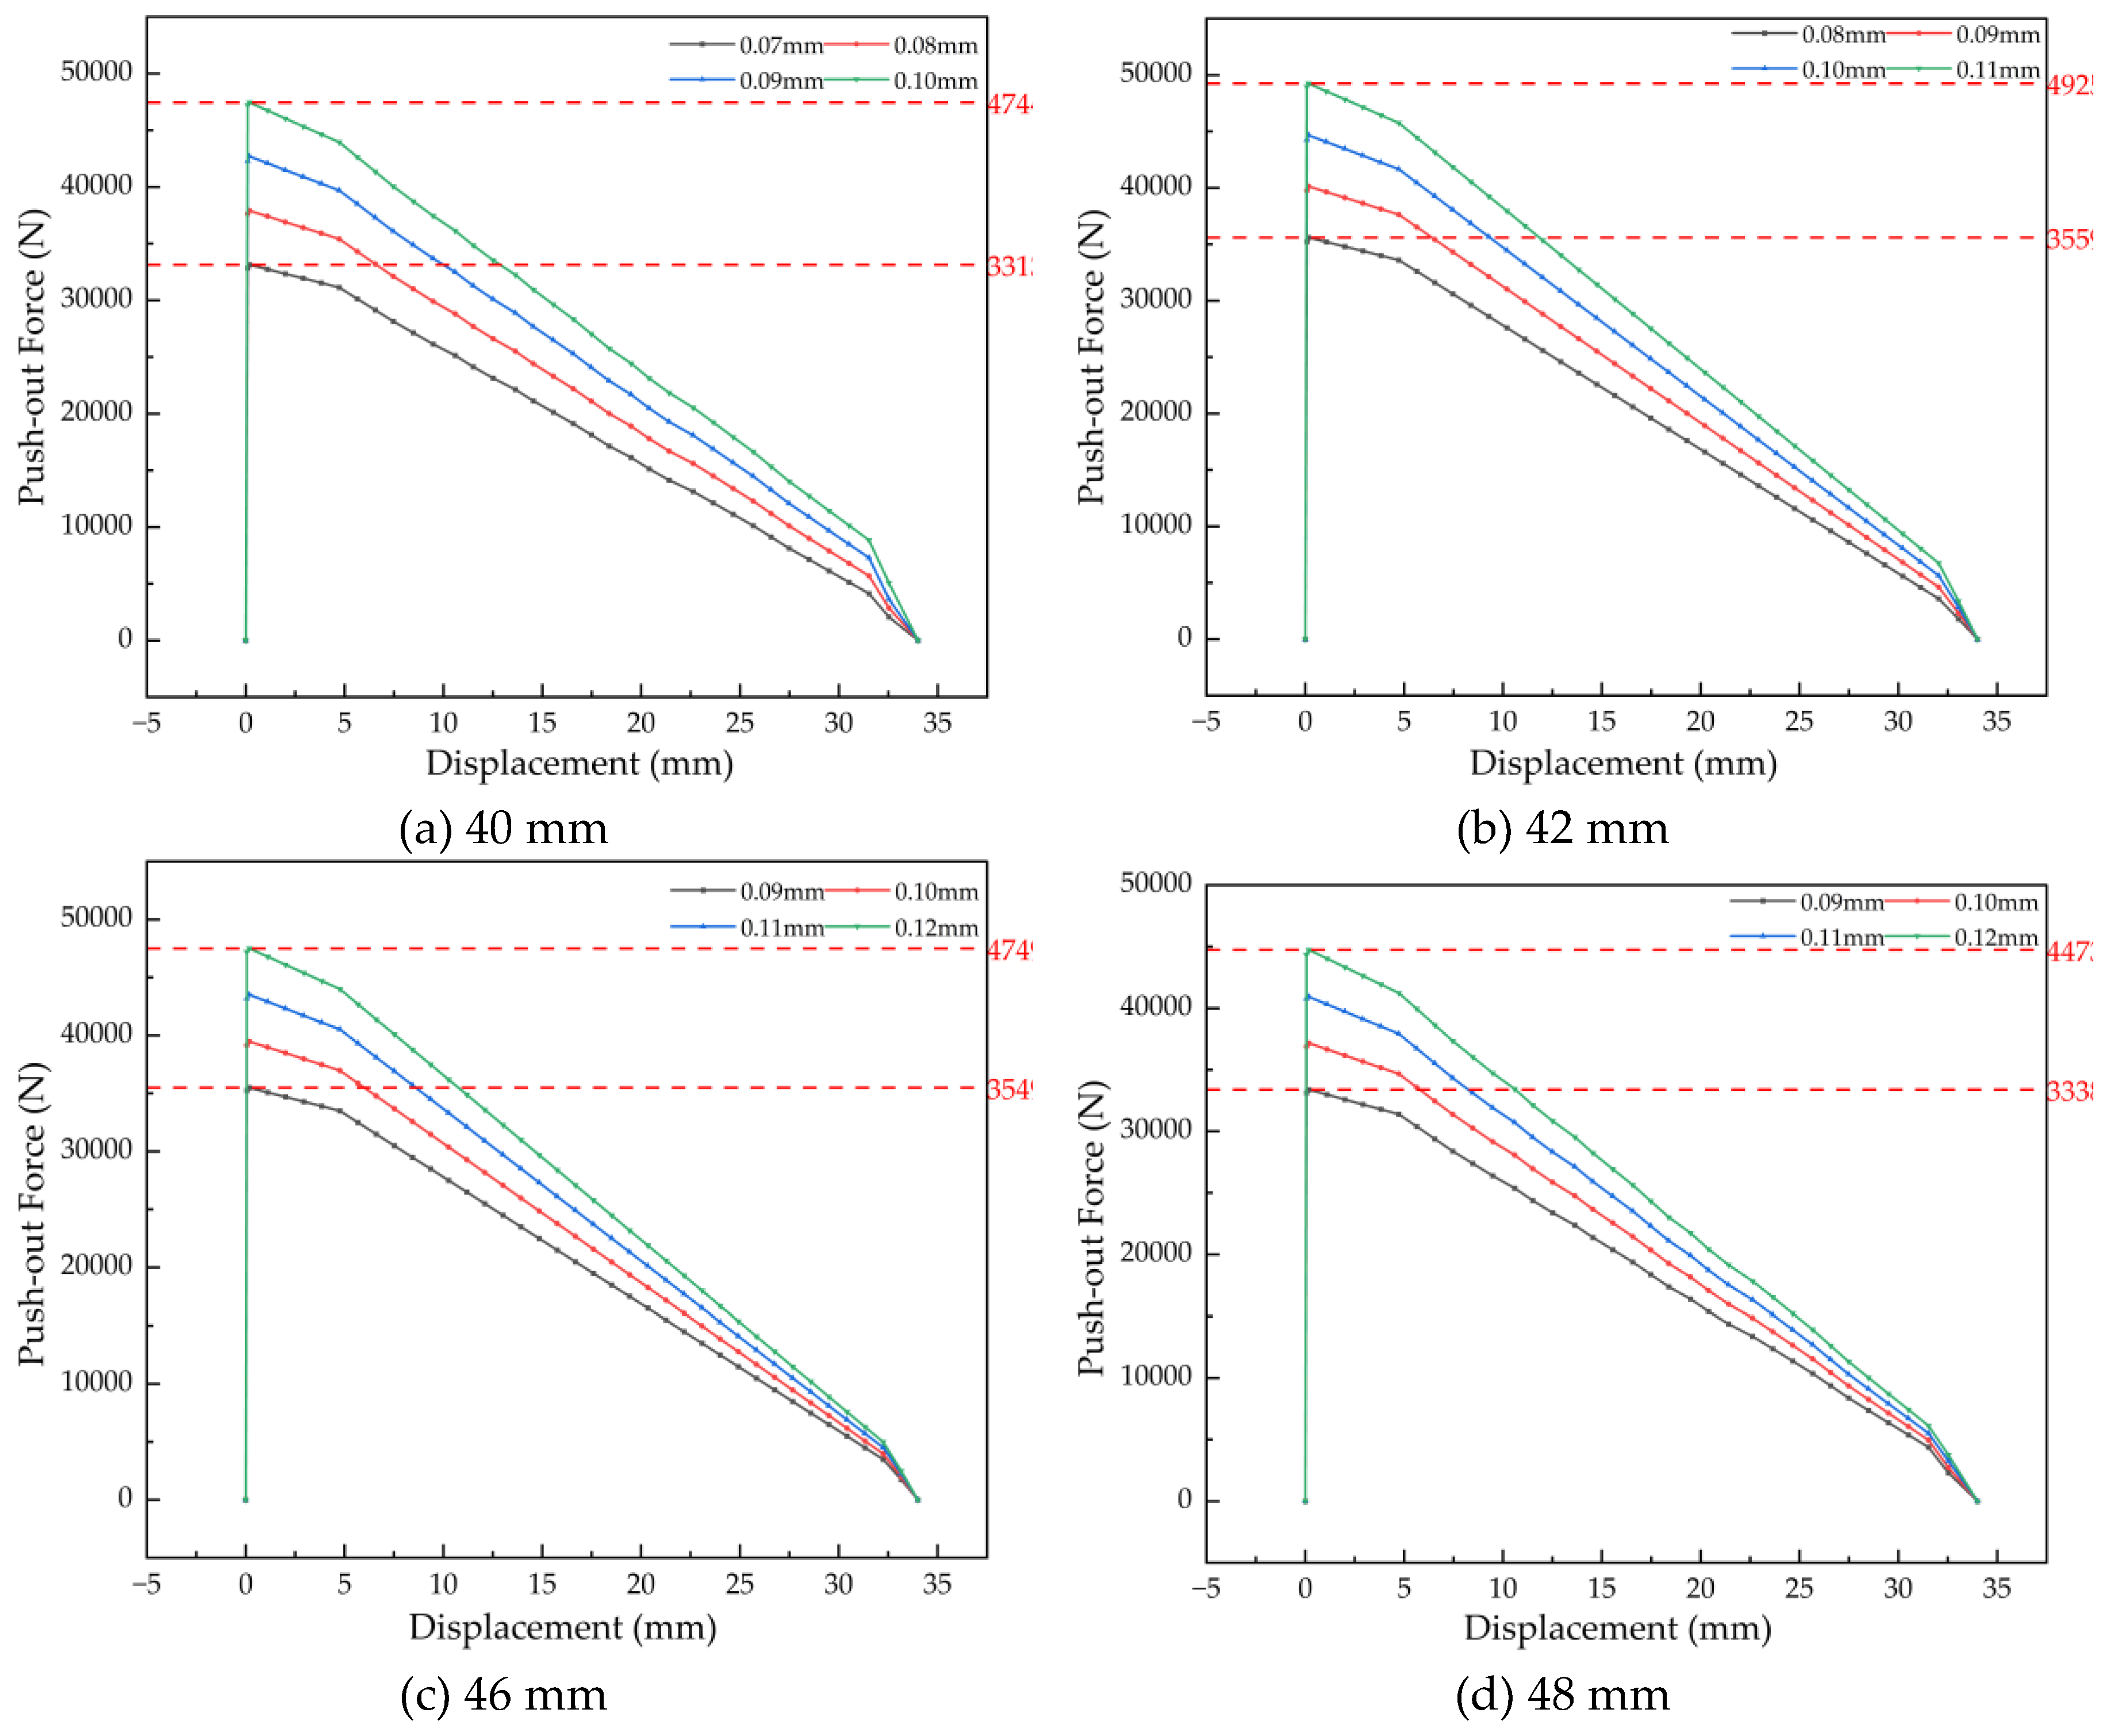
Figure 21.
Family of push-out force vs. displacement curves for bushings with varying wall thicknesses.
Figure 21.
Family of push-out force vs. displacement curves for bushings with varying wall thicknesses.
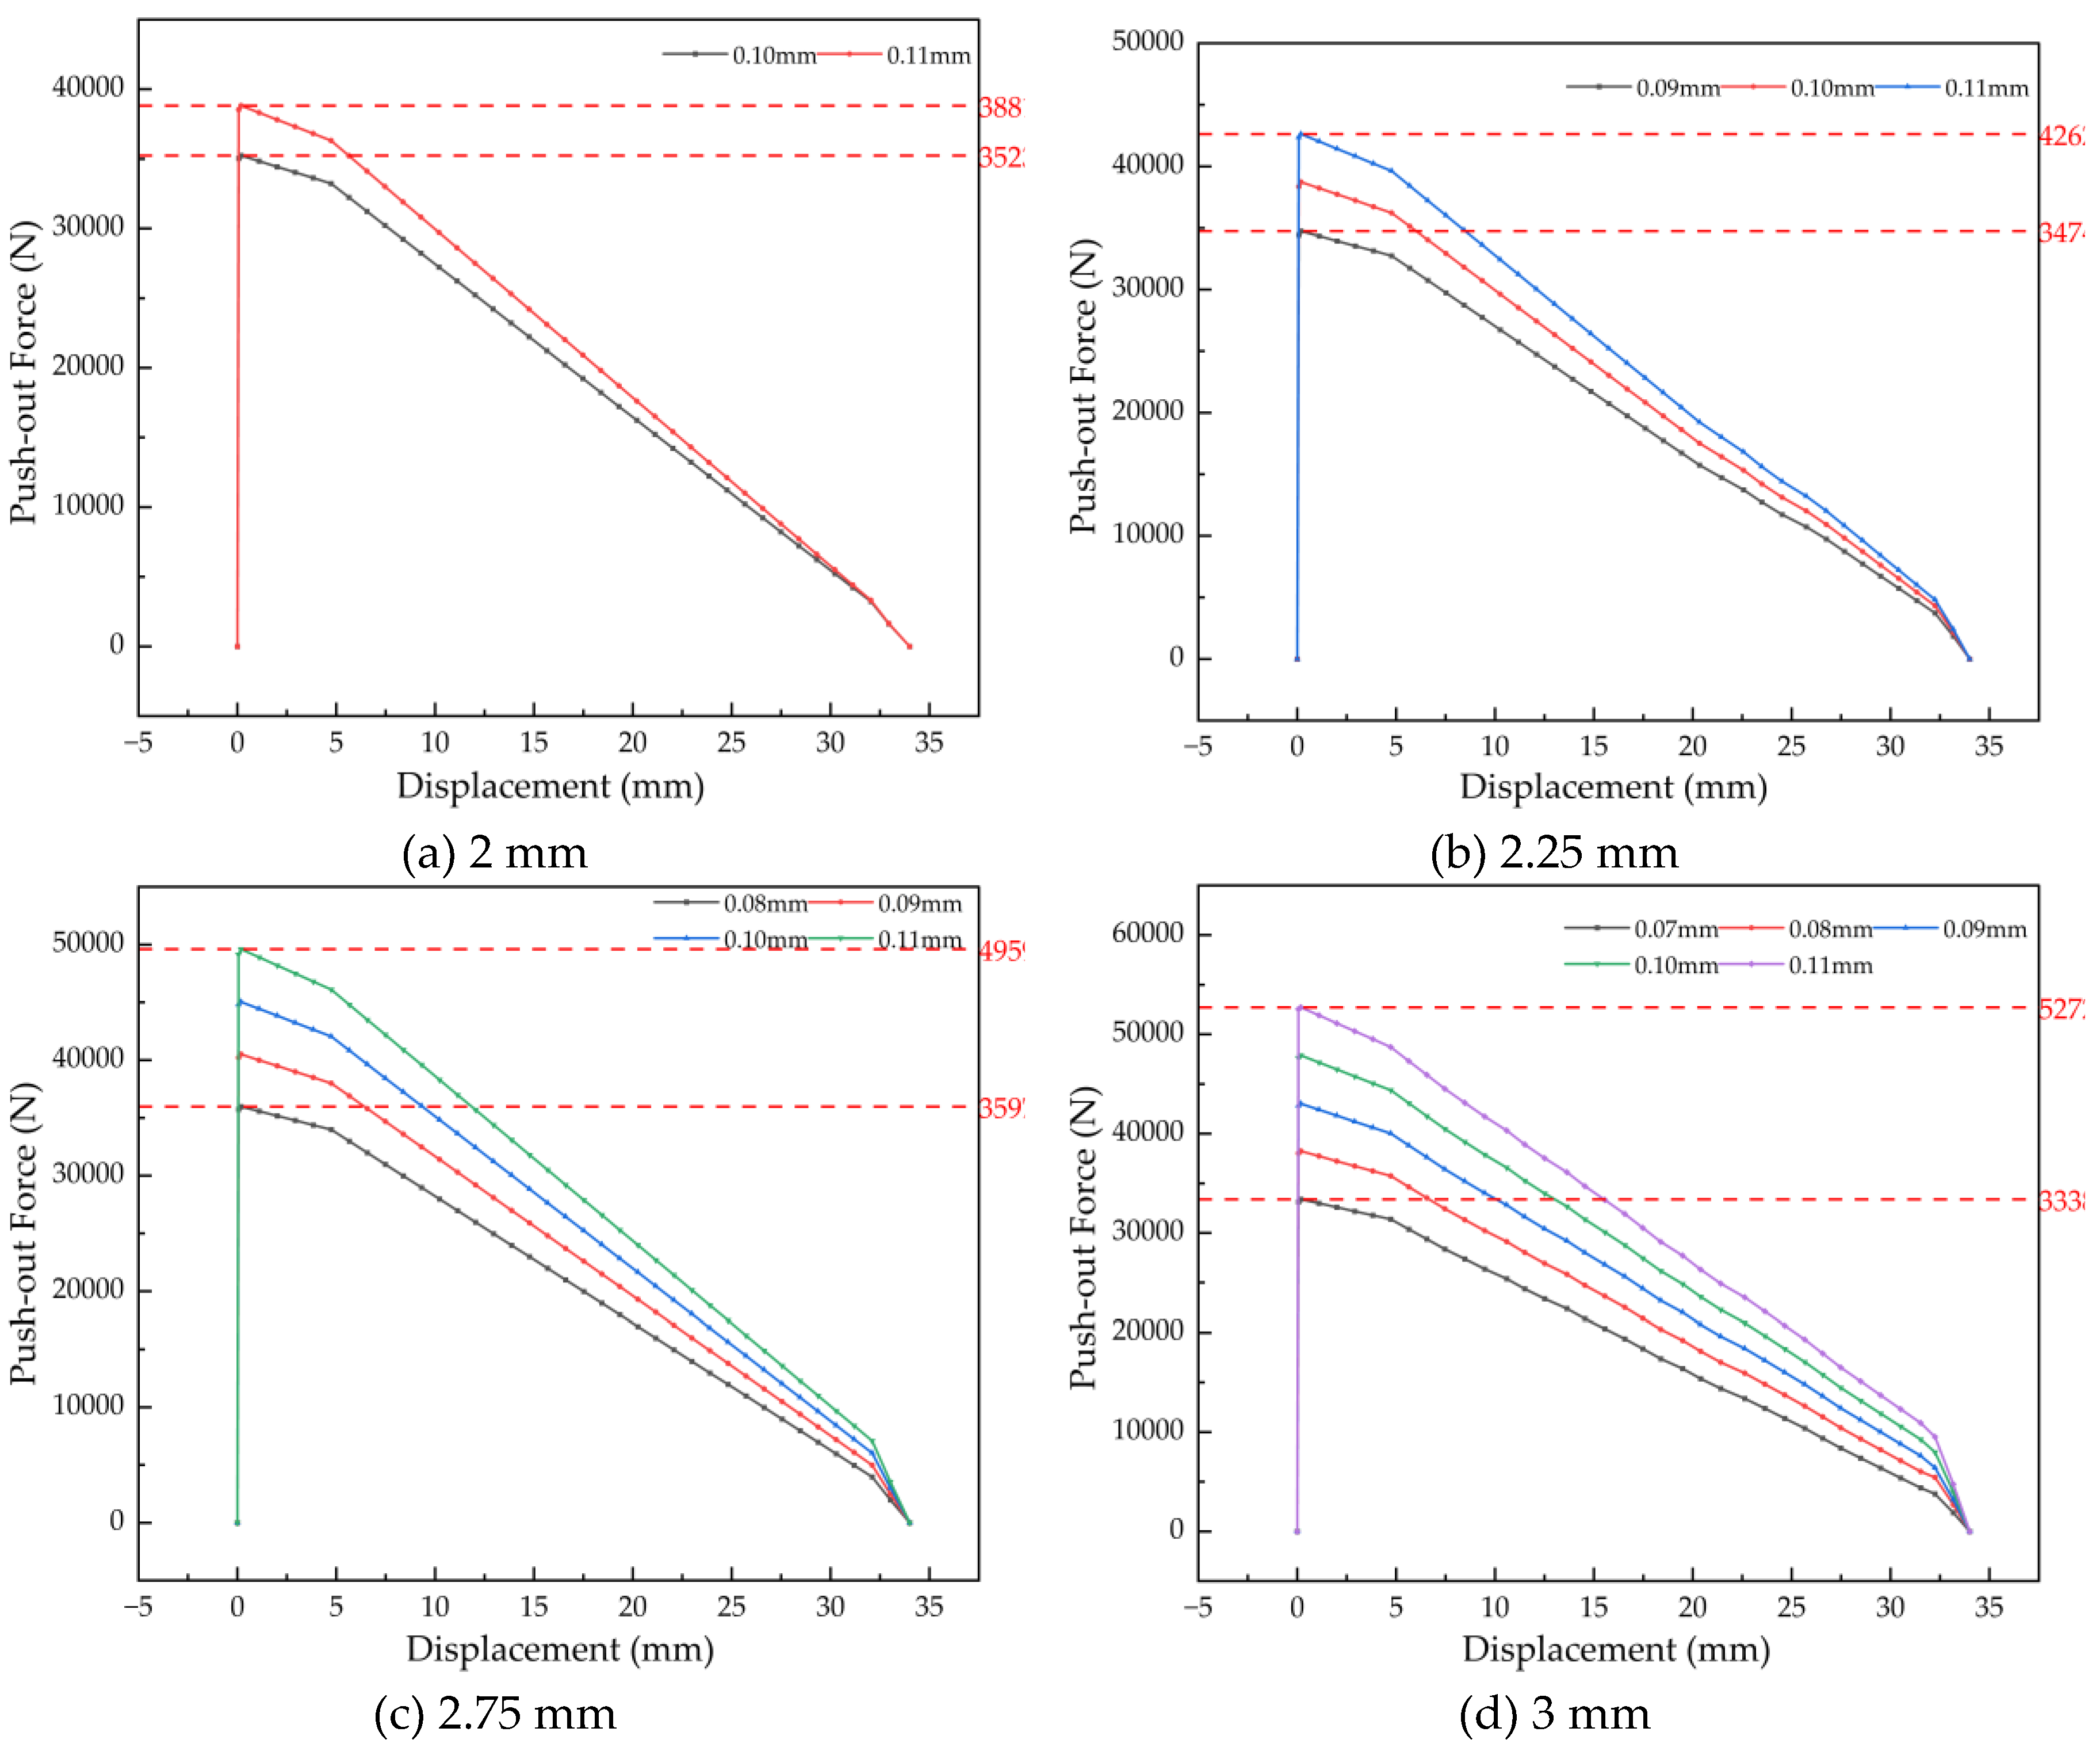
Figure 22.
Family of push-out force vs. displacement curves for bushings with varying widths.
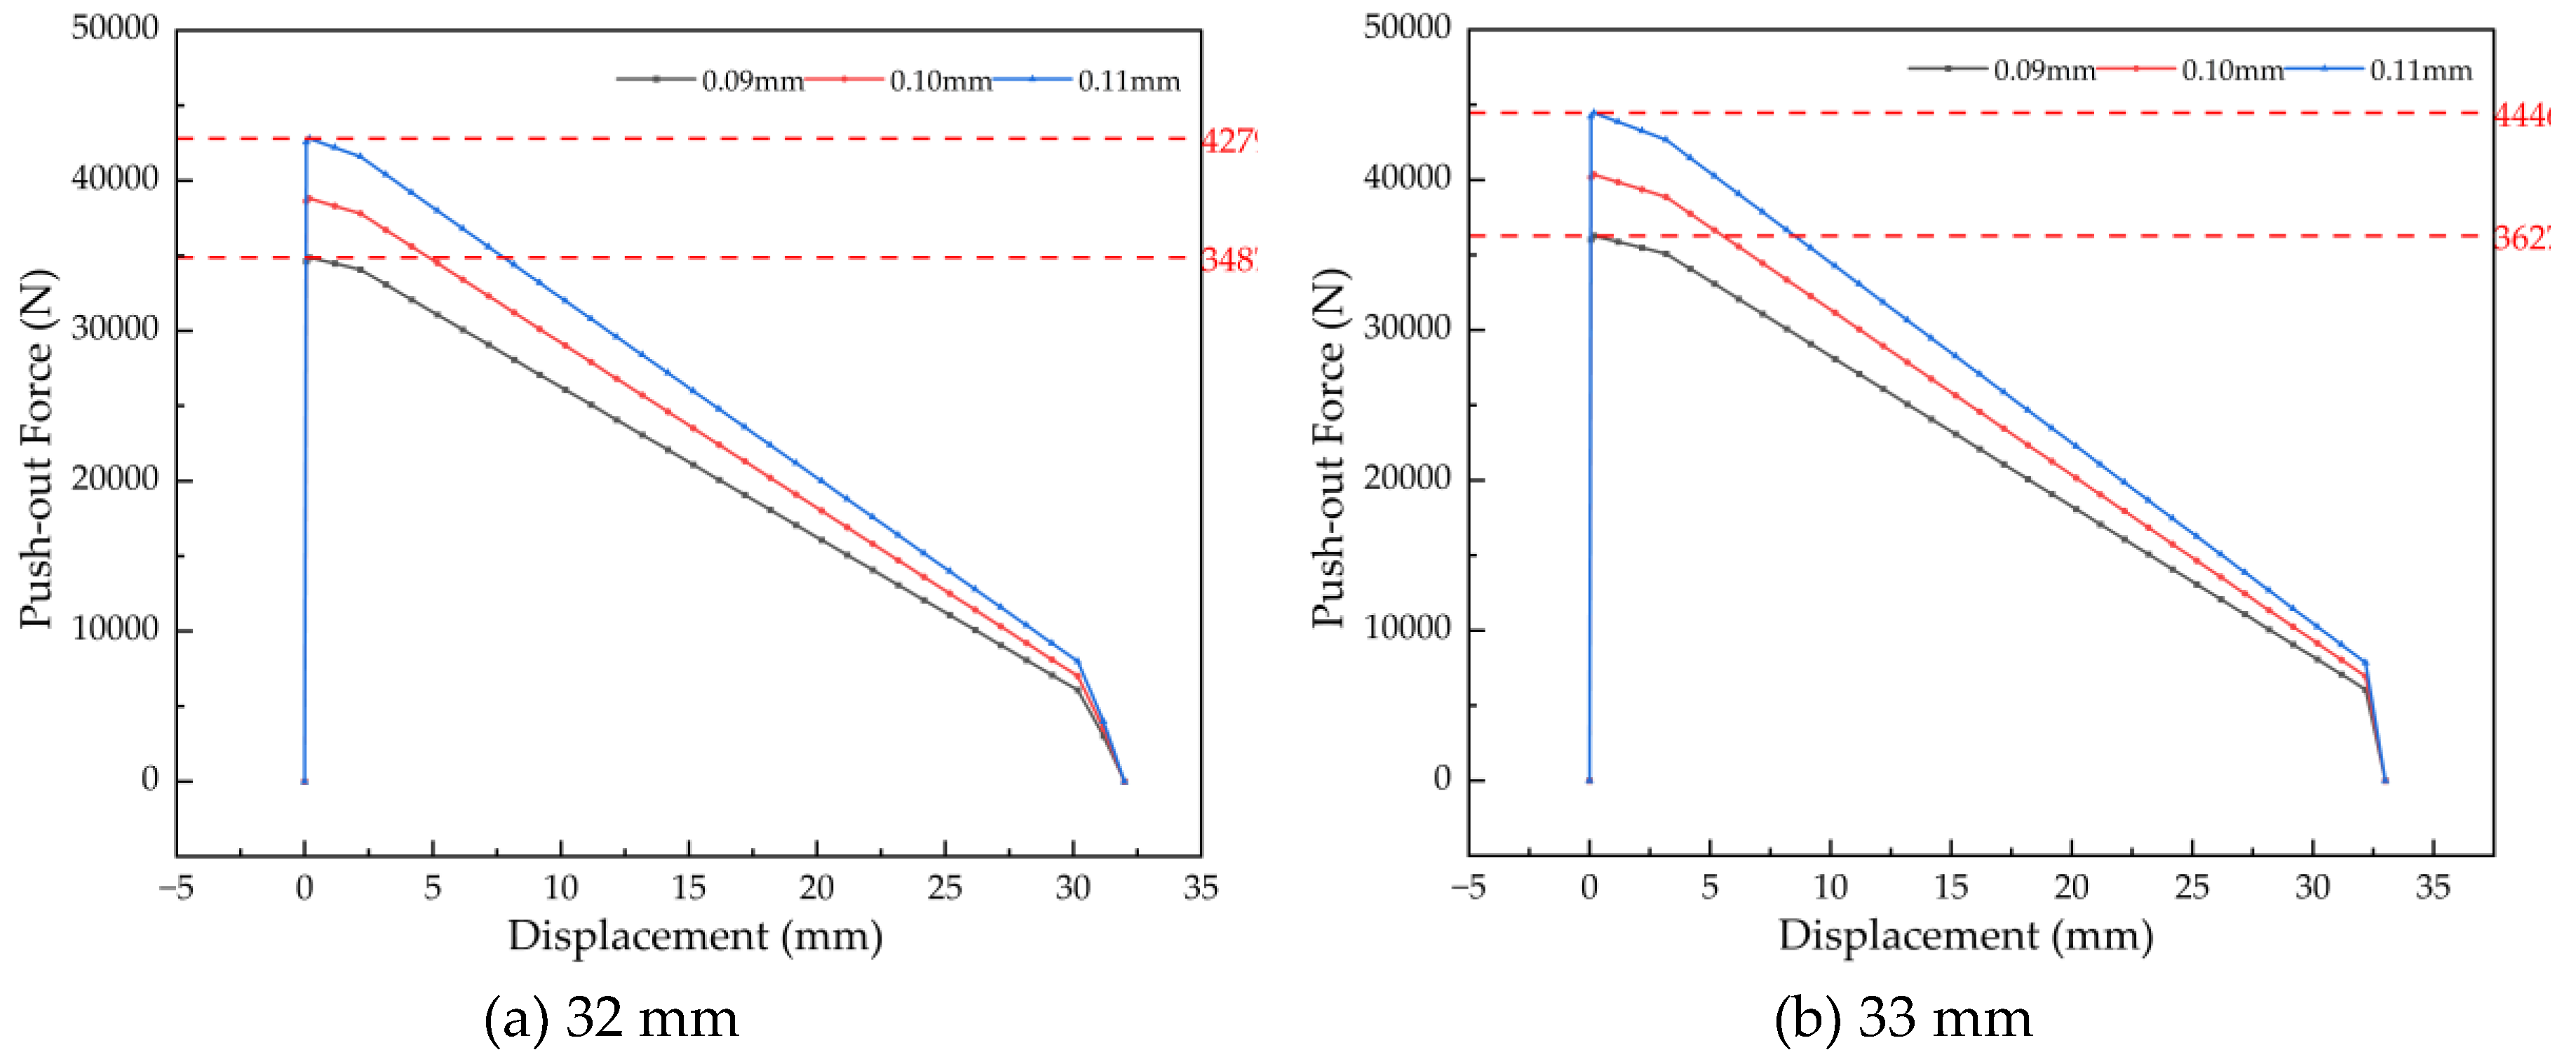
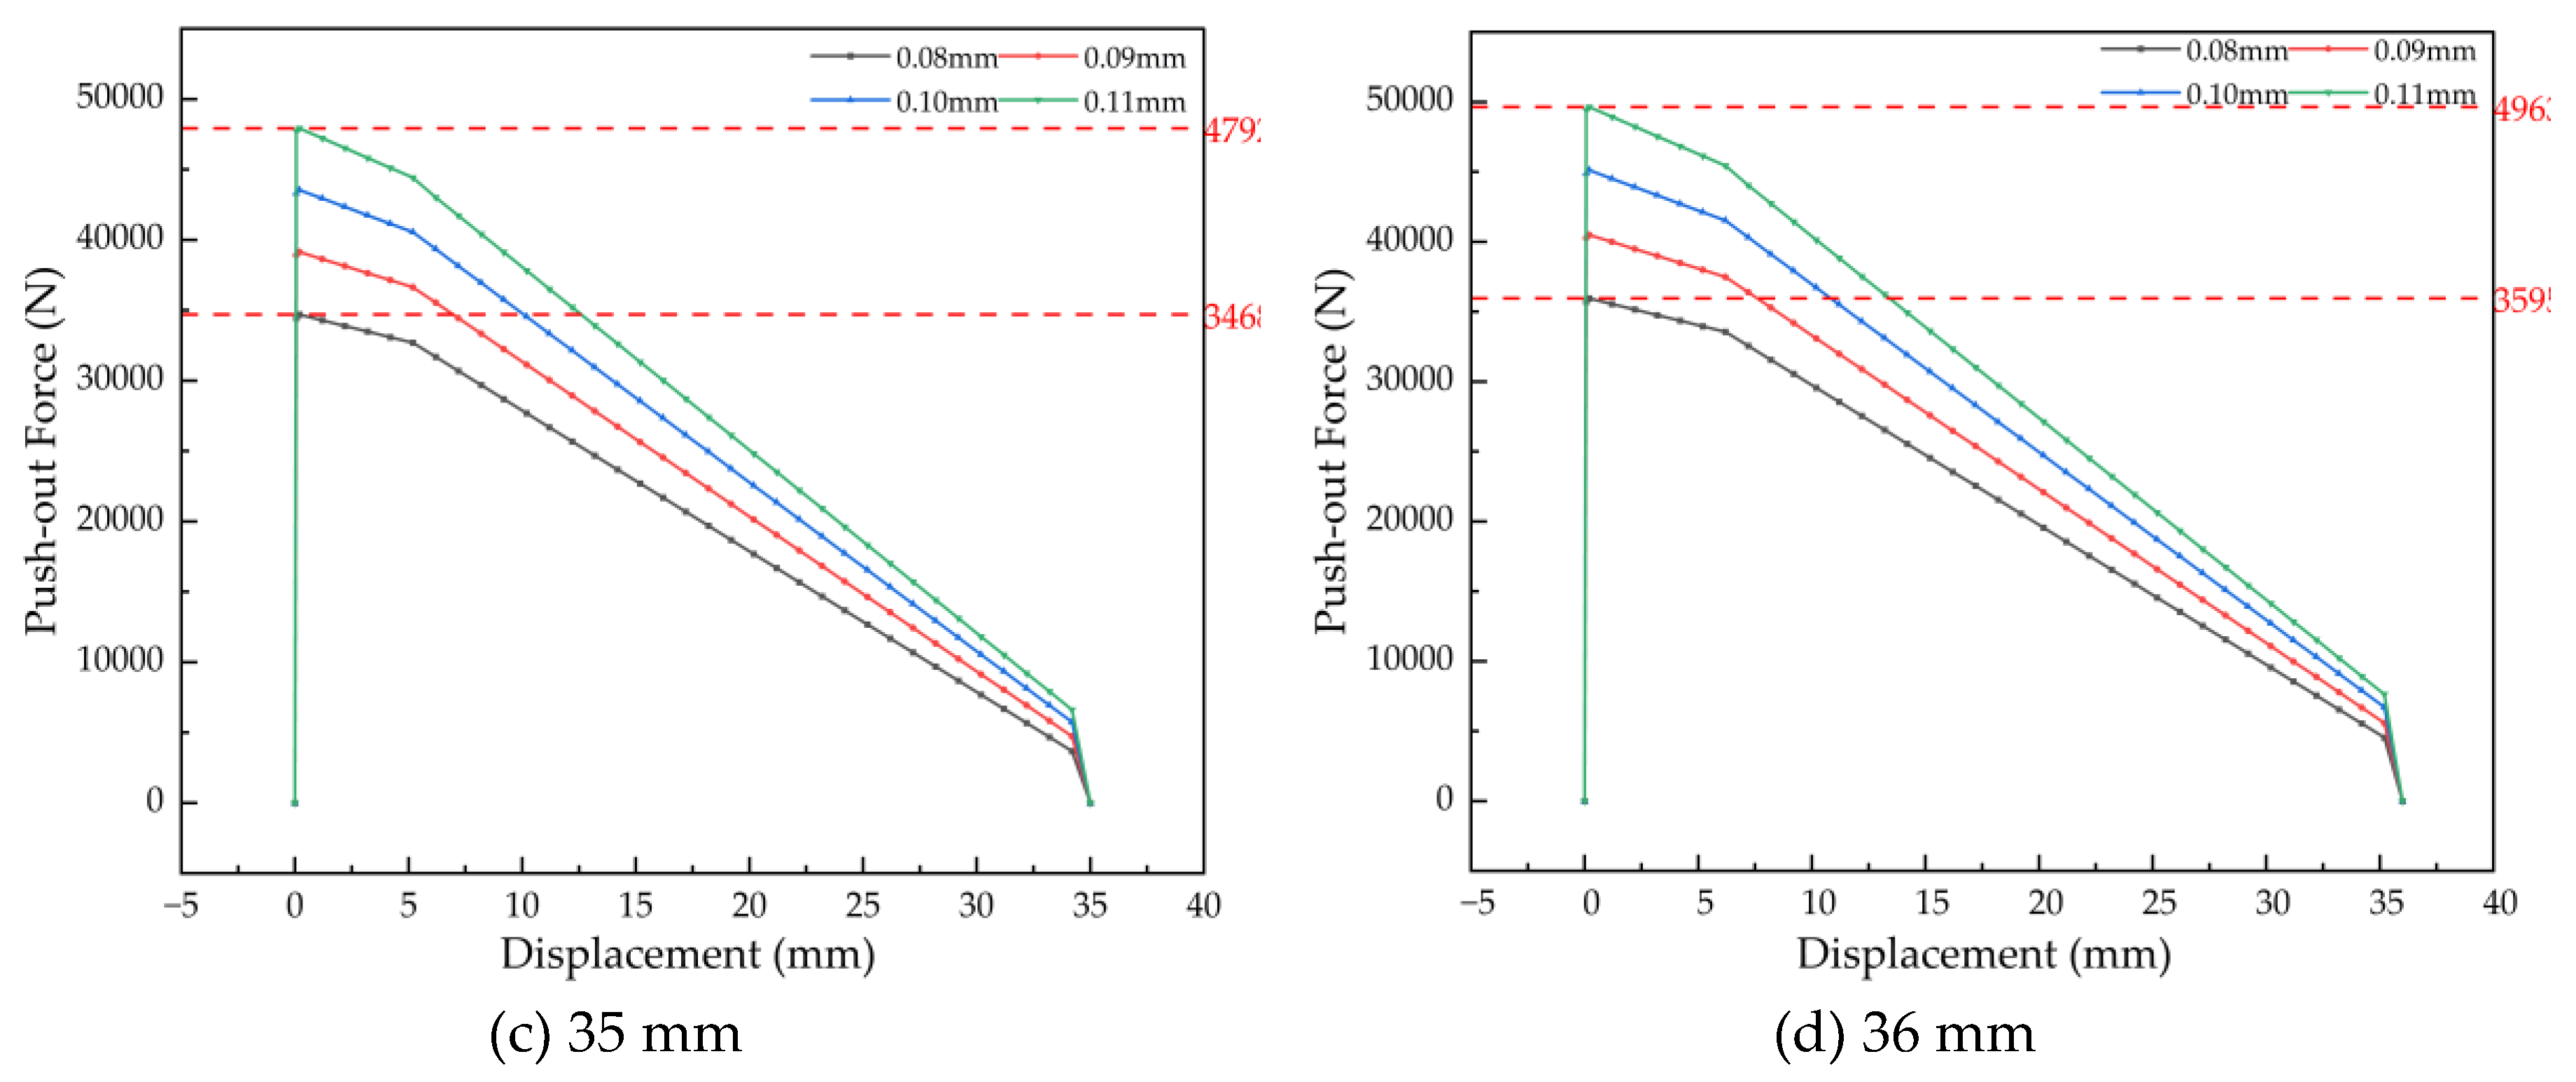

Table 1.
Comparison of theoretical and simulated contact pressure for the interference-fit bushing.
| Interference (mm) | Theoretical Pressure (MPa) | Simulated Pressure (MPa) | Error (%) |
|---|---|---|---|
| 0.04 | 19.47 | 19.71 | 1.2 |
| 0.05 | 24.34 | 24.67 | 1.4 |
| 0.06 | 29.21 | 29.64 | 1.5 |
| 0.07 | 34.07 | 34.57 | 1.5 |
Table 2.
Comparison of theoretical and simulated retention forces for different interference levels.
Table 2.
Comparison of theoretical and simulated retention forces for different interference levels.
| Interference (mm) | Theoretical Force (kN) | Simulated Force (kN) | Error (%) |
|---|---|---|---|
| 0.04 | 16.25 | 16.72 | 2.9 |
| 0.05 | 20.32 | 20.94 | 3.1 |
| 0.06 | 24.38 | 25.16 | 3.2 |
| 0.07 | 28.44 | 29.39 | 3.3 |
Table 3.
Comparison of theoretical, simulated, and experimental retention forces.
| Interference(mm) | (kN) | (kN) | (kN) | (%) | (%) |
|---|---|---|---|---|---|
| 0.04 | 16.25 | 16.72 | 16.52 | 1.7 | 1.2 |
| 0.05 | 20.32 | 20.94 | 20.75 | 2.1 | 0.9 |
Table 4.
Contact pressure and corresponding allowable interference range for bushings of different inner diameters.
Table 4.
Contact pressure and corresponding allowable interference range for bushings of different inner diameters.
| Bushing Inner Diameter (mm) | Minimum Contact Pressure (MPa) | Maximum Contact Pressure (MPa) | Interference Range (mm) |
|---|---|---|---|
| 40 | 37.86 | 72.94 | 0.06–0.12 |
| 42 | 36.25 | 69.66 | 0.07–0.13 |
| 46 | 33.41 | 63.92 | 0.08–0.14 |
| 48 | 32.15 | 61.39 | 0.08–0.15 |
Table 5.
Contact pressure and corresponding allowable interference range for bushings of different wall thicknesses.
Table 5.
Contact pressure and corresponding allowable interference range for bushings of different wall thicknesses.
| Bushing Wall Thickness (mm) | Minimum Contact Pressure (MPa) | Maximum Contact Pressure (MPa) | Interference Range (mm) |
|---|---|---|---|
| 2.00 | 35.50 | 53.91 | 0.09–0.13 |
| 2.25 | 35.13 | 60.32 | 0.08–0.13 |
| 2.75 | 34.42 | 72.94 | 0.07–0.14 |
| 3.00 | 34.08 | 79.15 | 0.06–0.14 |
Table 6.
Contact pressure and corresponding allowable interference range for bushings of different widths.
Table 6.
Contact pressure and corresponding allowable interference range for bushings of different widths.
| Bushing Width (mm) | Minimum Contact Pressure (MPa) | Maximum Contact Pressure (MPa) | Interference Range (mm) |
|---|---|---|---|
| 32 | 36.95 | 66.67 | 0.07–0.14 |
| 33 | 35.83 | ||
| 35 | 33.80 | ||
| 36 | 32.84 |
Table 7.
Allowable interference ranges for bushings with different structural parameters.
| Structural Parameter Variation (mm) | Allowable Interference Range (mm) | ||
| Assembly Condition | Combustion Pressure Condition | ||
|
Varying Inner Diameter (Wall thickness: 2.5 mm; Width: 34 mm) |
40.00 | 0.07–0.10 | 0.07–0.10 |
| 42.00 | 0.08–0.11 | 0.08–0.11 | |
| 46.00 | 0.09–0.12 | 0.09–0.12 | |
| 48.00 | 0.09–0.12 | 0.09–0.12 | |
|
Varying Wall Thickness (Inner diameter: 44 mm; Width: 34 mm) |
2.00 | 0.10–0.11 | 0.10–0.11 |
| 2.25 | 0.09–0.11 | 0.09–0.11 | |
| 2.75 | 0.08–0.11 | 0.08–0.11 | |
| 3.00 | 0.07–0.11 | 0.07–0.11 | |
|
Varying Width (Inner diameter: 44 mm; Wall thickness: 2.5 mm) |
32.00 | 0.09–0.11 | 0.09–0.11 |
| 33.00 | 0.09–0.11 | 0.09–0.11 | |
| 35.00 | 0.08–0.11 | 0.08–0.11 | |
| 36.00 | 0.08–0.11 | 0.08–0.11 | |
Table 8.
Allowable retention force ranges for connecting rod bushings with different structural parameters.
Table 8.
Allowable retention force ranges for connecting rod bushings with different structural parameters.
| Structural Parameter Variation (mm) | Retention Force Range (kN) | |
|---|---|---|
|
Varying Inner Diameter (Wall thickness: 2.5 mm; Width: 34 mm) |
40.00 | 33.14 – 47.44 |
| 42.00 | 35.60 – 49.25 | |
| 46.00 | 35.49 – 47.49 | |
| 48.00 | 33.39 – 44.74 | |
|
Varying Wall Thickness (Inner diameter: 44 mm; Width: 34 mm) |
2.00 | 35.24 – 38.82 |
| 2.25 | 34.74 – 42.63 | |
| 2.75 | 35.97 – 49.60 | |
| 3.00 | 33.39 – 52.72 | |
|
Varying Width (Inner diameter: 44 mm; Wall thickness: 2.5 mm) |
32.00 | 34.88 – 42.80 |
| 33.00 | 36.28 – 44.46 | |
| 35.00 | 34.69 – 47.92 | |
| 36.00 | 35.95 – 49.64 | |
Disclaimer/Publisher’s Note: The statements, opinions and data contained in all publications are solely those of the individual author(s) and contributor(s) and not of MDPI and/or the editor(s). MDPI and/or the editor(s) disclaim responsibility for any injury to people or property resulting from any ideas, methods, instructions or products referred to in the content. |
© 2026 by the authors. Licensee MDPI, Basel, Switzerland. This article is an open access article distributed under the terms and conditions of the Creative Commons Attribution (CC BY) license.
Copyright: This open access article is published under a Creative Commons CC BY 4.0 license, which permit the free download, distribution, and reuse, provided that the author and preprint are cited in any reuse.


