Preprint
Article

This version is not peer-reviewed.

Accuracy of the Garmin Vivoactive 4 for Estimating Heart Rate, Energy Expenditure, and Step Count During Treadmill Exercise

Submitted:

04 January 2026

Posted:

06 January 2026

You are already at the latest version

Abstract

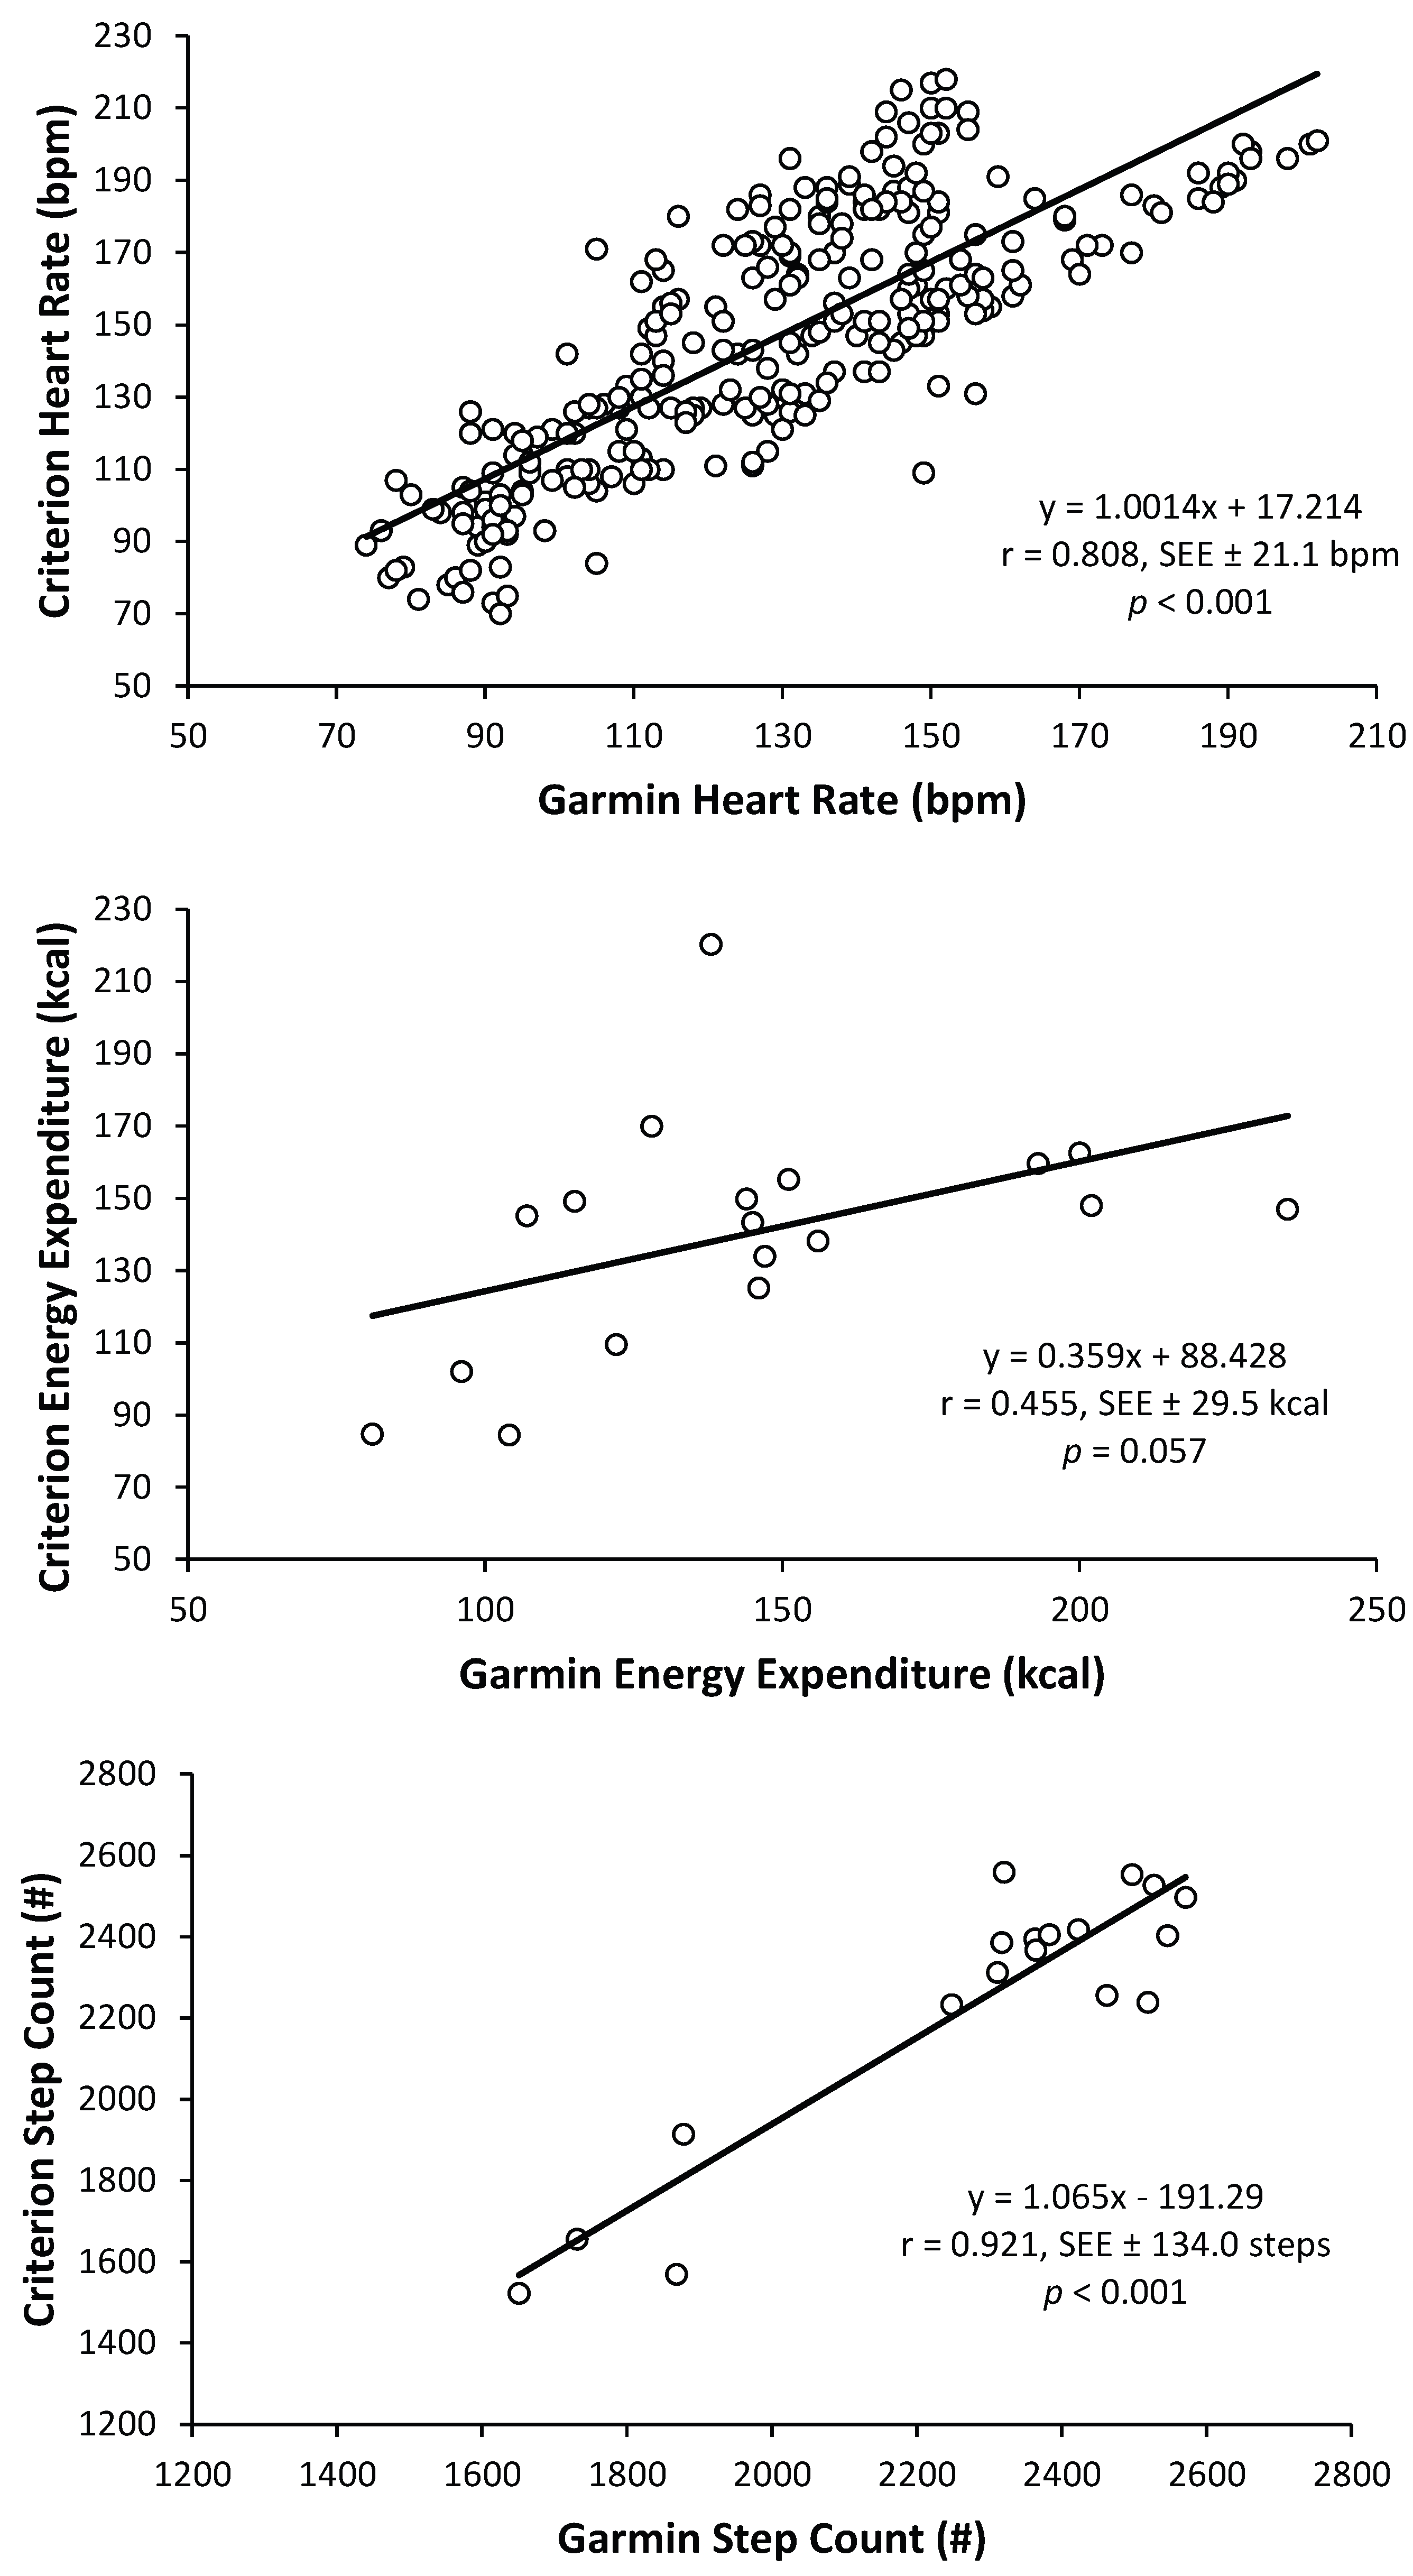
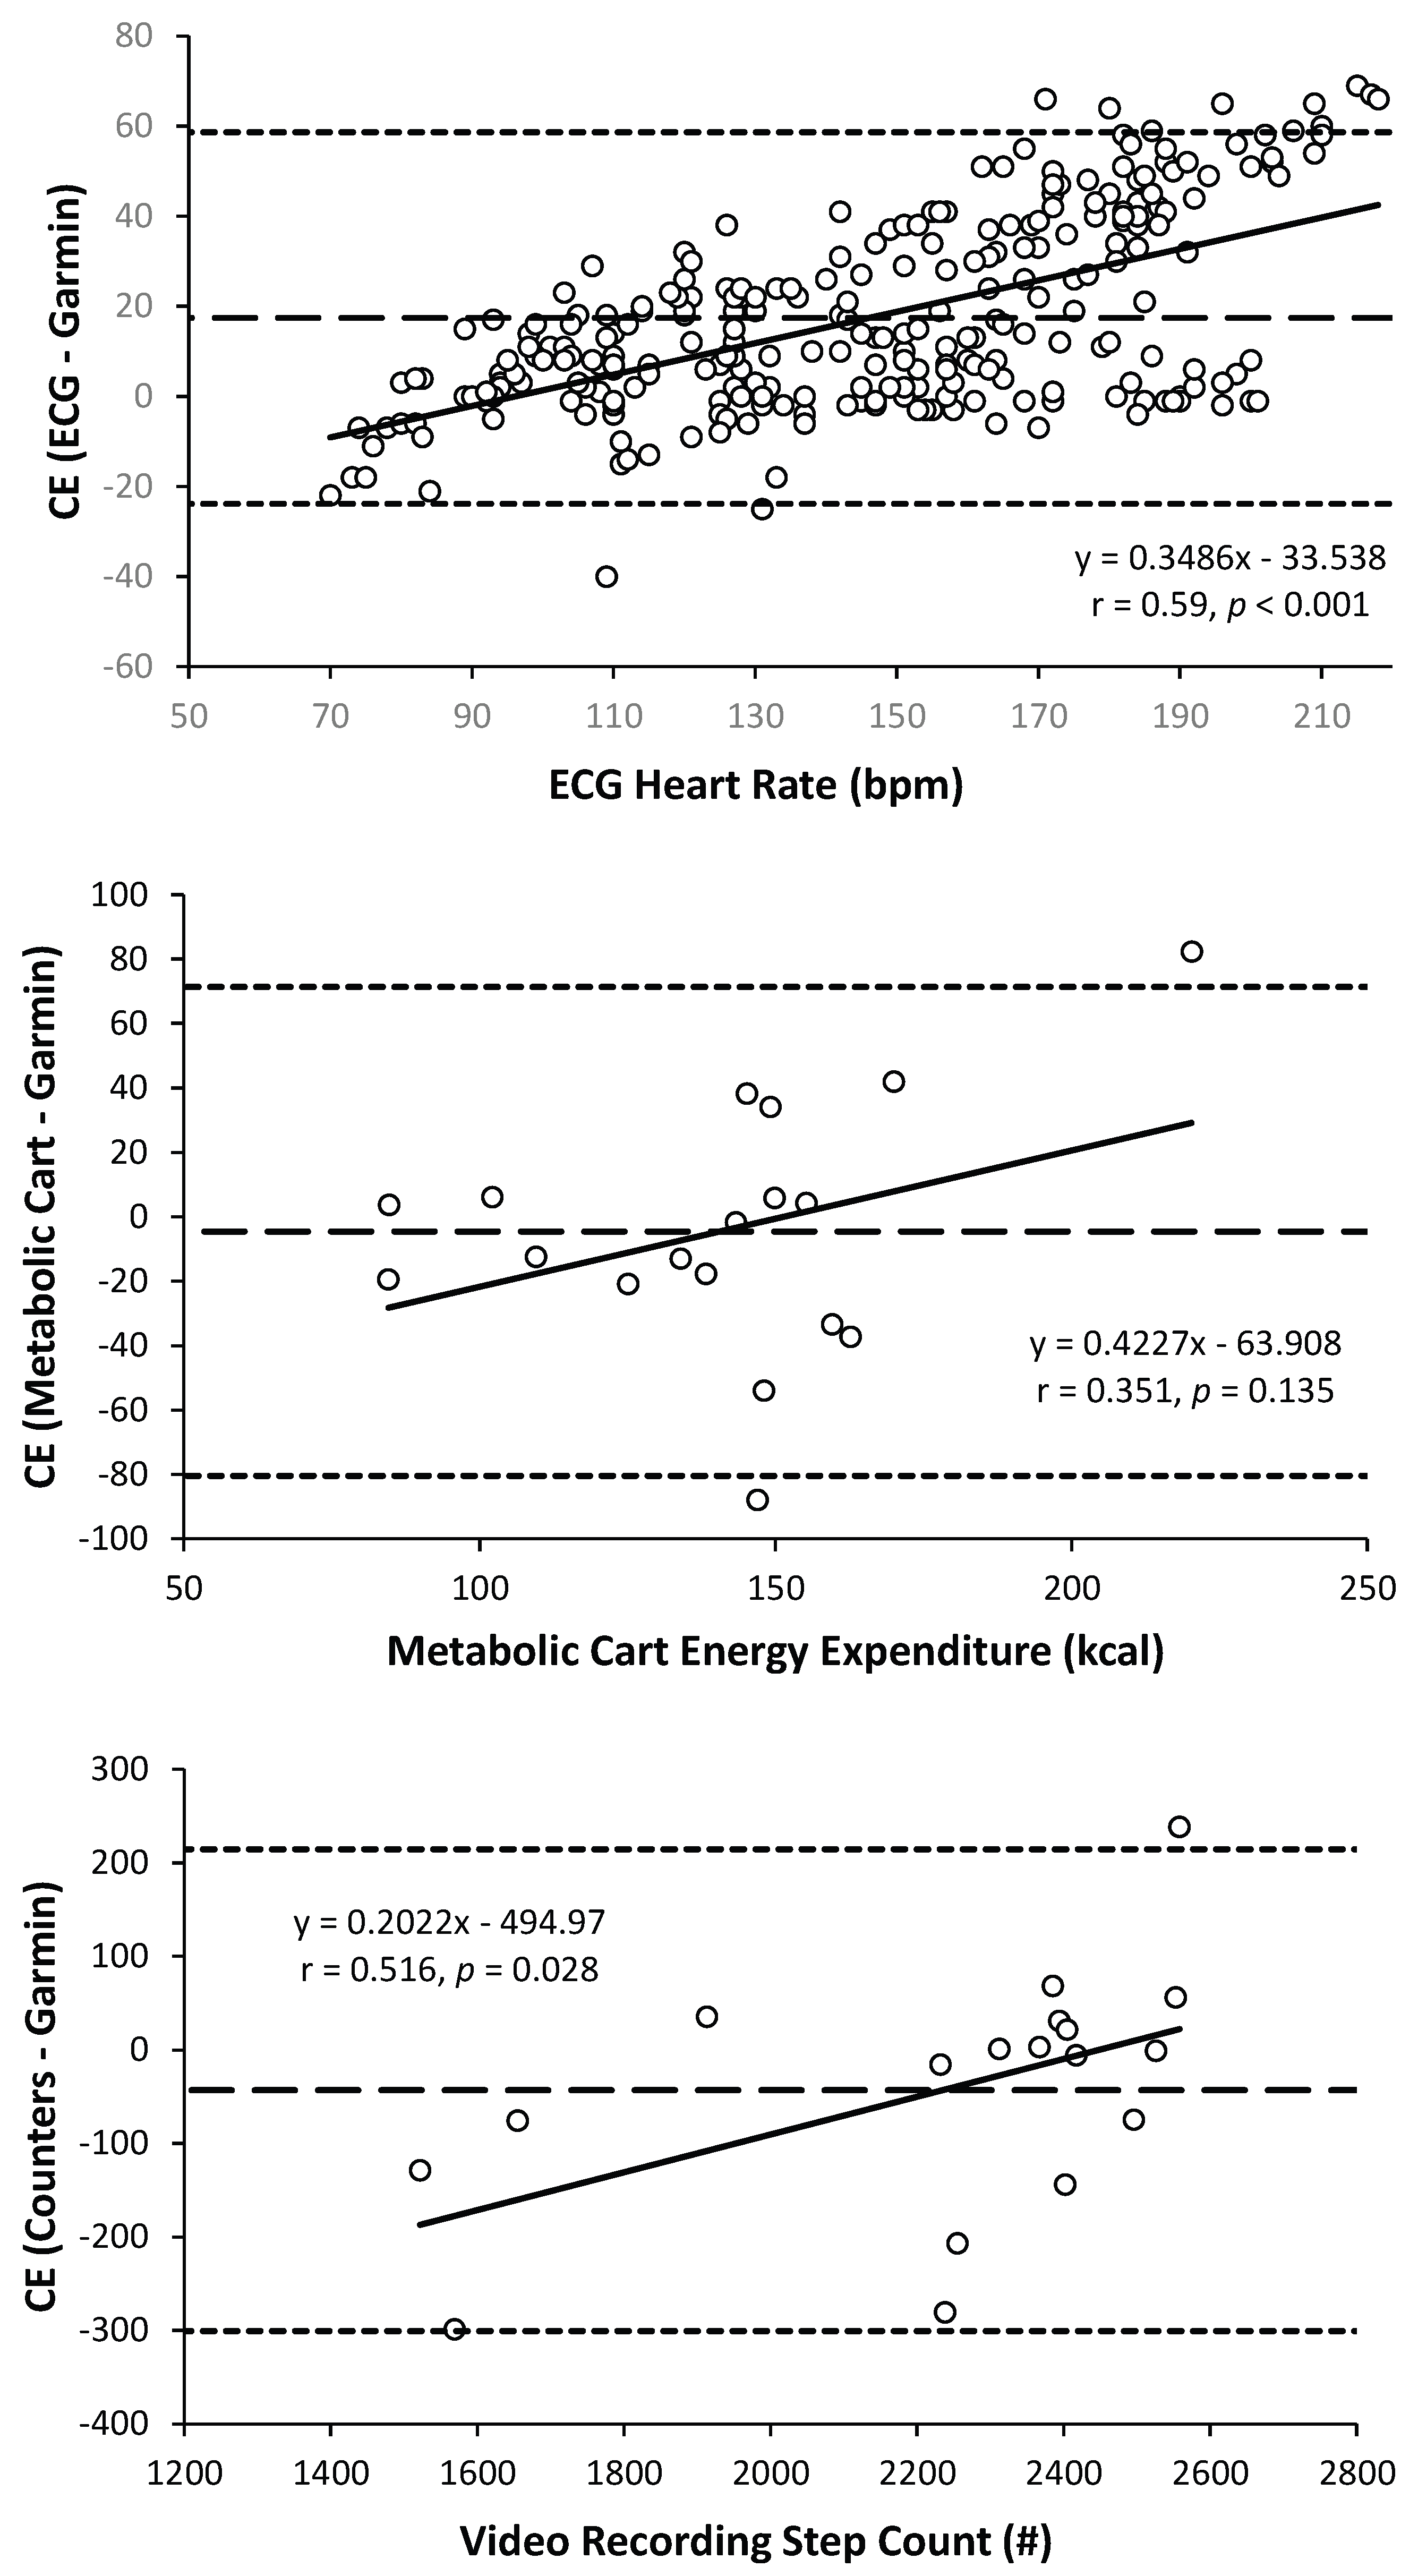
The purpose of this study was to examine the validity of a Garmin wrist-based device for estimating heart rate, energy expenditure, and step count during incremental treadmill exercise in college-aged individuals. Eighteen males and females (mean ± SD age = 23.2 ± 4.9 years) volunteered to complete an incremental treadmill test with the Garmin Vivoactive 4 device and criterion methods (electrocardiogram, indirect calorimetry, and video recording) measuring heart rate, energy expenditure, and step count. Mean absolute percent error (MAPE), simple linear regression, and Bland-Altman plots were used to assess accuracy. Acceptable accuracy was defined as MAPE < 5% for heart rate and < 10% for energy expenditure and step count. Statistical significance was set at α < 0.05. The MAPE (±SD) values were 13.0 (±10.1), 19.1 (±15.0), and 4.6 (±5.3)% for heart rate, energy expenditure, and step count, respectively. The Bland-Altman regression analyses illustrated proportional bias was present for estimations of heart rate (r = 0.591, p < 0.001) and step count (r = 0.516, p = 0.028), but not energy expenditure (r = 0.351, p = 0.153). These findings indicated that the Garmin Vivoactive 4 provided acceptable accuracy metrics for step count, but not heart rate or energy expenditure.

Keywords: 
;  ;  ;  ;  

1. Introduction

Wearable technology was named as the top fitness trend by the American College of Sports Medicine’s 2026 worldwide survey for the eighth time in the last 10 years [1]. The global popularity of fitness wearables is largely driven by increased public awareness of preventative health and the capability of these devices to track physical activity data in real time [2]. Approximately 45% of adults report using wearable fitness technology in the United States [3], contributing to the $96 billion global market in 2025 with projections reaching $186 billion by 2030 [1,4]. Fitness wearables include a range of device categories (e.g. heart rate monitors, smartwatches, fitness trackers, sensor-based clothing) that can be worn on various anatomical locations depending on measurement requirements, functionality, user preference, or intended application [5]. Smartwatches and other wrist-worn activity trackers (i.e. Apple, Garmin, and Fitbit), however, dominate the market [6] due to their smartphone integration, user-friendly interfaces, and ability to monitor multiple physiological and behavioral metrics. In addition, these devices support adherence to healthy behaviors such as increased physical activity from improved self-awareness [7]. Given their widespread accessibility and multi-functional capabilities, wrist-worn smartwatches have become valuable tools for tracking health, fitness, and performance outcomes.
Smartwatches provide both primary and derived metrics by collecting raw physiological signals that are subsequently processed through algorithmic systems [8]. Specifically, primary metrics are directly measured through sensors on the device such as heart rate, movement, and body temperature [9]. Derived metrics, however, are calculated from primary sensor data using proprietary algorithms and represent estimations of more complex variables (e.g. energy expenditure, step count, oxygen uptake, recovery) [10]. Among primary metrics, heart rate is the most fundamental and serves as an important physiological indicator of cardiovascular health and exercise intensity. In various populations, heart rate monitors are used to establish optimized workout zones, detect arrhythmias, and track sleep for recovery [11]. Energy expenditure is another widely utilized and clinically relevant variable that relies heavily on heart rate inputs [12] and is commonly used to monitor weight management, dietary adjustments, and exercise prescription [13]. Step count remains one of the most popular indicators of daily activity and is reportedly incorporated into smartwatch algorithms that estimate energy expenditure [14]. The American Heart Association and other health organizations have established guidelines that promote daily step goals of approximately 8,000-10,000 steps to encourage increased physical activity and wellness. Thus, the accurate estimation of heart rate, energy expenditure, and step count is essential to guide training decisions and track progress towards health goals.
Most wrist-based fitness wearables operate using non-invasive photoplethysmography (PPG) technology, thereby allowing users to record real-time heart rate data that can also be incorporated into proprietary algorithms to estimate metabolic and stress-related variables [15]. PPG functions by emitting green LED light into the skin and detecting variations in the reflected signal corresponding to microvascular changes in blood volume [16]. The validity of PPG measurements can be influenced by several factors including mode and intensity of exercise, sensor technology and placement, motion artifact, and skin tone [5,17]. Some devices demonstrate greater heart rate measurement accuracy at lower intensities of exercise when motion artifact is minimal [18], whereas others achieve greater accuracy at higher exercise intensities likely due to increased blood perfusion [17,19]. Since heart rate serves as a foundational signal for many derived metrics, limitations in its accuracy can introduce error into secondary calculations including energy expenditure, heart rate variability, and pulse oxygen saturation [16,20].
Previous investigations have reported substantial error in wrist-based wearable measurements, with mean absolute percentage error (MAPE) values for heart rate exceeding 30% compared to criterion measures of electrocardiography (ECG) and chest-strap monitors [21,22]. Inaccurate heart rate estimations may further compromise the validity of derived metrics such as energy expenditure, which has also demonstrated error of greater than 40% and systemic bias across exercise intensities in several wearable devices [23]. Although step count is often considered a more reliable indicator of physical activity, inaccuracies have been reported that vary by device model, exercise intensity, and movement velocity [24]. Given the increased reliance on wrist-worn devices in recreational, clinical, and athletic populations, inconsistent accuracy across key physiological and activity metrics raises concerns about their utility for monitoring training load, managing energy balance, and informing health-related decisions [25,26]. As Garmin smartwatches continue to gain widespread adoption, there is a substantial need for updated validation studies evaluating their performance across progressive exercise intensities. Therefore, the purpose of the present study was to examine the validity of a Garmin wrist-based device for estimating heart rate, energy expenditure, and step count during incremental treadmill exercise in college-aged individuals.

2. Materials and Methods

2.1. Subjects

Eighteen males (n = 12; mean ± SD age = 22.8 ± 4.7 years; body mass = 83.8 ± 13.4 kg) and females (n = 6; 24.2 ± 5.6 years; 65.2 ± 9.6 kg) volunteered to participate in this study that required two visits to the laboratory. The recruitment of subjects was completed through flyers and class scripts at Northern Illinois University seeking physically active individuals. Eligible participants were those within the age range of 19-29, not reporting any musculoskeletal, metabolic, or cardiovascular related diseases or conditions, and regularly engaging in exercise training according to the American College of Sports Medicine Guidelines [27] (i.e. ≥ 150 minutes per week of moderate-intensity aerobic activity (~ 30 minutes on ≥ 5 days per week) or ≥ 75 minutes per week of vigorous-intensity aerobic activity (~ 20 minutes on ≥ 3 days per week) or a combination). Subjects were instructed to avoid strenuous exercise for at least 24 hours and be in a postprandial state (≥ 2-3 hours) for the beginning of each laboratory visit [28]. In addition, all subjects were required to complete a PAR-Q+ form, health history questionnaire, and sign an informed consent document prior to any testing procedures. The study was conducted according to the guidelines of the Declaration of Helsinki and approved by the Institutional Review Board of Northern Illinois University (IRB #HS21-0152, 01 December 2020). Participants completed a total of two study visits separated by 24 hours, including a familiarization session and an exercise trial.

2.2. Familiarization Session

The first laboratory visit served as an informational meeting that provided subjects with detailed requirements and expectations of their participation in the study. In addition, all subjects completed a familiarization protocol that involved orientation to the testing equipment and procedures (i.e. treadmill, Garmin Smartwatch, electrocardiogram, metabolic cart, video recording).

2.3. Exercise Protocol

During the second laboratory visit, subjects completed an exercise trial to evaluate device validity. For this trial, participants completed an incremental exercise test on a motorized treadmill (Woodway Desmo HP; Woodway USA, Inc., Waukesha, Wisconsin, USA) that involved four, 4-minute stages at 4.8, 7.2, 9.7, and 12.1 km·hr-1 [28]. Heart rate, energy expenditure, and step count values were assessed using the Garmin Smartwatch and criterion methods throughout the 16-minute treadmill test.

2.4. Garmin Watch

The Garmin Smartwatch (Vivoactive 4, Garmin Ltd., Olathe, Kansas, USA; currently available online for $200-350) was secured on the left wrist of each subject according to the manufacturer's recommendations prior to the incremental treadmill test. All history was cleared from the device before placement, synched to an online mobile application, and then individually programmed for each subject according to their age, biological sex, body mass, and height. The Garmin device was also programmed to measure heart rate, energy expenditure, and step count at the initiation of the incremental treadmill test. Instantaneous readings of heart rate (bpm) from the Garmin Smartwatch were recorded at the end of each minute during the 16-minute test. In addition, total energy expenditure (kcal) and step count were recorded as single values that represented the entire 16-minute treadmill test. As soon as the treadmill test was completed, the exercise “session” on the Garmin Smartwatch was stopped simultaneously with criterion measurement devices (ECG, metabolic cart, and video recording of step count).

2.5. Criterion Measurements

2.5.1. Heart Rate

A standard 12-lead ECG (Marquette Case Plus Stress Test Monitor, General Electric, Boston, Massachusetts, USA) was used as the criterion method for heart rate. Specifically, subjects were placed on an examination table for skin preparation prior to placement of the electrodes (Skintact Electrodes, Leonhard Lang GmbH, Innsbruck, Austria). To maximize signal quality (i.e. reduce electrical impedance) and establish optimal adhesive contact between the skin and electrodes, the chest was shaved to remove hair (if necessary) and lightly abraded with gauze and cleaned with isopropyl alcohol to remove any surface contaminants. The ECG electrodes were then placed on the chest with the Mason-Likar configuration. Instantaneous measurements of heart rate (bpm) from the ECG were recorded at the end of each minute of the 16-minute test.

2.5.2. Energy Expenditure

Criterion measurement of energy expenditure during the 16-minute treadmill test was completed using a metabolic cart (TrueOne 2400, Parvo Medics, Sandy, Utah, USA). Prior to each test, the metabolic cart was calibrated for flow volume using a 3-liter calibration syringe and gas analysis using room air and a certified standard mixture of oxygen (16.00%) and carbon dioxide (4.00%). Ambient conditions for atmospheric pressure, temperature, and humidity were included in all calibration procedures for the metabolic cart. Energy expenditure was then calculated by the TrueOne 2400 system using the manufacturer’s software (Parvo Medics, Sandy, Utah, USA). The total energy expenditure (kcal) from the 16-minute treadmill test was used as the representative criterion value.

2.5.3. Step Count

All 16-minute treadmill tests were video recorded for the criterion measurement of step count [29]. Following the test, two research assistants independently reviewed the video from start to finish in slow motion while tracking the number of steps using handheld tally counters (KTRIO LLC, Long Island City, New York, USA). These two independent step count numbers from each treadmill test were then averaged and used as the representative criterion step count score. Inter-rater reliability for step count of all (n = 18) 16-minute treadmill tests resulted in an ICC of R = 0.999 (model: two-way mixed, random with absolute agreement) and no significant mean differences (2235 ± 335 vs. 2232 ± 335 steps, p = 0.320) between counters.

2.6. Data Analysis

Microsoft Excel (Microsoft Corp, Redmond, Washington, USA) was used to record and organize all study data. SPSS (Version 29.0, SPSS Inc., Armonk, New York, USA: IBM Corp.) was utilized for all subsequent data analysis. Heart rate values from the Garmin device and ECG measurements were recorded simultaneously as instantaneous values at the end of each minute of the treadmill test. Energy expenditure and step count values from the Garmin device and criterion methods (metabolic cart and video recording, respectively) were recorded as single values across the entire 16-minute treadmill test. Validity of the Garmin device compared to criterion methods was assessed through: 1) calculation of mean absolute percent error (MAPE), 2) simple linear regression for determination of the correlation coefficient (r) and standard error of estimate (SEE), and 3) Bland-Altman plots with regression analyses for constant error (CE = criterion method – Garmin device) across the range of criterion values. MAPE provides the average amount of error from a non-criterion method of measurement relative to the criterion measurement and has been recommended as the primary statistical measure for assessing the validity of wearable heart rate monitors [30]. The Bland-Altman regression analyses were used to assess proportional bias. Acceptable MAPE accuracy thresholds and categories were variable specific. Since heart rate is a directly measured physiological variable of the Garmin device, more conservative MAPE values were required to meet the “acceptable” classification: MAPE of < 5.0% was defined as “high accuracy” and the threshold for “acceptable” [31,32]; MAPE of 5.0-10.0% was defined as “moderate accuracy”: [33]; and MAPE of > 10% was classified as “unacceptable”, consistent with the general consensus in the literature that errors above this magnitude are not typically considered valid for physiological monitoring in controlled laboratory environments [32,33]. Neudorfer et al. [34] proposed conservative MAPE criteria (of < 5.0%) is necessary for practical application, thereby preventing measurement error from exceeding heart rate intensity zones used in exercise prescriptions. For the model-derived metrics of energy expenditure and step count, however, a MAPE value of < 10.0% was considered an “acceptable” indicator of accuracy [35,36]. The classification of correlation (r) strength was based on Jo et al. [31]: 0.90 – 1.00 = strong, 0.80 – 0.89 = moderately strong, 0.70 – 0.79 = moderate, 0.60 – 0.69 = moderately weak, ≤ 0.59 = weak. An alpha of 0.05 was used for statistical significance.

3. Results

3.1. Heart Rate

The overall MAPE (±SD) value for heart rate across all four treadmill stages was 13.0 (±10.1)%. MAPE values for each stage were 12.0 (±8.2), 14.1 (±10.1), 14.5 (±11.3), and 11.2 (± 10.8)% at 4.8, 7.2, 9.7, 12.1 kph, respectively. The linear regression analysis for the ECG vs. Garmin resulted in a moderately strong correlation (r = 0.808, p < 0.001) and SEE value of 21.1 bpm (Figure 1). The mean (±SD) CE (actual ECG heart rate—predicted Garmin heart rate) values were 17.4 (±21.0) bpm. The Bland–Altman regression analysis resulted in a significant relationship for CE vs. ECG heart rate (r = 0.591, p < 0.001) and illustrated that the Garmin device tended to overestimate heart rate at lower exercise intensities and underestimate at higher exercise intensities (Figure 2).

3.2. Energy Expenditure

The MAPE (±SD) value associated with energy expenditure was 19.1 (±15.0)%. The linear regression analysis for the metabolic cart vs. Garmin resulted in a non-significant, weak correlation (r = 0.455, p = 0.057) and an SEE value of 29.5 kcal (Figure 1). The mean (±SD) CE (actual metabolic cart energy expenditure - predicted Garmin energy expenditure) value was -4.5 (±38.7) kcal. The Bland-Altman regression analysis resulted in a non-significant relationship (r = 0.351, p = 0.153) for CE vs. metabolic cart energy expenditure (Figure 2). Thus, the CE of the Garmin device for estimating energy expenditure of the metabolic cart was uniform across the range of energy expenditure values (Figure 2).

3.3. Step Count

The MAPE (±SD) value for step count was 4.6 (±5.3)%. The linear regression analysis for the video recording and hand-counters compared to the Garmin resulted in a strong correlation (r = 0.921, p < 0.001) and SEE value of 134.0 steps (Figure 1). The mean (±SD) CE (counters step count – Garmin step count) value was -43.4 (±131.4) steps. The Bland-Altman regression analysis resulted in a significant relationship for CE vs. the video recording of step count (r = 0.516, p = 0.028) and demonstrated that step count was generally overestimated by the Garmin device compared to the video recording but more accurate at the higher range ( >2300 steps) (Figure 2).

4. Discussion

The present investigation examined the validity of the Garmin Vivoactive4 to measure heart rate, energy expenditure, and step count during an incremental treadmill test. Our main findings indicated the device provided acceptable estimates for step count, but unacceptable estimates for heart rate and energy expenditure. Overall, the Garmin wrist-based monitor tended to underestimate heart rate, with error increasing at higher exercise intensities. While energy expenditure did not meet the MAPE criteria and was weakly correlated with the criterion measurement (i.e. indirect calorimetry), the associated error was consistent across the range of total kcal values. Step count estimated from the Garmin device, however, was accepted as accurate and strongly correlated with criterion values.
Heart rate data across the incremental treadmill test from the Garmin device did not achieve the criteria defined as “acceptable” proposed by Jo et al. [31] and Navalta et al. [32]. Specifically, the MAPE value for heart rate during the entire 16-minute protocol was 13.0% with values ranging from 11.2 to 14.5% for individual 4-minute stages. The Bland-Altman plot for mean CE (17.4 ± 21.0 bpm) across ECG values demonstrated that the Garmin device generally overestimated heart rate at lower exercise intensities and underestimated at higher intensities (Figure 2). Numerous studies have suggested reduced accuracy for heart rate measurements in wrist-based wearables is due to motion artifact, especially at higher speeds or with greater arm movement that can heavily influence sensor-to-skin contact in PPG technology [37,38]. In support, Merrigan et al. [39] and Bunn et al. [24] demonstrated heart rate accuracy from Garmin wrist-based devices is highest during submaximal cycling (MAPE = 4.2%) compared to steady state (MAPE = 5.4%) and incremental (MAPE = 4.4%) treadmill exercise as well as Tabata-style circuit training (MAPE = 10.2%). Other devices placed on more proximal locations (e.g. forearm or chest) have shown acceptable accuracy (MAPE < 5.0%) during exercise modalities with substantial wrist movement [28,32,40]. Therefore, the compromised accuracy of heart rate measurements from wrist-based wearables is a function of distal location placement that can be further exacerbated by increased arm movement. Although the present study demonstrated similar MAPE values across the four incremental stages, other investigations [39] have reported improved Garmin accuracy with increases in exercise intensity. Improved accuracy at higher workloads has largely been attributed to increased blood perfusion of the arms that enhances heart rate estimates from PPG technology [17,19]. Due to these factors, the selection of an optimal fitness wearable for tracking heart rate should be based on intended application with specific consideration for the influence of motion and intensity on overall accuracy.
The accuracy of energy expenditure estimates derived from commercial wearables is difficult to evaluate since many companies such as Garmin rely on proprietary algorithms. Thus, validation efforts are primarily limited to sensor performance rather than the underlying computational models [20]. In the present study, the Bland-Altman (Figure 2) for energy expenditure predictions indicated that both overestimations and underestimations occurred, with greater error at approximately ≥ 150 kcals. Zakeri et al. [12] identified several factors that may influence energy expenditure estimation accuracy, including heart rate measurement error, incorrect metabolic equivalent assignments, and inaccuracies in body anthropometric inputs, all of which may vary depending on the algorithm employed. Although there are conflicting data, the integration of PPG for heart rate measurement with accelerometry has been proposed to improve energy expenditure estimation accuracy [41]. Hajj-Boutros et al. [42], however, reported that despite acceptable heart rate accuracy in two wrist-worn devices (Apple Watch 6 and Polar Vantage V), energy expenditure estimates exhibited substantial error (MAPE = 25.8-47.8%) during different physical activities (i.e. sitting, walking, running, cycling, resistance training). Furthermore, the present investigation did not demonstrate acceptable heart rate accuracy (MAPE < 5.0%) and the linear regression analysis between energy expenditure estimated by the Garmin device and criterion measurement illustrated a weak, non-significant relationship (r = 0.455; p = 0.057) (Figure 1). Our results were consistent with previous findings that reported high estimation error for energy expenditure from Garmin devices (e.g. Garmin Fenix 6) during walking (MAPE = 32.0%) and running (MAPE = 21.8%) [20]. Collectively, the present findings and those of others [20,42] supported the conclusion that energy expenditure estimates from consumer wearables should be interpreted with caution, as overestimation may create a false perception of achieving physical activity goals and misinform training or health-related decisions [35]. Thus, the fitness wearable examined in the current study should be considered a general reference tool rather than a precise measure of energy expenditure.
The present study found that the Garmin Vivoactive4 provided valid step count estimations (MAPE = 4.6%) during incremental treadmill exercise. The device also resulted in a strong correlation (r = 0.921) (Figure 1) with the criterion measure (i.e. hand-counters), yet visual inspection of the Bland-Altman and CE (-43.4 steps) (Figure 2) illustrated a slight overestimation compared to the video recording with error generally decreasing for subjects achieving higher step counts. Mora-Gonzalez et al. [29] examined the validity of 21 devices for step count during treadmill exercise and reported progressively higher accuracy with increasing speed. In addition, Hao et al. [35] investigated 11 commercially available wrist-worn devices and found that step count was overestimated during a free-living simulation and three bouts of exercise at progressing intensities, with none of the devices achieving acceptable MAPE values (14.2-27.6%). It is possible that step count error at low intensities is due to the reduced amplitude of the arm swing motion during slow walking or light running, thereby failing to trigger accelerometer detection due to insufficient movement [43]. In contrast, increased accuracy at higher intensity levels can be attributed to more pronounced arm swing to balance gait that results in improved sensor activation and step count detection accuracy [44]. Although step count was assessed as a single value across the entire test and not individual stages, the findings of the present study indicated that the Garmin vivoactive4 provides acceptably accurate step count estimates for activity tracking during moderate to vigorous intensity treadmill exercise.
There were a number of limitations in the present study. Variation in skin pigmentation and body composition were not assessed but have been shown to influence PPG accuracy [45], potentially leading to error between subjects. In addition, the inclusion of both male and female participants introduces possible sex-related differences in energy expenditure prediction. Another limitation of the present investigation is the laboratory-based design, which may not be applicable to free-living environments and may yield different accuracy due to movement patterns that require different wrist usage. Lastly, reliability was not assessed and it is possible that device location placement on the wrist could potentially influence the accuracy of the wearable between individuals. Thus, the present findings are limited to healthy, college-aged individuals and should not be generalized to older adults, clinical populations, or free-living settings.
In conclusion, the Garmin Vivoactive 4 demonstrated poor validity for heart rate (MAPE > 5%) and energy expenditure (MAPE > 10%) but acceptable validity for step count (MAPE < 10%) during incremental treadmill running in healthy, college-aged individuals. This device may assist users in achieving daily activity goals through accurate step count tracking, but heart rate and energy expenditure outputs should be interpreted as approximations rather than precise physiological measurements. Future studies should examine additional Garmin models, evaluate specific algorithms of these devices, and assess performance across diverse populations and free-living conditions to provide further insight into their accuracy on general indicators of health and fitness.

Author Contributions

Conceptualization, B.M.M.; methodology, C.L.C., P.J.C., A.R.J., B.M.M.; formal analysis, M.F.D., C.L.C.; data curation, R.A.K., B.A., B.L., R.S.; writing—original draft preparation, M.F.D., C.L.C.; writing—review and editing, M.F.D., C.L.C., R.A.K., B.A., B.L., R.S., P.J.C., A.R.J., B.M.M.; supervision, R.A.K.; project administration, B.M.M. All authors have read and agreed to the published version of the manuscript.

Funding

This research received no external funding.

Institutional Review Board Statement

The study was conducted in accordance with the Declaration of Helsinki, and approved by the Institutional Review Board of Northern Illinois University (IRB #HS21-0152, 01 December 2020).

Informed Consent Statement

Informed consent was obtained from all subjects involved in the study.

Data Availability Statement

The raw data supporting the conclusions of this article will be made available by the authors on request.

Conflicts of Interest

The authors declare no conflicts of interest.

Abbreviations

The following abbreviations are used in this manuscript:
PPG Photoplethysmography
MAPE Mean absolute percent error
ECG Electrocardiogram
SEE Standard error of estimate
CE Constant error

References

  1. McAvoy, C.; Batrakoulis, A.; Camhi, S.; Sansone, J.; Stanfield, J.; Reed, R. 2026 ACSM Worldwide Fitness Trends: Future Directions of the Health and Fitness Industry. ACSMʼs Health Fit. J. 2025, 29, 16–33. [Google Scholar] [CrossRef]
  2. Tang, M.S.S.; Moore, K.; McGavigan, A.; Clark, R.A.; Ganesan, A.N. Effectiveness of Wearable Trackers on Physical Activity in Healthy Adults: Systematic Review and Meta-Analysis of Randomized Controlled Trials. JMIR MHealth UHealth 2020, 8, e15576. [Google Scholar] [CrossRef] [PubMed]
  3. Nagappan, A.; Krasniansky, A.; Knowles, M. Patterns of Ownership and Usage of Wearable Devices in the United States, 2020-2022: Survey Study. J. Med. Internet Res. 2024, 26, e56504. [Google Scholar] [CrossRef]
  4. Wearable Technology Market Size | Industry Report, 2030. Available online: https://www.grandviewresearch.com/industry-analysis/wearable-technology-market (accessed on 27 December 2025).
  5. Navalta, J.W.; Montes, J.; Bodell, N.G.; Salatto, R.W.; Manning, J.W.; DeBeliso, M. Concurrent Heart Rate Validity of Wearable Technology Devices during Trail Running. PLOS ONE 2020, 15, e0238569. [Google Scholar] [CrossRef]
  6. Wearable Technology Market Size & Share 2035. Available online: https://www.businessresearchinsights.com/market-reports/wearable-technology-market-119131 (accessed on 27 December 2025).
  7. de Vries, H.J.; Kooiman, T.J.M.; van Ittersum, M.W.; van Brussel, M.; de Groot, M. Do Activity Monitors Increase Physical Activity in Adults with Overweight or Obesity? A Systematic Review and Meta-Analysis. Obesity 2016, 24, 2078–2091. [Google Scholar] [CrossRef]
  8. Rehman, R.Z.U.; Chatterjee, M.; Manyakov, N.V.; Daans, M.; Jackson, A.; O’Brisky, A.; Telesky, T.; Smets, S.; Berghmans, P.-J.; Yang, D.; et al. Assessment of Physiological Signals from Photoplethysmography Sensors Compared to an Electrocardiogram Sensor: A Validation Study in Daily Life. Sensors 2024, 24. [Google Scholar] [CrossRef] [PubMed]
  9. Hibbing, P.R.; Pilla, M.; Birmingham, L.; Byrd, A.; Ndagijimana, T.; Sadeghi, S.; Seigfreid, N.; Farr, D.; Al-Shawwa, B.; Ingram, D.G.; et al. Evaluation of the Garmin Vivofit 4 for Assessing Sleep in Youth Experiencing Sleep Disturbances. Digit. Health 2024, 10, 20552076241277150. [Google Scholar] [CrossRef]
  10. Altini, M.; Penders, J.; Vullers, R.; Amft, O. Personalizing Energy Expenditure Estimation Using Physiological Signals Normalization during Activities of Daily Living. Physiol. Meas. 2014, 35, 1797. [Google Scholar] [CrossRef] [PubMed]
  11. Etiwy, M.; Akhrass, Z.; Gillinov, L.; Alashi, A.; Wang, R.; Blackburn, G.; Gillinov, S.M.; Phelan, D.; Gillinov, A.M.; Houghtaling, P.L.; et al. Accuracy of Wearable Heart Rate Monitors in Cardiac Rehabilitation. Cardiovasc. Diagn. Ther. 2019, 9, 26271–26271. [Google Scholar] [CrossRef]
  12. Zakeri, I.; Adolph, A.L.; Puyau, M.R.; Vohra, F.A.; Butte, N.F. Application of Cross-Sectional Time Series Modeling for the Prediction of Energy Expenditure from Heart Rate and Accelerometry. J. Appl. Physiol. 2008, 104, 1665–1673. [Google Scholar] [CrossRef]
  13. Ainslie, P.N.; Reilly, T.; Westerterp, K.R. Estimating Human Energy Expenditure. Sports Med. 2003, 33, 683–698. [Google Scholar] [CrossRef]
  14. Crouter, S.E.; Clowers, K.G.; Bassett, D.R. A Novel Method for Using Accelerometer Data to Predict Energy Expenditure. J. Appl. Physiol. 2006, 100, 1324–1331. [Google Scholar] [CrossRef] [PubMed]
  15. Liu, M.; Po, L.; Fu, H. Cuffless Blood Pressure Estimation Based on Photoplethysmography Signal and Its Second Derivative. Int. J. Comput. Theory Eng. 2017, 9, 202–206. [Google Scholar] [CrossRef]
  16. Fine, I.; Kaminsky, A. Scattering-Driven PPG Signal Model. Biomed. Opt. Express 2022, 13, 2286. [Google Scholar] [CrossRef] [PubMed]
  17. Hettiarachchi, I.T.; Hanoun, S.; Nahavandi, D.; Nahavandi, S. Validation of Polar OH1 Optical Heart Rate Sensor for Moderate and High Intensity Physical Activities. PLOS ONE 2019, 14, e0217288. [Google Scholar] [CrossRef]
  18. Boudreaux, B.D.; Hebert, E.P.; Hollander, D.B.; Williams, B.M.; Cormier, C.L.; Naquin, M.R.; Gillan, W.W.; Gusew, E.E.; Kraemer, R.R. Validity of Wearable Activity Monitors during Cycling and Resistance Exercise. Med. Sci. Sports Exerc. 2018, 50, 624. [Google Scholar] [CrossRef]
  19. Støve, M.P.; Haucke, E.; Nymann, M.L.; Sigurdsson, T.; Larsen, B.T. Accuracy of the Wearable Activity Tracker Garmin Forerunner 235 for the Assessment of Heart Rate during Rest and Activity. J. Sports Sci. 2019, 37, 895–901. [Google Scholar] [CrossRef]
  20. Le, S.; Wang, X.; Zhang, T.; Lei, S.M.; Cheng, S.; Yao, W.; Schumann, M. Validity of Three Smartwatches in Estimating Energy Expenditure during Outdoor Walking and Running. Front. Physiol. 2022, 13. [Google Scholar] [CrossRef]
  21. Jamieson, A.; Jones, S.; Chaturvedi, N.; Hughes, A.D.; Orini, M. Accuracy of Smartwatches for the Remote Assessment of Exercise Capacity. Sci. Rep. 2024, 14, 22994. [Google Scholar] [CrossRef]
  22. Van Oost, C.N.; Masci, F.; Malisse, A.; Schyvens, A.-M.; Peters, B.; Dirix, H.; Ross, V.; Wets, G.; Neven, A.; Verbraecken, J.; et al. Accuracy of Heart Rate Measurement Under Transient States: A Validation Study of Wearables for Real-Life Monitoring. Sensors 2025, 25. [Google Scholar] [CrossRef]
  23. Wahl, Y.; Düking, P.; Droszez, A.; Wahl, P.; Mester, J. Criterion-Validity of Commercially Available Physical Activity Tracker to Estimate Step Count, Covered Distance and Energy Expenditure during Sports Conditions. Front. Physiol. 2017, 8. [Google Scholar] [CrossRef]
  24. Bunn, J.; Navalta, J.; Fountaine, C.; Reece, J. Current State of Commercial Wearable Technology in Physical Activity Monitoring 2015-2017. Int. J. Exerc. Sci. 2018, 11, 503–515. [Google Scholar] [CrossRef] [PubMed]
  25. Doherty, C.; Baldwin, M.; Keogh, A.; Caulfield, B.; Argent, R. Keeping Pace with Wearables: A Living Umbrella Review of Systematic Reviews Evaluating the Accuracy of Consumer Wearable Technologies in Health Measurement. Sports Med. 2024, 54, 2907–2926. [Google Scholar] [CrossRef]
  26. Wells, L.; Konoval, T.; Bruce, L. An Examination of How and Why Triathlon Coaches Use a Suite of Technologies in Their Practice. Int. J. Sports Sci. Coach. 2023, 18, 687–694. [Google Scholar] [CrossRef]
  27. Garber, C.E.; Blissmer, B.; Deschenes, M.R.; Franklin, B.A.; Lamonte, M.J.; Lee, I.-M.; Nieman, D.C.; Swain, D.P. Quantity and Quality of Exercise for Developing and Maintaining Cardiorespiratory, Musculoskeletal, and Neuromotor Fitness in Apparently Healthy Adults: Guidance for Prescribing Exercise. Med. Sci. Sports Exerc. 2011, 43, 1334–1359. [Google Scholar] [CrossRef]
  28. Jagim, A.R.; Koch-Gallup, N.; Camic, C.L.; Kroening, L.; Nolte, C.; Schroeder, C.; Gran, L.; Erickson, J.L. The Accuracy of Fitness Watches for the Measurement of Heart Rate and Energy Expenditure during Moderate Intensity Exercise. J. Sports Med. Phys. Fitness 2021, 61. [Google Scholar] [CrossRef]
  29. Mora-Gonzalez, J.; Gould, Z.R.; Moore, C.C.; Aguiar, E.J.; Ducharme, S.W.; Schuna, J.M.; Barreira, T.V.; Staudenmayer, J.; McAvoy, C.R.; Boikova, M.; et al. A Catalog of Validity Indices for Step Counting Wearable Technologies during Treadmill Walking: The CADENCE-Adults Study. Int. J. Behav. Nutr. Phys. Act. 2022, 19, 117. [Google Scholar] [CrossRef]
  30. Mühlen, J.M.; Stang, J.; Lykke Skovgaard, E.; Judice, P.B.; Molina-Garcia, P.; Johnston, W.; Sardinha, L.B.; Ortega, F.B.; Caulfield, B.; Bloch, W.; et al. Recommendations for Determining the Validity of Consumer Wearable Heart Rate Devices: Expert Statement and Checklist of the INTERLIVE Network. Br. J. Sports Med. 2021, 55, 767–779. [Google Scholar] [CrossRef]
  31. Jo, E.; Lewis, K.; Directo, D.; Kim, M.J.; Dolezal, B.A. Validation of Biofeedback Wearables for Photoplethysmographic Heart Rate Tracking. J. Sports Sci. Med. 2016, 15, 540–547. [Google Scholar] [PubMed]
  32. Navalta, J.W.; Davis, D.W.; Malek, E.M.; Carrier, B.; Bodell, N.G.; Manning, J.W.; Cowley, J.; Funk, M.; Lawrence, M.M.; DeBeliso, M. Heart Rate Processing Algorithms and Exercise Duration on Reliability and Validity Decisions in Biceps-Worn Polar Verity Sense and OH1 Wearables. Sci. Rep. 2023, 13, 11736. [Google Scholar] [CrossRef] [PubMed]
  33. Schweizer, T.; Gilgen-Ammann, R. Wrist-Worn and Arm-Worn Wearables for Monitoring Heart Rate During Sedentary and Light-to-Vigorous Physical Activities: Device Validation Study. JMIR Cardio 2025, 9, e67110. [Google Scholar] [CrossRef] [PubMed]
  34. Neudorfer, M.; Kumar, D.; Smeddinck, J.D.; Kulnik, S.T.; Niebauer, J.; Treff, G.; Sareban, M. Validity of Four Consumer-Grade Optical Heart Rate Sensors for Assessing Volume and Intensity Distribution of Physical Activity. Scand. J. Med. Sci. Sports 2024, 34, e14756. [Google Scholar] [CrossRef]
  35. Hao, Y.; Ma, X.-K.; Zhu, Z.; Cao, Z.-B. Validity of Wrist-Wearable Activity Devices for Estimating Physical Activity in Adolescents: Comparative Study. JMIR MHealth UHealth 2021, 9, e18320. [Google Scholar] [CrossRef]
  36. Moore, C.C.; McCullough, A.K.; Aguiar, E.J.; Ducharme, S.W.; Tudor-Locke, C. Toward Harmonized Treadmill-Based Validation of Step-Counting Wearable Technologies: A Scoping Review. 2020. [Google Scholar] [CrossRef]
  37. Falter, M.; Budts, W.; Goetschalckx, K.; Cornelissen, V.; Buys, R. Accuracy of Apple Watch Measurements for Heart Rate and Energy Expenditure in Patients With Cardiovascular Disease: Cross-Sectional Study. JMIR MHealth UHealth 2019, 7, e11889. [Google Scholar] [CrossRef]
  38. Martín-Escudero, P.; Cabanas, A.M.; Dotor-Castilla, M.L.; Galindo-Canales, M.; Miguel-Tobal, F.; Fernández-Pérez, C.; Fuentes-Ferrer, M.; Giannetti, R.; Martín-Escudero, P.; Cabanas, A.M.; et al. Are Activity Wrist-Worn Devices Accurate for Determining Heart Rate during Intense Exercise? Bioengineering 2023, 10. [Google Scholar] [CrossRef]
  39. Merrigan, J.J.; Stovall, J.H.; Stone, J.D.; Stephenson, M.; Finomore, V.S.; Hagen, J.A. Validation of Garmin and Polar Devices for Continuous Heart Rate Monitoring During Common Training Movements in Tactical Populations. Meas. Phys. Educ. Exerc. Sci. 2023, 27, 234–247. [Google Scholar] [CrossRef]
  40. Navalta, J.W.; Carrier, B.; Blank, M.; Zarei, S.; Davis, D.W.; Craig, M.; Perez, O.R.; Baca, J.; Sweder, T.S.; Carballo, T.; et al. Validity and Reliability of Wearable Technology Devices during Simulated Pickleball Game Play. Sports 2024, 12. [Google Scholar] [CrossRef] [PubMed]
  41. Chowdhury, E.A.; Western, M.J.; Nightingale, T.E.; Peacock, O.J.; Thompson, D. Assessment of Laboratory and Daily Energy Expenditure Estimates from Consumer Multi-Sensor Physical Activity Monitors. PLOS ONE 2017, 12, e0171720. [Google Scholar] [CrossRef]
  42. Hajj-Boutros, G.; Landry-Duval, M.-A.; Comtois, A.S.; Gouspillou, G.; Karelis, A.D. Wrist-Worn Devices for the Measurement of Heart Rate and Energy Expenditure: A Validation Study for the Apple Watch 6, Polar Vantage V and Fitbit Sense. Eur. J. Sport Sci. 2023, 23, 165–177. [Google Scholar] [CrossRef]
  43. John, D.; Tyo, B.; Bassett, D.R. Comparison of Four ActiGraph Accelerometers during Walking and Running. Med. Sci. Sports Exerc. 2010, 42, 368–374. [Google Scholar] [CrossRef] [PubMed]
  44. Chen, M.D.; Kuo, C.C.; Pellegrini, C.A.; Hsu, M.J. Accuracy of Wristband Activity Monitors during Ambulation and Activities. Med. Sci. Sports Ererc 2016, 48, 1942–9. [Google Scholar] [CrossRef] [PubMed]
  45. Cabanas, A.M.; Fuentes-Guajardo, M.; Latorre, K.; León, D.; Martín-Escudero, P. Skin Pigmentation Influence on Pulse Oximetry Accuracy: A Systematic Review and Bibliometric Analysis. Sensors 2022, 22. [Google Scholar] [CrossRef] [PubMed]
Figure 1. Relationships between criterion measures and Garmin Smartwatch for heart rate, energy expenditure, and step count.
Preprints 192877 g001
Figure 2. Bland-Altman plots for the relationships between constant error (CE) and the criterion heart rate, energy expenditure, and step count values. CE (dashed lines); upper and lower limits of agreements (dotted lines); and lines of regression (solid lines).
Preprints 192877 g002
Disclaimer/Publisher’s Note: The statements, opinions and data contained in all publications are solely those of the individual author(s) and contributor(s) and not of MDPI and/or the editor(s). MDPI and/or the editor(s) disclaim responsibility for any injury to people or property resulting from any ideas, methods, instructions or products referred to in the content.
Copyright: This open access article is published under a Creative Commons CC BY 4.0 license, which permit the free download, distribution, and reuse, provided that the author and preprint are cited in any reuse.
Prerpints.org logo

Preprints.org is a free preprint server supported by MDPI in Basel, Switzerland.

Subscribe

Disclaimer

Terms of Use

Privacy Policy

Privacy Settings

© 2026 MDPI (Basel, Switzerland) unless otherwise stated