Submitted:
04 January 2026
Posted:
06 January 2026
You are already at the latest version
Abstract
The article presents a technology for the physical recycling of printed circuit boards (PCBs) that is consistent with the principles of circular economy and sustainable production. A Life Cycle Assessment (LCA) was performed for PCB recycling using shredding, grinding and physical and physicochemical processes such as electrostatic separation, gravity separation and flotation for the separation of metals and plastics. On the basis of this assessment and the selectivity criterion, electrostatic separation was found to be the best separation method used after shredding and cryogenic grinding. Furthermore, the financial potential of recycling and other benefits that recycling can bring to the economics of the business and to the protection of the environment were presented. The possibility of using non-metallic fraction (plastic) generated during the recycling as an additive in the production of composite materials was assessed. The functional properties of the composite were assessed (static tensile, hardness, pin-on-disc, and Schopper-Schlobach abrasion tests), as well as the ecotoxicity of the powder added to polymeric materials such as polyester and epoxy resins, and silicone, used in the production of consumer goods.
Keywords:
1. Introduction
2. Materials and Methods
2.1. Methods
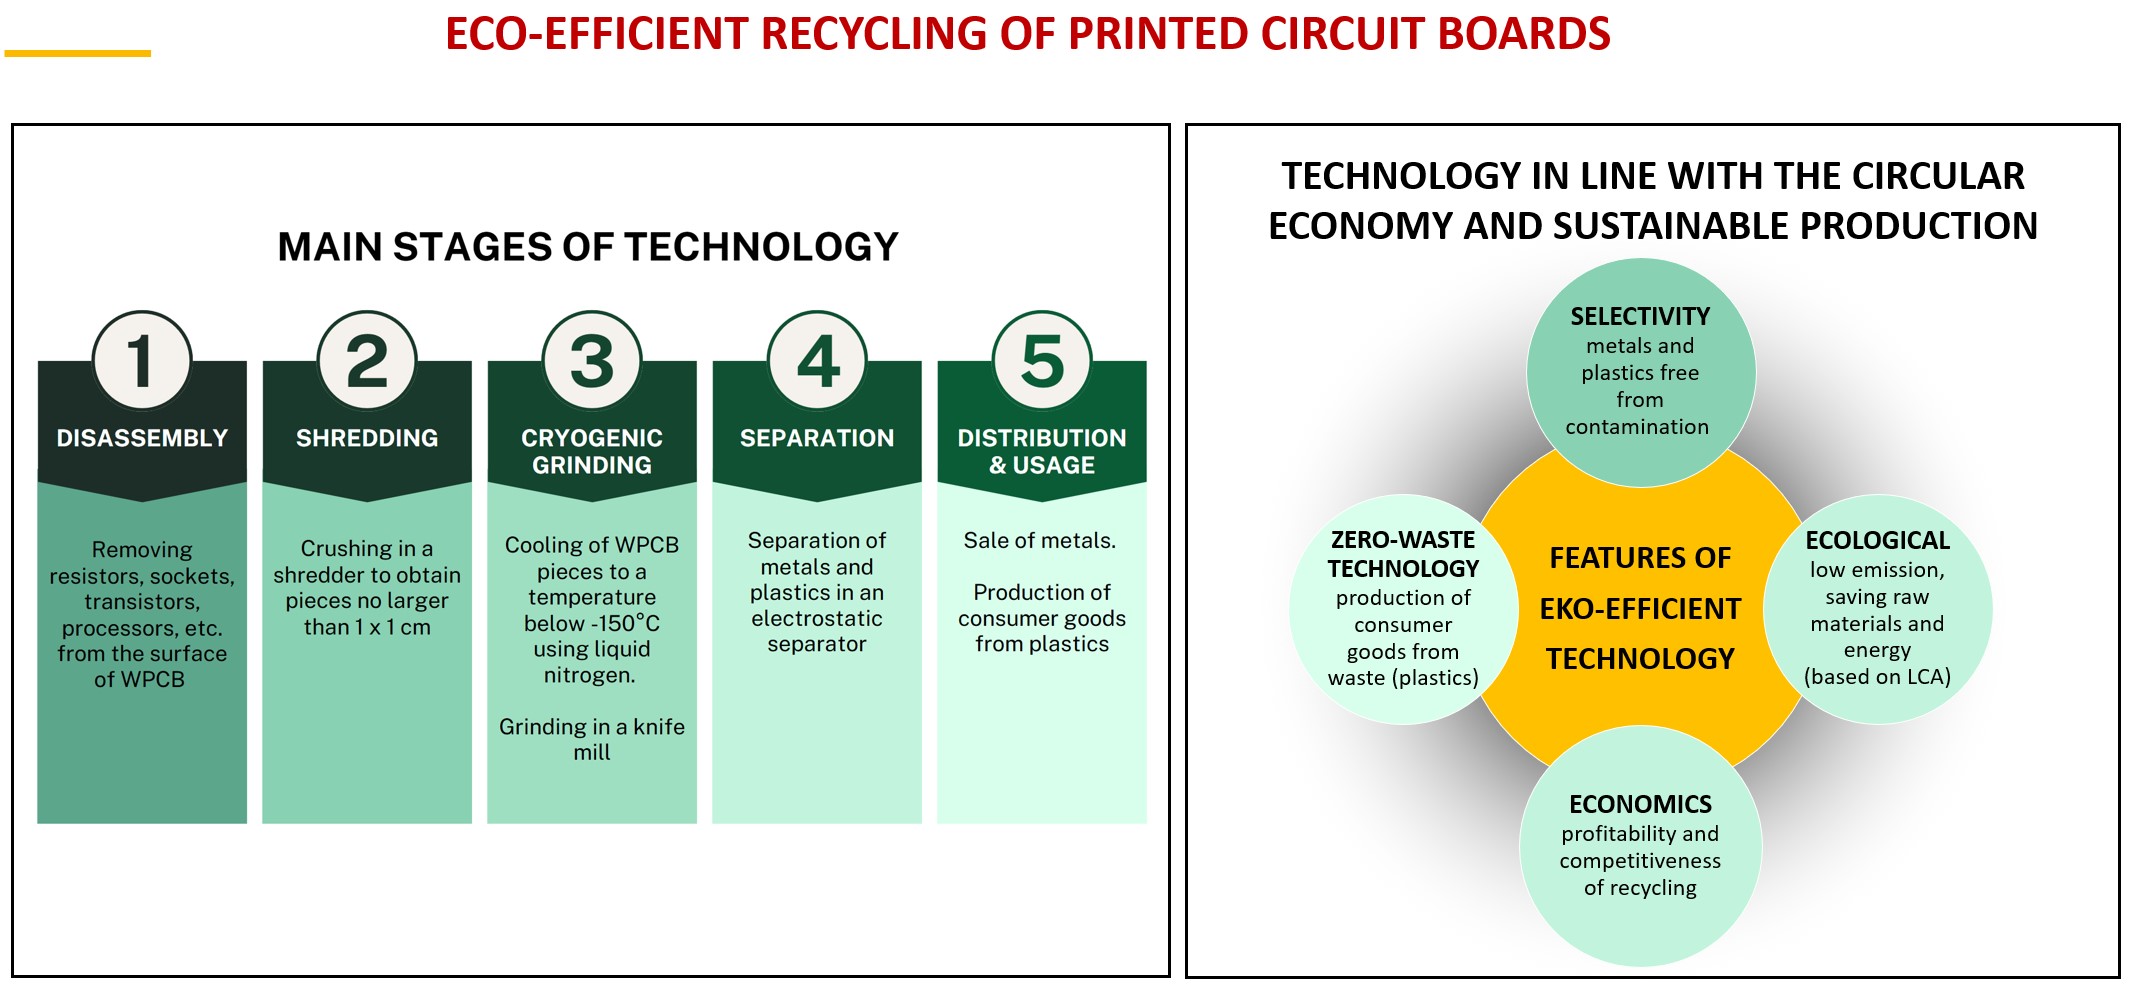
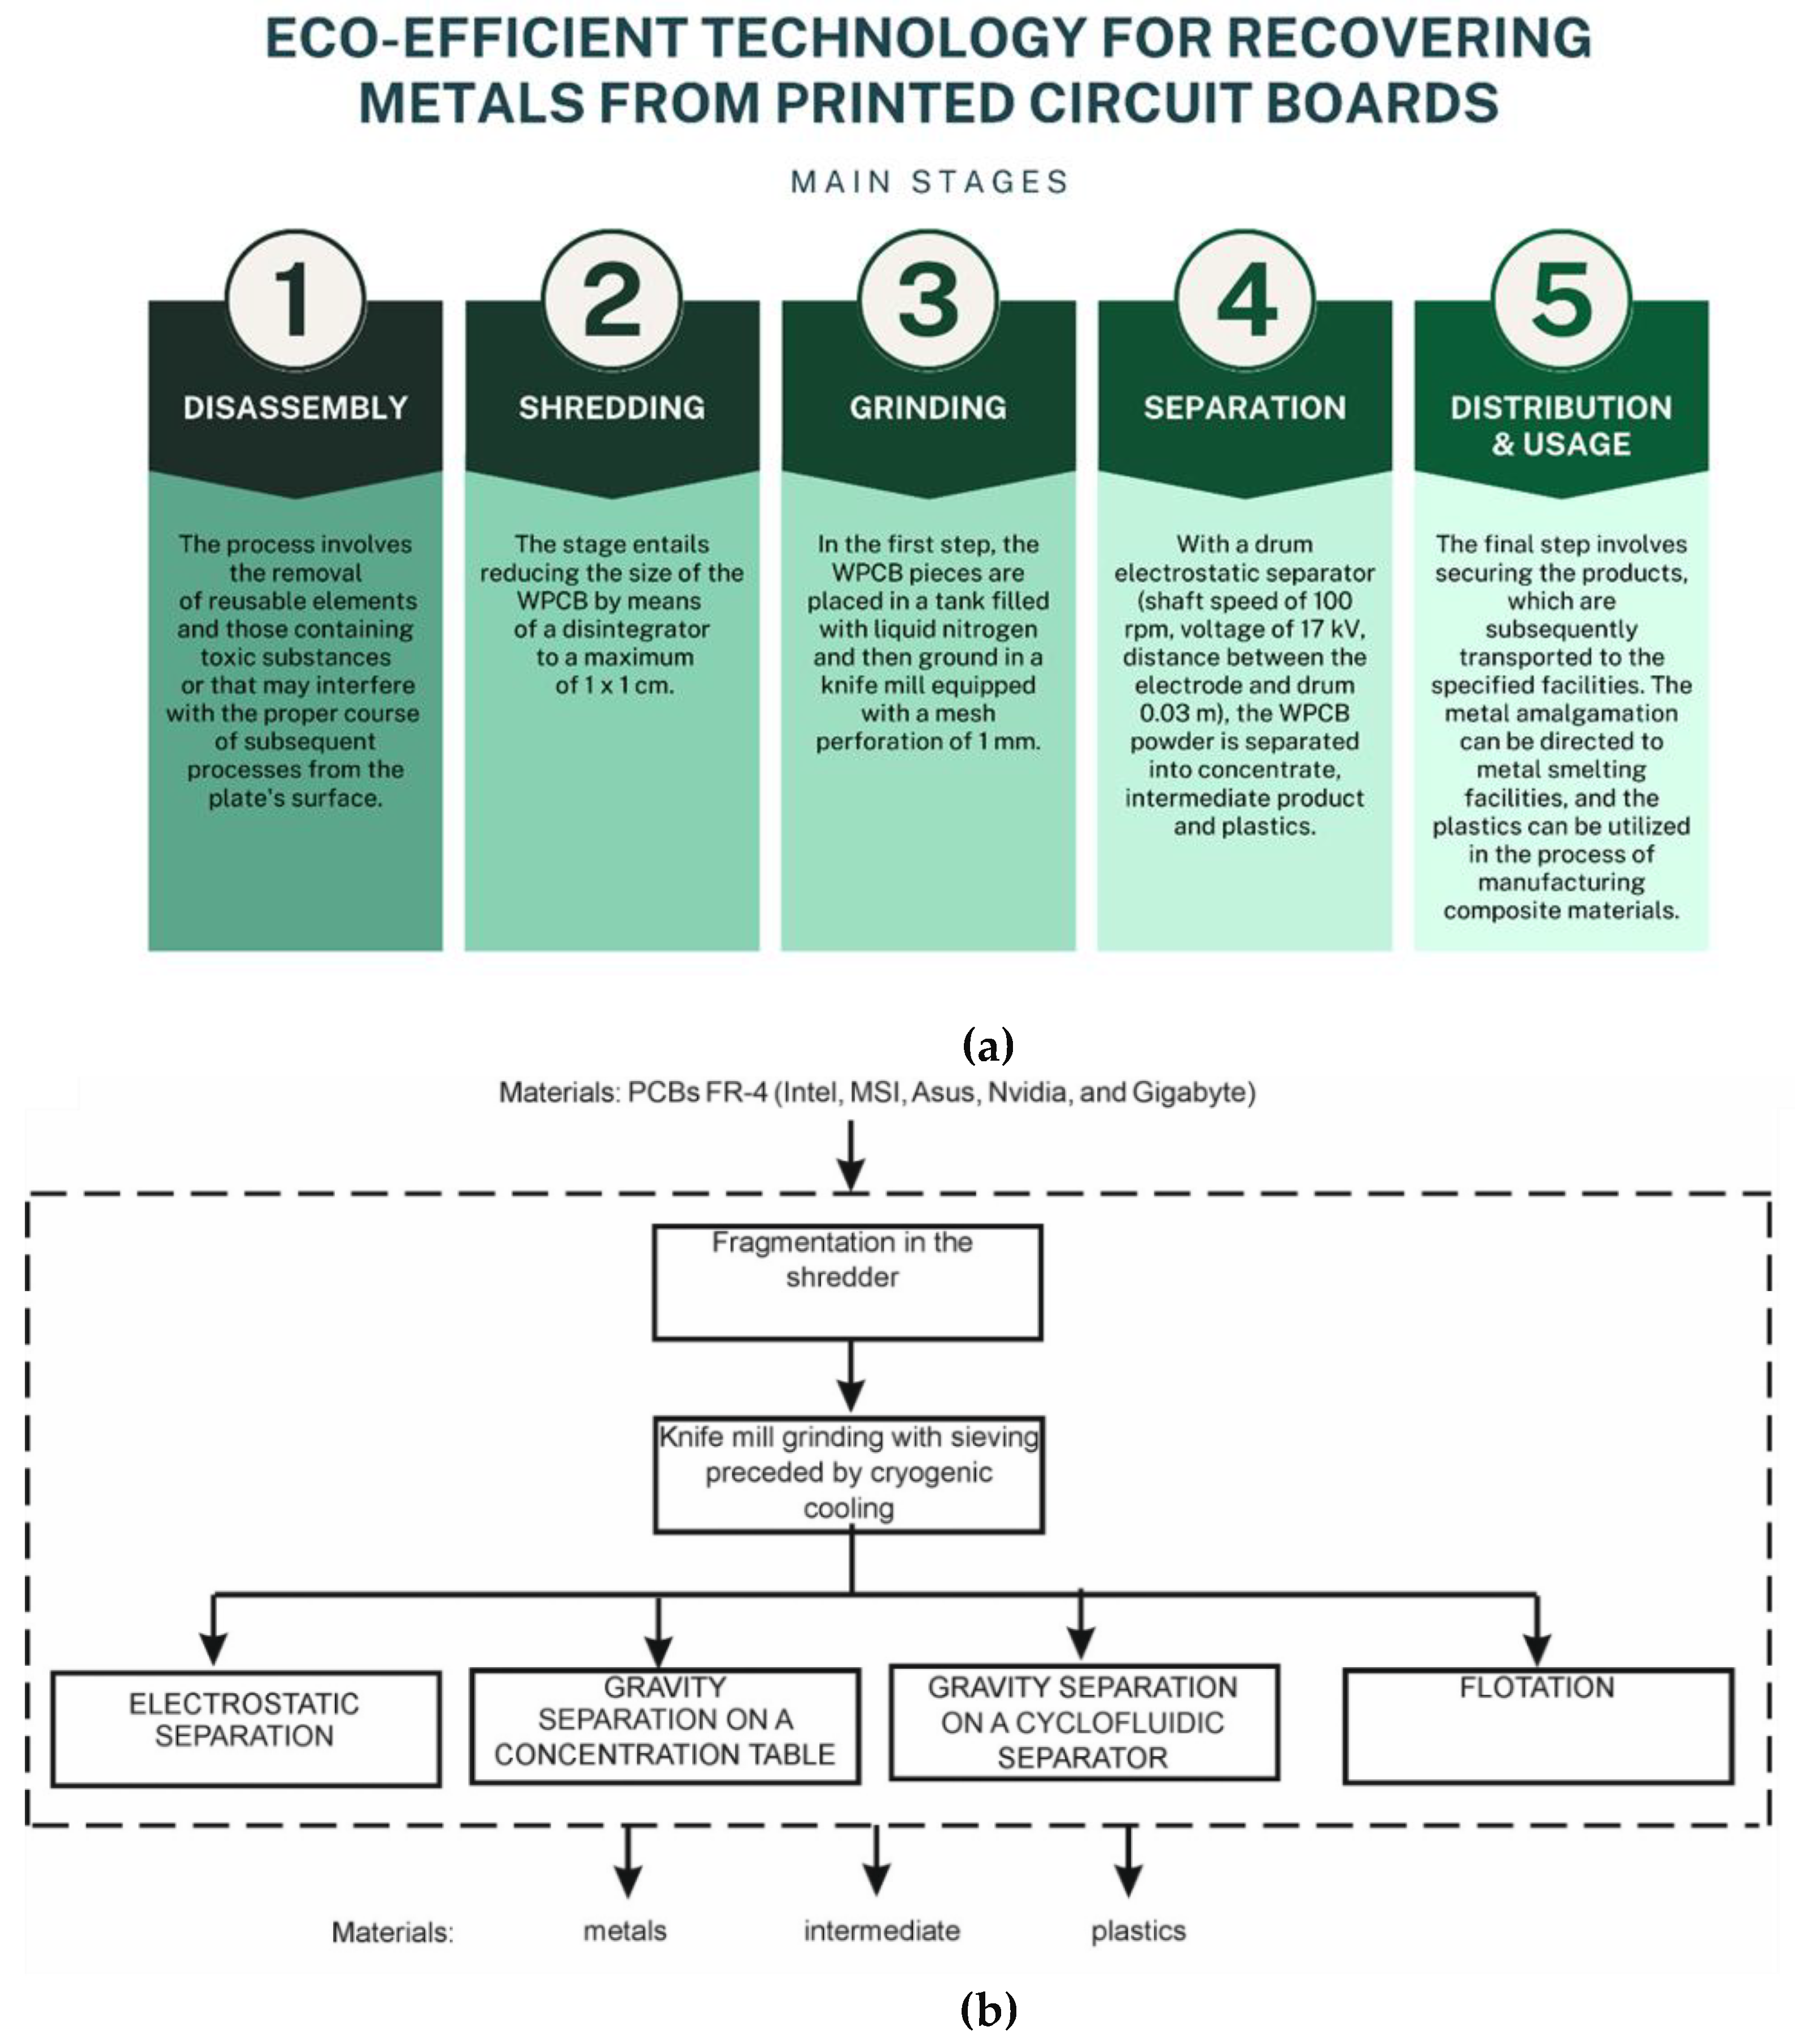
2.1.1. WPCB Recycling Technology
2.1.2. Life Cycle Assessment (LCA)
2.1.3. Using WPCB Recycled Plastic to Produce Composite Materials - Strength Parameters
2.1.4. Using WPCB Recycled Plastic to Produce Composite Materials - Phytotoxicity Test
2.2. Materials
2.2.1. Material for Recycling
2.2.2. Characteristics of Polymers and Fillers for the Production of Composite Materials
3. Results
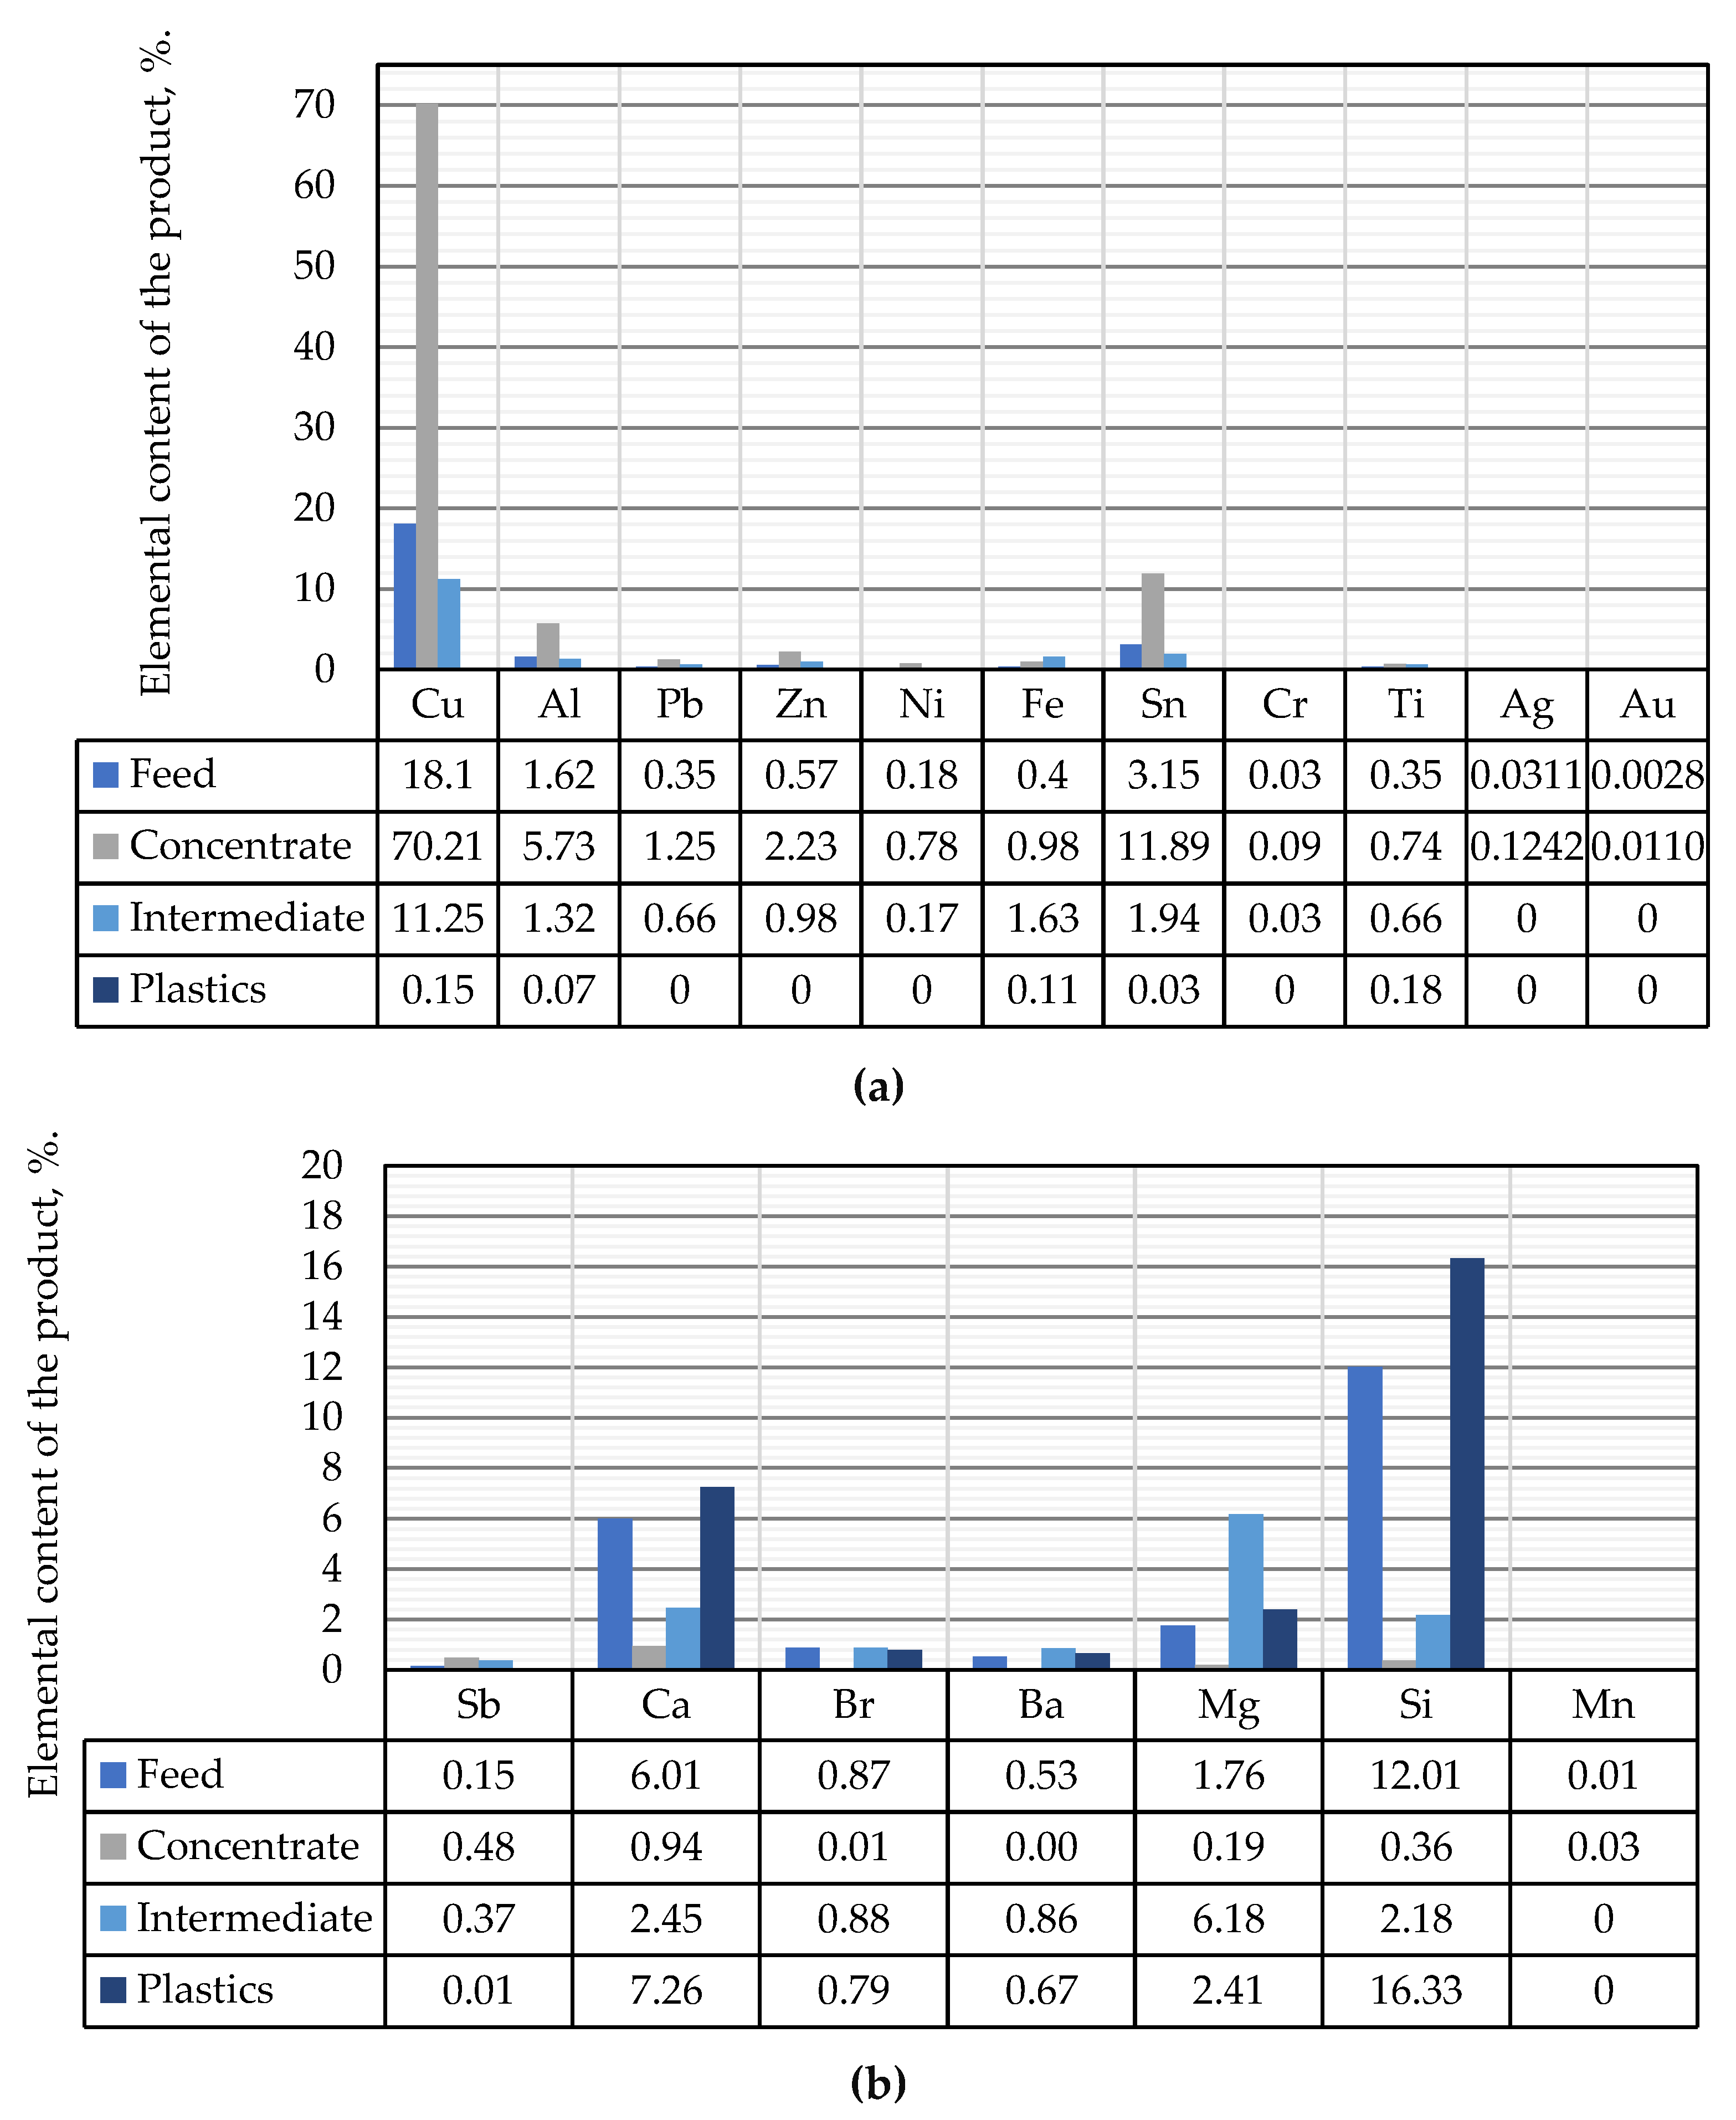
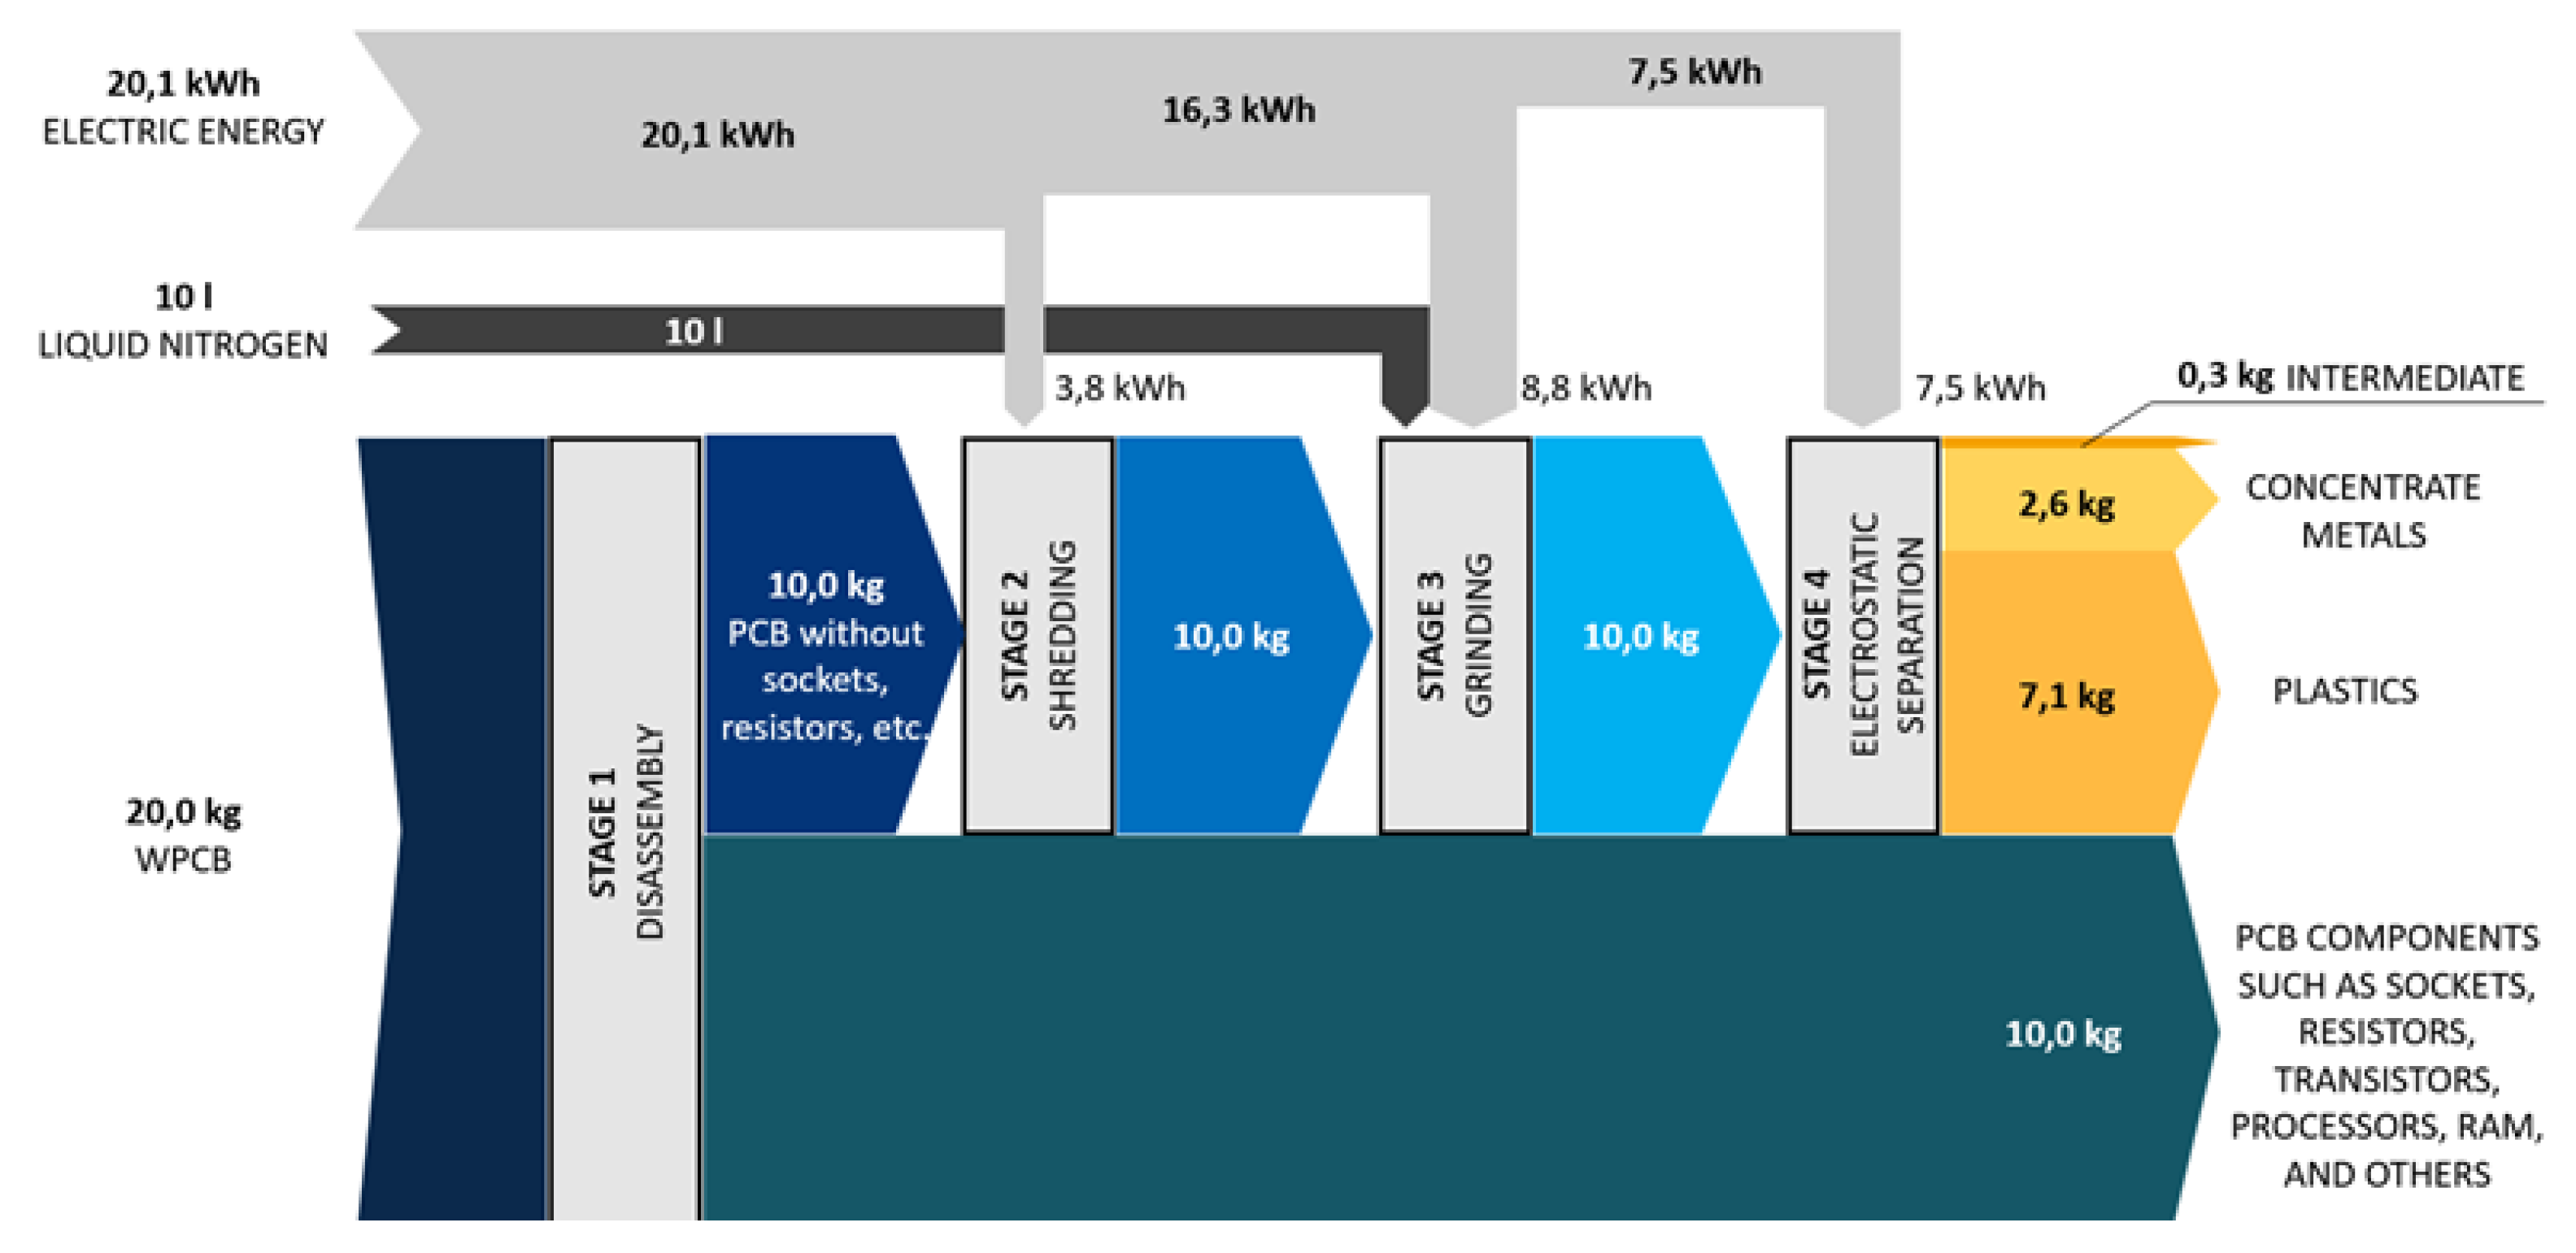
3.1. WPCB Recycling
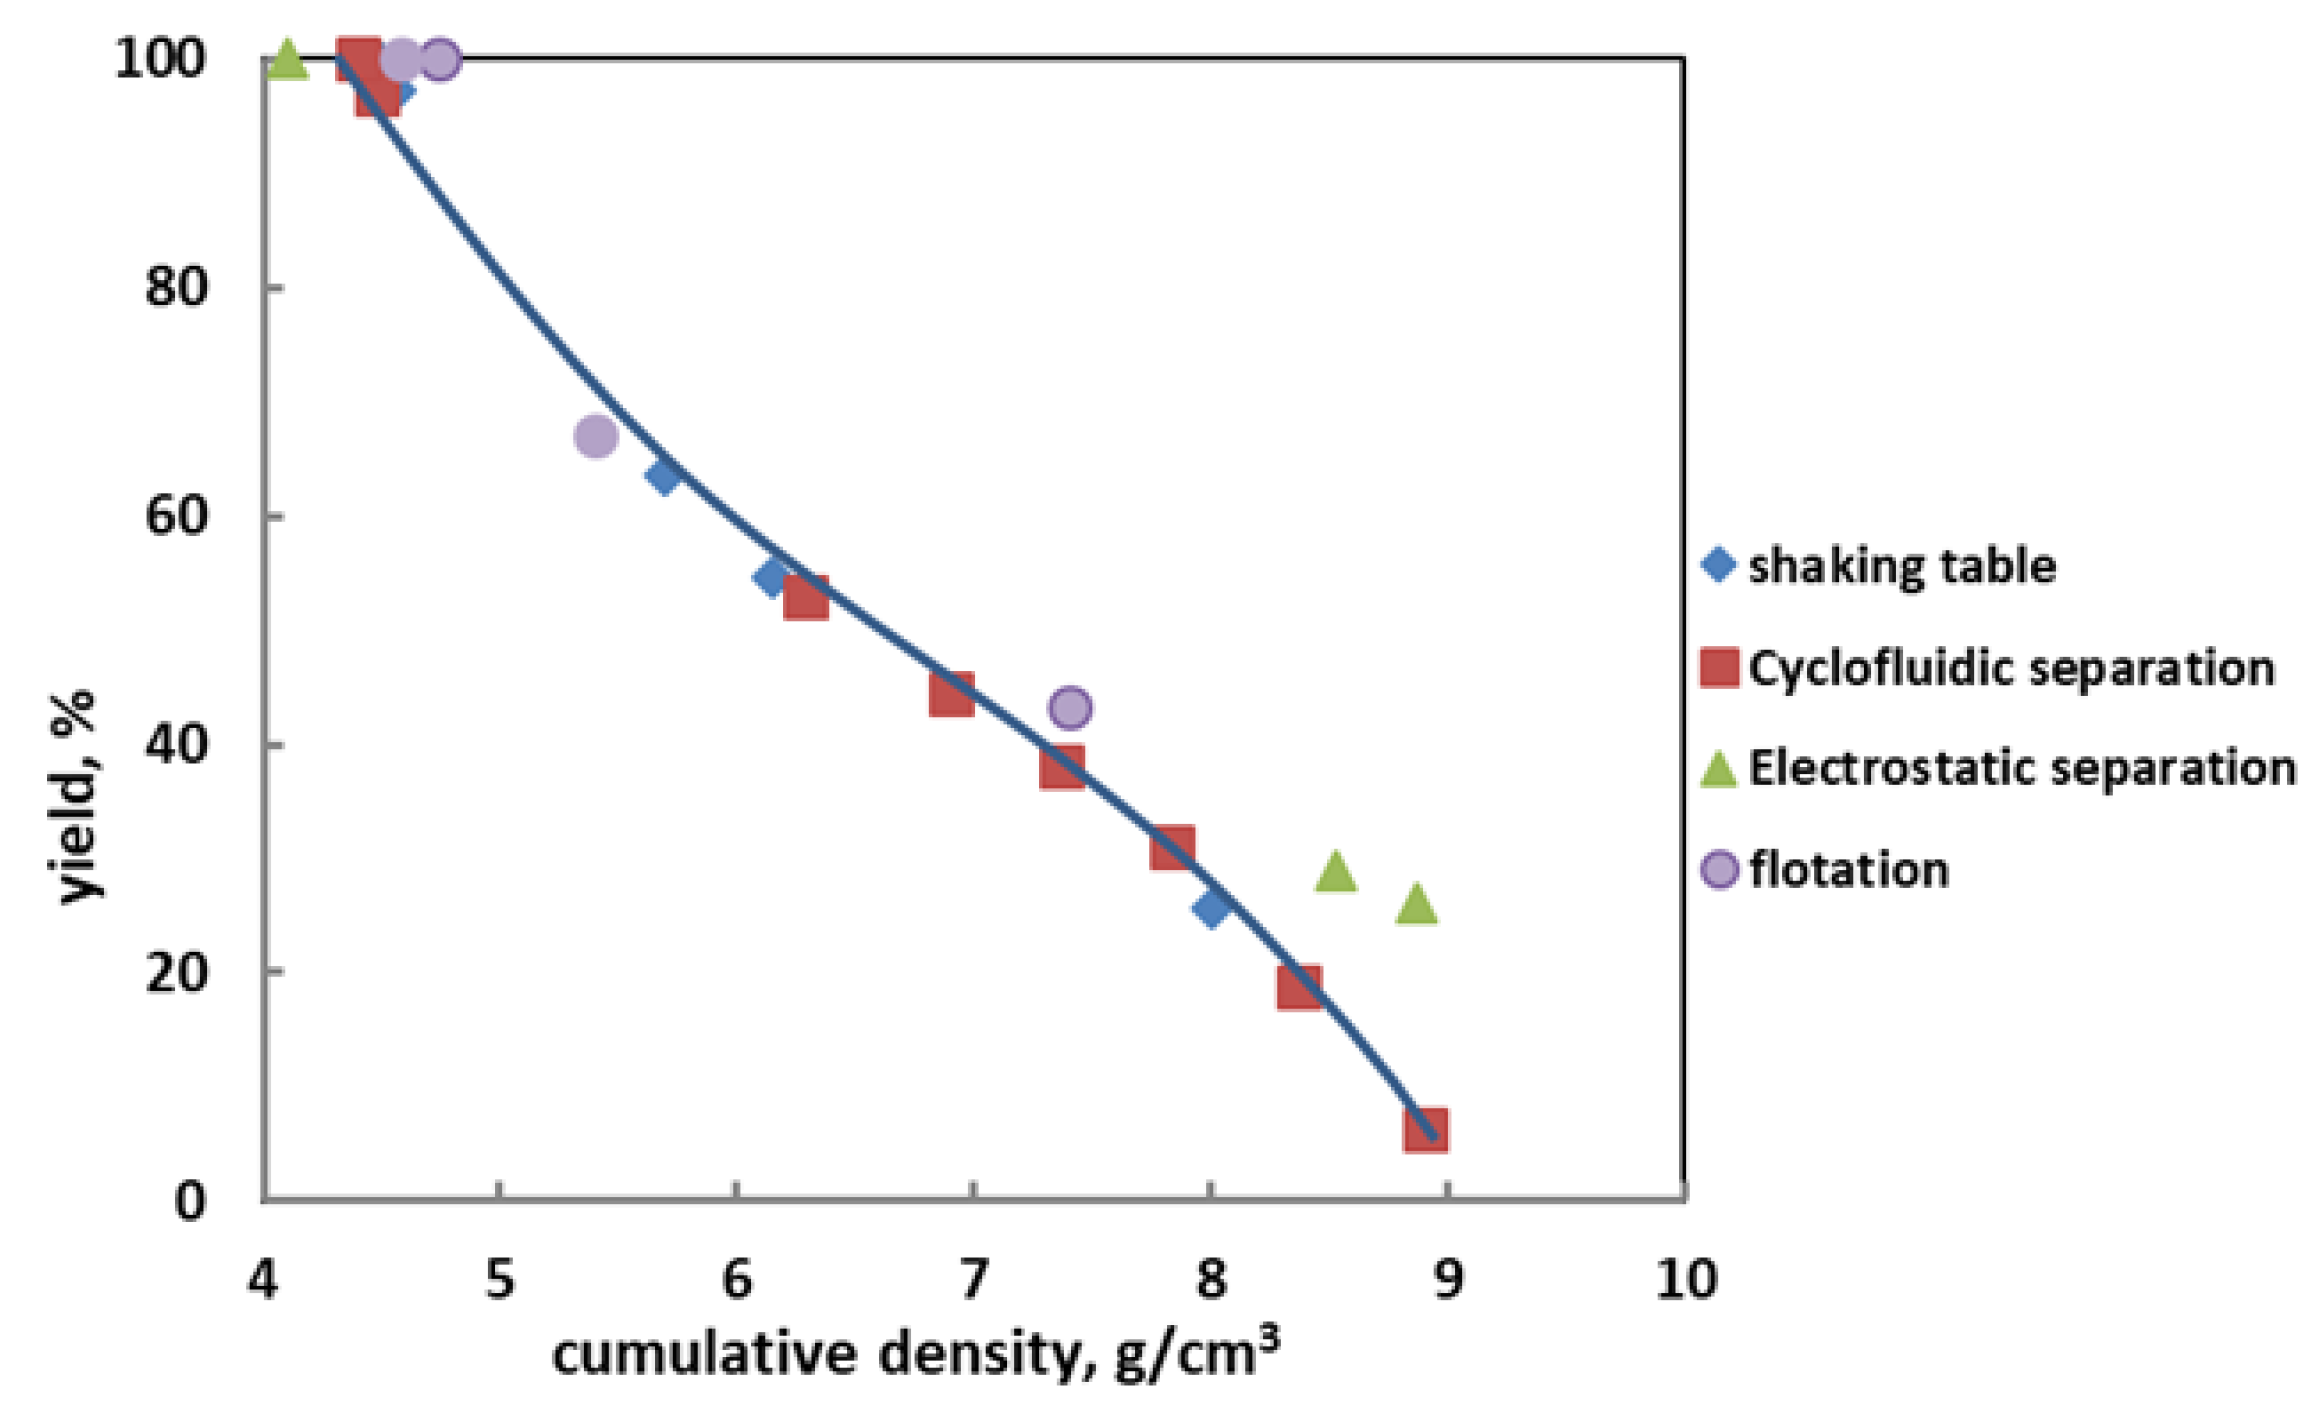
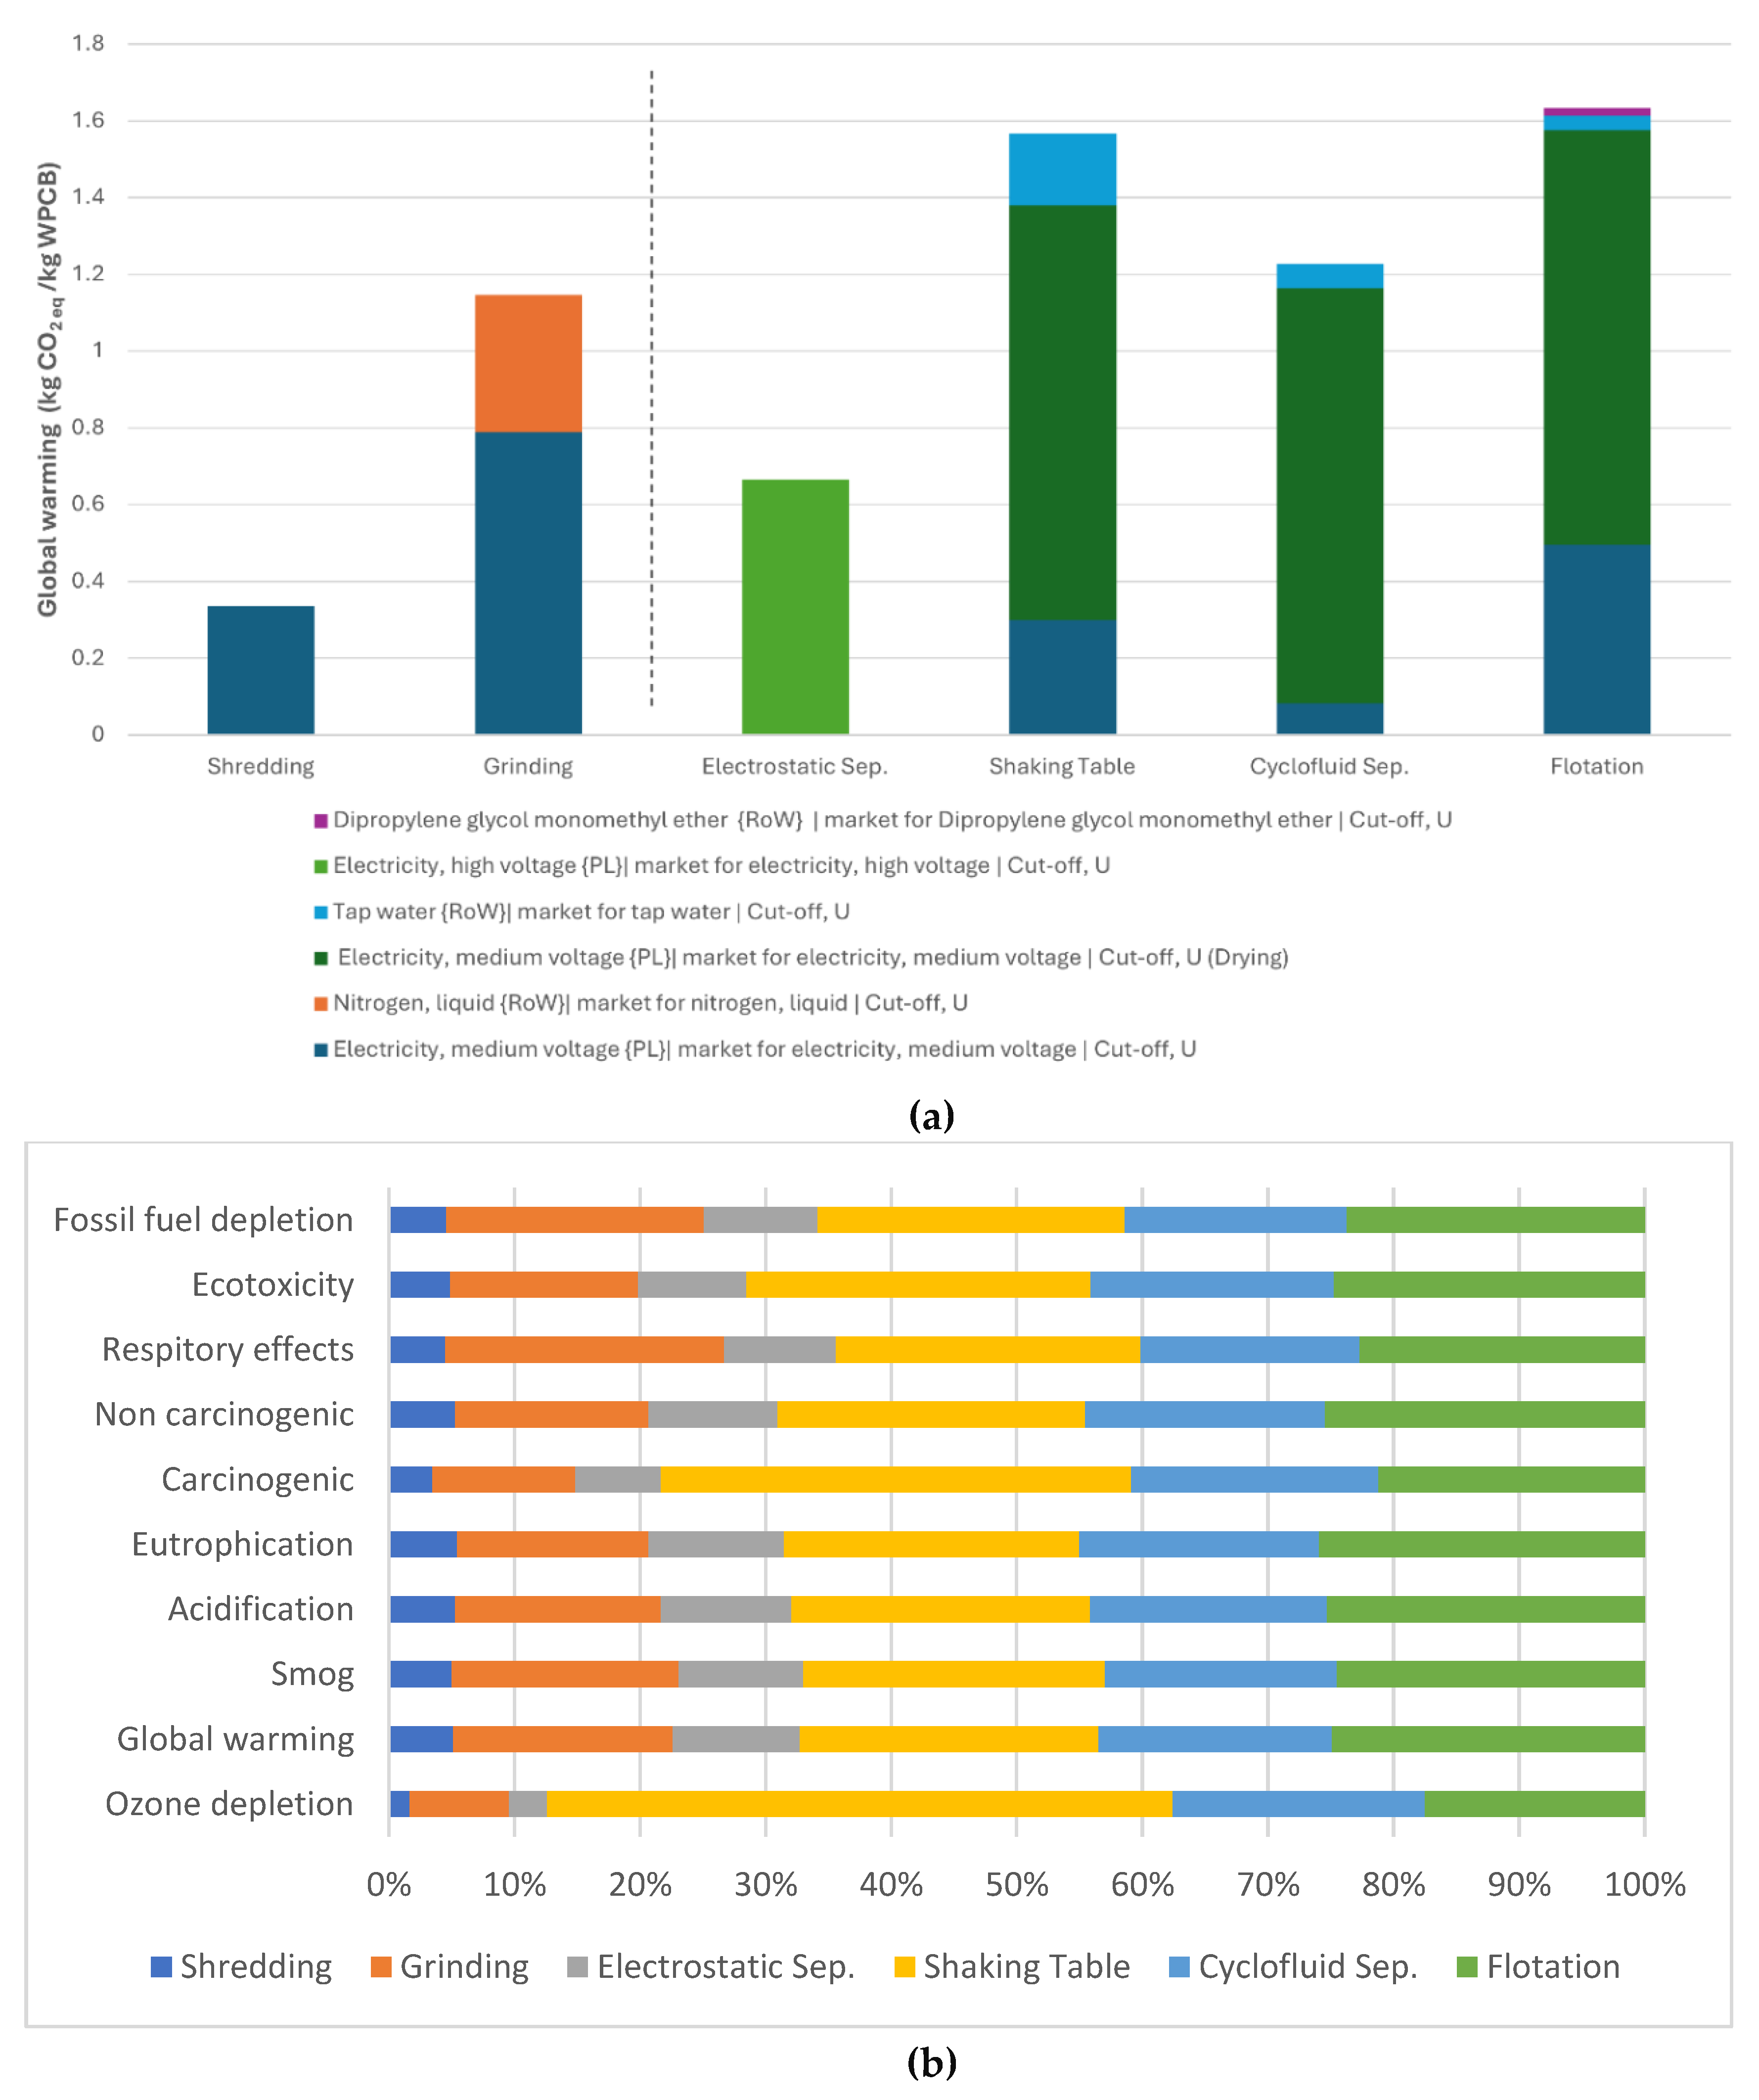
3.2. Life Cycle Assessment (LCA)
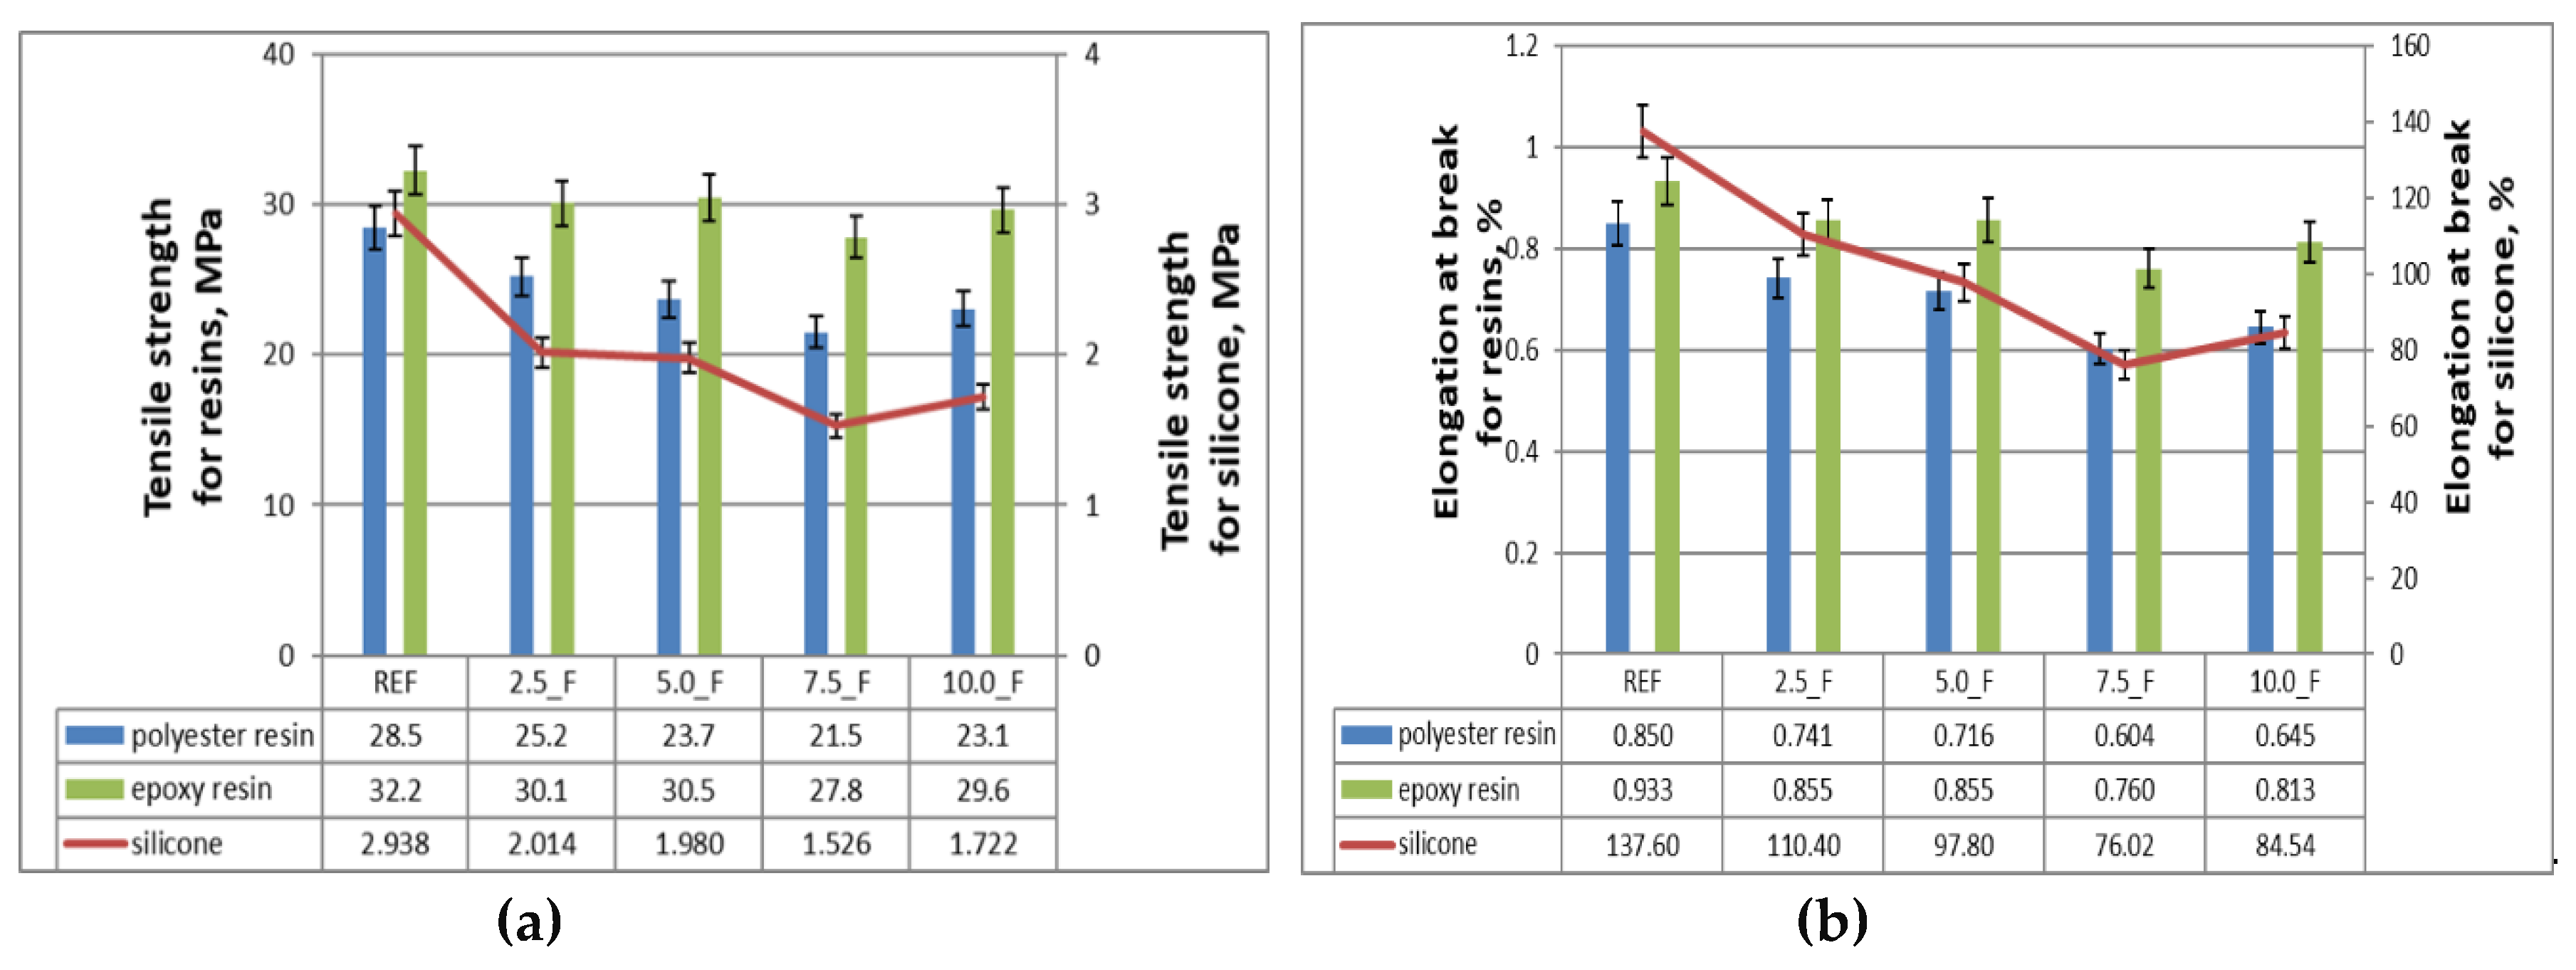
3.3. Strength Parameters of Composite Materials
3.3.1. Tensile Tests of Composite Materials
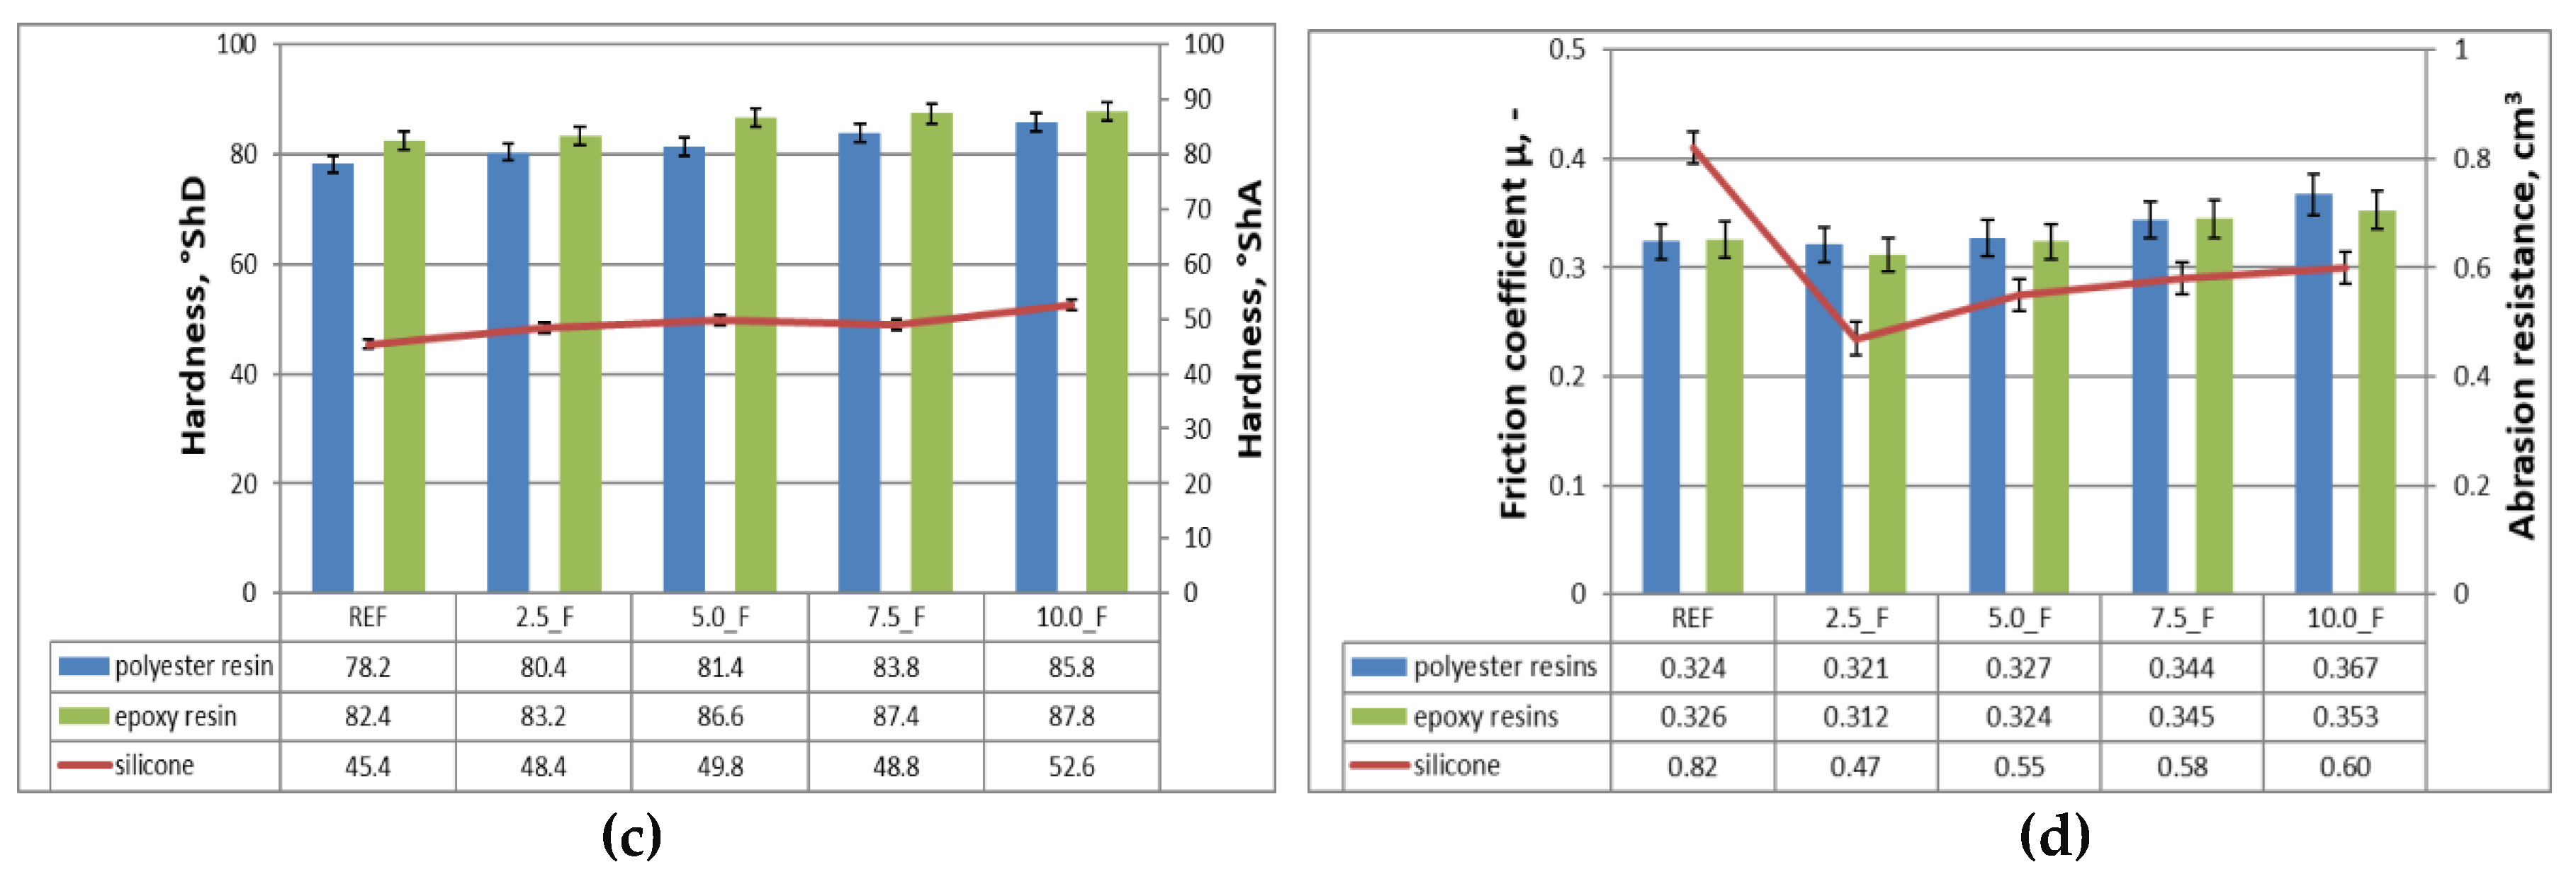
3.3.2. Hardness Tests of Composite Materials
3.3.3. Abrasion Tests of Composite Materials
3.4. Phytotoxicity Tests
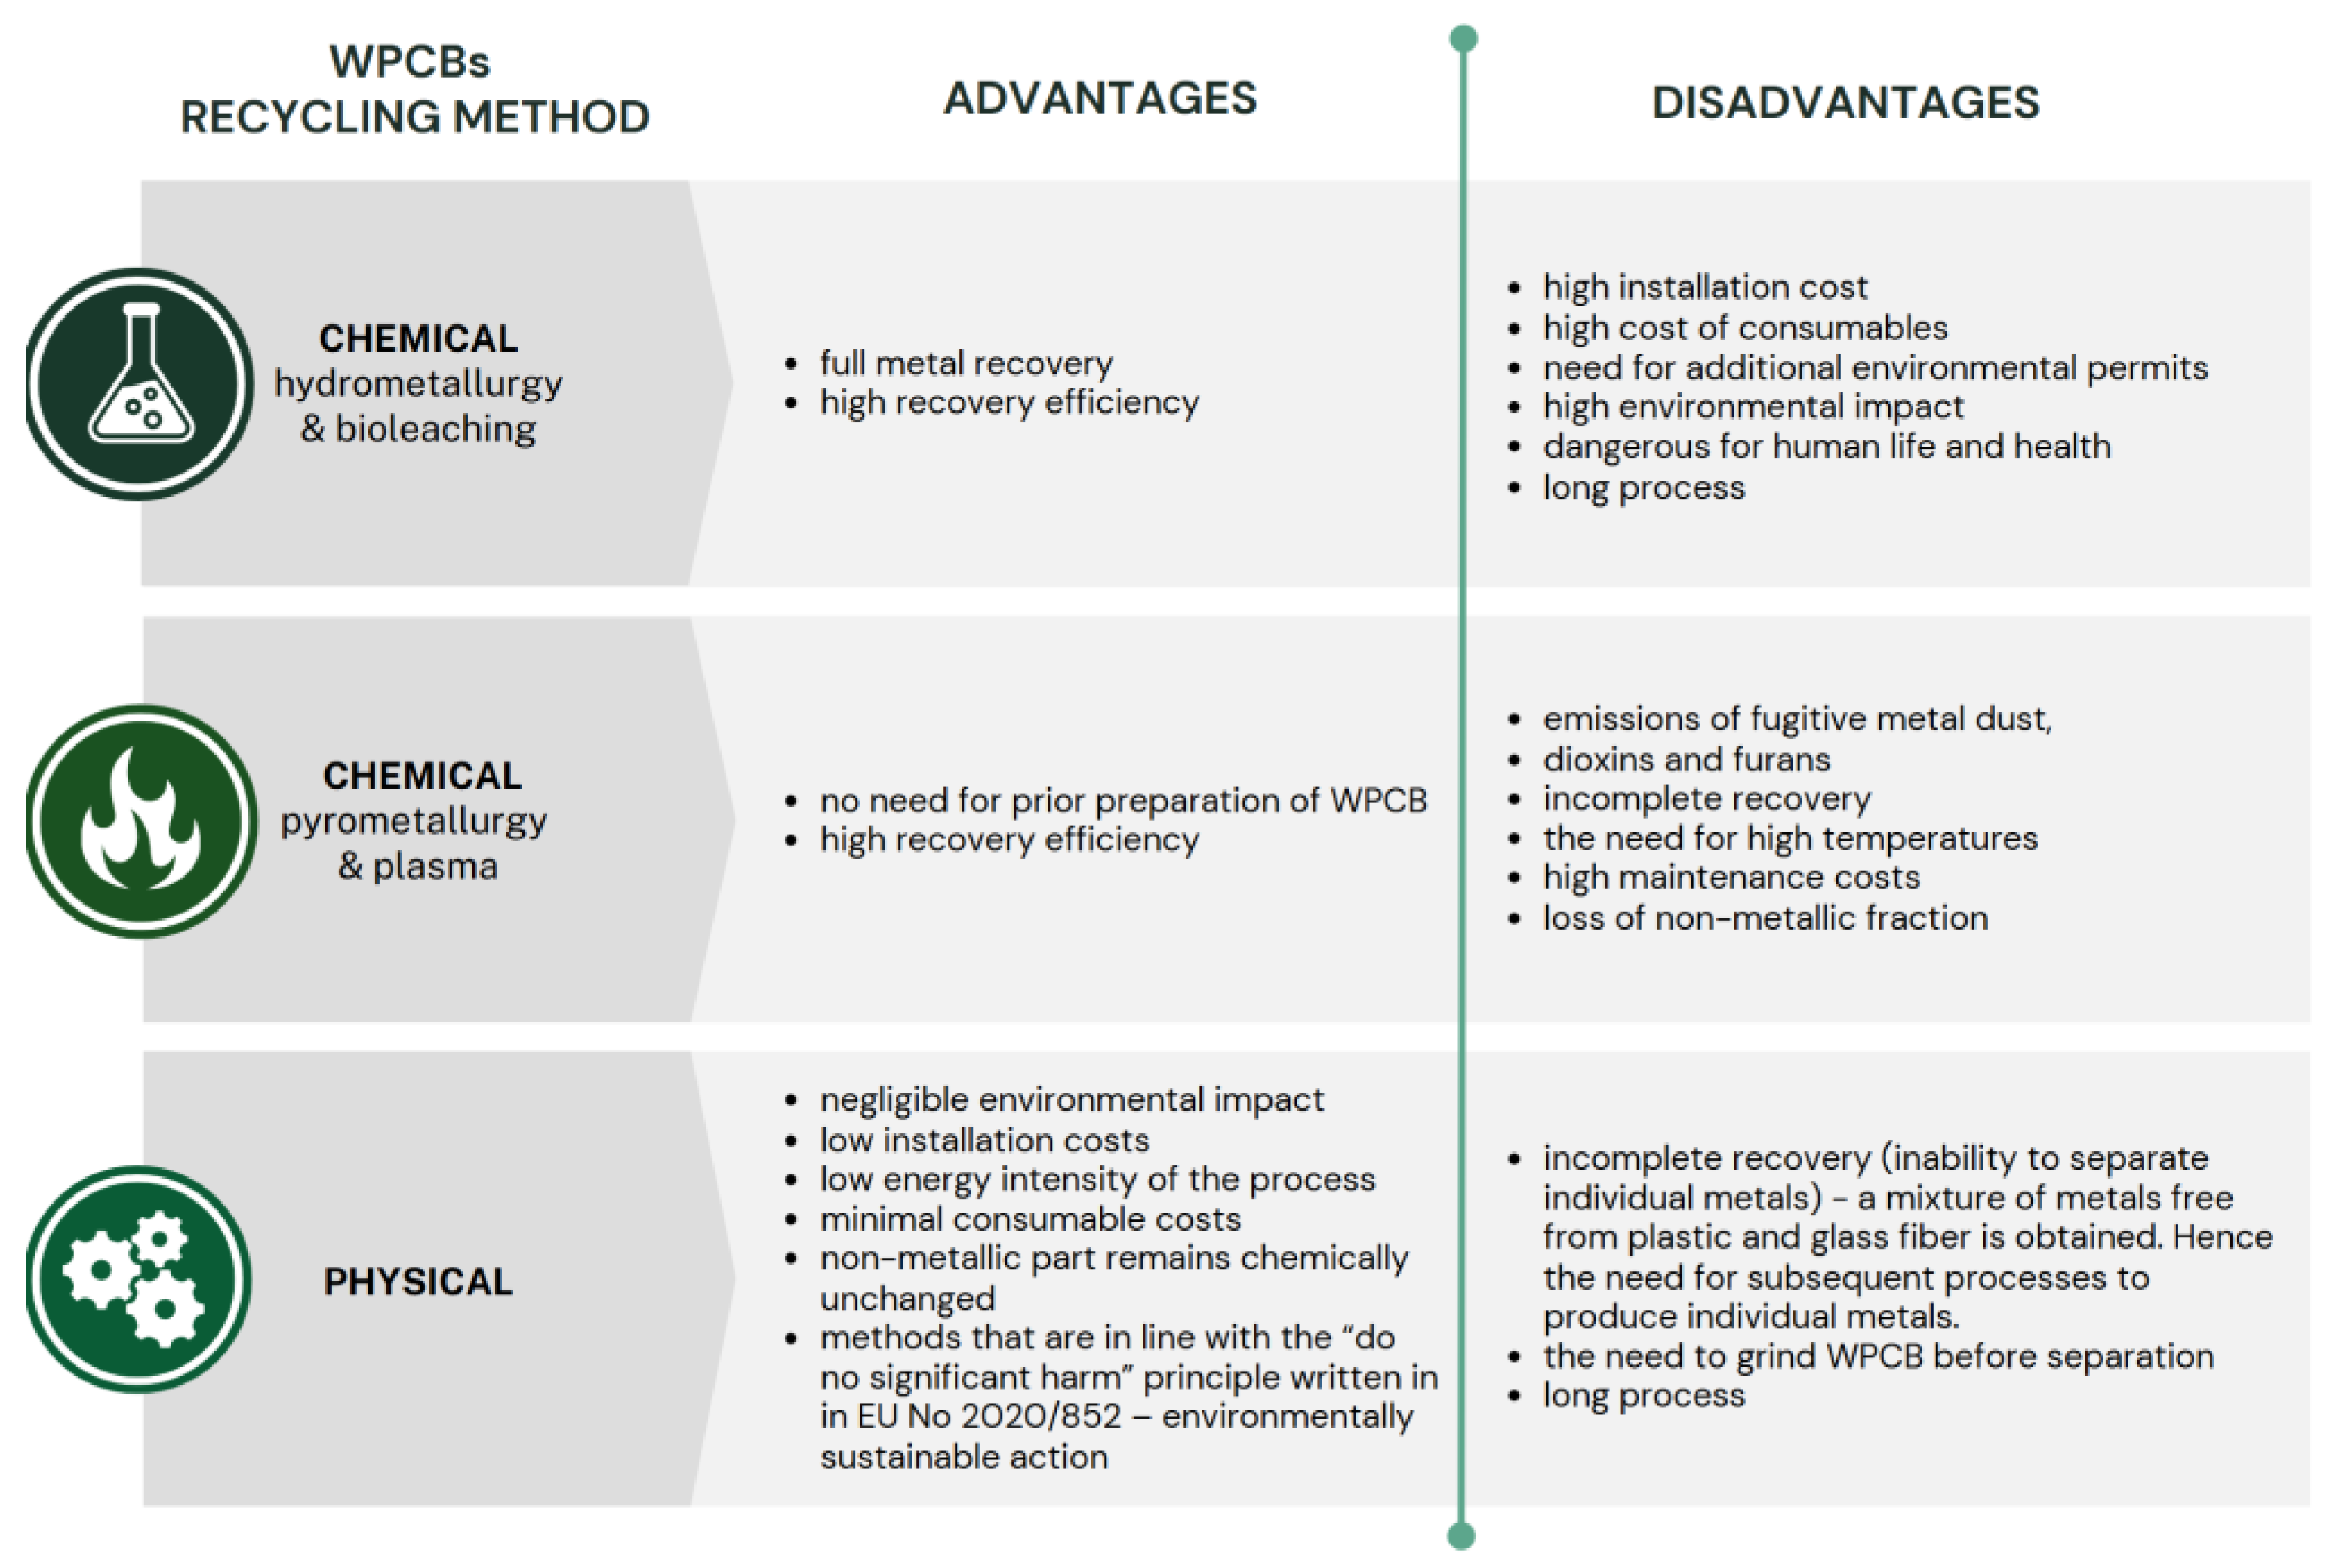
4. Discussion
5. Conclusions
Author Contributions
Funding
Institutional Review Board Statement
Informed Consent Statement
Data Availability Statement
Conflicts of Interest
Appendix 1. Life Cycle Inventory to Process 1 kg WPCB
| Stages | Energy consumption, kWh/kgWPCB | Water consumption, dm3/kgWPCB |
Liquid nitrogen consumption, dm3/kgWPCB |
Flotation reagent consumption, mg/kgWPCB |
||
| Shredding | 0.375 | |||||
| Grinding | Cooling | 1 | ||||
| Grinding | 0.880 | |||||
| Separation | Electrostatic Separator | 0.750 | ||||
| Shaking Table | Separation | 0.333 | 150 | |||
| Drying | 1.200 | |||||
| Cyclofluid Separator | Separation | 0.093 | 50 | |||
| Drying | 1.200 | |||||
| Flotation Machine | Separation | 0.552 | 30 | 3140 | ||
| Drying | 1.200 | |||||
References
- Xavier, L.H.; Giese, E.C.; Ribeiro-Duthie, A.C.; Lins, F.A.F. Sustainability and the circular economy: A theoretical approach focused on e-waste urban mining. Resour. Policy 2021, 74, 101467. [Google Scholar] [CrossRef]
- Morseletto, P. Targets for a circular economy. Resour. Conserv. Recycl. 2020, 153, 104553. [Google Scholar] [CrossRef]
- Dantas, T.E.T.; de-Souza, E.D.; Destro, I.R.; Hammes, G.; Rodriguez, C.M.T.; Soares, S.R. How the combination of Circular Economy and Industry 4.0 can contribute towards achieving the Sustainable Development Goals. Sustain. Prod. Consum. 2021, 26, 213–227. [Google Scholar] [CrossRef]
- e-waste monitor, 2024. The Global E-waste Monitor 2024. E-Waste Monit. Available online: https://ewastemonitor.info/the-global-e-waste-monitor-2024/ (accessed on 3 December 2025).
- Forti, V.; Balde, C.P.; Kuehr, R.; Bel, G. The Global E-waste Monitor 2020: Quantities, flows and the circular economy potential. 2020. [Google Scholar]
- Kaya, M. Recovery of metals and nonmetals from electronic waste by physical and chemical recycling processes. Waste Manag. 2016, 57, 64–90. [Google Scholar] [CrossRef]
- Kaya, M. Recovery of metals and nonmetals from waste printed circuit boards (PCBs) by physical recycling techniques. Energy Technol. 2017 Carbon Dioxide Manag. Technol. 2017, 433–451. [Google Scholar]
- Zhang, Y.; Liu, S.; Xie, H.; Zeng, X.; Li, J. Current status on leaching precious metals from waste printed circuit boards. Procedia Environ. Sci. 2012, 16, 560–568. [Google Scholar] [CrossRef]
- Kumar, A.; Holuszko, M.; Espinosa, D. C. R. E-waste: An overview on generation, collection, legislation and recycling practices. Resources, conservation and recycling 2017, 122, 32–42. [Google Scholar] [CrossRef]
- Muwanguzi, A.J.; Karasev, A.V.; Byaruhanga, J.K.; Jönsson, P.G. Characterization of chemical composition and microstructure of natural iron ore from Muko deposits. Int. Sch. Res. Not. 2012, 2012, 174803. [Google Scholar]
- Stec, Andrzej. Commodity quotes - Gold - Oil - Commodities [WWW Document]. Bankier.pl. 2025. Available online: https://www.bankier.pl/surowce/notowania (accessed on 29 December 2025).
- Mir, S.; Dhawan, N. A comprehensive review on the recycling of discarded printed circuit boards for resource recovery. Resour. Conserv. Recycl. 2022, 178, 106027. [Google Scholar] [CrossRef]
- Exchange, T.L.M. Home | London Metal Exchange [WWW Document]. Lme. 2024. Available online: https://www.lme.com/ (accessed on 24 October 2025).
- Royal Society of Chemistry, n.d. Periodic Table – relative supply risk [WWW Document]. Available online: https://www.rsc.org/periodic-table (accessed on 25 October 2025).
- Yaashikaa, P. R.; Priyanka, B.; Kumar, P. S.; Karishma, S.; Jeevanantham, S.; Indraganti, S. A review on recent advancements in recovery of valuable and toxic metals from e-waste using bioleaching approach. Chemosphere 2022, 287, 132230. [Google Scholar] [CrossRef]
- Ghosh, B.; Ghosh, M. K.; Parhi, P.; Mukherjee, P. S.; Mishra, B. K. Waste printed circuit boards recycling: an extensive assessment of current status. Journal of cleaner production 2015, 94, 5–19. [Google Scholar]
- Krzyzak, A.; Racinowski, D.; Szczepaniak, R.; Mucha, M.; Kosicka, E. The impact of selected atmospheric conditions on the process of abrasive wear of CFRP. Materials 2020, 13(18), 3965. [Google Scholar] [CrossRef]
- Mrówka, M.; Woźniak, A.; Prężyna, S.; Sławski, S. The influence of zinc waste filler on the tribological and mechanical properties of silicone-based composites. Polymers 2021, 13, 585. [Google Scholar] [CrossRef]
- Sławski, S.; Woźniak, A.; Bazan, P.; Mrówka, M. The mechanical and tribological properties of epoxy-based composites filled with manganese-containing waste. Materials 2022, 15(4), 1579. [Google Scholar]
- Suponik, T.; Franke, D.; Nuckowski, P. Electrostatic and magnetic separations for the recovery of metals from electronic waste. IOP Conference Series: Materials Science and Engineering, 2019; IOP Publishing; p. 012017. [Google Scholar]
- Suponik, T.; Franke, D.M.; Nuckowski, P.M.; Matusiak, P.; Kowol, D.; Tora, B. Impact of grinding of printed circuit boards on the efficiency of metal recovery by means of electrostatic separation. Minerals 2021, 11, 281. [Google Scholar] [CrossRef]
- Franke, D.; Suponik, T.; Nuckowski, P.M.; Gołombek, K.; Hyra, K. Recovery of metals from printed circuit boards by means of electrostatic separation. Manag. Syst. Prod. Eng. 2020, 28, 213–219. [Google Scholar] [CrossRef]
- Franke, D.M.; Suponik, T.; Nuckowski, P.M.; Dubaj, J. Evaluation of the efficiency of metal recovery from printed circuit boards using gravity processes. Physicochem. Probl. Miner. Process. 2021, 57, 63–77. [Google Scholar] [CrossRef]
- Błaszczyński, S.; Szpyrka, J.; Plewa, F.; Suponik, T.; Lutyński, M.; Hadrian, H.; Dietrych, N. Device for the separation of mixtures of fine-grained components in an aqueous medium - differing in density. The Patent Office of the Republic of Poland Patent No. 245480, 2024. [Google Scholar]
- Franke, D.M.; Kar, U.; Suponik, T.; Siudyga, T. Evaluation of the use of flotation for the separation of ground printed circuit boards. Gospod. Surowcami Miner.-Miner. Resour. Manag. 2022, 38. [Google Scholar]
- ISO 14040; Environmental Management-Life Cycle Assessment-Principles and Framework. International Standard Organization, 1997.
- ISO 14041; Environmental Management - Life Cycle Assessment - Goal and Scope Definition and Inventory Analysis. International Standard Organization, 1998.
- ISO 14042; Environmental Management - Life Cycle Assessment - Impact Assessment. International Standard Organization, 2000a.
- ISO 14043; Environmental Management - Life Cycle Assessment - Life Cycle Interpretation. International Standard Organization, 2000b.
- Goedkoop, M.; Oele, M.; de Schryver, A.; Vieira, M.; Hegger, S. SimaPro database manual methods library. In PRé Consult. Neth; 2008; pp. 22–25. [Google Scholar]
- Bare, J. TRACI 2.0: the tool for the reduction and assessment of chemical and other environmental impacts 2.0. Clean Technol. Environ. Policy 2011, 13, 687–696. [Google Scholar] [CrossRef]
- EN ISO 527-1:2012; Plastics—Determination of Tensile Properties—Part 1: General Principles. Polish Committee for Standardization, 2012.
- EN ISO 7619-1:2010; Rubber, Vulcanized or Thermoplastic—Determination of Indentation hardness—Part 1: Durometer Method (Shore Hardness. Polish Committee for Standardization, 2010.
- Sanapala, R. Characterization of FR-4 printed circuit board laminates before and after exposure to lead-free soldering conditions; University of Maryland: College Park, 2008. [Google Scholar]
- Hyra, K.; Nuckowski, P.M.; Willner, J.; Suponik, T.; Franke, D.; Pawlyta, M.; Matus, K.; Kwaśny, W. Morphology, Phase and Chemical Analysis of Leachate after Bioleaching Metals from Printed Circuit Boards. Materials 2022, 15, 4373. [Google Scholar] [CrossRef] [PubMed]
- Argumedo-Delira, R.; Gómez-Martínez, M.J.; Soto, B.J. Gold bioleaching from printed circuit boards of mobile phones by Aspergillus niger in a culture without agitation and with glucose as a carbon source. Metals 2019, 9, 521. [Google Scholar] [CrossRef]
- Hołda, A.; Krawczykowska, A. Extraction of selected metals from waste printed circuit boards by bioleaching acidophilic bacteria. Inż. Miner. 2021, 1, 43–52. [Google Scholar] [CrossRef]
- Wu, J.; Li, J.; Xu, Z. Electrostatic separation for recovering metals and nonmetals from waste printed circuit board: problems and improvements. Environ. Sci. Technol. 2008, 42, 5272–5276. [Google Scholar] [CrossRef]
- Wu, J.; Qin, Y.; Zhou, Q.; Xu, Z. Impact of nonconductive powder on electrostatic separation for recycling crushed waste printed circuit board. J. Hazard. Mater. 2009, 164, 1352–1358. [Google Scholar] [CrossRef]
- Kar, U.; Nili, S.; Mends, E.; Vahidi, E.; Chu, P. A review and environmental impact analysis on the current state of froth flotation on recycling of e-wastes. Resour. Conserv. Recycl. 2025, 212, 107967. [Google Scholar] [CrossRef]
- Rezaee, M.; Saneie, R.; Mohammadzadeh, A.; Abdollahi, H.; Kordloo, M.; Rezaee, A.; Vahidi, E. Eco-friendly recovery of base and precious metals from waste printed circuit boards by step-wise glycine leaching: process optimization, kinetics modeling, and comparative life cycle assessment. J. Clean. Prod. 2023, 389, 136016. [Google Scholar] [CrossRef]
- Kaya, M. Electronic waste and printed circuit board recycling technologies. 2019. [Google Scholar] [CrossRef]
- Kozłowski, J.; Mikłasz, W.; Lewandowski, D.; Czyżyk, H. Research on hazardous waste-management part I. Arch. Waste Manag. Environ. Prot. 2013, 15, 69–76. [Google Scholar]
- Khaliq, A.; Rhamdhani, M. A.; Brooks, G.; Masood, S. Metal extraction processes for electronic waste and existing industrial routes: a review and Australian perspective. Resources 2014, 3(1), 152–179. [Google Scholar] [CrossRef]
- Otsuki, A.; Pereira Gonçalves, P.; Leroy, E. Selective milling and elemental assay of printed circuit board particles for their recycling purpose. Metals 2019, 9, 899. [Google Scholar] [CrossRef]
- Verma, H.R.; Singh, K.K.; Basha, S.M. Effect of milling parameters on the concentration of copper content of hammer-milled waste PCBs: a case study. J. Sustain. Metall. 2018, 4, 187–193. [Google Scholar]
- Ma, E. Recovery of waste printed circuit boards through pyrometallurgy. In Electronic waste management and treatment technology; 2019; pp. 247–267. [Google Scholar]
- Maurice, A.A.; Dinh, K.N.; Charpentier, N.M.; Brambilla, A.; Gabriel, J.-C.P. Dismantling of printed circuit boards enabling electronic components sorting and their subsequent treatment open improved elemental sustainability opportunities. Sustainability 2021, 13, 10357. [Google Scholar] [CrossRef]

| Input | Unit price, USD | Consumption / Price, USD | ||
| Shredding | Cryogenic grinding | Electr. separat. | ||
| Electricity (Sas, 2025), kWh | 0.012 | 0.005 | 0.011 | 0.009 |
| Liquid nitrogen, litres | 0.59 | 0.59 | ||
| Consumable costs | 0.491 | 1.022 | <0.0013 | |
| Price excl. consumables costs, USD | 0.005 | 0.601 | 0.009 | |
| Total price, USD | 0.495 | 1.621 | 0.009 | |
Disclaimer/Publisher’s Note: The statements, opinions and data contained in all publications are solely those of the individual author(s) and contributor(s) and not of MDPI and/or the editor(s). MDPI and/or the editor(s) disclaim responsibility for any injury to people or property resulting from any ideas, methods, instructions or products referred to in the content. |
© 2026 by the authors. Licensee MDPI, Basel, Switzerland. This article is an open access article distributed under the terms and conditions of the Creative Commons Attribution (CC BY) license (http://creativecommons.org/licenses/by/4.0/).


