Submitted:
03 January 2026
Posted:
05 January 2026
You are already at the latest version
Abstract
Background: Breast cancer is one of the leading causes of female mortality, especially if diagnosed in late stages. While mammography is the cornerstone of screening, its diagnostic accuracy is limited by tumor heterogeneity and subjective interpretation. Objective: Herein, we explored the potential of radiomics and machine learning to improve the diagnostic accuracy of mammograms and personalise patient management in breast cancer. Methods: We manually segmented tumours and lymph nodes to analyse mammograms of the open-source INbreast dataset, which comprised multiple cases of benign and malignant breast masses with and without lymphadenopathy. Ra- diomics features (morphological, texture, wavelet) were extracted using PyRadiomics. Stratified sampling ensured balanced class representation. Then, we trained ML classifiers (XGBoost, CatBoost, LightGBM, etc.) to detect malignancy from the extracted radiomical features. Random Forest classifier was used to prognosticate the molecular subtype of the tumour from radiomical findings. Results: Significant radiomic differences were observed between benign and malignant lesions. Combining features of breast mass and lymph node yielded the highest classification accuracy (up to 99%) in detecting malignancy. The Random Forest model achieved 90.8% accuracy in identifying Luminal A molecular subtypes, with first-order and shape-based features contributing most to model perfor- mance. Conclusion: Radiomics-based ML models significantly improve diagnostic accuracy and enable non-invasive prediction of breast cancer subtypes. This approach supports precision oncology by enhancing screening efficiency and informing personalized treatment strategies.
Keywords:
breast cancer
; radiomics
; screening
; molecular biomarkers
; molecular subtypes
; machine learning
; classification model
; risk stratification
; precision medicine
1. Introduction
According to the WHO statistics for the 2022 year, breast cancer (BC) accounts for around 670,000 deaths worldwide, and it is the most common cancer type in females in the majority of countries [1]. Despite the availability of surgery, radiotherapy, and systemic treatment, a small delay of four weeks can dramatically increase the percentage of adverse outcomes [2]. The five-year survival rate is 100% in women diagnosed with the first stage of the disease, 90% in those with the second stage, over 70% in the third stage, and more than 25% in the fourth stage [3]. Well-arranged screening is a way to decrease mortality markedly [4].
Over the past two decades, the advancement of diagnostics decreased the proportion of patients diagnosed with late-stage BC [5]. Investigators have applied various diagnostic approaches to BC detection. Those include radiologic examinations, microwave imaging, molecular biomarkers, Raman spectroscopy, biopsy, and other methods [6,7,8,9,10,11]. Most of these are invasive, which limits their utility in screening for cancer. Therefore, few radiologic techniques and molecular markers fall under the category of screening tools.
Radiology plays a pivotal role in the early diagnostics and management of BC cases. It encompasses a broad spectrum of methods for early cancer detection: mammography, ultrasound, MRI, CT, and PET [6]. In contemporary clinical settings, the early invasive diagnostics of BC relies on radiological evaluation. Mammography, ultrasound examination and contrast-enhanced magnetic resonance imaging are essential methods for identifying breast lesions and biopsying them.
For years, various breast cancer screening programs have been introduced into practice in the national healthcare systems of different countries [12]. Despite some improvement, the programs’ potential to reduce women’s mortality is not exhausted: the widespread screening coverage can lower the death rate substantially [13]. A systematic review covered 23 guidelines on breast cancer screening, and it concluded that all the guidelines recommend mammography (MAM) as the primary screening modality. The attitude to clinical breast examination varied among the guidelines that either did not suggest it for screening or recommended the examination every 1-2 or 2-3 years [12]. National Cancer Center of China approved ultrasound screening every 1-2 years for women over 45 years of age [14]. Still, MAM is the modality of choice for BC screening in most countries.
If not supplemented by pathological confirmation, the imaging techniques are non-reliable due to suboptimal accuracy. Besides, the turnaround time for test results is long [15]. Finally, the heterogeneity of BC appearance is high, and radiologists can miss imaging features with valuable prognostic and predictive information [15,16]. These facts evidence the necessity of AI-based computer-aided decision tools for improved screening and patient management [17]. An artificial intelligence (AI) system can triage normal MAM examinations with a low level of uncertainty about the diagnosis. Then, the high-uncertainty cases are referred to the radiologist. In contrast to a stand-alone system, this decision-referral approach surpasses the radiologist in diagnostic accuracy and reduces the physician’s workload [18]. However, it remains unclear if all the cases should be apprised by radiologists with the support of AI or not.
Recently, researchers conducted a systematic review of the literature on the use of AI for image analysis in breast cancer screening programs [19]. The focus of the study was the diagnostic accuracy of AI algorithms alone or in combination with radiologists. The diagnostic modality was digital MAM. The ground through was the biopsy for screen-positive cases and the follow-up for screen-negative ones. The review concluded that AI systems are not enough accurate to substitute radiologist double reading in BC screening. The authors struggled to specify the clinical pathway which may benefit from AI. This information motivated us to formulate the concept of the current study: the constructed AI system should quantify the risk of malignancy in a breast part that looks suspicious to the radiologist. This system architecture assures the safety of diagnostics since all the cases go through the radiologists. It also provides physicians with additional information based on statistics for benign and malignant cases encapsulated in machine learning (ML) classification algorithms.
Molecular biomarkers (MBMs) may characterize disease phenotype, which determines the growth rate of BC, hormone-sensitivity of the tumour, and response to therapy [20]. Biomarker reconnaissance is an attempt to personalise disease management by dealing with BC heterogeneity effectively. With MBMs, physicians can define molecular subtypes of BC to prognosticate the disease course and improve cancer management by finding the optimal treatment for each specific case [21]. Still, the utility of MBMs is not limited to the detection of phenotype: they can be applied in numerous clinical contexts. In particular, MBMs can serve as screening tools for detecting latent primitive cancers and distinguishing benign from malignant cases [21]. Besides, they prognosticate disease course, predict the efficiency of specific therapeutic interventions, and monitor disease progression, i.e., relapse or advancement and response to treatment [11].
A common molecular classification of breast cancer is based on the presence of hormone receptors at the surface of cancer cells. Other classifications take into account genetic and epigenetic biomarkers, MBMs related to cell proliferation [9]. Although the information on the molecular subtype primarily serves the need for optimal case management, it can also serve diagnostics purposes [22]. A study showed that female patients with luminal A subtype of BC show the highest 5-year survival rate of 94.4%. They are followed by the women with luminal B and human epidermal growth factor (HER2) subtypes: the survival rate of 90.7% and 84.8%, respectively [23]. If MBMs reflecting tumour phenotype are strongly associated with radiomical findings, the radiomics can also contribute to personalized cancer management.
2. Objectives
The aim of this study was to improve diagnostic accuracy of mammograms and personalize patient management in breast cancer by applying radiomics and machine learning.
Hypothetically, radiomical features of breast tumors can reliably reflect lesion malignancy and molecular subtype. The latter serves as diagnostic and prognostic oncomarker suggesting the growth rate, targeted therapy and other clinically useful information on the tumor. If the hypothesis is true, the radiological features can aid in classifying breast lesions into benign and malignant, slowly and rapidly progressing, thus supporting case management.
To test the hypothesis, we focused on the following objectives:
- Extract radiomics data describing breast lesions and lymphatic nodes in mammograms; compute the descriptive statistics for the masses and nodes in benign and malignant cases.
- Explore associations between radiomics of masses and lymph nodes in patients with benign breast tumours and cancer.
- Build diagnostic models distinguishing benign and malignant cases; assess the predictive value of radiomics data retrieved from masses and lymph modes.
- Construct models predicting the molecular subtypes of BC.
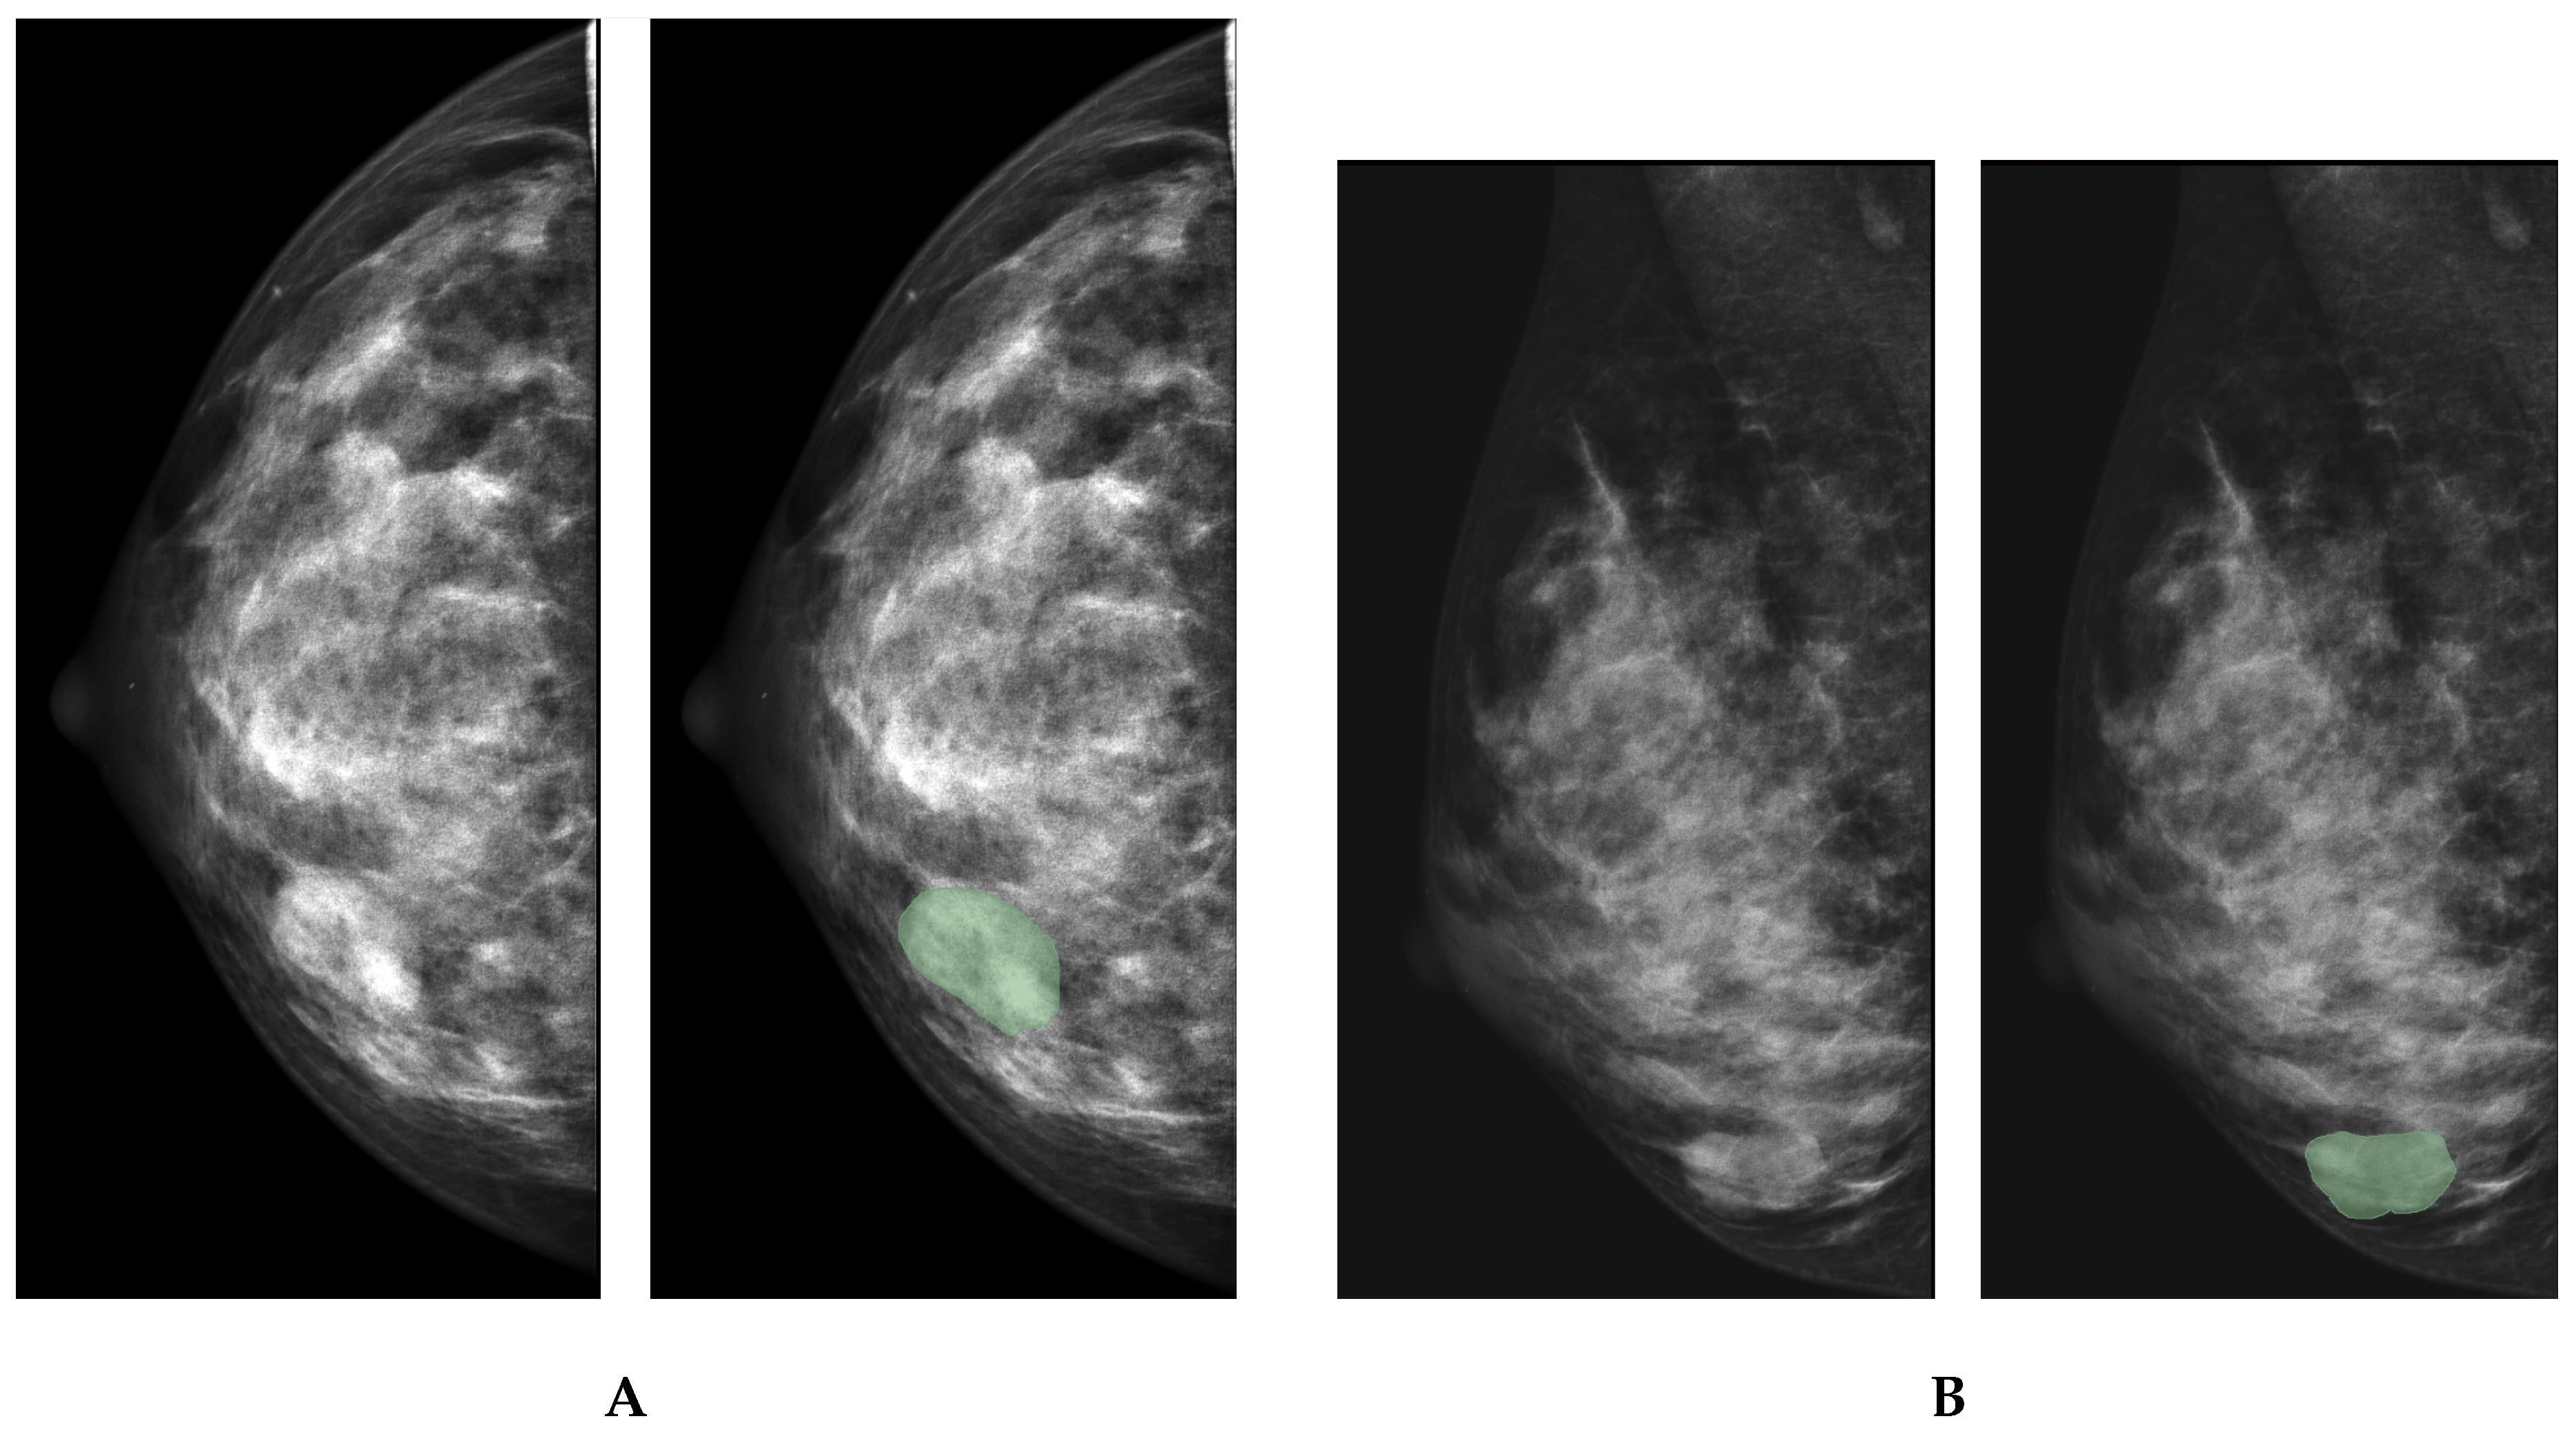
Figure 1.
Manual segmentation of mammary lumps A and lymph nodes B
3. Materials and Methods
3.1. Study Cohort
For the study, we used an open-source Inbreast dataset [24]. The manual segmentation of craniocaudal (CC) and mediolateral oblique (MLO) views of MAMs provided us with segmentation masks for 418 benign and 1243 malignant cases (see Table 1). At this stage of data analysis, each segmentation mask was treated as an individual case. The delineation of the borders for the axillary and sentinel lymph nodes (LNs) was performed in MLO MAMs. This resulted in 88 and 308 segmentation masks for benign and malignant lymphadenopathy, respectively. The radiomical features were extracted, and then the datasets were fused. For this, the radiomical data on LNs were merged with the features of the breast mass extracted from the MLO view of the mammogram of the same patient. If the tumour was visible in the CC view of MAM, we combined the radiomical features that describe the nodes and masses in the CC view to append the findings to the data set.
Each view of the MAM was treated as a separate case, which increased the size of the study cohort. In the MAMs with visible breast masses, we also tried to identify and delineate lymph nodes. A total of 88 lymph nodes were visible in benign cases, and 308 nodes were identified in malignant cases. To merge the mass and node datasets, we took data on each node and added information on the mass detected in the correspondent case. This approach resulted in 156 benign and 561 malignant cases.
3.2. Data Preprocessing
To start with, we removed the features that specified study cases from the analysis. Those were ’name’, ’subtype’, ’idx’, and ’Label’. The target variables (‘classification’ and ’subtype’) were encoded with LabelEncoder from the scikit-learn library which converted categories to numbers. The data were split into training (67%) and testing (33%) sets using stratified sampling to maintain class distribution.
Regions of interest (ROIs) were marked independently by two radiologists. An expert in breast imaging compared manual segmentations from the two specialists and selected the most accurate masks of breast masses and LNs for each mammogram.
The bioengineer usec Pyradiomics package to extract radiomical features within the boundaries [25]. The extracted features can be classified into the following groups [26]. The first group characterises a two-dimensional size and shape. The second group is first-order statistical features reflecting the distribution of the voxel intensity across the ROI. The third group is the texture features describing the spatial distribution of the pattern or voxel intensity calculated by the grey-level co-occurrence matrix (GLCM) and grey-level run-length matrix (GLRLM). The fourth group includes wavelet features, wavelet decompositions of first-order statistical features and texture features [27].
The study dataset consisted of radiomics for breast masses and LNs. We retained outliers in the dataset, as they can represent patients with uncommon phenotypes of BC or unique forms of the disease. Removing outliers may diminish the model’s ability to generalise across the entire spectrum of cases.
3.3. Study Methodology
Working on the first task, a qualified radiologist delineated visible breast masses in the parenchyma of the mammary glands, providing us with 323 segmentation masks for benign lesions and 723 masks for malignant ones. In the same manner, the radiologist obtained 351 LN masks for benign cases and 958 node masks for cancer cases. Third, a data engineer extracted radiomics from ROIs with Pyradiomics package and calculated descriptive statistics.
The Shapiro-Wilk test was employed to assess all deviations from normality. To compare radiomical features of benign and malignant cases, the Wilcoxon signed-rank test was applied to data with an asymmetric distribution around the mean. The same test was utilised to compare radiological data extracted from different ROIs: breast masses and LNs. The Paired Samples t-test was conducted on the normally distributed data.
To perform the second task, we assessed the association of radiomic features derived from different ROIs: masses and LNs. This approach allowed us to determine whether the correlation between radiomics in breast masses and LNs is tighter in malignant cases compared to benign ones. If so, the radiomics data for both ROI types was regarded as potential predictors for the next task. We examined correlations among normally distributed variables using the Pearson coefficient. For other variables, we employed Spearman correlation.
To complete the third task, we resorted to machine learning. We employed the following binary classification boosting models: CatBoost, XGBoost, and Decision Tree. The primary performance metrics included sensitivity (Sn), specificity (Sp), accuracy (Acc), and the area under the curve in the receiver-operating characteristics diagram (AUC ROC). To enhance model performance, we optimised hyperparameters as follows: the ’objective’ hyperparameter was set to ’binary’, the ’metric’ hyperparameter was designated as ’f1’, the ’boosting_type’ was equal to ’gbdt’, the ’num_leaves’ hyperparameter was assigned a value of 31, the ’learning_rate’ ranged from 0.01 to 0.5, and the ’feature_fraction’ varied from 0.7 to 0.9.
To accomplish the fourth task, we utilized a dataset comprising lesion data and corresponding molecular subtype labels for training and evaluation. Random Forest model was employed for classification tasks.
To optimise hyperparameters, we applied a Bayesian optimisation approach. The following hyperparameters wwere used: the number of estimators, learning rate, maximum tree depth, number of leaves, minimum child samples, subsample ratio, column sampling ratio, L1 and L2 regularisation terms. The model performance was assessed at the time of training in a five-fold stratified cross-validation technique. To improve model performance by reducing information noise, we used the top 30 features according to ANOVA F-value. Specifically, we will applied the SelectKBest function with the f_classif parameter. In the optimisation, the weighted F1-score was the primary metric for selecting the model.
4. Results
4.1. Quantitative Characteristics of Mammogram Images
A total of 199 radiomics features were extracted from mammogram images (see Table 2) comprising 18 first-order statistics, 12 two- and three-dimensional shape descriptors, 24 GLCM features, 16 GLDM features, 16 GLRLM features, 16 GLSZM features, and 5 NGTDM features. The dataset also included characteristics of the original diagnostic images and their corresponding masks.
Significant differences were observed in 15 first-order features between benign and malignant breast masses, with most values being higher in malignant cases. Notably, skewness (-0.16±0.52 vs. -0.07±0.49) was significantly lower in malignant tumors (p < 0.001). Among LN images, 16 radiomics descriptors exhibited significant differences, with most being elevated in metastatic LNs, except for skewness, which was higher in non-cancerous LN changes.
Eleven GLCM features demonstrated pronounced differences between benign and malignant breast lesions. Autocorrelation, cluster prominence, cluster tendency, correlation, imc2, sum average, sum entropy, and sum squares were significantly higher in malignant tumors (p < 0.001). Conversely, the remaining features were elevated in benign cases. In LN images, metastatic cases exhibited higher values for autocorrelation, cluster prominence, cluster tendency, correlation, imc2, joint entropy, maximal correlation coefficient (MCC), sum average, sum entropy, and sum squares, whereas benign cases showed higher imc1, joint energy, and maximum feature values.
In breast masses, malignant lesions exhibited significantly higher values for dependence entropy, gray-level variance, high gray-level emphasis, large dependence high gray-level emphasis, and small dependence high gray-level emphasis in the GLDM features. Conversely, dependence non-uniformity normalized, large dependence high gray-level emphasis, and low gray-level emphasis were lower in malignant cases. Metastatic LN images displayed higher values for most GLDM features, except for large dependence and low gray-level emphasis, which were reduced in metastases.
Eight GLRLM features differed significantly between benign and malignant breast lesions. Malignant cases showed higher gray-level variance, high gray-level run emphasis, long-run high gray-level emphasis, run entropy, and short-run high gray-level emphasis, whereas gray-level non-uniformity normalized, long-run low gray-level emphasis, low gray-level run emphasis, and short-run low gray-level emphasis were lower. Similar trends were observed in LN images, with two exceptions: high gray-level run emphasis was lower in malignant cases, and run-length non-uniformity exhibited a statistical difference not seen in breast masses.
Among GLSZM features, size zone non-uniformity normalised was lower in malignant cases, reflecting more homogeneous zone sizes, while zone entropy was higher in malignant lesions, indicating greater heterogeneity in breast masses. Other significantly different features included gray-level non-uniformity normalized, gray-level variance, high gray-level zone emphasis, size zone uniformity normalized, small area emphasis, small area high gray-level emphasis, and small area low gray-level emphasis. In LN images, significant differences were observed in gray-level non-uniformity, gray-level variance, high gray-level zone emphasis, large area high gray-level emphasis, low gray-level zone emphasis, size zone non-uniformity, small area high/low gray-level emphasis, and zone entropy.
A single NGTDM descriptor differed significantly between benign and malignant masses, suggesting greater non-uniformity and rapid gray-level intensity fluctuations in malignant cases. This value was also higher in metastatic LNs compared to benign lymphadenopathy (12.91 ± 6.18 vs. 11.01 ± 5.84, p = 0.01).
Nearly all original shape-based features differed significantly between benign and malignant breast masses. In LN images, disparities were observed in sphericity, surface area, surface-volume ratio, and voxel volume. Malignant cases exhibited lower sphericity values in both masses and LNs, indicating less spherical tumor morphology compared to benign lesions.
Significant differences in radiomics feature values were observed across all groups of descriptors. LN images exhibited a greater number of discriminative features between benign and malignant cases compared to breast parenchyma scans. Additionally, discrepancies were noted between benign breast lesions and LNs, as well as between malignant breast and LN features.
4.2. Performance of Binary Classification Models
4.2.1. Feature Importance in Detecting Malignancy
We identified the most informative radiomics features contributing to the classification of tumours from images of masses, LNs and their combination (see Figure 2). Among the radiomics descriptors of the masses, the highest-ranking feature was original_firstorder_Maximum, indicating that the maximum intensity value within a lesion is a significant predictor of malignancy. Original first-order Root Mean Squre and 90Th percentile further highlighted the importance of intensity-based measurements. Shape descriptors also were prominent features in the classification models reflecting the importance of lesion morphology in mass differentiation. In particular, surface volume ratio was among top-five radiomics features contributing to the model performance. Textual features had a lower importance but these radiomics descriptors underscored the significance of heterogeneity and spatial intensity distribution in predictive modelling.
Among features extracted from LN images, the most important feature was original_firstorder_Skewness, suggesting that the asymmetry in intensity value distribution is a key factor in malignancy prediction from LN radiomics. Additional first-order statistics, including diagnostics_Image.original_Maximum, emphasized the importance of intensity characteristics. A high informative value of several shape-based features highlighted the morphological aspects of lymph node classification. Textual radiomics descriptors had a less prominent information gain value. Still, their inclusion suggested that heterogeneity in grey-level distribution played a crucial role in detecting malignancy. The combination of statistical intensity descriptors, shape-based metrics, and texture-related attributes indicated a complex interplay between radiomic features in distinguishing benign from malignant LNs.
When LN and mass features were combined, the most influential feature was the original first-order_maximum feature retrieved from images of breast masses. This attribute was followed by the original first-order root mean squared and 90th percentile describing breast lesions. Top informative descriptors attributing to LNs included diagnostics_mask.original_BoundingBox_i and original shape_SurfaceArea. The findings suggested that intensity distribution characteristics played a more significant role in differentiating between benign and malignant tumors than texture-based features extracted from both masses and LN images.
The results highlighted the significant differences in predictive importance between radiomics extracted from masses, LNs, and their combination. The findings imply the necessity of tailored classification models that incorporate domain-specific radiomic characteristics for accurate malignancy differentiation.
4.2.2. Prediction of Cancerous Tumours and Metastases from Radiomics Features
In the training dataset, all models demonstrated a strong performance in detecting malignancy (see Table 3. When the classifiers were trained on radiomics of the masses, the Decision Tree achieved the highest sensitivity but had the lowest specificity (0.865) and accuracy (0.940). The XGBoost Classifier exhibited the highest specificity (1.000) and accuracy (0.968). When the algorithms were fed with features describing LN images, sensitivity ranged from 0.941 to 1.000. The Decision Tree Classifier had the highest sensitivity (1.000) and accuracy (0.971). Similarly, the same classifier achieved the sensitivity of 1.000 when it was trained on a combination of radiomic predictors. The combined model improved mean accuracy to 0.970 ± 0.007 and yielded more balanced sensitivity and specificity values compared to models trained on a single set of features.
In the validation dataset, classification performance remained high across all models. When the models were trained on radiomics of breast mass images, the XGBoost and Decision Tree Classifiers exhibited sensitivity close to 1.000, although their specificity slightly decreased compared to the training dataset. The mean accuracy across classifiers was higher than in the training phase, at 0.971 ± 0.015. The XGBoost and Decision Tree Classifiers displayed the highest sensitivity in detecting cancerous tumours when provided with radiomics extracted from the LN images. The accuracy of both models also surpassed that of the CatBoost Classifier, reporting 0.992 versus 0.958. When the predictors were utilised in combination, the ecision Tree proved to be the most sensitive (0.997) and accurate (0.990) classifier. The mean accuracy across the classifiers improved when the algorithms were trained on the combination of radiomic findings. AUC ROC also demonstrated a high performance of all the tree classifiers (0.99) when radiomics features of breast masses were used as predictors. The accuracy improved when LN radiomics and the combination of findings were used to construct the models (See Figure 3).
4.3. Identification of Molecular Subtypes from Radiomics Features
4.3.1. Top Informative Features in Distinguishing Between Molecular Subtypes
We identified the top 30 features in each dataset of radiomic descriptors of images of breast masses and LNs (see Figure 4). Among features derived from MAMs of breast masses, original_glszm_SmallAreaEmphasis emerged as the most critical feature, emphasizing the contribution of localized intensity variations in the classification of tumours in their molecular subtypes. Additional significant predictors included original_shape_SurfaceVolumeRatio, diagnostics_Mask.original_CenterOfMass_x, original _glszm_SizeZoneNonUniformityNormalized, and diagnostics_MAsk.original_CenterofMassIndex_x. The findings suggest that shape irregularity, spacial location and contrast-based textual patterns were the most important features characterizing a specific molecular type of cancer.
When we ranked features describing LN images, original_gldm_SmallDependence Low Gray Level Emphasis exhibited the highest importance. This is a texture-based metric describing how small clusters of similar pixels with low intensity appear in a tumour or lesion. Intensity, localization and texture features had the highest importance in models distinguishing between tumour subtypes from radiomics describing LN images.
In the combined dataset, the features describing images of masses had predominately higher importance than features of LN images. In particular, original_firstorder_maximum was ranked as the highest contributor to the model. This feature indicates the brightest pixel value inside the tumour or lesion in a medical image. Other highly informative first-order features included original_firstorder_10Percentile, original_firstorder_Median, original_firstorder_Mean, and original_shape_MajorAxis. First-order radiomics descriptors specify the pixel intensity at different locations of the tumour. The original_shape_MajorAxis feature describes the size and shape of the tumour. The findings imply the greater contribution features of mass images than LN ones in detecting molecular subtypes. Across all three models, first-order statistical, texture-based, and shape-derived radiomic features consistently ranked as the most important predictors.
4.3.2. Performance of ML Models in Identification of Molecular Subtype of BC
At the training stage, the Random Forest Classifier achieved moderate accuracy of 0.780 in classifying tumours according to their molecular subtypes. The model identified a specific molecular subtype with the precision and recall of 0.821. The findings suggest that the classifer effectively learned patterns within the radiomics data on histological variants of BC but retained some some margin for improvement in classification of cancer subtypes. On the validation dataset, the model demonstrated significantly improved performance, with precision and recall increasing to 0.940 and accuracy reaching 0.908. This suggests that the model generalizes well to unseen data and can reliably classify molecular subtypes based on radiomics features.
We have also examined the efficiency of the Random Forest Classifier in discriminating a specific molecular subtype against all other variants of BC (see Table 4). In the training dataset, the model demonstrated high sensitivity across most subtypes, particularly for LABC (0.908) and HER2 (0.948). However, specificity remained low, particularly for HER2 (0.267) and LABC (0.433), suggesting a high number of false positives. TNBC classification posed a challenge and resulted in low sensitivity (0.577), specificity (0.672), and accuracy (0.628).
Performance improved significantly in the validation dataset. Sensitivity exceeded 0.90 across all subtypes and specificity reached 1.000 for LABC and HER2. TNBC classification improved, with higher sensitivity (0.944) and specificity (0.800), suggesting better generalizability. The model performance did not improve considerably in detecting LBBC: sensitivity, specificity and accuracy were 0.935, 0.571 and 0.868 respectively. The overall high accuracy in validation suggests that radiomical models can effectively differentiate BC subtypes, though refinements may still be needed to improve specificity for LBBC.
When the model’s performance was evaluated using AUC-ROC, the Random Forest classifier exhibited the highest effectiveness in detecting LBBC, achieving an AUC-ROC of 0.83. The classification of LABC yielded a slightly lower AUC-ROC of 0.82. The model demonstrated the least discriminative power in identifying the HER2+ and TNBC subtypes, with AUC-ROC scores of 0.72 and 0.77, respectively.
5. Discussion
In biomedical research, computer-aided systems have demonstrated promising potential in enhancing the diagnostic accuracy of various imaging modalities for cancer detection (see Table 6). ML algorithms can autonomously segment lesions and differentiate between benign and malignant cases [28]. Before the advent of radiomics, models were trained on raw images obtained directly from imaging devices [29]. These algorithms achieved notable accuracy in cancer detection, ranging from 64.40% to 97.97% [28,30]. The introduction of radiomics has further enhanced the diagnostic and predictive capabilities of these models.
5.1. Radimoic Approach to Distinguishing Between Malignant and Benign Lesions
The current study revealed statistically significant differences in the quantitative characteristics of shape, texture, intensity, and heterogeneity between benign and malignant cases, as well as between breast tumours and LN metastases. These findings support the idea that radiomics can uncover unique imaging characteristics that might otherwise go unnoticed. Thus, the radiomic approach to image characterization serves as an invaluable tool for radiologists, helping them refine their clinical skills and streamline routine tasks [31]. By leveraging this approach, bioengineers can develop computer-aided decision support tools that improve the accuracy of mammography using top-performing ML models. To achieve this, radiomics quantitatively characterize breast lesions by extracting features that provide valuable insights for decision-support models [15]. Moreover, ML can be integrated at various stages of the radiomics workflow, including image acquisition, region of interest segmentation, feature extraction, feature selection, and model development. This flexibility allows AI-driven tools to be tailored to specific study objectives and hypotheses.
Radiomic features extracted from medical images form radiomic signatures that characterize diverse clinical phenotypes [32]. Pathophysiologic variations among disease phenotypes contribute to heterogeneity in radiomic data [33]. As a pattern recognition technique, radiomics identifies recurring numerical, geometric, and voxel intensity patterns to support diagnostic decision-making, particularly in distinguishing malignant from benign tissues [34]. All features belong to four major categories: shape, texture, first-order statistics, and higher-order statistics [15].
Shape features quantify tumour geometry, including volume, maximum diameter, surface area, compactness, and sphericity. Tumours with spiculated margins exhibit a higher surface-to-volume ratio than those with a round morphology [35]. Shape-based analysis provides insights into tumour aggressiveness [36], yet its inclusion in radiomic signatures varies across studies [37]. While some models assign greater weight to shape descriptors than texture-based features [38], their stability generally surpasses that of texture metrics [39,40].
Texture analysis quantitatively evaluates tumor heterogeneity by assessing the spatial distribution of gray-level intensities, thereby capturing image patterns that are imperceptible to the human eye [41]. This method provides insights into image coarseness, irregularity, and smoothness. A study by Tang et al. identified significant differences in 14 texture features between MRI scans of normal and malignant breast tissues [42]. Moreover, texture patterns within peritumoral regions have demonstrated clinical relevance, underscoring the role of the tumor microenvironment in MRI-based analysis [43,44].
First-order statistical features describe the intensity histogram of mammographic voxels, providing quantitative metrics that extend beyond human visual perception. These features have shown potential associations with cancer incidence [45] and are effective in differentiating BIRADS density groups [45]. Moreover, single and multiparametric entropy values significantly vary between benign and malignant breast tumors, offering additional diagnostic utility [46].
Higher-order statistical features represent another category of textural descriptors. Unlike direct image analysis, these features assess spatial relationships between multiple pixels or voxels through matrix-based transformations [47]. Such approaches enhance breast lesion characterization and facilitate the assessment of treatment response [48]. However, their applicability in breast cancer research is influenced by imaging constraints and voxel count requirements, which may limit feasibility in certain studies [49].
Radiomics presents a powerful tool for breast cancer characterization. AI models incorporating radiomic features have demonstrated potential in distinguishing benign from malignant lesions, predicting treatment outcomes, and correlating imaging data with molecular markers. Nonetheless, the standardization of radiomic methodologies and validation across diverse imaging modalities remain critical for integrating radiomics into routine clinical practice and advancing precision medicine in breast cancer management.
5.2. Classification Accuracy of Models Distinguishing Between Benign and Malignant Cases
5.2.1. Detection of Malignant Breast Masses
Our models demonstrated robust performance in distinguishing malignant from benign cases across both training and validation datasets. The highest classification accuracy was achieved through the integration of radiomic features extracted from both breast mass and LN images. This finding aligns with the range of accuracies (70.60% to 97%) reported in prior studies (see Table 5) [50,51,52,53,54,55,56,57].
While MAM emains the gold standard for breast cancer screening, existing literature demonstrates significant variation in model performance across different imaging modalities. Our study focused exclusively on MAM-derived radiomics, with results showing strong discriminatory power that aligns with previous reports of high sensitivity in MAM-based AI solutions, albeit with typically lower specificity [54,57]. Conversely, ultrasound-based radiomic models generally demonstrate weaker performance metrics [50,51,52,53], MAM may provide more reliable features for malignancy detection. However, such cross-modality comparisons fall outside the scope of our current investigation.
Our models were trained on 199 features from nine groups, encompassing texture, size, shape, and intensity descriptors. The inclusion of a comprehensive set of features contributed to the development of highly accurate algorithms. This contrasts with earlier studies that employed more limited feature selections[54,56,57]. For example, Avci and Karakaya [57] achieved reliable classification using only 33 GLCM and GLRLM features, while Parekh and Jacobs [54] focused on energy, first-order entropy, and GLCM-based features such as dissimilarity, contrast, and homogeneity. Other researchers incorporated similar GLCM features alongside correlation measures[56] and reported accuracies ranging from 77.08% to 93.75%. The highest sensitivity/specificity values were 90.62% and 99.99% respectively [54,56]. Notably, some studies failed to specify their exact feature sets [50,52,53,55], potentially contributing to the observed variability in published classification outcomes.
Model architecture emerged as another critical determinant of diagnostic performance. Parekh and Jacobs developed a multiparametric radiomic framework for MRI features integrated with an IsoSVM algorithm, achieving 82.5% sensitivity and 80.5% specificity [54]. Li et al. obtained superior metrics (94.55% accuracy, 95.60% sensitivity, 95.36% specificity) by modifying a DenseNet architecture with an Inception module [55]. employed sophisticated image preprocessing, including median filtering, contrast-limited adaptive histogram equalization, and unsharp masking prior to feature extraction. The approach yielded accuracies ranging from 70.60% to 94.10% with exceptional sensitivity (up to 100%) but suboptimal specificity (54.50–66.70%) [57]. Against this benchmark, our architecture demonstrated marked improvements in both classification accuracy and diagnostic robustness for BC detection.
5.2.2. Identification of Lymph Node Metastases
Our research did not focus specifically on detecting LN metastases separately from malignant breast tumours. However, identifying metastatic spread is a crucial step in developing effective treatment strategies. In early-stage BC, recognizing malignancy in the lymphatic system is particularly challenging, as clinical examination and imaging often fail to detect subtle metastatic changes [68]. Nevertheless, certain imaging characteristics of breast tumours may serve as predictors of the cancer spread. For example, the risk of metastasis has been associated with the tumour’s distance from the skin and nipple in ultrasound images [75]. Definitive confirmation of LN malignancy typically requires surgical resection, which can significantly impact a patient’s quality of life. To mitigate the adverse effects of invasive procedures, bioengineers have been developing CAD systems for the non-invasive identification of LN metastases (see Table 5).
The identification of secondary tumours in LNs remains a relatively underexplored area compared to primary detection of BC. Studies on the performance of AI frameworks in distinguishing between benign and malignant lymphadenopathy have yielded highly variable results. Our literature review revealed that imaging-based and radiomics models have achieved a maximum accuracy of 90.88% [64]. However, the majority of classifiers demonstrated only low to moderate sensitivity and specificity [60,64,68,69]. Notably, two CAD systems exhibited a sensitivity exceeding 95% in detecting cancer spread to LNs [64,66]. The overall suboptimal performance of these models may be attributed to imaging limitations, the subtle radiomic features of metastatic LNs, and the challenges posed by small and imbalanced datasets.
5.3. Application of Radiomics for Detecting Molecular Subtypes of Cancer
The choice of therapeutic agents for cancer treatment is guided by molecular subtype characterization. While needle biopsy remains the clinical standard for immunohistochemical assessment [72], this invasive procedure carries risks, including potential hematogenous dissemination of malignant cells along the biopsy tract [76]. Consequently, bioengineers are actively exploring non-invasive alternatives for molecular subtyping.
Our models demonstrated optimal performance in BC subtyping by integrating radiomic features from both breast masses and LNs. However, detection of LBBC proved challenging, with specificity remaining suboptimal (0.571). These results align with prior research confirming the feasibility of molecular subtyping via radiomic analysis, though reported accuracies vary widely (50.70–89.30%) across studies (See Table 7) [70,71,72,73,74]. The variation in model performance indicates that imaging features capture molecular differences in tumors, but results depend on the scan type and analysis method used.
As with tumor detection models, subtyping performance is determined by both feature selection and model architecture. Prior studies relied exclusively on breast mass radiomics, often limiting features to GLCM, GLRLM, and GLSZM descriptors [70,71,72]. This constrained approach may explain the suboptimal performance of some previous models in discriminating certain subtypes. Additionally, pronounced class imbalance in training datasets could contribute to poor sensitivity for minority subtypes , despite high overall accuracy [70,72,74]. In imbalanced datasets, models can bias predictors toward the majority class.
Notably, models trained on 18F-FDG PET/CT radiomics outperformed mammography-based approaches, achieving 84.70–89.30% accuracy and 80.10–93.30% sensitivity despite class imbalance [73]. In contrast, conventional MAM and digital breast tomosynthesis (DBT) yielded more modest metrics. For instance, a DBT study reported 50.7% accuracy, 44% sensitivity and 66.7% specificity for luminal classification [70], implying either intrinsic limitations in imaging-based discrimination or classifier-specific shortcomings.
AI-driven radiomics shows promise for non-invasive BC subtyping, but performance heterogeneity persists due to disparities in sample sizes, imaging modalities, and algorithmic design. Future work should prioritize standardized pipelines, multi-modal data integration, and external validation to bridge the gap toward clinical translation.
Strength and Limitations
This study demonstrates several methodological and clinical strengths:
- The application of radiomics provides a comprehensive phenotypic profile of breast lesions through quantitative characterization of shape, intensity, texture, and wavelength features. This approach aligns with the principles of personalized medicine by enabling non-invasive tumor characterization.
- Integration of radiomic features from both breast masses and LNs yielded superior classification accuracy (AUC-ROC up to 0.99) compared to single-region analyses. The biological interpretability of these features bridges the gap between imaging findings and clinical decision-making.
- The integration of both breast mass and lymph node features yielded superior classification performance compared to single-region analyses, with binary classification models achieving exceptional discriminative ability (AUC-ROC up to 0.99).
- TModel robustness was ensured through stratified sampling, Bayesian hyperparameter optimization, and comparative evaluation of multiple classifier architectures (XGBoost, CatBoost, Random Forest). This systematic approach identified optimal algorithms for distinct diagnostic tasks.
- The study objective extended beyond conventional benign/malignant classification by demonstrating radiomics’ ability to infer molecular subtypes non-invasively. This could reduce unnecessary biopsies and associated complications (e.g., pain, bleeding, infection [15] and rare but clinically significant neoplastic seeding[77]).
The weaknesses of the study are as follows:
- A notable limitation is that pixel value in MAMs reflects the summary density of the mammary gland and varies with regard to acquisition parameters. Hence, the imaging data should be collected with the same mammography. Alternatively, a new dataset should be collected for another device, and the machine learning models should be retrained with the radiomical predictors extracted from new MAMs. When it is not feasible, bioengineers should harmonise the data to ensure model generalisability.
- Manual segmentation of ROIs is operator-dependent, and it may introduce intra- and inter-observer bias. To minimise the impact of the bias on study findings, our research team comprised two radiologists who delineated ROIs independently. The third radiologist compared segmentation masks and selected the best one for extracting radiomical features within the mask borders. In the future, semi- or fully automatic segmentation with deep learning networks can help us overcome this limitation.
- Inbreast dataset does not contain information on the histological verification of metastatic growth inside the lymph nodes that can be detected on the mammograms. Some of the nodes visible at MAM can still be free from metastasis; however, the chance for this occasion is low, and it should not strongly impact the final statistics.
- The open-source dataset does not describe the specific location of biopsies. Most likely, they were taken from the masses and nodes detected with MAMs. The limitation is common to all studies conducted with these data.
- Limited sample size for rare subtypes (e.g., TNBC: n=42) can affect model generalizability.
- The observed performance disparities across molecular subtypes suggest that current feature sets may not fully capture relevant biological heterogeneity. The moderate AUC-ROC values for HER2+ (0.72) and TNBC (0.77) classification leave room for improvement in subtype discrimination.
Conclusion
- Radiomics features extracted from MAM effectively differentiated between benign and malignant breast lesions and LNa. Significant differences across nearly all feature groups support the utility of radiomics in characterizing tumour morphology and intensity distribution.
- LN images exhibited a greater number of discriminative radiomic features compared to breast parenchyma scans. Supposedly, the analysis of nodal structures provides additional diagnostic insights beyond lesion characterization alone.
- The integration of radiomic data from both breast masses and LNs enhanced the interpretability of disease phenotype, providing a more holistic image-based biomarker signature for malignancy.
- ML classifiers demonstrated high accuracy, sensitivity, and specificity in distinguishing benign from malignant lesions using radiomics features. The combination of breast mass and lymph node features yielded the highest overall performance: accuracy exceeded 97% in validation datasets.
- Shape and first-order statistical features had the highest predictive power in malignancy detection. This highlights the diagnostic value of tumour morphology and internal texture intensity in AI-based classification models.
- The Random Forest model achieved accuracy above 0.868 and sensitivity greater than 0.91 in classifying breast cancer molecular subtypes from radiomic features. Although the model struggled to identify TNBC in the training dataset, the performance improved substantially in validation.
The study does not require ethical approval as it was conducted on the open-source dataset of anonymized cases.
Author Contributions
Conceptualization was done by YS; writing (original draft preparation) was mainly done by DS and YS; study methodology was selected and formulated by RV and YS; data curation, analysis and visualization were performed by YS, AK and RV; writing (review and editing)—by YS; validation of study results—by YS; problem investigation—by DS, AK and YS; supervision—by YS and ML; project administration—by ML and YS; funding acquisition—by ML and YS All authors contributed to the article and approved the submitted version.
Funding
This study is supported by the Strategic Research Program of the Zayed Center for Health Sciences at UAEU: "Radiomics and Machine Learning for Rising Accuracy of Diagnostic Mammograms and Improved Molecular Profiling in Breast Cancer." Data interpretation was conducted as part of YS’s degree study in the College of Computing at the Illinois Institute of Technology.
Abbreviations
| AI | artificial intelligence |
| ANL | axillary lymph nodes |
| BC | breast cancer |
| CC | craniocaudal |
| HER2+ | Human Epidermal Growth Factor Receptor-2 overexpressing |
| MAM | mammography |
| MBM | molecular biomarker |
| MLO | mediolateral oblique |
| NSLN | non-sentinel lymph node |
| ROI | region of interests |
| SLN | sentinel lymph node |
| LABC | Luminal A |
| LBBC | Luminal B |
| TNBC | Triple Negative |
References
- World health organization: Breast cancer Kernel Description. Available online: https://www.who.int/news-room/fact-sheets/detail/breast-cancer (accessed on 18 November 2024).
- Hanna, T.P.; King, W.D.; Thibodeau, S.; Jalink, M.; Paulin, G.A.; Harvey-Jones, E.; O’Sullivan, D.E.; Booth, C.M.; Sullivan, R.; Aggarwal, A. Mortality due to cancer treatment delay: systematic review and meta-analysis. bmj 2020, 371. [Google Scholar] [CrossRef] [PubMed]
- Survival for breast cancer. Available online: https://www.cancerresearchuk.org/about-cancer/breast-cancer/survival (accessed on 18 November 2024).
- Zielonke, N.; Gini, A.; Jansen, E.E.; Anttila, A.; Segnan, N.; Ponti, A.; Veerus, P.; de Koning, H.J.; van Ravesteyn, N.T.; Heijnsdijk, E.A.; et al. Evidence for reducing cancer-specific mortality due to screening for breast cancer in Europe: A systematic review. European journal of cancer 2020, 127, 191–206. [Google Scholar] [CrossRef]
- Fuentes, J.D.B.; Morgan, E.; de Luna Aguilar, A.; Mafra, A.; Shah, R.; Giusti, F.; Vignat, J.; Znaor, A.; Musetti, C.; Yip, C.H.; et al. Global stage distribution of breast cancer at diagnosis: a systematic review and meta-analysis. JAMA oncology 2024, 10, 71–78. [Google Scholar]
- Wang, L. Early diagnosis of breast cancer. Sensors 2017, 17, 1572. [Google Scholar] [CrossRef]
- Bhargava, D.; Rattanadecho, P.; Jiamjiroch, K. Microwave imaging for breast Cancer detection-A Comprehensive review. Engineered Science 2024, 30, 1116. [Google Scholar]
- Brożek-Płuska, B.; Placek, I.; Kurczewski, K.; Morawiec, Z.; Tazbir, M.; Abramczyk, H. Breast cancer diagnostics by Raman spectroscopy. Journal of Molecular Liquids 2008, 141, 145–148. [Google Scholar] [CrossRef]
- Arriaga-Canon, C.; Contreras-Espinosa, L.; Aguilar-Villanueva, S.; Bargalló-Rocha, E.; García-Gordillo, J.A.; Cabrera-Galeana, P.; Castro-Hernández, C.; Jiménez-Trejo, F.; Herrera, L. The clinical utility of lncRNAs and their application as molecular biomarkers in breast cancer. International journal of molecular sciences 2023, 24, 7426. [Google Scholar]
- Alam, M.S.; Sultana, A.; Reza, M.S.; Amanullah, M.; Kabir, S.R.; Mollah, M.N.H. Integrated bioinformatics and statistical approaches to explore molecular biomarkers for breast cancer diagnosis, prognosis and therapies. PloS one 2022, 17, e0268967. [Google Scholar]
- Lang, J.E.; Wecsler, J.S.; Press, M.F.; Tripathy, D. Molecular markers for breast cancer diagnosis, prognosis and targeted therapy. Journal of surgical oncology 2015, 111, 81–90. [Google Scholar] [PubMed]
- Ren, W.; Chen, M.; Qiao, Y.; Zhao, F. Global guidelines for breast cancer screening: a systematic review. The Breast 2022, 64, 85–99. [Google Scholar] [CrossRef]
- Zielonke, N.; Kregting, L.M.; Heijnsdijk, E.A.; Veerus, P.; Heinävaara, S.; McKee, M.; de Kok, I.M.; de Koning, H.J.; van Ravesteyn, N.T.; collaborators, E.T. The potential of breast cancer screening in Europe. International journal of cancer 2021, 148, 406–418. [Google Scholar] [CrossRef]
- He, J.; Chen, W.; Li, N.; Shen, H.; Li, J.; Wang, Y.; Tian, J.; Zhou, B.; et al. China guideline for the screening and early detection of female breast cancer (2021, Beijing). Zhonghua Zhong liu za zhi [Chinese Journal of Oncology] 2021, 43, 357–382. [Google Scholar] [PubMed]
- Pesapane, F.; De Marco, P.; Rapino, A.; Lombardo, E.; Nicosia, L.; Tantrige, P.; Rotili, A.; Bozzini, A.C.; Penco, S.; Dominelli, V.; et al. How radiomics can improve breast cancer diagnosis and treatment. Journal of Clinical Medicine 2023, 12, 1372. [Google Scholar] [CrossRef]
- Nicosia, L.; Pesapane, F.; Bozzini, A.C.; Latronico, A.; Rotili, A.; Ferrari, F.; Signorelli, G.; Raimondi, S.; Vignati, S.; Gaeta, A.; et al. Prediction of the malignancy of a breast lesion detected on breast ultrasound: radiomics applied to clinical practice. Cancers 2023, 15, 964. [Google Scholar] [CrossRef]
- Statsenko, Y.; Al Zahmi, F.; Habuza, T.; Neidl-Van Gorkom, K.; Zaki, N. Prediction of COVID-19 severity using laboratory findings on admission: informative values, thresholds, ML model performance. BMJ open 2021, 11, e044500. [Google Scholar] [CrossRef] [PubMed]
- Leibig, C.; Brehmer, M.; Bunk, S.; Byng, D.; Pinker, K.; Umutlu, L. Combining the strengths of radiologists and AI for breast cancer screening: a retrospective analysis. The Lancet Digital Health 2022, 4, e507–e519. [Google Scholar] [CrossRef] [PubMed]
- Freeman, K.; Geppert, J.; Stinton, C.; Todkill, D.; Johnson, S.; Clarke, A.; Taylor-Phillips, S. Use of artificial intelligence for image analysis in breast cancer screening programmes: systematic review of test accuracy. bmj 2021, 374. [Google Scholar] [CrossRef]
- Barba, D.; León-Sosa, A.; Lugo, P.; Suquillo, D.; Torres, F.; Surre, F.; Trojman, L.; Caicedo, A. Breast cancer, screening and diagnostic tools: All you need to know. Critical reviews in oncology/hematology 2021, 157, 103174. [Google Scholar] [CrossRef]
- Tarighati, E.; Keivan, H.; Mahani, H. A review of prognostic and predictive biomarkers in breast cancer. Clinical and experimental medicine 2023, 23, 1–16. [Google Scholar] [CrossRef]
- Orrantia-Borunda, E.; Anchondo-Nuñez, P.; Acuña-Aguilar, L.E.; Gómez-Valles, F.O.; Ramírez-Valdespino, C.A. Subtypes of breast cancer. Breast Cancer [Internet] 2022. [Google Scholar]
- (NIH), N.C.I. Cancer Stat Facts: Female Breast Cancer Subtypes; c2019-2022. Available online: https://seer.cancer.gov/statfacts/html/breast-subtypes.html (accessed on 20 November 2024).
- Moreira, I.C.; Amaral, I.; Domingues, I.; Cardoso, A.; Cardoso, M.J.; Cardoso, J.S. Inbreast: toward a full-field digital mammographic database. Academic radiology 2012, 19, 236–248. [Google Scholar] [CrossRef]
- Welcome to pyradiomics documentation! Available online: https://pyradiomics.readthedocs.io/en/latest/ (accessed on 18 November 2024).
- Wu, A.; Wu, C.; Zeng, Q.; Cao, Y.; Shu, X.; Luo, L.; Feng, Z.; Tu, Y.; Jie, Z.; Zhu, Y.; et al. Development and validation of a CT radiomics and clinical feature model to predict omental metastases for locally advanced gastric cancer. Scientific Reports 2023, 13, 8442. [Google Scholar] [CrossRef]
- Ardakani, A.A.; Bureau, N.J.; Ciaccio, E.J.; Acharya, U.R. Interpretation of radiomics features–a pictorial review. Computer methods and programs in biomedicine 2022, 215, 106609. [Google Scholar]
- Castro-Tapia, S.; Castaneda-Miranda, C.L.; Olvera-Olvera, C.A.; Guerrero-Osuna, H.A.; Ortiz-Rodriguez, J.M.; Martinez-Blanco, M.d.R.; Diaz-Florez, G.; Mendiola-Santibanez, J.D.; Solis-Sanchez, L.O. Classification of breast cancer in mammograms with deep learning adding a fifth class. Applied Sciences 2021, 11, 11398. [Google Scholar] [CrossRef]
- Hong, M.; Rim, B.; Lee, H.; Jang, H.; Oh, J.; Choi, S. Multi-class classification of lung diseases using CNN models. Applied Sciences 2021, 11, 9289. [Google Scholar] [CrossRef]
- Li, J.; Fan, M.; Zhang, J.; Li, L. Discriminating between benign and malignant breast tumors using 3D convolutional neural network in dynamic contrast enhanced-MR images. Proceedings of the Medical Imaging 2017: Imaging Informatics for Healthcare, Research, and Applications. SPIE 2017, Vol. 10138, 44–51. [Google Scholar]
- Litvin, A.; Burkin, D.; Kropinov, A.; Paramzin, F. Radiomics and digital image texture analysis in oncology. Sovremennye tehnologii v medicine 2021, 13, 97–104. [Google Scholar] [CrossRef] [PubMed]
- Zhang, W.; Guo, Y.; Jin, Q. Radiomics and its feature selection: A review. Symmetry 2023, 15, 1834. [Google Scholar] [CrossRef]
- Shen, M.T.; Liu, X.; Gao, Y.; Shi, R.; Jiang, L.; Yao, J. Radiomics-based quantitative contrast-enhanced CT analysis of abdominal lymphadenopathy to differentiate tuberculosis from lymphoma. Precision Clinical Medicine 2024, 7, pbae002. [Google Scholar]
- Su, T.H.; Kao, J.H. Artificial Intelligence, Machine Learning, and Deep Learning in Precision Medicine in Liver Diseases: Concept, Technology, Application and Perspectives; Elsevier, 2023. [Google Scholar]
- Rizzo, S.; Botta, F.; Raimondi, S.; Origgi, D.; Fanciullo, C.; Morganti, A.G.; Bellomi, M. Radiomics: the facts and the challenges of image analysis. European radiology experimental 2018, 2, 1–8. [Google Scholar]
- Limkin, E.J.; Reuzé, S.; Carré, A.; Sun, R.; Schernberg, A.; Alexis, A.; Deutsch, E.; Ferté, C.; Robert, C. The complexity of tumor shape, spiculatedness, correlates with tumor radiomic shape features. Scientific reports 2019, 9, 4329. [Google Scholar] [CrossRef] [PubMed]
- Li, M.; Zhu, L.; Zhou, G.; He, J.; Jiang, Y.; Chen, Y. Predicting the pathological status of mammographic microcalcifications through a radiomics approach. Intelligent Medicine 2021, 1, 95–103. [Google Scholar] [CrossRef]
- Wang, G.; Shi, D.; Guo, Q.; Zhang, H.; Wang, S.; Ren, K. Radiomics based on digital mammography helps to identify mammographic masses suspicious for cancer. Frontiers in oncology 2022, 12, 843436. [Google Scholar] [CrossRef] [PubMed]
- Lu, L.; Ehmke, R.C.; Schwartz, L.H.; Zhao, B. Assessing agreement between radiomic features computed for multiple CT imaging settings. PloS one 2016, 11, e0166550. [Google Scholar] [CrossRef]
- Del Corso, G.; Germanese, D.; Caudai, C.; Anastasi, G.; Belli, P.; Formica, A.; Nicolucci, A.; Palma, S.; Pascali, M.A.; Pieroni, S.; et al. Adaptive Machine Learning Approach for Importance Evaluation of Multimodal Breast Cancer Radiomic Features. Journal of Imaging Informatics in Medicine 2024, 1–10. [Google Scholar] [CrossRef]
- Chitalia, R.D.; Kontos, D. Role of texture analysis in breast MRI as a cancer biomarker: A review. Journal of Magnetic Resonance Imaging 2019, 49, 927–938. [Google Scholar] [CrossRef]
- Tang, Z.; Tan, L.K.; Ng, B.; Rahmat, K.; Ramli, M.; Ninomiya, K.; Wong, J. A radiomics study of textural features using magnetic resonance imaging for classification of breast cancer subtypes. In Proceedings of the Journal of Physics: Conference Series; IOP Publishing, 2020; Vol. 1497, p. 012015. [Google Scholar]
- Wang, J.; Kato, F.; Oyama-Manabe, N.; Li, R.; Cui, Y.; Tha, K.K.; Yamashita, H.; Kudo, K.; Shirato, H. Identifying triple-negative breast cancer using background parenchymal enhancement heterogeneity on dynamic contrast-enhanced MRI: a pilot radiomics study. PloS one 2015, 10, e0143308. [Google Scholar] [CrossRef]
- Braman, N.M.; Etesami, M.; Prasanna, P.; Dubchuk, C.; Gilmore, H.; Tiwari, P.; Plecha, D.; Madabhushi, A. Intratumoral and peritumoral radiomics for the pretreatment prediction of pathological complete response to neoadjuvant chemotherapy based on breast DCE-MRI. Breast Cancer Research 2017, 19, 1–14. [Google Scholar]
- Mahdavi, H.; Kaveh, V.; Karami, F.; Rahimi, M.A. Association between Radiological and First-Order Statistical Features of the Mammogram, and the Tumor Phenotype in Breast Cancer Patients: Statistical features of mammogram and breast cancer. Archives of Breast Cancer 2024, 11. [Google Scholar] [CrossRef]
- Parekh, V.S.; Jacobs, M.A. Multiparametric radiomics methods for breast cancer tissue characterization using radiological imaging. Breast cancer research and treatment 2020, 180, 407–421. [Google Scholar] [CrossRef]
- Panico, A.; Gatta, G.; Salvia, A.; Grezia, G.D.; Fico, N.; Cuccurullo, V. Radiomics in Breast Imaging: Future Development. Journal of personalized medicine 2023, 13, 862. [Google Scholar]
- Tsougos, I.; Vamvakas, A.; Kappas, C.; Fezoulidis, I.; Vassiou, K. Application of radiomics and decision support systems for breast MR differential diagnosis. Computational and mathematical methods in medicine 2018, 2018, 7417126. [Google Scholar] [CrossRef]
- Gelardi, F.; Cavinato, L.; De Sanctis, R.; Ninatti, G.; Tiberio, P.; Rodari, M.; Zambelli, A.; Santoro, A.; Fernandes, B.; Chiti, A.; et al. The Predictive Role of Radiomics in Breast Cancer Patients Imaged by [18F] FDG PET: Preliminary Results from a Prospective Cohort. Diagnostics 2024, 14, 2312. [Google Scholar] [CrossRef] [PubMed]
- Karthik, R.; Menaka, R.; Kathiresan, G.; Anirudh, M.; Nagharjun, M. Gaussian dropout based stacked ensemble CNN for classification of breast tumor in ultrasound images. Irbm 2022, 43, 715–733. [Google Scholar] [CrossRef]
- Moon, W.K.; Chen, I.L.; Chang, J.M.; Shin, S.U.; Lo, C.M.; Chang, R.F. The adaptive computer-aided diagnosis system based on tumor sizes for the classification of breast tumors detected at screening ultrasound. Ultrasonics 2017, 76, 70–77. [Google Scholar] [CrossRef] [PubMed]
- Ali, M.D.; Saleem, A.; Elahi, H.; Khan, M.A.; Khan, M.I.; Yaqoob, M.M.; Farooq Khattak, U.; Al-Rasheed, A. Breast cancer classification through meta-learning ensemble technique using convolution neural networks. Diagnostics 2023, 13, 2242. [Google Scholar] [CrossRef] [PubMed]
- Luo, Y.; Huang, Q.; Li, X. Segmentation information with attention integration for classification of breast tumor in ultrasound image. Pattern Recognition 2022, 124, 108427. [Google Scholar] [CrossRef]
- Parekh, V.S.; Jacobs, M.A. Integrated radiomic framework for breast cancer and tumor biology using advanced machine learning and multiparametric MRI. NPJ breast cancer 2017, 3, 43. [Google Scholar] [CrossRef]
- Li, H.; Zhuang, S.; Li, D.a.; Zhao, J.; Ma, Y. Benign and malignant classification of mammogram images based on deep learning. Biomedical Signal Processing and Control 2019, 51, 347–354. [Google Scholar] [CrossRef]
- Vaidehi, K.; Subashini, T. Automatic characterization of benign and malignant masses in mammography. Procedia Computer Science 2015, 46, 1762–1769. [Google Scholar] [CrossRef]
- Avcı, H.; Karakaya, J. A novel medical image enhancement algorithm for breast cancer detection on mammography images using machine learning. Diagnostics 2023, 13, 348. [Google Scholar] [CrossRef]
- Al-Dhabyani, W.; Gomaa, M.; Khaled, H.; Fahmy, A. Dataset of breast ultrasound images. Data in brief 2020, 28, 104863. [Google Scholar]
- Suckling, J.; Parker, J.; Dance, D.; Astley, S.; Hutt, I.; Boggis, C.; Ricketts, I.; Stamatakis, E.; Cerneaz, N.; Kok, S.; et al. Mammographic image analysis society (mias) database v1. 21. 2015. [Google Scholar]
- Song, B.I. A machine learning-based radiomics model for the prediction of axillary lymph-node metastasis in breast cancer. Breast Cancer 2021, 28, 664–671. [Google Scholar]
- Lee, Y.W.; Huang, C.S.; Shih, C.C.; Chang, R.F. Axillary lymph node metastasis status prediction of early-stage breast cancer using convolutional neural networks. Computers in Biology and Medicine 2021, 130, 104206. [Google Scholar] [CrossRef]
- Yang, X.; Wu, L.; Ye, W.; Zhao, K.; Wang, Y.; Liu, W.; Li, J.; Li, H.; Liu, Z.; Liang, C. Deep learning signature based on staging CT for preoperative prediction of sentinel lymph node metastasis in breast cancer. Academic Radiology 2020, 27, 1226–1233. [Google Scholar] [CrossRef]
- Chen, M.; Kong, C.; Lin, G.; Chen, W.; Guo, X.; Chen, Y.; Cheng, X.; Chen, M.; Shi, C.; Xu, M.; et al. Development and validation of convolutional neural network-based model to predict the risk of sentinel or non-sentinel lymph node metastasis in patients with breast cancer: a machine learning study. EClinicalMedicine 2023, 63. [Google Scholar] [CrossRef]
- Liu, Z.; Ni, S.; Yang, C.; Sun, W.; Huang, D.; Su, H.; Shu, J.; Qin, N. Axillary lymph node metastasis prediction by contrast-enhanced computed tomography images for breast cancer patients based on deep learning. Computers in Biology and Medicine 2021, 136, 104715. [Google Scholar] [CrossRef]
- Yu, Y.; He, Z.; Ouyang, J.; Tan, Y.; Chen, Y.; Gu, Y.; Mao, L.; Ren, W.; Wang, J.; Lin, L.; et al. Magnetic resonance imaging radiomics predicts preoperative axillary lymph node metastasis to support surgical decisions and is associated with tumor microenvironment in invasive breast cancer: A machine learning, multicenter study. EBioMedicine 2021, 69. [Google Scholar] [CrossRef]
- Guo, X.; Liu, Z.; Sun, C.; Zhang, L.; Wang, Y.; Li, Z.; Shi, J.; Wu, T.; Cui, H.; Zhang, J.; et al. Deep learning radiomics of ultrasonography: Identifying the risk of axillary non-sentinel lymph node involvement in primary breast cancer. EBioMedicine 2020, 60. [Google Scholar] [CrossRef]
- Cheng, J.; Ren, C.; Liu, G.; Shui, R.; Zhang, Y.; Li, J.; Shao, Z. Development of high-resolution dedicated PET-based radiomics machine learning model to predict axillary lymph node status in early-stage breast cancer. Cancers 2022, 14, 950. [Google Scholar]
- Zhou, L.Q.; Wu, X.L.; Huang, S.Y.; Wu, G.G.; Ye, H.R.; Wei, Q.; Bao, L.Y.; Deng, Y.B.; Li, X.R.; Cui, X.W.; et al. Lymph node metastasis prediction from primary breast cancer US images using deep learning. Radiology 2020, 294, 19–28. [Google Scholar] [CrossRef]
- Sun, S.; Mutasa, S.; Liu, M.Z.; Nemer, J.; Sun, M.; Siddique, M.; Desperito, E.; Jambawalikar, S.; Ha, R.S. Deep learning prediction of axillary lymph node status using ultrasound images. Computers in Biology and Medicine 2022, 143, 105250. [Google Scholar] [CrossRef]
- Son, J.; Lee, S.E.; Kim, E.K.; Kim, S. Prediction of breast cancer molecular subtypes using radiomics signatures of synthetic mammography from digital breast tomosynthesis. Scientific reports 2020, 10, 21566. [Google Scholar] [PubMed]
- Zhu, S.; Wang, S.; Guo, S.; Wu, R.; Zhang, J.; Kong, M.; Pan, L.; Gu, Y.; Yu, S. Contrast-enhanced mammography radiomics analysis for preoperative prediction of breast cancer molecular subtypes. Academic Radiology 2024, 31, 2228–2238. [Google Scholar]
- Ge, S.; Yixing, Y.; Jia, D.; Ling, Y. Application of mammography-based radiomics signature for preoperative prediction of triple-negative breast cancer. BMC Medical Imaging 2022, 22, 166. [Google Scholar]
- Liu, J.; Bian, H.; Zhang, Y.; Gao, Y.; Yin, G.; Wang, Z.; Li, X.; Ma, W.; Xu, W. Molecular subtype classification of breast cancer using established radiomic signature models based on 18F-FDG PET/CT images. Frontiers in Bioscience-Landmark 2021, 26, 475–484. [Google Scholar]
- Zhou, J.; Tan, H.; Bai, Y.; Li, J.; Lu, Q.; Chen, R.; Zhang, M.; Feng, Q.; Wang, M. Evaluating the HER-2 status of breast cancer using mammography radiomics features. European journal of radiology 2019, 121, 108718. [Google Scholar]
- Ansari, B.; Morton, M.J.; Adamczyk, D.L.; Jones, K.N.; Brodt, J.K.; Degnim, A.C.; Jakub, J.W.; Lohse, C.M.; Boughey, J.C. Distance of breast cancer from the skin and nipple impacts axillary nodal metastases. Annals of surgical oncology 2011, 18, 3174–3180. [Google Scholar] [PubMed]
- Kong, Y.C.; Bhoo-Pathy, N.; O’Rorke, M.; Subramaniam, S.; Bhoo-Pathy, N.T.; See, M.H.; Jamaris, S.; Teoh, K.H.; Bustam, A.Z.; Looi, L.M.; et al. The association between methods of biopsy and survival following breast cancer: A hospital registry based cohort study. Medicine 2020, 99, e19093. [Google Scholar] [CrossRef]
- Bick, U.; Trimboli, R.M.; Athanasiou, A.; Balleyguier, C.; Baltzer, P.A.; Bernathova, M.; Borbély, K.; Brkljacic, B.; Carbonaro, L.A.; Clauser, P.; et al. Image-guided breast biopsy and localisation: recommendations for information to women and referring physicians by the European Society of Breast Imaging. Insights into imaging 2020, 11, 1–18. [Google Scholar] [CrossRef] [PubMed]
Figure 2.
Features importance in binary classification models detecting malignancy from (A) lesions, (B) lymphnodes and (C) lesions and lymphnodes together
Figure 2.
Features importance in binary classification models detecting malignancy from (A) lesions, (B) lymphnodes and (C) lesions and lymphnodes together
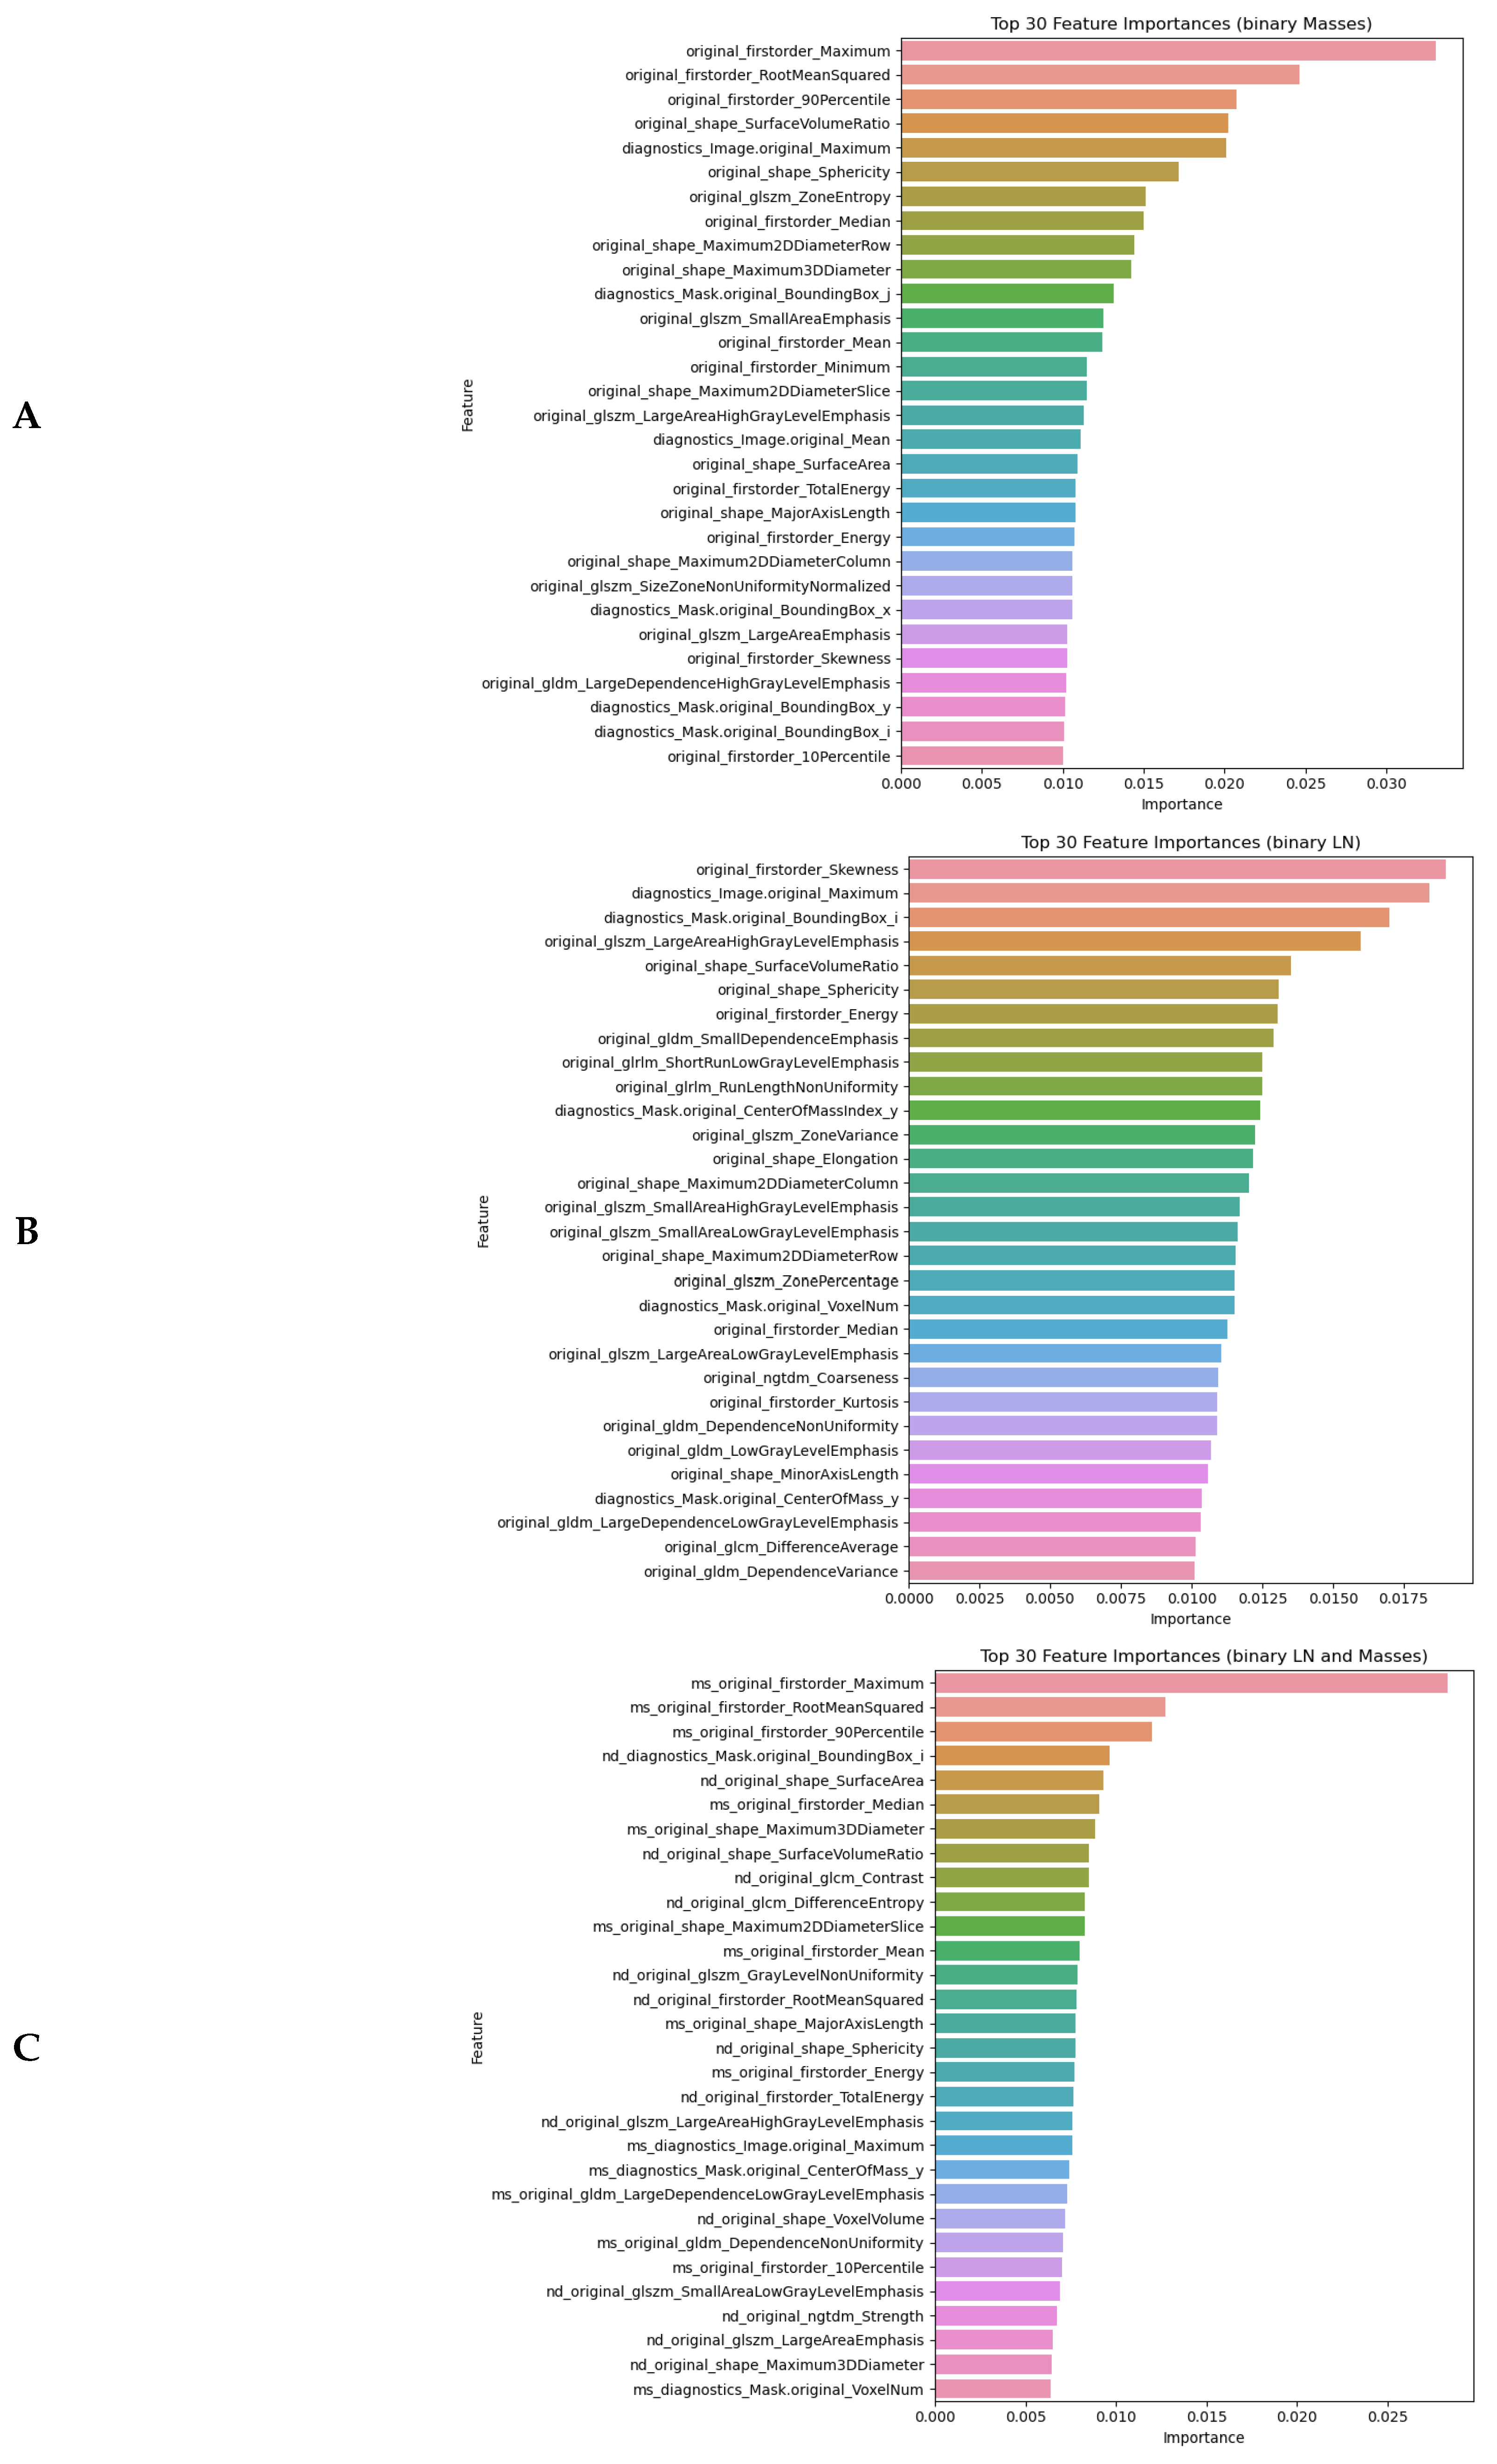
Figure 3.
AUC ROC curves for binary classification models detecting malignancy from (A) lesions, (B) lymphnodes and (C) lesions and lymphnodes together
Figure 3.
AUC ROC curves for binary classification models detecting malignancy from (A) lesions, (B) lymphnodes and (C) lesions and lymphnodes together
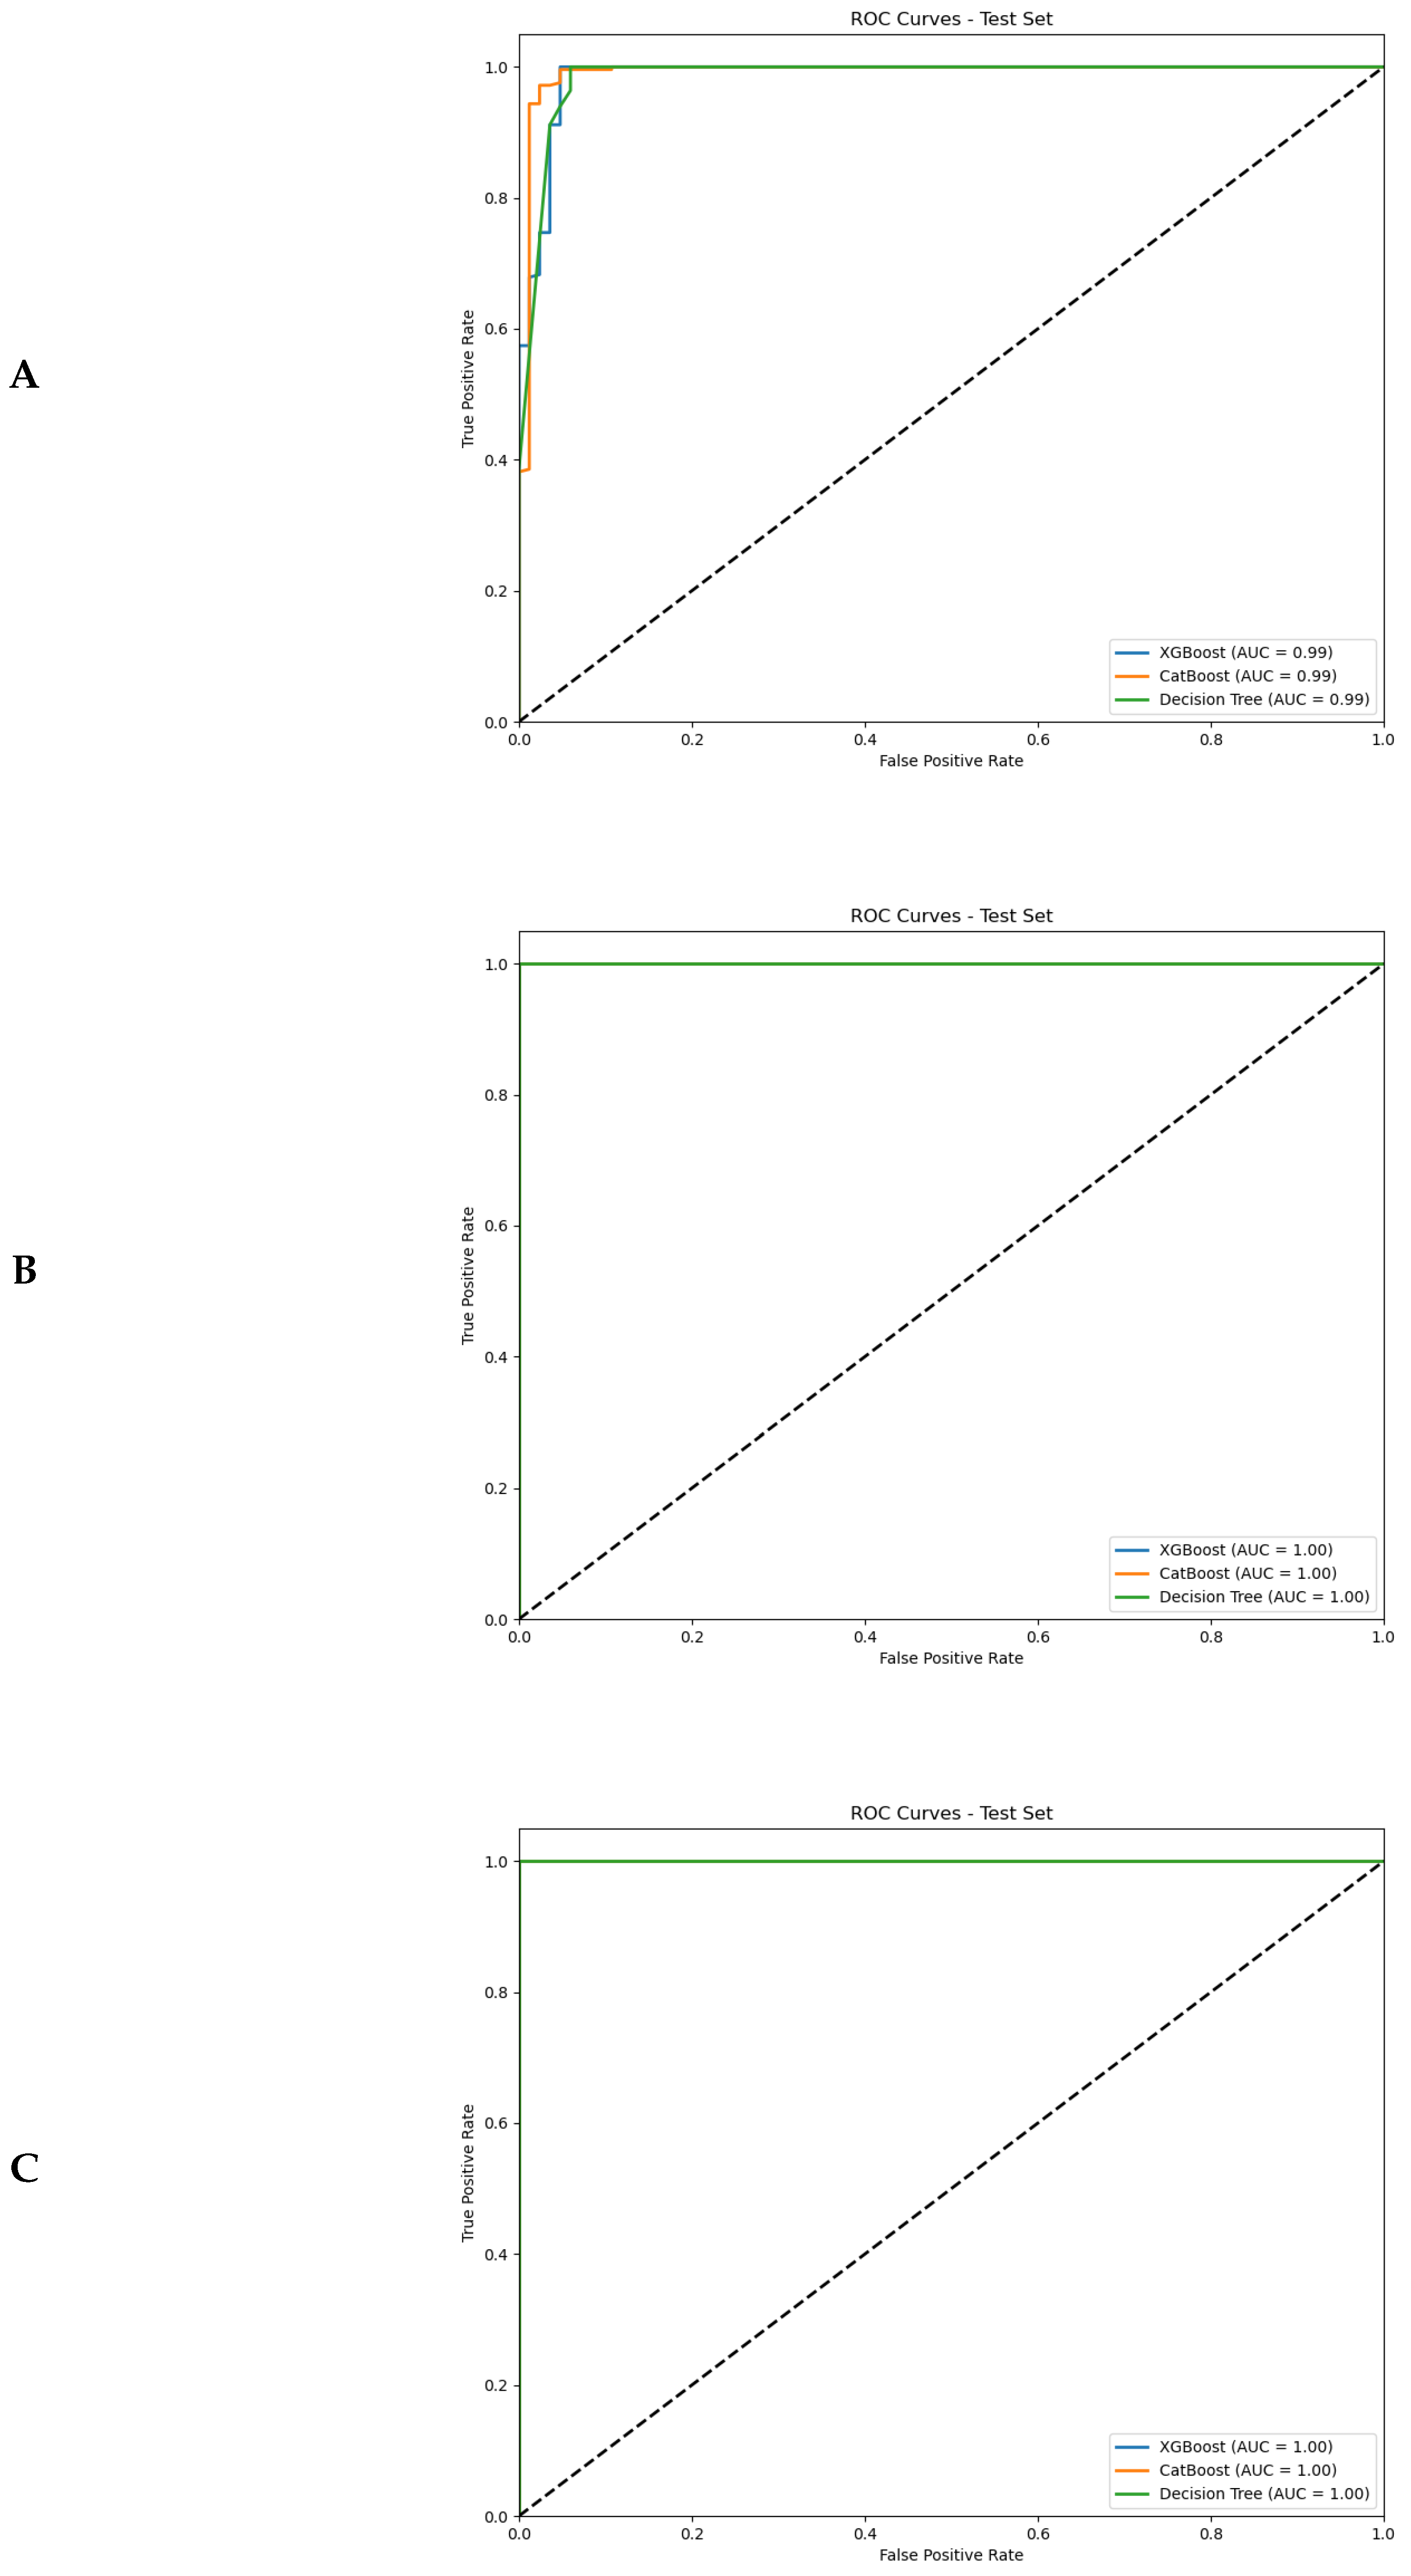
Figure 4.
Features importance in multiclass ML algorithms detecting molecular subtypes from (A) lesions, (B) lymphnodes and (C) lesions and lymphnodes together
Figure 4.
Features importance in multiclass ML algorithms detecting molecular subtypes from (A) lesions, (B) lymphnodes and (C) lesions and lymphnodes together
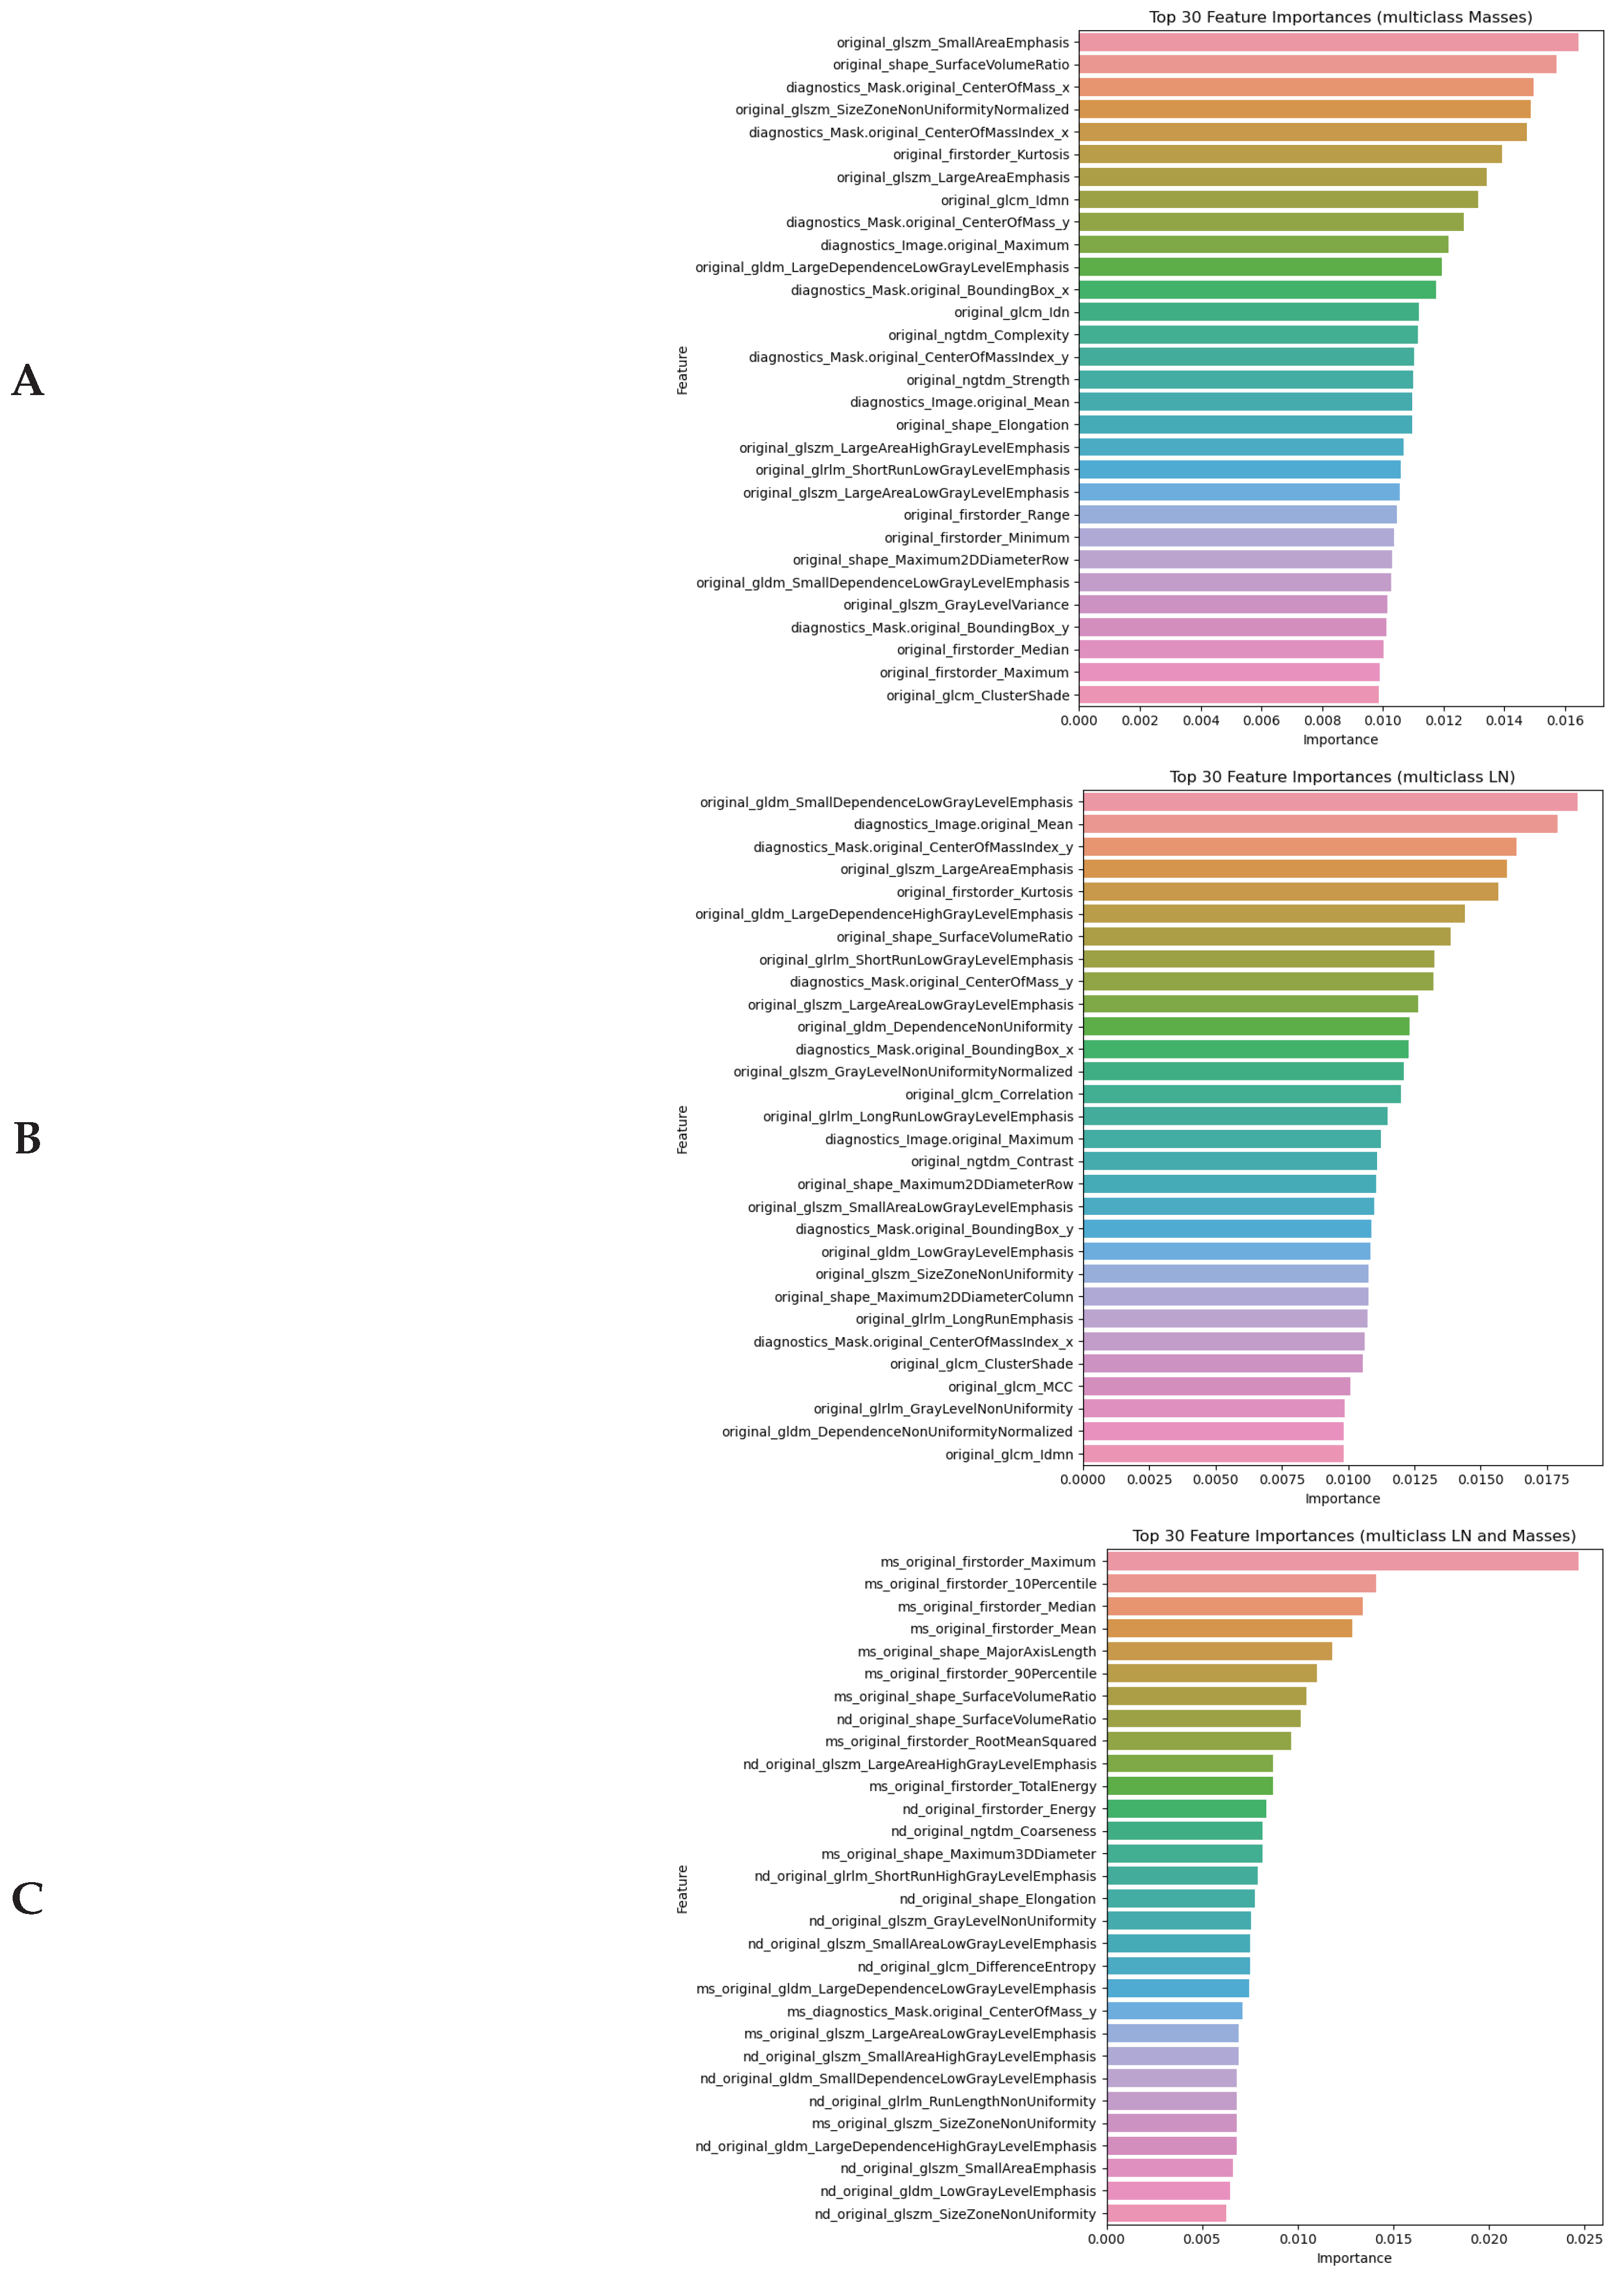

Table 1.
Number of cases taken into analysis after retrieving radiomical data
| Models | Binary classification | Multi-class classification | |||||
|---|---|---|---|---|---|---|---|
| Radiomical data | Benign | Malignant | Luminal A | Luminal B | HER2-enriched | Triple negative | |
| Breast masses | 418 | 1243 | 81 | 196 | 70 | 42 | |
| Lymph nodes | 88 | 308 | 18 | 54 | 19 | 8 | |
| Masses & nodes | 156 | 561 | 35 | 99 | 37 | 15 | |
Table 2.
Descriptive statistics of radiomic features detected in lesions and lymphnotes
| BREAST MASSES | LYMPH NODES | |||||||
|---|---|---|---|---|---|---|---|---|
| benign | malignant | p1−2 | benign | malignant | p3−4 | p1−3 | p2−4 | |
| n1=418 | n2=1243 | n3=88 | n4=308 | |||||
| DIAGNOSTICS IMAGE-ORIGINAL | ||||||||
| Maximum | 228.28±17.49 | 238.4±14.20 | <0.01 | 229.91±16.18 | 236.28±15.57 | <0.01 | 0.45 | 0.02 |
| Mean | 15.73±5.90 | 17.04±7.21 | 0.01 | 19.52±6.23 | 20.94±6.85 | 0.07 | <0.01 | <0.01 |
| DIAGNOSTICS MASK-ORIGINAL | ||||||||
| 237.97±147.04 | 241.92±109.33 | <0.01 | 166.41±112.13 | 188.56±134.34 | 0.42 | <0.01 | <0.01 | |
| 281.46±221.80 | 277.20±156.42 | <0.01 | 216.42±147.49 | 267.74±215.36 | 0.12 | 0.01 | <0.01 | |
| 843.78±618.02 | 788.08±647.76 | 0.09 | 892.35±839.39 | 786.91±817.25 | 0.28 | 0.58 | 0.09 | |
| 1020.6±345.84 | 993.35±345.20 | 0.23 | 69.66±127.35 | 91.22±188.47 | 0.45 | <0.01 | <0.01 | |
| 90.68±58.57 | 85.53±60.80 | 0.11 | 91.94±78.36 | 82.80±76.75 | 0.46 | 0.62 | 0.11 | |
| 109.11±30.80 | 106.43±31.33 | 0.16 | 16.48±12.95 | 20.88±18.54 | 0.03 | <0.01 | <0.01 | |
| 963.74±622.44 | 909.04±646.17 | 0.11 | 977.10±832.76 | 879.96±815.65 | 0.46 | 0.62 | 0.11 | |
| 1159.61±327.31 | 1131.13±332.93 | 0.16 | 175.13±137.64 | 221.93±197.03 | 0.03 | <0.01 | <0.01 | |
| VolumeNum | 1.13±0.84 | 2.52±5.10 | <0.01 | 2.15±1.44 | 2.40±2.42 | 0.79 | <0.01 | <0.01 |
| VoxelNum | 6.4e05±1.0e06 | 4.8e05±6.0e05 | 0.04 | 1.0e05±6.9e04 | 1.9e05±2.4e05 | 0.01 | <0.01 | <0.01 |
| ORIGINAL FIRST ORDER | ||||||||
| 10Percentile | 83.41±35.41 | 105.11±39.87 | <0.01 | 72.36±37.54 | 87.76±42.58 | 0.002 | 0.003 | <0.01 |
| 90Percentile | 156.96±37.13 | 181.16±39.13 | <0.01 | 120.98±45.53 | 143.40±48.74 | <0.01 | <0.01 | <0.01 |
| Energy | 9.0e10±1.4e10 | 1.0e10±1.1e10 | <0.01 | 1.2e09±1.4e09 | 3.4e09±7.2e09 | <0.01 | <0.01 | <0.01 |
| Entropy | 2.45±0.39 | 2.49±0.40 | 0.03 | 1.94±0.41 | 2.08±0.47 | 0.003 | <0.01 | <0.01 |
| Interquartile Range | 40.09±13.42 | 41.88±13.37 | 0.01 | 25.97±9.22 | 30.21±13.33 | 0.004 | <0.01 | <0.01 |
| Kurtosis | 2.85±0.87 | 2.86±1.22 | 0.26 | 3.09±0.76 | 3.17±1.79 | 0.07 | <0.01 | <0.01 |
| Maximum | 204.73±30.12 | 224.70±27.58 | <0.01 | 165.69±45.80 | 186.59±43.78 | <0.01 | <0.01 | <0.01 |
| Mean | 120.61±36.03 | 144.32±39.52 | <0.01 | 96.21±41.50 | 115.34±45.66 | <0.01 | <0.01 | <0.01 |
| Mean Absolute Deviation | 22.92±6.59 | 23.78±6.83 | 0.01 | 15.16±5.02 | 17.50±6.56 | 0.002 | <0.01 | <0.01 |
| Median | 121.20±38.07 | 145.76±41.81 | <0.01 | 95.43±42.37 | 114.99±47.24 | <0.01 | <0.01 | <0.01 |
| Minimum | 36.45±24.02 | 50.93±32.45 | <0.01 | 42.38±26.45 | 49.90±31.47 | 0.05 | 0.07 | 0.72 |
| Range | 168.28±30.61 | 173.77±33.03 | <0.01 | 123.32±31.51 | 136.69±35.74 | <0.01 | <0.01 | <0.01 |
| Robust Mean Absolute Deviation | 15.61±7.27 | 15.86±7.05 | 0.30 | 8.45±3.56 | 17.06±125.90 | <0.01 | <0.01 | <0.01 |
| Root Mean Squared | 114.22±47.51 | 137.05±55.11 | <0.01 | 126.67±61.75 | 318.86±2896.58 | <0.01 | <0.01 | <0.01 |
| Skewness | -0.07±0.49 | -0.16±0.52 | <0.01 | 0.27±0.40 | 0.13±0.61 | <0.01 | <0.01 | <0.01 |
| Total Energy | 7.4e06±12.1e06 | 7.7e07±9.2e07 | <0.01 | 2.03±0.83 | 2.25±0.80 | <0.01 | 0.002 | <0.01 |
| Uniformity | 0.28±0.24 | 0.28±0.23 | 0.57 | 2.78±1.10 | 3.06±1.00 | <0.01 | 0.002 | <0.01 |
| Variance | 847.11±450.33 | 909.01±487.52 | 0.01 | 390.73±259.20 | 527.15±383.76 | 0.001 | <0.01 | <0.01 |
| ORIGINAL GREY LEVEL CO-OCCURRENCE MATRIX | ||||||||
| Autocorrelation | 30.57±12.92 | 35.96±15.14 | <0.01 | 15.37±8.32 | 21.02±12.88 | <0.01 | <0.01 | <0.01 |
| Cluster Prominence | 217.25±244.25 | 255.03±303.92 | 0.01 | 49.61±75.21 | 105.46±227.63 | 0.001 | <0.01 | <0.01 |
| Cluster Shade | -2.09±16.92 | -5.46±19.86 | <0.01 | 1.14±4.88 | 0.99±14.87 | 0.05 | <0.01 | <0.01 |
| Cluster Tendency | 8.04±4.46 | 8.63±4.82 | 0.02 | 3.51±2.48 | 4.82±3.77 | 0.001 | <0.01 | <0.01 |
| Contrast | 0.65±0.17 | 0.64±0.16 | 0.34 | 0.67±0.26 | 0.66±0.21 | 0.72 | 0.88 | 0.01 |
| Correlation | 0.81±0.10 | 0.82±0.10 | 0.02 | 0.62±0.15 | 0.67±0.16 | 0.01 | <0.01 | <0.01 |
| Difference Average | 0.53±0.12 | 0.53±0.11 | 0.34 | 0.53±0.15 | 0.54±0.13 | 0.72 | 0.97 | 0.03 |
| Difference Entropy | 1.21±0.16 | 1.21±0.15 | 0.30 | 1.21±0.19 | 1.21±0.20 | 0.65 | 0.94 | 0.04 |
| Difference Variance | 0.35±0.07 | 0.35±0.06 | 0.31 | 0.36±0.11 | 0.36±0.09 | 0.63 | 0.83 | 0.01 |
| Id | 0.75±0.05 | 0.75±0.05 | 0.33 | 0.75±0.06 | 0.75±0.06 | 0.73 | 0.98 | 0.05 |
| Idm | 0.74±0.05 | 0.75±0.05 | 0.33 | 0.75±0.06 | 0.74±0.06 | 0.73 | 0.99 | 0.05 |
| Idmn | 0.99±0.003 | 0.99±0.003 | 0.01 | 0.99±0.01 | 0.99±0.01 | 0.003 | <0.01 | <0.01 |
| Idn | 0.95±0.01 | 0.95±0.01 | 0.01 | 0.94±0.01 | 0.94±0.02 | 0.07 | <0.01 | <0.01 |
| Imc1 | -0.34±0.11 | -0.35±0.10 | 0.07 | -0.21±0.10 | -0.25±0.13 | 0.02 | <0.01 | <0.01 |
| Imc2 | 0.88±0.09 | 0.89±0.09 | 0.03 | 0.71±0.14 | 0.75±0.15 | 0.01 | <0.01 | <0.01 |
| Inverse Variance | 0.44±0.08 | 0.44±0.07 | 0.26 | 0.44±0.08 | 0.44±0.08 | 0.67 | 0.86 | 0.05 |
| Joint Energy | 0.09±0.08 | 0.09±0.07 | 0.15 | 0.14±0.08 | 0.13±0.12 | 0.01 | <0.01 | <0.01 |
| Joint Entropy | 4.03±0.58 | 4.08±0.58 | 0.05 | 3.44±0.66 | 3.60±0.73 | 0.01 | <0.01 | <0.01 |
| Maximum Probability | 0.17±0.10 | 0.17±0.10 | 0.31 | 0.25±0.12 | 0.23±0.14 | 0.01 | <0.01 | <0.01 |
| MCC | 0.83±0.10 | 0.84±0.10 | 0.26 | 0.64±0.15 | 0.69±0.16 | 0.004 | <0.01 | <0.01 |
| Sum Average | 10.44±2.45 | 11.36±2.62 | <0.01 | 7.38±2.05 | 8.56±2.58 | <0.01 | <0.01 | <0.01 |
| Sum Entropy | 3.32±0.47 | 3.37±0.47 | 0.02 | 2.74±0.48 | 2.88±0.58 | 0.003 | <0.01 | <0.01 |
| Sum Squares | 2.17±1.12 | 2.32±1.21 | 0.02 | 1.04±0.64 | 1.37±0.95 | 0.002 | <0.01 | <0.01 |
| ORIGINAL GREY LEVEL DEPENDENCE MATRIX | ||||||||
| Dependence Entropy | 5.28±0.55 | 5.34±0.52 | 0.02 | 4.75±0.45 | 4.86±0.68 | 0.004 | <0.01 | <0.01 |
| Dependence Non-Uniformity | 9.4e041.6e05 | 7.0e04±1.1e05 | 0.11 | 1.5e04±1.0e04 | 3.0e04±5.0e04 | 0.01 | <0.01 | <0.01 |
| Dependence Non-Uniformity Normalized | 0.15±0.06 | 0.15±0.05 | 0.02 | 0.15±0.01 | 0.16±0.08 | 0.45 | 0.06 | <0.01 |
| Dependence Variance | 3.87±0.58 | 3.91±0.56 | 0.20 | 3.83±0.57 | 3.76±0.59 | 0.45 | 0.50 | <0.01 |
| Grey Level Non-Uniformity | 1.2e05±2.0e05 | 9.5e04±1.2e05 | 0.07 | 3.2e04±2.e04 | 4.9e04±6.9e04 | 0.07 | <0.01 | <0.01 |
| Grey Level Variance | 2.19±1.12 | 2.35±1.22 | 0.01 | 1.06±0.65 | 1.40±0.96 | 0.001 | <0.01 | <0.01 |
| High Grey Level Emphasis | 30.76±12.90 | 36.07±15.10 | <0.01 | 15.61±8.33 | 21.22±12.85 | <0.01 | <0.01 | <0.01 |
| Large Dependence Emphasis | 30.50±8.78 | 30.36±7.82 | 0.60 | 30.38±9.21 | 29.98±9.68 | 0.78 | 0.46 | 0.002 |
| Large Dependence High Grey Level Emphasis | 873.08±478.04 | 1.1e04±614.43 | <0.01 | 410.34±183.74 | 600.31±519.30 | <0.01 | <0.01 | <0.01 |
| Large Dependence Low Grey Level Emphasis | 3.27±7.41 | 2.18±5.21 | <0.01 | 4.51±5.23 | 4.06±9.19 | 0.02 | <0.01 | <0.01 |
| Low Grey Level Emphasis | 0.08±0.10 | 0.06±0.07 | <0.01 | 0.13±0.10 | 0.11±0.13 | <0.01 | <0.01 | <0.01 |
| Small Dependence Emphasis | 0.10±0.02 | 0.10±0.02 | 0.30 | 0.11±0.03 | 0.11±0.03 | 0.86 | 0.47 | <0.01 |
| Small Dependence High Grey Level Emphasis | 3.39±1.36 | 3.69±1.46 | <0.01 | 1.92±1.21 | 2.41±1.33 | 0.002 | <0.01 | <0.01 |
| Small Dependence Low Grey Level Emphasis | 0.01±0.004 | 0.01±0.004 | <0.01 | 0.01±0.01 | 0.01±0.01 | <0.01 | <0.01 | <0.01 |
| Grey Level Non Uniformity | 5.5e04±8.3e04 | 4.1e04±4.2e04 | 0.07 | 1.3e04±827.18 | 2.0e04±2.1e04 | 0.05 | <0.01 | <0.01 |
| Long Run High Grey Level Emphasis | 272.04±425.63 | 397.21±1.2e04 | <0.01 | 106.65±54.98 | 444.08±4.6e04 | <0.01 | <0.01 | <0.01 |
| ORIGINAL GREY LEVEL RUN LENGTH MATRIX | ||||||||
| grey Level Non Uniformity | 5.5e04±8.2e04 | 4.1e04±4.2e04 | 0.07 | 1.3e04±827.18 | 2.0e04±2.1e04 | 0.05 | <0.01 | <0.01 |
| Grey Level Non Uniformity Normalized | 0.21±0.05 | 0.20±0.06 | <0.01 | 0.28±0.07 | 0.25±0.07 | 0.001 | <0.01 | <0.01 |
| Grey Level Variance | 2.19±0.93 | 2.39±1.06 | <0.01 | 1.21±0.62 | 1.58±1.08 | <0.01 | <0.01 | <0.01 |
| High Grey Level Run Emphasis | 31.51±12.06 | 35.41±13.87 | <0.01 | 16.04±8.09 | 21.50±11.83 | <0.01 | <0.01 | <0.01 |
| Long Run Emphasis | 36.06±282.73 | 31.10±345.22 | 0.74 | 9.69±8.68 | 39.45±256.91 | 0.84 | 0.27 | <0.01 |
| Long Run High Grey Level Emphasis | 272.04±425.63 | 397.21±1258.60 | <0.01 | 106.65±54.98 | 444.08±4.6e04 | <0.01 | <0.01 | <0.01 |
| Long Run Low Grey Level Emphasis | 26.82±279.81 | 16.69±271.07 | <0.01 | 1.87±4.10 | 29.23±252.66 | 0.01 | <0.01 | <0.01 |
| Low Grey Level Run Emphasis | 0.07±0.07 | 0.06±0.05 | <0.01 | 0.13±0.10 | 0.11±0.10 | <0.01 | <0.01 | <0.01 |
| Run Entropy | 4.52±0.39 | 4.56±0.37 | 0.01 | 4.07±0.32 | 4.19±0.44 | 0.03 | <0.01 | <0.01 |
| Run Length Non Uniformity | 1.0e05±1.4e05 | 8.0e04±7.6e04 | 0.08 | 1.8e04±1.4e04 | 3.3e04±3.8e04 | 0.003 | <0.01 | <0.01 |
| Run Length Non Uniformity Normalized | 0.36±0.05 | 0.36±0.05 | 0.29 | 0.36±0.07 | 0.36±0.07 | 0.74 | 0.79 | 0.01 |
| Run Percentage | 0.49±0.09 | 0.49±0.08 | 0.60 | 0.49±0.10 | 0.49±0.10 | 0.79 | 0.48 | 0.002 |
| Run Variance | 26.34±229.73 | 17.50±193.11 | 0.79 | 4.64±5.54 | 25.75±188.11 | 0.86 | 0.22 | <0.01 |
| Short Run Emphasis | 0.62±0.05 | 0.62±0.05 | 0.26 | 0.61±0.07 | 0.62±0.07 | 0.75 | 0.81 | 0.01 |
| Short Run High Grey Level Emphasis | 19.79±7.39 | 21.75±8.28 | <0.01 | 10.37±5.66 | 13.62±7.33 | <0.01 | <0.01 | <0.01 |
| Short Run Low Grey Level Emphasis | 0.04±0.03 | 0.03±0.03 | <0.01 | 0.08±0.05 | 0.06±0.05 | <0.01 | <0.01 | <0.01 |
| GREY LEVEL SIZE ZONE MATRIX | ||||||||
| Grey Level Non Uniformity | 795.79±1201.62 | 585.19±669.72 | 0.09 | 180.04±117.67 | 272.46±283.88 | 0.03 | <0.01 | <0.01 |
| Grey Level Non Uniformity Normalized | 0.17±0.05 | 0.17±0.05 | <0.01 | 0.23±0.08 | 0.21±0.07 | 0.001 | <0.01 | <0.01 |
| Grey Level Variance | 2.92±0.87 | 3.16±1.00 | <0.01 | 2.02±0.71 | 2.37±0.94 | <0.01 | <0.01 | <0.01 |
| High Grey Level Zone Emphasis | 32.50±11.76 | 35.23±13.35 | <0.01 | 17.16±7.70 | 22.20±11.14 | <0.01 | <0.01 | <0.01 |
| Large Area Emphasis | 1.9e06±1.4e07 | 1.8e06±2.2e07 | 0.17 | 2.0e05±3.1e05 | 8.6e05±5.4e06 | 0.59 | <0.01 | <0.01 |
| Large Area High Grey Level Emphasis | 2.8e07±9.4e07 | 2.5e07±8.9e07 | 0.07 | 1.8e06±1.6e06 | 1.7e07±.20e08 | 0.001 | <0.01 | <0.01 |
| Large Area Low Grey Level Emphasis | 1.2e06±1.3e07 | 1.0e06±2.0e07 | <0.01 | 4.8e04±2.1e05 | 5.4e05±5.1e06 | 0.27 | 0.34 | 0.58 |
| Low Grey Level Zone Emphasis | 0.08±0.08 | 0.07±0.06 | 0.01 | 0.16±0.10 | 0.13±0.11 | <0.01 | <0.01 | <0.01 |
| Size Zone Non Uniformity | 1.7e04±2.4e04 | 1.3e04±1.3e04 | 0.11 | 300.70±230.42 | 525.89±609.14 | 0.01 | <0.01 | <0.01 |
| Size Zone Non Uniformity Normalized | 0.36±0.03 | 0.35±0.03 | <0.01 | 0.34±0.03 | 0.34±0.04 | 0.70 | <0.01 | <0.01 |
| Small Area Emphasis | 0.62±0.02 | 0.61±0.02 | <0.01 | 0.60±0.03 | 0.60±0.05 | 0.76 | <0.01 | <0.01 |
| Small Area High Grey Level Emphasis | 20.27±7.39 | 21.78±8.29 | 0.002 | 10.47±4.60 | 13.51±6.94 | <0.01 | <0.01 | <0.01 |
| Small Area Low Grey Level Emphasis | 0.05±0.04 | 0.04±0.04 | 0.003 | 0.10±0.06 | 0.08±0.07 | <0.01 | <0.01 | <0.01 |
| Zone Entropy | 5.05±0.34 | 5.17±0.39 | <0.01 | 4.72±0.40 | 4.85±0.47 | 0.004 | <0.01 | <0.01 |
| Zone Percentage | 0.08±0.02 | 0.08±0.02 | 0.40 | 0.09±0.03 | 0.09±0.03 | 0.89 | 0.16 | <0.01 |
| Zone Variance | 1.9e06±1.4e07 | 1.7e06±2.0e07 | 0.17 | 2.0e05±3.1e05 | 8.1e05±5.2e06 | 0.59 | <0.01 | <0.01 |
| ORIGINAL NEIGHBOURING GREY TONE DIFFERENCE MATRIX | ||||||||
| Busyness | 89.95±124.85 | 65.62±74.74 | 0.53 | 58.52±136.42 | 47.20±45.30 | 0.86 | 0.002 | <0.01 |
| Coarseness | 0.001±0.001 | 0.001±0.002 | 0.07 | 0.001±0.001 | 0.002±0.01 | 0.05 | <0.01 | <0.01 |
| Complexity | 17.62±6.14 | 18.87±6.97 | <0.01 | 11.01±5.84 | 12.91±6.18 | 0.01 | <0.01 | <0.01 |
| Contrast | 0.02±0.01 | 0.02±0.01 | 0.55 | 0.02±0.01 | 0.02±0.01 | 0.40 | 0.002 | <0.01 |
| Strength | 0.02±0.02 | 0.02±0.02 | 0.85 | 0.03±0.02 | 0.03±0.07 | 0.54 | <0.01 | <0.01 |
| ORIGINAL SHAPE | ||||||||
| Elongation | 0.71±0.17 | 0.70±0.17 | 0.09 | 0.45±0.21 | 0.48±0.22 | 0.18 | <0.01 | <0.01 |
| Major AxisLength | 29.43±23.74 | 28.41±17.51 | 0.01 | 28.68±19.45 | 32.47±26.12 | 0.57 | 0.98 | 0.86 |
| Maximum 2D Diameter Column | 21.33±13.40 | 21.17±9.64 | 0.01 | 12.54±8.65 | 14.94±11.24 | 0.19 | <0.01 | <0.01 |
| Maximum 2D Diameter Row | 24.79±19.16 | 24.30±13.49 | <0.01 | 16.71±11.58 | 21.50±17.36 | 0.05 | <0.01 | <0.01 |
| Maximum2D Diameter Slice | 29.27±21.33 | 29.11±15.32 | <0.01 | 24.51±14.66 | 29.09±21.14 | 0.20 | 0.11 | 0.01 |
| Maximum 3D Diameter | 29.27±21.33 | 29.11±15.32 | <0.01 | 24.51±14.66 | 29.09±21.14 | 0.20 | 0.11 | 0.01 |
| Mesh Volume | 561.78±916.62 | 419.69±527.64 | 0.05 | 91.54±60.56 | 166.03±209.15 | 0.01 | <0.01 | <0.01 |
| Minor Axis Length | 19.46±13.31 | 18.41±8.79 | 0.05 | 10.79±7.01 | 13.36±11.04 | 0.18 | <0.01 | <0.01 |
| Sphericity | 0.35±0.11 | 0.32±0.07 | <0.01 | 0.43±0.08 | 0.41±0.11 | 0.03 | <0.01 | <0.01 |
| Surface Area | 1.2e04±1.9e04 | 945.31±1.1e04 | 0.01 | 242.55±151.84 | 406.97±459.46 | 0.02 | <0.01 | <0.01 |
| Surface Volume Ratio | 2.30±0.21 | 2.38±0.28 | <0.01 | 2.75±0.26 | 2.68±0.36 | 0.002 | <0.01 | <0.01 |
| Voxel Volume | 563.50±917.69 | 421.96±528.31 | 0.04 | 92.83±61.20 | 167.65±210.00 | 0.01 | <0.01 | <0.01 |
Table 3.
Performance of binary classification models detecting malignancy
| Predictors | Mass radiomics | Lymph node radiomics | Mass & lymph node radiomics | |||||||
|---|---|---|---|---|---|---|---|---|---|---|
| Classifiers | Sn | Sp | Acc | Sn | Sp | Acc | Sn | Sp | Acc | |
| TRAINING DATASET | ||||||||||
| CatBoost Classifier | 0.951 | 0.962 | 0.954 | 0.941 | 0.965 | 0.946 | 0.973 | 0.951 | 0.960 | |
| XGBoost Classifier | 0.956 | 1.000 | 0.968 | 0.986 | 0.860 | 0.960 | 0.970 | 1.000 | 0.977 | |
| Decision Tree | 1.000 | 0.865 | 0.940 | 1.000 | 0.860 | 0.971 | 1.000 | 0.885 | 0.972 | |
| Mean±SD | 0.969±0.022 | 0.942±0.057 | 0.954±0.011 | 0.976±0.025 | 0.895±0.049 | 0.959±0.010 | 0.981±0.013 | 0.945±0.047 | 0.970±0.007 | |
| VALIDATION DATASET | ||||||||||
| CatBoost Classifier | 0.974 | 0.901 | 0.956 | 0.955 | 0.968 | 0.958 | 0.975 | 0.990 | 0.978 | |
| XGBoost Classifier | 0.990 | 0.961 | 0.991 | 1.000 | 0.930 | 0.992 | 0.975 | 1.000 | 0.980 | |
| Decision Tree | 0.999 | 0.859 | 0.965 | 1.000 | 0.960 | 0.992 | 0.997 | 0.962 | 0.990 | |
| Mean±SD | 0.988±0.010 | 0.907±0.042 | 0.971±0.015 | 0.985±0.021 | 0.953±0.016 | 0.981±0.016 | 0.982±0.010 | 0.984±0.016 | 0.983±0.005 | |
Table 4.
Identification of each molecular subtype from radiomics for breast masses and lymph nodes
| Classification | Sensitivity | Specificity | Accucary |
|---|---|---|---|
| TRAINING DATASET | |||
| LABC vs others | 0.908 | 0.433 | 0.818 |
| LBBC vs others | 0.850 | 0.487 | 0.783 |
| TNBC vs others | 0.577 | 0.672 | 0.628 |
| HER2 vs others | 0.948 | 0.267 | 0.891 |
| VALIDATION DATASET | |||
| LABC vs others | 0.967 | 1.000 | 0.974 |
| LBBC vs others | 0.935 | 0.571 | 0.868 |
| TNBC vs others | 0.944 | 0.800 | 0.868 |
| HER2 vs others | 0.914 | 1.000 | 0.921 |
Table 5.
Radiomical models of machine learning in breast cancer imaging
| Cite | Year | Database | Sample size | Classification | Imaging modality |
Classifier | Metrics, % | ||
|---|---|---|---|---|---|---|---|---|---|
| Accuracy | Sensitivity | Specificity | |||||||
| DETECTION OF MALIGNANT BREAST MASSES | |||||||||
| [50] | 2022 | Baheya Hospital for Early Detection & Treatment of Women’s Cancer [58] |
487 : 357 : 212 | benign vs malignant tumours vs normal breast tissue |
Ultrasound | CNN | 87.76 | 87.62 | – |
| [51] | 2017 | Seoul National University Hospital |
78 : 78 | benign vs malignant tumour |
Ultrasound | Logistic regression |
81.41 | 83.33 | 79.49 |
| [52] | 2023 | Baheya Hospital for Early Detection & Treatment of Women’s Cancer [58] |
5000 : 5000 | benign vs malignant tumour |
Ultrasound | Inception V3 ResNet50 DenseNet121 Ensemble |
83.00 88.00 84.00 90.00 |
74.00 82.00 79.00 84.00 |
– – – – |
| [53] | 2021 | Cancer Center of Sun Yat-sen University |
946 : 1048 | benign vs malignant tumour |
Ultrasound | DCNN | 90.78 | 91.18 | 90.44 |
| [54] | 2017 | The Johns Hopkins School of Medicine Hospital |
26 : 98 | benign vs malignant tumour |
DCE-MRI | IsoSVM RBFSVM Linear SVM Quadratic SVM Cubic SVM |
– – – – – |
93.00 80.00 85.00 85.00 93.00 |
85.00 77.00 62.00 54.00 55.00 |
| [55] | 2019 | First Hospital of Shanxi Medical University |
1011 : 1031 | benign vs malignant tumour |
Mammo- graphy |
AlexNet VGGNet GooLeNet DenseNet DenseNet-II |
92.70 92.78 93.54 93.87 94.55 |
93.60 93.58 93.90 94.59 95.60 |
91.78 92.42 93.17 93.90 95.36 |
| [56] | 2015 | MIAS [59] | 32 : 16 | benign vs malignant tumour |
Mammo- graphy |
Adaboost BPNN SRC |
81.25 77.08 93.75 |
78.12 75.00 90.62 |
87.50 81.25 99.99 |
| [57] | 2023 | MIAS [59] | 322 cases | benign vs malignant tumour |
Mammo- graphy |
SVM RF ANN k-NN NB DT |
94.10 97.00 93.50 82.30 70.60 94.10 |
93.70 100.00 92.90 100.00 100.00 100.00 |
97.30 94.70 92.00 66.70 54.50 88.80 |
| IDENTIFICATION OF LYMPH NODE METASTASES | |||||||||
| [60] | 2021 | Keimyung University Dongsan Hospital |
43 : 57 | benign vs malignant lymphadenopathy in ALN |
PET/CT | XGBoost | 77.00 | 55.80 | 93.00 |
| [61] | 2021 | National Taiwan University Hospital |
59 : 94 | benign vs malignant lymphadenopathy in ALN |
Ultrasound | Logistic regression SVM XGBoost DenseNet-121 |
71.90 66.01 69.93 81.05 |
54.24 52.54 50.84 81.36 |
82.98 74.47 80.85 80.85 |
| [62] | 2020 | Guangdong Provincial People’s Hospital |
134 : 214 | benign vs malignant lymphadenopathy in SLN |
CT | CNN-Fast | 67.70 | 82.50 | 58.40 |
| [63] | 2023 | Three hospitals in Zhejiang | 234 : 754 | benign vs malignant lymphadenopathy in SLN |
DCE-MRI | CNN - raw images Radiomics models |
89.20 82.60 |
75.50 60.00 |
88.30 54.40 |
| [64] | 2023 | Luzhou Medical College Affiliated Hospital |
400 : 400 | benign vs malignant lymphadenopathy in ALN |
CE-CT | DA-VGG19 | 90.88 | 95.00 | 86.75 |
| [65] | 2021 | Sun Yat-sen Hospital & Cancer Center |
328 : 475 | benign vs malignant lymphadenopathy in ALN |
DCE-MRI | SVM | 78.00 | 86.00 | 69.00 |
| [66] | 2020 | Two Affiliated Hospitals of Harbin Medical University |
821 : 263 | benign vs malignant lymphadenopathy in SLN and NSLN |
Ultrasound | DenseNet | 67.30 80.20 |
89.70 98.40 |
47.60 39.30 |
| [67] | 2022 | Two Affiliated Hospitals of Harbin Medical University |
94 : 109 | pN0 vs pN1 stage | PET | LASSO | 59.78 | 84.21 | 40.82 |
|
Acronyms: - artificial neural network; - Back Propogation Neural Network;
- contrast-enhanced CT;
- convolutional neural network; - deformable attention VGG19; - dynamic contrast-enhanced MRI; - deep convolutional neural network; - Dense Convolutional Network; - decision tree; - hybrid isomap and support vector machine; - k-Nearest Neighbour; - least absolute shrinkage and selection operator; - machine learning; - naive Bayes; - Radial basis function SVM - random forest; - sparse representation based classifier; - support vector machine; | |||||||||
Table 6.
Imaging models of machine learning in breast cancer
| Cite | Year | Database | Sample size | Classification | Imaging modality |
Classifier | Metrics, % | ||
|---|---|---|---|---|---|---|---|---|---|
| Accuracy | Sensitivity | Specificity | |||||||
| DETECTION OF MALIGNANT BREAST MASSES | |||||||||
| [28] | 2021 | MIAS [59] INbreast database [24] |
322 : 208 | benign vs malignant tumour |
Mammo- graphy |
AlexNet GoogLeNet Resnet50 Vgg19 |
88.66 91.97 87.12 91.16 |
83.40 87.83 80.52 91.16 |
96.52 97.60 95.63 97.66 |
| [30] | 2017 | Zhejiang Cancer Hospital |
66 : 77 | benign vs malignant tumour |
DCE-MRI | 2D CNN 3D CNN |
64.40 70.50 |
70.10 80.50 |
58.00 61.80 |
| IDENTIFICATION OF LYMPH NODE METASTASES | |||||||||
| [68] | 2020 | Tongji Hospital Hubei Cancer Hospital |
347 : 337 | benign vs malignant lymphadenopathy in ALN |
Ultrasound | Inception V3 InceptionResNetV2 V2 ResNet-101 |
80.00 82.00 78.00 |
82.00 80.00 78.00 |
79.00 85.00 79.00 |
| [69] | 2022 | Breast Imaging Section Columbia University Medical Center |
105 : 64 | benign vs malignant lymphadenopathy in ALN |
Ultrasound | CNN | 72.60 | 65.50 | 78.90 |
|
Acronyms: - axillary lymph node;
- convolutional neural network;
- dynamic contrast-enhanced MRI; - Mammographic Image Analysis Society | |||||||||
Table 7.
Performance of machine learning for detecting molecular subtypes of breast cancer
| Cite | Year | Database | Sample size | Classification | Imaging modality |
Classifier | Metrics, % | ||
|---|---|---|---|---|---|---|---|---|---|
| Accuracy | Sensitivity | Specificity | |||||||
| [70] | 2020 | Severance Hospital | TN: 62 HER2: 59 luminal: 100 |
TN vs. non-TN HER2 vs. non-HER2 luminal vs. non-luminal |
DBT | N/A | 80.30 70.4 50.70 |
83.30 11.10 44.00 |
79.70 79.00 66.70 |
| [71] | 2024 | Third Affiliated Hospital of Soochow University Fudan University Shanghai Cancer Center |
TN: 55 HER2: 55 luminal: 276 |
TN vs. non-TN HER2 vs. non-HER2 luminal vs. non-luminal |
contrast-enhanced mammography |
SVM | 75.00 83.00 72.00 |
50.00 38.00 75.00 |
78.00 98.00 67.00 |
| [72] | 2022 | First Affiliated Hospital of Soochow University Suzhou Municipal Hospital |
TN: 65 : 254 | TN vs. non-TN | mammography | Binary logistic backward stepwise regression |
80.60 | 72.00 | 80.70 |
| [73] | 2021 | Tianjin Medical University Cancer Institute and Hospital |
TN: 41 HER2: 45 LABC: 20 LBBC(HER2-): 106 LBBC(HER2+): 61 |
TN vs. Non-TN HER2 + vs. HER2 - Luminal vs. Non-Luminal |
18 F-FDG PET/CT | N/A | 89.30 84.70 86.40 |
93.30 90.80 80.10 |
83.90 76.40 90.50 |
| [74] | 2019 | Henan Provincial People’s Hospital |
HER2+: 227 HER2-:79 |
HER2 + vs. HER2 - | mammography | SVM logistic regression |
73.00 77.00 |
60.86 73.91 |
68.75 68.75 |
Disclaimer/Publisher’s Note: The statements, opinions and data contained in all publications are solely those of the individual author(s) and contributor(s) and not of MDPI and/or the editor(s). MDPI and/or the editor(s) disclaim responsibility for any injury to people or property resulting from any ideas, methods, instructions or products referred to in the content. |
© 2026 by the authors. Licensee MDPI, Basel, Switzerland. This article is an open access article distributed under the terms and conditions of the Creative Commons Attribution (CC BY) license (http://creativecommons.org/licenses/by/4.0/).
Copyright: This open access article is published under a Creative Commons CC BY 4.0 license, which permit the free download, distribution, and reuse, provided that the author and preprint are cited in any reuse.


