
Submitted:
01 January 2026
Posted:
04 January 2026
You are already at the latest version
Abstract
The surface properties and electrical behavior of carbon-based materials can be effectively tailored by energetic ion irradiation. In this study, graphene oxide (GO), cyclic olefin copolymer foils (COC, Topas 112 and 011, respectively) were irradiated with 1 MeV Au ions using a 3 MV Tandetron accelerator at fluences of 1 × 10¹⁴, 1 × 10¹⁵, and 2.5 × 10¹⁵ ions/cm2. The irradiation induced systematic modifications in surface chemistry, morphology, wettability, and electrical properties. Compositional changes before and after irradiation were investigated using Rutherford backscattering spectrometry (RBS) and elastic recoil detection analysis (ERDA), while surface morphology and roughness were characterized by atomic force microscopy (AFM), revealing a clear fluence-dependent evolution of nanoscale topography. The vibrational characteristics will be assessed through Raman spectroscopy. Surface wettability was evaluated by static contact angle measurements, and surface free energy was determined using the Owens–Wendt–Rabel–Kaelble (OWRK) method, showing a consistent decrease in water contact angle and an increase in surface free energy with increasing ion fluence in Topas 112/011 but not in GO. Electrical characterization demonstrated a pronounced fluence-dependent decrease in sheet resistivity across all investigated substrates. The results show that 1 MeV Au-ion irradiation enables controlled modification of both surface and electrical properties of carbon-based foils.
Keywords:
graphene oxide
; cyclic olefin copolymer
; gold ion implantation
; electrical and surface properties
1. Introduction
Polymeric and carbon-based thin foils are widely employed in modern optoelectronics [1], biosensing [2] and flexible devices [3] due to their unique combination of mechanical, chemical, and electrical properties. Polymers are very well applied in tissue engineering due to a wide range of physical, mechanical, and chemical properties, cytocompatibility, microstructure, and biodegradability [4,5]. COC, including Topas 112 and Topas 011 foils, are chemically inert, optically transparent, and mechanically robust, but their intrinsically insulating nature limits their direct use in electronic applications without surface modification [6,7]. GO has attracted significant attention because of its tuneable electrical conductivity, large surface area, and chemical versatility, which can be adjusted through reduction or functionalization processes [8].
Surface and bulk properties of these materials can be systematically tuned using external treatments, such as chemical functionalization [9], plasma exposure [7,10,11], or energetic-ion irradiation [12], or doping [6,13]. High-energy ion irradiation provides a unique pathway to simultaneously modify surface chemistry, morphology, and electrical properties in a controlled manner. Irradiation with MeV-range ions can induce a variety of physical and chemical processes, including chain scission, cross-linking, local densification, and sputtering, which in turn influence surface roughness, polarity, and electronic conductivity [6,8]. Ion irradiation can convert insulating polymer regions into partially conductive domains through mechanisms such as carbonization or formation of sp2-rich networks, while also altering wettability via the introduction of polar functional groups [6,8].
Previous studies have demonstrated that COC foils undergo significant surface and subsurface modifications under high-energy irradiation, which can gradually adjust surface energy and electrical properties [6,7]. GO responds sensitively to energetic ion exposure, with partial reduction and reorganization of the carbon lattice resulting in enhanced electrical conductivity and modified surface chemistry [8].
A detailed understanding of the interplay between ion fluence, nanoscale morphology, surface polarity, and electrical behavior is crucial for rational design of functional materials. Surface roughness, for instance, can influence not only wettability [14] but also charge transport [15] and adhesion characteristics [16], while chemical modifications can create new active sites or conductive pathways. Therefore, characterizing both surface and bulk responses to controlled-ion irradiation is essential to optimize performance in electronic, optoelectronic, and flexible device contexts.
This work offers the relationship between irradiation parameters, surface evolution, and electrical properties, offering insights into the controlled engineering of polymeric and carbon-based foils for advanced functional applications. We investigate the effects of 1 MeV Au-ion irradiation on COC and GO foils over a range of fluences (1 × 10¹⁴, 1 × 10¹⁵, and 2.5 × 10¹⁵ ions cm-2). We combine compositional analysis using Rutherford backscattering spectrometry (RBS) and elastic recoil detection analysis (ERDA) with surface characterization via atomic force microscopy (AFM) and wettability measurements, and Raman spectroscopy. Electrical behavior is evaluated through sheet resistivity measurements, providing a comprehensive view of irradiation-induced modifications.
2. Materials and Methods
2.1. Materials
The Topas substrates were used for ion irradiation and subsequent testing of functional properties: mcs-foil 112 with a thickness of 175 µm and a glass transition temperature (Tg) of 142 °C, corresponding to Topas grade 6015 with a norbornene content of 52–57%; and mcs-foil 011 with a thickness of 140 µm and a Tg of 78 °C, corresponding to Topas grade 8007 with a norbornene content of 35–45%. Both substrates were supplied by ChipShop (Germany) [17].
GO was synthesized by permanganate oxidation of graphite [18]. Three grams of graphite was mixed with H2SO4/H3PO4 (360/40 mL), followed by 18 g KMnO4 and heating at 50 °C for 12 h. The reaction was quenched with ice (400 g) and H2O2 (20 mL), and GO was collected by centrifugation. GO foils were prepared by suction filtration using a poly carbonate membrane (Nucleopore 0.45 μm/90-mm diameter) and 10 mL of GO aqueous suspension with a concentration of 6.7 mg mL−1.
2.2. Analytical Methods
RBS and ERDA were employed for the compositional study of the foils before and after the ion irradiation with the ion fluences of 1 × 10¹⁴, 1 × 10¹⁵, and 2.5 × 1015 cm-2. The RBS spectra were collected using a beam of 2.0 MeV He+ ions (in the remainder of the article, the ion will be referred to without specifying its charge state). An Ultra-Ortec PIPS detector recorded the He ions backscattered at a laboratory scattering angle of 170°. The ERDA spectra were measured using 2 MeV He ions, with the primary beam coming at an angle of 75° with respect to the substrate surface normal and with hydrogen atoms recoiled at a scattering angle of 30° registered with the PIPS detector covered by a 12 µm Mylar foil. To reduce the effects of the sample degradation during the RBS/ERDA analysis, several spectra were measured on different beam spots on the sample surface, and the final spectrum was obtained by summing the individual spectra. RBS/ERDA spectra were evaluated by SIMNRA code [19].
Surface morphology and roughness were analyzed by AFM (XploRA PLUS, Horiba Jobin Yvon, France) in tapping mode using HQ:NSC14 probes with an aluminium reflective coating (spring constant 5 N.m⁻¹) under ambient conditions at room temperature. The data were analysed using free software Gwyddion version 2.69. Raman spectroscopy was carried out also same system using a confocal Raman microscope (XploRA PLUS, Horiba Jobin Yvon, France) equipped with a laser excitation source (632 nm), under ambient conditions at room temperature.
Electrical properties of the pristine and irradiated foils were studied by the standard 2-point method using the Keithley 6221 current source and Keithley 2128A nanovoltmeter. For the electrical resistance measurement, Au contacts (50 nm thick) with relative distance 1 mm were sputtered on the surface of foils. For more details see our previous study [20].
Surface wettability was evaluated by static contact angle measurements using the sessile drop method (DSA30, Krüss, Germany) at 22–24 °C (±0.1°). A 2 µL drop of deionized water or diiodomethane was deposited at 2 µL min-1, and contact angles were recorded after 10 s of stabilization. Each sample was measured four times. Contact angles were calculated using Advance software with an Ellipse (tangent-1) fit and automatic or manual baseline.
SFE was calculated in Advance software employing the OWRK method from the contact angles of two liquids: water as polar and diiodomethane (CH2I2) as non-polar. This model considers the surface tension from the viewpoint of the polar and dispersive components [21,22]. In total, eight values from each liquid were used to calculate the surface free energy.
2.3. Ion Beam Implantation and Simulation
Topas 112/011 and GO thin foils were irradiated with 1 MeV Au ions in the implantation chamber of the 3 MV Tandetron MC-4130 accelerator at the Nuclear Physics Institute of the Czech Academy of Sciences. Irradiation was performed at ion current densities of 7–10 nA cm−2 and ion fluences of 1 × 10¹⁴, 1 × 10¹⁵, and 2.5 × 1015 cm−2. The chamber was evacuated to a base pressure of approximately 6.9 × 10⁻⁶ mbar.
The projected ranges (RP) and the range straggling (ΔRP) extracted from the measured depth profiles are presented as well and compared with the corresponding SRIM [23]. The calculations were performed using a full cascade Monte Carlo simulation, with the initial material composition taken from RBS analysis of the real samples. Energy loss of incident ions occurs through electronic and nuclear stopping, which together drive irradiation-induced substrate modifications. Electronic stopping primarily induces ionization and electronic excitation, whereas nuclear stopping causes atomic displacements and bond rupture [24]. Both processes degrade the host matrix via chain scission, free-radical cross-linking, and bond conjugation. Dominant electronic stopping favors dehydrogenation and formation of low-mass fragments, while nuclear stopping promotes degassing and carbonization [25]. Electronic (Se) and nuclear stopping (Sn) powers as well as Rp and (ΔRP) for Topas 112/011, and GO are shown in Table 1.
For all investigated materials, the nuclear stopping power dominates over electronic stopping, as reflected by Se/Sn ratios ranging from 0.61 to 0.77. The highest relative contribution of nuclear stopping is observed for Topas 112 and Topas 011, indicating that interaction between ion and electron interactions play a major role in energy dissipation within these cyclic olefin copolymers. GO exhibits the lowest Se/Sn ratio, suggesting a comparatively stronger contribution of nuclear stopping, which is consistent with its higher atomic density and carbon-rich structure.
The projected ion ranges Rp decrease from Topas (421–422 nm) to GO (358 nm), reflecting differences in material density and elemental composition. Polyimide shows the shallowest penetration depth, consistent with its higher stopping efficiency. The longitudinal straggling ΔRp remains similar for Topas and GO (51 nm).
3. Results
3.1. RBS and ERDA, Au Depth Profiles
The elemental composition of pristine and ion-irradiated samples was analyzed using ion-beam spectroscopic techniques, namely RBS and ERDA, employing 2 MeV He ions. For polymers and graphene oxide, the effective information depth of RBS at this beam energy is approximately 1 µm, while ERDA provides a shallower probing depth of about 0.5 µm, making the two techniques complementary for compositional analysis [20]. RBS and ERDA spectra for pristine Topas 112 and 011 and samples irradiated with 1 MeV Au ions at fluences of 1 × 10¹⁴, 1 × 10¹⁵, and 2.5 × 1015 cm−2 are shown in Figure 1. The experimental spectrum was evaluated using SIMNRA simulations, enabling quantitative determination of elemental composition and depth distributions.
In addition, Au depth profiles were extracted from the 2 MeV RBS spectra and are presented in Figure 2, providing insight into the implantation depth and distribution of Au ions within the polymer matrix.
Figure 2a and Figure 2b show the experimental Au depth distributions in irradiated Topas 112/011 foils, respectively. For the lowest ion fluences, Au concentration profile exhibits a well-defined peak located at a depth corresponding to the projected range of 1 MeV Au ions, with a relatively symmetric distribution around the maximum. As the ion fluence increases, the peak intensity increases proportionally, accompanied by a gradual broadening of the profile, indicating increased ion straggling and accumulation effects. In the case of Topas 011 (Figure b), noticeable changes in the Au depth distribution are observed. The peak position shows a slight shift toward the surface, and the profiles become broader and more asymmetric, particularly at higher fluences. These effects suggest irradiation-induced modifications of the polymer matrix, including changes in density, enhanced damage accumulation, and possible surface recession due to sputtering. For Topas 112/011, the experimentally measured depth profiles are compared with SRIM simulations, which predict a narrower distribution. The deviations between experiment and simulation become more pronounced with increasing fluence, reflecting the limitations of static SRIM calculations in capturing fluence-dependent structural changes in polymer targets.
Figure 2c shows the experimental depth profiles of Au implanted into GO foils under identical irradiation conditions. Compared to polymer samples, Au in GO exhibits a shallower projected range and a pronounced asymmetry with an extended tail toward greater depths, reflecting GO’s higher density, layered structure, and compositional heterogeneity. Increasing ion fluence leads to higher Au concentrations and broadening of the profiles, indicative of enhanced defect formation, ion-beam-induced mixing, and local structural rearrangements. At the highest fluences, the profiles shift deeper and deviate from Gaussian behavior, developing pronounced shoulders at both shallow and deep regions, consistent with Au permeation previously observed in bulk GO and other materials [26]. Comparison with SRIM simulations reveals systematic discrepancies, with experimental profiles being broader and shifted relative to the simulated distributions.
Table 2 summarizes the elemental composition of pristine and Au-ion-irradiated Topas 112/011 and GO foils as determined by combined RBS and ERDA analyses. These techniques provide complementary information on the concentration of all elements (C, O, N and H), enabling a comprehensive evaluation of irradiation-induced compositional changes.
* Due to sample damage, we do not provide this data.
For pristine Topas 112 and Topas 011 foils, elemental compositions align with their nominal polymer structures, dominated by carbon and hydrogen with minor oxygen and nitrogen. Irradiation with 1 MeV Au ions induces pronounced, fluence-dependent compositional changes. In both polymers, increasing fluence systematically raises the carbon content while reducing hydrogen, reflected in a monotonic increase of the C/H ratio, indicative of progressive hydrogen depletion. This behavior is characteristic of ion-beam-induced dehydrogenation, driven by hydrogen’s low displacement energy and high mobility.
Oxygen exhibits non-monotonic evolution: initially increasing at low fluences, then stabilizing or slightly decreasing at higher fluences, likely due to competing irradiation-induced oxidation from residual atmosphere and oxygen loss via bond scission and sputtering. Nitrogen content remains low but rises at intermediate fluences, particularly in Topas 112, suggesting radiation-enhanced incorporation or redistribution. The increasing C/O ratio with fluence supports carbon enrichment of the polymer matrix, associated with chain scission, cross-linking, and formation of carbon-rich structures. These trends are consistent with structural transformations inferred from depth-profile and spectroscopic analyses.
Pristine GO is different, with higher oxygen content and larger C/O ratio reflecting its oxidized layered structure. Au ion irradiation moderately increases carbon while strongly decreasing oxygen, resulting in a substantial rise in the C/O ratio, indicative of irradiation-induced reduction via preferential oxygen removal. Hydrogen content in GO is low and largely unaffected, suggesting hydrogen-related processes are less significant. The observed compositional evolution correlates with defect generation, partial restoration of sp2 carbon networks, and structural rearrangements. At the highest fluence (2.5×1015 cm-2), severe structural damage and partial material removal hinder accurate RBS/ERDA quantification.
RBS and ERDA reveal material-dependent responses to Au ion irradiation, where Topas polymers undergo dehydrogenation and carbon enrichment linked to degradation and cross-linking, while GO experiences pronounced oxygen depletion consistent with reduction and structural transformation. The oxygen increase in polymers may also reflect oxidation after irradiation. The pristine Topas structure is dominated by C–C (3.4 eV) and C–H (4.3 eV) bonds [27], much weaker than the 1 MeV ion energy, which primarily induces electronic stopping-driven bond scission [20,25]. Hydrogen loss results from macromolecular cleavage and free-radical formation, while oxygen incorporation enhances hydrophilicity of the irradiated polymers [27].
3.2. Surface Morphology
AFM was employed to evaluate the evolution of surface topography in Topas 112, Topas 011, and GO substrates subjected to 1 MeV Au ion irradiation at fluences of 1×10¹⁴, 1×10¹⁵ and 2.5×1015 cm-2. For all materials, both the arithmetic roughness (Ra) and the root-mean-square roughness (RMS) were extracted from 2 × 2 μm2 scans to quantify irradiation-induced morphological modifications (see Figure 2 for Topas 011) and are collected in Table 2.
Figure 3.
Surface morphology measured by AFM. Representative 2D images (2×2 µm) of TOPAS 011 foils pristine (a) and modified by 1 MeV Au ions with fluences of 1×10¹⁴ (b), 1×10¹⁵ (c) and 2.5 × 1015 cm−2 (d).
Figure 3.
Surface morphology measured by AFM. Representative 2D images (2×2 µm) of TOPAS 011 foils pristine (a) and modified by 1 MeV Au ions with fluences of 1×10¹⁴ (b), 1×10¹⁵ (c) and 2.5 × 1015 cm−2 (d).
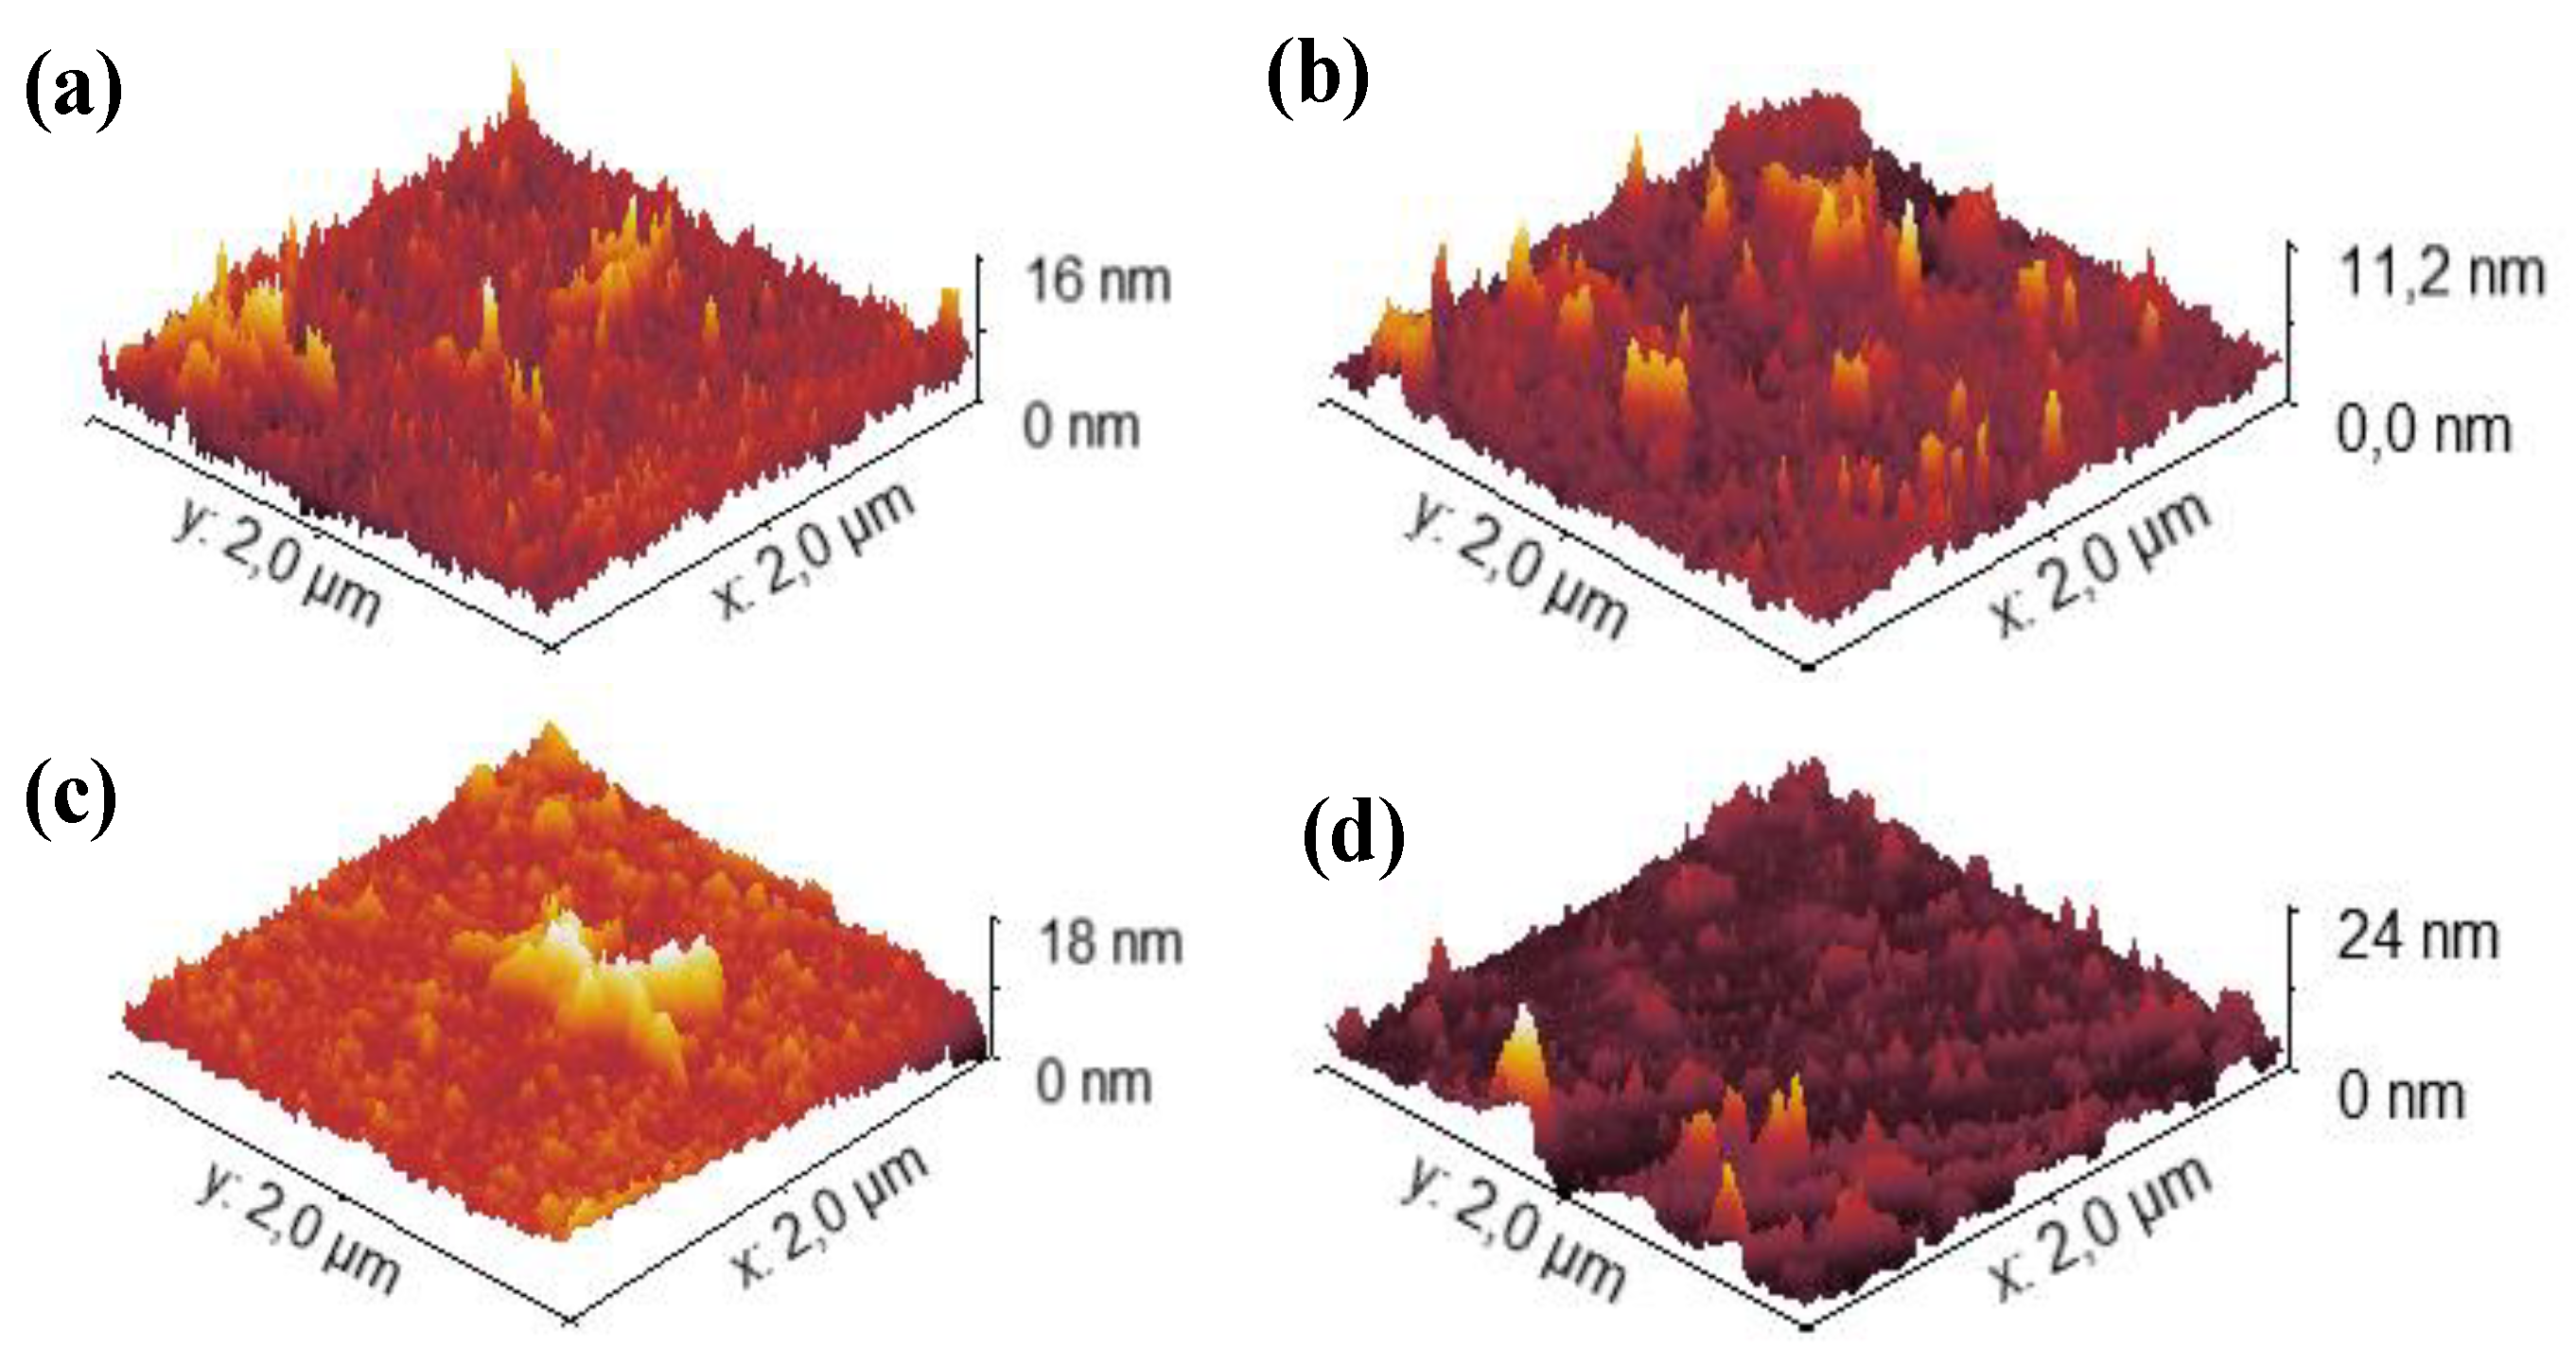
For the unirradiated Topas 112 foils, the pristine surface exhibited an Ra of 1.20 nm and an RMS of 1.35 nm. Upon increasing ion fluence, both roughness metrics decreased markedly, achieving minimum values of 0.30 nm (Ra) and 0.39 nm (RMS) at 1 × 1014 cm−2, and remaining below pristine levels at higher fluences (Ra ≈ 0.71–0.75 nm, RMS ≈ 1.06–1.07 nm), indicating smoothing of the surface likely due to ion-induced densification and defect annealing effects. Similarly, Topas 011 foils demonstrated a reduction in Ra from 1.19 nm to as low as 0.72 nm, with corresponding RMS values decreasing from 1.45 nm to 1.03 nm at the lowest studied fluence, and partial recovery at higher fluences.

Table 3.
Ra and RMS of TOPAS 112 and 011 and GO foils irradiated by 1MeV Au ions with fluences in the range of 1 × 10¹⁴ - 2.5 × 1015 cm-2.
Table 3.
Ra and RMS of TOPAS 112 and 011 and GO foils irradiated by 1MeV Au ions with fluences in the range of 1 × 10¹⁴ - 2.5 × 1015 cm-2.
| Material | Ion Fluence [Au/cm2] | Ra [nm] |
RMS [nm] |
|---|---|---|---|
| Topas 112 | pristine | 1.20 | 1.35 |
| 1x10¹⁴ | 0.30 | 0.39 | |
| 1x10¹⁵ | 0.71 | 1.07 | |
| 2.5x10¹⁵ | 0.75 | 1.06 | |
| Topas 011 | pristine | 1.19 | 1.45 |
| 1x10¹⁴ | 0.72 | 1.03 | |
| 1x10¹⁵ | 1.04 | 1.52 | |
| 2.5x10¹⁵ | 1.24 | 1.80 | |
| GO | pristine | 20.06 | 23.94 |
| 1x10¹⁴ | 26.33 | 32.91 | |
| 1x10¹⁵ | 24.85 | 28.93 | |
| 2.5x10¹⁵ | 16.53 | 20.04 |
GO foils had substantially higher initial roughness (Ra ≈ 20 nm, RMS ≈ 24 nm) that increased slightly at 1 × 1014 cm−2 (Ra ≈ 26–24 nm, RMS ≈ 32–29 nm) before decreasing at the highest fluence (Ra ≈ 16.5 nm, RMS ≈ 20.0 nm).
3.3. Raman Measurement
Raman spectroscopy provides a detailed analysis of structural changes caused by gold beam irradiation. The spectra exhibit the characteristic features of sp2-hybridized carbon materials, notably the D, G, and 2D bands, along with several additional fitted peaks D′′, D**, D+D′′, D′, D+D′ and 2D′. These peaks were deconvoluted through multi-peak fitting (Lorentzian function was used for this purpose see Figure 4d), providing deeper insight into the disorder, stacking order, and complexity of the carbon structures.
The D′′ band (~1230 cm-1) is a minor feature typical of amorphous carbon. The D peak (~1350 cm-1) arises from breathing modes of six-membered rings and requires defects for activation [28]. The D** feature (~1450 cm-1) is associated with amorphous carbon or edge-related vibrations [29]. The G peak (~1580 cm-1) corresponds to the E2g high-frequency phonon and is present in all carbon materials containing sp2 bonding [30]. A second peak is found very close to the G band, but slightly upshifted (about 1620 cm-1). It is D′ peak due to an intravalley double-resonance process, linking points within the same cone near K (or K′) [31].
At higher Raman shifts, second order and combination modes appear. The D+D′′ band (~2580 cm⁻¹) represents a second-order combination mode of graphitic carbon, providing a characteristic signature of sp2 hybridized structures and their disorder. The 2D band (~2700 cm-1) is the overtone of the D peak, arising from second-order zone-boundary phonons. These phonons are Raman inactive in first-order spectra of defect-free graphite, appearing only through double-resonance processes [32].
The D+D′ band (2850-3000 cm-1) arises from a two-phonon defect-assisted scattering process, involving one phonon near the K point (D) and another near the Γ point (D′). The presence of a defect enables the necessary momentum relaxation, allowing both phonons to participate in the double-resonance process [31]. The band centre frequency differs from the simple sum of the positions of D and D′ peaks. The 2D′ band (~3200 cm-1) is the overtone of the D′. Both the 2D and 2D′ bands arise from defect-independent double-resonance processes involving two phonons with opposite momenta, which satisfy momentum conservation, making these overtones intrinsic features of sp2 carbon systems [31]. The D band is defect-activated, with ID/IG reflecting structural disorder. The 2D band, a second-order overtone, is sensitive to graphene thickness and stacking. The I2D/IG ratio is commonly used to estimate the number of graphene layers: monolayer graphene exhibits I2D/IG>1.4, bilayer graphene ranges from 0.75–1.4, and multilayer graphene is below 0.75 [33].
The pristine Topas 112 and 011 Raman spectrum as well as Topas 011 irradiated with the low fluence is overwhelmed by a high fluorescence background and are not shown here. The Raman spectra of irradiated Topas 112 and 011 show several peaks originating from polymeric structures (see Figure 4a for Au 1×1014 cm-2 and Figure 4b for Au 1×1015 cm-2). The strong bands observed at 750, 890, and 930 cm-1 correspond to norbornene units in COC. In the COC spectrum, the bands at 750 and 930 cm-1 are assigned to ring vibrational modes of the COC molecules, while the ring breathing mode is observed at 889 cm-1 in the Raman spectrum. The Raman peaks at 1225 and 1311 cm-1 are attributed to the twisting modes of the CH2 groups in COC. C-H symmetric stretching is observed between 2800–3100 cm−1 [34,35]. After gold implantation, the D and G peaks become prominent in the Topas 112 and 011 spectra, replacing the spectral features of the pristine polymers. This evolution indicates amorphization and partial carbonization of the irradiated structure, which contributes to the observed changes in electrical properties.
The most prominent peaks are also the D and G peaks in all Raman spectra of GO (Figure 4c). The decrease in D-peak intensity and the increase of the 1450 cm-1 peak after gold irradiation become more pronounced with lower ion fluence. The reduction in the D peak reflects the loss of epoxide and hydroxyl groups in GO, while the diminishing multiple features between 2400 and 3200 cm-1 indicate the growth of sp2 domains [20,36], which was also reflected by RBS. After irradiation with 1×10¹⁵ and 2.5×1015 cm-2, D peak increased again. The D peak growth is caused by the formation of non-six-carbon rings [37].
In pristine GO, the ID/IG ratio is 1.16, reflecting a high level of disorder due to oxygen-containing functional groups. After gold irradiation, the ID/IG ratio first decreases to 0.81 at a low fluence of 1×1014 cm-2, indicating that initial irradiation partially removes epoxide and hydroxyl groups, restoring sp² domains and reducing disorder. At higher fluences, ID/IG increases to 0.98 (1×1015 cm-2) and 1.11 (2.5×1015 cm-2) as continued ion impacts create new defects, increasing lattice disorder. The 2D peak steadily decreases with fluence, reflecting the progressive disruption of long-range sp2 order despite the partial reduction of oxygen groups.
3.3. Wettability, Surface Energy and Electrical Properties
Figure 5 summarizes the evolution of the water contact angle (Figure 5a) and surface free energy (SFE, Figure 5b) for Topas 112, Topas 011, and GO foils subjected to ion irradiation at fluences of 1×10¹⁴, 1×10¹⁵ and 2.5×1015 cm-2. For all investigated materials, ion-beam treatment induces a systematic modification of the surface wettability. For Topas 112/011, the pristine samples exhibit contact angles with 100 ± 2° and 101 ± 2°, consistent with their intrinsically hydrophobic character. Upon irradiation, a gradual decrease in contact angle is observed, with the most pronounced reduction at the highest fluence.
Topas 112 and Topas 011 show statistically significant reductions across all fluence levels, with contact angle decreases of up to ~10° at 2.5×1015 cm-2. GO exhibits a opposite and more pronounced response, likely reflecting its higher chemical sensitivity to irradiation-driven structural rearrangements. GO is hydrophilic; during the production process, oxygen-containing functional groups such as -OH and -COOH are attached to the surface and edges of the graphene layers. After gold ion beam irradiation, the surface of the GO is more hydrophobic.
The OWKR method was used to calculate SFE. The corresponding SFE values (Figure 5b) increase consistently with fluence for Topas 112/011. The SFE of pristine TOPAS 112 and 011 was 32±2 and 31±1 mN m−1, respectively, classifying them as low-energy polymers, like PTFE, PDMS, and polypropylene, which typically exhibit SFE in the range of 18–30 mN m-1 [6]. The most notable enhancement is observed for Topas 011, where the SFE rises from ~31 mN m-1 (pristine) to nearly 40 mN m-1 (2.5×1015 cm-2). The observed increase in SFE indicates that the gold ions successfully functionalize both Topas. This interaction is primarily responsible for transforming the material’s naturally hydrophobic character into a significantly more hydrophilic surface.
3.4. The Electrical Properties
Figure 6 shows the evolution of the sheet resistivity of Topas 112/011, and GO foils implanted with 1 MeV Au ions with different ion fluences. All pristine samples exhibit significant differences in their initial resistivity, reflecting their distinct polymeric or carbon-based structures. Upon ion implantation, however, all materials show a clear decrease in sheet resistivity, demonstrating that Au-ion irradiation effectively enhances their electrical conductivity.
Topas 112 and Topas 011 exhibit higher initial resistivity and a more moderate conductivity enhancement compared to GO. Both polymeric materials show a monotonic decrease with increasing fluence, confirming that even chemically inert cyclic olefin copolymers undergo sufficient structural modification under 1 MeV Au-ion bombardment to facilitate charge transport. Compared to Topas 112 and 011, GO exhibits a relatively monotonic behaviour with a slight decrease in sheet resistivity after irradiation.
5. Conclusions
Au ion irradiation induces material-dependent modifications in polymeric Topas (112 and 011) and GO foils. In Topas, irradiation causes dehydrogenation, carbon enrichment, chain scission, cross-linking, and partial amorphization, as evidenced by D and G Raman bands, surface smoothing, increased surface free energy, and reduced water contact angles in Topas 112/011. Oxygen and nitrogen contents show non-monotonic evolution, reflecting competing oxidation and bond scission processes. In GO, irradiation preferentially removes oxygen, partially restores sp2 domains at low fluences, and generates defects and lattice disorder at higher fluences, with concomitant increase in hydrophobicity. AFM measurements indicate surface roughness decreases in polymers and evolves moderately in GO. Sheet resistivity decreases in all materials, with Topas showing moderate enhancement and GO a relatively monotonic reduction. These results demonstrate that Au ion implantation modifies chemical composition, structure, surface wettability, and electrical properties, with the extent and nature of changes strongly dependent on material type and ion fluence.
Author Contributions
Conceptualization, R.M (Romana Mikšová) and P.M (Petr Malinský).; methodology, P.M.; software, R.M.; validation, R.M., J.N. (Josef Novák) and P.A (Petr Aubrecht).; ion beam implantation, P.M and J.N.; RBS, P.M and R.M.; AFM, J.N. and R.M.; Raman spectroscopy, J.N and R.M.; Electrical properties, J.N.; surface wettability characterization, P.A.; writing—original draft preparation, R.M.; writing—review and editing, P.M.; visualization, R.M.; authors have read and agreed to the published version of the manuscript.
Institutional Review Board Statement
Not applicable.
Data Availability Statement
All data for this paper are mentioned in Zenodo https://doi.org/10.5281/zenodo.18093832.
Acknowledgments
Research has been carried out at the CANAM (Centre of Accelerators and Nuclear Analytical Methods) infrastructure LM 2015056. The scientific results were obtained with the support of the GACR Project No. 23-06702S and University of J. E. Purkyne project UJEP-SGS-2025-53-006-2. The authors acknowledge the assistance provided by the Advanced Multiscale Materials for Key Enabling Technologies project, supported by the Ministry of Education, Youth, and Sports of the Czech Republic. Project No. CZ.02.01.01/00/22_008/0004558, Co-funded by the European Union.”- AMULET project.
Conflicts of Interest
“The authors declare no conflicts of interest.”
References
- Kim, S.; Prasetio, A.; Han, J.W.; Kim, Y.; Shin, M.; Heo, J.; Kim, J.H.; Cho, S.; Kim, Y.H.; Jahandar, M.; et al. Enhanced Flexible Optoelectronic Devices by Controlling the Wettability of an Organic Bifacial Interlayer. Commun. Mater. 2021, 2, 26. [Google Scholar] [CrossRef]
- Altug, H.; Oh, S.-H.; Maier, S.A.; Homola, J. Advances and Applications of Nanophotonic Biosensors. Nat. Nanotechnol. 2022, 17, 5–16. [Google Scholar] [CrossRef]
- Li, L.; Han, L.; Hu, H.; Zhang, R. A Review on Polymers and Their Composites for Flexible Electronics. Mater. Adv. 2023, 4, 726–746. [Google Scholar] [CrossRef]
- Mazzola, L.; Bemporad, E.; Carassiti, F. Flame Treatment on Plastic: A New Surface Free Energy Statistical Prediction Model and Characterization of Treated Surfaces. Appl. Surf. Sci. 2011, 257, 2148–2158. [Google Scholar] [CrossRef]
- Gauvin, R.; Khademhosseini, A.; Guillemette, M.; Langer, R. Emerging Trends in Tissue Engineering. In Comprehensive Biotechnology; Elsevier, 2011; pp. 251–263. ISBN 978-0-08-088504-9. [Google Scholar]
- Aubrecht, P.; Malinský, P.; Novák, J.; Smejkal, J.; Jagerová, A.; Matoušek, J.; Štofik, M.; Liegertová, M.; Luxa, J.; Macková, A.; et al. Patterning of COC Polymers by Middle-Energy Ion Beams for Selective Cell Adhesion in Microfluidic Devices. Adv. Mater. Interfaces 2024, 11, 2301077. [Google Scholar] [CrossRef]
- Dawaymeh, F.; Abbas, Y.; Khaleel, M.; Alazzam, A.; Alamoodi, N. Tuning the Surface Wettability of Cyclic Olefin Copolymer by Plasma Treatment and Graphene Oxide Deposition and Reduction. Polymers 2021, 13, 2305. [Google Scholar] [CrossRef]
- Malinský, P.; Cutroneo, M.; Macková, A.; Hnatowicz, V.; Szökölová, K.; Bohačová, M.; Luxa, J.; Sofer, Z. Graphene Oxide Layers Modified by Irradiation with 1.0 MeV Au+ Ions. Surf. Interface Anal. 2018, 50, 1110–1115. [Google Scholar] [CrossRef]
- Price, E.K.; Bansala, T.; Achee, T.C.; Sun, W.; Green, M.J. Tunable Dispersibility and Wettability of Graphene Oxide through One-Pot Functionalization and Reduction. J. Colloid Interface Sci. 2019, 552, 771–780. [Google Scholar] [CrossRef] [PubMed]
- Lim, T.; Ju, S. Control of Graphene Surface Wettability by Using CF 4 Plasma. Surf. Coat. Technol. 2017, 328, 89–93. [Google Scholar] [CrossRef]
- Aktas, C.; Bhethanabotla, V.; Ayyala, R.S.; Sahiner, N. Modifying Wetting Properties of PI Film: The Impact of Surface Texturing and CF4 and O2 Plasma Treatment. Appl. Surf. Sci. 2024, 656, 159729. [Google Scholar] [CrossRef]
- Sun, P.; Zhu, M.; Ma, R.; Wang, K.; Wei, J.; Wu, D.; Sasaki, T.; Zhu, H. Graphene Oxide/Titania Hybrid Films with Dual-UV-Responsive Surfaces of Tunable Wettability. RSC Adv. 2012, 2, 10829. [Google Scholar] [CrossRef]
- Ashraf, A.; Wu, Y.; Wang, M.C.; Yong, K.; Sun, T.; Jing, Y.; Haasch, R.T.; Aluru, N.R.; Nam, S. Correction to Doping-Induced Tunable Wettability and Adhesion of Graphene. Nano Lett. 2016, 16, 5318. [Google Scholar] [CrossRef]
- Nakae, Hideo; Inui, Ryuichi; Hirata, Yosuke; Saito, Hiroyuki. Effects of Surface Roughness on Wettability. Acta Mater. 1998, 46, 2313–2318. [Google Scholar] [CrossRef]
- Reiss, G.; Brückl, H. The Influence of Surface Roughness on Electronic Transport in Thin Films. Surf. Sci. 1992, 269–270, 772–776. [Google Scholar] [CrossRef]
- Persson, B.N.J.; Scaraggi, M. Theory of Adhesion: Role of Surface Roughness. J. Chem. Phys. 2014, 141, 124701. [Google Scholar] [CrossRef]
- Agha, A.; Waheed, W.; Alamoodi, N.; Mathew, B.; Alnaimat, F.; Abu-Nada, E.; Abderrahmane, A.; Alazzam, A. A Review of Cyclic Olefin Copolymer Applications in Microfluidics and Microdevices. Macromol. Mater. Eng. 2022, 307, 2200053. [Google Scholar] [CrossRef]
- Jankovský, O.; Šimek, P.; Luxa, J.; Sedmidubský, D.; Tomandl, I.; Macková, A.; Mikšová, R.; Malinský, P.; Pumera, M.; Sofer, Z. Definitive Insight into the Graphite Oxide Reduction Mechanism by Deuterium Labeling. ChemPlusChem 2015, 80, 1399–1407. [Google Scholar] [CrossRef]
- Mayer, M. SIMNRA, a Simulation Program for the Analysis of NRA, RBS and ERDA. In Proceedings of the AIP Conference Proceedings; AIP: Denton, Texas (USA), 1999; pp. 541–544. [Google Scholar]
- Malinský, P.; Romanenko, O.; Havránek, V.; Cutroneo, M.; Novák, J.; Štěpanovská, E.; Mikšová, R.; Marvan, P.; Mazánek, V.; Sofer, Z.; et al. Graphene Oxide and Polymer Humidity Micro-Sensors Prepared by Carbon Beam Writing. Polymers 2023, 15, 1066. [Google Scholar] [CrossRef]
- Owens, D.K.; Wendt, R.C. Estimation of the Surface Free Energy of Polymers. J. Appl. Polym. Sci. 1969, 13, 1741–1747. [Google Scholar] [CrossRef]
- Kaelble, D.H.; Uy, K.C. A Reinterpretation of Organic Liquid-Polytetrafluoroethylene Surface Interactions. J. Adhes. 1970, 2, 50–60. [Google Scholar] [CrossRef]
- Ziegler, J.F.; Ziegler, M.D.; Biersack, J.P. SRIM – The Stopping and Range of Ions in Matter (2010). Nucl. Instrum. Methods Phys. Res. Sect. B Beam Interact. Mater. At. 2010, 268, 1818–1823. [Google Scholar] [CrossRef]
- Nastasi, M. Ion Beam Analysis: Fundamentals and Applications; Nastasi, M., Mayer, J.W., Wang, Y., Eds.; Online-Ausg.; CRC Press: Boca Raton, Florida, 2015; ISBN 978-1-4398-4638-4. [Google Scholar]
- Popok, V.N. Ion Implantation of Polymers: Formation of Nanoparticulate Materials. Rev Adv Mater Sci 2012, 30, 1–26. [Google Scholar]
- Ogata, C.; Koinuma, M.; Hatakeyama, K.; Tateishi, H.; Asrori, M.Z.; Taniguchi, T.; Funatsu, A.; Matsumoto, Y. Metal Permeation into Multi-Layered Graphene Oxide. Sci. Rep. 2014, 4, 3647. [Google Scholar] [CrossRef]
- Guan, Y.; Zhang, H.; Yan, Z.; Wei, X.; Zhang, Z.; Chen, X. Surface Modification of Cyclic-Olefin-Copolymer (COC)-Based Microchannels for the Large-Scale Industrial Production of Droplet Microfluidic Devices. Bioengineering 2023, 10, 763. [Google Scholar] [CrossRef]
- Tuinstra, F.; Koenig, J.L. Raman Spectrum of Graphite. J. Chem. Phys. 1970, 53, 1126–1130. [Google Scholar] [CrossRef]
- Ferrari, A.C.; Robertson, J. Interpretation of Raman Spectra of Disordered and Amorphous Carbon. Phys. Rev. B 2000, 61, 14095–14107. [Google Scholar] [CrossRef]
- Bleu, Y.; Bourquard, F.; Gartiser, V.; Loir, A.-S.; Caja-Munoz, B.; Avila, J.; Barnier, V.; Garrelie, F.; Donnet, C. Graphene Synthesis on SiO2 Using Pulsed Laser Deposition with Bilayer Predominance. Mater. Chem. Phys. 2019, 238, 121905. [Google Scholar] [CrossRef]
- Ferrari, A.C.; Basko, D.M. Raman Spectroscopy as a Versatile Tool for Studying the Properties of Graphene. Nat. Nanotechnol. 2013, 8, 235–246. [Google Scholar] [CrossRef] [PubMed]
- Nemanich, R.J.; Solin, S.A. First- and Second-Order Raman Scattering from Finite-Size Crystals of Graphite. Phys. Rev. B 1979, 20, 392–401. [Google Scholar] [CrossRef]
- Xiong, W.; Zhou, Y.S.; Jiang, L.J.; Sarkar, A.; Mahjouri-Samani, M.; Xie, Z.Q.; Gao, Y.; Ianno, N.J.; Jiang, L.; Lu, Y.F. Single-Step Formation of Graphene on Dielectric Surfaces. Adv. Mater. 2013, 25, 630–634. [Google Scholar] [CrossRef]
- Long, D.A. Infrared and Raman Characteristic Group Frequencies. Tables and Charts George Socrates John Wiley and Sons, Ltd, Chichester, Third Edition, 2001. Price £135. J. Raman Spectrosc. 2004, 35, 905. [Google Scholar] [CrossRef]
- Forsyth, J.; Pereña, J.M.; Benavente, R.; Pérez, E.; Tritto, I.; Boggioni, L.; Brintzinger, H.-H. Influence of the Polymer Microstructure on the Thermal Properties of Cycloolefin Copolymers with High Norbornene Contents. Macromol. Chem. Phys. 2001, 202, 614–620. [Google Scholar] [CrossRef]
- Ambrosi, A.; Bonanni, A.; Sofer, Z.; Cross, J.S.; Pumera, M. Electrochemistry at Chemically Modified Graphenes. Chem. – Eur. J. 2011, 17, 10763–10770. [Google Scholar] [CrossRef]
- Arif, S.; Rafique, M.S.; Saleemi, F.; Sagheer, R.; Naab, F.; Toader, O.; Mahmood, A.; Rashid, R.; Mahmood, M. Influence of 400 keV Carbon Ion Implantation on Structural, Optical and Electrical Properties of PMMA. Nucl. Instrum. Methods Phys. Res. Sect. B Beam Interact. Mater. At. 2015, 358, 236–244. [Google Scholar] [CrossRef]
Figure 1.
The RBS experimental spectra (symbols) together with the corresponding SIMNRA-simulated spectra (solid lines) for pristine and 1 MeV Au-ion–irradiated Topas 011 (a) and Topas 112 (c). The experimental ERDA spectra (symbols) and the corresponding SIMNRA simulations (solid lines) for the Topas 011 (b) and Topas 112 (d), irradiated at fluences ranging from 1 × 10¹⁴ to 2.5 × 1015 cm-2.
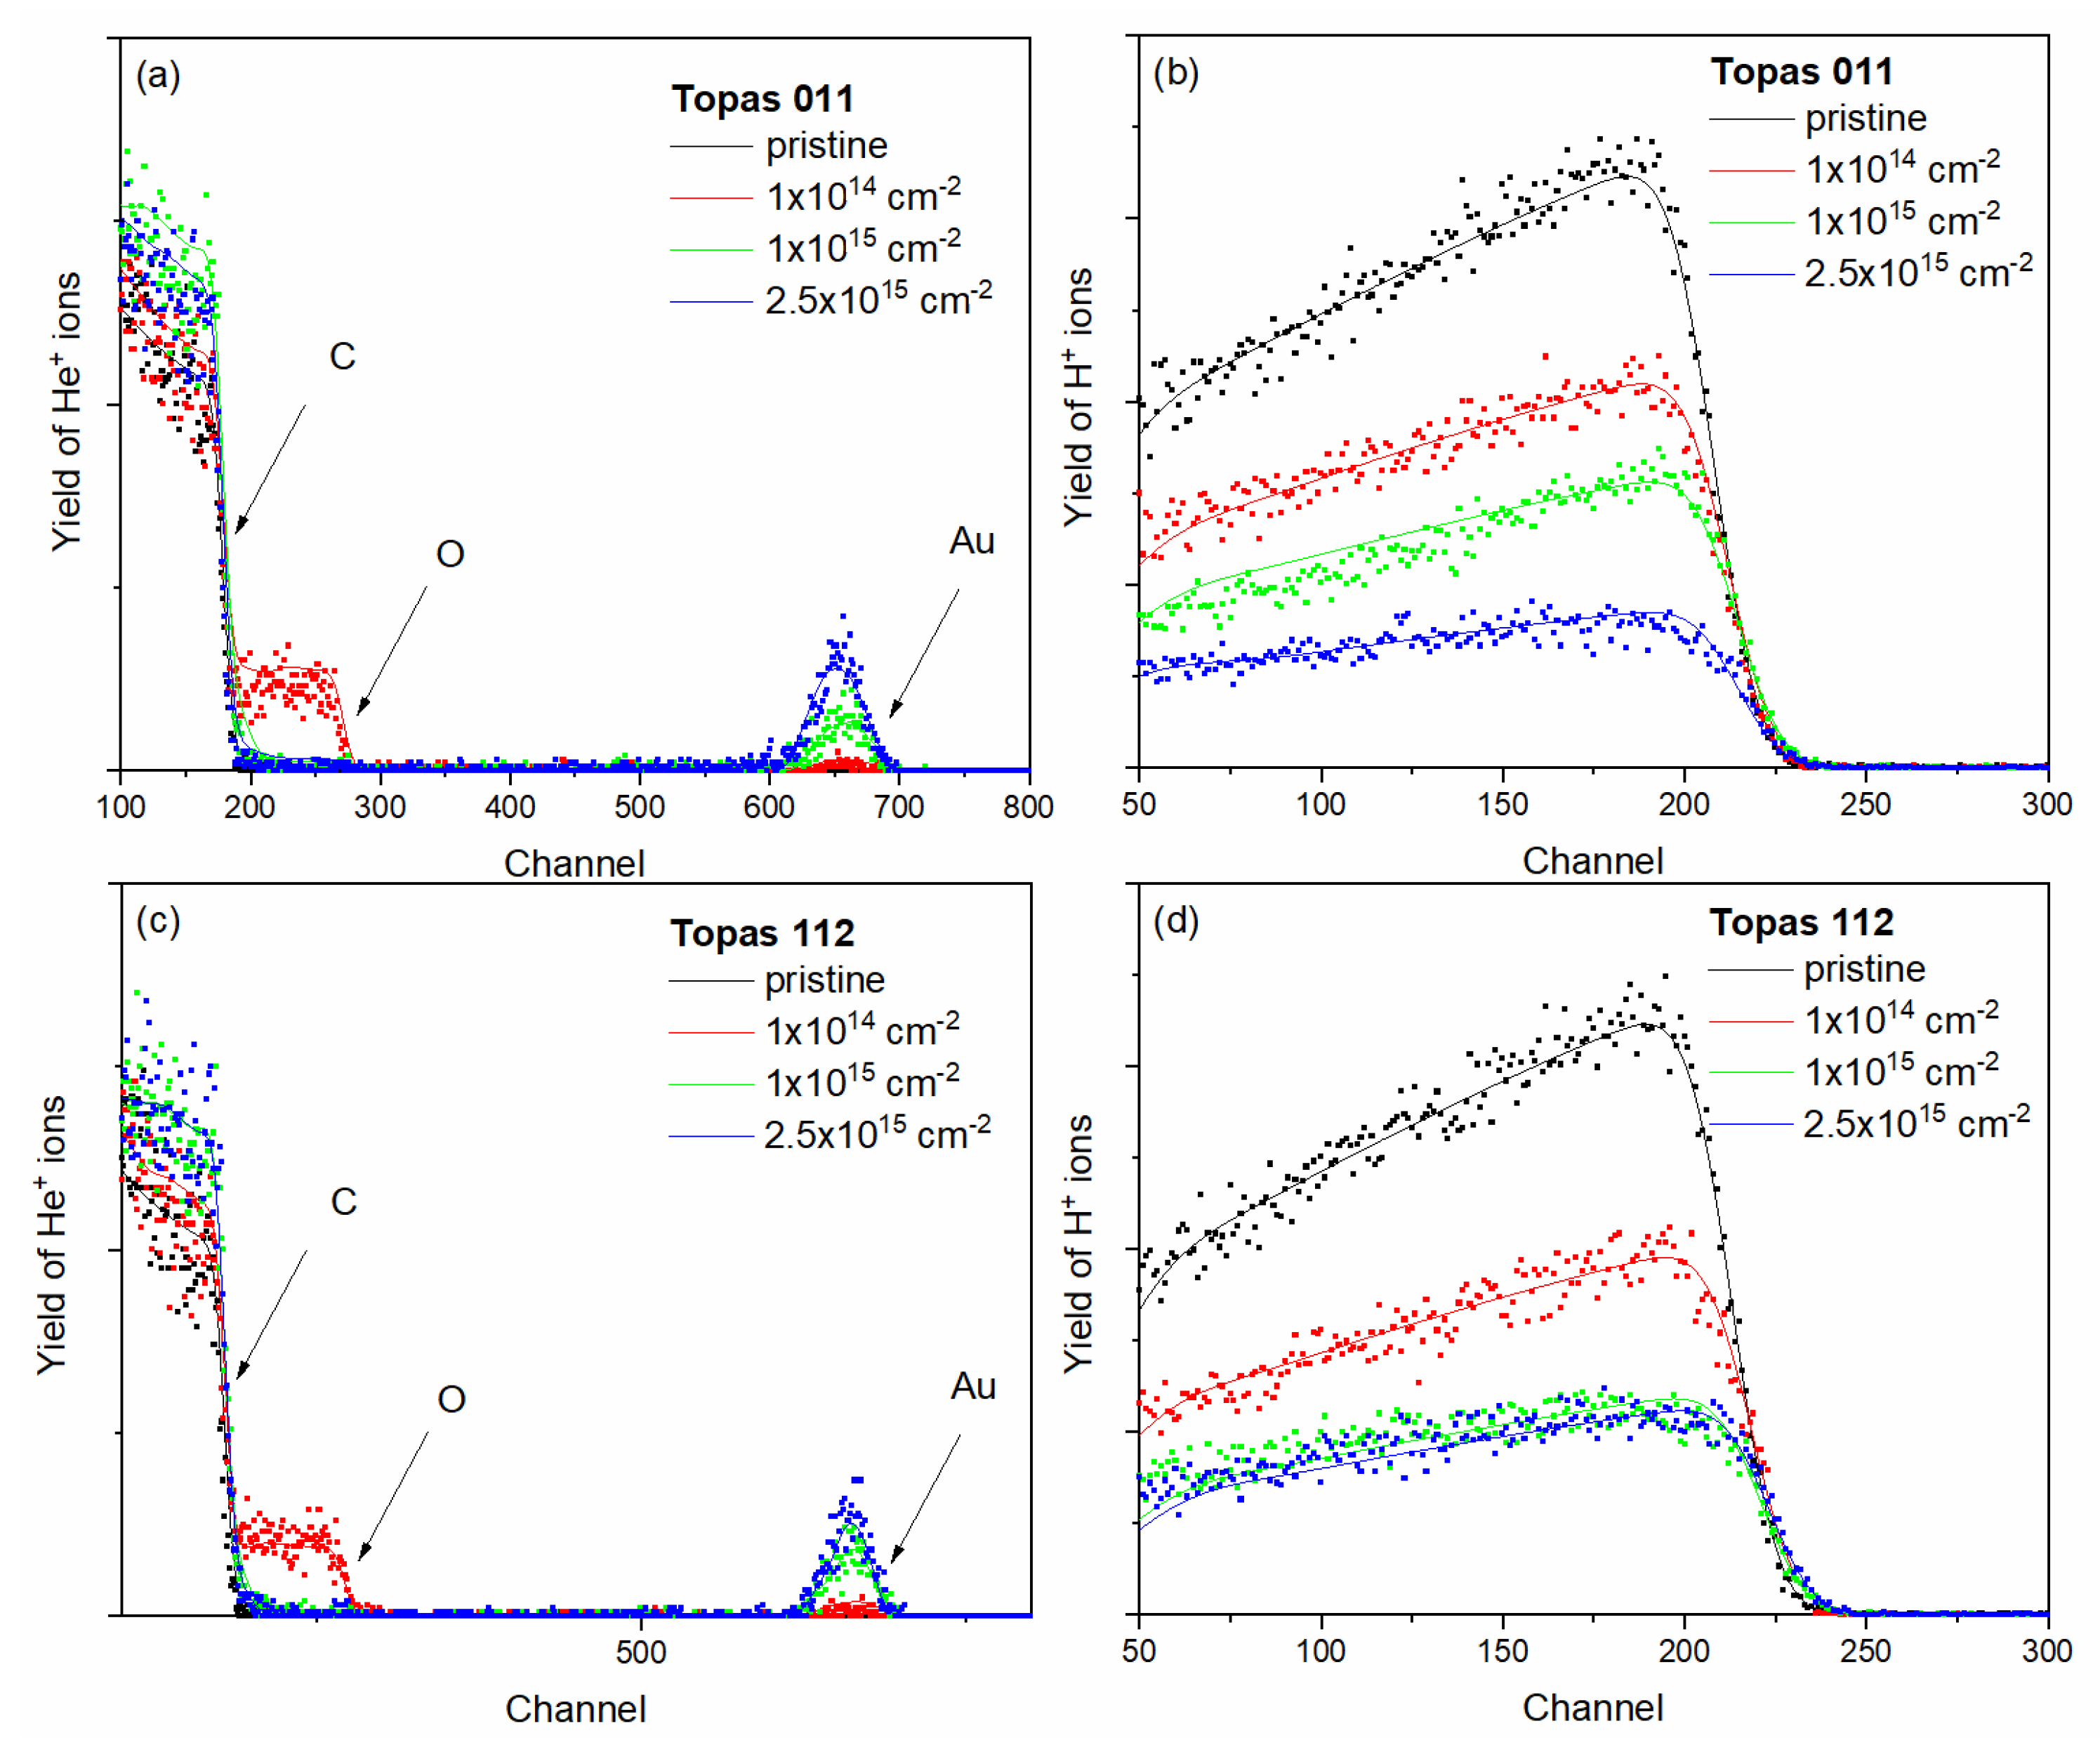
Figure 2.
The experimental depth profiles of Au atoms in irradiated Topas 112/011 (a, b) and GO (c) foils irradiated by 1MeV Au ions with fluences in the range of 1 × 10¹⁴ - 2.5 × 1015 cm-2.
Figure 2.
The experimental depth profiles of Au atoms in irradiated Topas 112/011 (a, b) and GO (c) foils irradiated by 1MeV Au ions with fluences in the range of 1 × 10¹⁴ - 2.5 × 1015 cm-2.
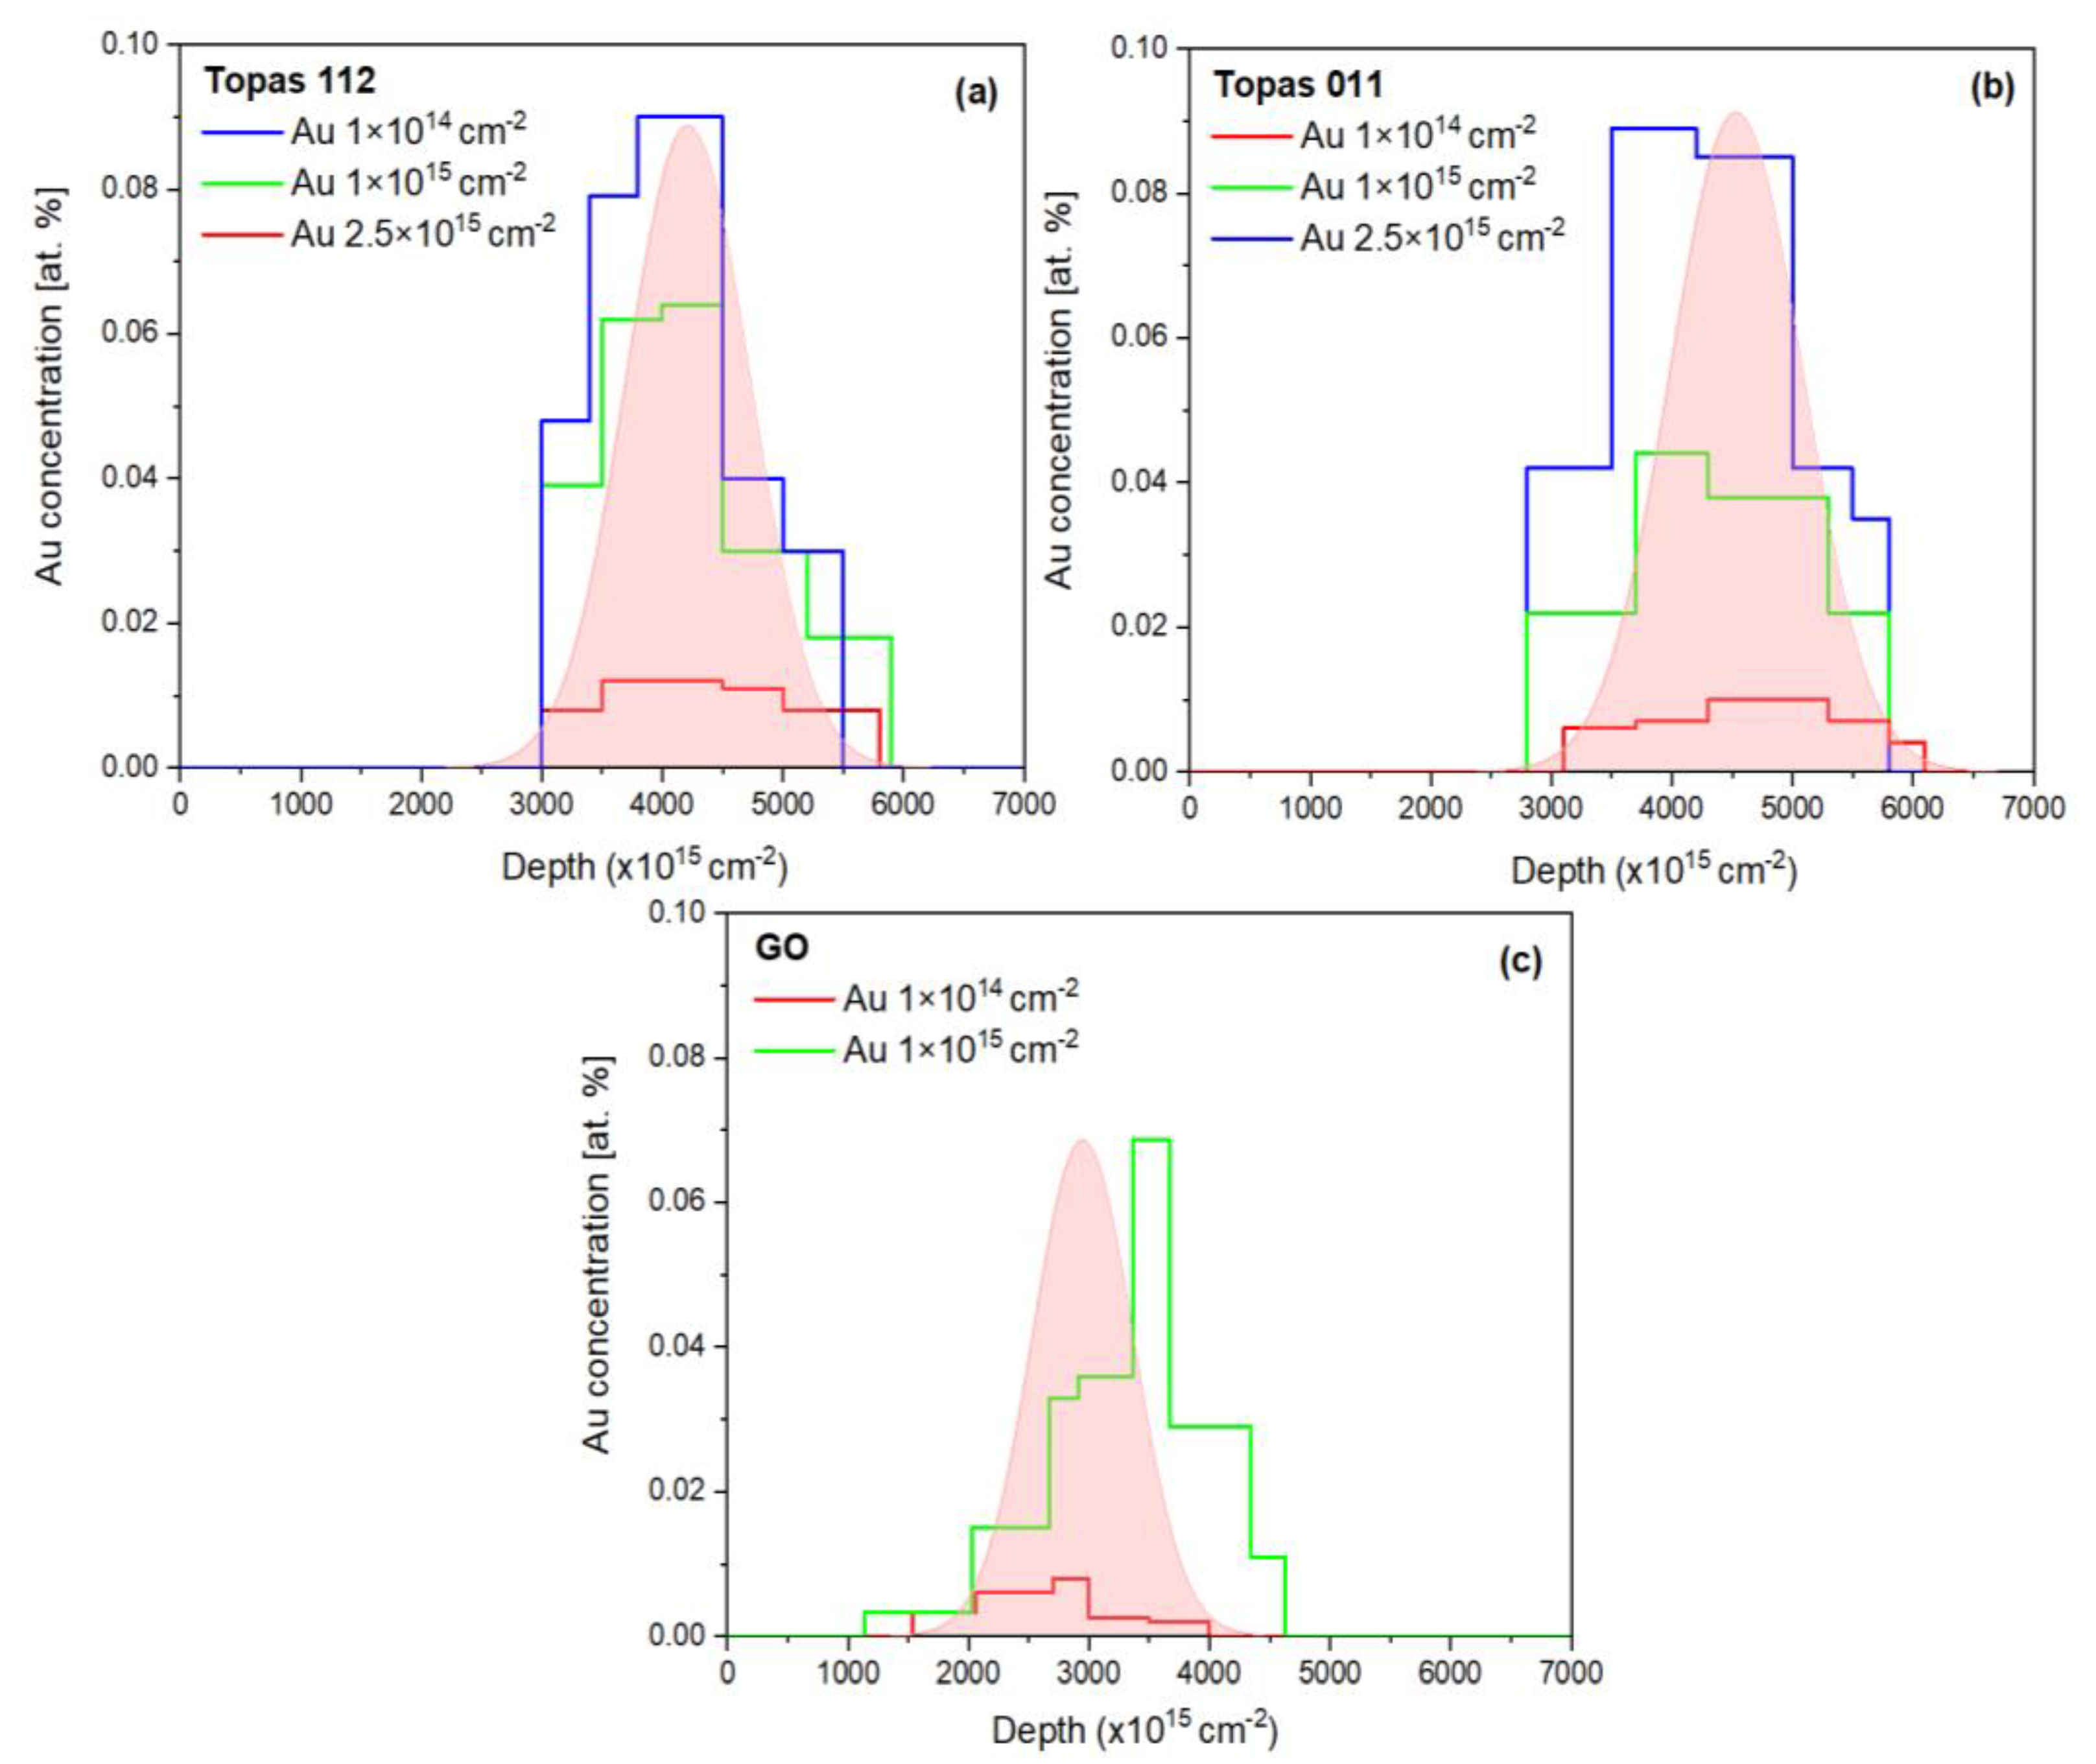
Figure 4.
Raman spectra of Topas 112 (a), Topas 011 (b), and GO (c) after 1 MeV Au ion irradiation at fluences from 1×10¹⁴ to 2.5×1015 cm-2, recorded with a 632 nm excitation wavelength.
Figure 4.
Raman spectra of Topas 112 (a), Topas 011 (b), and GO (c) after 1 MeV Au ion irradiation at fluences from 1×10¹⁴ to 2.5×1015 cm-2, recorded with a 632 nm excitation wavelength.
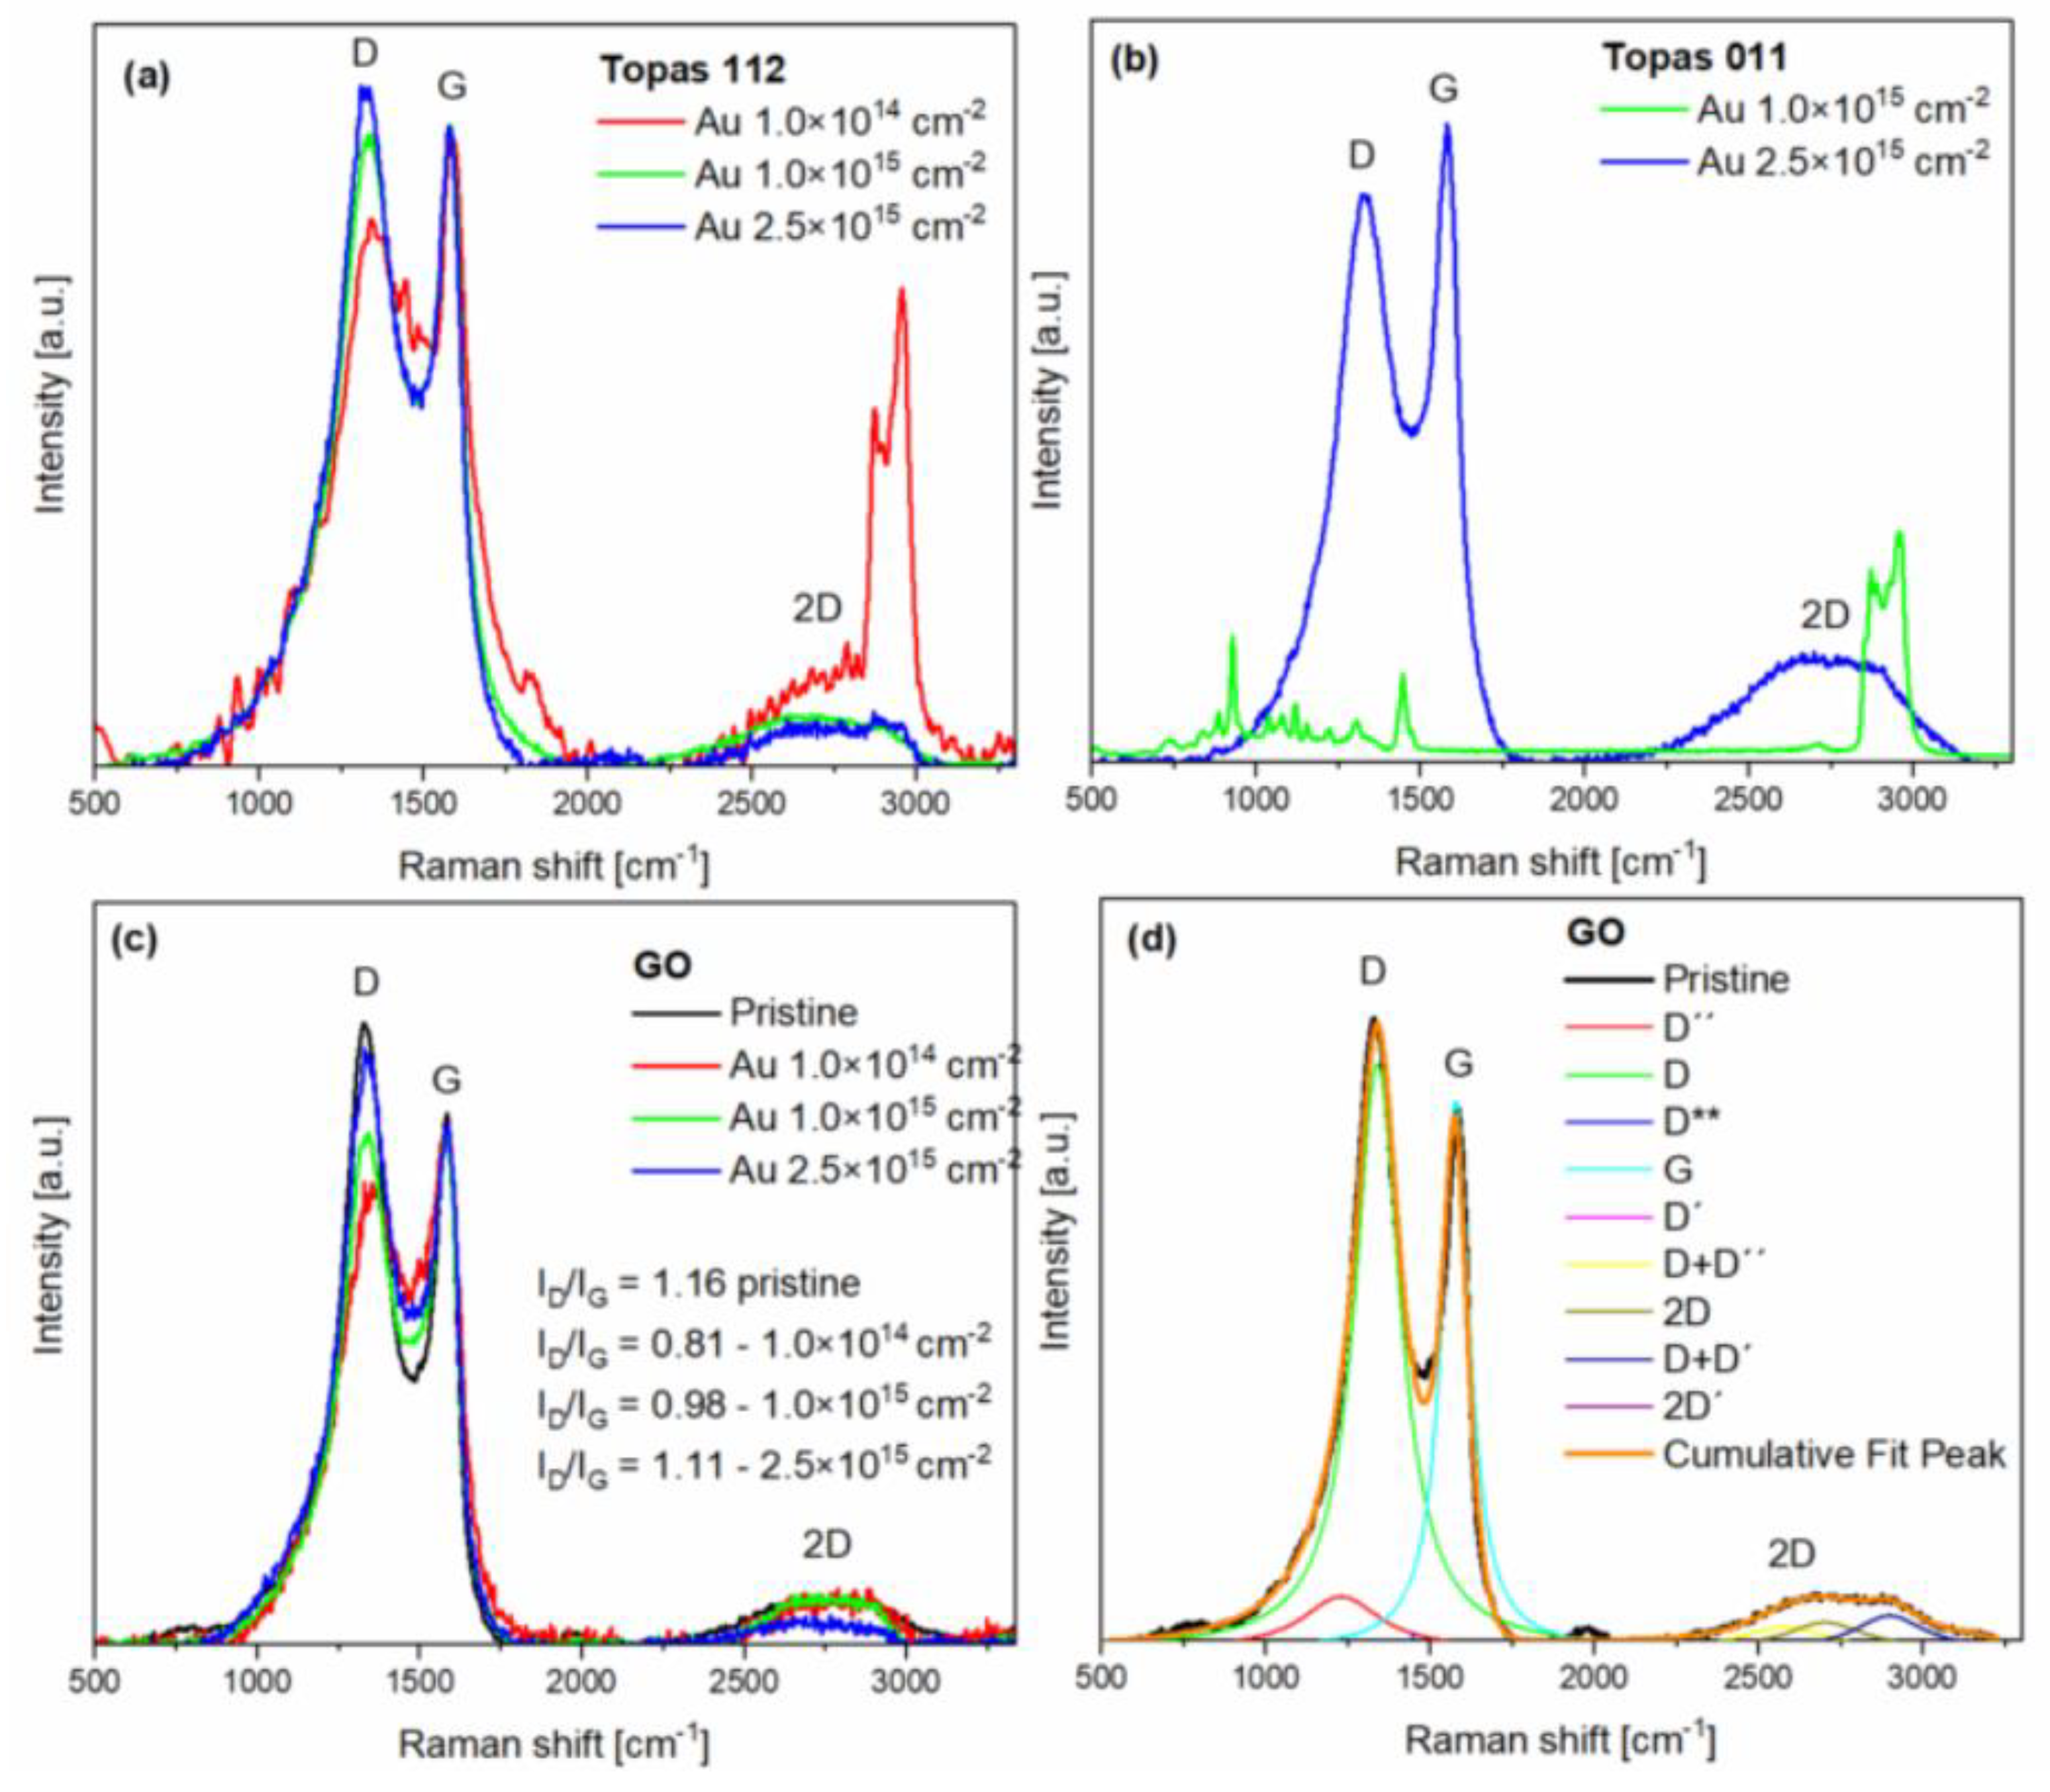
Figure 5.
Surface wettability characterization of TOPAS 112 and TOPAS 011 foils modified by 1 MeV Au with fluences of 1×10¹⁴, 1×10¹⁵ and 2.5×1015 cm-2. Water contact angle measurements (a) and surface free energy (SFE) values (b) calculated using the OWRK method. Data are presented as mean ± SD (n = 8) and analyzed by two-way ANOVA comparing pristine and modified materials. Significance is indicated as p ≤ 0.05, **p ≤ 0.01, and ***p ≤ 0.001; unlabeled data are not statistically significant.
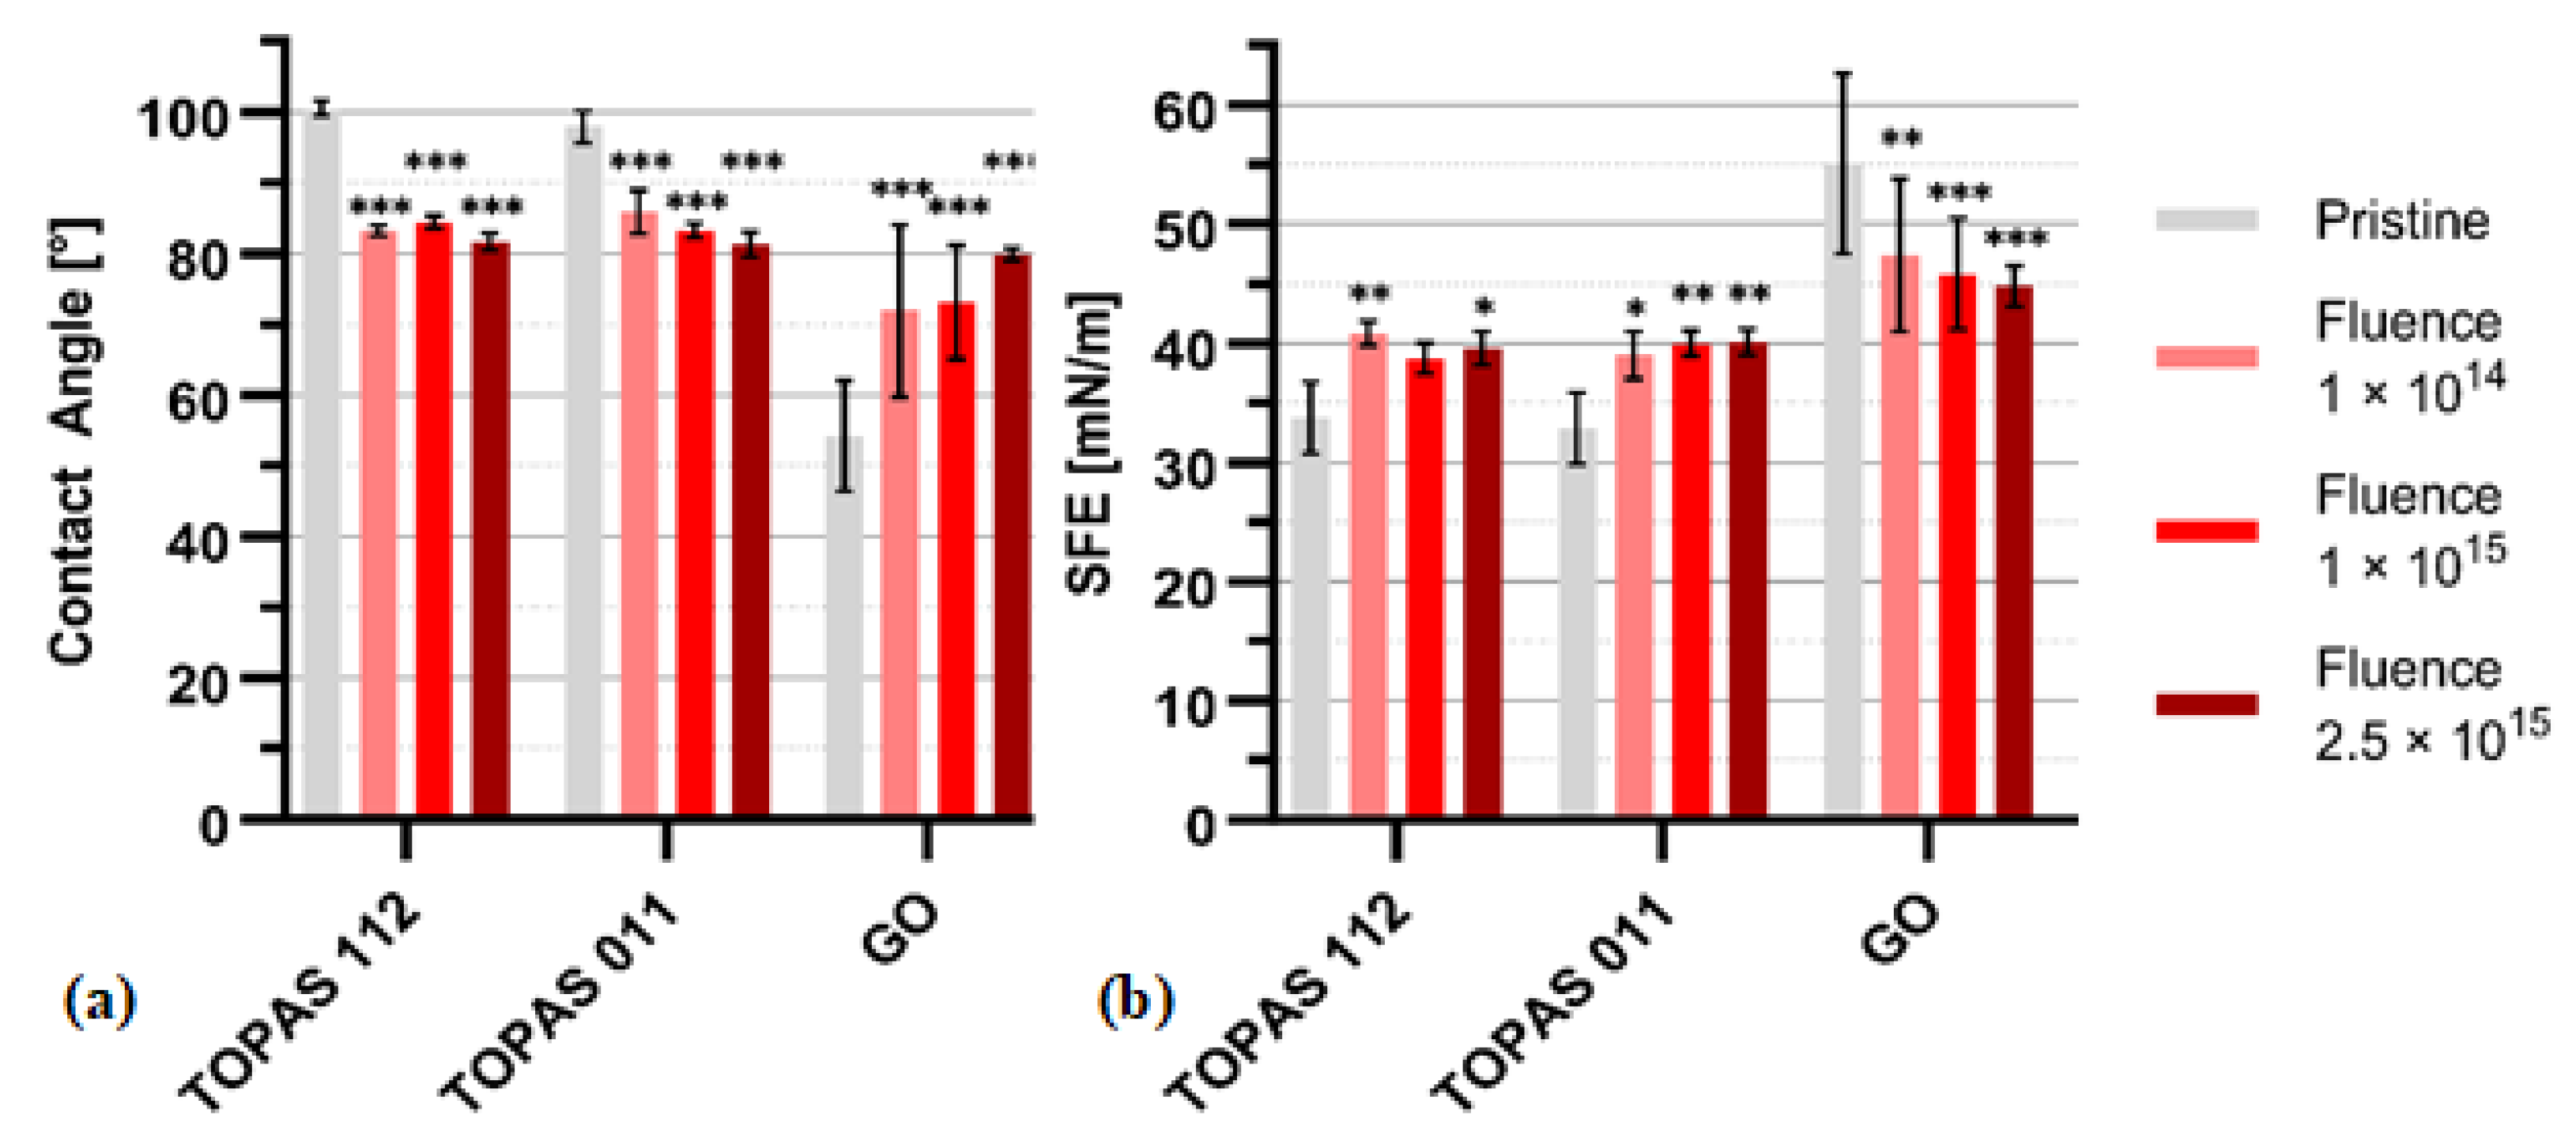
Figure 6.
The sheet resistivity depends on the ion fluence of Topas 112, Topas 011 and GO.
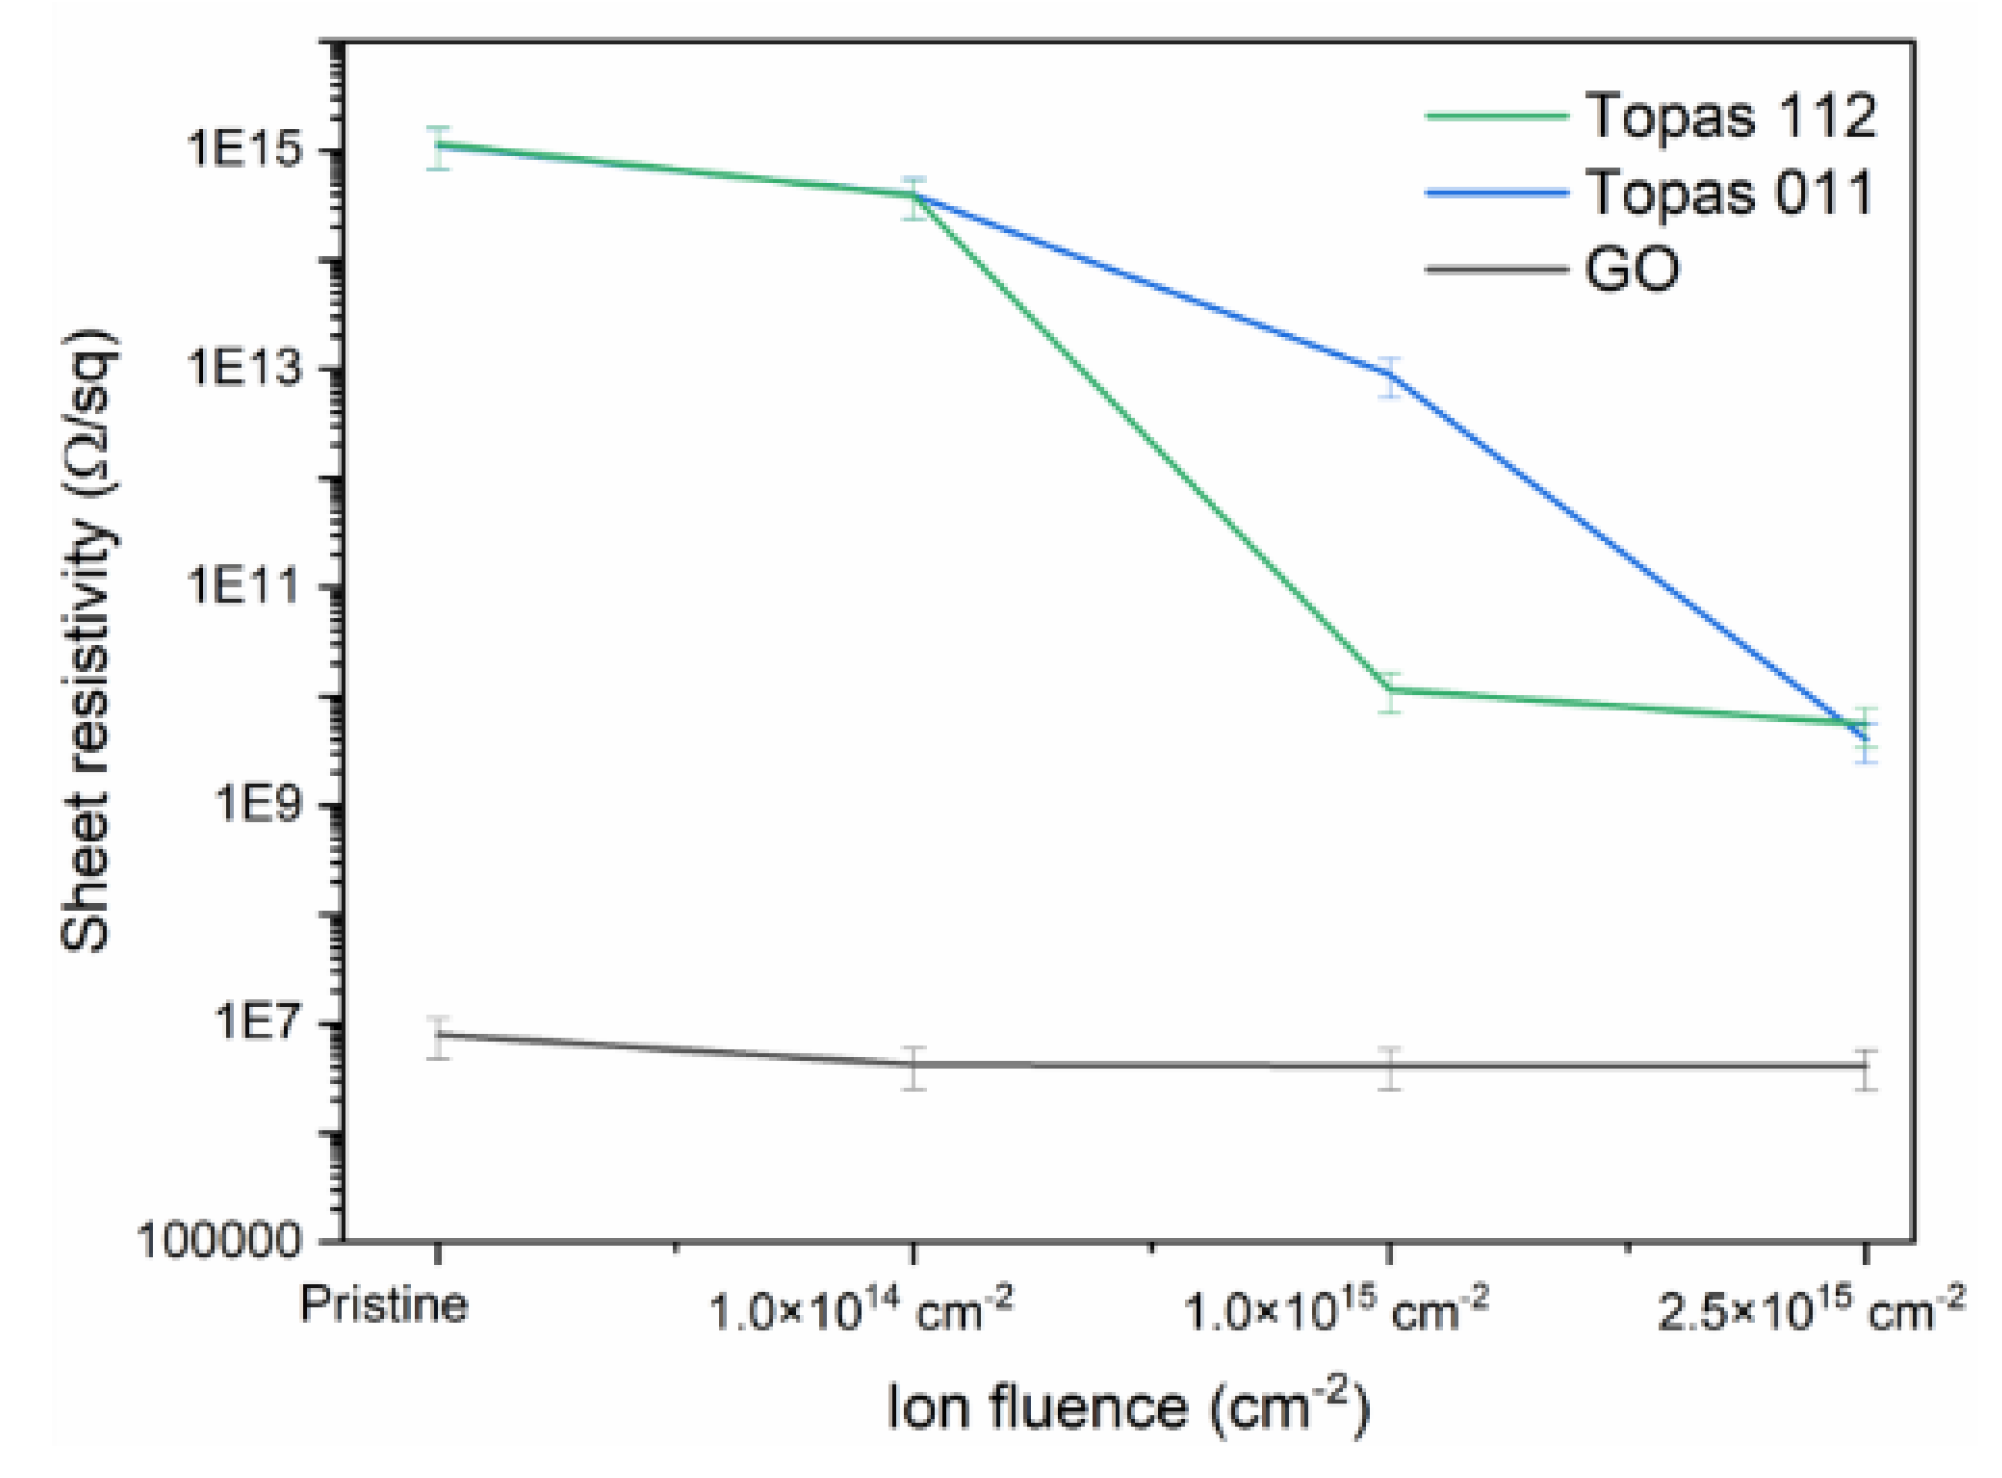
Table 1.
SRIM-calculated Se, Sn, Rp and ΔRP values of 1 MeV Au ions for Topas 112/011 and GO.
| Samples | Se [eV/Å] | Sn [eV/Å] | Se/ Sn | Rp [nm] | ΔRP [nm] |
|---|---|---|---|---|---|
| TOPAS 112 | 1.228E+02 | 1.600E+02 | 0.77 | 422 | 51 |
| TOPAS011 | 1.223E+02 | 1.603E+02 | 0.76 | 421 | 51 |
| GO | 1.121E+02 | 1.833E+02 | 0.61 | 358 | 51 |
Table 2.
The results of the RBS and ERDA measurements. The elemental composition of TOPAS 112/011 and GO foils irradiated by 1MeV Au ions with fluences in the range of 1 × 10¹⁴ - 2.5 × 1015 cm−2.
Table 2.
The results of the RBS and ERDA measurements. The elemental composition of TOPAS 112/011 and GO foils irradiated by 1MeV Au ions with fluences in the range of 1 × 10¹⁴ - 2.5 × 1015 cm−2.
| Material | Ion Fluence [Au/cm2] | C [at. %] |
O [at. %] |
H [at. %] |
C/O | N [at. %] |
C/H |
|---|---|---|---|---|---|---|---|
| Topas 112 | pristine | 53.1 | 0.9 | 46.0 | 59.0 | 1.2 | |
| 1x10¹⁴ | 62.0 | 6.0 | 32.0 | 10.3 | 1.9 | ||
| 1x10¹⁵ | 78.9 | 0.2 | 21.0 | 525.7 | 3.8 | ||
| 2.5x10¹⁵ | 79.9 | 0.2 | 20.0 | 532.3 | 4.0 | ||
| Topas 011 | pristine | 53.0 | 1.5 | 45.5 | 35.3 | 1.2 | |
| 1x10¹⁴ | 57.1 | 8.9 | 34.0 | 6.4 | 1.7 | ||
| 1x10¹⁵ | 72.7 | 0.8 | 26.5 | 90.9 | 2.7 | ||
| 2.5x10¹⁵ | 83.0 | 1.2 | 15.8 | 69.2 | 5.3 | ||
| GO | pristine | 63.9 | 22.0 | 9.0 | 2.9 | 4.8 | 7.1 |
| 1x10¹⁴ | 68.7 | 68.7 | 9.7 | 4.0 | 3.3 | 7.1 | |
| 1x10¹⁵ | 78.7 | 78.7 | 9.7 | 11.2 | 3.3 | 8.1 | |
| 2.5x10¹⁵ | X* | X | X | X | X | X |
* Due to sample damage, we do not provide this data.
Disclaimer/Publisher’s Note: The statements, opinions and data contained in all publications are solely those of the individual author(s) and contributor(s) and not of MDPI and/or the editor(s). MDPI and/or the editor(s) disclaim responsibility for any injury to people or property resulting from any ideas, methods, instructions or products referred to in the content. |
© 2026 by the authors. Licensee MDPI, Basel, Switzerland. This article is an open access article distributed under the terms and conditions of the Creative Commons Attribution (CC BY) license.
Copyright: This open access article is published under a Creative Commons CC BY 4.0 license, which permit the free download, distribution, and reuse, provided that the author and preprint are cited in any reuse.


