
Submitted:
01 January 2026
Posted:
04 January 2026
You are already at the latest version
Abstract
Injection molding is widely used for plastic parts, but its performance is limited by the cooling stage, which dominates cycle time and affects dimensional stability and energy consumption. Conformal cooling channels, which can be manufactured using additive technologies, improve thermal efficiency but introduce a high-dimensional design problem. This work proposes an integrated methodology for optimizing injection molds with conformal cooling channels that combines parametric CAD, simulation, nonlinear principal component analysis, artificial neural network, and multi-objective evolutionary optimization. The workflow is applied to a case study with five cooling layouts. An initial set of 36 metrics related to temperature gradients, warpage, shrinkage, and energy is reduced to a small number of latent objectives, simplifying the search space while preserving the main physical trends. Artificial neural networks surrogates accurately reproduce numerical results, enabling exploration of the design space at a fraction of the computational cost. The optimization yields diverse Pareto-optimal solutions that balance cycle time, dimensional stability, and energy consumption, assisting the design of more sustainable injection molds. Sensitivity analysis identifies mold temperature and channel position/diameter as key design levers. The proposed methodology reduces dependence on expensive simulations and is readily transferable to industrial mold design.
Keywords:
injection molding
; conformal cooling channels
; objectives selection
; surrogate models
; multi-objective optimization
1. Introduction
Injection molding is a dominant manufacturing process for producing polymer parts, widely used in sectors such as automotive, electronics, packaging, and consumer goods, due to its high productivity, precision, and ability to produce complex geometries with excellent repeatability. The overall performance of the process, however, is strongly conditioned by the cooling stage, which typically accounts for more than 50% of the total cycle time and has a critical impact on dimensional stability, residual stresses, shrinkage, and energy consumption [1,2,3]. Non-uniform heat extraction leads to heterogeneous solidification, warpage, and internal defects, often requiring conservative processing conditions and longer cycles to ensure quality.
Conventional cooling systems are typically manufactured through drilling and milling operations, restricting channels to straight or smoothly curved paths that cannot closely follow part geometry. This limitation often creates hot spots and steep temperature gradients, particularly in regions with variable thickness or complex features. Conformal cooling channels (CCCs) overcome these drawbacks by following the part’s contour, enabling placement closer to critical areas and a more uniform temperature distribution. Several studies have shown that CCCs can reduce cycle time while improving dimensional quality, with reported reductions of several tens of percent under favorable conditions [1,5]. The increasing availability of metal additive manufacturing (AM) has made CCC feasible, enabling intricate three-dimensional geometries and additional mold functionalities [3,6].
Despite these advantages, CCC design remains challenging. The problem is intrinsically multi-objective and high-dimensional, combining geometric variables (e.g., channel diameter, spacing, distance to the cavity surface, topology) with processing variables (melt and mold temperatures, injection velocity, packing pressure and time, and cooling time). AM also introduces constraints on minimum feature size, projections, powder removal, and mold structural integrity. Designers must balance conflicting targets such as cycle time, temperature uniformity, warpage, residual stress, and energy consumption while ensuring manufacturability [3,5,6]. Classical trial-and-error or single-objective approaches are insufficient to explore this design space.
Simulation-based optimization, supported by three-dimensional injection-molding software, provides a systematic approach to addressing this problem. However, directly coupling high-fidelity simulations with multi-objective evolutionary algorithms (MOEAs) can be computationally prohibitive when many variables and performance indicators are considered. This difficulty is well documented in injection molding and extrusion, where MOEAs such as NSGA-II have been applied to optimize processing conditions and conventional cooling layouts [6]. Surrogate models provide an attractive alternative: once trained on a suitably designed set of simulations, they can replace expensive evaluations during optimization, reducing cost while preserving the richness of the Pareto solutions.
A further complication arises from the objective space. In injection molding, quality and performance indicators are often strongly correlated; different measures of warpage, temperature non-uniformity, and residual stresses may convey similar information. Treating them as independent objectives can produce redundant search directions, unnecessarily complex Pareto fronts, and difficulties in interpretation and decision-making. Linear Principal Component Analysis (PCA) has been used to select objectives or construct composite quality indices, but the relationships among objectives are frequently nonlinear. In this context, Nonlinear PCA (NL-PCA) provides a more flexible method for extracting latent variables that capture the dominant variability of the original objectives [7].
To address these challenges, we implement a surrogate-assisted multi-objective optimization workflow combining NL-PCA, artificial neural network (ANN) metamodels, and a state-of-the-art MOEA. First, NL-PCA is applied to the original performance indicators to identify a compact set of latent objectives, reducing redundancy and simplifying the objective space. Second, ANN models are trained to map design variables, CCC geometric parameters, and process conditions onto these latent objectives, enabling rapid predictions that replace time-consuming simulations during optimization. Finally, NSGA-III [8] is employed to identify a diverse set of Pareto-optimal solutions in the reduced objective space, ensuring a good spread of trade-offs among productivity, quality, and energy-related metrics while preserving convergence properties.
Simultaneously, the use of multiple objectives supports the development of molds that contribute to sustainability in injection molding. Minimizing cycle time, defects, and energy consumption contributes decisively to this desideratum.
Within this framework, the primary objective of the present work is to design molds incorporating CCCs for sustainable injection molding. For that, the secondary objectives are: (i) to apply and extend an existing optimization methodology to different processing conditions and CCC configurations, evaluating its robustness under distinct thermal and mechanical scenarios; (ii) to validate ANN-based metamodels for the considered case study, assessing accuracy and generalization across the design space; (iii) to demonstrate, through an industrially relevant example, that the methodology can generate CCC designs that improve cycle time, dimensional quality, and energy consumption while respecting AM constraints; and (iv) to discuss tool integration and workflow automation, strengthening the connection between CAD/CAE environments, data-driven modeling, and multi-objective optimization in industrial practice. In this way, the work provides a unified framework for jointly optimizing CCC geometry and injection molding processing conditions, with guidelines extendable to other polymer processing operations.
The main contributions of this work are as follows. First, a systematically integrated framework combining dimensionality reduction (NL-PCA), surrogate modeling (ANNs), and many-objective evolutionary optimization (NSGA-III) for simultaneous CCC geometry and processing-condition design; to the best of our knowledge, this combination has not yet been explored in a unified manner for CCC design. Second, it provides an analysis of the injection-molding objective space with CCCs, clarifying how correlated quality indices and energy-related metrics can be mapped onto a small number of latent objectives, facilitating both search and post-optimization decisions. Third, the study quantifies benefits in cycle time reduction, dimensional quality, and energy consumption relative to baseline conventional cooling layouts, generating Pareto-optimal solutions that can serve as benchmarks for future research in sustainable mold design. Finally, by discussing implementation aspects, sampling strategies, ANN training procedures, and practical handling of AM-related constraints, the work provides methodological guidelines of broad interest for researchers and practitioners at the intersection of digitalization, optimization, and advanced mold manufacturing.
The remainder of the paper is organized as follows. Section 2 presents the relevant background on injection molding and CCC design, summarizing the main concepts underlying the proposed methodology, including NL-PCA, ANN-based surrogates, and NSGA-III. Section 3 describes the case study, the decision variables, the objectives, and the experimental plan used to generate the training and validation data. Section 4 discusses the optimization results, focusing on the structure of the reduced objective space, the quality of the ANN models, and the characteristics of the obtained Pareto fronts. Finally, Section 5 presents the main conclusions and outlines directions for future work.
2. State-of-the-art
2.1. The IM Process
Figure 1 schematically represents the stages of the injection molding process: plasticizing, filling, packing, cooling, and ejection. Each stage can significantly influence the final quality of the molded part [1,2,5,9].
During plasticizing (i), pellets melt in the barrel. Temperature and screw speed are critical: improper heating can cause poor melting or degradation, while higher screw speed increases shear and improves melt uniformity. These factors control melt flow during injection [1,3]. In the filling phase (ii), the melt enters the mold cavity. Runner and gate design affect flow and pressure loss. Injection pressure and speed must be balanced, since too fast or too slow filling can cause defects. Melt temperature again controls viscosity. During packing (iii), pressure is applied to offset shrinkage. Packing time and pressure ensure full cavity filling, while mold temperature controls solidification and internal stresses. During cooling (iv), the polymer solidifies in the mold. Mold and coolant temperatures control heat transfer, while cooling time must be balanced to avoid deformation or long cycles. In the ejection phase (v), the part is removed after sufficient solidification. Proper draft angles and surface finish help ensure smooth ejection [1,3].
Overall, process optimization and an efficient cooling system are essential for minimizing cycle time and ensuring part quality, with mold design as a key determinant [3].
2.2. Process Optimization
The integration of numerical modeling tools with multi-objective optimization requires dimensionality reduction techniques and metamodels, given the high computational cost of full three-dimensional simulations [10]. As summarized in Figure 2, the optimization loop is driven by a multi-objective evolutionary algorithm (MOEA), which controls candidate generation, evaluation, and evolution. The main phases are: (i) population initialization; (ii) evaluation via numerical modeling or metamodels; (iii) fitness calculation; (iv) selection, recombination, and mutation; and (v) creation of a new population, iterated until convergence or a stopping criterion is met [11].
In the present work, the proposed methodology combines numerical simulation, artificial intelligence, and MOEAs in a structured workflow (Figure 2):
i) Generation of parameterized geometries: automatic creation of mold and CCC configurations using Python scripts and, when required, the SolidWorks API;
ii) Numerical simulation: thermal–mechanical analysis with Moldex3D, obtaining information on temperature evolution, cycle time, warpage, and related metrics;
iii) Dimensionality reduction: application of NL-PCA to retain the most informative objectives, reducing redundancy;
iv) Metamodel development using ANNs: training ANN-based surrogate models to emulate simulations and provide fast predictions [12];
v) Multi-objective optimization with MOEAs: use of evolutionary algorithms (e.g., NSGA-II and NSGA-III) to explore the design space and construct Pareto fronts [11,13,14];
vi) Analysis and selection of solutions: post-processing of the Pareto set, selection of representative solutions, and experimental or detailed numerical validation.
Candidate generation starts with Python scripts that define decision variables, including CCC geometry, processing conditions, and, when needed, feeding-system parameters. Python supports systematic sampling and communication with SolidWorks, where parameterized 3D geometries are automatically generated via the API. This automation enables the exploration of many CCC designs while respecting design and AM constraints. The geometries are then analyzed in Moldex3D.
Moldex3D predicts thermal and mechanical behavior during injection molding, providing results such as filling, pressure, temperature, shrinkage, and warpage. These outputs help identify defects and define optimization objectives, but they typically create a high-dimensional objective space.
To reduce this complexity, objectives are selected using NL-PCA [7,15]. An initial set of 36 metrics is reduced to 3 or 4 latent objectives based on eigenvalues and variance retention, preserving the main performance trends.
ANNs are then trained as surrogate models using Moldex3D data, linking design and process variables to the reduced objectives. Once trained, ANNs rapidly predict objective values for new designs, allowing the evaluation of thousands of candidates with low computational cost [12,16].
MOEAs, such as NSGA-II and NSGA-III, are applied to the surrogate model to identify trade-offs among conflicting objectives [8,11]. NSGA-II is effective for a few-objective problems, whereas NSGA-III handles many-objective problems using reference points [13,14]. Together with NL-PCA and ANNs, these methods efficiently explore the design space and identify high-performance CCC solutions.
The evolutionary process starts with a diverse population, evaluates individuals using ANN predictions, and applies selection, crossover, and mutation to generate new solutions. This cycle repeats until convergence or a stopping criterion is met [11,13].
Finally, objectives and decision variables must be clearly distinguished. Objectives measure performance, while decision variables define geometry and processing conditions. The ANN-based mapping between them, combined with NL-PCA, is central to the optimization approach used in Section 4 and Section 5.
In Gaspar-Cunha et al. [10], a multi-objective methodology combining PCA-based dimensionality reduction, ANNs, and MOEAs was proposed for CCC design, thereby simplifying the problem and improving thermal efficiency, as demonstrated through numerical and practical case studies. The present work builds on this strategy by adopting NL-PCA, explicitly integrating AM-compatible geometric constraints, and applying the framework to an industrially relevant case study.
3. Case study
3.1. Decision Variables
As noted above, the decision variables to be optimized fall into two categories: processing conditions and CCC geometry. Figure 3 shows the geometry of the plastic part to be studied, a cup, and illustrates the five different CCCs system designs, including conventional channels, circular ring channels (with 2–3 rings), spiral channels (with the number of turns defined by the user), and zigzag channels. Table 1 presents the geometric parameters to be optimized, as identified in Figure 3, along with their corresponding ranges of variation.
3.2. Objectives to be Optimized
To capture the complex variations arising from changes to the cooling system, the objectives were organized into six categories to optimize thermal performance and minimize defects. Table 4 summarizes the objectives considered. All these objectives are evaluated using Moldex3D numerical modelling software. These objectives are selected to validate the methodology in a real-world environment, where it is not possible to determine in advance the objectives necessary for the specific problem under study. In some cases, they appear redundant, but our experience indicates that selecting performance measures for complex problems is not straightforward.
A) Temperature profile-based objectives: Temperature gradients within molded parts have a significant impact on the final product quality. To control these gradients, objectives were established based on temperature variations across the part thickness:
- Surface–Core Variations: Measure the mean and standard deviation of temperature differences between the surface and the core of the part.
- Surface–Surface Variations: Analyze the temperature difference between opposite surfaces.
- Core–Opposite Surface Variations: Evaluate temperature differences through the core and between opposite surfaces. These objectives, measured at the end of the cooling phase, ensure uniform cooling, reducing the risk of residual stresses and warpage. Furthermore, by focusing the analysis on the 20% of regions with the highest thermal gradients, the optimization targets the most critical areas, improving the overall cooling performance.
B) Defect-based objectives: Minimizing defects is essential to ensure final product quality. Sixteen objectives were defined to assess the following phenomena:
- Warpage: Determination of maximum and minimum displacements along the X, Y, and Z axes, as well as total deformation.
- Volumetric Shrinkage: Evaluation of part shrinkage, expressed as the percentage variation of linear dimensions along the X, Y, and Z axes (linear shrinkage is calculated as the percentage difference between the molded part dimension and the nominal mold dimension), as well as total linear shrinkage. The separation between maximum and minimum values enables the identification of asymmetries in deformation. For symmetric parts, this approach ensures consistency and highlights areas that require process adjustments. The analysis of warpage, for instance, enables understanding of the impact of flow direction on deformation and guides improvements in product design.
C) Time-related objective: Cycle time has a direct influence on production efficiency:
- Cycle Time: Total cycle time calculated by Moldex3D.
D) Objectives related to density and thermal efficiency: A uniform density distribution in molded parts is essential to avoid defects such as uneven shrinkage and internal stresses. The density standard deviation was used as a metric to evaluate and minimize variability, ensuring structural integrity and compliance with design specifications. Thermal efficiency objectives focus on the dynamics of heat transfer between the molded parts and the cooling channels. By analyzing efficiency differences across the cooling channels, it is possible to maximize heat removal while maintaining thermal uniformity. This balance improves energy use and reduces cycle times without compromising quality.
E) Von Mises stress-based objectives: The mechanical integrity of the parts is assessed using the Von Mises stress metric, which includes the following parameters:
- Maximum Stress: Identification of regions with a higher risk of structural failure.
- Mean Stress: Analysis of the overall material behavior.
-
Standard Deviation: Evaluation of the uniformity of stress distribution.Reducing stress concentrations improves part durability and prevents structural failure. This comprehensive assessment enables the identification of areas that require reinforcement in the design or adjustments to the manufacturing process, thereby contributing to greater long-term reliability.
F) Energy-based objectives: The analysis of energy consumption during the injection molding process is essential to ensure the sustainability and efficiency of the production process. To this end, two main energy-related objectives were developed:
- Total Energy Consumption: This objective aggregates the different forms of energy used throughout the injection cycle, including plasticization energy (energy required to melt and homogenize the thermoplastic material), viscous dissipation energy (associated with internal friction losses during material flow), hydraulic energy (consumed by the machine’s hydraulic systems responsible for mechanical movements such as screw advance, mold closing and opening, and part ejection), and coolant pumping energy (required to circulate the cooling fluid through the channels).
- Residual Thermal Energy in the Part: This objective quantifies the thermal energy that remains accumulated in the part at the end of the cooling phase. The presence of residual thermal energy may indicate insufficient or uneven cooling, increasing the risk of warpage, internal stresses, and dimensional defects. Its minimization improves the part’s dimensional stability and optimizes cycle time without compromising final product quality.
3.3. Experimental Plan
To evaluate and optimize the thermal performance of different conformal cooling channel (CCC) geometries and ensure the robustness of the proposed solutions, the experimental plan was structured into two distinct studies, as shown in Table 5. To ensure the fidelity of the obtained models, the number of initial solutions for selecting objectives using NL-PCA and for the ANN is 1000. Additionally, based on initial experimental computations and the number of decision variables (i.e., the decision space size), the MOEA population size is 100, and the number of generations is 50.
The first study aims to compare the performance of conventional channels with different CCC geometries for the same objectives, and decision variables, i.e., operating conditions (OC), and cooling channel (CC) geometry and location. For that, the potential of CCC solutions is evaluated by evaluating critical objectives, including thermal efficiency, part quality, and cycle time, and ultimately selecting the best-performing solutions from the most promising geometry.
The second study focuses on evaluating the impact of optimizing certain decision variables on the injection process performance of the two-ring geometry by optimizing: i) the CC location and geometry; ii) the OC and CC with mold temperature constant; iii) the CC with di and d_i constant; iv) the CC with Di constant; and v) OC and CC by changing the baffle by a spiral in the fix part of the mold. This study allowed us to assess the influence of the variables that were changed.
4. Results and discussion
4.1. A Simple Practical Example
To provide a more precise understanding, the overall methodology is explained below using a simple example of optimizing two-ring circular cooling channels for four objectives. All results reported in Table 5 are presented in this section and in the Data Repositorium [17].
NL-PCA for the Selection of Objectives
As previously mentioned, dimensionality reduction (i.e., reduction in the number of objectives) was performed using NL-PCA based on numerical modeling data. Table 6 presents the results obtained when the selected objectives are 4 and 3. In both cases, the explained variance was 95%.
ANN Model Performance
An ANN surrogate model was trained using the selected objectives and 200 Moldex3D evaluations. Bayesian optimization was applied to determine the ANN hyperparameters using k-fold with five intervals and the Tree-structured Parzen Estimator (TPE) algorithm from the Hyperopt library [18].
Figure 4 compares predicted and observed values and summarizes the model error. For this case, the training NMAE (normalized mean absolute error) was 0.0243. For the remaining cases, the NMAE values fall within the interval [0.0151, 0.0318]. In all cases, cross-validation is made, with the dataset being split into training and validation subsets. However, the final optimization results must be analyzed with care, since as the population of solutions approaches the Pareto front, the ANN accuracy decreases.
NMAE is defined as the mean absolute difference between predicted and measured values, normalized by the range of each variable. This yields a dimensionless metric that enables direct comparison across objectives with different scales. As shown in Figure 4, the error is low, with most points clustering near the 1:1 (diagonal) line, indicating strong agreement between predictions and observations.
Multiobjective optimization results
Multi-objective optimization was performed using NSGA-III with a population size of 100 and 50 generations. For the case with four NL-PCA–selected objectives (sdVMS, maxWaT, sDTms, and energconsumpt) and two-ring circular channels, Figure 5 shows the Pareto fronts obtained from the 50th generation. Cross markers indicate the initial ANN solutions. The figure also highlights the selected designs and their corresponding channel geometries, providing a physical interpretation of the results.
Table 7 reports the processing conditions and geometric parameters of the solutions in Figure 5, and Table 8 lists the associated objective values. As all objectives are minimized, preferred solutions lie toward the lower-left of each plot. However, because the objectives conflict, some solutions that appear dominated in one 2D projection remain non-dominated in another. Then, to characterize both trade-off limits and near-ideal compromises, solutions at the curve extremes and representative intermediate points were selected. Table 7 further clarifies how decision variables influence performance.
The simultaneous analysis of Figure 5 and Table 7 and Table 8 indicates that reducing PiMax to approximately 120 MPa is beneficial for the process, as it promotes greater thermal uniformity, reduces the probability of thermal defects, and lowers energy consumption, as observed in solutions 1-6. For PpMax, no consistent trend could be identified. Finally, both reducing Tmelt toward its lower limit and decreasing Tmold result in lower energy consumption, with the mold temperature showing an approximately linear relationship with energy. Regarding the geometric parameters, d1 tends to approach its lower limit, while for d2, no clear conclusion can be drawn. For d_1, approaching the lower limit reduces maxWaT, although this effect is not statistically significant, whereas d_2 tends to approach the upper limit. For the D1 parameter, values near the lower bound are generally associated with reduced energy consumption, provided that D2 approaches its upper bound.
4.2. Optimization of Different Cooling Channel Geometries
4.2.1. Optimization Conditions
In this section, the performance of the conventional channel geometry with various CCC geometries developed is evaluated, i.e., the first study identified in Table 5. For this purpose, critical parameters, including thermal efficiency, part quality, and cycle time, are evaluated, and the best-performing solutions are ultimately selected from the most promising geometries. Table 9 and Table 10 present the characteristics and runs for the different types of cooling channels for the objectives selected by the DM and by NL-PCA, respectively.
4.2.2. Conventional Channels
The analysis of the eight sets of objectives for conventional channels (I to VIII, Table 9 and Table 10) showed that differences among scenarios are generally minor at the lower bounds of the objectives, indicating that conventional geometry tends to converge to similar solutions across metric combinations. Even so, some patterns were identified.
Figure 6A and Figure 7 present the optimization plots for run I for the conventional geometry, along with tables reporting objective values for selected solutions, images of these solutions, and the processing conditions obtained for each case. The remaining solutions are provided in the Data Repositorium [17].
Regarding the processing conditions, the conclusions obtained for conventional cooling channels remain consistent with those previously discussed in the application example of the methodology, with no relevant changes observed in the trends associated with the maximum injection pressure or the thermal parameters (Tmold and Tmelt), except that the mold temperature does not exhibit a linear relationship with energy consumption. As for PpMax, it continues to show no conclusive trend. The main divergence relative to the first topic arises in the analysis of the geometric parameters (d_1 and d_2). Contrary to prior observations, an inversion in the trend of these parameters is identified, indicating different behavior as they approach the admissible bounds. In this case, d_1 tends toward the upper limit, while d_2 tends toward the lower limit.
Across the remaining runs, it was observed that replacing energconsumpt with deltaenerg or maxWaT with maxSrT mainly affects convergence, but not the best achievable values. In particular, sets including maxSrT showed greater dispersion in tcycle, revealing greater sensitivity of this objective to process variations.
4.2.3. Two-Ring Channels
The same set of objectives selected by the DM was analyzed in the same manner as for conventional channels (runs I-VI, Table 9). In contrast, the objectives selected by NL-PCA differ (runs VII-VIII, Table 10).
Figure 6B and Figure 8 present the optimization plots for run I for the 2-ring geometry, along with tables reporting objective values for selected solutions, images of these solutions, and the processing conditions for each case. The remaining solutions are provided in the Data Repositorium [17]. Under the processing conditions used, differences are observed in the results obtained for the 2-ring channels compared with conventional channels. PpMax tends to approach the upper limit without significantly affecting warpage. The remaining processing conditions follow the same trends as those previously obtained for conventional channels. The main divergence from conventional channels is evident in the analysis of the geometric parameters (d1 and d2). Unlike previously observed trends, an inversion in this parameter’s trend is noted. In this case, d1 tends toward the upper limit, while d2 remains inconclusive. The other geometric parameters (D1 and D2) exhibit trends similar to those observed in the previous results.
When comparing all runs (I to VI), the 2-ring geometry showed measurable improvements over the conventional design: reduction in maxWaT, lower maximum shrinkage (maxSrT), lower energy consumption, despite tcycle being nearly unchanged. Differences between runs were again slight, although scenarios V and VI showed more evident convergence when deltaenerg replaced energconsumpt.
In the NL-PCA-selected sets, including maxWaT (in VIII), increased dispersion along sdVMS, highlighting greater sensitivity of the 2-ring geometry to this objective. However, the lower bounds remained similar, indicating that optimal performance is maintained.
Overall, the 2-ring geometry represents an advancement over the conventional design, particularly with respect to dimensional stability and energy efficiency.
4.2.4. 3-Ring Channels
Based on observations from 2-ring channels and reinforcing the conclusions already drawn for the conventional channels, it is clear that variations in solutions at the lower bounds of the objectives are minor. Therefore, a detailed presentation of all studied runs is unnecessary. As a result, the analysis continues to use only three of the six initially considered runs selected by the DM, namely I, III, and V (Table 9). The two sets selected by NL-PCA were maintained (runs VII and VIII, Table 10). This was kept for the following cases studied (spiral and zig-zag).
Figure 6C and Figure 9 present the optimization plots for run I for the 3-ring geometry, along with tables reporting objective values for selected solutions, images of these solutions, and the processing conditions for each case. The remaining solutions are provided in the Data Repositorium [17].
For the processing conditions, the conclusions obtained are the same as those for conventional channels. In the analysis of the geometric parameters, the main similarity with conventional channels is observed in d1, d2, d_1, and d_2; however, no clear conclusion can be drawn for d3, and d_3 tends to approach its upper bound. Regarding channel diameters, the trends observed previously are maintained; however, for at least two channels in the selected solutions (D2 and D3), the values approach the upper limit, whereas the third channel (D1) approaches the lower limit.
The three-ring geometry proved to be one of the most consistent throughout the study. Comparing runs I, III, and V, the addition of maxSrT (run V) did not affect energconsumpt, while replacing it with deltaenerg (run III) resulted in greater convergence, particularly in tcycle. In runs VII and VIII (NL-PCA), including maxVMS significantly increased dispersion, confirming that this objective is strongly correlated with the others and thus validating the automatic selection via NL-PCA. In terms of performance, the three-ring geometry exhibited lower warpage than the 2-ring design, slightly reduced shrinkage, and maintained low energy consumption. Overall, the 3-ring geometry stood out as one of the most balanced solutions in terms of deformation, cycle time, and energy efficiency.
4.2.5. Optimization of Spiral Channel
Figure 6D and Figure 10 show the optimization plots for the run I for the spiral geometry, along with tables reporting objective values for selected solutions, images of these solutions, and the processing conditions for each case. The remaining solutions are available in the Data Repository [17]. The only difference observed in the processing conditions relative to the other geometries is that PpMax tends to approach the lower limit, thereby reducing warpage and other thermal defects. The remaining processing conditions exhibit the same trends as those previously observed. Regarding geometric parameters, d2 and d_2 follow the same logic as in the previous cases, whereas d1 is inconclusive and d_1 approaches the lower limit, which does not occur in the previous geometries. Regarding the channel diameter D1, since there is only one channel, it tends toward the upper limit, thereby reducing process energy consumption.
The spiral geometry showed highly competitive results, with low warpage (maxWaT) comparable to the 3-ring design, controlled shrinkage (maxSrT), and energy and tcycle values very close to those of the other geometries. The most significant differences appeared in the NL-PCA sets: the introduction of sdDens increased dispersion in aVMS, maxSrY, and sDTss, indicating that the spiral is particularly sensitive to density variations. Even so, the spiral maintained stable minimum values, exhibiting robust behavior comparable to that of the 3-ring geometry.
4.2.6. Optimization of Zigzag Channel
Figure 6E and Figure 11 present the optimization plots for run I for the zigzag geometry, along with tables reporting objective values for selected solutions, images of these solutions, and the processing conditions for each case. The remaining solutions are provided in the Data Repositorium [17].
Regarding processing conditions, the conclusions are consistent with those obtained for the 2-ring channels. Regarding the geometric parameters, d_1, d_2, and d1 continue to follow the same trends as in previous cases, except in the spiral configuration. For the channel diameter D1, the results are similar to those observed in the earlier spiral-channel scenario. For h values, the lower bound is preferred, which reduces energy consumption; however, it slightly increases warpage, though not in a globally significant way. Similarly, w1 approaches values near its upper bound, while w2 moves toward values close to its lower bound.
The zigzag geometry demonstrated the best performance in tcycle, thanks to its shorter flow pattern, and exhibited lower energconsumpt, standing out as one of the most energy-efficient designs. Its maxWaT values were slightly higher than those of the spiral and 3-ring geometries, but still competitive. The inclusion of sDTssH led to a marked increase in dispersion, highlighting the zigzag geometry’s high sensitivity to local thermal variations. Geometrically, lower crossover heights and shorter distances to critical points were observed to yield better thermal performance. Overall, the zigzag design did not outperform the spiral in overall performance, but it was equivalent for specific objectives and superior in energy efficiency and cycle time.
4.3. Global Comparative Analysis
All cooling channel geometries were evaluated using universal objective sets applicable to all scenarios (runs I, III and V, Table 9):
- tcycle, maxWaT, energconsumpt;
- tcycle, maxWaT, deltaenerg;
- tcycle, maxWaT, maxSrT, energconsumpt.
Regarding maximum warpage (maxWaT), all geometries exhibited very similar convergence, with values in the range of 0.83–0.84 mm. However, the three-ring circular (3-ring), zigzag, and conventional geometries recorded slightly lower values, which is noteworthy in this parameter.
With respect to energy consumption (energconsumpt), more significant differences between geometries were observed. While the zigzag and conventional configurations showed consumption between 20–21 kJ, the two-ring (2-ring), three-ring (3-ring), and spiral geometries were more efficient, with values ranging from 19.5–20.5 kJ. Within this group, the 3-ring and spiral designs were the most economical.
When analyzing energy variation (deltaenerg), the three-ring (3-ring) geometry showed the best performance, with values between 2 and 3.5 kJ. The two-ring (2-ring) geometries fell within the range of 2.5–3.5 kJ, whereas zigzag, spiral, and conventional designs yielded the highest values, between 3 and 4.5 kJ.
Regarding maximum shrinkage (maxSrT), the spiral geometry exhibited the narrowest and most stable range of values. However, in multi-objective scenarios with additional parameters, the three-ring (3-ring) geometry achieved lower or better values, indicating greater optimization capability.
4.4. Selection of the Best Solution
The final selection required a thorough analysis of the trade-offs between objectives, as metrics such as warpage, energy, and cycle time exhibit opposing correlations. In such cases, there is no single global optimum, but rather a set of compromise solutions located on the Pareto front. The final selection considered not only the relative positions of solutions on the Pareto front but also engineering criteria, including thermal uniformity, manufacturability, dimensional stability, and industrial feasibility. After this integrated analysis, it was concluded that the objective combination based on (tcycle, maxWaT, deltaenerg) produced the most robust compromise solutions. Within this set, Solution 2 (Figure 12) demonstrated the best balance between reduced cycle time, moderate deformation, and optimized energy, and was therefore selected as the final best solution of the study.
4.5. Impact of Certain Decision Variables
The second study evaluates the impact of optimizing selected decision variables on injection process performance for the 2-ring CCC configuration, specifically by keeping certain variables constant (e.g., Tmold, di, d_i, Di) and by replacing the internal baffle with a spiral.
The results demonstrate that optimizing processing conditions (OC) plays a decisive role in expanding the solution space and improving the quality of the final part. When processing parameters were allowed to vary, the Pareto fronts obtained showed greater dispersion and lower objective values, reflecting enhanced exploration capability of the search algorithm and superior achievable solutions. Conversely, when processing conditions were held constant, the solution space became significantly narrower and more constrained, with higher lower bounds and lower upper bounds across objectives, confirming that fixing these variables restricts optimization potential.
Overall, the study concludes that certain decision variables, especially processing conditions, channel location, and channel diameter, strongly influence the solution space, and that optimizing them is essential to maximizing the performance of CCC systems. The spiral baffle also demonstrated a measurable effect, indicating its potential as an alternative internal cooling feature. The optimization results are provided in the Data Repositorium [17].
5. Conclusions
In this work, an integrated, automated methodology was developed to design and optimize conformal cooling channel (CCC) systems in polymer injection molds, combining numerical modeling, artificial intelligence (ANN-based metamodels), and multi-objective evolutionary algorithms. The proposed workflow successfully addressed the high geometric complexity of CCCs, the multi-objective nature of the problem, and the prohibitive computational cost of direct numerical simulation, thereby enabling a systematic exploration of both geometric and processing decision variables.
The methodology was applied to different processing conditions and CCC layouts, demonstrating its robustness and versatility. By coupling automated geometry generation in SolidWorks with Moldex3D simulations, a reproducible pipeline was established for evaluating complex cooling configurations. The adoption of NL-PCA reduced the initial set of 36 objectives to 3–4 representative metrics, capturing more than 95% of the total data variance and simplifying subsequent optimization. ANN-based metamodels, trained on the simulation results, achieved a normalized mean absolute error (NMAE) of 0.0243, confirming their accuracy and robustness as surrogates and enabling thousands of optimization iterations to be carried out at a fraction of the computational cost of full simulations.
The optimization results showed that CCC geometries based on three circular ring channels offered the best overall performance among the configurations studied. In particular, one solution from the objective set {tcycle, maxWaT, Δenerg} stood out by simultaneously minimizing cycle time and maximum warpage while maintaining favorable energy consumption. These solutions are emerging for molds manufactured using additive technologies, as they offer an optimal balance between thermal performance, dimensional stability, and manufacturability.
The three-ring (3-ring) geometry proved to be the most balanced and robust among the configurations studied. With consistently strong performance across all evaluated objectives (low warpage, reduced energy consumption, excellent control of energy variation, and effective shrinkage management), this configuration emerges as the most recommendable solution for additive manufacturing of molds when comprehensive optimization of the cooling system in injection molding is desired.
Overall, the study confirms that the combination of AI, numerical modeling, and MOEAs is a powerful and scalable tool for advanced injection mold design.
Despite the positive results, the proposed methodology has several limitations that must be acknowledged. First, the objective selection was based on NL-PCA, which, although effective, does not explicitly account for mutual information or relevance–redundancy trade-offs between objectives; more advanced feature selection strategies could further improve the reduced objective set. Second, although the ANN metamodels exhibited low global error, discrepancies between predicted and simulated values tend to increase near the Pareto front, precisely where greater accuracy is required for final decision-making; therefore, improvements in network architectures, training strategies, and local refinement mechanisms are needed. Third, the optimization procedure was tested on a specific class of CCC layouts and a limited set of objectives; extending the approach to more complex design spaces, additional materials, and a larger set of constraints will require more efficient, scalable MOEAs. Finally, solution selection at the end of the optimization remains a largely manual step; the development of systematic decision-support tools to rank and select Pareto-optimal solutions according to industrial priorities is an important topic for future work, together with the experimental validation of the most promising designs and the comparison with alternative layouts, such as three-turn spiral configurations.
Author Contributions
C. Pereira: implementation, software, validation, formal analysis, investigation, writing-original draft preparation; A. Gaspar-Cunha: conceptualization, methodology, resources, writing-review and editing, supervision; A.J. Pontes: review, supervision, and founding.
References
- Rosato, D. V.; Rosato, D. V.; Rosato, M. G. Injection molding handbook; Springer: Boston, MA, 2000. [Google Scholar]
- Osswald, T. A.; Turng, L.-S.; Gramann, P. Injection molding handbook; Hanser: Munich, 2007. [Google Scholar]
- Kazmer, D. O. Injection mold design engineering, 3rd ed.; Hanser Publishers, 2022. [Google Scholar]
- Kitayama, S.; Tamada, K.; Takano, M.; Aiba, S. Numerical optimization of process parameters in plastic injection molding for minimizing weldlines and clamping force using conformal cooling channel. Journal of Manufacturing Processes 2018, 32, 782–790. [Google Scholar] [CrossRef]
- Gaspar-Cunha, A.; Melo, J.; Marques, T.; Pontes, A. A review on injection molding: Conformal cooling channels, modelling, surrogate models and multi-objective optimization. Polymers 2025, 17(7), 919. [Google Scholar] [CrossRef] [PubMed]
- Kanbur, B. B.; Zhou, Y.; Shen, S.; Duan, F. Neural network-integrated multiobjective optimization of 3D-printed conformal cooling channels. IEEE Xplore. 2020. [Google Scholar] [CrossRef]
- Scholz, M.; Kaplan, F.; Guy, C. L.; Kopka, J.; Selbig, J. Non-linear PCA: A missing data approach. Bioinformatics 2005, 21(20), 3887–3895. [Google Scholar] [CrossRef] [PubMed]
- Deb, K.; Jain, H. NSGA-III: An evolutionary many-objective optimization algorithm based on reference points. IEEE Transactions on Evolutionary Computation 2014, 18(4), 602–623. [Google Scholar] [CrossRef]
- Michaeli, W.; Müller, J.; Schmachtenberg, E. Understanding injection molding technology, 2ª ed.; Carl Hanser Verlag, 2020. [Google Scholar]
- Gaspar-Cunha, A.; Melo, J.; Marques, T.; Pontes, A. Application of artificial intelligence techniques to select the objectives in the multi-objective optimization of injection molding. International Polymer Processing 2025. [Google Scholar] [CrossRef]
- Gaspar-Cunha, A.; Covas, J. A. RPSGAe—Reduced Pareto set genetic algorithm: Application to polymer extrusion. In Metaheuristics for Multiobjective Optimisation; 2004; pp. 221–249. [Google Scholar]
- Gao, Z.; Dong, G.; Tang, Y.; Zhao, Y. F. Machine learning aided design of conformal cooling channels for injection molding. Journal of Intelligent Manufacturing 2023, 34(3), 1183–1201. [Google Scholar] [CrossRef]
- Coello, C.A.C.; Lamont, G.B.; Van Veldhuizen, D.A. Evolutionary Algorithms for Solving Multi-Objective Problems; Springer: Boston, MA, 2007. [Google Scholar]
- Deb, K. Multi-objective optimization using evolutionary algorithms.; Wiley: Chichester, 2001. [Google Scholar]
- Jolliffe, I. T. Principal Component Analysis, 2nd ed.; Springer, 2002. [Google Scholar] [CrossRef]
- Gaspar-Cunha, A.; Vieira, A. A multi-objective evolutionary algorithm using neural networks to approximate fitness evaluations. International Journal on Computer Systems & Signals 2005, 6(1), 18–36. [Google Scholar]
- Pereira, Carlos; Gaspar-Cunha, António. Surrogate-Assisted Multi-Objective Optimization of Conformal Cooling in Injection Molding; Repositório de Dados da Universidade do Minho, 2025. [Google Scholar] [CrossRef]
- Bergstra, J.; Bardenet, R.; Bengio, Y.; Kégl, B. Algorithms for Hyper-Parameter Optimization. In Advances in Neural Information Processing Systems; Shawe-Taylor, J., Zemel, R., Bartlett, P., Pereira, F., Weinberger, K. Q., Eds.; Curran Associates, Inc, 2011; Vol. 24. [Google Scholar]
Figure 1.
Stages of the injection molding process.
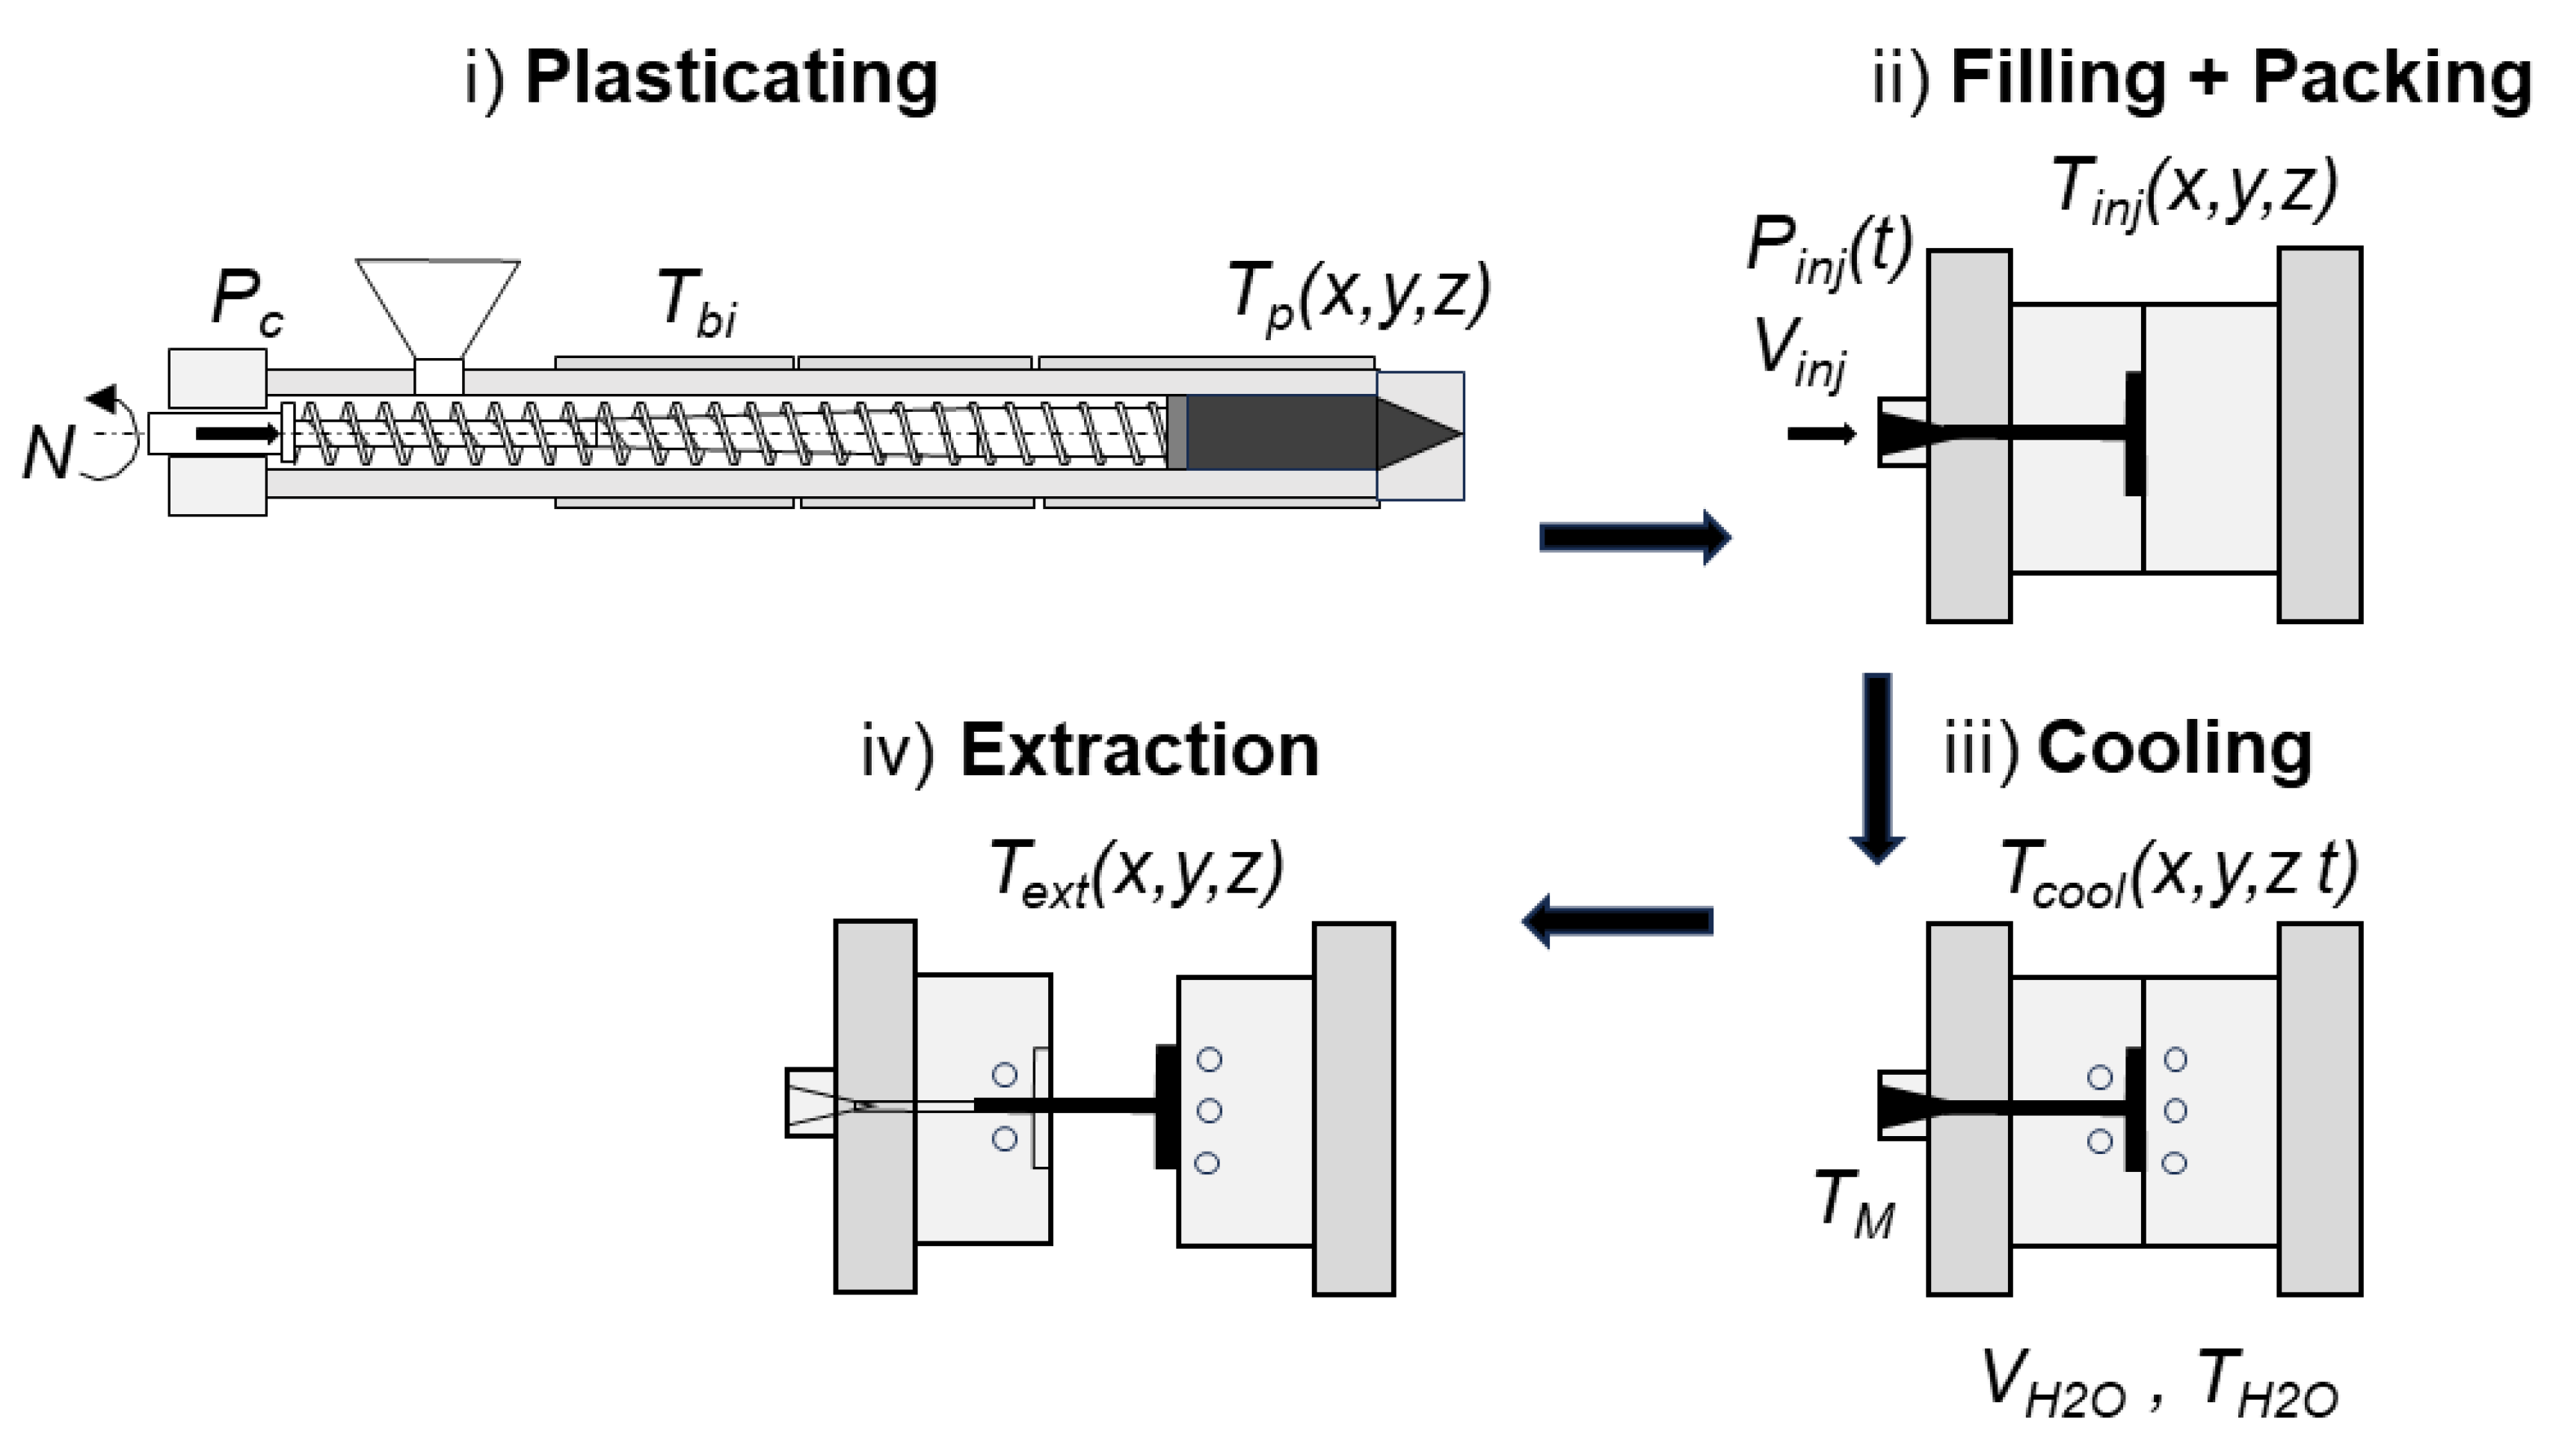
Figure 2.
Workflow methodology.
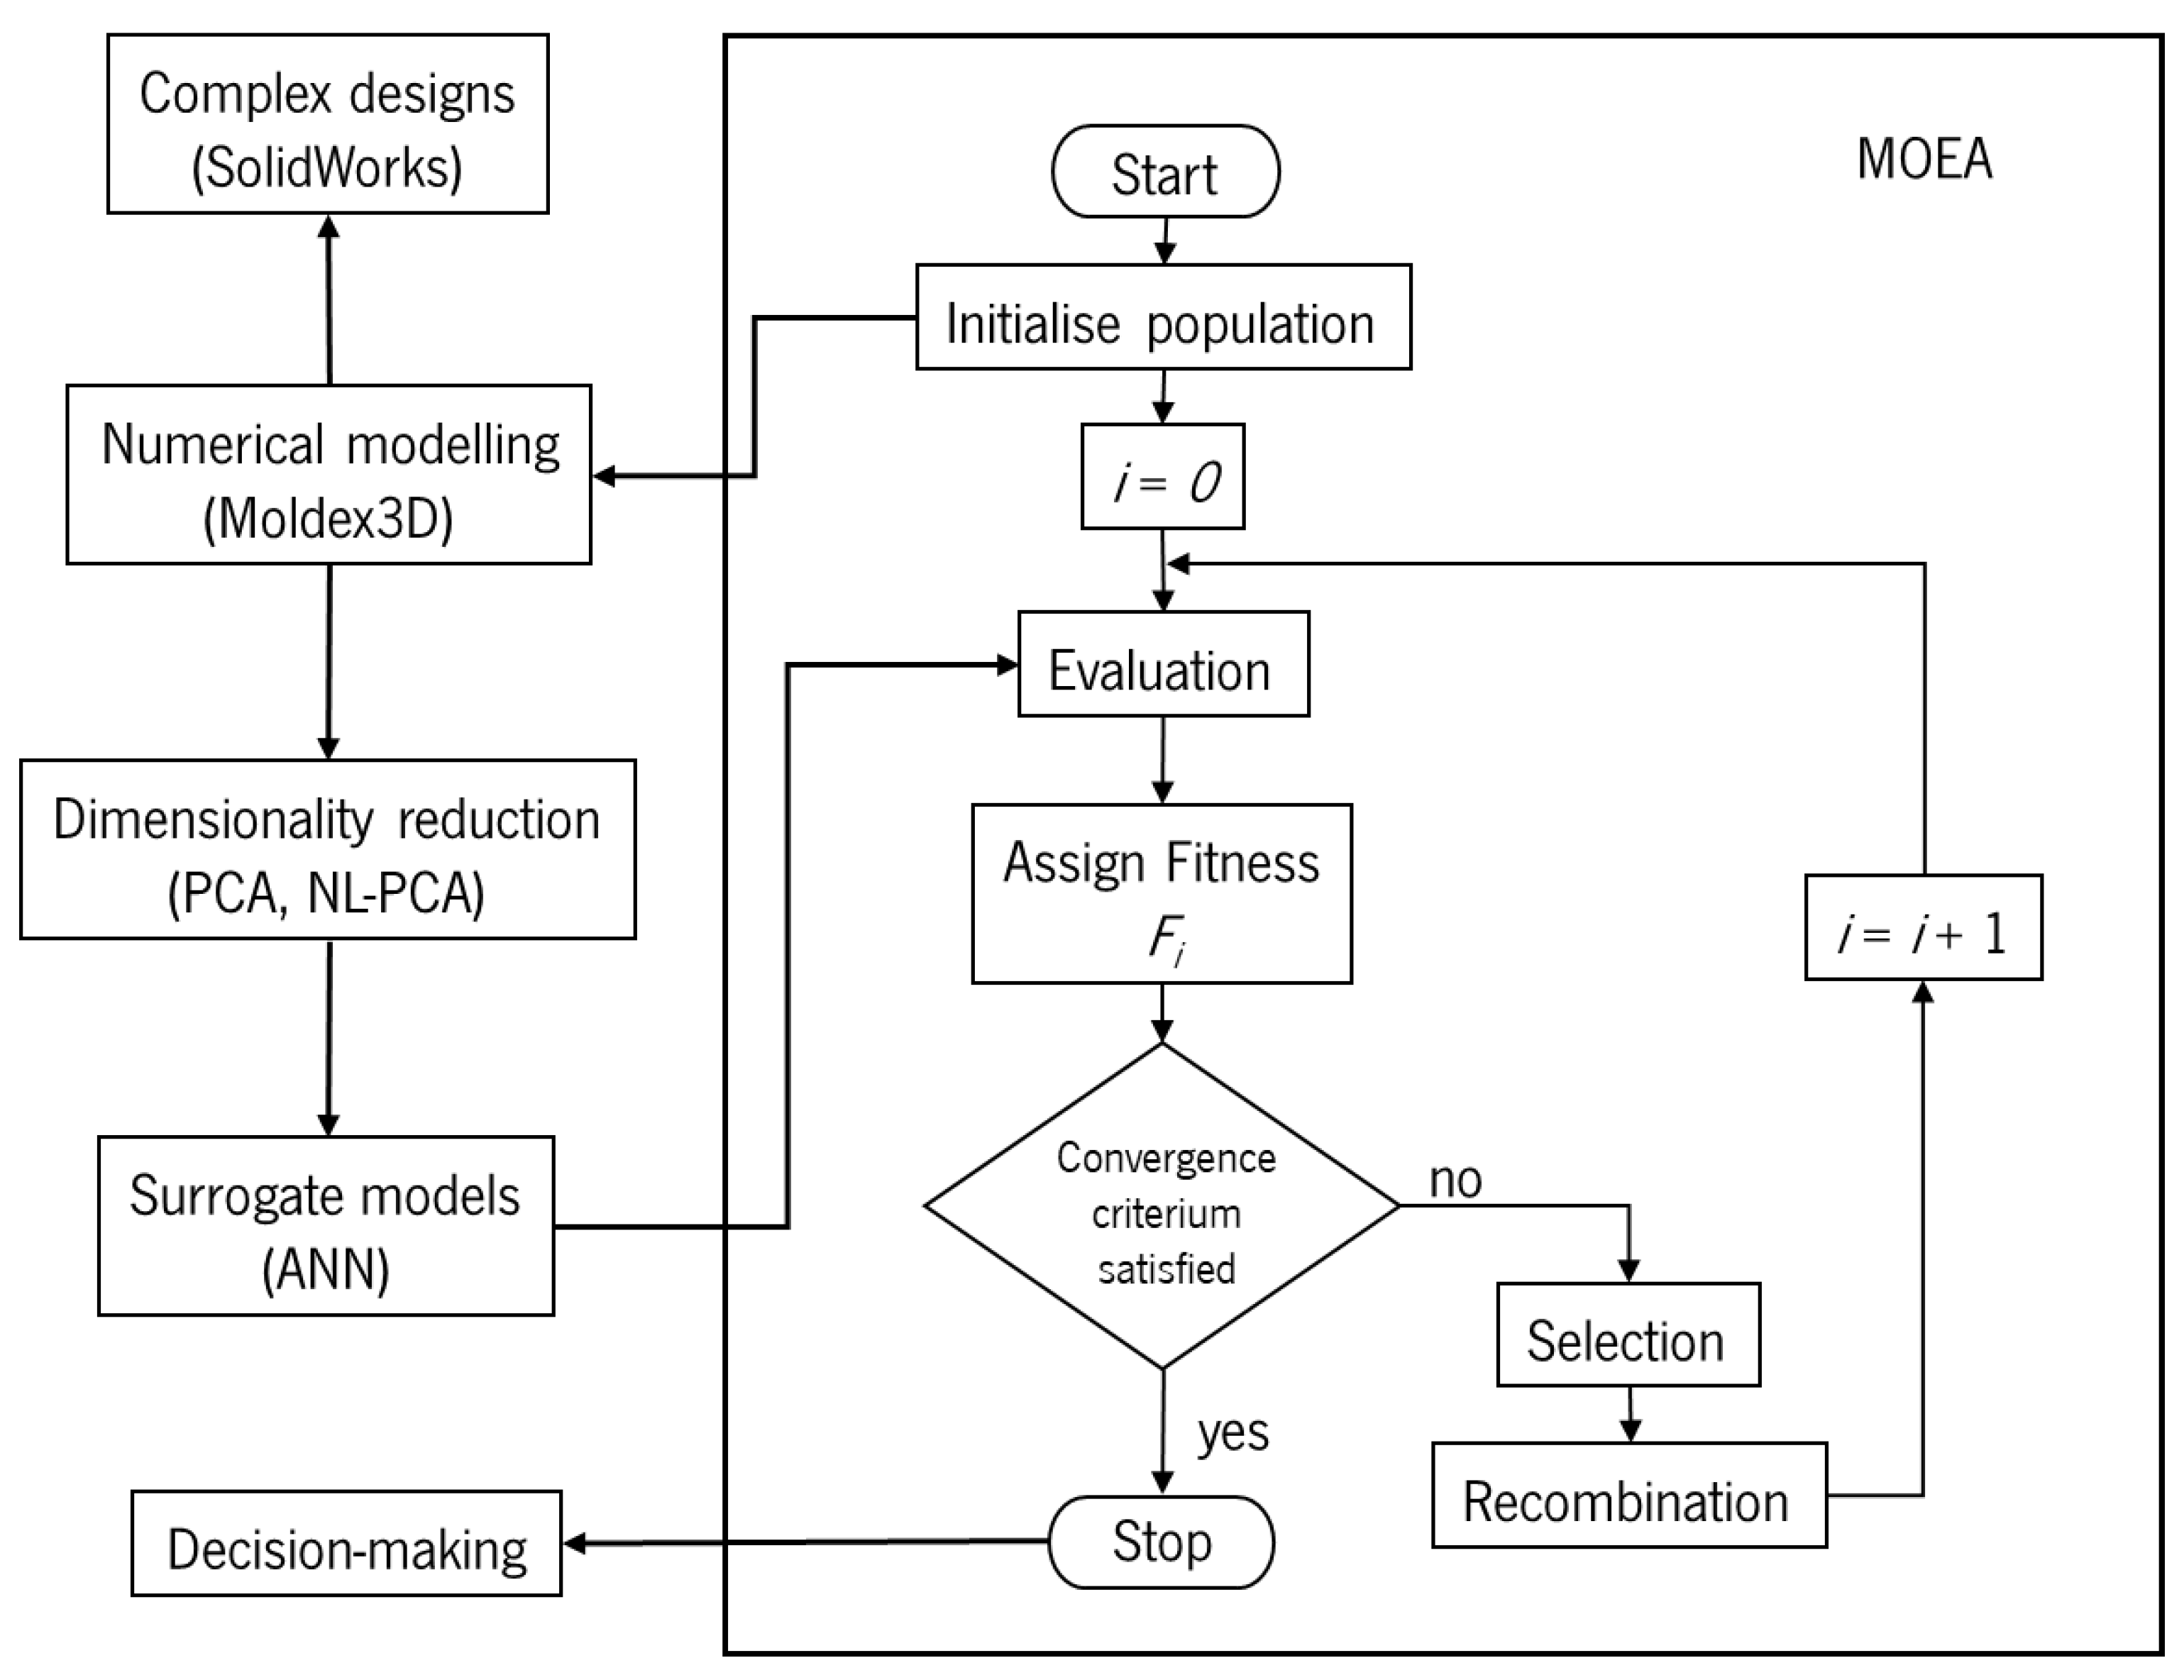
Figure 3.
System to be optimized: A) part geometry; B) CCC system parameters for conventional and two rings (left) and three rings (right); C) CCC system parameters for spiral; and D) CCC system parameters for zigzag.
Figure 3.
System to be optimized: A) part geometry; B) CCC system parameters for conventional and two rings (left) and three rings (right); C) CCC system parameters for spiral; and D) CCC system parameters for zigzag.
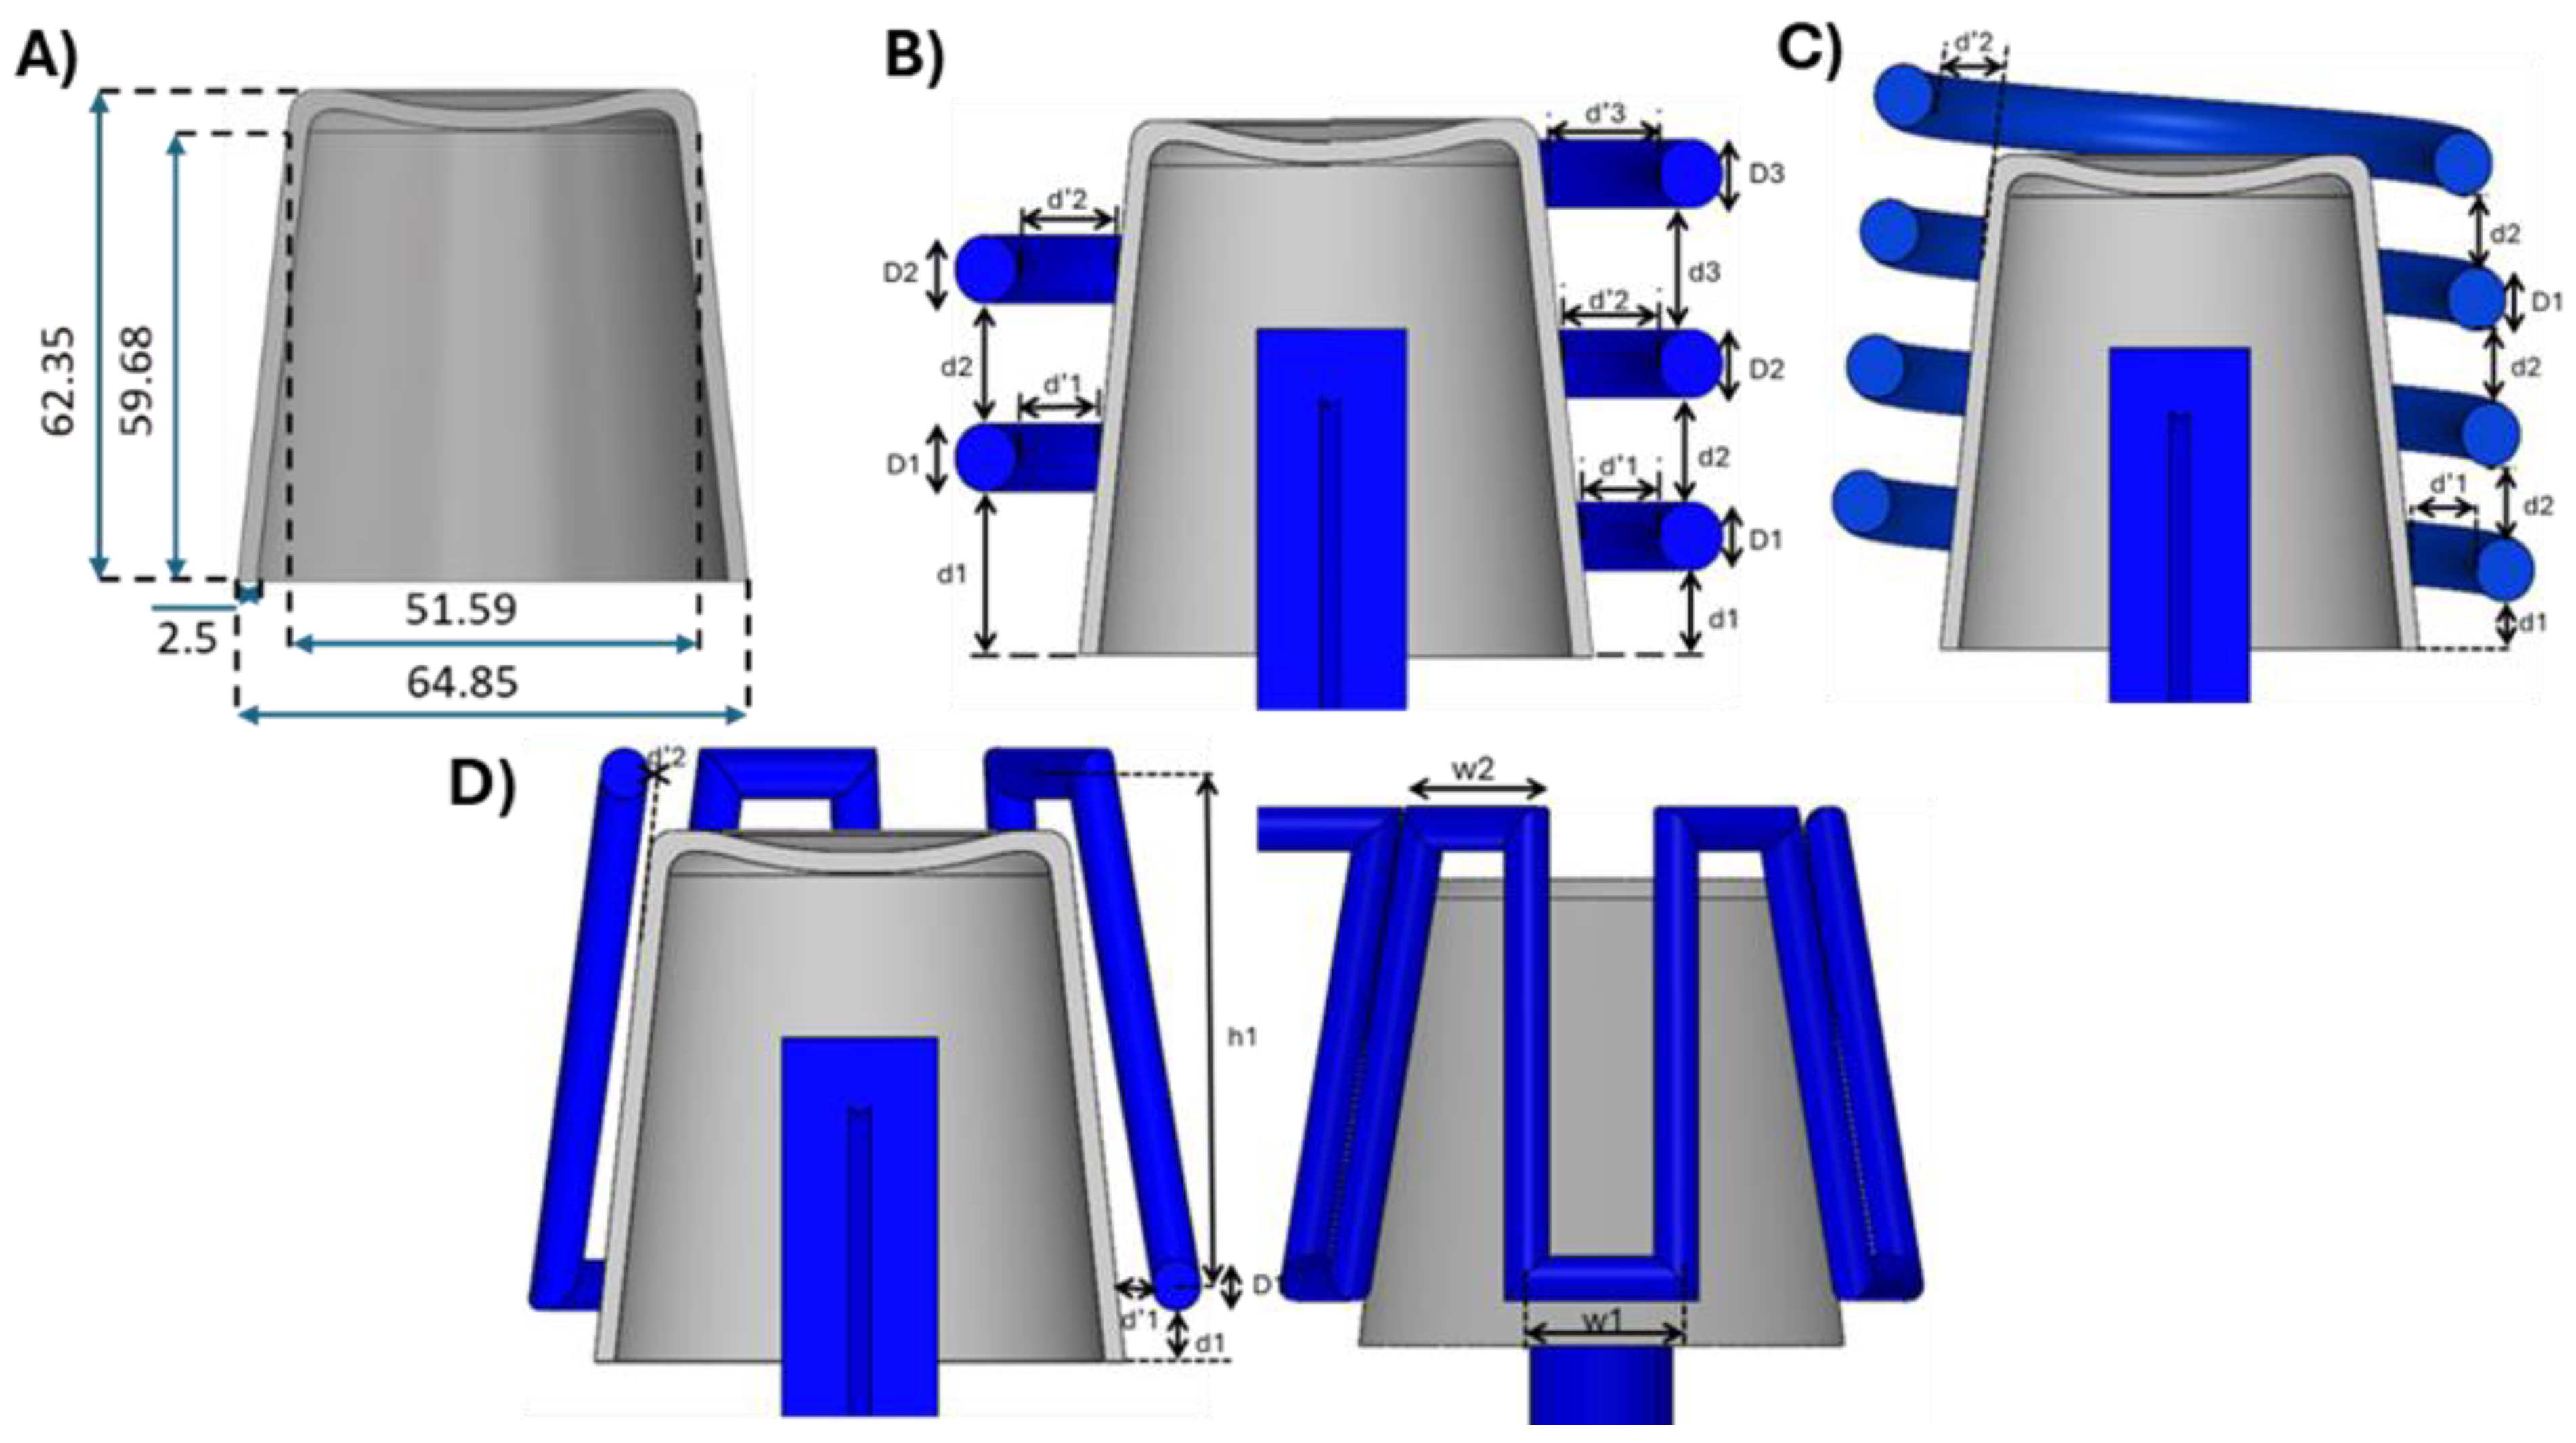
Figure 4.
ANN error: predicted vs. actual values.
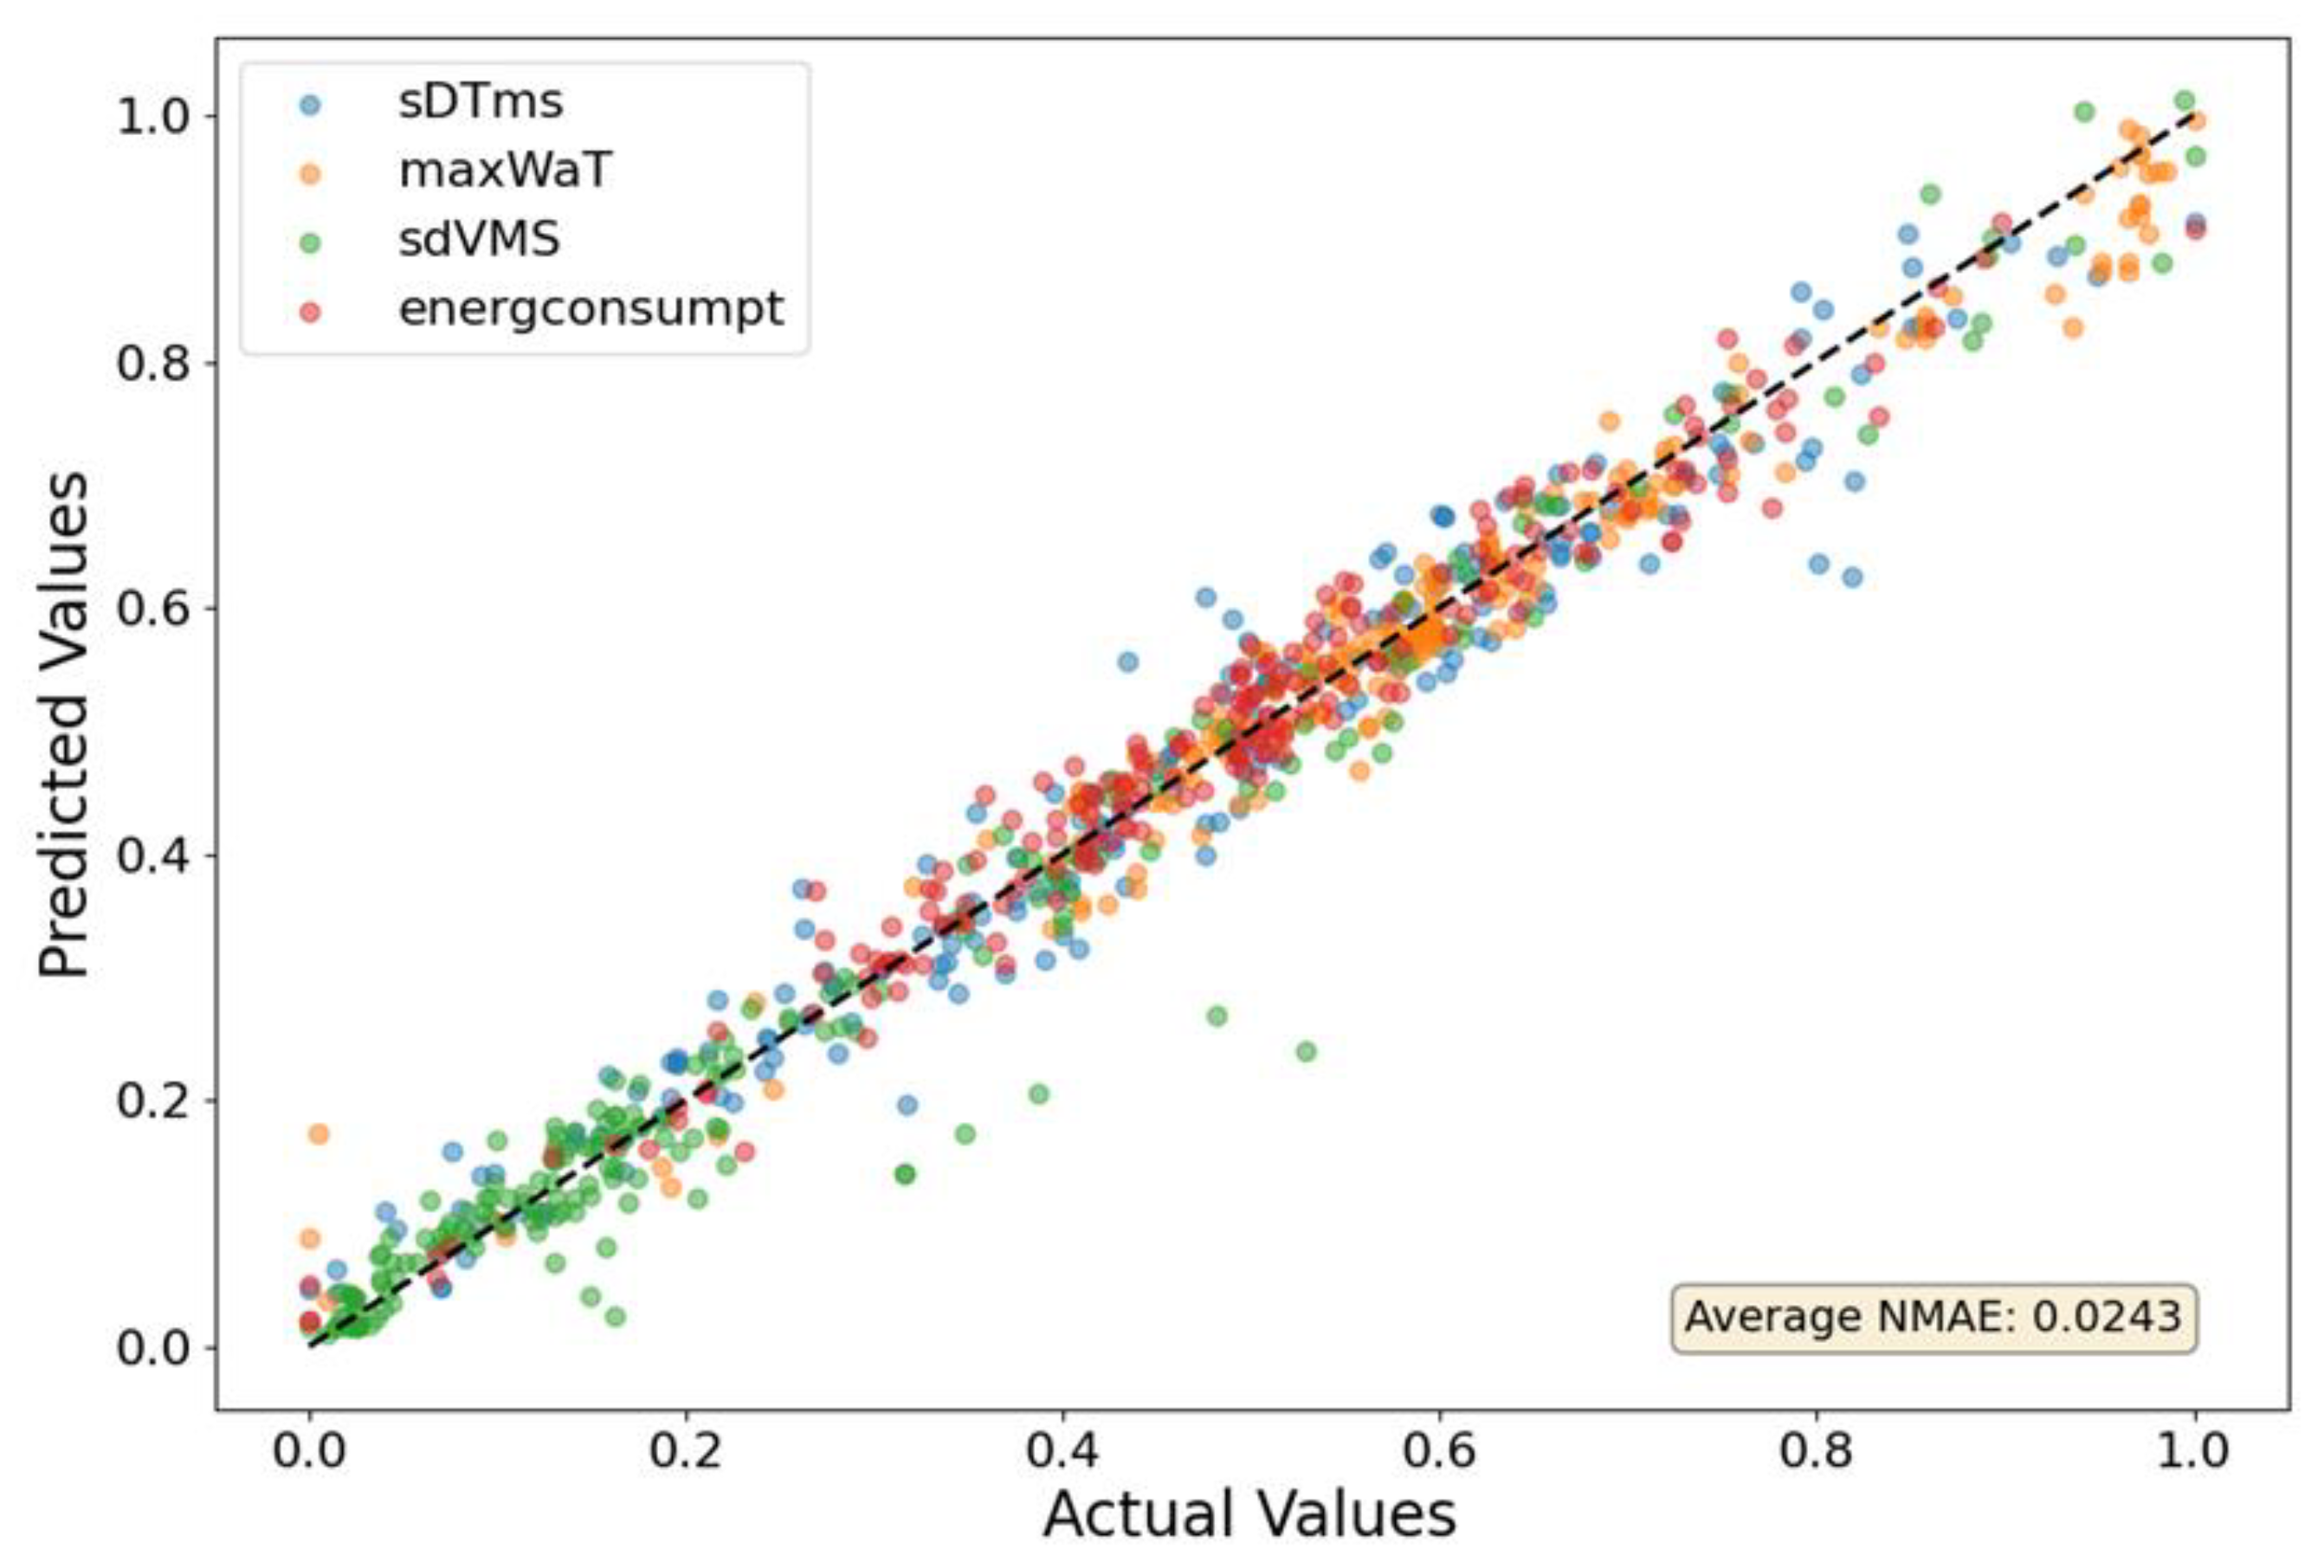
Figure 5.
Optimization of two-ring circular channels for four objectives (sDTms, maxWaT, sdVMS, and energconsumpt).
Figure 5.
Optimization of two-ring circular channels for four objectives (sDTms, maxWaT, sdVMS, and energconsumpt).
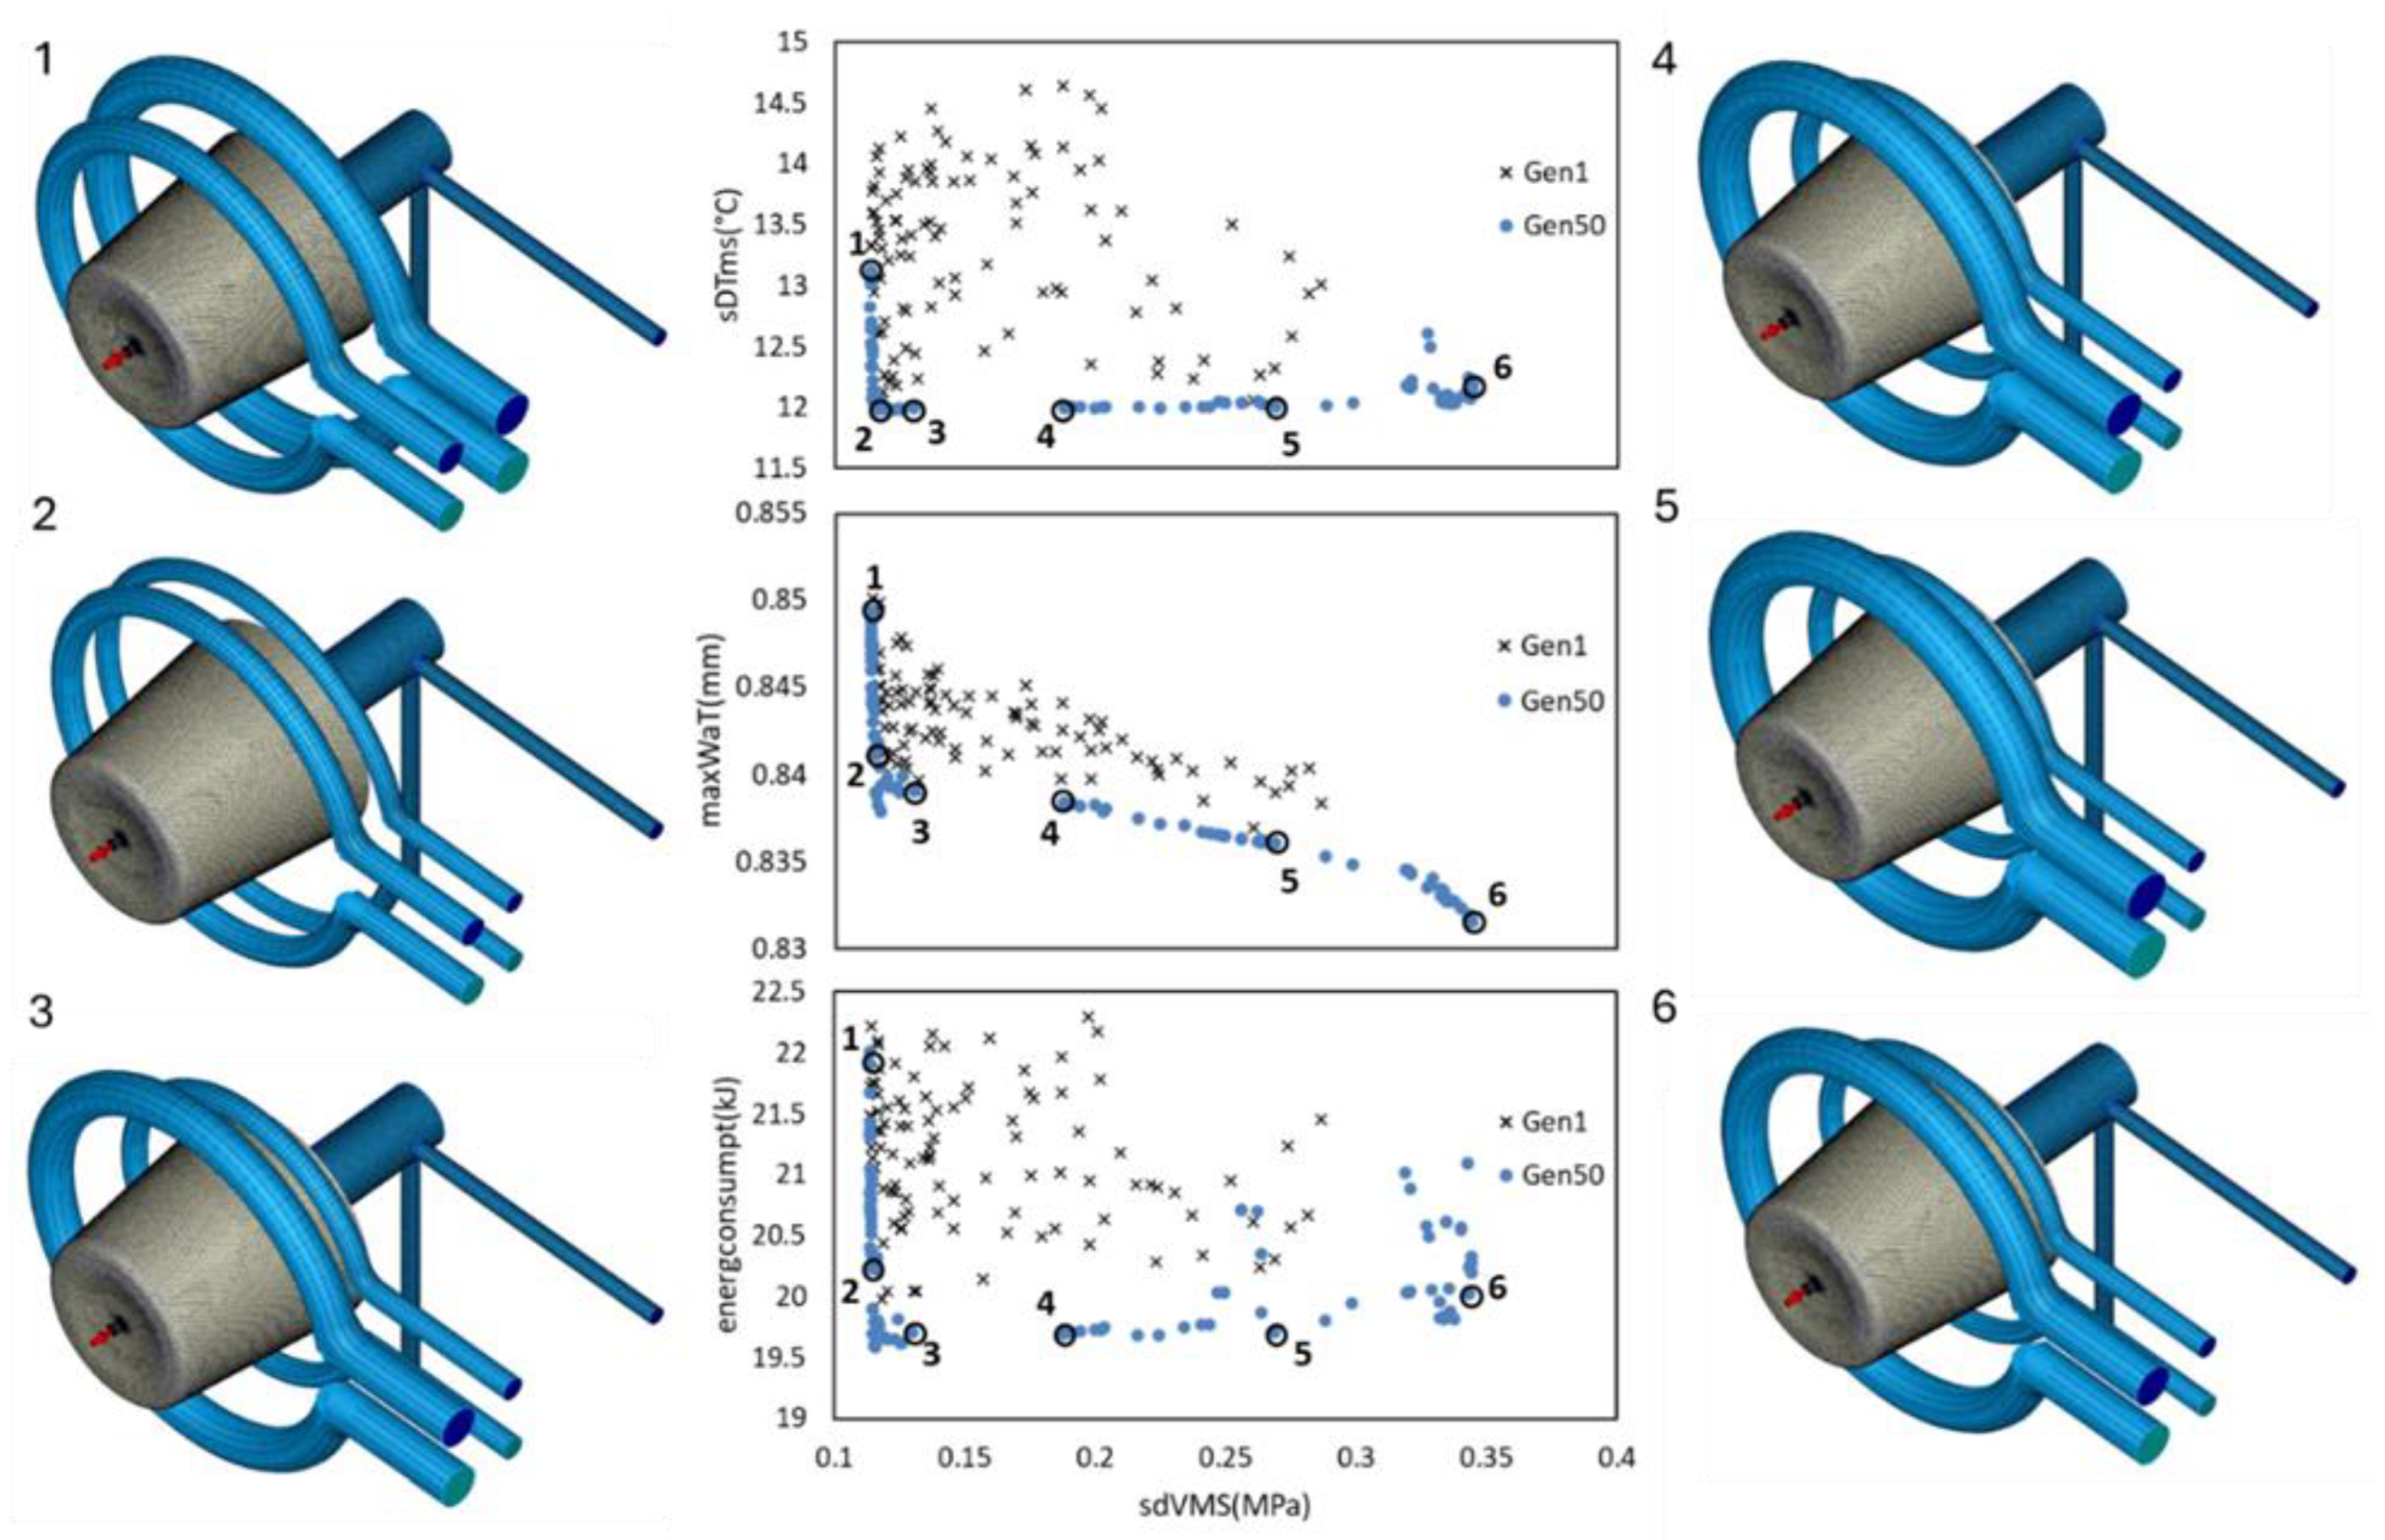
Figure 6.
Optimization results for the objective set tcycle, maxWaT and energconsumpt for: A) conventional channels; B) 2-rings; C) 3-rings; D) spiral channel; E) zigzag channel.
Figure 6.
Optimization results for the objective set tcycle, maxWaT and energconsumpt for: A) conventional channels; B) 2-rings; C) 3-rings; D) spiral channel; E) zigzag channel.
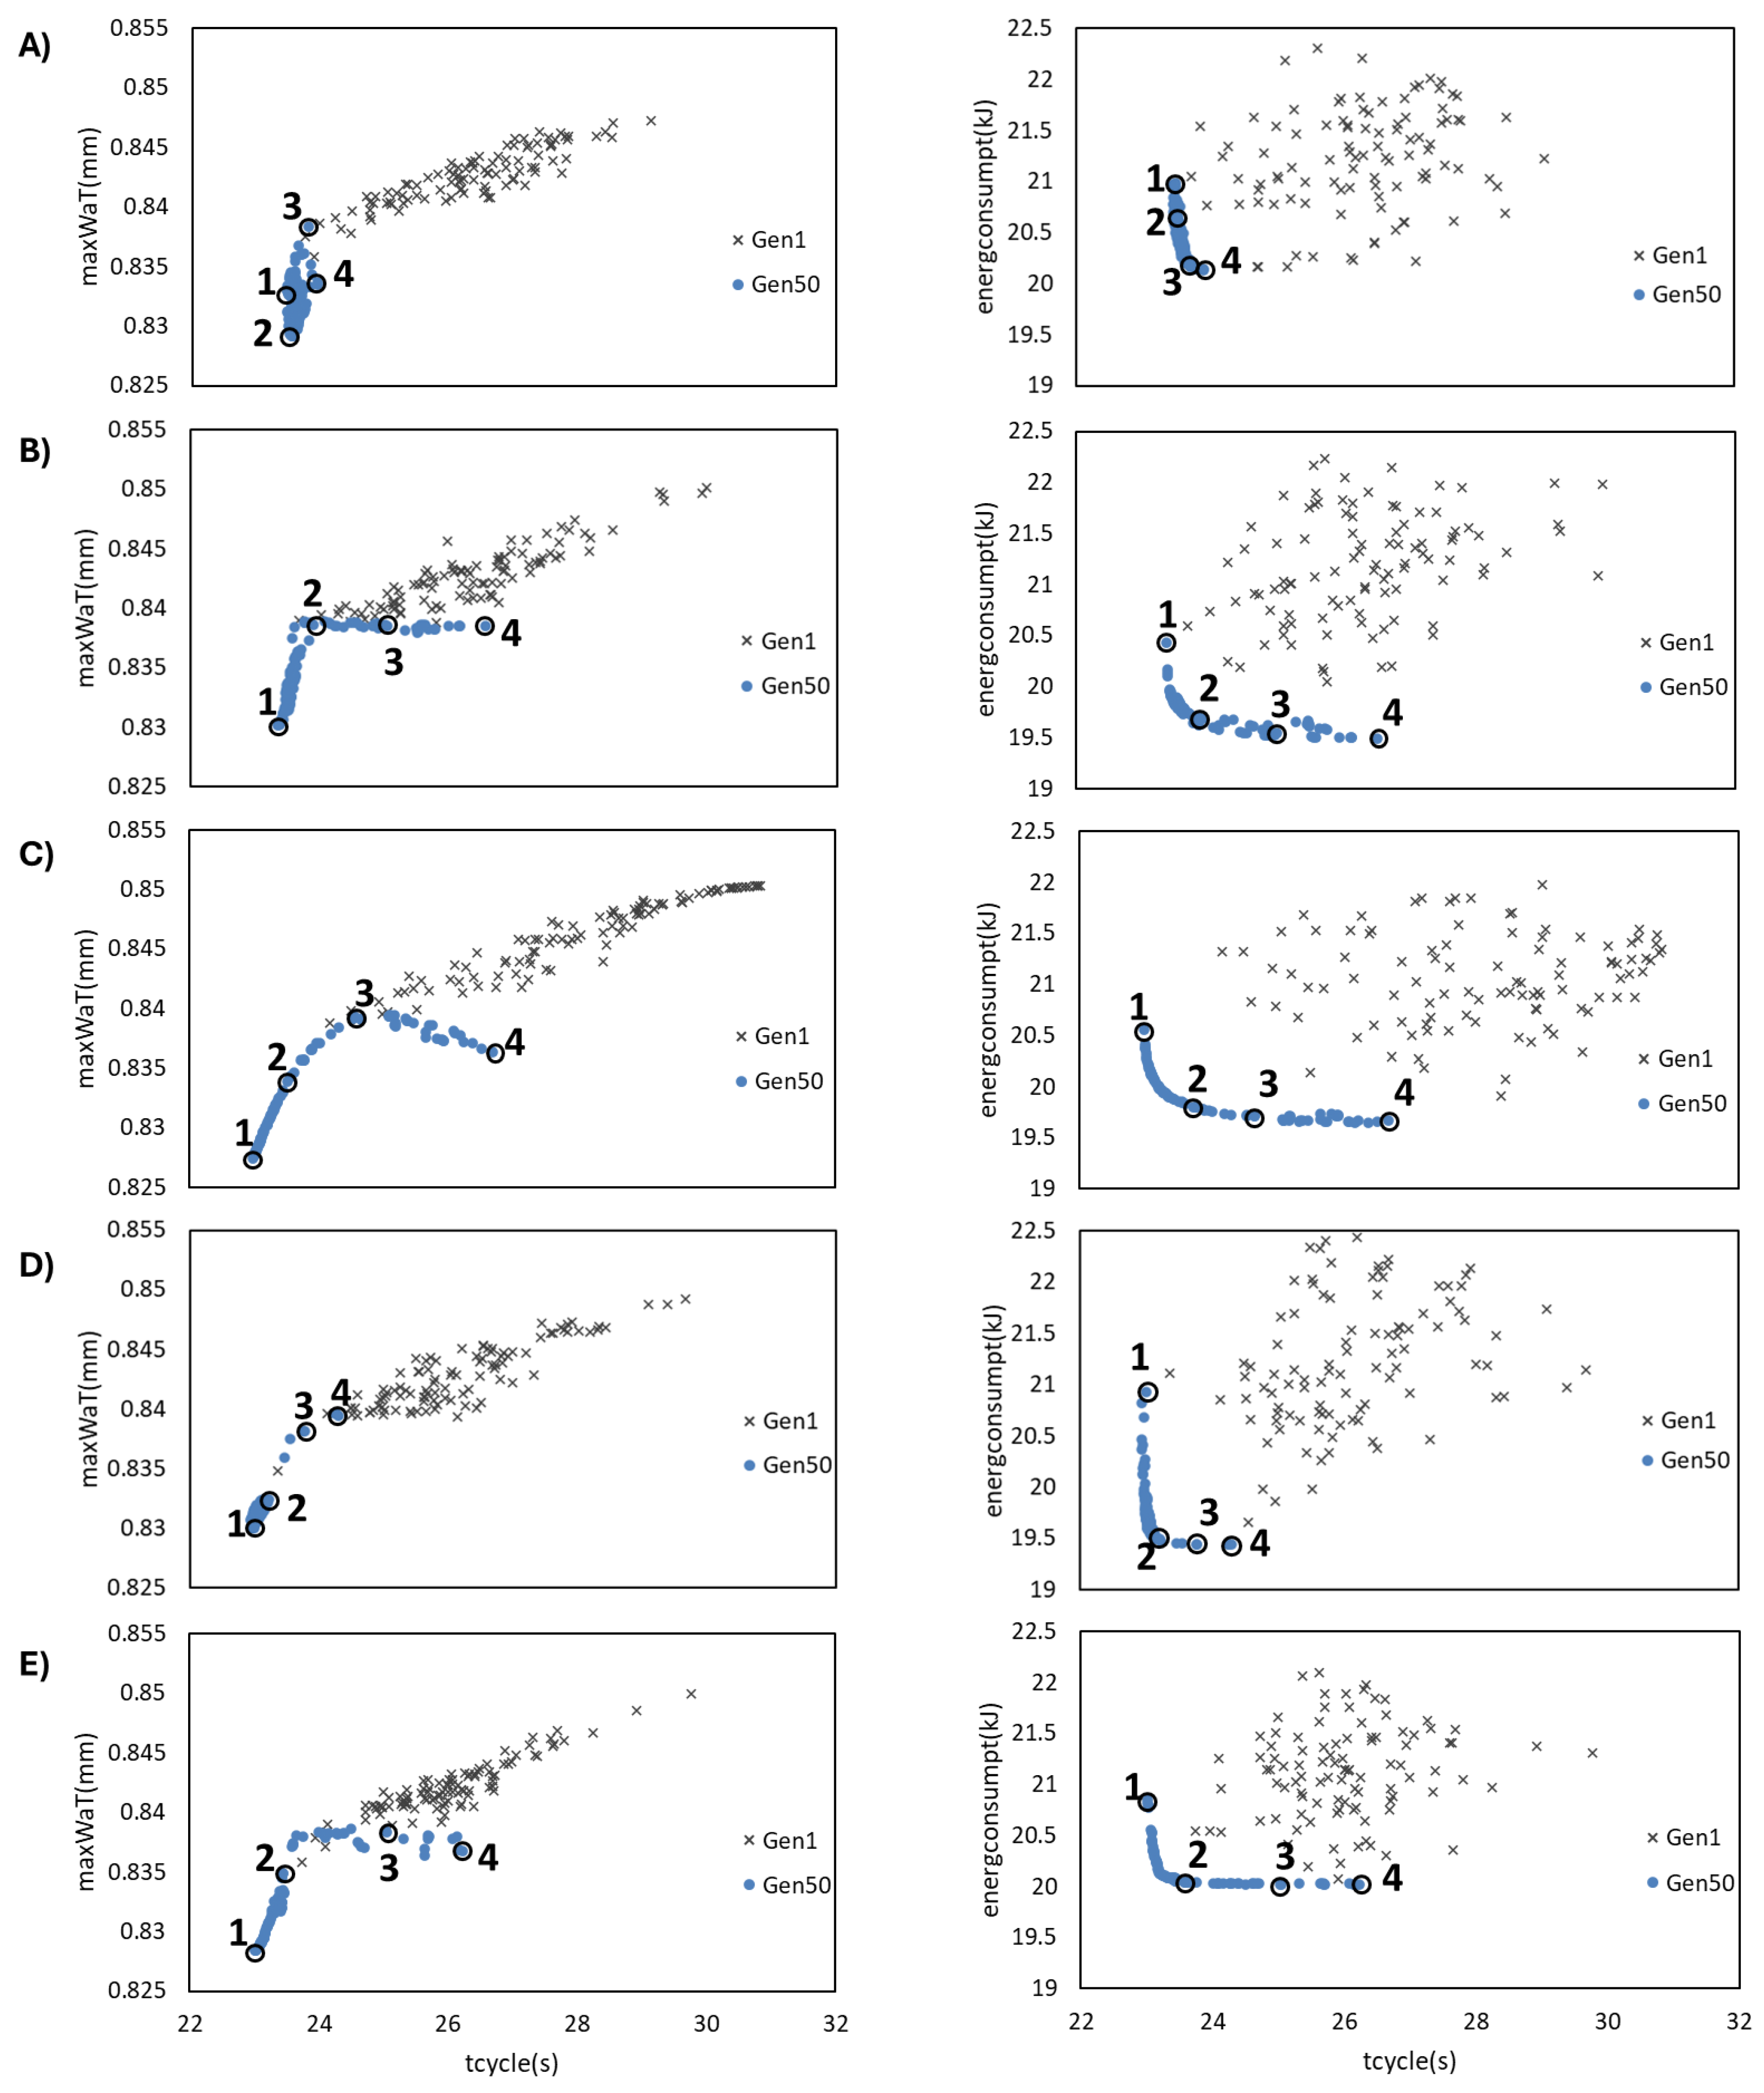
Figure 7.
Selected solutions for conventional channels for the following objective set: tcycle, maxWaT and energconsumpt.
Figure 7.
Selected solutions for conventional channels for the following objective set: tcycle, maxWaT and energconsumpt.
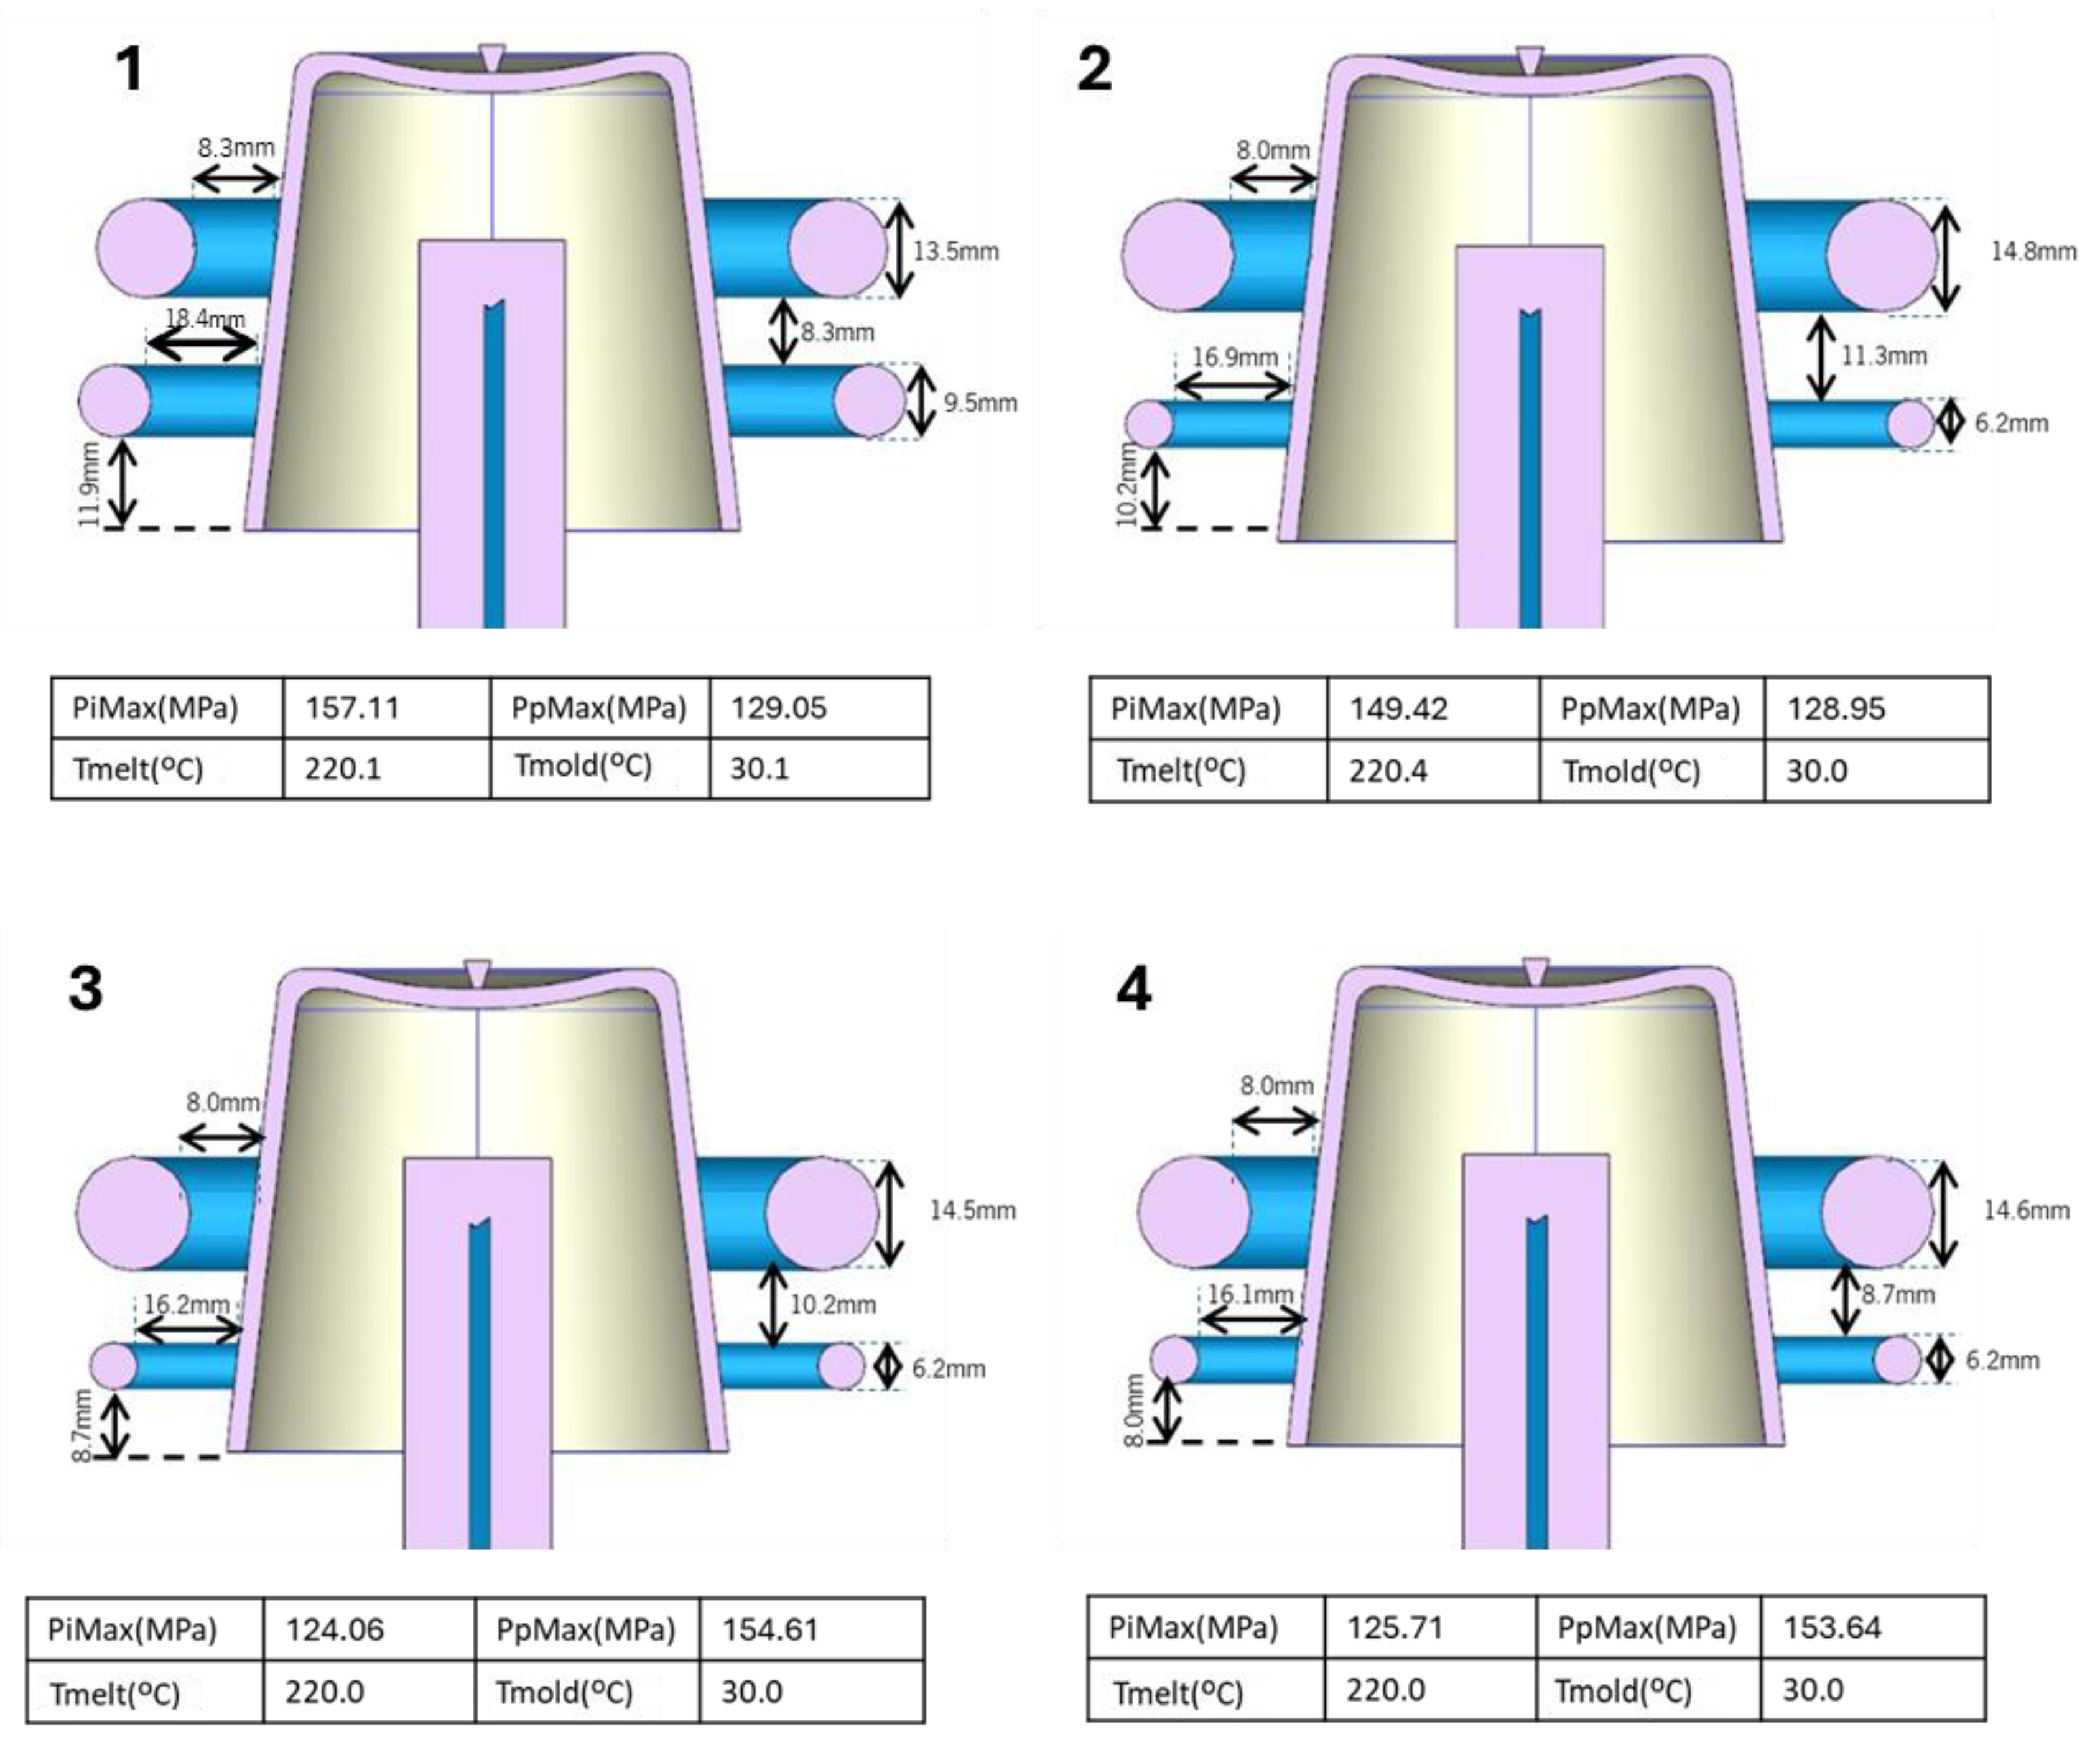
Figure 8.
Selected solutions for 2-rings channels for the following objective set: tcycle, maxWaT and energconsumpt.
Figure 8.
Selected solutions for 2-rings channels for the following objective set: tcycle, maxWaT and energconsumpt.
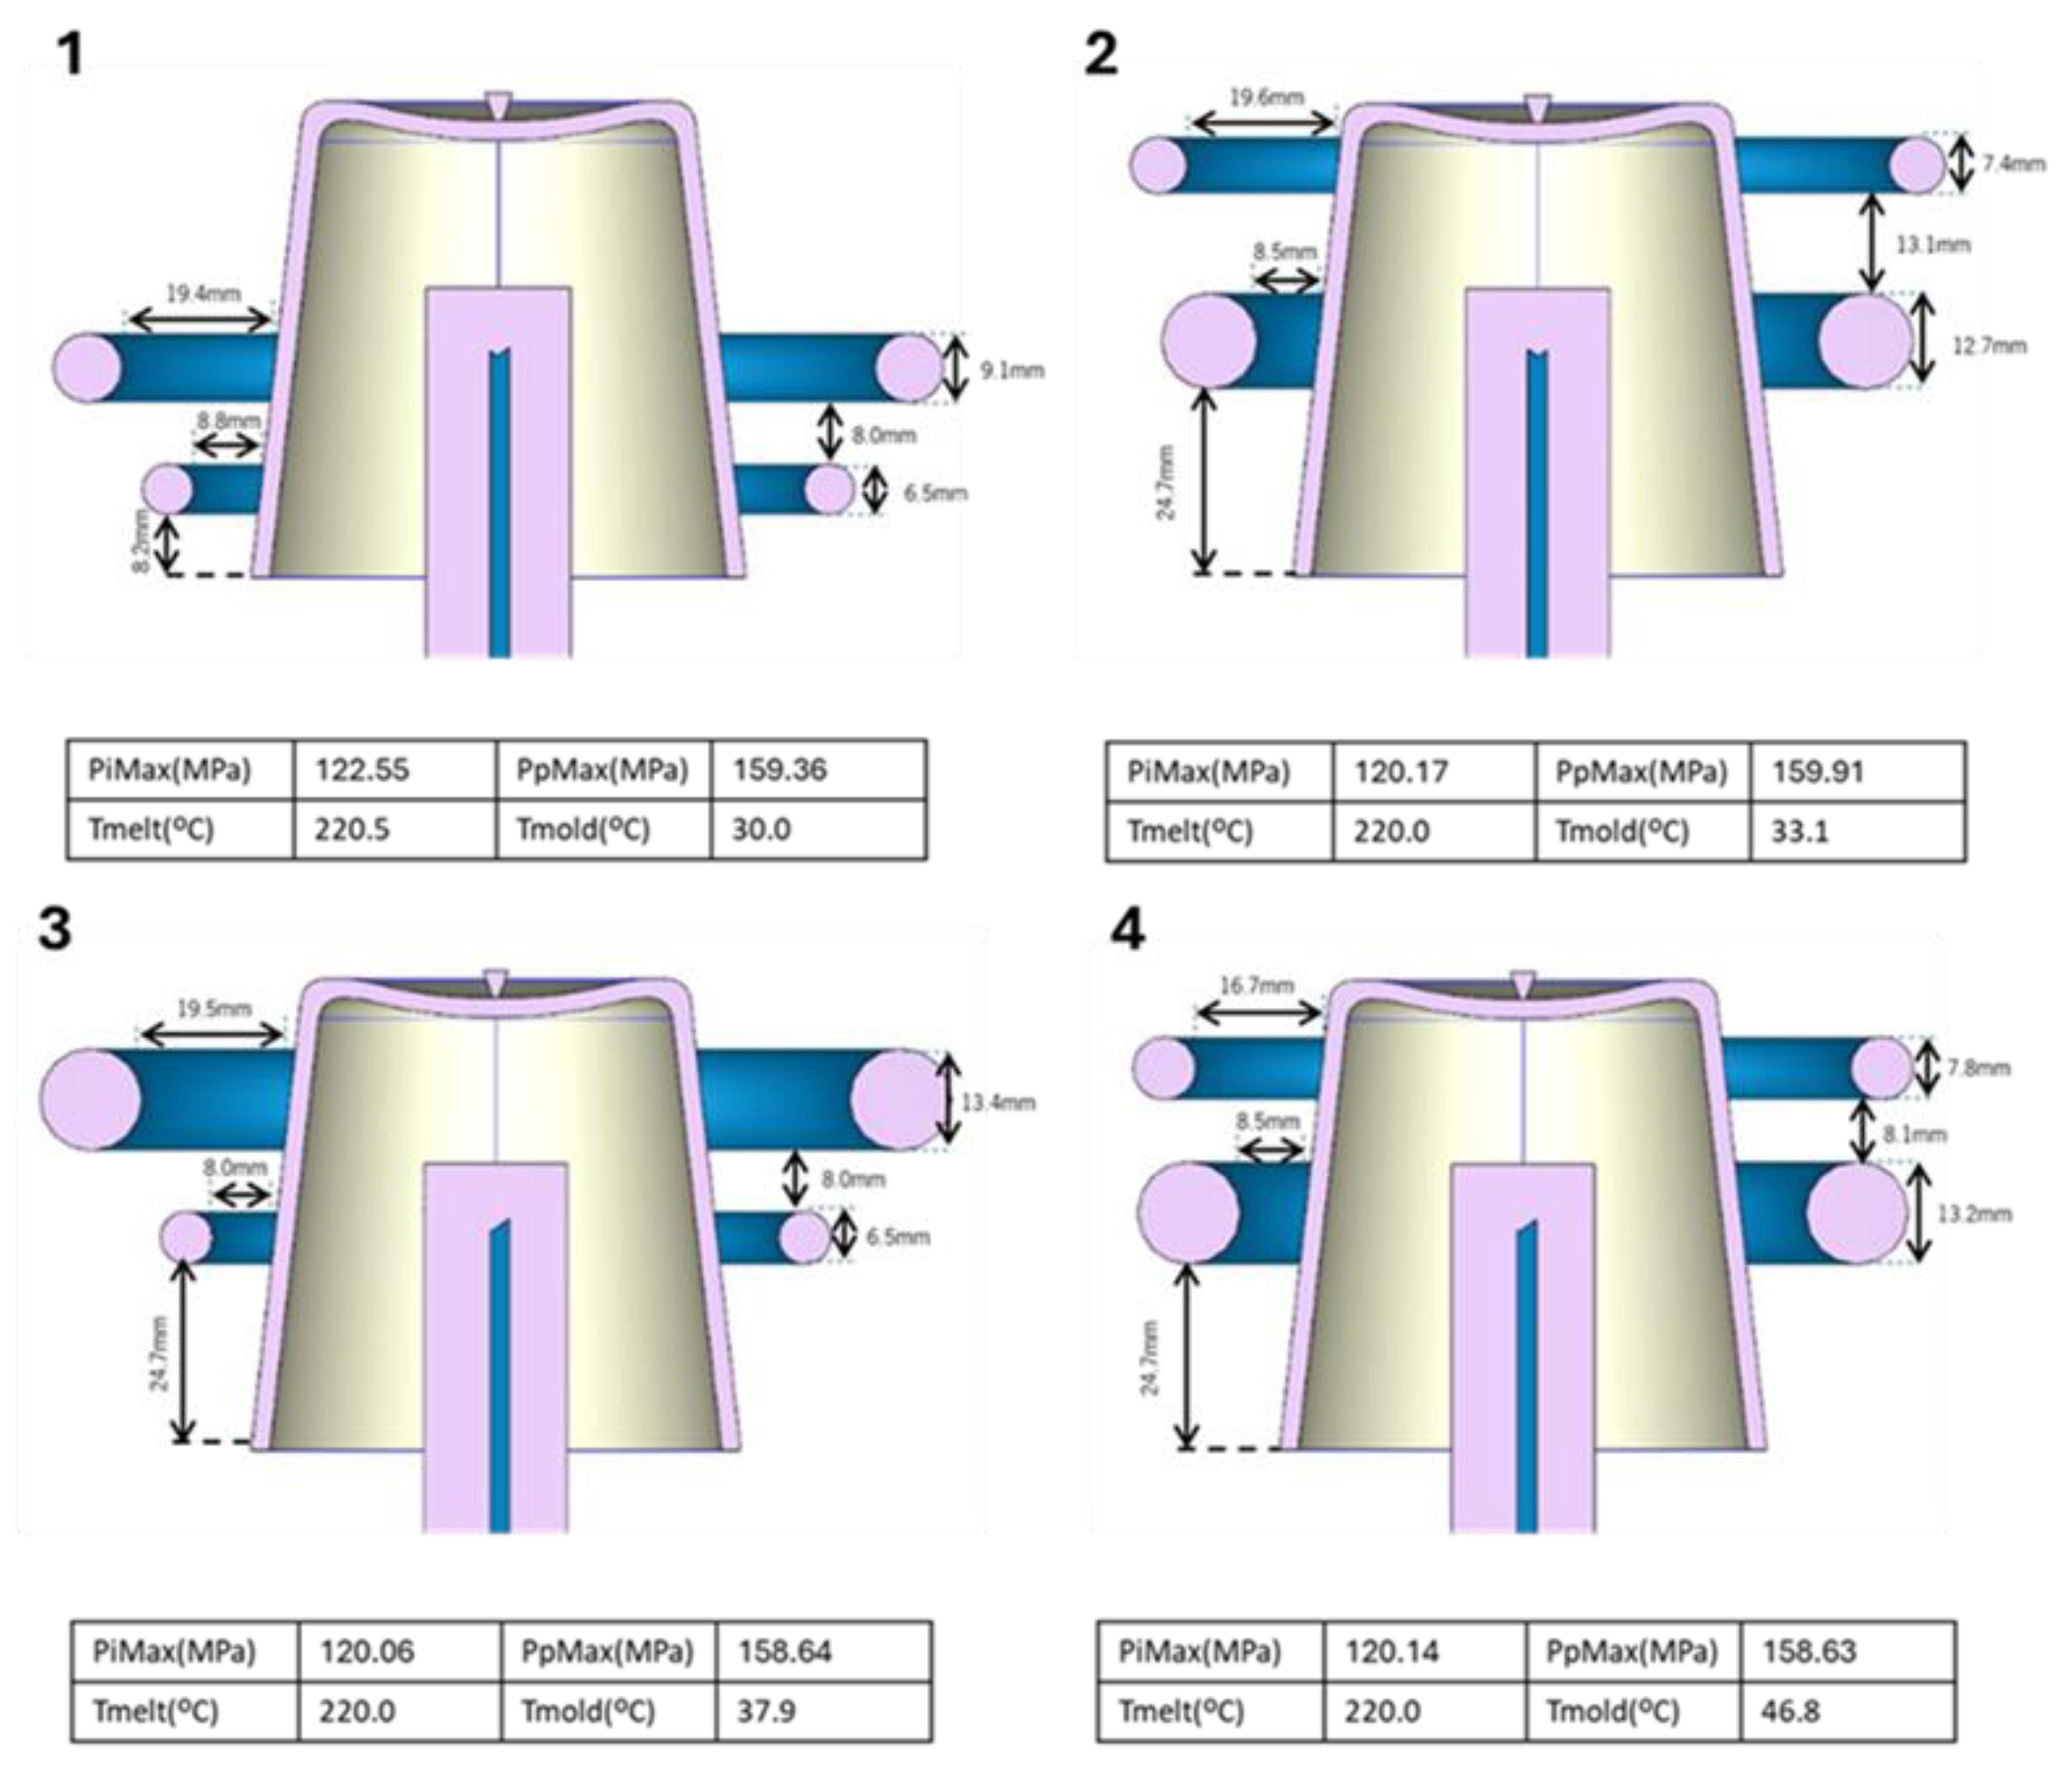
Figure 9.
Selected solutions for 3-rings channels for the following objective set: tcycle, maxWaT and energconsumpt.
Figure 9.
Selected solutions for 3-rings channels for the following objective set: tcycle, maxWaT and energconsumpt.
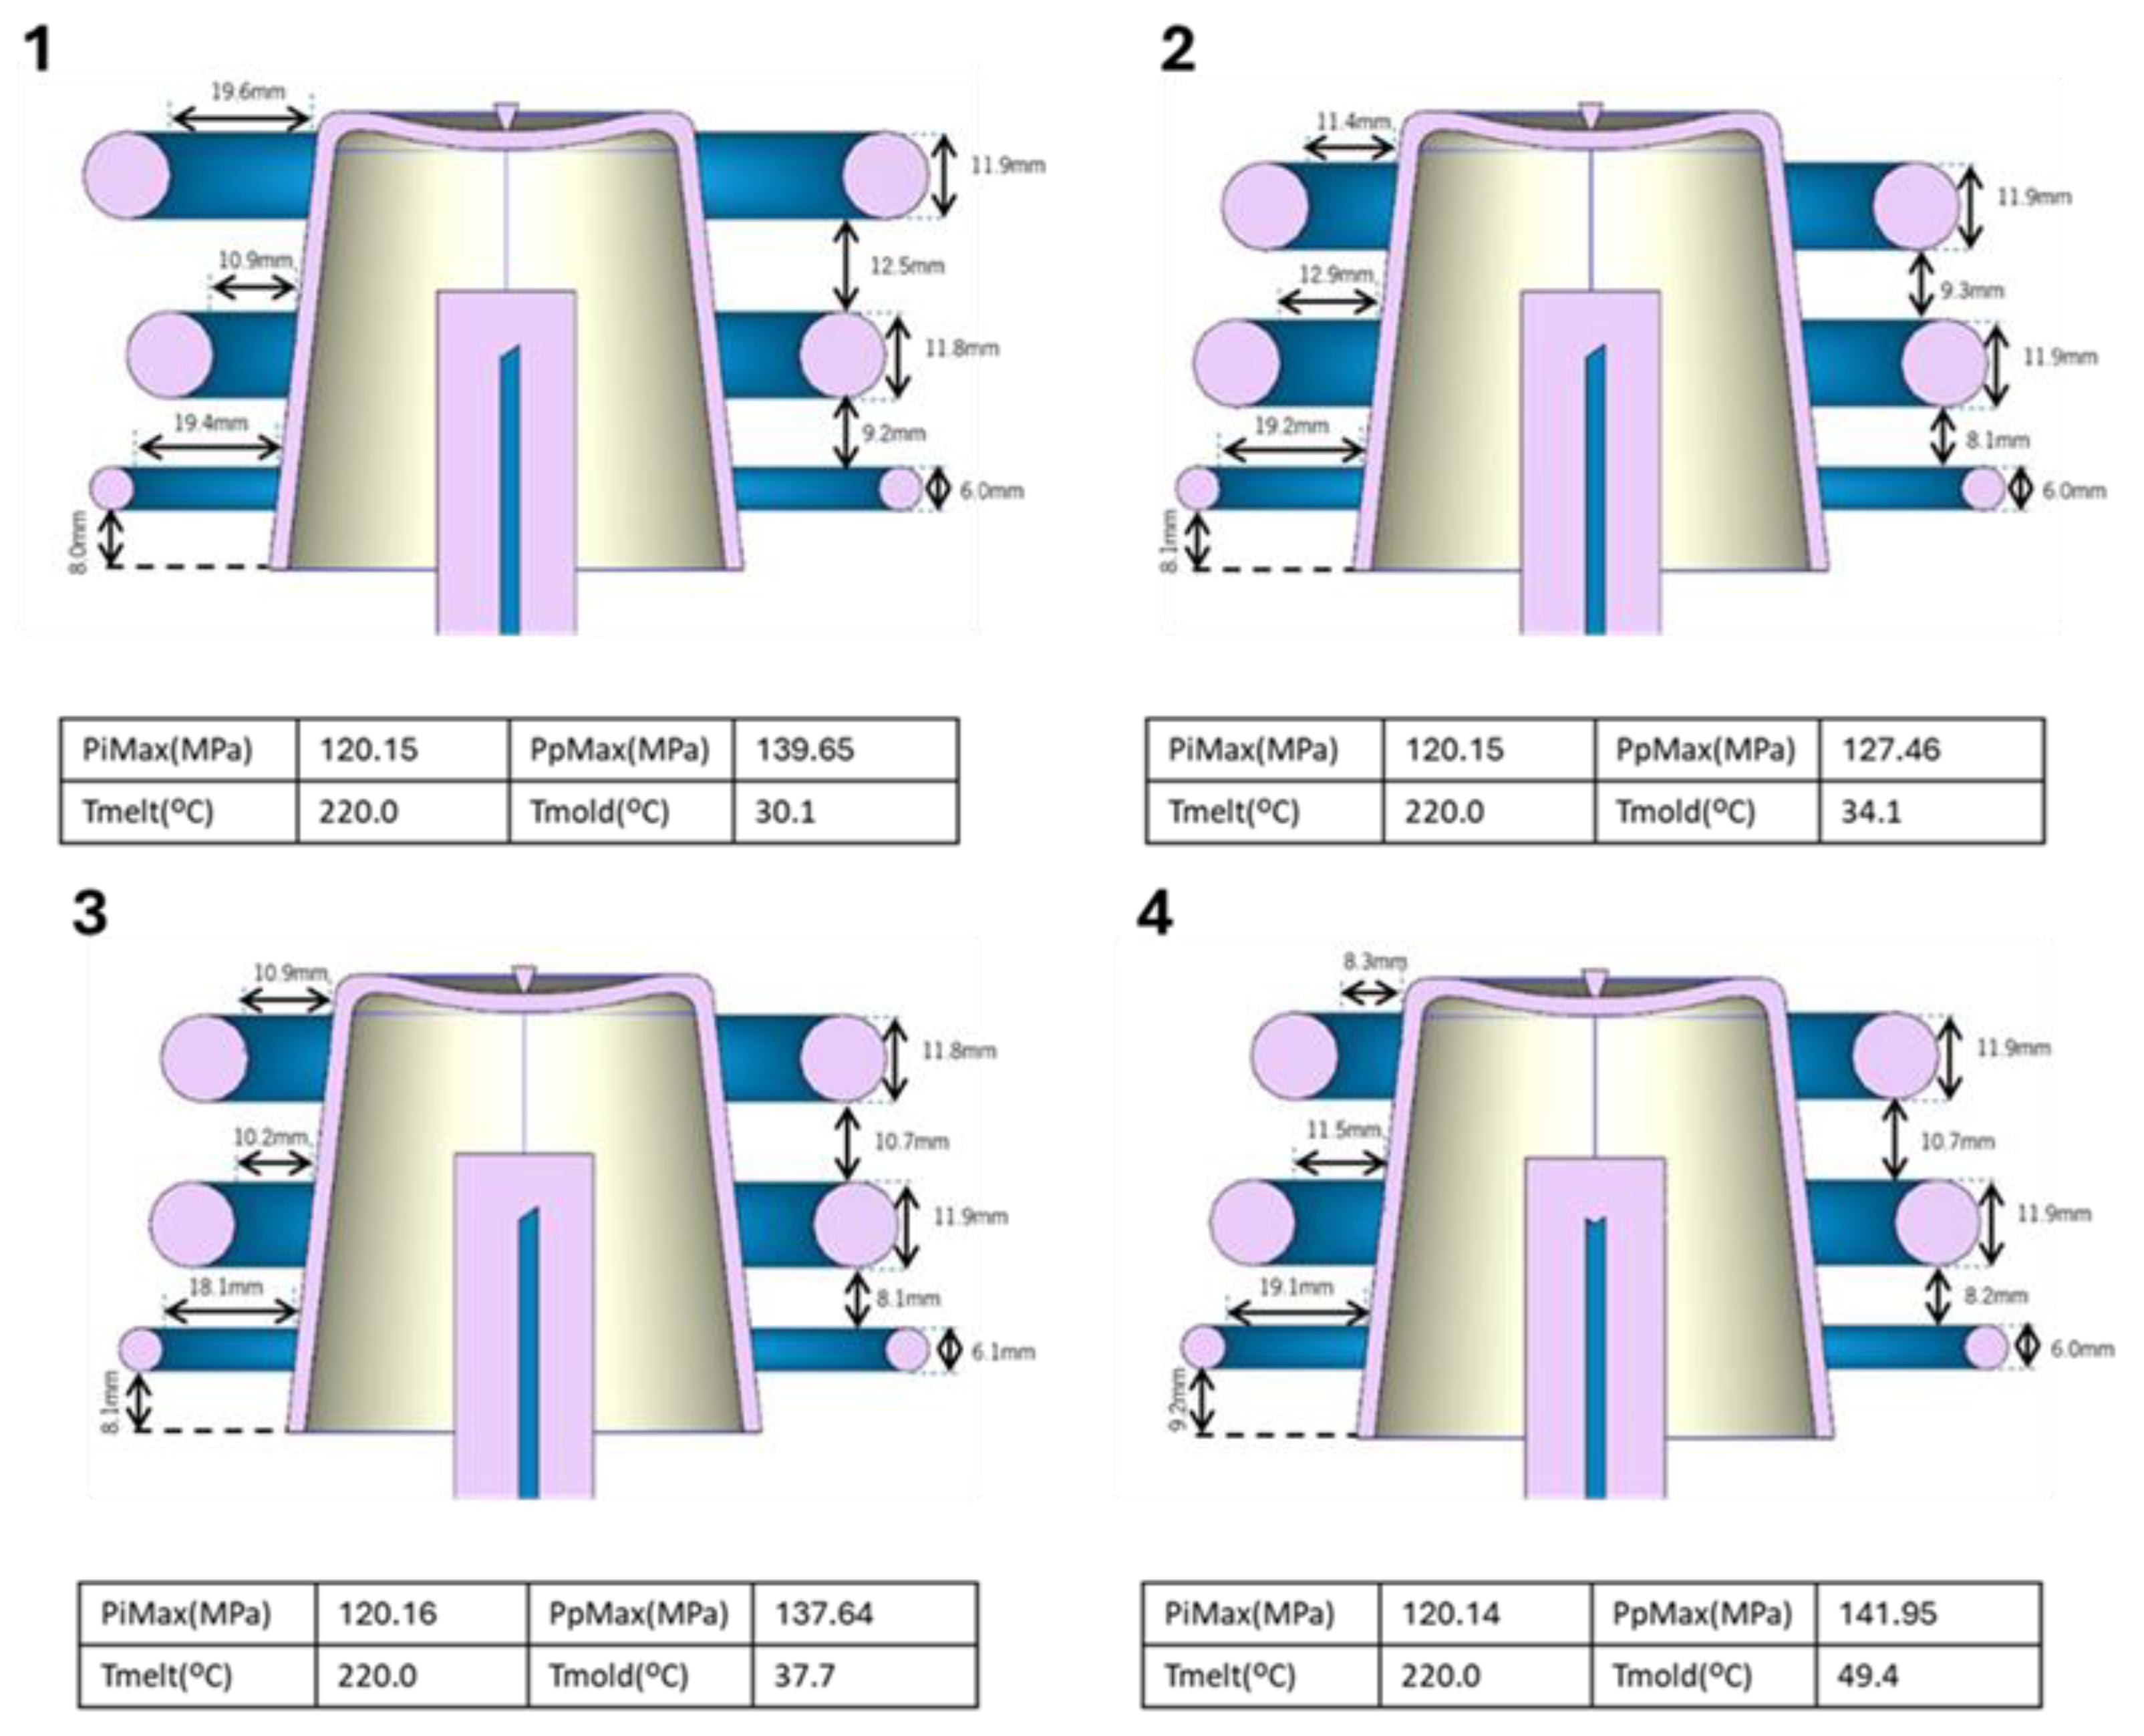
Figure 10.
Selected solutions for a spiral channel for the following objective set: tcycle, maxWaT and energconsumpt.
Figure 10.
Selected solutions for a spiral channel for the following objective set: tcycle, maxWaT and energconsumpt.
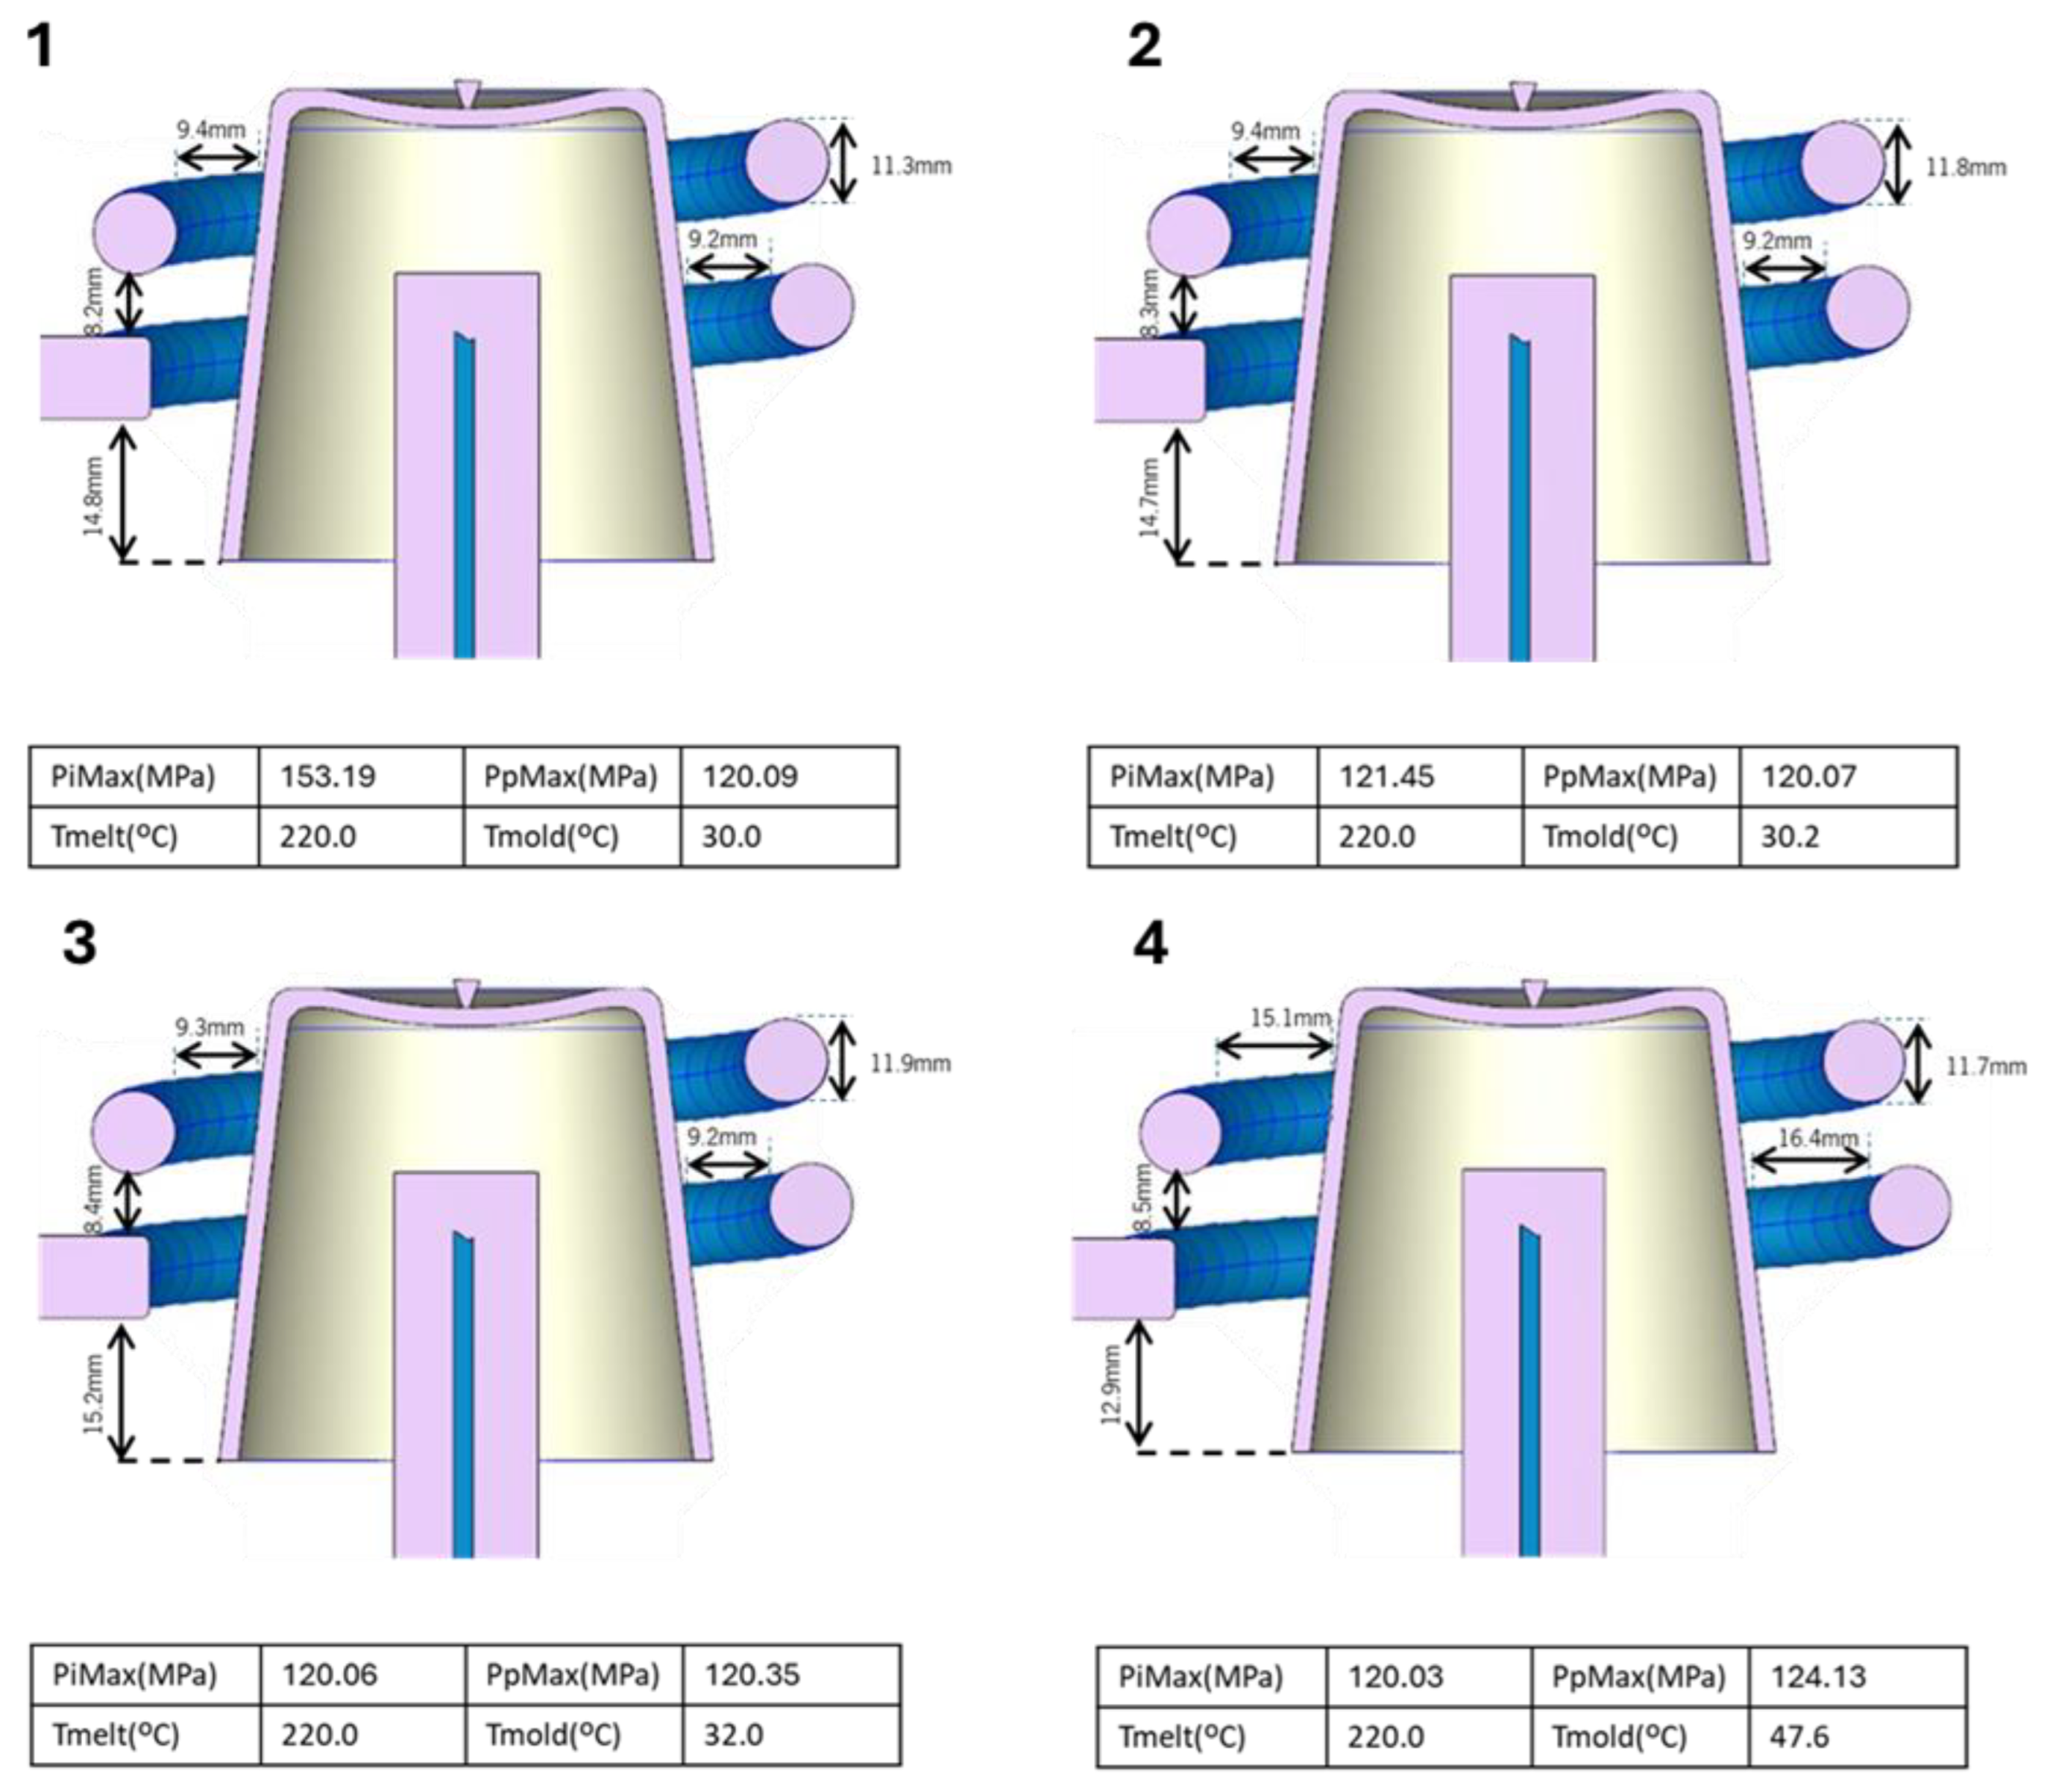
Figure 11.
Selected solutions for zigzag channel for the following objective set: tcycle, maxWaT and energconsumpt.
Figure 11.
Selected solutions for zigzag channel for the following objective set: tcycle, maxWaT and energconsumpt.
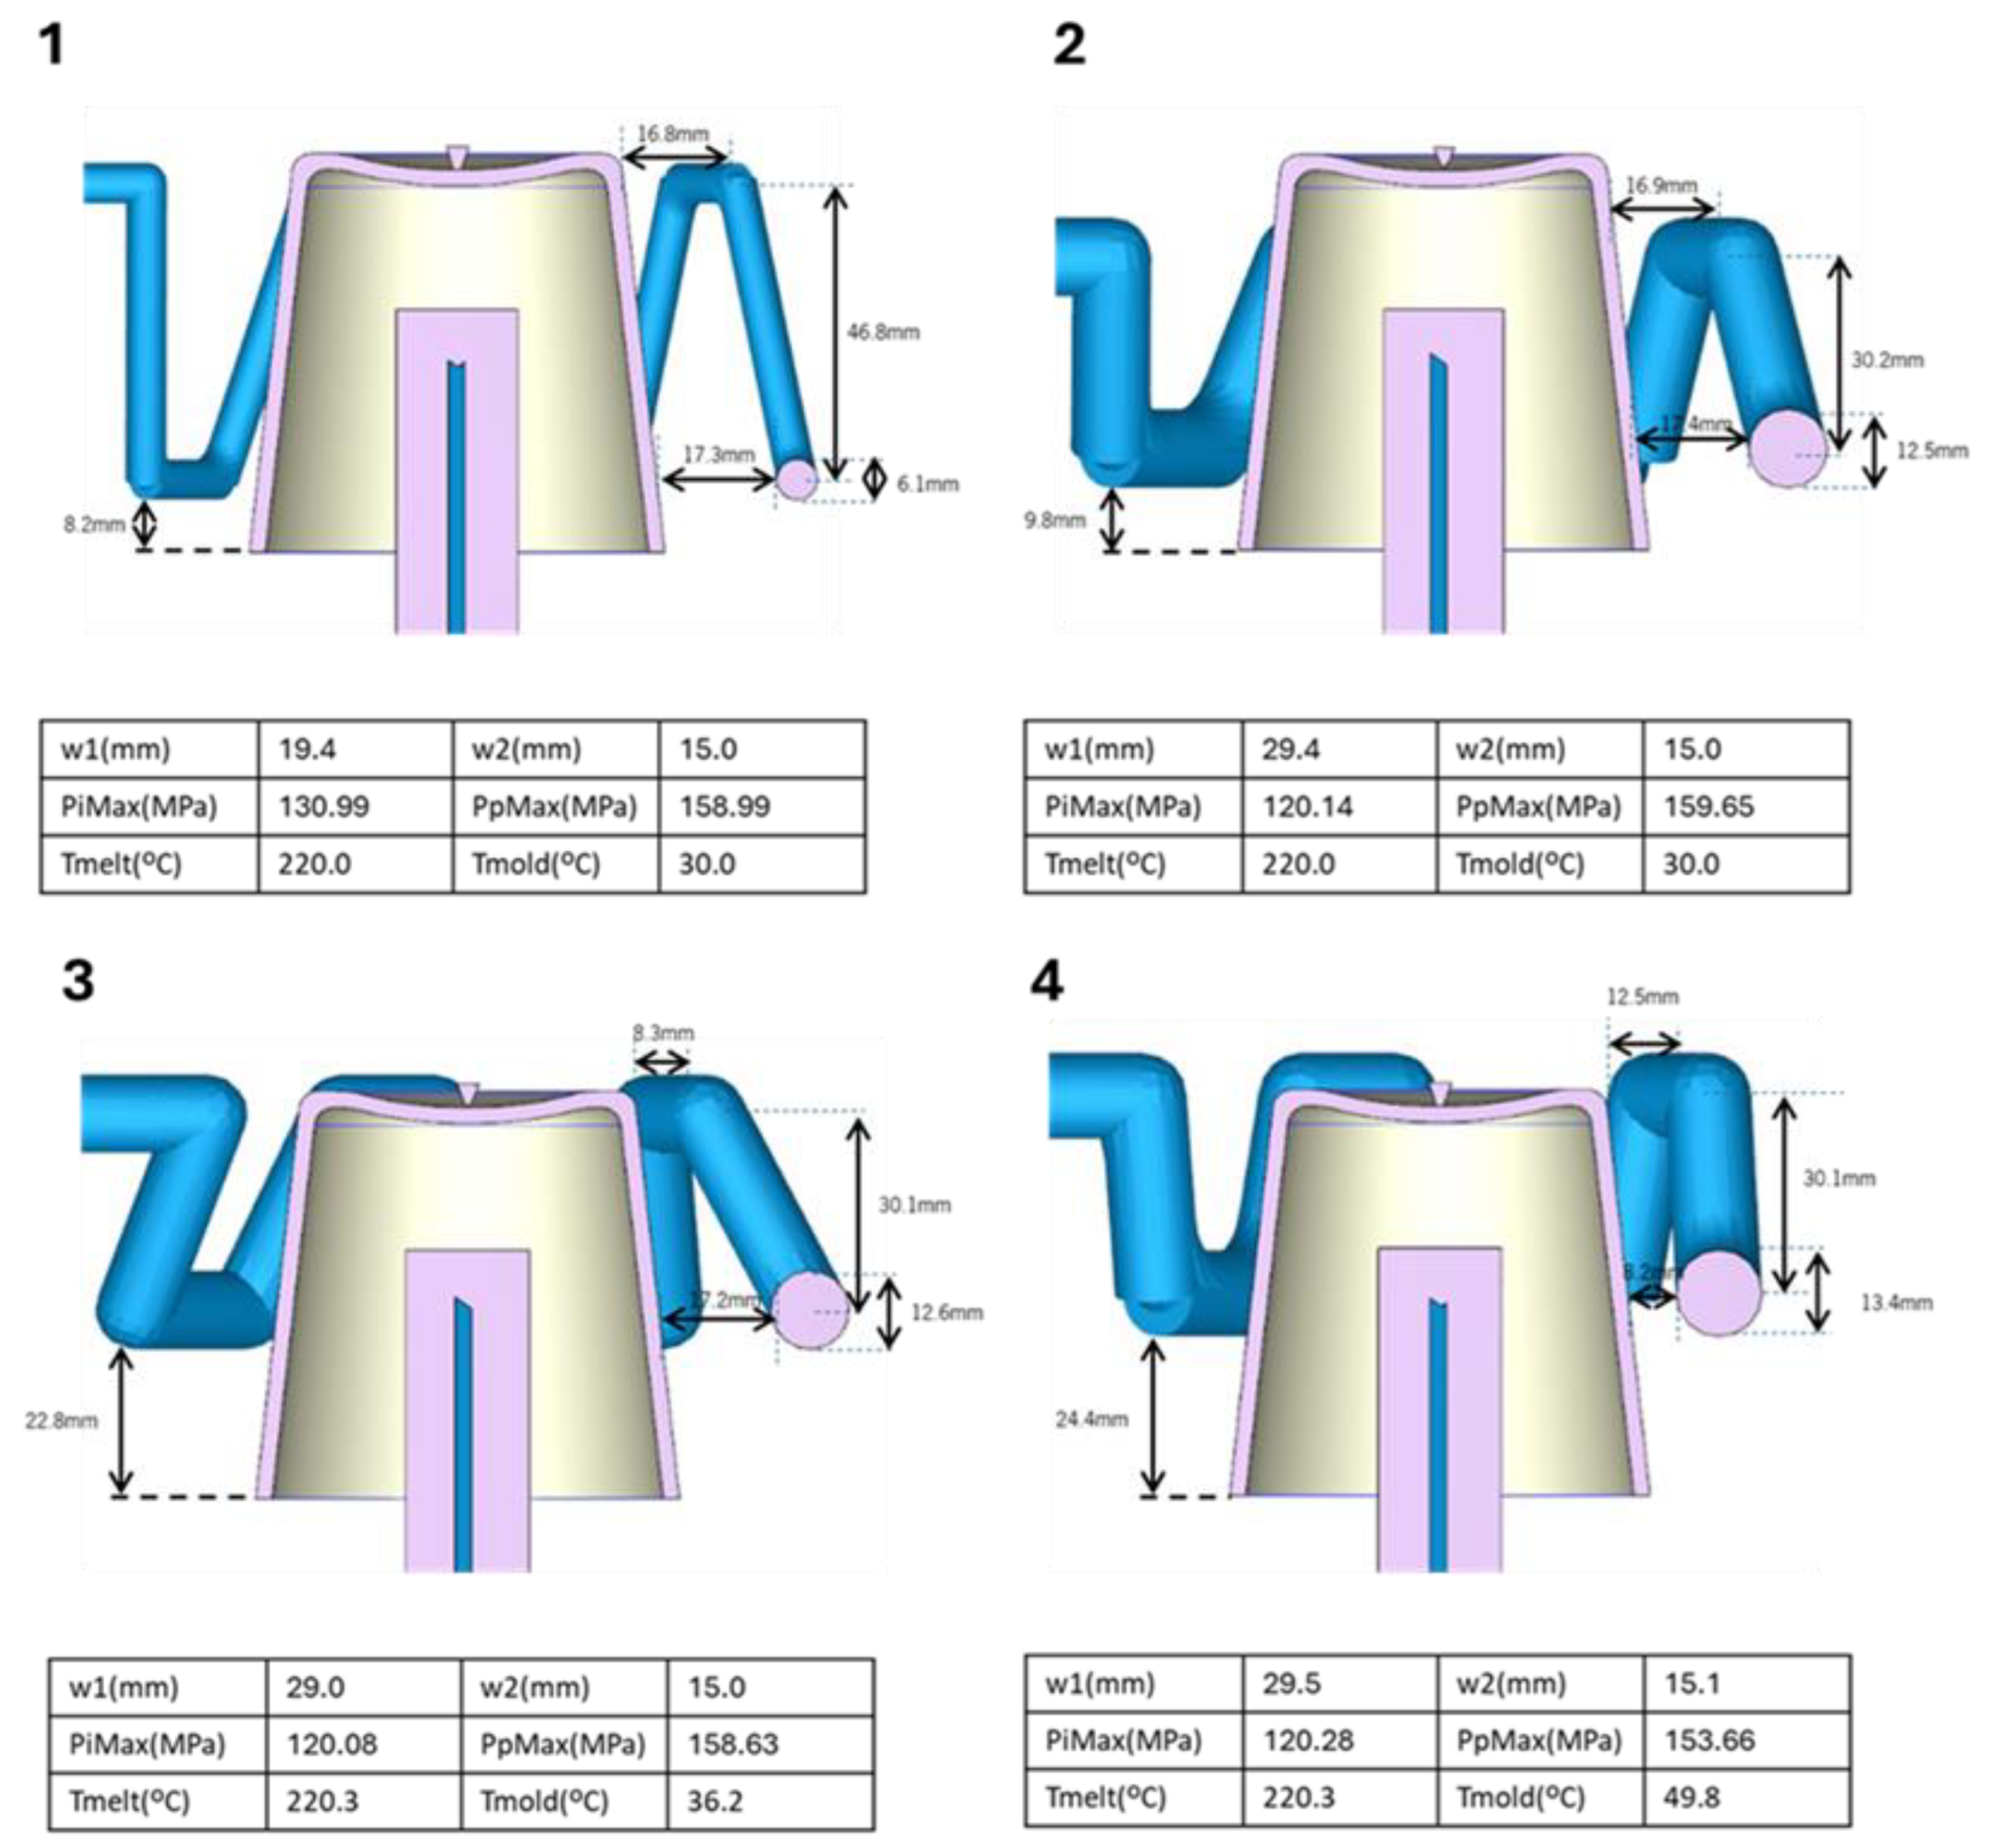
Figure 12.
Selected solution.
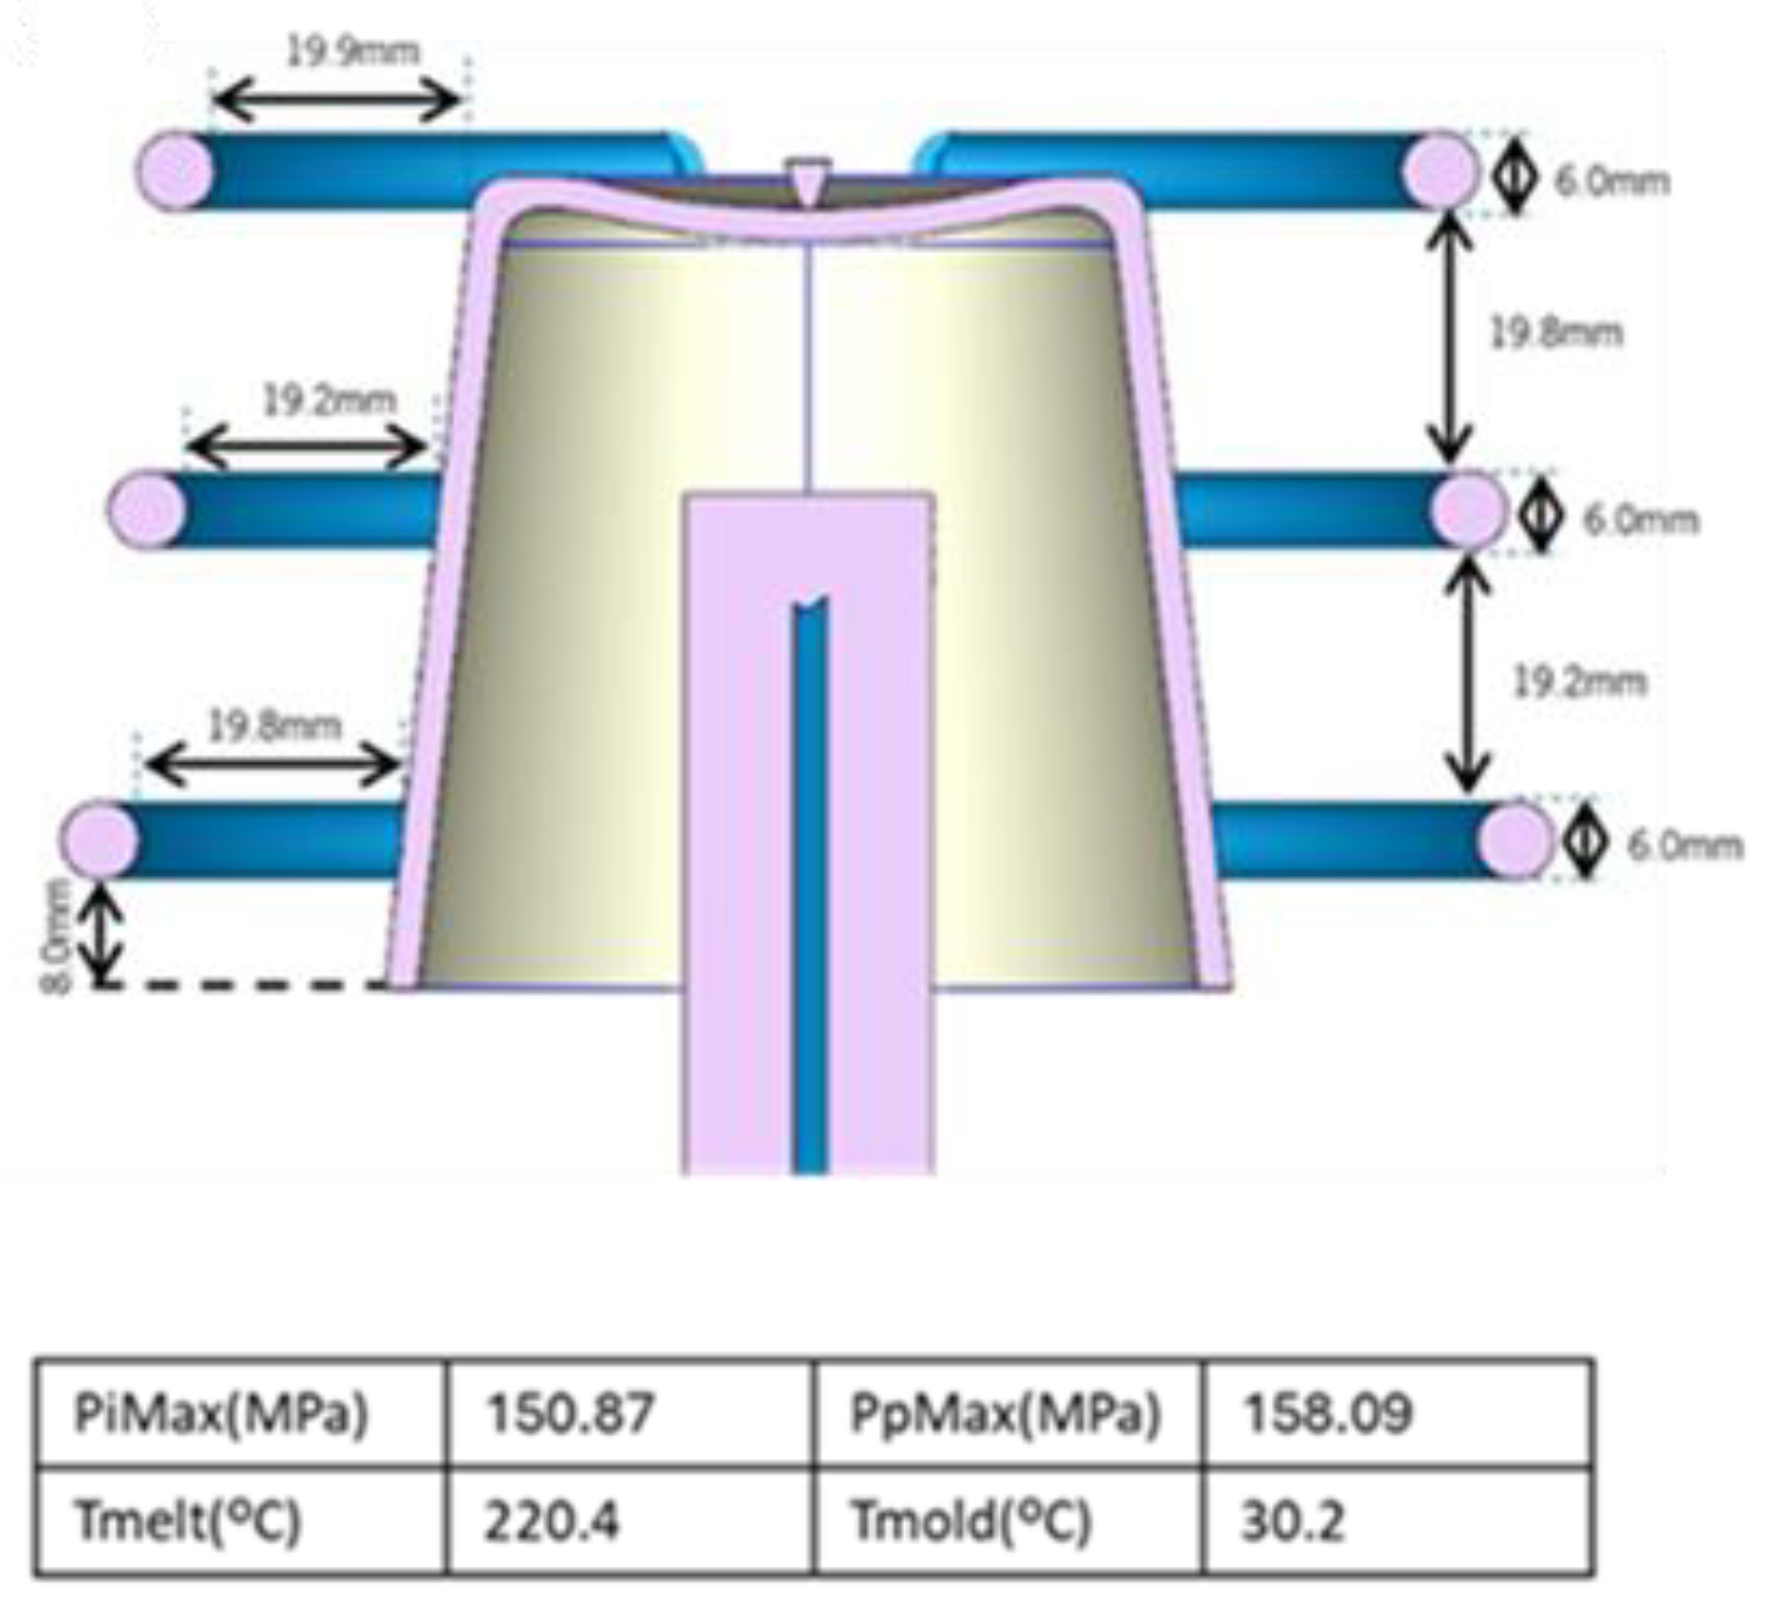

Table 1.
Decision variables and their range of variation for the CCC geometries considered (the meaning of the decision variables is identified in Figure 3).
Table 1.
Decision variables and their range of variation for the CCC geometries considered (the meaning of the decision variables is identified in Figure 3).
| Decision Variables | Conventional Channels (mm) |
2 Rings (mm) |
3 Rings (mm) |
Spiral (mm) |
Zigzag (mm) |
|---|---|---|---|---|---|
| d1 | [8,25] | [8,25] | [8,10] | [8,25] | [8,25] |
| d2 | [8,20] | [8,20] | [8,20] | [8,20] | - |
| d3 | - | - | [8,20] | - | - |
| d_1 | [8,20] | [8,20] | [8,20] | [8,20] | [8,20] |
| d_2 | [8,20] | [8,20] | [8,20] | [8,20] | [8,20] |
| d_3 | - | - | [8,20] | - | - |
| D1 | [6,15] | [6,15] | [6,12] | [6,12] | [6,15] |
| D2 | [6,15] | [6,15] | [6,12] | - | - |
| D3 | - | - | [6,12] | - | - |
| h1 | - | - | - | - | [30,50] |
| w1 | - | - | - | - | [15,30] |
| w2 | - | - | - | - | [15,30] |
Table 2.
Processing conditions to be optimized.
| Parameter | Designation | Range | Units |
|---|---|---|---|
| Injection pressure | PiMax | [120,160] | MPa |
| Packing pressure | PpMax | [120,160] | MPa |
| Melt temperature | Tmelt | [220,260] | °C |
| Mold temperature | Tmold | [30,50] | °C |
Table 3.
Unmodified processing conditions.
| Parameter | Designation | Reference Value | Units |
|---|---|---|---|
| Injection time | tfill | 1,13 | s |
| Packing time | tpack | 7,09 | s |
| Switch-over from volume to pressure | vpswit | 98 | % |
| Volumetric flow rate of the cooling system | Qcoolt | 120 | cm3 .s-1 |
| Cooling fluid temperature | Tcoolt | Tmold | °C |
| Ambient temperature | Tair | 25 | °C |
| Ejection temperature | Teje | 115 | °C |
| Cooling time | tcool | 16,5 | s |
| Mold opening time | tmopen | 5 | s |
Table 4.
Objectives considered.
| Name | Description | |
|---|---|---|
| Temperature profiles | aDTsm | Average temperature difference between the inner and outer surfaces and the core |
| sDTsm | Standard deviation of aDTsm | |
| aDTsmH | Average temperature difference between the inner and outer surfaces and the core for the 20% of points with the highest temperature | |
| sDTsmH | Standard deviation of aDTsmH | |
| aDTms | Average temperature difference between the core and the outer surface | |
| sDTms | Standard deviation of aDTms | |
| aDTmsH | Average temperature difference between the core and the outer surface for the 20% of points with the highest temperature | |
| sDTmsH | Standard deviation of aDTmsH | |
| aDTss | Average temperature difference between the outer and inner surfaces | |
| sDTss | Standard deviation of aDTss | |
| aDTssH | Average temperature difference between the outer and inner surfaces for the 20% of points with the highest temperature | |
| sDTssH | Standard deviation of aDTssH | |
| Warpage | maxWaT | Maximum total warpage |
| maxWaX | Maximum warpage in the X direction | |
| maxWaY | Maximum warpage in the Y direction | |
| maxWaZ | Maximum warpage in the Z direction | |
| minWaT | Minimum total warpage | |
| minWaX | Minimum warpage in the X direction | |
| minWaY | Minimum warpage in the Y direction | |
| minWaZ | Minimum warpage in the Z direction | |
| Shrinkage | maxSrT | Maximum total shrinkage |
| maxSrX | Maximum shrinkage in the X direction | |
| maxSrY | Maximum shrinkage in the Y direction | |
| maxSrZ | Maximum shrinkage in the Z direction | |
| minSrT | Minimum total shrinkage | |
| minSrX | Minimum shrinkage in the X direction | |
| minSrY | Minimum shrinkage in the Y direction | |
| minSrZ | Minimum shrinkage in the Z direction | |
| Time | tcycle | Minimum cycle time predicted by Moldex3D Studio in which all regions of the part reach the ejection temperature |
| Density, thermal efficiency | sdDens | Standard deviation of density |
| coolef | Difference in heat flux transfer between the baffle cooling system and the cavity cooling systems | |
| Von Mises stresses | maxVMS | Maximum Von Mises stress |
| aVMS | Average Von Mises stress | |
| sdVMS | Standard deviation of Von Mises stress | |
| Energy | energconsumpt | Process energy consumption |
| deltaenerg | Thermal energy balance |
Table 5.
Experimental plan (OC- operating conditions; and CC- cooling channels).
| Study | Description | Number of DVs |
|---|---|---|
| 1st study | Conventional cooling channels (OC+CC) | 10 |
| 2 rings (OC + CC) | 10 | |
| 3 rings (OC+CC) | 13 | |
| Spiral (OC+CC) | 9 | |
| Zigzag (OC+CC) | 11 | |
| 2nd study | 2 rings (CC) | 6 |
| 2 rings (OC + CC: Tmold = constant) | 9 | |
| 2 rings (CC: di = constant, d_i = constant) | 4 | |
| 2 rings (CC: Di = constant) | 2 | |
| 2 rings (OC + CC: spiral vs. baffle) | 10 |
Table 6.
NL-PCA results for two-ring circular channels.
| 3 objectives | sdVMS | sDTms | energconsumpt | |
| 4 objectives | sdVMS | sDTms | energconsumpt | maxWaT |
Table 7.
Solutions identified in Figure 5 – processing conditions and geometric parameters of the channels.
Table 7.
Solutions identified in Figure 5 – processing conditions and geometric parameters of the channels.
| Solution | d1 (mm) |
d2 (mm) |
d_1 (mm) | d_2 (mm) | D1 (mm) |
D2 (mm) |
PiMax (MPa) |
PpMax (MPa) |
Tmelt (°C) |
Tmold (°C) |
|---|---|---|---|---|---|---|---|---|---|---|
| 1 | 8.2 | 11.8 | 19.6 | 19.9 | 12.9 | 9.9 | 126.2 | 156.2 | 255.9 | 49.9 |
| 2 | 8.1 | 8.2 | 19.9 | 19.9 | 6.2 | 8.4 | 155.7 | 158.6 | 220.1 | 49.8 |
| 3 | 8.4 | 10.7 | 8.7 | 19.4 | 6.9 | 12.1 | 121.4 | 122.9 | 220.0 | 47.9 |
| 4 | 8.2 | 8.0 | 8.4 | 19.9 | 7.4 | 13.7 | 121.4 | 131.6 | 220.1 | 43.2 |
| 5 | 8.2 | 8.0 | 8.5 | 19.8 | 6.7 | 14.5 | 120.2 | 156.7 | 220.3 | 38.8 |
| 6 | 8.0 | 11.2 | 8.6 | 19.9 | 6.4 | 12.2 | 124.5 | 158.4 | 220.4 | 30.1 |
Table 8.
Solutions identified in Figure 5 – objective values.
Table 8.
Solutions identified in Figure 5 – objective values.
| Solution | sdVMS (MPa) | sDTms (°C) | maxWaT (mm) | energconsumpt(kJ) |
|---|---|---|---|---|
| 1 | 0.11 | 13.1 | 0.85 | 21.8 |
| 2 | 0.11 | 11.9 | 0.84 | 20.3 |
| 3 | 0.13 | 11.9 | 0.84 | 19.7 |
| 4 | 0.19 | 11.9 | 0.84 | 19.7 |
| 5 | 0.27 | 12.0 | 0.84 | 19.7 |
| 6 | 0.34 | 12.0 | 0.83 | 20.0 |
Table 9.
Characteristics of the optimization runs with objectives selected by the DM: cc- conventional channels; 2r- 2 circular rings; 3r- 3 circular rings; sp- spiral; zz- zig-zag.
Table 9.
Characteristics of the optimization runs with objectives selected by the DM: cc- conventional channels; 2r- 2 circular rings; 3r- 3 circular rings; sp- spiral; zz- zig-zag.
| Run ID | N. Objs. | Objetives | cc | 2r | 3r | sp | zz |
|---|---|---|---|---|---|---|---|
| I) | 3 | tcycle, maxWaT, energconsumpt | Yes | Yes | Yes | Yes | Yes |
| II) | 3 | tcycle, maxSrT, energconsumpt | Yes | Yes | No | No | No |
| III) | 3 | tcycle, maxWaT, deltaenerg | Yes | Yes | Yes | Yes | Yes |
| IV) | 3 | tcycle, maxSrT, deltaenerg | Yes | Yes | No | No | No |
| V) | 4 | tcycle, maxWaT, maxSrT, energconsumpt | Yes | Yes | Yes | Yes | Yes |
| VI) | 4 | tcycle, maxWaT, maxSrT, deltaenerg | Yes | Yes | No | No | No |
Table 10.
Characteristics of the optimization runs with objectives selected by NL-PCA: cc- conventional channels; 2r- 2 circular rings; 3r- 3 circular rings; sp- spiral; zz- zig-zag.
Table 10.
Characteristics of the optimization runs with objectives selected by NL-PCA: cc- conventional channels; 2r- 2 circular rings; 3r- 3 circular rings; sp- spiral; zz- zig-zag.
| Type | 3 objectives: run ID- VII) | 4 objectives: run ID- VIII) |
|---|---|---|
| cc | sDTmsH, aDTss, minSrT | aDTss, tcycle, maxWaT, minSrT |
| 2-r | sdVMS, sDTms, energconsumpt | sdVMS, sDTms, energconsumpt, maxWaT |
| 3-r | aVMS, minSrZ, maxWaZ | aVMS, minSrZ, maxWaZ, maxVMS |
| sp | maxSrY, sDTss, aVMS | maxSrY, sDTss, aVMS, sdDens |
| zz | minWaT, aVMS, energconsumpt | minWaT, aVMS, energconsumpt, sDTssH |
Disclaimer/Publisher’s Note: The statements, opinions and data contained in all publications are solely those of the individual author(s) and contributor(s) and not of MDPI and/or the editor(s). MDPI and/or the editor(s) disclaim responsibility for any injury to people or property resulting from any ideas, methods, instructions or products referred to in the content. |
© 2026 by the authors. Licensee MDPI, Basel, Switzerland. This article is an open access article distributed under the terms and conditions of the Creative Commons Attribution (CC BY) license (http://creativecommons.org/licenses/by/4.0/).
Copyright: This open access article is published under a Creative Commons CC BY 4.0 license, which permit the free download, distribution, and reuse, provided that the author and preprint are cited in any reuse.


