
Submitted:
31 December 2025
Posted:
02 January 2026
You are already at the latest version
Abstract
The expansion of internet connectivity and mobile technologies has transformed financial services worldwide, positioning digital banking as a key platform for transactions. In Ethiopia, adoption has accelerated through regulatory reforms and national strategies such as Digital Ethiopia 2025 and the National Financial Inclusion Strategy. Despite these developments, empirical studies remain limited, particularly in urban contexts where usage is rapidly increasing. This study applies the Unified Theory of Acceptance and Use of Technology 2 (UTAUT2) to examine factors influencing digital banking utilization in Addis Ababa. Using survey data from 405 respondents and Partial Least Squares Structural Equation Modeling (PLS-SEM), the analysis shows that facilitating conditions and price value were the strongest predictors of adoption, followed by performance expectancy and social influence, while effort expectancy was not significant. These findings underscored the importance of infrastructure readiness, affordability, and normative influences in shaping digital banking users. The study contributes to technology adoption literature by contextualizing UTAUT2 within Ethiopia’s financial sector and offers practical insights for policymakers, banks, and technology providers seeking to advance digital financial inclusion.
Keywords:
digital banking
; UTAUT2
; PLS-SEM
; Addis Ababa
; Ethiopia
1. Introduction
The rapid expansion of internet connectivity and
mobile technologies has transformed the global banking industry, enabling the
rise of digital banking as a central channel for financial transactions.
Digital banking encompasses services such as online and mobile banking,
electronic payments, and digital wallets, offering customers convenient access
to account management and financial services (Alkhowaiter, 2020). During the
COVID-19 pandemic, these platforms became critical in sustaining economic
activity through contactless and cashless transactions (Indriasari et al.,
2022).
In Ethiopia, digital banking adoption has evolved
gradually, beginning with the introduction of ATMs by the Commercial Bank of
Ethiopia in 2001, followed by Dashen Bank’s successful deployment in 2006 and
subsequent expansion by private banks (Kindie, 2016; Worku, 2010). Regulatory
frameworks such as the National Payment System Proclamation (2011) and the
establishment of the National Switch (2014) provided legal recognition and
interoperability for electronic payments (Gemechu, 2014; Zeleke, 2016). More recently,
national strategies including Digital Ethiopia 2025 and the National
Financial Inclusion Strategy have accelerated transformation, promoting mobile
banking, e-commerce, and cybersecurity initiatives (MoPD, 2021; NBE, 2021;
GSMA, 2023).
Despite these advances, empirical research on
Ethiopia’s digital banking remains limited and often outdated, with early
studies focusing on infrastructural challenges and regulatory gaps rather than
contemporary adoption dynamics (Tiwari, 2021; Zerihun, 2016). Traditional
models such as the Technology Acceptance Model (TAM) explain adoption through
perceived usefulness and ease of use (Davis, 1989), but scholars argue that TAM
alone is insufficient for capturing the complexities of modern ecosystems (Ahmad,
2018). The Unified Theory of Acceptance and Use of Technology (UTAUT) and its
extension UTAUT2 provide a more comprehensive framework, integrating
performance expectancy, effort expectancy, social influence, facilitating
conditions, and price value, and have been widely applied in digital banking
contexts (Venkatesh et al., 2003; Venkatesh et al., 2012; Pham, 2021). This
study applies UTAUT2 to examine determinants of digital banking utilization in
Addis Ababa, addressing a critical gap in Ethiopia’s financial technology
literature.
2. Literature Review and Hypothesis
2.1. Concept of Digital Banking
The global spread of internet connectivity and
mobile devices has also led to the development of new financial products and
payment mechanisms. Digital banking has emerged as a practical and efficient
channel for conducting financial transactions, encompassing services such as
online banking, mobile banking, electronic banking, and digital wallets
(Alkhowaiter, 2020). These platforms typically allow users to check account
balances, transfer funds, and make payments. During the COVID-19 crisis,
digital banking systems further supported business operations by linking banks
with entrepreneurs, employees, suppliers, and broader markets within an
interconnected digital ecosystem.
Over the last twenty years, rapid developments in
internet infrastructure, mobile devices, and digital communication technologies
have fundamentally transformed the banking industry. These advances have
enabled banks to deliver faster, more reliable, and customer-friendly financial
services, significantly changing how individuals and businesses conduct
transactions. During the economic disruption triggered by the COVID-19
pandemic, digital banking became especially important by facilitating
contactless and cashless payments, thereby supporting economic continuity
(Indriasari et al., 2022).
The primary focus of digital transformation is on
enhancing customer value through real-time service delivery, personalization,
and seamless digital interactions (Alsobai & Aassouli, 2025; Mohammed &
Japee, 2025). Importantly, digital transformation in banking extends beyond
technological deployment to include changes in organizational structure,
internal processes, and institutional culture (Alsobai & Aassouli, 2025).
The growing presence of neobanks and digital-only
financial institutions further demonstrates this structural shift within the
banking sector. Unlike traditional banks, these institutions operate without
physical branches and rely exclusively on digital channels to provide
cost-efficient and intuitive services. As a result, they have intensified
competition and reshaped customer expectations across the industry (Ikmanila
& Djastuti, 2025).
2.2. Digital Banking in Ethiopia
Ethiopia’s digital banking journey began in 2001
when the Commercial Bank of Ethiopia (CBE) introduced ATM services, though
early adoption was limited and the system was later discontinued (Worku, 2010).
A breakthrough occurred in 2006 when Dashen Bank successfully reintroduced
ATMs, gaining a competitive edge by deploying technologies that were previously
uncommon in the country (Kindie, 2016; Gemechu, 2014; Zeleke, 2016). Wegagen
Bank followed in 2010, and subsequent private banks gradually adopted
electronic banking services to enhance market presence and operational efficiency
(Kinfe, 2016).
The sector’s development was reinforced by
regulatory and policy frameworks, including the 2011 National Payment System
Proclamation, which legally recognized electronic payments, and the creation of
the National Switch in 2014, enabling interoperability across ATMs, cards, and
point-of-sale systems. National strategies such as Digital Ethiopia 2025, the
National Financial Inclusion Strategy (NFIS), and the National Digital Payments
Strategy further accelerated digital transformation by promoting mobile banking,
financial inclusion, digital IDs, e-governance, e-commerce, and cybersecurity
initiatives (MoPD, 2021; NBE, 2021; GSMA, 2023).
Complementary legal measures, including
Proclamations 1159/2019, 1205/2020, 1282/2023, and 1284/2023, along with
directives ONPS/01/2020 and ONPS/02/2020, have established a clear regulatory
environment for digital financial services. These developments collectively aim
to expand access to banking, foster a cash-lite economy, and enhance the
overall efficiency and competitiveness of Ethiopia’s financial sector.
2.3. Theory of Technology Adoption Model
Research on technology adoption has increasingly
shifted toward integrated and next-generation frameworks that extend beyond
traditional single-theory models. The Technology Acceptance Model (TAM),
originally developed by Davis (1989), remains a foundational lens, explaining
adoption behavior through perceived usefulness and perceived ease of use.
Contemporary studies reaffirm TAM’s relevance across diverse domains such as digital
banking, education, and sustainability, demonstrating its enduring explanatory
power. However, scholars argue that TAM alone is insufficient for capturing the
complexities of modern digital ecosystems (Shaji et al., 2025).
The Unified Theory of Acceptance and Use of
Technology (UTAUT) and its extensions have emerged as dominant frameworks,
synthesizing elements of TAM, the Theory of Planned Behavior (TPB), and related
models into four key determinants: performance expectancy, effort expectancy, social
influence, and facilitating conditions, moderated by demographic and
experiential factors (Venkatesh et al. in 2003). Reviews suggest that UTAUT and
UTAUT2 outperform single-theory approaches, explaining up to 70% of variance in
behavioral intention and nearly 50% in actual use, making them particularly
effective in contexts such as mobile applications, digital banking, and online
platforms (García de Blanes Sebastián et al., 2022).
The Unified Theory of Acceptance and Use of
Technology 2 (UTAUT2) is an extended technology adoption framework developed to
explain users’ intentions and actual use of digital technologies by
incorporating both functional and consumer-oriented factors. Introduced by
Venkatesh et al. (2012), UTAUT2 expands the original UTAUT model and has been
widely applied in studies of digital platforms, mobile applications, and
digital banking.
1. Performance expectancy: which reflects the
extent to which users perceive a technology as improving task efficiency and
outcomes; in the context of digital banking, perceived usefulness in conducting
financial transactions strongly shapes adoption intentions (Venkatesh et al.,
2012; Patil et al., 2020).
2. Effort expectancy: relates to perceived ease
of use, suggesting that intuitive and user-friendly banking platforms reduce
cognitive effort and encourage frequent usage (Venkatesh et al., 2012).
3. Social influence: captures the impact of
opinions and behaviors of peers, family members, and social networks, which can
significantly affect individuals’ willingness to adopt digital financial
services (Tarhini et al., 2016).
4. Facilitating conditions: refer to users’
perceptions of the availability of technical infrastructure, internet
connectivity, compatible devices, and institutional support, all of which are
critical for sustained digital banking use, particularly among digitally
intensive user groups (Venkatesh et al., 2012; Patil et al., 2020).
5. Price value: which reflects users’
assessment of whether the benefits of using a technology outweigh associated
costs, such as service fees or data expenses, a factor increasingly relevant in
competitive digital banking environments(Venkatesh et al., 2012).
6. Digital banking: utilization represents
actual usage behavior, encompassing remote access to financial services such as
payments, fund transfers, account management, loans, and investments without
physical interaction with bank branches (Ahmed & Sur, 2021; Mohamud, 2017).
In Ethiopia, digital banking utilization has
expanded rapidly following regulatory reforms and the implementation of the
National Digital Payments Strategy, with digital transactions reaching over
Birr 4.7 trillion by June 2023, nearly tripling the value recorded in the
previous year (NBE, 2024). Collectively, UTAUT2 provides a comprehensive and
context-sensitive framework for examining digital banking adoption by
integrating technological, economic, social, and infrastructural determinants.
2.4. Research Gap
Empirical research on digital banking usage in
Ethiopia, particularly in Addis Ababa, remains scarce and largely outdated.
Early studies focused mainly on broad challenges such as weak regulatory
frameworks, infrastructural constraints, and low digital literacy, offering
limited insight into current urban digital banking dynamics (Wondwossen &
Tsegai, 2005; Gardachew, 2010). Furthermore, much of the African literature
relies on generic technology adoption models emphasizing perceived usefulness
and ease of use, while neglecting context-specific factors such as UTAUT2
(Venkatesh et al., 2012; Mago & Mago, 2021). This gap underscores the need
for updated, context-sensitive empirical research on digital banking
utilization in Addis Ababa, Ethiopia.
2.5. Conceptual Model and Hypothesis Development
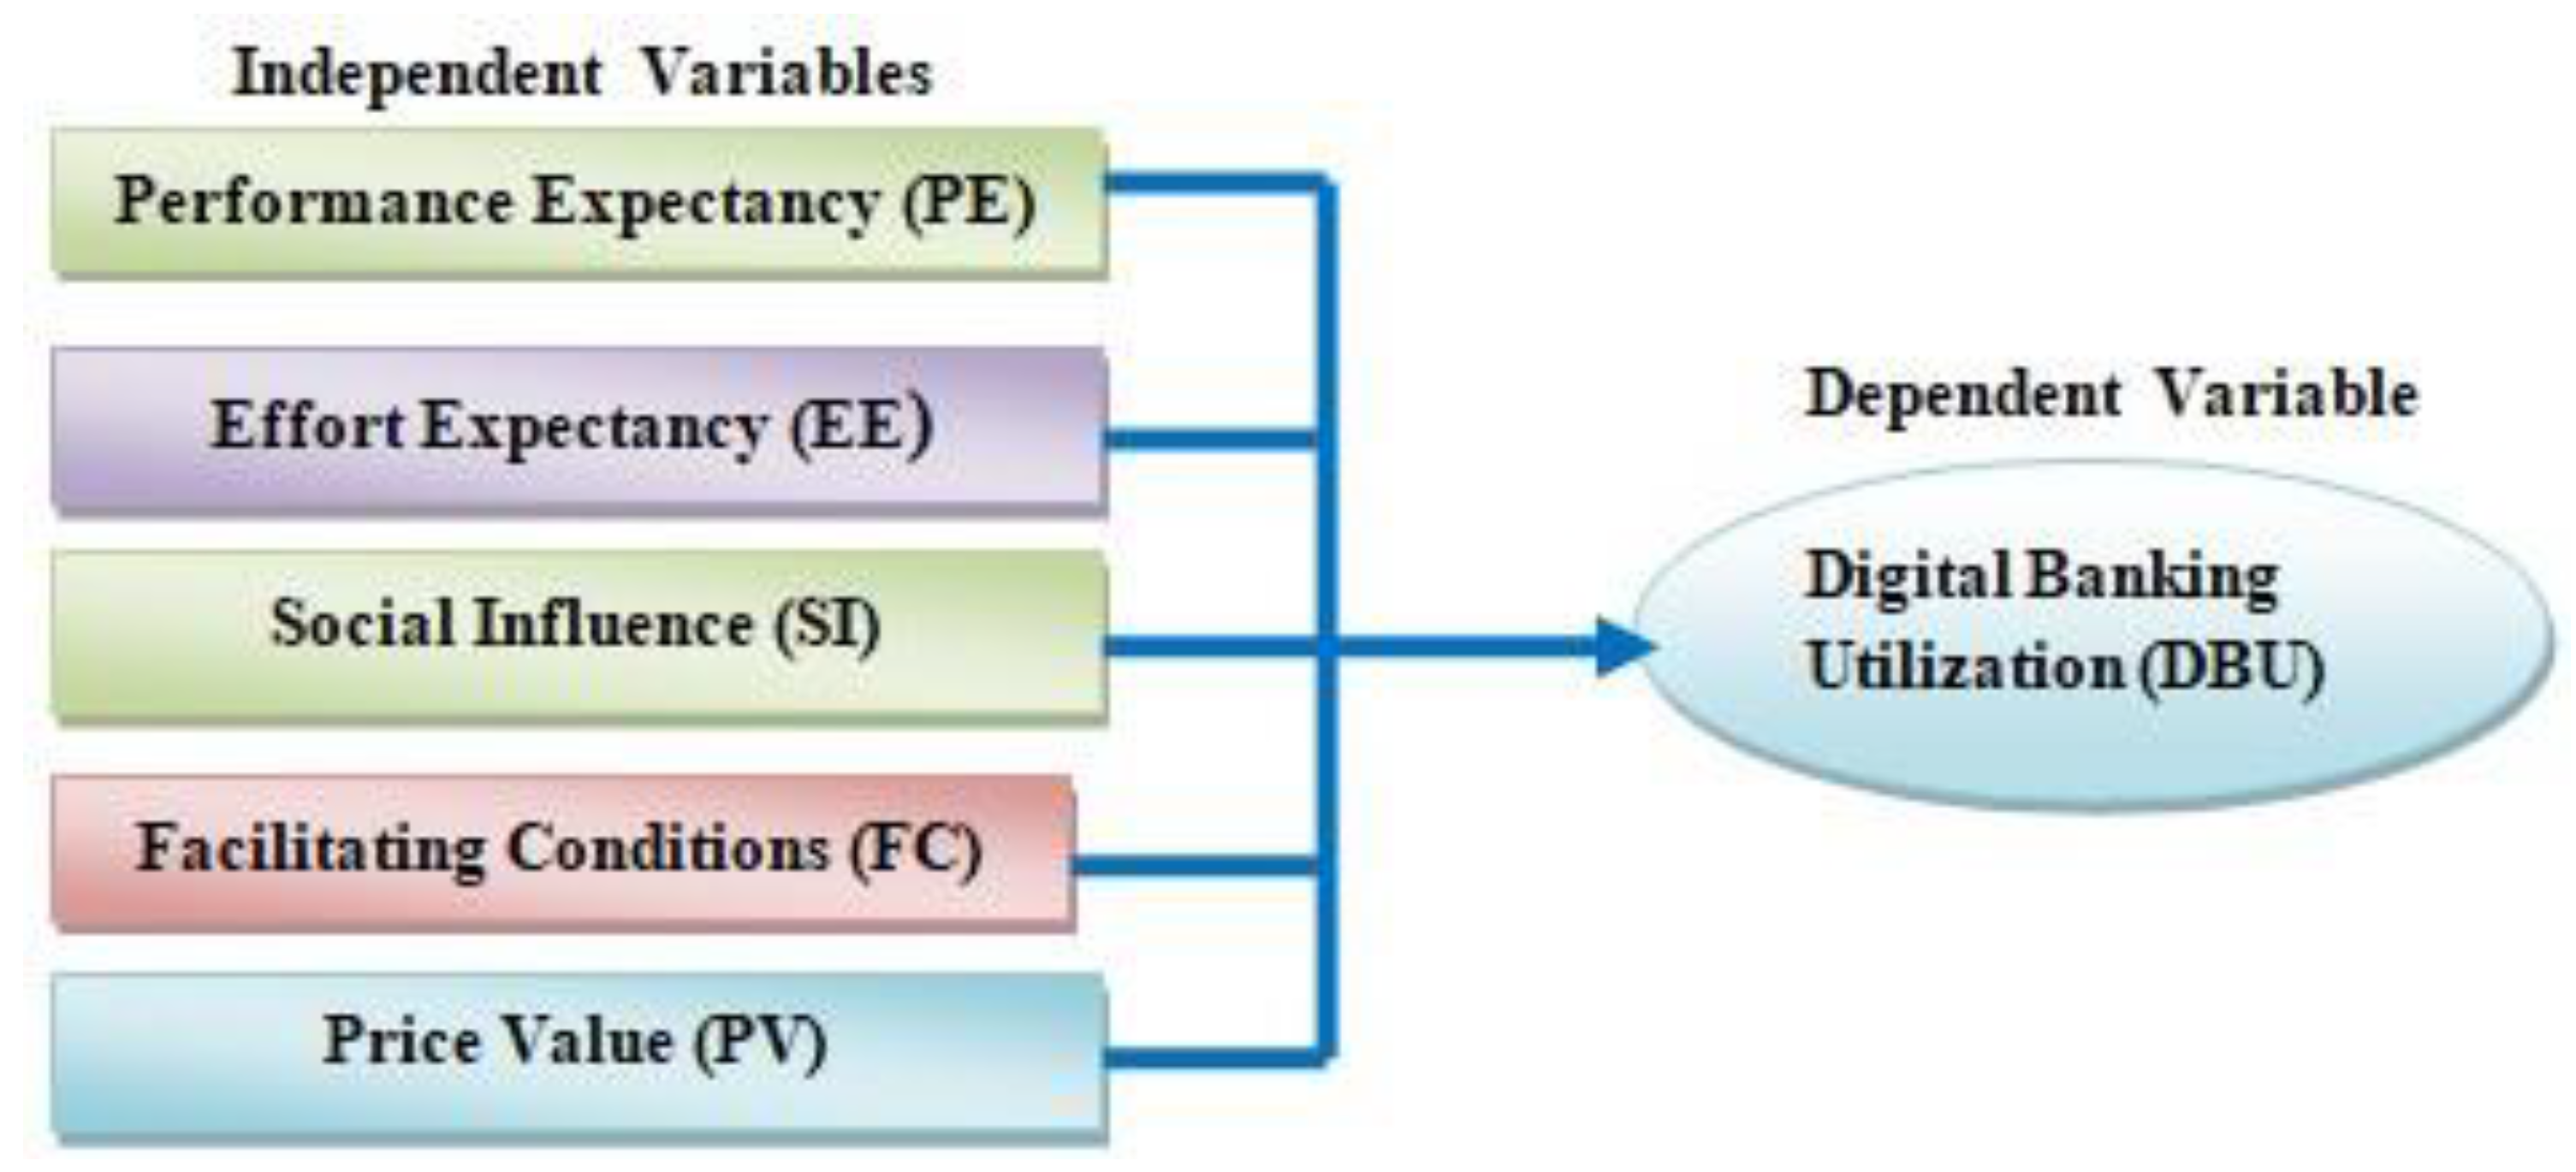
2.5.1. Conceptual Framework
The conceptual framework of this study is grounded
in the Unified Theory of Acceptance and Use of Technology 2 (UTAUT2), which
explains technology acceptance from a consumer perspective (Venkatesh et al.,
2012). The framework illustrates the relationship between key UTAUT2 constructs
performance expectancy, effort expectancy, social influence, facilitating
conditions, and price value and digital banking utilization. These variables
were selected based on a review of relevant digital banking literature. The framework
is used to examine the extent to which UTAUT2 factors influence digital banking
usage in Addis Ababa, Ethiopia.
Figure 1.
Conceptual Model. Source: Venkatesh et al. (2012).
2.5.2. Hypothesis Development
The Extended Unified Theory of Acceptance and Use
of Technology (UTAUT2), model extends the original UTAUT by incorporating
consumer-oriented constructs such as price value (Venkatesh et al., 2012).
Recent studies confirm the relevance of UTAUT2 in explaining digital banking
utilization in developing countries (Banna et al., 2023; Mensah & Abbas,
2024). Accordingly, this study formulates hypotheses based on the UTAUT2
framework and relevant empirical literature.
1. Performance Expectancy (PE): refers to the
degree to which users believe that digital banking enhances their financial
transactions. Empirical evidence shows a strong positive relationship between
PE and digital banking utilization (Alalwan et al., 2022).
H1: Performance expectancy has a
positive and significant effect on digital banking utilization.
2. Effort Expectancy (EE): captures perceived
ease of use. While traditionally significant, recent studies suggest its
influence diminishes as users become more technologically experienced (Dwivedi
et al., 2023).
H2: Effort expectancy has a
positive and significant effect on digital banking utilization.
3. Social Influence (SI): reflects the extent
to which individuals perceive that important others believe they should use
digital banking. In collectivist societies, SI plays a crucial role (Mensah
& Abbas, 2024).
H3: Social influence has a
positive and significant effect on digital banking utilization.
4. Facilitating Conditions (FC): include access
to infrastructure, technical support, and compatible devices. Strong FC has
been consistently linked with higher digital service utilization in Africa
(Banna et al., 2023).
H4: Facilitating conditions has a
positive and significant effect on digital banking utilization
5. Price Value (PV): represents users’
cognitive trade-off between benefits and monetary costs. Affordable transaction
fees significantly encourage adoption in low-income economies (Hasan et al.,
2022).
H5: Price value has a positive
and significant effect on digital banking utilization.
3. Research Methodology
This section outlines the research methodology
employed in the study. It includes the research approaches and design, target
population and sampling methods, data collection instruments, data analysis
method, and ethical considerations.
3.1. Research Approaches and Design
This study employed a quantitative approach with a
descriptive research design to examine the factors influencing digital banking
utilisation in Addis Ababa, Ethiopia, using the UTAUT2 model while excluding
hedonic motivation and habit.
Digital banking services are largely transactional
and utilitarian, with users prioritizing efficiency and security over
enjoyment, which reduces the relevance of hedonic motivation; moreover, prior
research suggests that such constructs are more applicable to consumer-oriented
technologies than to essential financial services (Venkatesh et al., 2012).
Likewise, habit has limited explanatory power in emerging markets such as
Ethiopia, where low digital maturity, recent financial sector liberalization, and
persistent infrastructural constraints hinder the development of stable and
automatic usage patterns. Consequently, constructs such as performance
expectancy, facilitating conditions, social influence, and price value are
better suited to capturing the socio-economic and infrastructural realities of
the Ethiopian digital banking context (Venkatesh et al., 2012; Hilal &
Varela-Neira, 2022; Gebrekidan, 2022).
3.2. Data Sources and Collection Methods
Data for this study were collected using a
structured questionnaire, a widely recognized tool for primary data collection
(Roopa & Rani, 2012). The questionnaire employed a five-point Likert scale,
with responses ranging from 1 (strongly disagree) to 5 (strongly agree).
Trained enumerators administered the survey by distributing questionnaires at
the entrances of selected banks during regular working hours Monday to Friday,
9:00 AM to 5:00 PM throughout November 2025. The instrument comprised 25 indicators
organized into five constructs, all adapted from established literature.
Specifically, the measurements were modified from the works of Venkatesh et al.
(2012), Hussain et al. (2019), Farah et al. (2018), and Lien et al. (2018).
3.3. Population and Sample Size
The targeted population of the study was all
customers (actual and potential) of Ethiopian commercial banks in Addis Ababa.
Due to the absence of a sampling frame and an unknown population size, the
sample size was determined using Cochran’s (1963) formula as follow:
Using Cochran’s (1963) formula, a base sample of 385 respondents was calculated. To account for an anticipated 10.5% non-response rate, the final sample was adjusted to 430 questionnaires, which were distributed to actual and potential bank customers in Addis Ababa through convenience sampling.
3.4. Data Analysis Methods
To test the proposed hypotheses and evaluate the research model, this study employed Partial Least Squares Structural Equation Modeling (PLS-SEM) with SmartPLS-4 software, following established methodological guidelines (Sarstedt et al., 2014). PLS-SEM is a variance-based, prediction-oriented approach that focuses on maximizing the explained variance of endogenous constructs, making it well suited for exploratory and theory-extension research (Hair et al., 2012).
The PLS-SEM effectively accommodates non-normally distributed data through bootstrapping procedures, which provide robust estimates of standard errors and significance levels (Chin, 1998; Henseler et al., 2016). Data analysis was conducted using the SmartPLS software, which is widely used for PLS-based modeling due to its reliability and user-friendly interface (Ghozali & Latan, 2014).
3.5. Validity and Reliability
Validity testing is conducted to determine whether the data accurately measure the intended constructs (Khalid & M., 2012). The validity assessment is considered acceptable when questionnaire items meet predefined criteria for each variable. In addition, convergent validity is confirmed when the Average Variance Extracted (AVE) value is greater than 0.50 (Fornell & Larcker, 1981).
Reliability testing is performed using Cronbach’s alpha, where an instrument is considered reliable if the coefficient is equal to or greater than 0.70 (Nazaruddin, Ietje, & Basuki, 2015). Reliability is also assessed using Composite Reliability (CR), which complements Cronbach’s alpha. CR values between 0.60 and 0.70 are acceptable, while values ranging from 0.70 to 0.90 indicate satisfactory reliability (Hair et al., 2017).
Furthermore, the coefficient of determination (R²) is used to evaluate the explanatory power of independent variables on dependent variables. R² values range from 0 to 1, where values between 0.00 and 0.09 indicate weak effects, 0.10 and 0.50 indicate moderate effects, and 0.51 and 0.51–0.99 indicate strong effects (Ozili, 2023).
3.6. Hypothesis Analysis
Hypothesis testing in this study is conducted using path coefficients to determine the direction and strength of relationships among variables. Path coefficient values range from −1 to +1, where a value of +1 indicates a positive relationship and a value of −1 indicates a negative relationship (Hair Jr. et al., 2014). Statistical significance is evaluated using T-statistics and p-values. A hypothesis is considered significant if the T-statistic exceeds 1.96 and the p-value is below 0.05 (Rick & Jasny, 2018).
3.7. Ethical Consideration
The study used primary data collected through questionnaires, maintaining confidentiality, and informing respondents about the study's objectives and benefits. Verbal consent was obtained before data collection to ensure participant withdrawal at any time. The study adheres to ethical principles such as respect for persons, non-malfeasance, beneficence, informed consent, confidentiality, honesty, and avoiding plagiarism, with all references following the APA style.
4. Results and Discussion
The researcher distributed 430 questionnaires through an enumerator to digital banking users in Addis Ababa in November 2025. Accordingly, the enumerator collected all the questionnaires from the respondents. The researcher organised and coded the collected data. While coding, 25 responses were found to be incomplete and were excluded from the analysis, while 405 questionnaires were properly completed and prepared for analysis. This revealed a 405/430 (94.2%) response rate, which is considered an excellent response rate.
4.1. Model Fit Results
Model fit was assessed using global fit indices in PLS-SEM SmartPLS-4. The standardized root mean square residual (SRMR) value of 0.056 was below the recommended threshold of 0.08, indicating an acceptable model fit. The normed fit index (NFI) was 0.832, suggesting an acceptable improvement over the null model. The results indicate that the proposed model demonstrates an adequate fit to the data.
The coefficient of determination (R²) was examined to assess the explanatory power of the structural model. The results showed that the model explains 45.5% of the variance in DBU (R² = 0.455). The adjusted R² value of 0.448 indicates that the model maintains a good level of explanatory power after accounting for model complexity. Overall, the findings suggest that the proposed model exhibits moderate explanatory power for DBU.
4.2. Descriptive Statistics Results
Table 1 presents the descriptive statistics and correlation results for the study constructs. The mean values for all variables range from 3.518 to 3.886, indicating a generally positive perception of digital banking and its determinants among respondents. Performance expectancy (PE) recorded the highest mean (M = 3.886), suggesting that users strongly perceive digital banking as useful and beneficial, a finding consistent with prior studies identifying performance expectancy as a key driver of technology utilization (Kassaye et al., 2025; Venkatesh et al., 2012; Hilal & Varela-Neira, 2022). The relatively low standard deviations across constructs indicate limited variability in responses, while skewness and kurtosis values fall within acceptable ranges, suggesting approximate normality of the data (Hair et al., 2019).
The correlation analysis shows positive and moderate relationships among all constructs, with coefficients ranging from 0.460 to 0.700, indicating meaningful associations without evidence of multicollinearity. Notably, digital banking utilization (DBU) is positively correlated with facilitating conditions (r = 0.593), performance expectancy (r = 0.530), social influence (r = 0.528), and price value (r = 0.544). All the construct values were positively associated with digital banking utilization, supporting the UTAUT2 model. Performance expectancy drives adoption by enhancing perceived efficiency, facilitating conditions ensure the necessary resources and infrastructure, social influence shapes user intention through normative pressures, and price value reflects the perceived cost-benefit trade-off, all of which are critical in emerging markets like Ethiopia (Kassaye et al., 2025; Venkatesh et al., 2012; Oliveira et al., 2014; Gebrekidan, 2022; Hilal & Varela-Neira, 2022).
4.3. Discriminant Validity Measurement Model
Discriminant validity was evaluated using the heterotrait–monotrait ratio (HTMT) and Fornell–Larcker criterion. When the HTMT values below the recommended thresholds of 0.90 confirmed adequate discriminant validity (Henseler et al., 2015; Hair et al., 2013). The square root of the AVE for each construct exceeded its inter-construct correlations, satisfying the Fornell–Larcker criterion (Fornell & Larcker, 1981).
The results presented in Table 2 indicate that the discriminant validity assessment confirmed that the constructs in the model are sufficiently distinct from one another.
The Heterotrait-Monotrait (HTMT) ratios for all construct pairs were below the recommended threshold of 0.90, confirming that discriminant validity was achieved (Henseler, Ringle, & Sarstedt, 2015). This indicates that each constructdigital banking utilization (DBU), effort expectancy (EE), facilitating conditions (FC), performance expectancy (PE), price value (PV), and social influence (SI) captures unique aspects under study without excessive overlap.
The Fornell-Larcker criterion results show that the square root of the Average Variance Extracted (AVE) for each construct was greater than its correlations with other constructs, further supporting discriminant validity (Fornell & Larcker, 1981).
As depicted in Table 3, the DBU had an AVE square root of 0.794, which exceeded its correlations with EE (0.499), FC (0.594), PE (0.530), PV (0.551), and SI (0.537). Together, these findings confirm that the measurement model is robust, with constructs that are both reliable and conceptually distinct, thereby providing a sound basis for testing the structural relationships in the SEM analysis (Hair et al., 2022).
4.4. Validity and Reliability Results
Table 4 showed the results of the measurement model that demonstrates strong reliability and validity across most constructs. Factor loadings for the majority of items exceeded the recommended threshold of 0.70, indicating that the observed variables adequately represent their latent constructs (Hair et al., 2022). Although two items of the price value (PV2 and PV5) fell slightly below this benchmark (0.564 and 0.678), the construct was retained because its Average Variance Extracted (AVE) value of 0.524 surpassed the minimum criterion of 0.50, confirming acceptable convergent validity (Fornell & Larcker, 1981).
As presented in table 4 the Cronbach’s alpha (CA) values ranged from 0.769 (PV) to 0.888 (PE), all above the 0.70 threshold, demonstrating internal consistency reliability. Similarly, composite reliability (CR rho_a and rho_c) values range 0.786(PV) to 0.888(PE) and 0.844(PV) to 0.918(PE) respectively, this indicates that all constructs exceeded 0.70, further supporting construct reliability (Henseler et al., 2015).
Table 4 showed the Average Variance Extracted (AVE) values, ranging from 0.524(PV) to 0.691(PE), exceed the 0.50 threshold, indicating adequate convergent validity and that each construct explains more than half of the variance of its indicators (Fornell & Larcker, 1981; Hair et al., 2019).
Table 4 indicated that the Variance Inflation Factor (VIF) values for all items were below the critical threshold of 5, with most ranging between 1.216 and 2.848, indicating no serious multicollinearity issues (Kock, 2015). This ensures that the constructs are distinct and not excessively correlated.
4.5. PLS-SEM Path Analysis Result
This study employed Structural Equation Modeling (SEM) using the Partial Least Squares approach (PLS-SEM) with SmartPLS-4 software. The analysis was conducted in two sequential stages: evaluation of the measurement model (outer model) and assessment of the structural model (inner model). The measurement model was examined to establish construct reliability and validity, including convergent validity, discriminant validity, composite reliability, and Cronbach’s alpha. The structural model was then evaluated to assess the explanatory power of the model (R²) and the significance of hypothesized relationships using path coefficients. Causal relationships among latent variables were tested through bootstrapping procedures, which generated t-statistics and significance levels for hypothesis testing (Abdillah, 2018; Hair et al., 2014).
Figure 2.
PLS-SEM Path Coefficients Analysis.
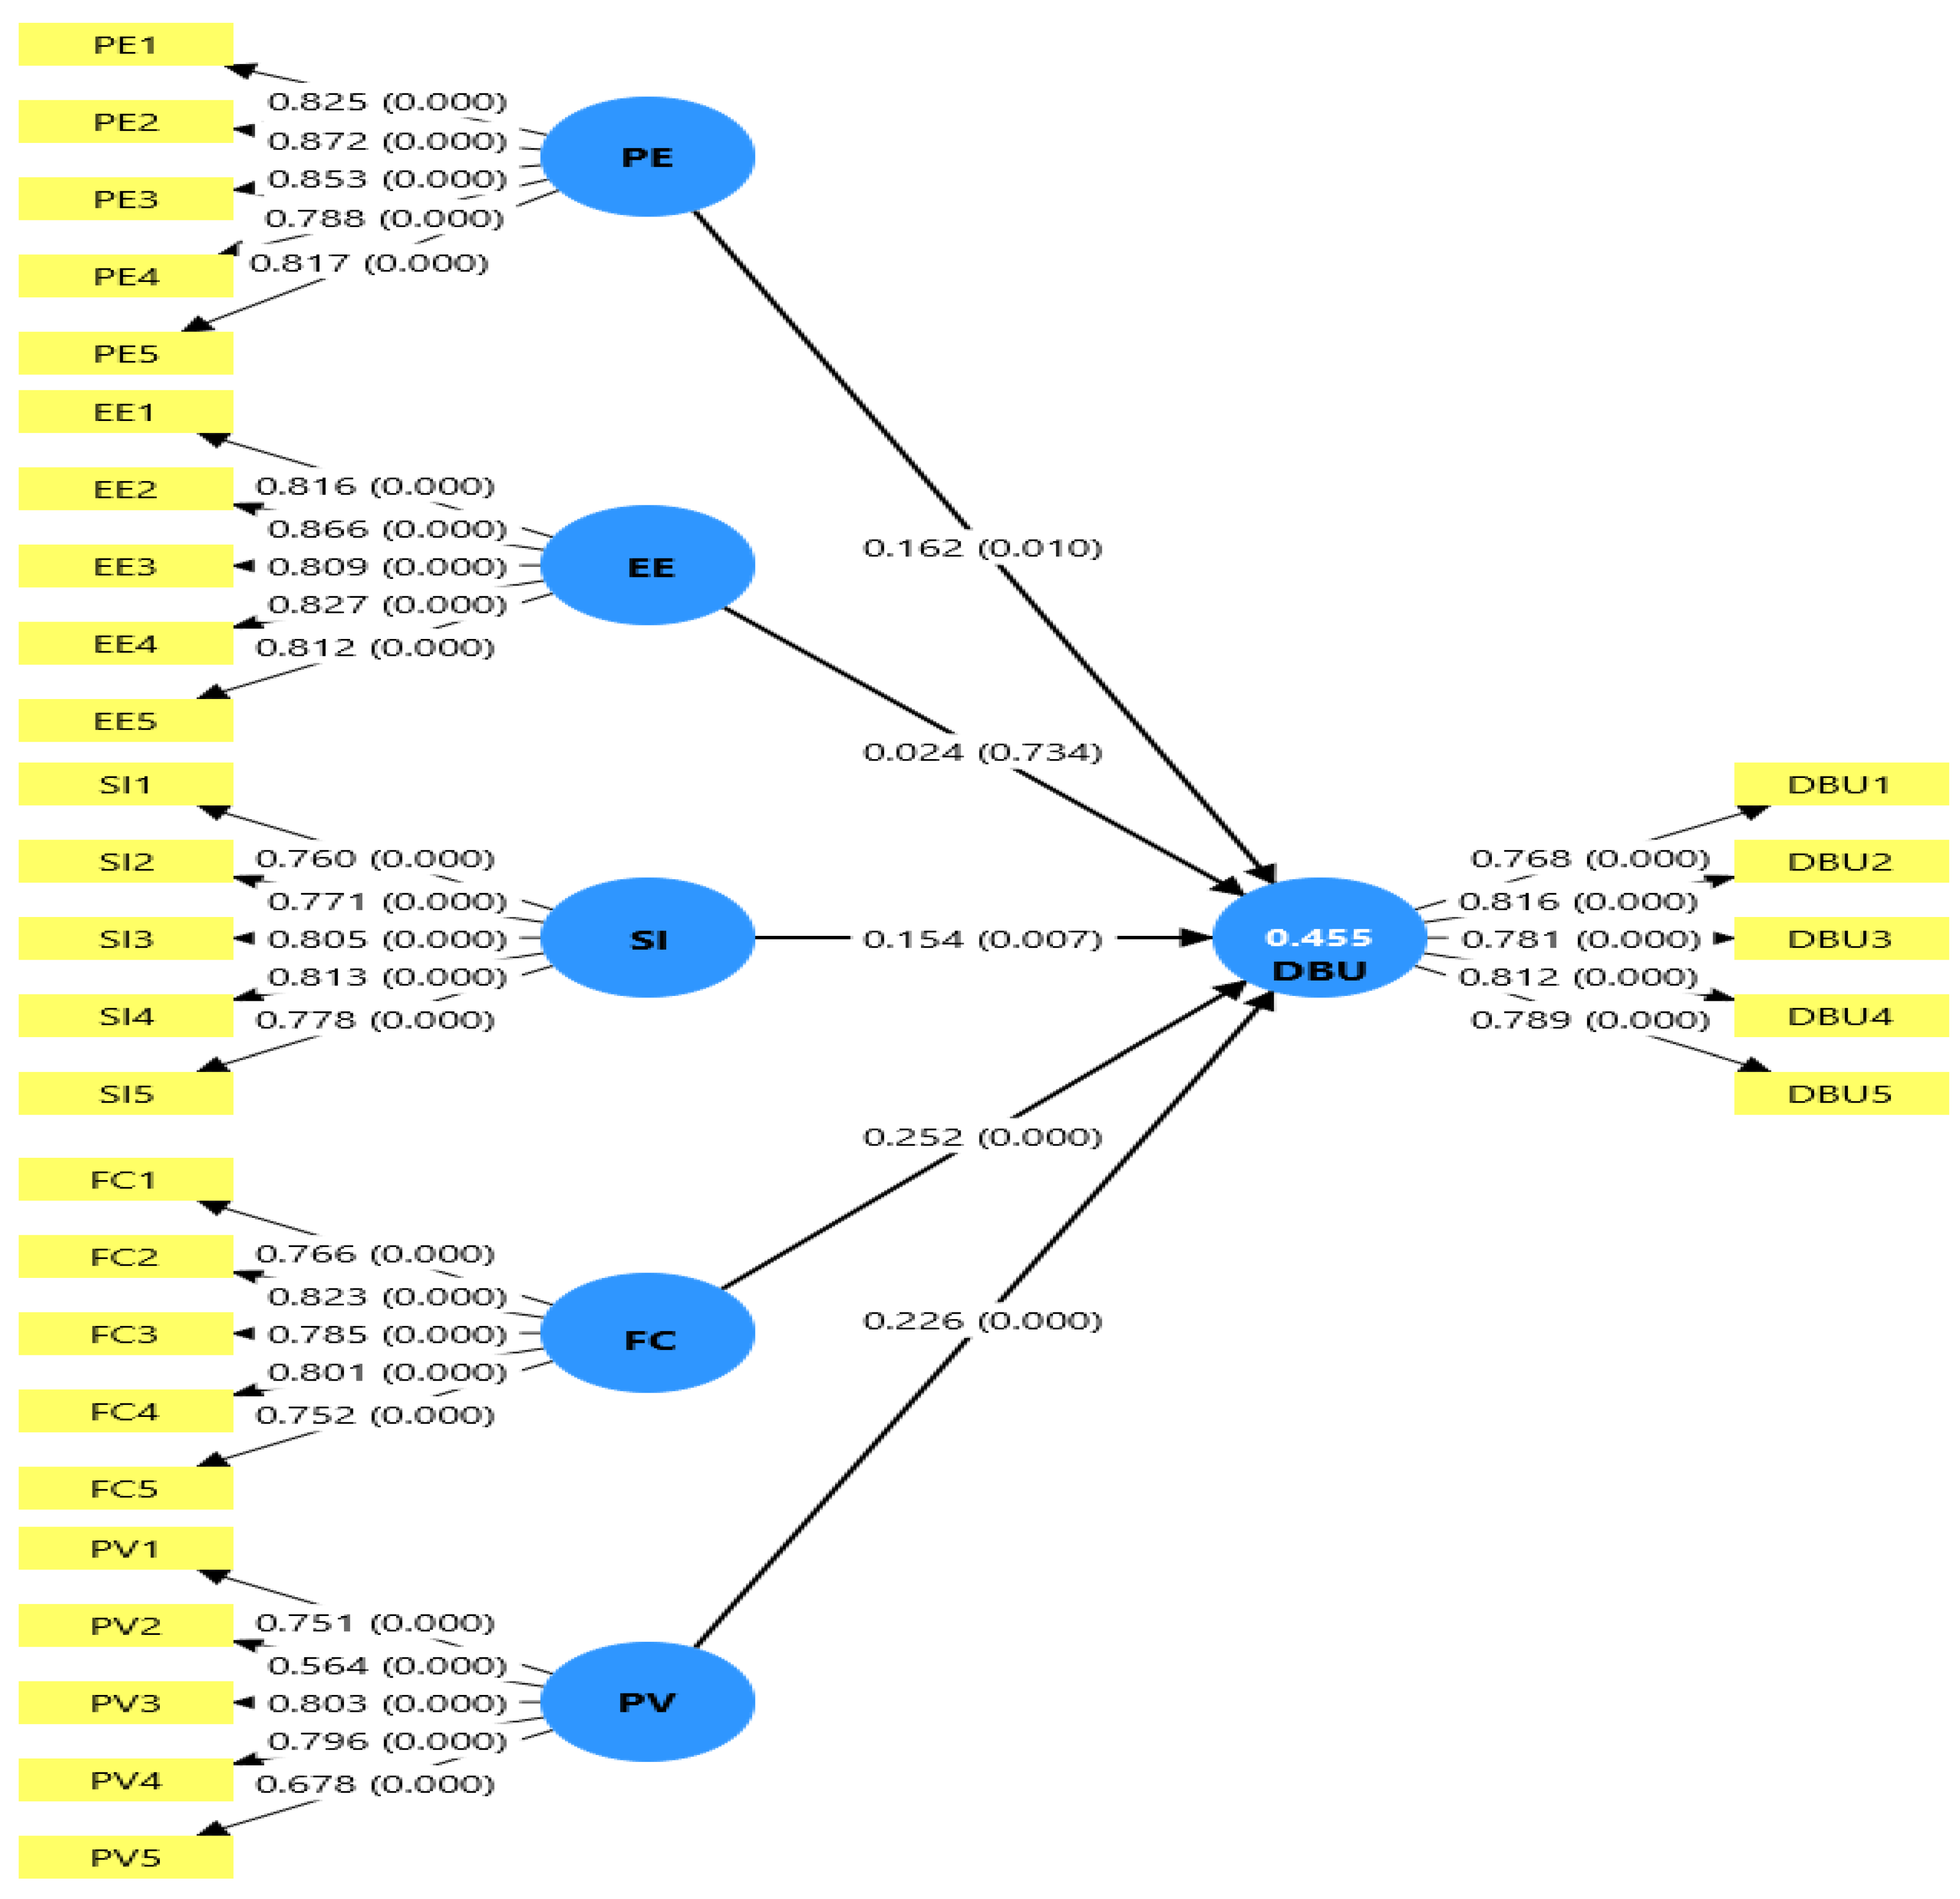
The structural model results reveal that the determinants of digital banking utilization (DBU) in Ethiopia vary in their influence, with facilitating conditions (β = 0.252, p < 0.001) and price value (β = 0.226, p < 0.001) exerting the strongest positive effects. This indicates that users are more likely to adopt digital banking when adequate infrastructure, resources, and perceived cost-benefit advantages are present, consistent with prior findings that emphasize the importance of FC and PV in technology adoption across emerging markets (Venkatesh et al., 2012; Oliveira et al., 2014). Performance expectancy (β = 0.162, p = 0.010) also significantly predicts DBU, underscoring the role of perceived usefulness and efficiency, which aligns with UTAUT2 theory and recent empirical evidence (Hilal & Varela-Neira, 2022). Social influence (β = 0.154, p = 0.007) has a moderate but significant effect, suggesting that peer, family, and societal norms shape adoption decisions, a finding consistent with studies in similar developing country contexts (Gebrekidan, 2022). In contrast, effort expectancy (β = 0.024, p = 0.734) was non-significant, implying that ease of use does not strongly affect adoption, likely because users have already gained familiarity with digital banking or perceive the effort required as manageable (Oliveira et al., 2014). Overall, these results validate the theoretical underpinnings of UTAUT2 while highlighting the context-specific relevance of FC and PV as critical drivers of digital banking adoption in Ethiopia.
4.6. Hypothesis Testing Results
The results of the hypothesis analysis are shown below; a hypothesis is regarded accepted if the T-statistics value is more than 1.96 and the P-value is less than 5% (0.05). The hypothesis analysis outcomes are described as follows:

Table 5.
Path Coefficients Hypothesis Test Results.
| Hypothesis | Path Coefficients | T-Statistics | P Values | Results |
|---|---|---|---|---|
| PE -> DBU | 0.162 | 2.560 | 0.010 | Supported |
| EE -> DBU | 0.024 | 0.340 | 0.734 | Not Supported |
| SI -> DBU1 | 0.154 | 2.687 | 0.007 | Supported |
| FC -> DBU | 0.252 | 3.884 | 0.000 | Supported |
| PV-> DBU | 0.226 | 4.105 | 0.000 | Supported |
Source: SmartPLS-4 output, 2025.
The structural model results provide important insights into the determinants of digital banking utilization (DBU) in Addis Ababa.
H1: Performance expectancy has a positive and significant effect on digital banking utilization
Performance Expectancy (PE → DBU): The positive and significant effect (β = 0.162, t = 2.560, p = 0.010) indicates that users adopt digital banking when they perceive it as improving efficiency and financial management. This is consistent with UTAUT2 findings that performance expectancy is a strong predictor of technology adoption (Venkatesh et al., 2012; Hilal & Varela-Neira, 2022).
H2: Effort Expectancy (EE) has a positive and significant effect on digital banking utilization
Effort Expectancy (EE → DBU): The path coefficient (β = 0.024, t = 0.340, p = 0.734) was not significant, indicating that ease of use does not strongly influence DBU in this context. This finding suggests that Ethiopian users may already be familiar with digital platforms, making effort expectancy less relevant. Similar results were reported in African contexts where digital literacy has improved, reducing the role of effort expectancy in adoption decisions (Muthinja & Chipeta, 2020).
H3: Social Influence (SI) has a positive and significant effect on digital banking utilization
Social Influence (SI → DBU): The significant path (β = 0.154, t = 2.687, p = 0.007) highlights the role of peer and societal pressure in shaping adoption. In collectivist cultures such as Ethiopia, recommendations from friends, family, and community leaders strongly influence technology acceptance (Gebrekidan, 2022).
H4: Facilitating Conditions (FC) has a positive and significant effect on digital banking utilization
Facilitating Conditions (FC → DBU): The relationship was significant (β = 0.252, t = 3.884, p < 0.001), confirming that infrastructural support and resource availability are critical for DBU. This aligns with prior studies emphasizing the importance of reliable mobile networks, electricity, and institutional support in Sub-Saharan Africa (Mago & Mago, 2021; Eyo-Udo et al., 2025).
H4: Price Value (PV) has a positive and significant effect on digital banking utilization
Price Value (PV → DBU): The strongest significant predictor (β = 0.226, t = 4.105, p < 0.001) demonstrates that affordability and perceived economic benefits are central to DBU. This finding resonates with recent African studies showing that cost-effectiveness and value-added services drive digital finance adoption (Neves et al., 2024; Kassaye et al., 2025).
The results confirm that facilitating conditions, performance expectancy, social influence, and price value significantly predict DBU, while effort expectancy does not. This highlights the importance of context-specific determinants in Ethiopia, where infrastructural reliability, affordability, and social dynamics outweigh ease-of-use considerations.
5. Conclusions
Based on the finding of the analysis the following conclusions were drawn this study provides empirical evidence on the drivers of digital banking utilization in Addis Ababa, Ethiopia. The results demonstrate that facilitating conditions, price value, performance expectancy, and social influence significantly influence digital banking usage, whereas effort expectancy does not play a decisive role.
These findings suggest that in an emerging digital finance ecosystem, adoption is shaped more by infrastructural readiness, perceived economic value, and social endorsement than by usability concerns. The study confirms the contextual robustness of UTAUT2 in explaining consumer technology adoption within developing economies characterized by rapid regulatory reform and expanding digital infrastructure.
5.1. Implications
The findings indicate that banks and fintech providers should prioritize service affordability, system reliability, and infrastructure compatibility to enhance digital banking uptake. Emphasizing tangible performance benefits and cost efficiency can strengthen customer value perception, while socially driven awareness campaigns may further accelerate adoption. For policymakers, the results reinforce the importance of sustained investment in digital infrastructure, interoperability, and supportive regulatory frameworks. Strengthening these enabling conditions will be critical for advancing Ethiopia’s national goals of financial inclusion and a cash-lite economy, in line with the National Digital Payments Strategy.
5.2. Contribution
This study contributes to the digital banking and information systems literature in three important ways. First, it extends the application of the UTAUT2 model to the Ethiopian context, where empirical evidence remains limited and fragmented. Second, by excluding hedonic motivation and habit, the study adapts UTAUT2 to reflect the utilitarian and necessity-driven nature of financial services in emerging markets. Third, it provides updated empirical insights into urban digital banking behavior in Sub-Saharan Africa, thereby enriching the comparative literature on technology adoption across developing economies.
5.3. Limitations
The cross-sectional design restricts causal inference and does not capture behavioral changes over time. The geographic focus on Addis Ababa may limit the generalizability of findings to rural or less digitally connected regions. Additionally, the reliance on self-reported survey data may introduce response bias, despite the strong reliability and validity of the measurement model. These limitations suggest caution when extending the findings beyond similar urban contexts.
5.4. Future Research Direction
Future studies should adopt longitudinal approaches to examine how digital banking usage evolves as infrastructure quality, regulation, and digital literacy improve. Expanding research to include rural and semi-urban areas will offer a more comprehensive national perspective. Further the researches also integrate qualitative methods to explore trust, perceived risk, and institutional confidence in greater depth. Extending the model to include variables such as cybersecurity awareness, fintech collaboration, and digital literacy could enhance the explanatory power of technology adoption frameworks in emerging financial ecosystems.
References
- Abdulreza, M. S.; Ali, H. M.; Ismail, J. A. The impact of UTAUT2 on new financing technologies. In World Economics & Finance Bulletin; 2024. [Google Scholar]
- African Development Bank. Ethiopia Economic Outlook 2023; AfDB, 2023. [Google Scholar]
- Ahmad, M. Review of TAM in internet and mobile banking . International Journal of ICT Development 2018. [Google Scholar]
- Ahmed, R.; Sur, S. Digital banking and customer engagement: A conceptual review. Journal of Financial Services Marketing 2021, 26(3), 210–223. [Google Scholar]
- Alkhowaiter, W. A. Digital payment systems and banking innovation. Journal of Financial Technology 2020, 5(3), 221–235. [Google Scholar]
- Alsobai, B.; Aassouli, D. Assessing Digital Transformation Strategies in Retail Banks: A Global Perspective. Journal of Risk and Financial Management 2025, 18(12), 710. [Google Scholar] [CrossRef]
- Besrat, T. Ethiopia’s digital payments journey: Leveraging the National Digital Transformation Strategy 2025; AfricaNenda, 2024. [Google Scholar]
- BPC; Fincog. Digital Banking in Sub-Saharan Africa; 2022. [Google Scholar]
- Davis, F. D. Perceived usefulness, perceived ease of use, and user acceptance of information technology . MIS Quarterly 1989, 13(3), 319–340. [Google Scholar] [CrossRef]
- European Investment Bank. Finance in Africa: Unlocking investment in an era of digital transformation; 2024. [Google Scholar]
- Eyo-Udo, N. L.; Apeh, C. E.; Bristol-Alagbariya, B. Digital banking in Africa: Recent developments and challenges. Account and Financial Management Journal 2025, 10(4), 12–24. [Google Scholar] [CrossRef]
- Fornell, C.; Larcker, D. F. Evaluating structural equation models with unobservable variables and measurement error. Journal of Marketing Research 1981, 18(1), 39–50. [Google Scholar] [CrossRef]
- Gardachew. Electronic-Banking in Ethiopia- Practices, Opportunities and Challenges. Journal of Internet Banking and Commerce 2010, 15(2). [Google Scholar]
- Gebrekidan, T. Users Intention Towards Digital Financial Service Adoption in Ethiopia. Journal of Finance and Accounting 2022, 10(5), 196–205. [Google Scholar] [CrossRef]
- Gefen, D.; Straub, D.; Boudreau, M. C. Structural equation modeling and regression: Guidelines for research practice. Communications of the Association for Information Systems 2000, 4(7), 1–77. [Google Scholar] [CrossRef]
- Gemechu, A. Factors Affecting Adoption of Electronic Banking System in Ethiopian Banking Industry. Journal of Management Information System and E-commerce 2014, 1(1), 1–17. [Google Scholar]
- GSMA. Mobile Money in Ethiopia: Advancing financial inclusion and driving. Global System for Mobile Communication Association 2023, 1–83. [Google Scholar]
- Hair, J. F.; Black, W. C.; Babin, B. J.; Anderson, R. E. Multivariate data analysis, 8th ed.; Cengage Learning, 2019. [Google Scholar]
- Hair, J. F.; Hult, G. T. M.; Ringle, C. M.; Sarstedt, M. A primer on partial least squares structural equation modeling (PLS-SEM), 2nd ed.; Sage Publications, 2017. [Google Scholar]
- Hair, J. F.; Hult, G. T. M.; Ringle, C. M.; Sarstedt, M. A primer on partial least squares structural equation modeling (PLS-SEM), 3rd ed.; Sage Publications, 2022. [Google Scholar]
- Hair, J. F., Jr.; Hult, G. T. M.; Ringle, C. M.; Sarstedt, M. A primer on partial least squares structural equation modeling (PLS-SEM); Sage Publications, 2014. [Google Scholar]
- Harahap, D.; Afandi, A.; Siregar, T. M. Digital banking transformation and consumer behavior . Journal of Applied Structural Equation Modeling 2024. [Google Scholar]
- Henseler, J.; Ringle, C. M.; Sarstedt, M. A new criterion for assessing discriminant validity in variance-based structural equation modeling. Journal of the Academy of Marketing Science 2015, 43(1), 115–135. [Google Scholar] [CrossRef]
- Hilal, A.; Varela-Neira, C. Understanding consumer adoption of mobile banking: Extending the UTAUT2 model with proactive personality. Sustainability 2022, 14(22), 14708. [Google Scholar] [CrossRef]
- Ikmanila, R..; Djastuti, I.. The Role of Digital Banking in Enhancing Financial Inclusion. Economic and Business Horizon 2025, 4(3), 459–468. [Google Scholar] [CrossRef]
- Indriasari, E.; Prabowo, H.; Gaol, F. L.; Purwandari, B. Digital banking: Challenges, Emerging Technology Trends, and Future Research Agenda. International Journal of E-Business Research 2022, 18(1). [Google Scholar] [CrossRef]
- Kassaye, A. T.; Belachew, T.; Haftu, K. Determinants of Customers’ Digital Banking Utilization: A Pathway to Cash-Lite Economy. Journal of Business and Economic Development 2025, 10(2), 81–93. [Google Scholar] [CrossRef]
- Khalid, M. Research methodology: Tools and techniques; Academic Press, 2012. [Google Scholar]
- Kindie, H. Customers’ Perception towards Mobile Banking Security: The Case of Commercial Bank of Ethiopia in Addis Ababa. Master's Thesis, Addis Ababa University. School of Information Science, 2016. [Google Scholar]
- Kinfe, M. Challenges and Prospect of E-Banking in Ethiopia. Master's Thesis, Addis Ababa University, School of Information Science, 2016. [Google Scholar]
- KPMG. Scorecard for Digital Banking Channels in Africa 2022.
- Mago, S.; Mago, S. The digital financial services ecosystem in Africa: A review. Journal of African Business 2021, 22(3), 361–381. [Google Scholar]
- MDPI. Digital Finance in Africa: Accelerating Foundations for Inclusion; 2024. [Google Scholar]
- Ministry of Planning and Development (MoPD). A ten years Development plan: A Pathway to Prosperity (2021 - 2030); Ministry of Planning and Development: Addis Ababa, Ethiopia, 2021; pp. 1–86. [Google Scholar]
- Mesud, Mohammed; Gurudutta, &. Japee. The Role of Digital Banking in Advancing Financial Inclusion: A Systematic Literature Review. Asian Journal of Economics, Business and Accounting 2025, 25(5), 335–342. [Google Scholar] [CrossRef]
- Mohamud, A. Electronic banking systems and customer service delivery. International Journal of Banking and Finance 2017, 12(2), 45–60. [Google Scholar]
- Murrar, A.; Asfour, B.; Paz, V. Banking sector and economic growth in the digital transformation era . Asian Journal of Economics and Business 2023. [Google Scholar]
- Muthinja, M. M.; Chipeta, C. Digital financial innovations and financial inclusion in Sub-Saharan Africa: Evidence from Kenya. African Journal of Economic and Management Studies 2020, 11(3), 403–423. [Google Scholar]
- National Bank of Ethiopia (NBE). Quarterly economic and financial developments report; National Bank of Ethiopia, April 2024. [Google Scholar]
- Nazaruddin, I.; Ietje; Basuki, T. Statistical analysis for social research; Deepublish, 2015. [Google Scholar]
- NBE. National Digital Payments Strategy 2021–2024; National Bank of Ethiopia: Addis Ababa, Ethiopia, 2021; pp. 1–88. [Google Scholar]
- NBE. National Digital Payments Strategy; National Bank of Ethiopia, 2021. [Google Scholar]
- NBE. National Financial Inclusion Strategy II (NFIS 2021–2025). National Bank of Ethiopia; Addis Ababa, Ethiopia, 2021. Available online: https://nbe.gov.et/files/national-financial-inclusion-strategy-ii-2021-2025.
- NBE. Proclamation for National Payment System Amendment Proclamation No:- 1282/2023. Addis Ababa, National Bank of Ethiopia, 2023.
- NBE. Proclamation to Provide for Electronic Transactions Proclamation No: - 1205/2020. National Bank of Ethiopia. Addis Ababa, 2020. [Google Scholar]
- Neves, C.; Oliveira, T.; Santini, F. O.; Ladeira, W. J. A digital payment generalisation model: A meta-analytic structural equation modelling approach. In Electronic Commerce Research; 2024. [Google Scholar]
- Oliveira, T.; Faria, M.; Thomas, M. A.; Popovič, A. Extending the understanding of mobile banking adoption: When UTAUT meets TTF and ITM. International Journal of Information Management 2014, 34(5), 689–703. [Google Scholar] [CrossRef]
- Ozili, P. K. The acceptable R-square in empirical modelling. Journal of Applied Economics and Finance 2023, 10(1), 1–7. [Google Scholar]
- Patil, P.; Tamilmani, K.; Rana, N. P.; Raghavan, V. Understanding consumer adoption of mobile banking: Extending UTAUT2. Journal of Retailing and Consumer Services 55 2020, 102–112. [Google Scholar]
- Pham, D. K. Digital banking adoption in Vietnam: An application of UTAUT2 . Webology 2021, 19(1). [Google Scholar] [CrossRef]
- Rick, J.; Jasny, B. R. Statistical significance, p-values, and confidence intervals. Science 2018, 360(6388), 631–632. [Google Scholar]
- Tarhini, A.; Hone, K.; Liu, X. The effects of individual differences on e-learning users’ behavior in developing countries. Computers in Human Behavior 64 2016, 689–700. [Google Scholar]
- Tiwari, P. Electronic banking adoption in Ethiopia: An empirical investigation . SN Business & Economics 2021, 1(112). [Google Scholar] [CrossRef]
- Venkatesh, V.; Morris, M. G.; Davis, G. B.; Davis, F. D. User acceptance of information technology: Toward a unified view . MIS Quarterly 2003, 27(3), 425–478. [Google Scholar] [CrossRef]
- Venkatesh, V.; Thong, J. Y. L.; Xu, X. Consumer acceptance and use of information technology: Extending the Unified Theory of Acceptance and Use of Technology. MIS Quarterly 2012, 36(1), 157–178. [Google Scholar] [CrossRef]
- Wondwossen, T.; Tsegai, G. E-payment: Challenges and Opportunities in Ethiopia. In Economic commission for Africa; Addis Ababa Ethiopia, 2005. [Google Scholar]
- Worku, G. Electronic banking in Ethiopia: Practices, Opportunities and Challenges. Journal of Internet Banking and Commerce 2010, 15(2), 1–8. [Google Scholar]
- Zeleke, A. Opportunities and Challenges in the Adoption of E-Banking Services: The case of Dashen Bank S.C. Master's Thesis, Addis Ababa University, Executive Masters of Business Administration (EMBA), 2016. [Google Scholar]
- Zerihun, M. Assessment of opportunities and challenges for e-banking adoption in Ethiopia; St. Mary’s University, 2016. [Google Scholar]
Table 1.
Descriptive Statistics and Correlation Results.
| Construct | Descriptive Statistics Results | Correlation Results | ||||||||
|---|---|---|---|---|---|---|---|---|---|---|
| Mean | Standard Deviation | Kurtosis | Skewness | PE | EE | SI | FC | PV | DBU | |
| PE | 3.886 | 0.775 | 0.609 | -0.802 | 1 | |||||
| EE | 3.863 | 0.724 | 0.146 | -0.500 | 0.687 | 1 | ||||
| SI | 3.559 | 0.747 | 0.565 | -0.520 | 0.511 | 0.516 | 1 | |||
| FC | 3.754 | 0.715 | 0.273 | -0.550 | 0.632 | 0.700 | 0.606 | 1 | ||
| PV | 3.518 | 0.697 | -0.139 | -0.171 | 0.479 | 0.460 | 0583 | 0.563 | 1 | |
| DBU | 3.808 | 0.692 | 0.203 | -0.421 | 0.530 | 0.497 | 0.528 | 0.593 | 0.544 | 1 |
Source: SmartPLS-4 output, 2025.
Table 2.
Discriminant validity – Heterotrait-monotrait ratio (HTMT).
| Construct | DBU | EE | FC | PE | PV | SI |
|---|---|---|---|---|---|---|
| DBU | ||||||
| EE | 0.574 | |||||
| FC | 0.698 | 0.812 | ||||
| PE | 0.608 | 0.776 | 0.729 | |||
| PV | 0.672 | 0.564 | 0.700 | 0.585 | ||
| SI | 0.626 | 0.604 | 0.718 | 0.596 | 0.725 |
Source: SmartPLS-4 output, 2025.
Table 3.
Discriminant validity – Fornell-Larcker Criterion.
| Construct | DBU | EE | FC | PE | PV | SI |
|---|---|---|---|---|---|---|
| DBU | 0.794 | |||||
| EE | 0.499 | 0.826 | ||||
| FC | 0.594 | 0.703 | 0.786 | |||
| PE | 0.530 | 0.687 | 0.632 | 0.831 | ||
| PV | 0.551 | 0.465 | 0.569 | 0.493 | 0.724 | |
| SI | 0.537 | 0.528 | 0.609 | 0.523 | 0.586 | 0.786 |
Source: SmartPLS-4 output, 2025.
Table 4.
Construct Validity and Reliability Results.
| Construct | Items | Factor Loading | CA (α) | CR (rho_a) | CR (rho_c) | AVE | VIF |
|---|---|---|---|---|---|---|---|
| DBU | DBU1 | 0.768 | 0.853 | 0.853 | 0.895 | 0.630 | 1.819 |
| DBU2 | 0.816 | 2.073 | |||||
| DBU3 | 0.781 | 1.766 | |||||
| DBU4 | 0.812 | 1.979 | |||||
| DBU5 | 0.789 | 1.963 | |||||
| EE | EE1 | 0.816 | 0.884 | 0.885 | 0.915 | 0.683 | 2.195 |
| EE2 | 0.866 | 2.702 | |||||
| EE3 | 0.809 | 2.059 | |||||
| EE4 | 0.827 | 2.111 | |||||
| EE5 | 0.812 | 1.963 | |||||
| FC | FC1 | 0.766 | 0.845 | 0.846 | 0.890 | 0.618 | 1.742 |
| FC2 | 0.823 | 2.046 | |||||
| FC3 | 0.785 | 1.800 | |||||
| FC4 | 0.801 | 1.888 | |||||
| FC5 | 0.752 | 1.649 | |||||
| PE | PE1 | 0.825 | 0.888 | 0.888 | 0.918 | 0.691 | 2.222 |
| PE2 | 0.872 | 2.848 | |||||
| PE3 | 0.853 | 2.422 | |||||
| PE4 | 0.788 | 1.788 | |||||
| PE5 | 0.817 | 2.071 | |||||
| SI | SI1 | 0.760 | 0.846 | 0.850 | 0.890 | 0.617 | 2.047 |
| SI2 | 0.771 | 2.136 | |||||
| SI3 | 0.805 | 1.868 | |||||
| SI4 | 0.813 | 1.908 | |||||
| SI5 | 0.778 | 1.718 | |||||
| PV | PV1 | 0.751 | 0.524 | 1.569 | |||
| PV2 | 0.564 | 1.216 | |||||
| PV3 | 0.803 | 0.769 | 0.786 | 0.844 | 1.748 | ||
| PV4 | 0.796 | 1.695 | |||||
| PV5 | 0.678 | 1.308 |
Source: SmartPLS-4 output, 2025.
Disclaimer/Publisher’s Note: The statements, opinions and data contained in all publications are solely those of the individual author(s) and contributor(s) and not of MDPI and/or the editor(s). MDPI and/or the editor(s) disclaim responsibility for any injury to people or property resulting from any ideas, methods, instructions or products referred to in the content. |
© 2026 by the authors. Licensee MDPI, Basel, Switzerland. This article is an open access article distributed under the terms and conditions of the Creative Commons Attribution (CC BY) license (http://creativecommons.org/licenses/by/4.0/).
Copyright: This open access article is published under a Creative Commons CC BY 4.0 license, which permit the free download, distribution, and reuse, provided that the author and preprint are cited in any reuse.


