Submitted:
26 April 2025
Posted:
21 May 2025
You are already at the latest version
Abstract
The purpose of this study is to investigate the factors influencing the usage of mobile banking service technology by a commercial bank in Ethiopia, Harar city. This study uses the TAM model by integrating perceived usefulness, perceived ease of use, perceived risk, perceived trust, and perceived awareness to investigate the factors influencing the usage of mobile banking service technology by a commercial bank in the city of Harar in Ethiopia. The study employed a quantitative approach with both explanatory and descriptive research designs. This study was conducted on the basis of information acquired from clients of the commercial bank of Ethiopia's five branches in the city of Harar. A survey was conducted via a questionnaire; 385 of the 400 issued surveys were used. The data were analyzed with SPSS version 20. The research results revealed that perceived usefulness, perceived ease of use, and perceived awareness had a significant positive effect on mobile banking usage and that major factors influencing mobile banking perceived trust had a significant negative effect on mobile banking usage, whereas perceived risk had an insignificant negative effect on mobile banking customers located in Harar city. The study recommended that banks should aim to make their mobile banking as simple and easy to use as possible so that customers do not perceive them as being complicated or difficult to use.
Keywords:
usage of mobile banking service
; TAM
; perceived usefulness
; perceived ease of use
; perceived risk
; perceived trust
; perceived awareness
1. Introduction
Mobile banking is used for the operation of the bank for current accounts and savings for deposit or payment accounts. This is because mobile phones and other handheld devices have been firmly established as alternative forms of payment in technologically advanced societies (Singh, 2014). Mobile banking is one of the emerging trends in the marketing of products. As such, it is regarded as a tool of electronic marketing, which is characterized by the use of interactive wireless media to provide customers with product information at any time in a way that benefits stakeholders or by a set of procedures that enables an organization to interact with its audience (Bihari, 2014). As a result, many businesses have started utilizing mobile marketing to streamline their processes and remain in constant contact with their clients, including banks, which have started to increase the number of mobile banking services they offer. This form of service is regarded as an advanced method of offering banking services to clients because it calls for a foundational understanding from clients, interactional experience, and a shift in the clients' traditional banking practices (Medberg & Heinonen, 2014).
A number of valuable studies in the area of mobile banking have been conducted over the years back in North America, Europe and Asia. Africa, which considers it a developing continent and mobile banking, is still very new in the technology world. However, additional studies carried out in the middle of the 2000s revealed that mobile banking has developed more quickly in Sub-Saharan Africa than in the majority of other regions of the world within a relatively short period of time and is anticipated to continue growing (International Telecommunications Union, 2005). Researchers, such as Gerrard (2003), La foret (2005), Masinge (2010), Teo et al. (2011), Al-Jabri (2012), Dineshwar (2013) and others, have presented evidence for a number of variables that influence customer behavior intentions to use mobile banking; however, the study of mobile banking has received little attention in the literature in Ethiopia.
The existing research in Ethiopia included mobile banking in electronic banking challenges and barriers (Bultum, 2012), (Garedachew, 2010). To the best of the researcher's knowledge, no research has been conducted on the factors influencing the usage of mobile banking in Ethiopia, specifically inHararcity. Therefore, this gap and the empirical gap mentioned above motivate student researchers to undertake research to overcome the issues that influence mobile banking services to understand this new technology in the banking sector.
2. Literature Review
2.1. Factors Affecting Mobile Banking Usage
Many researchers have used different theoretical frameworks in the adoption of new technological innovations. Among the frameworks that have been developed on the basis of past studies include the technology acceptance model (TAM) (Davis et al., 1989), which posits two sets of beliefs, i.e., perceived ease of use (PEOU) and perceived usefulness (PU), to determine an individual's acceptance of a technology. The additional TAM constructs perceived risk, awareness and trust, as indicated in different studies, and extends the existing TAM model by adding four new constructs to understand mobile banking adoption in Taiwan. These are perceived credibility, perceived self-efficacy, perceived cost and perceived risk (Luarn & Lin, 2005a).
Technology Acceptance Model (TAM)
This is the most pervasive approach where Davis (1989) presented a theoretical model aiming to predict and explain ICT usage behavior, that is, what causes potential adopters to accept or reject the use of information technology. Theoretically, the TAM is based on the theory of reasoned action (TRA). In the TAM, two theoretical constructs, perceived usefulness and perceived ease of use, are the fundamental determinants of system use and predict attitudes toward the use of the system, that is, the user’s willingness to use the system.
- Perceived Usefulness
According to the TAM, “perceived usefulness is the degree to which a person believes that using a particular system would enhance his or her job performance”(Davis et al., 1989). Perceived usefulness is the degree to which a person thinks that adopting mobile banking would benefit them. In the context of mobile banking services, the effect of perceived usefulness has received widespread recognition. (Chen & Barnes, 2007). Previous research has consistently argued that there is a positive relationship between the perceived usefulness of mobile banking, mobile banking intentions and attitudes toward mobile banking and mobile banking usage (Bhatti, 2007). For example, Chang (2003) examined the contributing factors and determined that perceived usefulness was an important factor in fostering a positive attitude towards accepting internet banking services. Additionally, there is a strong correlation between the use of mobile banking and the perceived usefulness of mobile banking in the literature on mobile banking. (Davis, 1989; Geffen, Karaganda& Straub, 2003; Venkatesh& Morris, 2000).
Thus, the research hypothesis was as follows:
H1
. Perceived usefulness has a significant positive effect on the usage of mobile banking services.
- 2.
- Perceived Ease of Use
Perceived ease of use is defined as the extent to which a person thinks that using a given method would be effortless. Prior studies have shown that perceived ease of use has a significant effect on usage intention, either directly or indirectly through its effect on perceived usefulness (Venkatesh, 2000). Information such as details of products or services, their benefits, and usage guidelines needs to be provided, as it will make it easier for customers to adopt mobile banking (Jeong & Yoon, 2013). Furthermore, “perceived ease of use helps in building trust with banks as it may send a signal that banks have truly put in thought about their end users”(Lin & Wang, 2006). Many previous empirical studies further show that perceived ease of use has a positive influence on the adoption of mobile commerce (Khalifa & Shen, 2008).
Thus, the research hypothesis was as follows:
H2.
Perceived ease of use has a significant positive effect on the usage of mobile banking services.
- 3.
- Perceived Risk
Perceived risk is the “uncertainty use of about the use pursuit of a desired outcome”(Gerrard & Cunningham, 2003). According to Lee (2009), performance risk is the loss caused by a failure of a mobile banking server. The term "security/privacy risk" describes the possibility of suffering financial loss as a result of fraud or a hacker jeopardizing the security of a mobile banking user. Time risk is the term for the inconvenience and loss of time caused by payment processing delays or difficult navigation.
A study by Wu and Wang (2005) on mobile commerce, where more than three-fifths (60%) of the respondents had online transaction experience, revealed that perceived risk positively influences the behavioural intent to use a product. According to the literature review, it is hypothesized that security, financial, time, social and performance risks are more likely to have a negative effect on the adoption of mobile banking(Wu & Wang, 2005).
Thus, the research hypothesis was as follows:
H3.
Perceived risk has a significant negative effect on the usage of mobile banking services.
- 4.
- Perceived Trust
Trust is a variable that has attracted the attention of many scholars and plays a mysterious role in the “adoption of mobile payments”(Misra & Wickamasinghe, 2004). Trust is a fundamental component for establishing and maintaining successful relationships between customers and businesses (Garbarino & Johnson, 1999).
Brand loyalty is simply defined as the repetitive purchase of preferred brand products or services. A favourable attitude toward the mobile vendor results in repeat buying behaviour(Lin & Wang, 2006). For the purpose of this study, Harris and Goode (2004) reported that customer loyalty in an online business is positively and directly associated with customer loyalty for online services (Harris & Goode, 2004). Since mobile banking is considered an extension of internet banking (Brown et al., 2003), it is therefore considered to be part of online services. Hence, a customer’s operations in mobile banking positively influence the service adoption of mobile banking.
Thus, the research hypothesis was as follows:
H4.
Perceived trust has a significant negative effect on overall mobile banking services.
- 5.
- Perceived Awareness
Awareness creation speeds the sales of products and evidence from different participants, laying credence to this. The level of awareness is an important factor in encouraging consumers to adopt related self-service facilities (Palvia, 2009). The amount of information customers have about impacting adoption. According to (Sathye, 1999), even if the use of an online banking service is still a relatively new experience for many people, a significant obstacle to the adoption of internet banking is a lack of awareness of the service. Customers were shown to be ignorant of the options, benefits, or drawbacks associated with internet banking in an empirical study of Australian consumers.
Thus, the research hypothesis was as follows:
H5.
Perceived awareness of mobile banking services has a significant positive effect on the usage of mobile banking services.
2.2. Benefits of Mobile Banking
Mobile banking, a commercial technique combining technology and commerce, allows customers to access specialized services without visiting traditional banks. Supported by SMS, it saves time, allows location flexibility, and offers convenience (Olasina, 2015). Mobile banking saves banks time, enabling effective marketing and sales efforts. It reduces costs of courier, communication, and paper work, and reduces the need for branch visits. This fosters a positive relationship, increasing customer loyalty(Mishra & Sahoo, 2013). Mobile banking offers numerous benefits, such as saving time and travel costs for customers, enabling timely payment of utility bills, and avoiding fines. Despite its widespread use, it remains underutilized (Riquelme & Rios, 2010b; Mishra & Sahoo, 2013; Delport, 2010).
2.3. Research Gap
Dineshwar and Steven (2013) provided evidence for several factors that affect customers' intentions to utilise mobile banking; however, research on mobile banking has received less attention in the Ethiopian literature (Ramdhony & Munien, 2013). The existing research in Ethiopia included mobile banking in electronic banking challenges and barriers (Bultum, 2012), (Garedachew, 2010), (Gezahegn, 2016), and (Nesibu, 2017). To the best of the researcher's knowledge, no study has investigated the factors influencing the use of mobile banking service technology in Ethiopia, particularly in Harar city. To develop an understanding of this modern technology in the banking sector, this study aims to address the problems that affect the usage of mobile banking services.
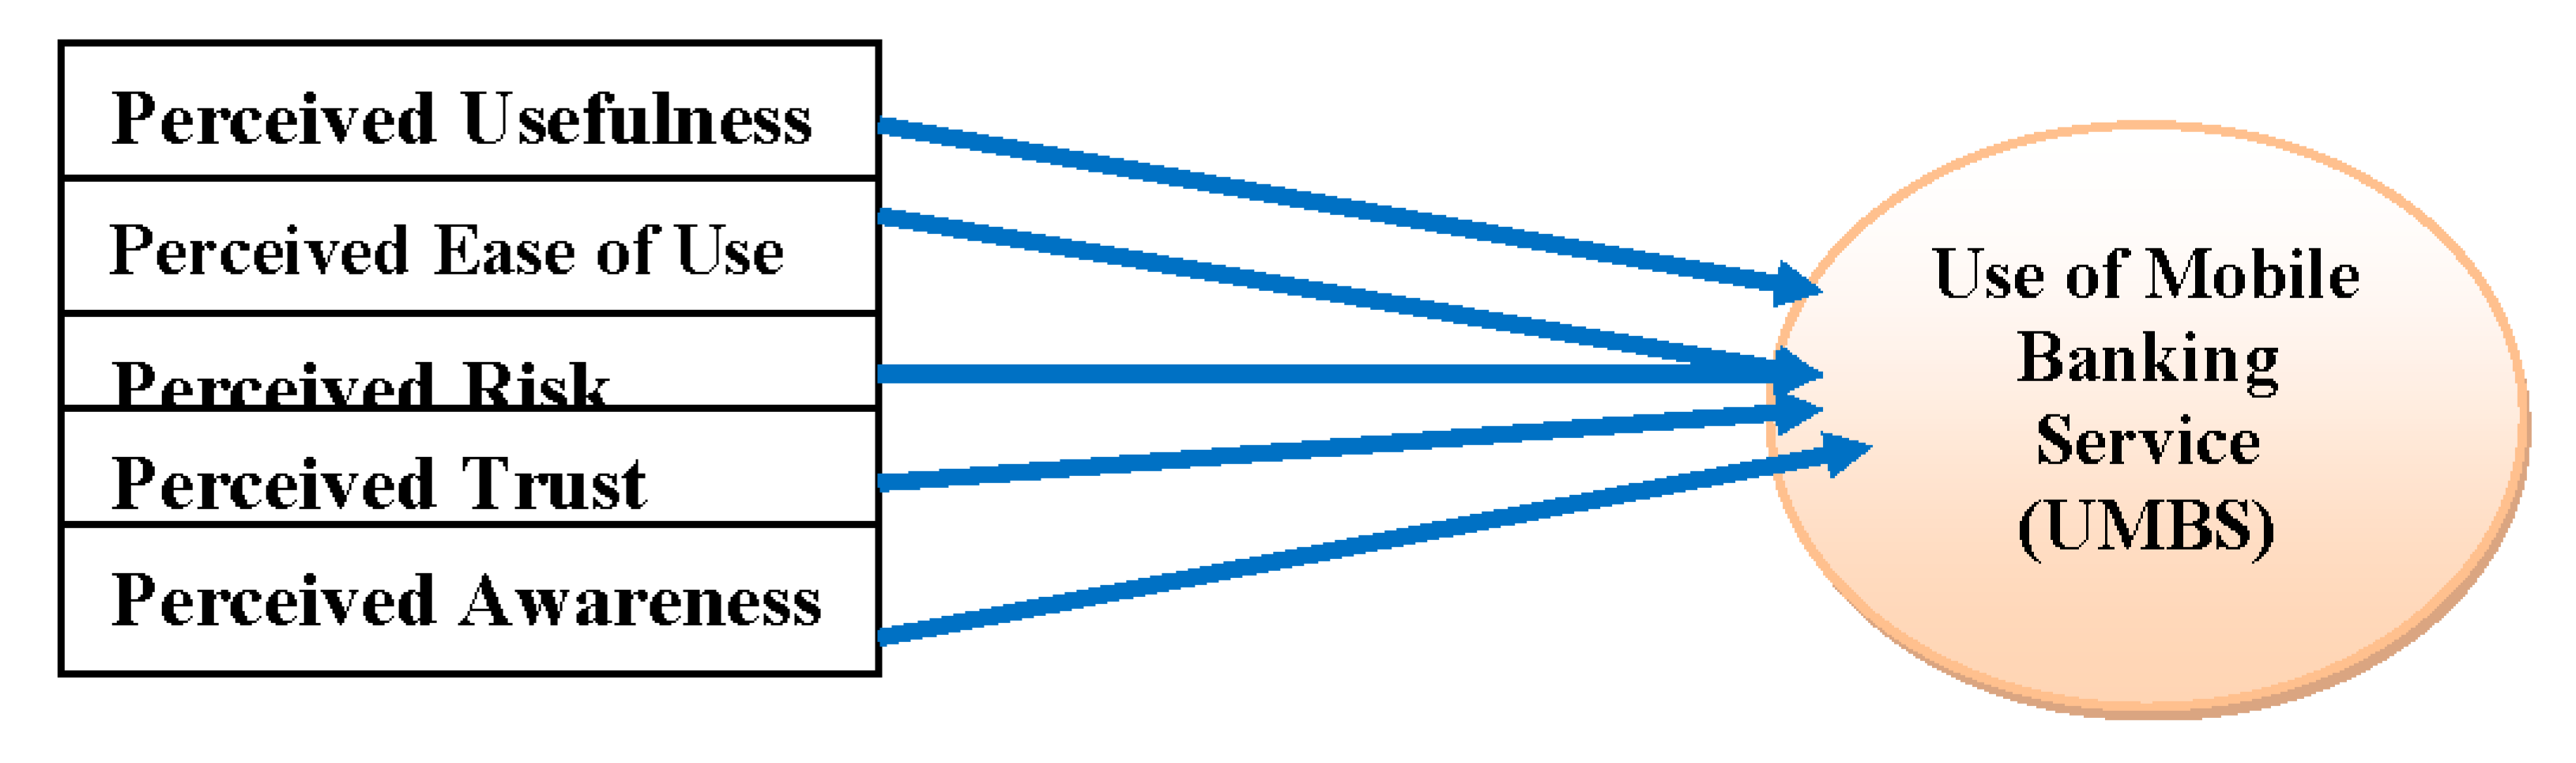
2.4. Conceptual Framework
Figure 1.
Conceptual Framework. Source: TAM Model Luarnand Lin (2005) and DIT model Rogers (2013).
3. Research Methodology
3.1. Description of the Study Area
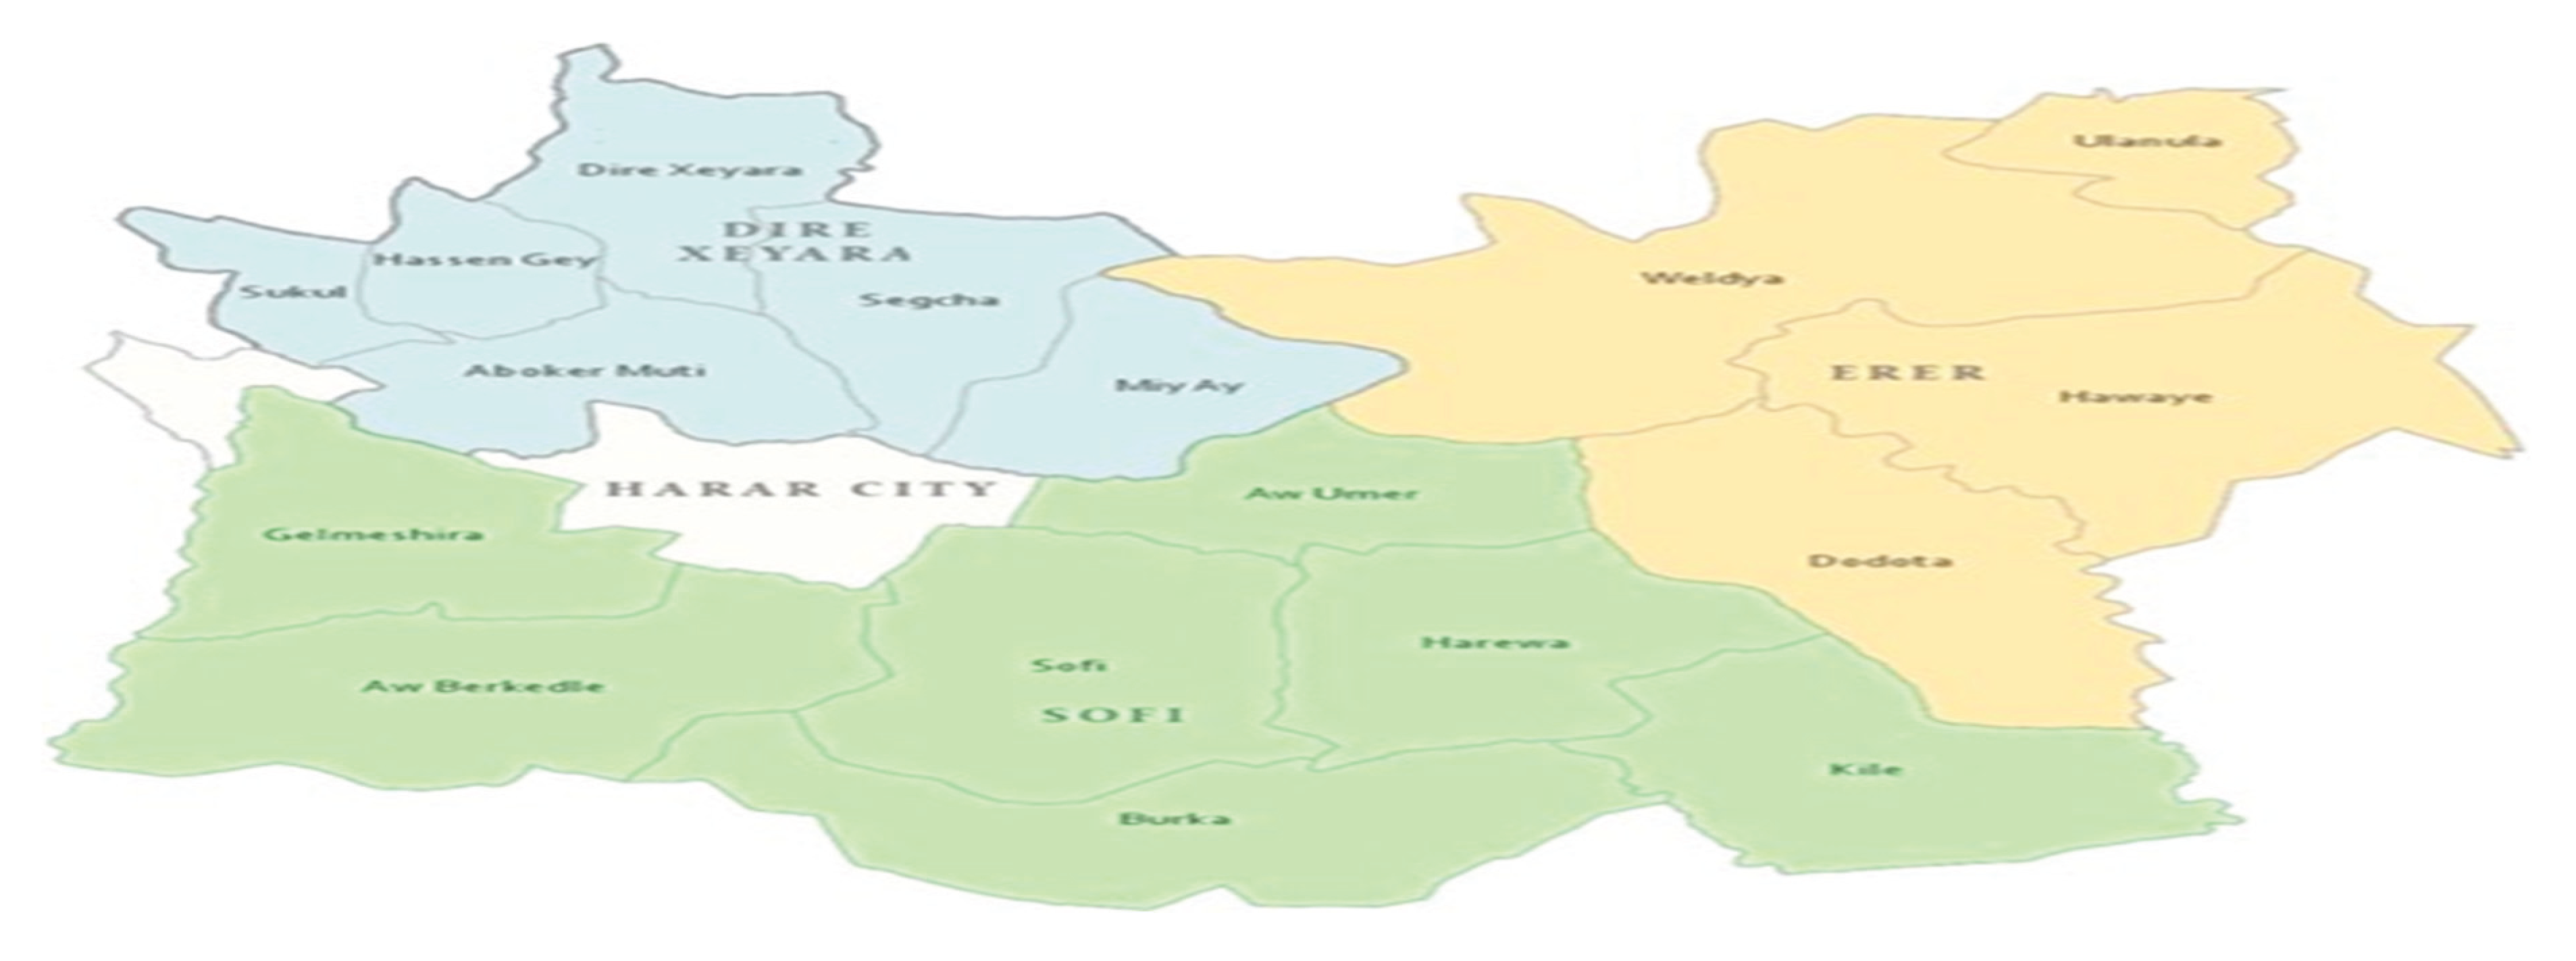
Harar city, the capital of the Harari Region in Ethiopia, has a population of 273,000, with 62.6% living in urban areas and 37.4% in rural areas. The region is divided into six urban and three rural districts, with minority ethnic groups including Oromo, Amhara, and Harari. followed Islam, Orthodox, Catholic, and Protestant religions (Harari Educational Bureau, 2018).
Figure 2.
Map of the Harari Regional State. Source: Harari Region President Office Face book Page.
3.2. Research Approaches and Design
Quantitative research, the measurement and classification requirements of the information that is gathered demand that study designs are more structured, fixed and predetermined in their use to ensure accuracy in measurement and classification (Kumar, 2018). To study the factors influencing the usage of mobile banking service technology in Harar city, a quantitative research approach is preferable to formulate hypotheses. Used both descriptive and explanatory research design.
3.3. Data Collection Methods
Primary source of data were used through questionnaires collected from customers of the Commercial Bank of Ethiopia Harar city branches. The closed-ended questions were developed on five-point Likert scales ranging from 5 (strongly agree) to 1 (strongly disagree).
3.4. Target Population
The target populations are customers of the Commercial Bank of Ethiopia in Harar City who use mobile banking services. Among the eight branches of CBE in Harar city, five branches (Harar branch, Jegol branch, Shenkor branch, Jenela branch, and Aboker branch) that implement mobile banking were selected as the branch target population. According to information obtained from the CBE Harar branch, 285,000 customers currently use mobile banking in these five branches in Harar city.
3.5. Sample Size and Sampling Method
The size of the sample depends upon the precision that the researcher desires in estimating the population parameter at a particular confidence level. According to Yamane (1967), a more straightforward formula is provided to determine sample sizes. The sample sizes were determined via the following formula. e = 0.05 or a 5% margin of error, together with a 95% confidence level, were assumed. The researcher used the following formula to determine the sample size.
where
- n = sample size
- N = population size
- e = sample error at 5%
28500/713.5=399.44 There for n =400 approximately

Table 1.
Sample size determination.
| No | Name of Branch | Active mobile banking user(N) | Sample size form each strata by using proportional method(n) |
|---|---|---|---|
| 1 | Harar branch | 75,000 | 105 |
| 2 | Jegol branch | 61,000 | 86 |
| 3 | Shenkor branch | 50,000 | 70 |
| 4 | Jenela branch | 44,000 | 62 |
| 5 | Aboker branch | 55,000 | 77 |
| Total | 285,000 | 400 | |
Source: CBE Harar Branch Digital Department, 2023.
The researcher used a purposive sampling method to obtain the opinions of the branches of the commercial bank of Ethiopia Harar city. The total sample size of the studies was 400, and the sample size or participants were determined via a statistical formula.
3.6. Model Specification
This research utilised multiple regression models to analyse the factors influencing mobile banking usage. The equation was built on one dependent variable and five independent variables, using Pearson correlation and linear multiple regression techniques.
Therefore, the form of the model is given by:
where Y is the dependent variable (usage of mobile banking).
Y = β+ β1X1 + β2 X2 + β3 X3 + β4 X4 + β5 X5+ εi
X1, X2, X3, X4, and X5 are the independent variables (perceived usefulness, perceived ease of use, perceived risk, perceived trust and awareness), and β1 is the intercept term, which gives the mean or average effect on Y of all the variables excluded from the equation, although its mechanical interpretation is the average value of Y when the stated independent variables are set equal to zero. β1, β2, β3, β4, and β5 refer to the coefficients of the respective independent variables, which measure the change in the mean value of Y per unit change in their respective independent variables.
Table 2.
Summary of Variables.
| Variable | Expected Sign (+/-) | Notation | Description |
| Dependent Variable | |||
| Y | UMBST | Usage of Mobile Banking Service Technology | |
| Independent Variable | |||
| X1 | +ve | PU | Perceived Usefulness |
| X2 | +ve | PEOU | Perceived Ease of Use |
| X3 | -ve | PR | Perceived Risk |
| X4 | -ve | PT | Perceived Trust |
| X5 | +ve | PA | Perceived Awareness |
3.7. Validity and Reliability
Validity is the accuracy of a measuring tool in detecting actual differences between individuals, and is crucial in determining the validity of a data gathering method, as research problem nature and researcher's opinions often influence evidence (Kothari, 2004).
According to Hair et al. (2003), reliability refers to the consistency of measurements used in tests. Cronbach's alpha is a method used to measure items and questionnaire mean. The most commonly accepted value is 0.70 or higher for internal reliability.
Table 3.
Reliability Statistics.
| Constructs | Cronbach's Alpha | N of Items |
|---|---|---|
| PU | .892 | 5 |
| PEOU | .740 | 5 |
| PR | .981 | 5 |
| PT | .825 | 5 |
| PA | .740 | 5 |
Source: Field survey data from May 2023 via SPSS 20.
8.8. Data Analysis Method
The method of analysis was descriptive statistics, which refers to a set of concepts and methods used in organizing, summarizing, tabulating, and describing collections of data. Studies that focus on describing a certain person or group's features are known as descriptive research studies. Additionally, inferential statistics, such as correlation analysis, can be used to determine the significance and direction of a correlation between two variables considered in this study and regression analysis to examine the relationship between the dependent variable (usage of mobile banking services) and the five independent variables, that is, perceived usefulness, perceived ease of use, perceived risk, perceived trust, and awareness, with Pearson correlation and linear multiple regression techniques.
3.9. Ethical Consideration
Due consideration was given to obtaining consent from each participant about their participation in the study. This study was conducted on a strictly voluntary basis. The researcher should respect the participant’s citation and privacy. The findings of the research did not deviate from the outcome of the research. In addition, the researcher fully acknowledges all the reference materials used in the study.
4. Results and Discussion
This part of the paper presents the results of a study involving 400 questionnaires sent to Commercial Bank of Ethiopia customers in Harar and collected 385 questionnaires, revealing a response rate of 96.25%.
4.1. Correlations Analysis
To determine the existence and level of association, the researcher used bivariate correlation. The Pearson correlation coefficient falls between -1.0 and +1.0 and indicates the strength and direction of the association between the two dependent and independent variables (Field, 2005).
Table 4.
Correlations between variables.
| Correlations | |||||||
| PU | PEOU | PR | PT | PA | UMBST | ||
| PU | Pearson Correlation | 1 | |||||
| Sig. (2-tailed) | |||||||
| PEOU | Pearson Correlation | .314** | 1 | ||||
| Sig. (2-tailed) | .000 | ||||||
| PR | Pearson Correlation | -.515** | -.605** | 1 | |||
| Sig. (2-tailed) | .000 | .000 | |||||
| PT | Pearson Correlation | .411** | .276** | -.466** | 1 | ||
| Sig. (2-tailed) | .000 | .000 | .000 | ||||
| PA | Pearson Correlation | .390** | .379** | -.519** | .351** | 1 | |
| Sig. (2-tailed) | .000 | .000 | .000 | .000 | |||
| UMBST | Pearson Correlation | .591** | .596** | -.858** | .389** | .536** | 1 |
| Sig. (2-tailed) | .000 | .000 | .000 | .000 | .000 | ||
| **. Correlation is significant at the 0.01 level (2-tailed). | |||||||
| b. Listwise N=385 | |||||||
Source: Field survey data from May 2023 via SPSS 20.
As shown in the correlation matrix, mobile banking usage is positively and significantly related to perceived usefulness (r = 0.591, p value = 0.000 <0.01). There is also a significantly positive relationship: perceived ease of use (r=0.596, p value = 0.000 <0.01) and perceived risk (r= -0.858, p value = 0.000 <0.01) have significant and negative relationships; perceived trust (r = 0.389, p value = 0.000 <0.01) has a weak positive relationship; and perceived awareness (r=0.536, p value = 0.000 <0.01) has a significantly positive relationship.
On the basis of the correlation results, three variables, i.e., perceived usefulness, perceived ease of use and perceived awareness, have a strong relationship and statistically significant correlation; this means that a change in three variables strongly correlates with changes in the dependent variable (usage of mobile banking). Perceived risk and perceived trust are less correlated than the other variables are.
4.1.1. Regression Analysis
All the assumptions of the multiple regressions were satisfied under this study. For multiple regressions, the researcher checked the collinearity problem with the assumption of tolerance and variance inflation factor (VIF) statistics.
Regression Model Summary
Table 5.
Regression model summary.
| Model Summary | |||||
| Model | R | R Square | Adjusted R Square | Std. Error of the Estimate | Durbin-Watson |
| 1 | .885a | .784 | .781 | .568 | 1.600 |
| a. Predictors: (Constant), PA, PT, PEOU, PU, PR | |||||
| b. Dependent Variable: UMBST | |||||
Source: Field survey data from May 2023 via SPSS 20.
As we can see in Table 5 above, the adjusted R square value is 0.781. This means that 78.1% of the variation observed in the usage of mobile banking can be explained by perceived usefulness, perceived ease of use, perceived risk, perceived trust and perceived awareness. In other words, 78.1% of the potential usage of mobile banking can be attributed to independent variables. Our model explains 78.1% of the variation observed in usage of mobile banking, and the remaining 21.9% is unexplained (i.e., likely due to other factors), which could be beyond the study's parameters.
Table 6.
ANOVA.
| ANOVAa | ||||||
|---|---|---|---|---|---|---|
| Model | Sum of Squares | Df | Mean Square | F | Sig. | |
| 1 | Regression | 443.229 | 5 | 88.646 | 274.533 | .000b |
| Residual | 122.378 | 379 | .323 | |||
| Total | 565.606 | 384 | ||||
| a. Dependent Variable: UMBST | ||||||
| b. Predictors: (Constant), PA, PT, PEOU, PU, PR | ||||||
Source: Field survey data from May 2023 via SPSS 20.
As indicated from Table 6, analysis of variance (ANOVA) shows whether the regression model is significantly better at explaining the usage of mobile banks (dependent variable) than is the use of the mean as the best predictor. The ANOVA results are highly significant (F = 274.533, sig = .000), indicating that perceived usefulness, perceived ease of use, perceived risk, perceived trust, and perceived awareness can significantly influence the usage of mobile banking. Therefore, the overall results of the regression analysis show that this model is well constructed and well represented, as reflected in the variables selected. The standardized coefficient B column gives us the coefficients of the independent variables in the regression equation, including all the predictor variables, as indicated below.
Table 7.
Regression Results.
| Coefficients | ||||||||
| Model | Unstandardized Coefficients | Standardized Coefficients | t | Sig. | Collinearity Statistics | |||
| B | Std. Error | Beta | Tolerance | |||||
| 1 | (Constant) | 4.908 | .369 | 13.305 | .000 | .684 | 1.463 | |
| PU | .207 | .029 | .204 | 7.050 | .000 | .628 | 1.592 | |
| PEOU | .170 | .046 | .111 | 3.667 | .000 | .442 | 2.263 | |
| PR | -.876 | .047 | -.672 | -18.701 | .000 | .734 | 1.363 | |
| PT | -.087 | .035 | -.070 | -2.515 | .012 | .694 | 1.440 | |
| PA | .144 | .046 | .090 | 3.130 | .002 | .684 | 1.463 | |
| a. Dependent Variable: UMBST | ||||||||
Source: Field survey data from 2023.
UMBST = 4.908 + .204PU + .111PEOU + (-.672PR) + (-.070PT) + .090PA +
Based on the results indicated in Table 7; the beta coefficients demonstrated that the five independent variables under study, with the exception of perceived risk, had a significantly positive influence on the usage of mobile banking (sig..001). The beta weight is the average amount that the dependent variable increases when the independent variable increases by one (all other independent variables are held constant). As these are standardized perceived trust, with a beta value of -.070, and risk, with a beta value of -.672, are the poorest predictors of usage of mobile banking when it is compared with the other explanatory variables under study. , we can compare them. Thus, the factors with the greatest influence on the use of mobile banking are perceived usefulness (.204), perceived ease of use (.111), and perceived awareness (.090). In contrast, perceived trust, with a beta value of -.070, and risk, with a beta value of -.672, are the poorest predictors of usage of mobile banking when it is compared with the other explanatory variables under study. Hence, perceived usefulness, perceived ease of use, perceived trust, and perceived awareness are the key factors influencing the usage of mobile banking in Harar city.
Table 8.
Summary of the hypothesis.
| Hypothesis | Effects | Decision | Significant level |
|---|---|---|---|
| H1: the perceived usefulness has a positive effect on usage of mobile banking service | Significant Positive Effect | Do not reject H1 | Βeta1=0.204 P-Value=0.000 Sig<0.01 |
| H2: the perceived ease of use has a positive effect on usage of mobile banking service. | Significant Positive Effect | Do not reject H1 | Βeta2=0.111 P-Value=0.000 Sig<0.01 |
| H3: the perceived risk has a negative effect on usage of mobile banking service. | Significant Negative Effect | Do not reject H1 | Βeta3=-0.672 P-Value=0.000 Sig<0.01 |
| H4: the perceived trust has a positive effect on usage of mobile banking service. | Significant Negative Effect | Reject H1 | Βeta4=-0.070 P-Value=0.012 Sig<0.01 |
| H5: the perceived awareness has a positive on usage of mobile banking service. | Significant Positive Effect | Do not reject H1 | Βeta5=0.266 P-Value= 0.002 Sig<0.01 |
Source: From the result of Field Survey data may, 2023.
Perceived Usefulness: Based on the results indicated in Table 7 the coefficient of perceived usefulness is 0.204 and its P-value is 0.000. Holding other explanatory variables constant perceived usefulness was found to have a positive and statistically significant influence on usage of mobile banking service as its value of significance is less than 0.01. Therefore, the researcher should reject the null hypothesis that indicates perceived usefulness has a positive effect on mobile banking. This result is found to be in line with Luarn & Lin's (2005) finding that perceived usefulness has a positive influence on mobile banking usage and Jeongang Yoon (2013), perceived usefulness has a significant effect on behavioural intention towards mobile banking. The possible reason for the significant positive relationship could be that most customers choose to use mobile banking services because they see the benefits they could obtain and also the convenience and anytime, anywhere accessibility.
Perceived ease of use: Based on the results indicated in Table 7 the coefficient of perceived ease of use is 0.111 and its P-value is 0.000. Holding other explanatory variables constant perceived ease of use has emerged in this study as also a positive and statistically significant influence on the usage of mobile banking services as its value of significance is less than 0.01. Therefore, the researchers reject the null hypothesis that indicates perceived ease of use has a positive effect on mobile banking. This finding is consistent with the results by Khalifa & Shen (2008) and Kimet et al. (2009) that stated in previous empirical studies that perceived ease of use has a positive influence on the usage of mobile banking.
Perceived risk: Based on the results indicated in Table 7 the coefficient of perceived risk is -0.672 and its P-value is 0.000. Holding other explanatory variables constant, perceived risk was found to have a negative and statistically insignificant influence on usage of mobile banking services, which is a significant value less than 0.01. Therefore, the researcher should reject the null hypothesis that stated perceived risk to have a negative but insignificant effect on usage of mobile banking. Significantly, this finding is found to be inconsistent with Laforet and Li (2005), Luarn and Lin (2005), Mallat (2007), and Gu et al. (2009), who all found perceived risk to be one of the critical factors to be focused on while designing and developing a mobile banking service.
Perceived trust: Based on the results indicated in Table 7 the coefficient of perceived trust is -0.070 and the P-value is 0.012. Holding other explanatory variables constant, perceived trust was found to have a negative and statistically significant influence on usage of mobile banking services, as its value of significance is greater than 0.01.Therefore, the researcher fails to reject the null hypothesisthat customer’s trust means there is no sufficient evidence to support the positive relationship between perceived trust and usage of mobile banking service. This result is inconsistent with findings of Lee (2009) that indicated higher levels of confidence in a service provider will increase a user's desire to do mobile banking transactions. It is probable that customers may be less willing to use mobile banking as a result of the negative impact of trus.
Perceived Awareness: Based on the results indicated in Table 7 the coefficient of perceived awareness is 0.266 with a p-value of 0.000. It can be seen that maintaining other explanatory variables and constant perceived awareness was found to have a positive and statistically significant influence on usage of mobile banking services, as its value of significance is less than 0.01.Therefore, the researchers reject the null hypothesisthat stated perceived awareness about mobile banking to have a positive effect on mobile banking usage. This implies that there is a significant relationship between awareness and usage of mobile banking service technology, which is similar to the prior research of Laforet & Li (2005) that indicated awareness to significantly influence customers’ usage of online and mobile banking. This outcome can be explained by the fact that most bank customers believe they have the necessary information to use mobile banking. This suggests that this variable is an essential factor influencing usage of mobile banking service technology in Commercial Bank of Ethiopia Harar City.
5. Conclusions
The study examines the factors influencing mobile banking service usage in Harar city. It found that perceived usefulness, ease of use, risk, trust, and awareness are key factors. The study found that customers perceive mobile banking as a practical and quick method for financial transactions. Ease of use is also positively influenced by banks' guidance. Perceived risk has a small effect on mobile banking usage, while perceived trust has a significant negative effect. Awareness is positively influenced by the familiarity of all mobile banking services, including transfers, account management, and deposits.
5.1. Future Research Directions
The following are areas that could be considered for future research:
The contributions of demographic factors such as age and gender to the use of mobile banking services are not given much attention in this study; future researchers can examine the influence of demographic factors that influence the use of mobile banking service technology.
References
- Aboelmaged, M., & Gebba, T. R. (2013). Mobile banking adoption: An examination of technology acceptance model and theory of planned behavior. International Journal of Business Research and Development, 2(1). [CrossRef]
- Algozzine, B., & Hancock, D. (2017). Doing case study research: A practical guide for beginning researchers. Teachers College Press.
- Amirkhanpour, M., Vrontis, D., & Thrassou, A. (2014). Mobile marketing: A contemporary strategic perspective. International Journal of Technology Marketing 5, 9(3), 252–269. [CrossRef]
- Ba, S., & Pavlou, P. A. (2002). Evidence of the effect of trust building technology in electronic markets: Price premiums and buyer behavior. MIS Quarterly, 243–268. [CrossRef]
- Bhatt, A., & Bhatt, S. (2016). Factors affecting customers adoption of mobile banking services. The Journal of internet Banking and Commerce, 21(1).
- Bhattacherjee, A. (2002). Individual trust in online firms: Scale development and initial test. Journal of Management Information Systems, 19(1), 211–241. [CrossRef]
- Bhatti, T. (2007). Exploring Factors Influencing the Adoption of Mobile Commerce. Journal of internet Banking and Commerce, 12(3).
- Bihari, S. C. (2014). MOBILE BANKING IN INDIA-YOUR MONEY IN YOUR POCKET. Journal on Management, 9(3). [CrossRef]
- Brown, I., Cajee, Z., Davies, D., & Stroebel, S. (2003). Cell phone banking: Predictors of adoption in South Africa—An exploratory study. International Journal of Information Management, 23(5), 381–394. [CrossRef]
- Bučevska, V., & Bučevska, J. (2011). A LOGIT MODEL OF ELECTRONIC BANKING ADOPTION: THE CASE OF KOMERCIJALNA BANKA AD SKOPJE. Interdisciplinary Management Research, 7.
- Bultum, A. (2012a). Adoption of Electronic Banking System in Ethiopian Banking Industry: Barriers and Driver.
- Bultum, A. (2012b). Adoption of Electronic Banking System in Ethiopian Banking Industry: Barriers and Driver.
- Chen, Y., & Barnes, S. (2007). Initial trust and online buyer behaviour. Industrial Management & Data Systems.
- Creswell, J. W. (2014). A concise introduction to mixed methods research. SAGE publications.
- Cruz, P., Neto, L. B. F., Muñoz-Gallego, P., & Laukkanen, T. (2010). Mobile banking rollout in emerging markets: Evidence from Brazil. International Journal of Bank Marketing. [CrossRef]
- Davis, F. D., Bagozzi, R. P., & Warshaw, P. R. (1989). User acceptance of computer technology: A comparison of two theoretical models. Management Science, 35(8), 982–1003. [CrossRef]
- Deshwal, P. (2015). A study of mobile banking in India. International Journal of Advanced Research in IT and Engineering, 4(12), 1–12.
- Donner, J., & Tellez, C. A. (2008). Mobile banking and economic development: Linking adoption, impact, and use. Asian Journal of Communication, 18(4), 318–332. [CrossRef]
- Egger, F. N., & Abrazhevich, D. (2001). Security and trust: Taking care of the human factor. Electronic Payment Systems Observatory Newsletter, 9, 17–19.
- Field, A. P. (2005). Is the meta-analysis of correlation coefficients accurate when population correlations vary? Psychological Methods, 10(4), 444. [CrossRef]
- Garbarino, E., & Johnson, M. S. (1999). The different roles of satisfaction, trust, and commitment in customer relationships. Journal of Marketing, 63(2), 70–87. [CrossRef]
- Garedachew, W. (2010). Electronic Banking in Ethiopia-Practice, Opportunities and Challenges. Addis Ababa, Ethiopia. Retrieved from http. 1492006.
- Garson, G. D. (2012). Testing statistical assumptions.
- Gefen, D., Karahanna, E., & Straub, D. W. (2003). Trust and TAM in online shopping: An integrated model. MIS Quarterly, 51–90. [CrossRef]
- Gefen, D., & Straub, D. W. (2004). Consumer trust in B2C e-Commerce and the importance of social presence: Experiments in e-Products and e-Services. Omega, 32(6), 407–424. [CrossRef]
- Geoffrey, M., & David, D. (2005). Essentials of research design and methodology.
- Gerrard, P. Gerrard, P., & Cunningham, J. B. (2003). The diffusion of internet banking among Singapore consumers. International Journal of Bank Marketing. [CrossRef]
- Gezahegn, K. (2016). Factors Influencing Usage of Mobile Banking in Addis Ababa, Ethiopia.
- Ghosh, I. (2013). The agent in a transformational m-banking ecosystem: Interface or intermediary? 33–36.
- Gomber, P., Kauffman, R. J., Parker, C., & Weber, B. W. (2018). On the fintech revolution: Interpreting the forces of innovation, disruption, and transformation in financial services. Journal of Management Information Systems, 35(1), 220–265. [CrossRef]
- Gu, J.-C., Lee, S.-C., & Suh, Y.-H. (2009). Determinants of behavioral intention to mobile banking. Expert Systems with Applications, 36(9), 11605–11616. [CrossRef]
- Harris, L., & Goode, M. (2004). The Four Levels of Loyalty and the Pivotal Role of Trust: A Study of Online Service Dynamics. Journal of Retailing, 80, 139–158. [CrossRef]
- Im, I., Kim, Y., & Han, H.-J. (2008). The effects of perceived risk and technology type on users’ acceptance of technologies. Information & Management, 45(1), 1–9. [CrossRef]
- Jeong, B. K., & Yoon, T. E. (2013). An empirical investigation on consumer acceptance of mobile banking services. Business and Management Research, 2(1), 31–40. [CrossRef]
- Kabir, M. R. (2013). Factors influencing the usage of mobile banking: Incident from a developing country. World Review of Business Research, 3(3), 96–114.
- Khalifa, M., & Shen, K. N. (2008). Explaining the adoption of transactional B2C mobile commerce. Journal of Enterprise Information Management. [CrossRef]
- Kim, G., Shin, B., & Lee, H. G. (2009a). Understanding dynamics between initial trust and usage intentions of mobile banking. Information Systems Journal, 19(3), 283–311. [CrossRef]
- Kim, G., Shin, B., & Lee, H. G. (2009b). Understanding dynamics between initial trust and usage intentions of mobile banking. Information Systems Journal, 19(3), 283–311. [CrossRef]
- Kothari, C. R. (2004). Research methodology: Methods and techniques. New Age International.
- Kumar, R. (2018). Research methodology: A step-by-step guide for beginners. Sage.
- Laforet, S., & Li, X. (2005a). Consumers’ attitudes towards online and mobile banking in China. International Journal of Bank Marketing, 23(5), 362–380. [CrossRef]
- Laforet, S., & Li, X. (2005b). Consumers’ attitudes towards online and mobile banking in China. International Journal of Bank Marketing, 23(5), 362–380. [CrossRef]
- LEE, K., LEE, H., & KIM, S. (2007). FACTORS INFLUENCING THE ADOPTION BEHAVIOR OF MOBILE BANKING: A SOUTH KOREAN PERSPECTIVE.
- Lee, M.-C. (2009a). Factors influencing the adoption of internet banking: An integration of TAM and TPB with perceived risk and perceived benefit. Electronic Commerce Research and Applications, 8(3), 130–141. [CrossRef]
- Lee, M.-C. (2009b). Factors influencing the adoption of internet banking: An integration of TAM and TPB with perceived risk and perceived benefit. Electronic Commerce Research and Applications, 8(3), 130–141. [CrossRef]
- Liao, Z., & Cheung, M. T. (2002). Internet-based e-banking and consumer attitudes: An empirical study. Information & Management, 39(4), Article 4. [CrossRef]
- Lin, H.-H., & Wang, Y.-S. (2006a). An examination of the determinants of customer loyalty in mobile commerce contexts. Information & Management, 43(3), 271–282. [CrossRef]
- Lin, H.-H., & Wang, Y.-S. (2006b). An examination of the determinants of customer loyalty in mobile commerce contexts. Information & Management, 43(3), 271–282. [CrossRef]
- Liu, B. (2010). Sentiment analysis and subjectivity. Handbook of Natural Language Processing, 2(2010), 627–666.
- Luarn, P., & Lin, H.-H. (2005a). Toward an understanding of the behavioral intention to use mobile banking. Computers in Human Behavior, 21, 873–891. [CrossRef]
- Luarn, P., & Lin, H.-H. (2005b). Toward an understanding of the behavioral intention to use mobile banking. Computers in Human Behavior, 21, 873–891. [CrossRef]
- Malhotra, R. (2012). Factors affecting the adoption of mobile banking in New Zealand: A thesis presented in partial fulfilment of the requirements for the degree of Masters in Information Technology in Information Systems at Massey University, Albany campus, New Zealand.
- Masinge, K. (2010). Factors influencing the adoption of mobile banking services at the Bottom of the Pyramid in South Africa.
- Mattila, M. (2003). Factors affecting the adoption of mobile banking services. Journal of internet Banking and Commerce, 8, 8–12.
- Maurer, B. (2008). Retail electronic payments systems for value transfers in the developing world. Department of Anthropology, University of California.
- Medberg, G., & Heinonen, K. (2014). Invisible value formation: A netnography in retail banking. International Journal of Bank Marketing. [CrossRef]
- Mishra, S. K., & Sahoo, D. P. (2013). Mobile banking adoption and benefits towards customers service. International Journal on Advanced Computer Theory and Engineering, 2(1), 78–83.
- Misra, S. K., & Wickamasinghe, N. (2004). Security of a mobile transaction: A trust model. Electronic Commerce Research, 4(4), 359–372. [CrossRef]
- Morawczynski, O., & Miscione, G. (2008). Examining trust in mobile banking transactions in Kenya: The case of m-PESA in Kenya. IFIP WG.
- Nasri, W. (2011). Factors influencing the adoption of internet banking in Tunisia. International Journal of Business and Management, 6(8), 143–160. [CrossRef]
- Nesibu, H. (2017). Mobile Banking adoption in Ethiopia: A Case of Commercial Bank of Ethiopia.
- Olasina, G. (2015). Factors influencing the use of m-banking by academics: Case study sms-based m-banking. The African Journal of Information Systems, 7(4), 4.
- Oni, A. A., Adewoye, O. J., & Eweoya, I. O. (2016). E-banking users’ behaviour: E-service quality, attitude, and customer satisfaction. International Journal of Bank Marketing. [CrossRef]
- Pallant, J. (2020). SPSS survival manual: A step by step guide to data analysis using IBM SPSS. McGraw-hill education (UK).
- Palvia, P. (2009). Palvia, P.: The role of trust in E-Commerce relational exchange: A unified model. Information and Management 46, 213-220. Information & Management, 46, 213–220. [CrossRef]
- Porteous, D. (2011). The enabling environment for mobile banking in Africa, Bankablefrontier.
- Ramdhony, D., & Munien, S. (2013). An investigation on mobile banking adoption and usage: A case study of Mauritius. World J. Soc. Sci., 3, 197–217.
- Ravichandran, D., & Madana, M. H. B. A. H. (2016). Factors influencing mobile banking adoption in Kurunegala district. Journal of Information Systems & Information Technology, 1(1), 24–32.
- Riquelme, H. E., & Rios, R. E. (2010a). The moderating effect of gender in the adoption of mobile banking. International Journal of Bank Marketing, 28(5), 328–341. [CrossRef]
- Riquelme, H. E., & Rios, R. E. (2010b). The moderating effect of gender in the adoption of mobile banking. International Journal of Bank Marketing, 28(5), 328–341. [CrossRef]
- Sathye, M. (1999). Adoption of internet banking by Australian consumers: An empirical investigation. International Journal of Bank Marketing. [CrossRef]
- Siau, K., Sheng, H., & Nah, F. (2003). Development of a framework for trust in mobile commerce.
- Singh, S. (2014). The impact and adoption of mobile banking in Delhi. International Research Journal of Business and Management, 1(7), Article 7.
- Sripalawat, J., Thongmak, M., & Ngramyarn, A. (2011). M-Banking in Metropolitan Bangkok and a Comparison with other Countries. Journal of Computer Information Systems, 51(3), 67–76. [CrossRef]
- Venkatesh, V. (2000). Determinants of perceived ease of use: Integrating control, intrinsic motivation, and emotion into the technology acceptance model. Information Systems Research, 11(4), 342–365. [CrossRef]
- Wang, S., & Barnes, S. (2007). Exploring the acceptance of mobile auctions in China. 27–27.
- Wu, J.-H., & Wang, S.-C. (2005). What drives mobile commerce?: An empirical evaluation of the revised technology acceptance model. Information & Management, 42(5), 719–729. [CrossRef]
- Yeh, Y. S., & Li, Y. (2009). Building trust in m-commerce: Contributions from quality and satisfaction. Online Information Review. [CrossRef]
Disclaimer/Publisher’s Note: The statements, opinions and data contained in all publications are solely those of the individual author(s) and contributor(s) and not of MDPI and/or the editor(s). MDPI and/or the editor(s) disclaim responsibility for any injury to people or property resulting from any ideas, methods, instructions or products referred to in the content. |
© 2025 by the authors. Licensee MDPI, Basel, Switzerland. This article is an open access article distributed under the terms and conditions of the Creative Commons Attribution (CC BY) license (http://creativecommons.org/licenses/by/4.0/).
Copyright: This open access article is published under a Creative Commons CC BY 4.0 license, which permit the free download, distribution, and reuse, provided that the author and preprint are cited in any reuse.


