
Submitted:
31 December 2025
Posted:
01 January 2026
You are already at the latest version
Abstract
Background/Objectives: SLC13A5 encodes a sodium–citrate cotransporter implicated in early‐onset epileptic encephalopathy and metabolic brain dysfunction, yet its devel-opmental regulation and molecular context in the human brain remain incompletely defined. Methods: Leveraging human developmental transcriptomes from the Evo-Devo resource, we delineated tissue trajectories and network context for SLC13A5 across the fetal–postnatal life. Results: In the cerebrum, SLC13A5 expression rises from late fetal stages to peak in the first postnatal year and then declines into adulthood, while cerebellar levels increase across the lifespan; liver shows a fetal decrease followed by sustained postnatal upregulation. A transcriptome-wide scan identified extensive positive and negative associations with SLC13A5, and a signed WGCNA built on biweight midcor-relation placed SLC13A5 in a large module. The module eigengene tracked brain mat-uration (Spearman ρ = 0.802, P = 8.62×10⁻⁶) and closely matched SLC13A5 abundance (ρ = 0.884, P = 2.73×10⁻⁶), with a significant partial association after adjusting for developmental rank (ρ = 0.672, P = 6.17×10⁻⁴). Functional enrichment converged on oxidative phos-phorylation and mitochondria. A force-directed subnetwork of the top intramodular members (|bicor| > 0.6) positioned SLC13A5 adjacent to a densely connected nucleus including CYP46A1, ITM2B, NRGN, GABRD, FBXO2, CHCHD10, CYSTM1, and MFSD4A. Conclusions: Together, these results define a developmentally tuned, mito-chondria-centered program that co-varies with SLC13A5 in the human brain across the lifespan. It may provide insights to interrogate age-dependent phenotypes and therapeutic avenues for disorders involving citrate metabolism.
Keywords:
SLC13A5
; Na(+)/citrate cotransporter
; developmental and epileptic encephalopathy
; cerebrum
1. Introduction
SLC13A5 epilepsy, also known as developmental epileptic encephalopathy 25 (OMIM # 615905), is an autosomal recessive disease characterized by neonatal seizures, febrile seizures, status epilepticus, developmental delay, a severe movement disorder, and lack of tooth enamel. Severe seizures start in the first days of life with better seizure control in late childhood and adolescence but lifelong increased seizure risk [1]. Patients have global developmental delay and impaired motor function [2]. Tooth hypoplasia due to amelogenesis imperfecta remains a distinctive feature [3].
To date, more than 50 loss-of-function mutations in human SLC13A5 have been found to cause SLC13A5 epilepsy [4,5]. Interestingly, there has been no genotype-phenotype correlation identified, though all tested mutations had a severe loss of citrate transporter function [6,7]. Slc13a5-knockout mice showed pro-epileptogenic neuronal excitability changes in the hippocampus and approximately 50% of the mice had spontaneous seizures [8].
There are no curative treatments for SLC13A5 epilepsy, and all patients are treated with standard antiseizure medications with mixed results. Previously reported antiseizure medications include benzodiazepines, phenobarbital, phenytoin, and carbamazepine with good seizure control in some patients. However, some patients needed to use up to 10 drugs in polytherapy [1,2]. Although current antiseizure medications may reduce seizure frequency, more targeted treatments are needed to address the epileptic and non-epileptic features of SLC13A5 epilepsy, such as communication and movement disorders [9].
Studies have demonstrated that SLC13A5 epilepsy symptoms change with age [1]. However, it is unknown whether physiological SLC13A5 expression changes over time. The present work is therefore an effort to use large transcriptomic data to investigate SLC13A5 expression in humans.
2. Materials and Methods
2.1. Data Sources
The Evo-Devo application, created by Cardoso-Moreira et al. (2019), is a vast database including expression results for genes in different species, organs, and development stages. Human RNA-seq expression (RPKM) across developmental stages was obtained from the Evo-Devo resource [10]. SLC13A5 and genome-wide expression for brain and peripheral tissues reported by Evo-Devo were analyzed. Analyses focused on Homo sapiens only. Descriptive trajectories were assembled for brain, cerebellum, kidney, liver, testis, and ovary.
2.2. Preprocessing and Sample Ordering
Expression tables were reshaped into sample-by-gene matrices keyed by Ensembl gene identifiers. To stabilize variance, values were transformed as log2(RPKM + 1). Genes with zero variance or entirely missing values were removed, and Ensembl version suffixes were stripped to harmonize identifiers. Brain samples were arranged according to a biologically consistent developmental sequence spanning from 4–20 weeks post-conception through newborn, infant (6 to 9 months old), toddler (2 to 4 years old), school age (7 to 9 years old), teenager (13 to 19 years old), young adult (25 to 32 years old), young mid-age (39 to 41 years old), older mid-age (46 to 54 years old), and senior (58 to 63 years old). Since the Evo–Devo developmental labels are ordinal rather than metrically spaced, an ordinal trait (age rank) was constructed by assigning ranks from 1 to N along this sequence. Data quality was assessed using the WGCNA goodSamplesGenes criterion with a minimum non-missing fraction of 0.30 [11]; only samples and genes passing quality control were retained.
2.3. Transcriptome-Wide Association with SLC13A5
Within the brain data set, transcriptome-wide association was performed across samples, correlating SLC13A5 (Stable ID: ENSG00000141485) with each expressed gene by using Spearman rank correlation and pairwise handling of missingness. Two-sided P-values were adjusted for multiple testing using Benjamini–Hochberg false discovery rate (FDR). The full correlation landscape was summarized with a volcano-type display and a compact temporal heatmap of the top positively and negatively associated genes to visualize developmental coherence.
2.4. Weighted Gene Co-Expression Network Analysis (WGCNA)
A signed co-expression network was constructed from the brain matrix using biweight midcorrelation (bicor). The soft-thresholding power was chosen from the range 1–20 as the first value achieving a scale-free topology fit R2 ≥ 0.80; when no value reached this criterion, a conservative default of 6 was used [12]. Modules were identified with blockwise hierarchical clustering using signed topology overlap, a minimum module size of 30 genes, a merge cut height of 0.25, zero reassignment threshold, and partitioning around medoids respecting the dendrogram [13]. For each module, the first principal component (module eigengene) was computed to summarize expression.
2.5. Module–Trait and Gene–Module Relationships
Associations between the SLC13A5 module eigengene (SME) and developmental progression were tested using Spearman correlation with the ordinal age group rank. The relationship between SME and SLC13A5 expression was assessed analogously. A partial Spearman association between SME and SLC13A5 controlling for age rank was obtained by correlating rank-based residuals from linear models. Intramodular connectivity (kME) was quantified as the signed correlation between each gene and its own module eigengene, providing a continuous measure of hubness.
2.6. Functional Enrichment
Functional enrichment for the SLC13A5 module was performed while keeping gene-identifier universes consistent with each analysis. Gene Ontology Biological Process testing used Ensembl IDs for both input and background (all genes passing network quality control), with FDR control by Benjamini–Hochberg [14]. KEGG analysis required mapping Ensembl to Entrez Gene identifiers; both the module and the background were mapped symmetrically with deduplication at the Entrez level prior to testing, and FDR was controlled analogously. Transcription-factor target enrichment used MSigDB C3 TFT signatures retrieved via msigdbr [15], tested as over-representation on HUGO Gene Nomenclature Committee (HGNC) symbols with a matching symbol-level background. Enrichment results were summarized by −log10(FDR) and gene-ratio for the most significant terms.
2.7. Co-Expression Subnetwork Visualization
To illustrate intramodular organization, the 30 genes with the highest absolute kME within the SLC13A5 module were selected, with SLC13A5 forcibly included (if not originally among the top 30). Pairwise bicor values were computed within this set, and an undirected edge was drawn when the absolute correlation exceeded 0.60 [16]. The graph was laid out with a Fruchterman–Reingold force-directed algorithm using a fixed random seed for reproducibility. Node size and color encode |kME|, labels are shown for SLC13A5 and the highest-connectivity genes, and edges incident to SLC13A5 are highlighted to delineate its immediate neighborhood.
2.8. Statistical Considerations
Since expression distributions deviated substantially from normality, nonparametric measures, such as Spearman’s rho (ρ), were used throughout for association. All tests were two-sided, and multiplicity was controlled by Benjamini–Hochberg FDR unless otherwise stated. Random seeds were fixed where stochastic procedures were involved to ensure reproducibility of visual layouts and summaries. All analyses were performed using the R language (version 4.5.1) with the IDE RStudio (version 2025.9.1.401). A reproducible script is provided as supplementary material.
3. Results
To determine SLC13A5 expression across tissues and how expression changes throughout development, we analyzed SLC13A5 expression using the human data from Cardoso-Moreira et al. (2019). Figure 1 shows the longitudinal view of SLC13A5 expression in different human tissues, namely cerebrum (Figure 1A), cerebellum (Figure 1B), liver (Figure 1C), kidney (Figure 1D), testis (Figure 1E), and ovaries (Figure 1F). Mean values for pre- and post-conception SLC13A5 expression (RPKM) by tissue are shown in Table 1.
In the cerebrum, SLC13A5 expression increases from ~0.5 RPKM at 19 weeks post-conception (WPC) to ~4 RPKM in the first year of life. This is followed by a decrease in cerebrum SLC13A5 expression until adult life, when levels are kept above 1 RPKM for the following decades. In early stages of development, cerebellar SLC13A5 expression is less than 1 RPKM (0.3 ± 0.3 RPKM) but increases slowly and continuously throughout life (0.7 ± 0.3 RPKM). Liver is the tissue with the highest SLC13A5 expression. Following an initial drop during the fetal period until birth (from ~50 RPKM to ~20 RPKM), SLC13A5 expression increases and is kept high (~60 RPKM) until the end of adulthood. Other peripheral tissues (including kidney, ovaries, and testis) are also low throughout life.
We then assessed the genes whose expression co-varies with SLC13A5 across development in the human cerebrum transcriptome. A transcriptome-wide correlation scan across Evo-Devo cerebrum samples revealed extensive bidirectional associations with SLC13A5 expression (Figure 2A). It includes both positively and negatively correlated genes after multiple-testing correction. To examine whether these relationships are developmentally organized, we evaluated z-scored expression for the top SLC13A5-correlated genes across fetal-to-postnatal stages. The heat map shows temporal coherence, with many transcripts mirroring the fetal-to-postnatal shift observed for SLC13A5 (Figure 2B). Over-representation analyses of this set of genes flagged processes/pathways linked to mitochondrial energy metabolism (notably oxidative phosphorylation), RNA processing and surveillance (including spliceosome-related terms), and cell-cycle/chromatin regulation (Figure 2C–D).
Network construction of the human cerebrum yielded a scale-free–like topology at low double-digit soft thresholds, with the signed bicor fit approaching the conventional R2 = 0.8 plateau and remaining stable thereafter (Figure 3A). Using this parameter, WGCNA identified a heterogeneous module landscape with a few very large groups and many smaller ones (Figure 3B); the “grey” set aggregated unassigned genes, while the turquoise and blue modules comprised the largest structured clusters. The hierarchical dendrogram revealed block structure (Figure 3C). The aligned annotation tracks (Figure 3D) showed that SLC13A5 is found in the turquoise module, where genes with the strongest gene significance to SLC13A5 (red in GS track) spatially co-localize with high intramodular connectivity (deep red in |kME| track).
The SLC13A5 module’s eigengene tracked cerebrum maturation and the gene’s own expression (Figure 4). Across fetal-to-postnatal stages, the eigengene rose in accordance with developmental rank (Spearman ρ = 0.802, P = 8.62 × 10⁻⁶; Figure 4A), indicating that the turquoise module is progressively activated during human cerebrum development. The eigengene was also tightly correlated with SLC13A5 expression itself (ρ = 0.884, P = 2.73 × 10⁻⁶; Figure 4B), consistent with SLC13A5 being embedded within, and representative of, the module. Importantly, this association persisted after regressing out age effects: a partial correlation between the eigengene and SLC13A5 (controlling for developmental rank) remained significant (ρ = 0.672, P = 6.17 × 10⁻⁴; Figure 4C).
To visualize the local wiring of the SLC13A5 module, a force-directed subnetwork composed of the top 30 module members was plotted (ranked by |kME|); edges represent robust pairwise co-expression (|bicor| > 0.6) (Figure 5). The layout reveals a compact nucleus of highly interconnected genes with high module cohesion, flanked by a few peripheral nodes with weaker within-module connectivity. SLC13A5 sits adjacent to the core and forms numerous strong links to neuronal and mitochondrial/transport genes (including CYP46A1, ITM2B, NRGN, GABRD, FBXO2, CHCHD10, CYSTM1, MFSD4A, CORO6, and LYNX1), consistent with the functional enrichments for oxidative metabolism, RNA/protein homeostasis and synaptic programs. In contrast, nodes such as ABCC3, CRACDL, and TUBA4A occupy a more peripheral position with fewer edges, indicating lower intramodular connectivity.
Gene set enrichment of the SLC13A5-containing module revealed a coherent, mitochondria-centered program (Figure 6). In GO Biological Process (panel A), top terms were related to mitochondrial metabolism, including ‘aerobic electron transport chain’, ‘respiratory electron transport chain’, ‘ATP synthesis coupled electron transport’, and ‘mitochondrial ATP synthesis coupled electron transport’. Other terms also revealed involvement with inflammation and purine metabolism. KEGG analysis (panel B) showed a significant enrichment for ‘oxidative phosphorylation’ and pathways involved in neurodegenerative and inflammatory diseases. Transcription-factor–target enrichment (MSigDB C3 TFT; panel C) highlighted regulators consistent with these themes, including NFE2/NRF-like motifs, TFAM-associated genes and AP-1 family targets (multiple AP1 motif sets), as well as ELF1/BACH2 target sets.
4. Discussion
SLC13A5 plays a key role in citrate metabolism, impacting on hepatic lipogenesis, cell proliferation, bone development, and epilepsy in mammals [17]. Loss-of-function mutations in the SLC13A5 gene have been associated with SLC13A5 epilepsy [18]. On the other hand, overexpression of Slc13a5 in neurons from mouse forebrain has been linked to disrupted white matter integrity and autistic-like behaviors [19]. Slc13a5 overexpression also causes progeria-like phenotype, systemic inflammation, and alterations in protein acetylation [20]. Thus, SLC13A5 may present different roles/importance across lifespan.
The physiological pattern of SLC13A5 expression across life in human tissues has not been described yet. We then used a dataset of human tissues from Moreira and colleagues (2019) to start addressing this issue. Liver was the tissue with higher SLC13A5 mRNA expression at all timepoints investigated. Previous reports showed SLC13A5 expression much higher in liver than in brain (for both humans and rats) [21,22]. In cerebrum, SLC13A5 mRNA expression increased from conception until infancy, when it reaches its peak. An increase in Slc13a5 mRNA expression during early postnatal life was also shown in rat cerebral cortex [23]. Cerebellar expression of SLC13A5 steadily increased throughout life. Slc13a5-knockout mice show distinct metabolic pathways disrupted depending on the tissue investigated [24]. Thus, the distinct patterns of SLC13A5 mRNA expression reported here may cooperate to the different roles played by SLC13A5 in the metabolism of these tissues.
We then assessed expression data of all cerebrum genes in the Evo-Devo database and ran multiple Spearman correlation analyses against the longitudinal expression of SLC13A5. We found sets of genes with strong correlation (positive or negative) and time coherence appropriateness with SLC13A5 expression. Analysis of gene ontology and KEGG pathways indicate that SLC13A5 sits in a developmentally coherent gene neighborhood enriched for mitochondrial bioenergetics and gene-regulatory pathways in the human cerebrum. Genes related to transcription, translation, and synthesis of proteins are critical during neurodevelopment, and dysfunction of these genes may cause reduced brain volume, developmental delay, cognitive deficits, alterations in neural cristae, and neuronal alteration [25,26,27,28]. Additionally, the tuning of bioenergetic metabolism is crucial during neurodevelopment. Shifts in bioenergetics control cell fate, as well as neural progenitor proliferation and differentiation [29].
In order to evaluate the network hierarchy, we performed a weighted gene co-expression network analysis and evaluated the intramodular connectivity. The results of WGCNA validated the chosen network parameters, delineated the global co-expression architecture of the developing brain, and defined a densely connected SLC13A5-centered module for downstream analyses. The analyses of association between SLC13A5, the eigengene, and developmental rank indicated that the module captures a coordinated expression program that matches developmental progression and specifically co-varies with SLC13A5 (regardless of the global age trajectory).
The analysis of |kME| within the SLC13A5 module suggested that SLC13A5 is embedded in a densely connected module. It is directly connected to genes involved in neuronal homeostasis (synaptic signaling and structural proteins), mitochondrial organization, and lipid/cholesterol turnover. It is feasible that SLC13A5 plays a role in the cooperation between brain and liver for citrate homeostasis, maintaining lipid balance throughout the body (including basic and complex lipids) [24]. We also observed the presence of genes important for calcium handling (e.g., NRGN and TESC) [30,31,32] for cell signaling, metabolism, and fate (e.g., CYP46A1, LDHD, CA4, CA11, RGS4, CHCHD10, AIFM3 and TAMALIN) [33,34,35,36,37,38,39] as well as cell structure and extracellular matrix (e.g., COL5A3, ICAM5, TUBA4A and CORO6) [40,41,42,43]. Interestingly, GABRD was found directly connected to SLC13A5 in the module. GABRD is a gene that encodes GABAA subunit, an important receptor during neurodevelopment and for epilepsy [44]. SLC13A5 was also directly connected to LYNX1, a gene encoding a protein that modulates nAChR. Alterations in nAChR are associated with some epilepsies [45]. LYNX1 dysregulation was reported in Fragile X Syndrome, a condition characterized by epilepsy [46], and in neurodevelopmental disorders [47]. Additionally, knockout of Lynx1 in animal models enhances synaptic efficacy and performance in memory tests. However, it induces neurodegeneration by the hyperactivation of nAChR [48].
The functional programs enriched in the SLC13A5 module were then analyzed. GO Biological Process enrichment analysis indicated that the SLC13A5 module is embedded in a developmental program with genes involved in mitochondrial energy metabolism, reflecting a transcriptional coordination between mitochondrial homeostasis and SLC13A5. KEGG analysis showed an enrichment in pathways associated with neurodegenerative disease (Parkinson’s, Alzheimer’s, Huntington’s disease) and metabolic and inflammatory diseases (type I diabetes, non-alcoholic fatty liver disease, rheumatoid arthritis). Interestingly, SLC13A5 inhibition has also been suggested as a potential therapeutic target for kidney disease [49], hyperlipidemia [50], non-alcoholic fatty liver disease, insulin resistance, and a myriad of metabolic diseases [51,52,53,54]. The underlying mechanisms may involve decreasing citrate uptake from blood and reducing intracellular levels of citrate in the liver [55]. The enriched transcription-factor targets include factors such as NFE2, TFAM, and members of the AP-1 family (API, AP1F), implicated in the regulation of mitochondrial biogenesis, stress response, and cell differentiation [40,56,57,58]. The presence of TFAM, a key regulator of mitochondrial transcription, is particularly relevant. Altogether, the data suggest that this module may represent a regulatory axis relevant to physiological and pathophysiological conditions involving mitochondria.
5. Conclusions
SLC13A5 is highly expressed in the brain in the first years of life, suggesting an important role in this period of life and coinciding with the onset of seizures in SLC13A5 patients. Potential targets of metabolic interplay with SLC13A5 include mitochondria, neurotransmission-related genes, and lipid metabolism. These findings deepen our understanding of the SLC13A5 expression patterns and highlight its potential significance in cellular metabolism and disease pathogenesis. Continued investigation into the molecular mechanisms underlying SLC13A5 regulation and its functional implications in health and disease will be essential for unraveling its full biological significance and therapeutic potential. For instance, a better understanding of the mechanisms behind age- and tissue-specific SLC13A5 transcription would help identify targeted therapeutics for SLC13A5 epilepsy and other metabolic disorders with altered citrate homeostasis. Future studies should also investigate neurotransmitter changes after loss of SLC13A5 to elucidate the functional role of SLC13A5 in neurotransmission.
Supplementary Materials
The following supporting information can be downloaded at the website of this paper posted on Preprint.org.
Author Contributions
Conceptualization, BKF, PFS, GCF and HRF; methodology, HRF; software, HRF; formal analysis, BKF, PFS, GCF and HRF; data curation, HRF; writing—original draft preparation, BKF and HRF; writing—review and editing, BKF, PFS, GCF and HRF; supervision, PFS, GCF and HRF; project administration, PFS and GCF; funding acquisition, BKF, PFS, GCF and HRF. All authors have read and agreed to the published version of the manuscript.
Data Availability Statement
The raw data supporting the conclusions of this article will be made available by the authors upon reasonable request.
Acknowledgments
This work was supported by the Carlos Chagas Filho Research Support Foundation of the State of Rio de Janeiro (FAPERJ, Brazil) and the National Council for Scientific and Technological Development (CNPq, Brazil). HRF was supported by the 2024/2025 Coimbra Group Scholarship Programme for Young Professors and Researchers from Latin American Universities, as well as the Tess Research Foundation (TRF, USA) Early-Career Investigator Research Grant, 2022/2023.
Conflicts of Interest
The authors declare that the research was conducted in the absence of any commercial or financial relationships that could be construed as a potential conflict of interest.
References
- Matricardi, S.; De Liso, P.; Freri, E.; Costa, P.; Castellotti, B.; Magri, S.; Gellera, C.; Granata, T.; Musante, L.; Lesca, G.; et al. Neonatal Developmental and Epileptic Encephalopathy Due to Autosomal Recessive Variants in SLC13A5 Gene. Epilepsia 2020, 61, 2474–2485. [Google Scholar] [CrossRef]
- Spelbrink, E.M.; Brown, T.L.; Brimble, E.; Blanco, K.A.; Nye, K.L.; Porter, B.E. Characterizing a Rare Neurogenetic Disease, SLC13A5 Citrate Transporter Disorder, Utilizing Clinical Data in a Cloud-Based Medical Record Collection System. Front. Genet. 2023, 14. [Google Scholar] [CrossRef] [PubMed]
- Hardies, K.; de Kovel, C.G.F.; Weckhuysen, S.; Asselbergh, B.; Geuens, T.; Deconinck, T.; Azmi, A.; May, P.; Brilstra, E.; Becker, F.; et al. Recessive Mutations in SLC13A5 Result in a Loss of Citrate Transport and Cause Neonatal Epilepsy, Developmental Delay and Teeth Hypoplasia. Brain 2015, 138, 3238–3250. [Google Scholar] [CrossRef]
- Brown, T.L.; Bainbridge, M.N.; Zahn, G.; Nye, K.L.; Porter, B.E. The Growing Research Toolbox for SLC13A5 Citrate Transporter Disorder: A Rare Disease with Animal Models, Cell Lines, an Ongoing Natural History Study and an Engaged Patient Advocacy Organization. Ther Adv Rare Dis 2024, 5, 26330040241263972. [Google Scholar] [CrossRef]
- Goodspeed, K.; Liu, J.S.; Nye, K.L.; Prasad, S.; Sadhu, C.; Tavakkoli, F.; Bilder, D.A.; Minassian, B.A.; Bailey, R.M. SLC13A5 Deficiency Disorder: From Genetics to Gene Therapy. Genes 2022, 13, 1655. [Google Scholar] [CrossRef]
- Klotz, J.; Porter, B.E.; Colas, C.; Schlessinger, A.; Pajor, A.M. Mutations in the Na+/Citrate Cotransporter NaCT (SLC13A5) in Pediatric Patients with Epilepsy and Developmental Delay. Mol Med 2016, 22, 310–321. [Google Scholar] [CrossRef] [PubMed]
- Wang, W.-A.; Ferrada, E.; Klimek, C.; Osthushenrich, T.; MacNamara, A.; Wiedmer, T.; Superti-Furga, G. Large-Scale Experimental Assessment of Variant Effects on the Structure and Function of the Citrate Transporter SLC13A5. Sci Adv 2025, 11, eadx3011. [Google Scholar] [CrossRef] [PubMed]
- Henke, C.; Töllner, K.; van Dijk, R.M.; Miljanovic, N.; Cordes, T.; Twele, F.; Bröer, S.; Ziesak, V.; Rohde, M.; Hauck, S.M.; et al. Disruption of the Sodium-Dependent Citrate Transporter SLC13A5 in Mice Causes Alterations in Brain Citrate Levels and Neuronal Network Excitability in the Hippocampus. Neurobiol Dis 2020, 143, 105018. [Google Scholar] [CrossRef]
- Ozlu, C.; Adams, R.M.; Solidum, R.M.; Cooper, S.; Best, C.R.; Elacio, J.; Kavanaugh, B.C.; Spelbrink, E.M.; Brown, T.L.; Nye, K.; et al. Developmental Phenotype and Quality of Life in SLC13A5 Citrate Transporter Disorder. Developmental Medicine & Child Neurology 2025, 67, 930–940. [Google Scholar] [CrossRef]
- Cardoso-Moreira, M.; Halbert, J.; Valloton, D.; Velten, B.; Chen, C.; Shao, Y.; Liechti, A.; Ascenção, K.; Rummel, C.; Ovchinnikova, S.; et al. Gene Expression across Mammalian Organ Development. Nature 2019, 571, 505–509. [Google Scholar] [CrossRef]
- Langfelder, P.; Horvath, S. WGCNA: An R Package for Weighted Correlation Network Analysis. BMC Bioinformatics 2008, 9, 559. [Google Scholar] [CrossRef] [PubMed]
- Bakhtiarizadeh, M.R.; Hosseinpour, B.; Shahhoseini, M.; Korte, A.; Gifani, P. Weighted Gene Co-Expression Network Analysis of Endometriosis and Identification of Functional Modules Associated With Its Main Hallmarks. Front Genet 2018, 9, 453. [Google Scholar] [CrossRef] [PubMed]
- Li, J.; Zhou, D.; Qiu, W.; Shi, Y.; Yang, J.-J.; Chen, S.; Wang, Q.; Pan, H. Application of Weighted Gene Co-Expression Network Analysis for Data from Paired Design. Sci Rep 2018, 8, 622. [Google Scholar] [CrossRef]
- Benjamini, Y.; Hochberg, Y. Controlling the False Discovery Rate: A Practical and Powerful Approach to Multiple Testing. Journal of the Royal Statistical Society. Series B (Methodological) 1995, 57, 289–300. [Google Scholar] [CrossRef]
- Dolgalev, I. Msigdbr: MSigDB Gene Sets for Multiple Organisms in a Tidy Data Format 2025.
- Langfelder, P.; Horvath, S. Fast R Functions for Robust Correlations and Hierarchical Clustering. Journal of Statistical Software 2012, 46, 1–17. [Google Scholar] [CrossRef]
- Hu, T.; Huang, W.; Li, Z.; Kane, M.A.; Zhang, L.; Huang, S.-M.; Wang, H. Comparative Proteomic Analysis of SLC13A5 Knockdown Reveals Elevated Ketogenesis and Enhanced Cellular Toxic Response to Chemotherapeutic Agents in HepG2 Cells. Toxicol Appl Pharmacol 2020, 402, 115117. [Google Scholar] [CrossRef]
- Kopel, J.J.; Bhutia, Y.D.; Sivaprakasam, S.; Ganapathy, V. Consequences of NaCT/SLC13A5/mINDY Deficiency: Good versus Evil, Separated Only by the Blood–Brain Barrier. Biochemical Journal 2021, 478, 463–486. [Google Scholar] [CrossRef]
- Rigby, M.J.; Orefice, N.S.; Lawton, A.J.; Ma, M.; Shapiro, S.L.; Yi, S.Y.; Dieterich, I.A.; Frelka, A.; Miles, H.N.; Pearce, R.A.; et al. SLC13A5/Sodium-Citrate Co-Transporter Overexpression Causes Disrupted White Matter Integrity and an Autistic-like Phenotype. Brain Commun 2022, 4, fcac002. [Google Scholar] [CrossRef]
- Fernandez-Fuente, G.; Overmyer, K.A.; Lawton, A.J.; Kasza, I.; Shapiro, S.L.; Gallego-Muñoz, P.; Coon, J.J.; Denu, J.M.; Alexander, C.M.; Puglielli, L. The Citrate Transporters SLC13A5 and SLC25A1 Elicit Different Metabolic Responses and Phenotypes in the Mouse. Commun Biol 2023, 6, 926. [Google Scholar] [CrossRef] [PubMed]
- Inoue, K.; Zhuang, L.; Ganapathy, V. Human Na+ -Coupled Citrate Transporter: Primary Structure, Genomic Organization, and Transport Function. Biochem Biophys Res Commun 2002, 299, 465–471. [Google Scholar] [CrossRef] [PubMed]
- Inoue, K.; Zhuang, L.; Maddox, D.M.; Smith, S.B.; Ganapathy, V. Structure, Function, and Expression Pattern of a Novel Sodium-Coupled Citrate Transporter (NaCT) Cloned from Mammalian Brain. J Biol Chem 2002, 277, 39469–39476. [Google Scholar] [CrossRef] [PubMed]
- Yodoya, E.; Wada, M.; Shimada, A.; Katsukawa, H.; Okada, N.; Yamamoto, A.; Ganapathy, V.; Fujita, T. Functional and Molecular Identification of Sodium-Coupled Dicarboxylate Transporters in Rat Primary Cultured Cerebrocortical Astrocytes and Neurons. Journal of Neurochemistry 2006, 97, 162–173. [Google Scholar] [CrossRef]
- Milosavljevic, S.; Glinton, K.E.; Li, X.; Medeiros, C.; Gillespie, P.; Seavitt, J.R.; Graham, B.H.; Elsea, S.H. Untargeted Metabolomics of Slc13a5 Deficiency Reveal Critical Liver–Brain Axis for Lipid Homeostasis. Metabolites 2022, 12, 351. [Google Scholar] [CrossRef]
- Capossela, S.; Muzio, L.; Bertolo, A.; Bianchi, V.; Dati, G.; Chaabane, L.; Godi, C.; Politi, L.S.; Biffo, S.; D’Adamo, P.; et al. Growth Defects and Impaired Cognitive-Behavioral Abilities in Mice with Knockout for Eif4h, a Gene Located in the Mouse Homolog of the Williams-Beuren Syndrome Critical Region. Am J Pathol 2012, 180, 1121–1135. [Google Scholar] [CrossRef]
- Parenti, I.; Rabaneda, L.G.; Schoen, H.; Novarino, G. Neurodevelopmental Disorders: From Genetics to Functional Pathways. Trends Neurosci 2020, 43, 608–621. [Google Scholar] [CrossRef]
- Russ, J.B.; Stone, A.C.; Maney, K.; Morris, L.C.; Wright, C.F.; Hurst, J.H.; Cohen, J.L. Cell-Specific Expression Biases in Human Cortex of Genes Associated with Neurodevelopmental Disorders. Sci Rep 2025, 15, 23172. [Google Scholar] [CrossRef]
- Zheng, Z.; Guo, S.; Tam, H.Y.; Wang, J.; Rao, Y.; Hui, M.-N.; Cheung, M.P.L.; Leung, A.W.L.; Wong, K.K.W.; Sharma, R.; et al. Determination of Trunk Neural Crest Cell Fate and Susceptibility to Splicing Perturbation by the DLC1-SF3B1-PHF5A Splicing Complex. Nat Commun 2025, 16, 6718. [Google Scholar] [CrossRef]
- Rajan, A.; Fame, R.M. Brain Development and Bioenergetic Changes. Neurobiol Dis 2024, 199, 106550. [Google Scholar] [CrossRef]
- Bao, Y.; Hudson, Q.J.; Perera, E.M.; Akan, L.; Tobet, S.A.; Smith, C.A.; Sinclair, A.H.; Berkovitz, G.D. Expression and Evolutionary Conservation of the Tescalcin Gene during Development. Gene Expr Patterns 2009, 9, 273–281. [Google Scholar] [CrossRef] [PubMed]
- Martínez de Arrieta, C.; Pérez Jurado, L.; Bernal, J.; Coloma, A. Structure, Organization, and Chromosomal Mapping of the Human Neurogranin Gene (NRGN). Genomics 1997, 41, 243–249. [Google Scholar] [CrossRef]
- Perera, E.M.; Bao, Y.; Kos, L.; Berkovitz, G. Structural and Functional Characterization of the Mouse Tescalcin Promoter. Gene 2010, 464, 50–62. [Google Scholar] [CrossRef]
- De Blasi, A.; Conn, P.J.; Pin, J.; Nicoletti, F. Molecular Determinants of Metabotropic Glutamate Receptor Signaling. Trends Pharmacol Sci 2001, 22, 114–120. [Google Scholar] [CrossRef]
- Jin, S.; Chen, X.; Yang, J.; Ding, J. Lactate Dehydrogenase D Is a General Dehydrogenase for D-2-Hydroxyacids and Is Associated with D-Lactic Acidosis. Nat Commun 2023, 14, 6638. [Google Scholar] [CrossRef]
- Kitano, J.; Yamazaki, Y.; Kimura, K.; Masukado, T.; Nakajima, Y.; Nakanishi, S. Tamalin Is a Scaffold Protein That Interacts with Multiple Neuronal Proteins in Distinct Modes of Protein-Protein Association. J Biol Chem 2003, 278, 14762–14768. [Google Scholar] [CrossRef]
- Lv, G.; Sayles, N.M.; Huang, Y.; Mancinelli, C.; McAvoy, K.; Shneider, N.A.; Manfredi, G.; Kawamata, H.; Eliezer, D. Amyloid Fibril Structures Link CHCHD10 and CHCHD2 to Neurodegeneration. Nat Commun 2025, 16, 7121. [Google Scholar] [CrossRef]
- Svichar, N.; Waheed, A.; Sly, W.S.; Hennings, J.C.; Hübner, C.A.; Chesler, M. Carbonic Anhydrases CA4 and CA14 Both Enhance AE3-Mediated Cl--HCO3- Exchange in Hippocampal Neurons. J Neurosci 2009, 29, 3252–3258. [Google Scholar] [CrossRef]
- Xie, Q.; Lin, T.; Zhang, Y.; Zheng, J.; Bonanno, J.A. Molecular Cloning and Characterization of a Human AIF-like Gene with Ability to Induce Apoptosis. J Biol Chem 2005, 280, 19673–19681. [Google Scholar] [CrossRef] [PubMed]
- Zhao, Q.; Li, J.; Feng, J.; Wang, X.; Liu, Y.; Wang, F.; Liu, L.; Jin, B.; Lin, M.; Wang, Y.; et al. Cholesterol Metabolic Reprogramming Mediates Microglia-Induced Chronic Neuroinflammation and Hinders Neurorestoration Following Stroke. Nat Metab 2025, 7, 2099–2116. [Google Scholar] [CrossRef] [PubMed]
- Alaiz-Noya, M.; Miozzo, F.; Fuentes-Ramos, M.; Machnicka, M.A.; Kurowska, M.; Herrera, M.L.; Del Blanco, B.; Ninerola, S.; Bustos-Martínez, I.; Wilczynski, B.; et al. Neuronal Type-Specific Modulation of Cognition and AP-1 Signaling by Early-Life Rearing Conditions. Nat Commun 2025, 16, 9710. [Google Scholar] [CrossRef] [PubMed]
- Chan, K.T.; Creed, S.J.; Bear, J.E. Unraveling the Enigma: Progress towards Understanding the Coronin Family of Actin Regulators. Trends Cell Biol 2011, 21, 481–488. [Google Scholar] [CrossRef]
- Ning, L.; Tian, L.; Smirnov, S.; Vihinen, H.; Llano, O.; Vick, K.; Davis, R.L.; Rivera, C.; Gahmberg, C.G. Interactions between ICAM-5 and Β1 Integrins Regulate Neuronal Synapse Formation. J Cell Sci 2013, 126, 77–89. [Google Scholar] [CrossRef]
- Zhu, J.-L.; Liang, X. TUBA4A: The Tale of an Unconventional Tubulin. In Cytoskeleton (Hoboken); 2025. [Google Scholar] [CrossRef]
- Feng, Y.; Wei, Z.-H.; Liu, C.; Li, G.-Y.; Qiao, X.-Z.; Gan, Y.-J.; Zhang, C.-C.; Deng, Y.-C. Genetic Variations in GABA Metabolism and Epilepsy. Seizure 2022, 101, 22–29. [Google Scholar] [CrossRef]
- Becchetti, A.; Grandi, L.C.; Cerina, M.; Amadeo, A. Nicotinic Acetylcholine Receptors and Epilepsy. Pharmacol Res 2023, 189, 106698. [Google Scholar] [CrossRef] [PubMed]
- Talvio, K.; Minkeviciene, R.; Townsley, K.G.; Achuta, V.S.; Huckins, L.M.; Corcoran, P.; Brennand, K.J.; Castrén, M.L. Reduced LYNX1 Expression in Transcriptome of Human iPSC-Derived Neural Progenitors Modeling Fragile X Syndrome. Front Cell Dev Biol 2022, 10, 1034679. [Google Scholar] [CrossRef]
- Smith, M.R.; Glicksberg, B.S.; Li, L.; Chen, R.; Morishita, H.; Dudley, J.T. Loss-of-Function of Neuroplasticity-Related Genes Confers Risk for Human Neurodevelopmental Disorders. Pac Symp Biocomput 2018, 23, 68–79. [Google Scholar] [PubMed]
- Miwa, J.M.; Stevens, T.R.; King, S.L.; Caldarone, B.J.; Ibanez-Tallon, I.; Xiao, C.; Fitzsimonds, R.M.; Pavlides, C.; Lester, H.A.; Picciotto, M.R.; et al. The Prototoxin Lynx1 Acts on Nicotinic Acetylcholine Receptors to Balance Neuronal Activity and Survival in Vivo. Neuron 2006, 51, 587–600. [Google Scholar] [CrossRef]
- Gill, D.; Zagkos, L.; Gill, R.; Benzing, T.; Jordan, J.; Birkenfeld, A.L.; Burgess, S.; Zahn, G. The Citrate Transporter SLC13A5 as a Therapeutic Target for Kidney Disease: Evidence from Mendelian Randomization to Inform Drug Development 2023.
- Zhang, L.; Hu, W.; Guo, H.; Sun, Q.; Xu, X.; Li, Z.; Qiu, Z.; Bian, J. Discovery of Highly Potent Solute Carrier 13 Member 5 (SLC13A5) Inhibitors for the Treatment of Hyperlipidemia. J. Med. Chem. 2024, 67, 6687–6704. [Google Scholar] [CrossRef]
- Akhtar, M.J.; Khan, S.A.; Kumar, B.; Chawla, P.; Bhatia, R.; Singh, K. Role of Sodium Dependent SLC13 Transporter Inhibitors in Various Metabolic Disorders. Mol Cell Biochem 2023, 478, 1669–1687. [Google Scholar] [CrossRef]
- Brachs, S.; Winkel, A.F.; Tang, H.; Birkenfeld, A.L.; Brunner, B.; Jahn-Hofmann, K.; Margerie, D.; Ruetten, H.; Schmoll, D.; Spranger, J. Inhibition of Citrate Cotransporter Slc13a5/mINDY by RNAi Improves Hepatic Insulin Sensitivity and Prevents Diet-Induced Non-Alcoholic Fatty Liver Disease in Mice. Molecular Metabolism 2016, 5, 1072–1082. [Google Scholar] [CrossRef]
- Schumann, T.; König, J.; Henke, C.; Willmes, D.M.; Bornstein, S.R.; Jordan, J.; Fromm, M.F.; Birkenfeld, A.L. Solute Carrier Transporters as Potential Targets for the Treatment of Metabolic Disease. Pharmacological Reviews 2020, 72, 343–379. [Google Scholar] [CrossRef]
- Willmes, D.M.; Kurzbach, A.; Henke, C.; Schumann, T.; Zahn, G.; Heifetz, A.; Jordan, J.; Helfand, S.L.; Birkenfeld, A.L. The Longevity Gene INDY ( I ’m N Ot D Ead Y et) in Metabolic Control: Potential as Pharmacological Target. Pharmacology & Therapeutics 2018, 185, 1–11. [Google Scholar] [CrossRef]
- Kopel, J.; Higuchi, K.; Ristic, B.; Sato, T.; Ramachandran, S.; Ganapathy, V. The Hepatic Plasma Membrane Citrate Transporter NaCT (SLC13A5) as a Molecular Target for Metformin. Sci Rep 2020, 10, 8536. [Google Scholar] [CrossRef]
- Pajares, M.; Cuadrado, A.; Rojo, A.I. Modulation of Proteostasis by Transcription Factor NRF2 and Impact in Neurodegenerative Diseases. Redox Biol 2017, 11, 543–553. [Google Scholar] [CrossRef] [PubMed]
- Song, Y.; Wang, W.; Wang, B.; Shi, Q. The Protective Mechanism of TFAM on Mitochondrial DNA and Its Role in Neurodegenerative Diseases. Mol Neurobiol 2024, 61, 4381–4390. [Google Scholar] [CrossRef] [PubMed]
- Williams, L.M.; Lago, B.A.; McArthur, A.G.; Raphenya, A.R.; Pray, N.; Saleem, N.; Salas, S.; Paulson, K.; Mangar, R.S.; Liu, Y.; et al. The Transcription Factor, Nuclear Factor, Erythroid 2 (Nfe2), Is a Regulator of the Oxidative Stress Response during Danio Rerio Development. Aquat Toxicol 2016, 180, 141–154. [Google Scholar] [CrossRef] [PubMed]
Figure 1.
SLC13A5 expression in human central and peripheral tissues. RPKM for SLC13A5 expression is shown at different age categories for (A) Cerebrum, (B) Cerebellum, (C) Liver, (D) Kidney, (E) Ovary, and (F) Testis. Each panel depicts the biological ordering from fetal weeks post-conception through postnatal stages, with the within-tissue median ± IQR annotated. Data are expressed as mean RPKM ± SEM.
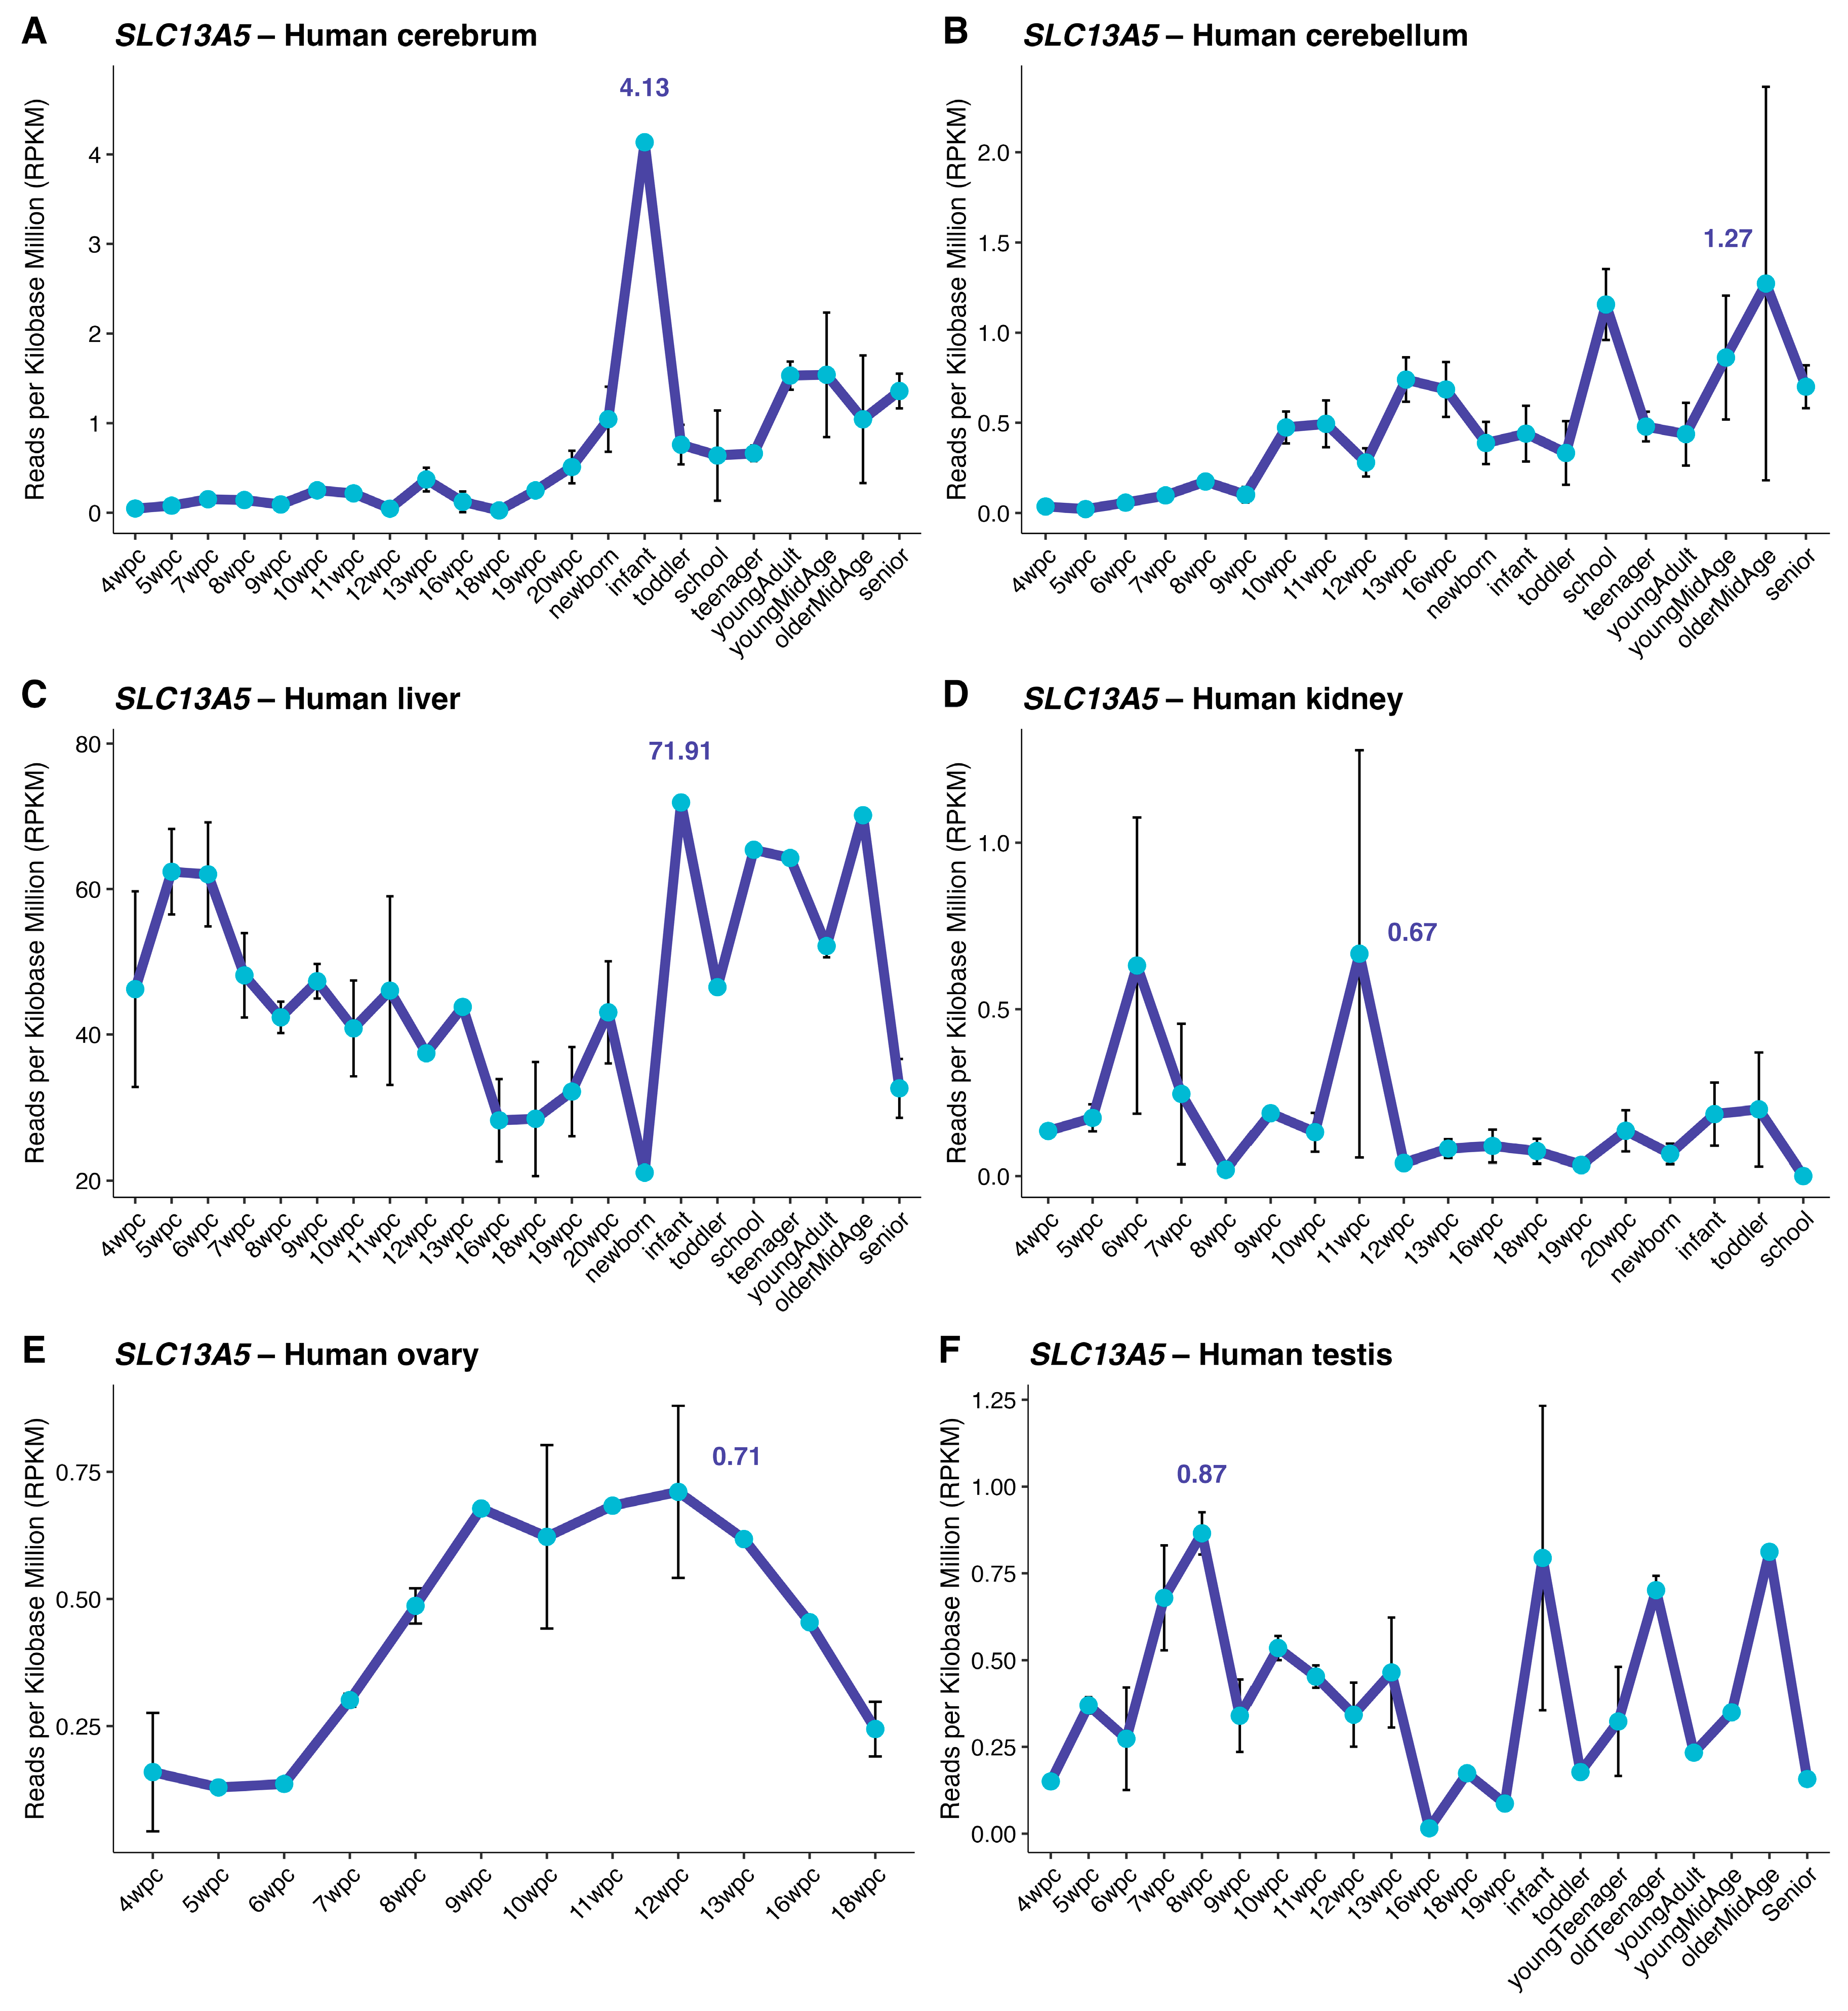
Figure 2.
Transcriptome-wide association landscape for SLC13A5 in the human cerebrum. (Panel A) shows a volcano-type display of Spearman correlations between SLC13A5 and all expressed genes across cerebrum samples (dashed guides at ρ = ±0.5 and at the Benjamini–Hochberg FDR = 0.05 threshold). Labeled points indicate the most significant positive and negative associates after FDR correction. (Panel B) presents a compact heat map of the top positively and negatively associated genes (at all developmental stages from 4 wpc to senior), showing z-scored expression to emphasize temporal gradient. (Panels C,D) summarize functional enrichment among FDR-significant correlates: C Gene Ontology Biological Process using Ensembl identifiers for SLC13A5-correlated genes; (D) KEGG pathways using a symmetric Ensembl→Entrez mapping. The color of the dots indicates the gene ratio. The y-axis reflects −log10(FDR), with terms ranked by significance.
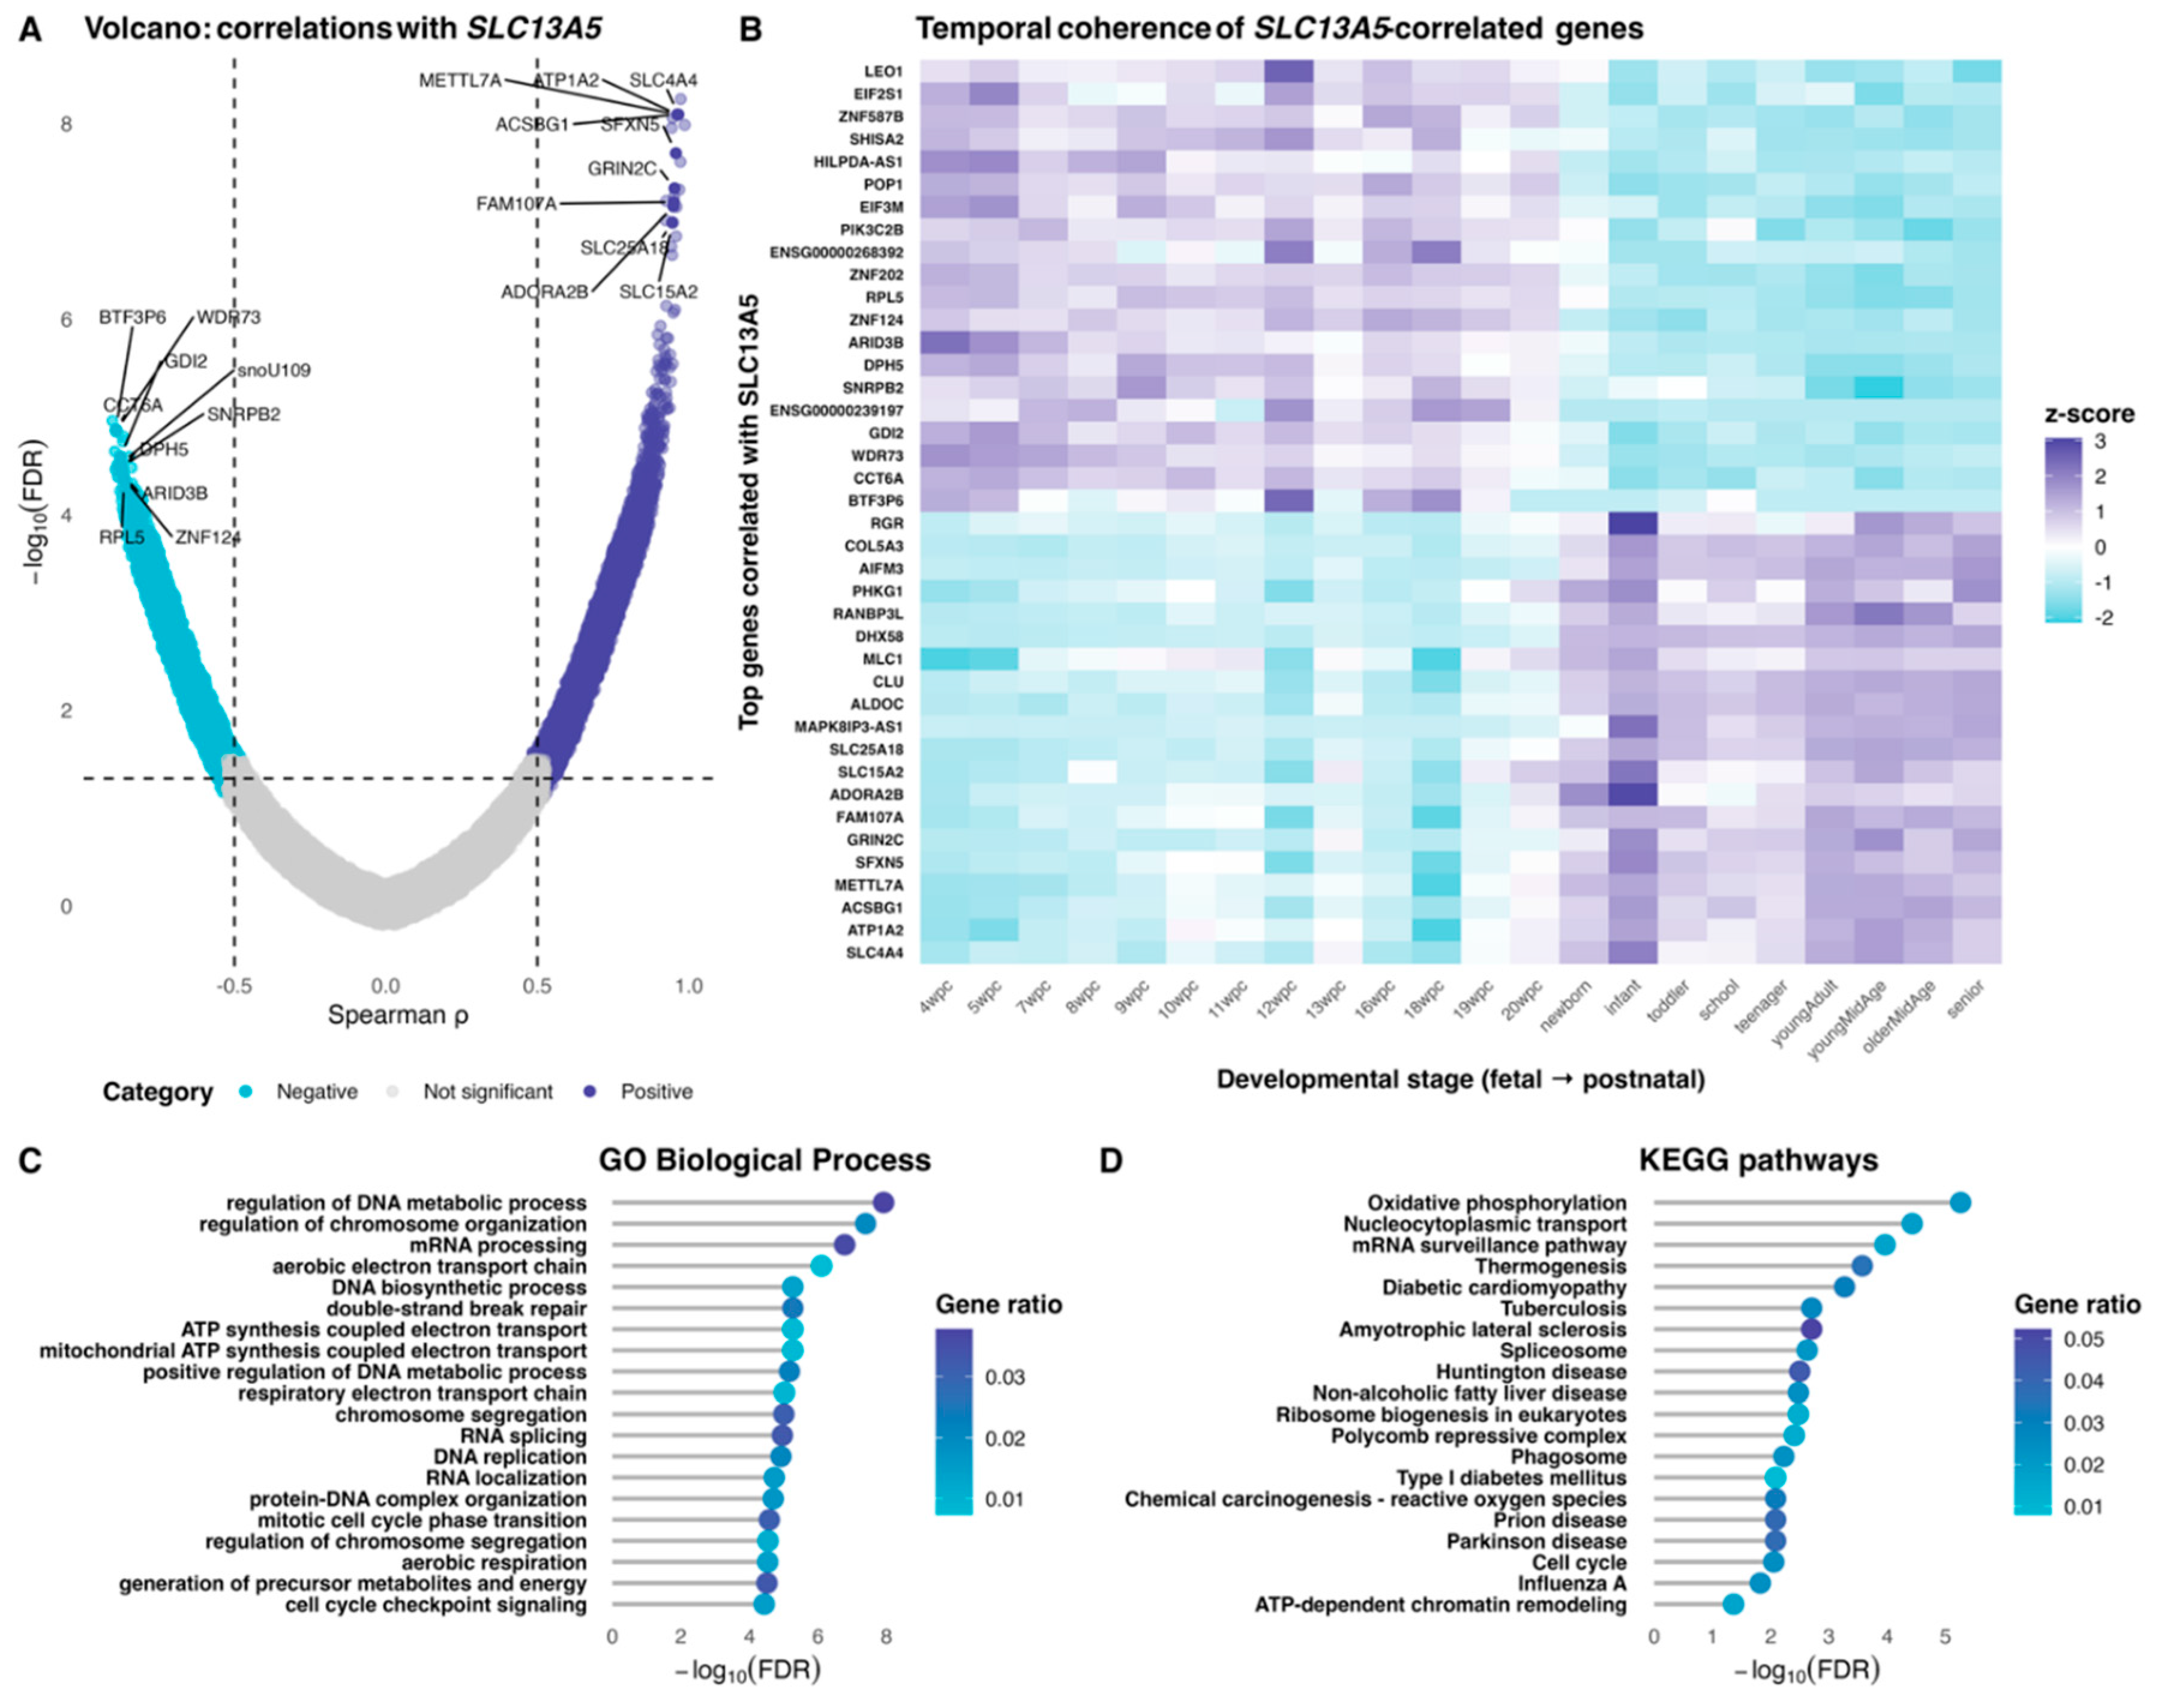
Figure 3.
Network architecture of the cerebrum co-expression map. (Panel A) displays the scale-free topology fit versus soft-thresholding power for a signed, bicor network; the chosen power corresponds to the first value achieving R2 ≥ 0.80 (fallback applied when no value reaches the criterion). (Panel B) shows module size distribution (genes per module), with the circle color fill matching the WGCNA module color key used throughout. (Panels C,D) show the gene dendrogram with aligned color tracks: C the dendrogram is zoomed at the top to emphasize branch topology; D annotation bars reporting, in order, module assignment (module colors), gene significance to SLC13A5 (bicor with SLC13A5; blue[high]-white-red[low]), and intramodular connectivity (|kME|; blue[high]-white-red gradient[low]).
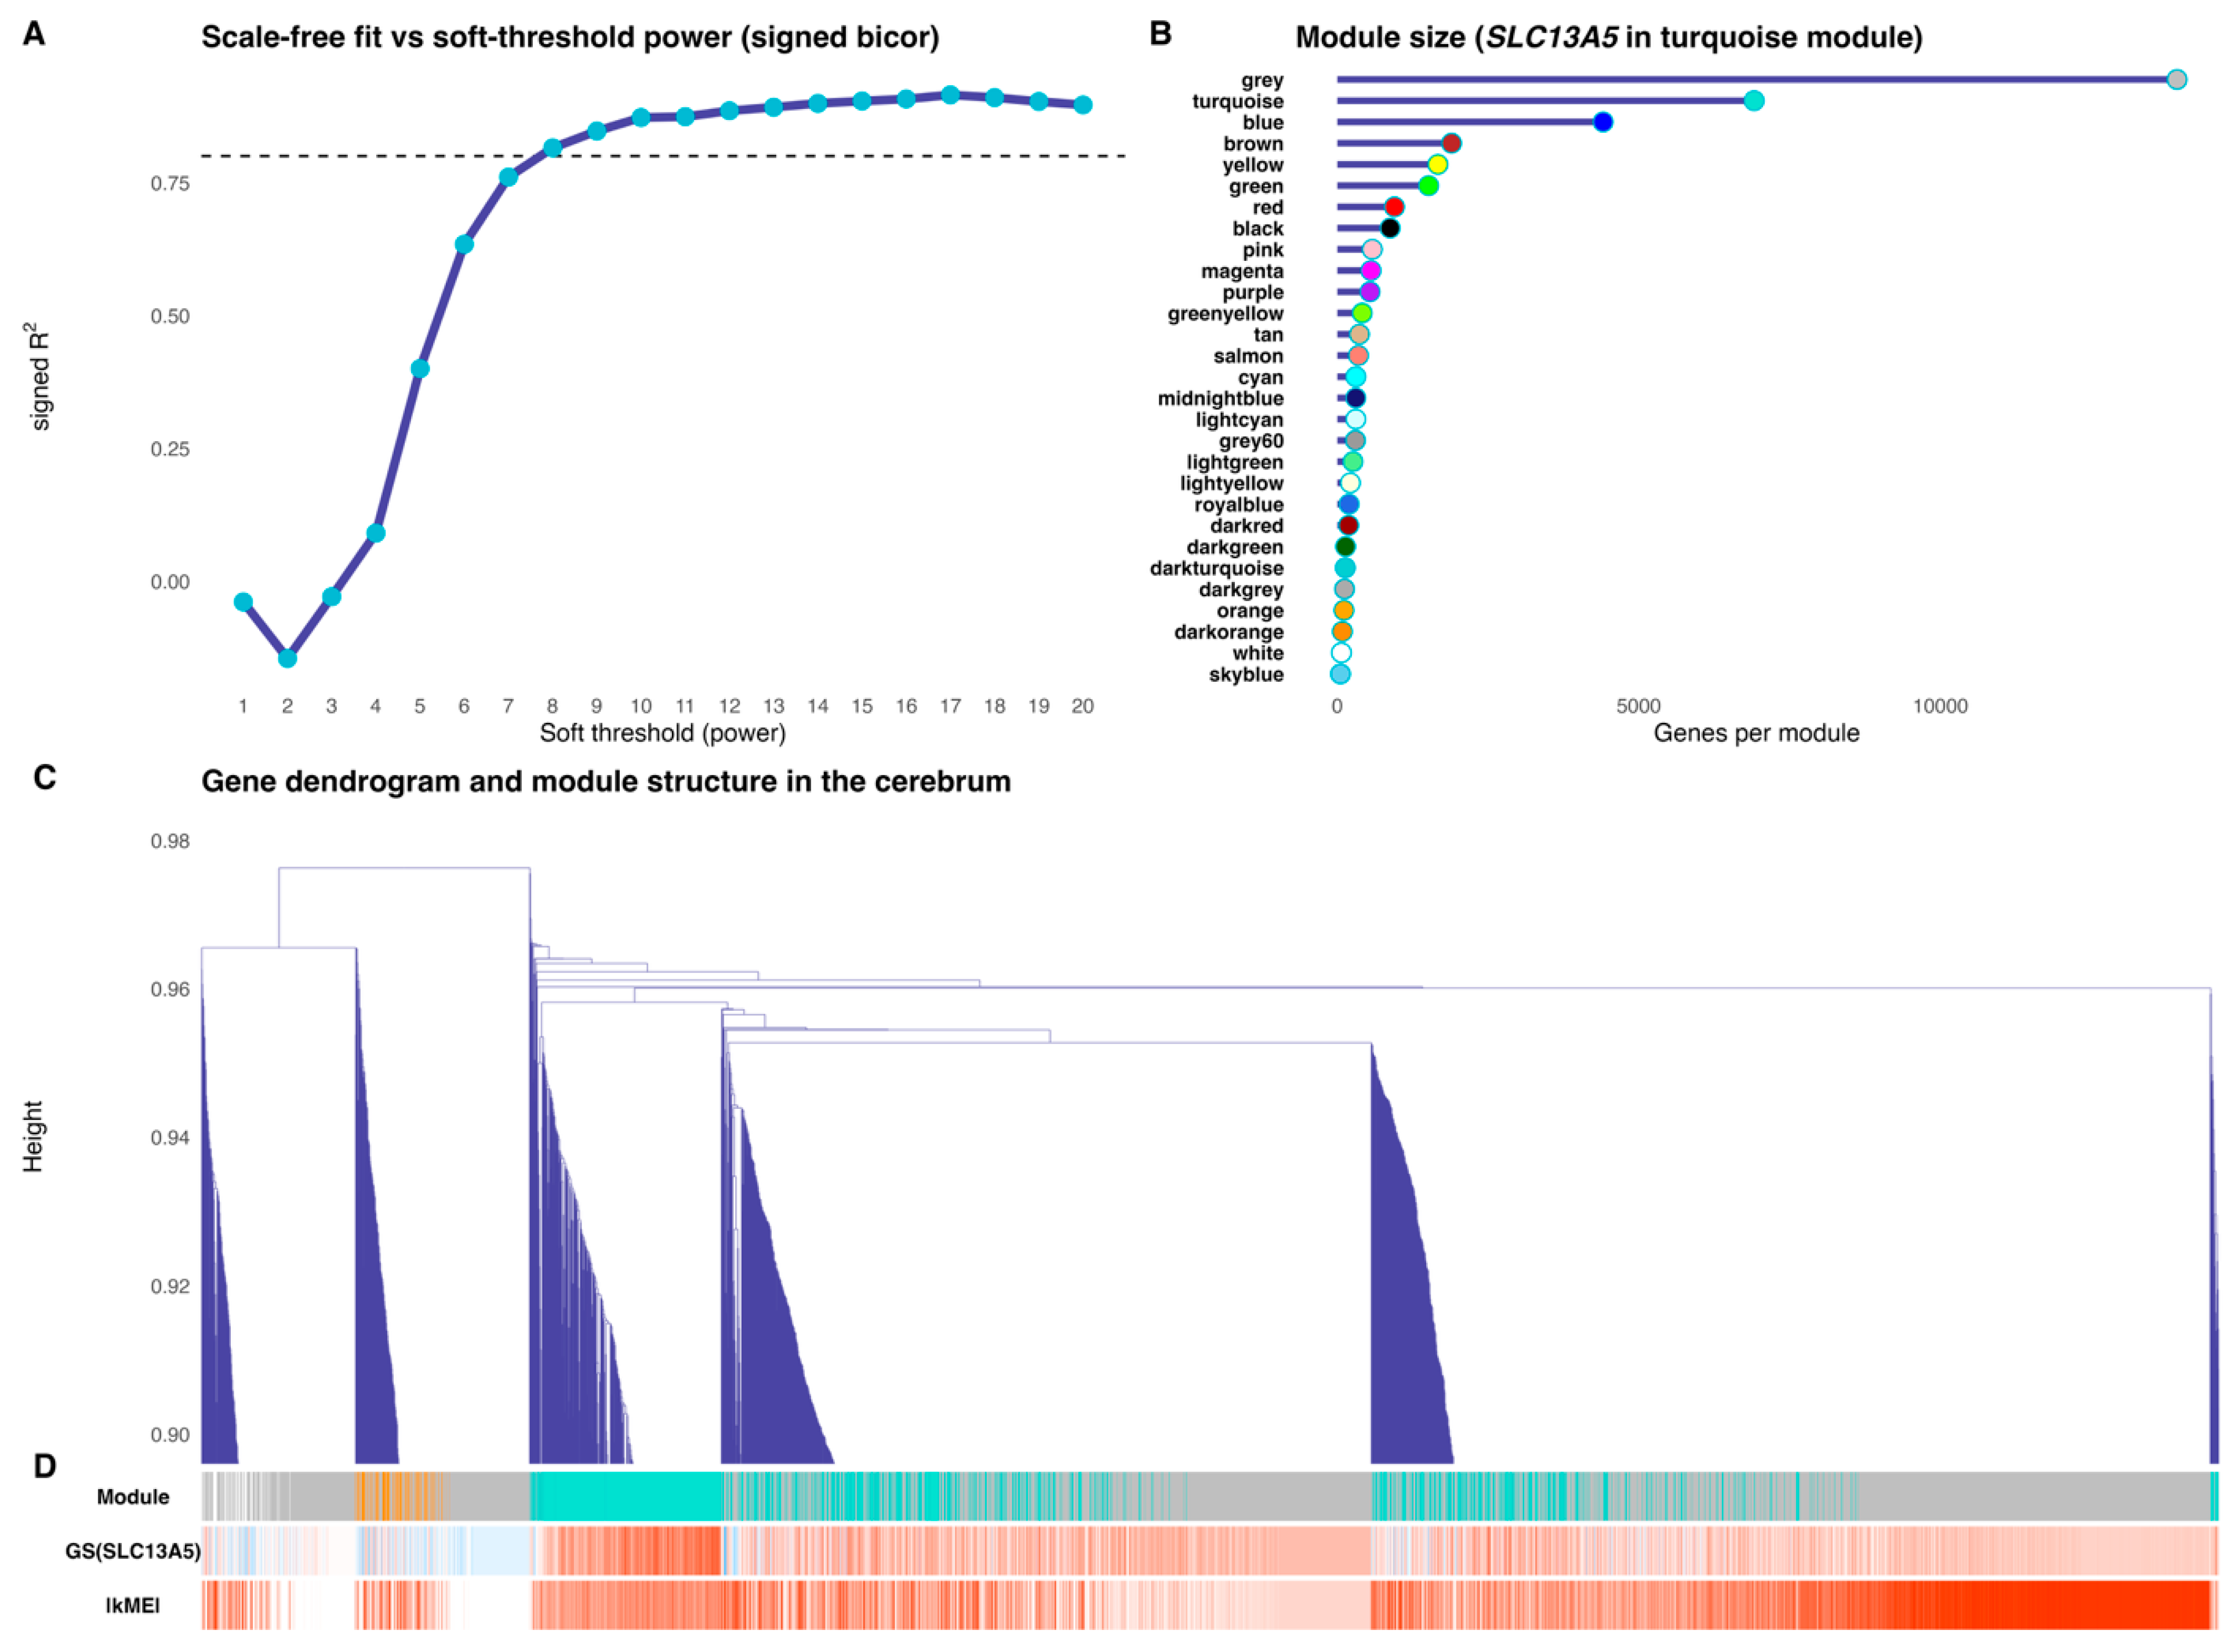
Figure 4.
The SLC13A5 module tracks neurodevelopment and the gene itself. (Panel A) shows the association between the SLC13A5 module eigengene (SME) and the ordinal developmental rank (age rank) across cerebrum samples. (Panel B) depicts the association between SME and SLC13A5 expression (log2-transformed). A partial Spearman correlation controlling for age rank (computed on rank-based residuals) is provided in the (panel C). Spearman ρ and two-sided P are indicated in all panels.
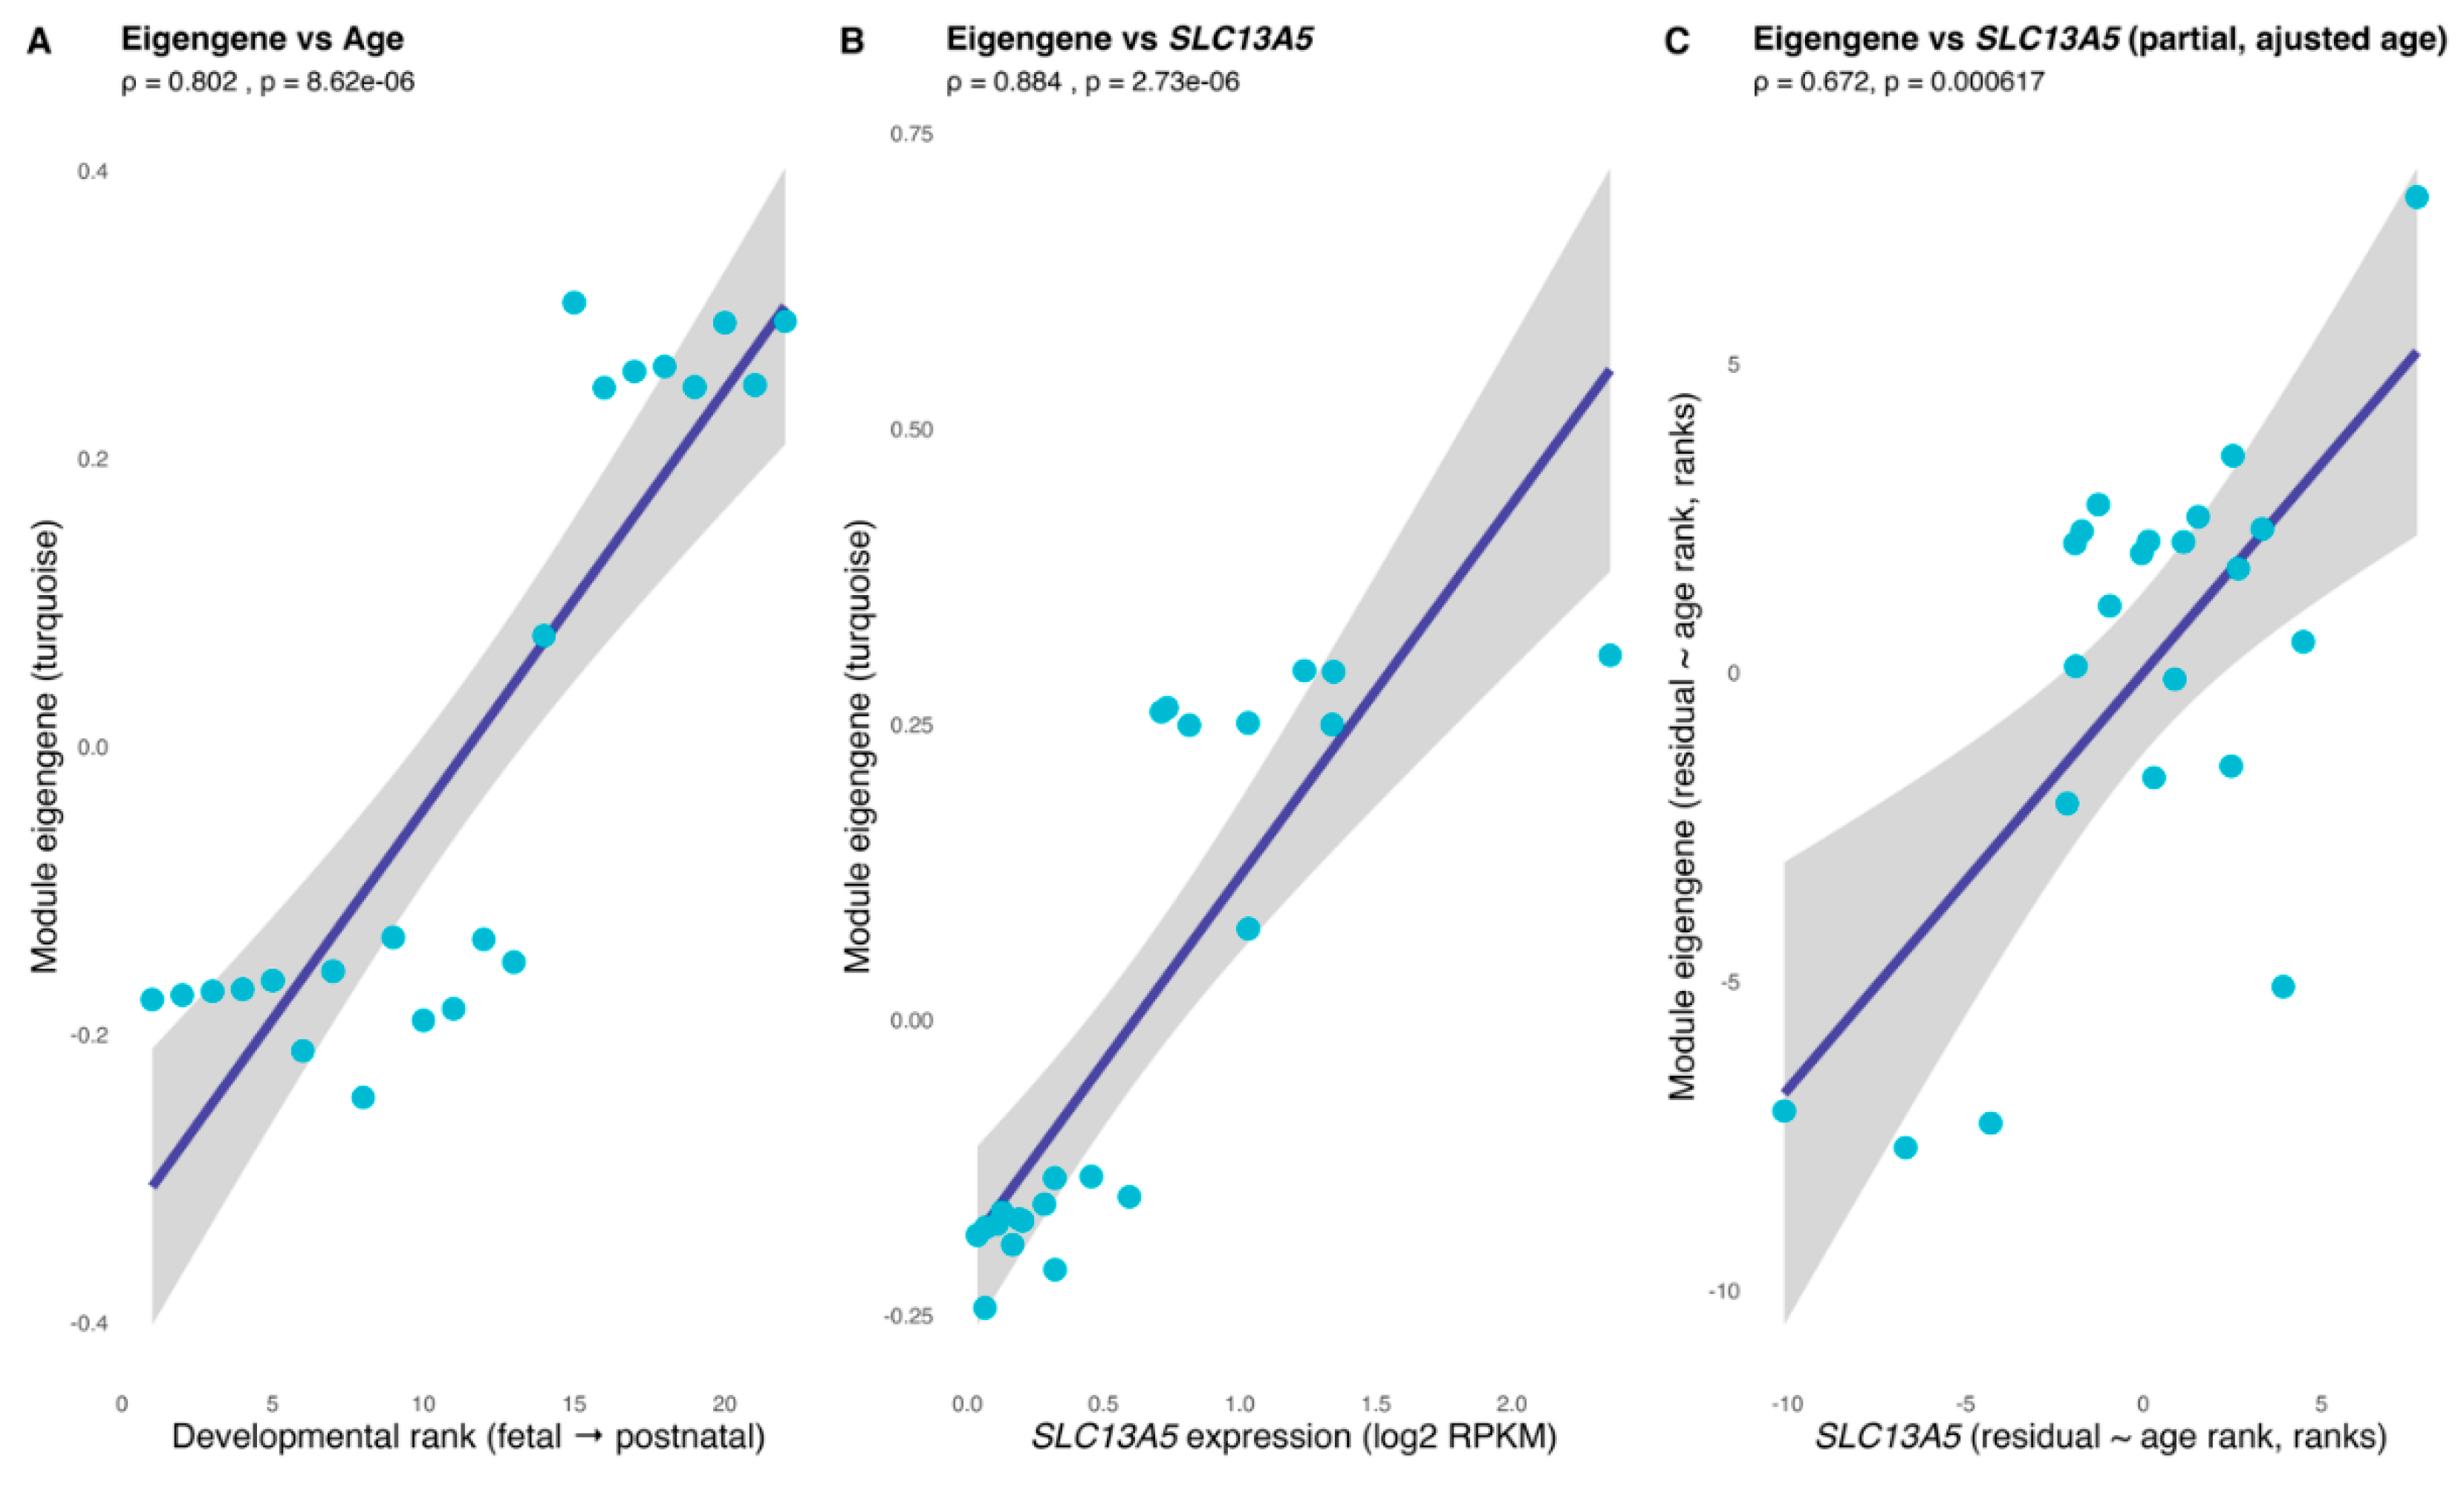
Figure 5.
Intramodular co-expression network linked to SLC13A5. A force-directed graph depicts the top 30 genes by absolute intramodular connectivity (|kME|) within the SLC13A5 module, with SLC13A5 forcibly included when necessary. Undirected edges connect pairs with |bicor| > 0.60, emphasizing robust associations. Node color encodes |kME|, size represents cerebrum gene expression (mean RPKM); labels are shown for SLC13A5 and the highest-connectivity nodes. Edges incident to SLC13A5 are highlighted (in red) to delineate its immediate neighborhood within the module.
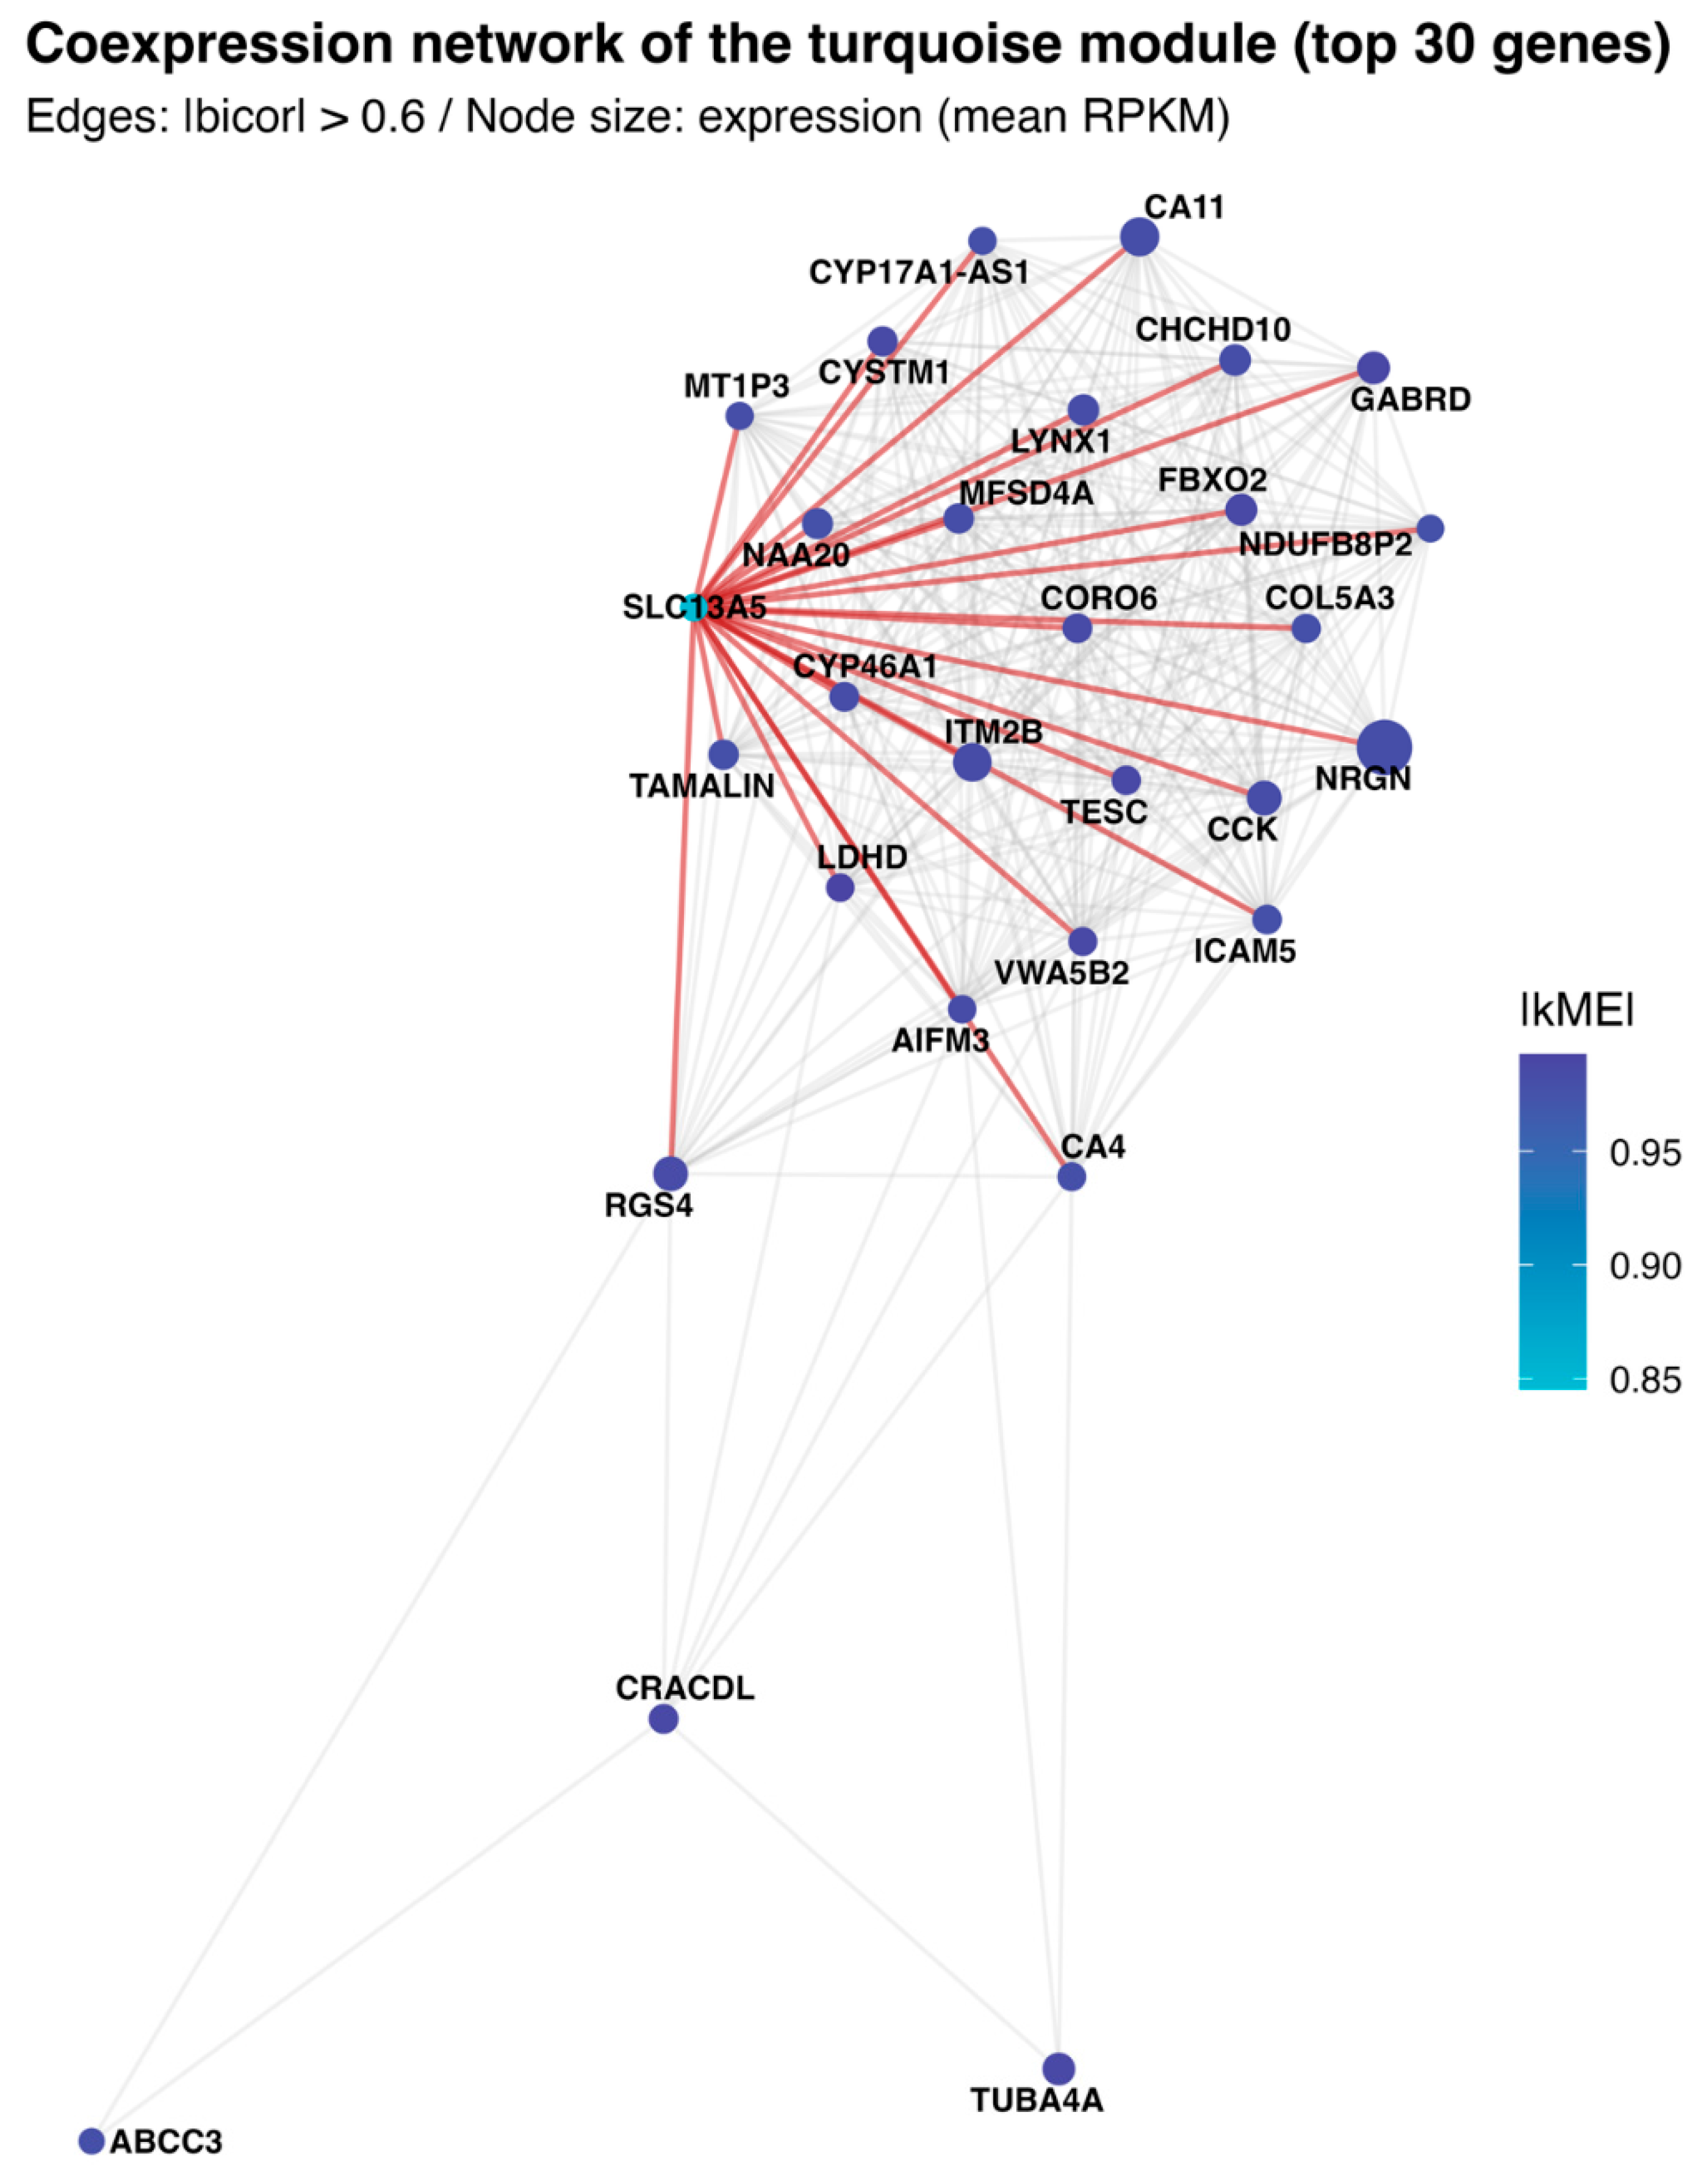
Figure 6.
Functional programs enriched in the SLC13A5 module. Gene-set over-representation for the SLC13A5 module is shown for Gene Ontology Biological Process (Panel A), KEGG pathways (Panel B), and MSigDB C3 transcription-factor targets (Panel C). Universes are matched to each test (all network-tested genes in Ensembl for GO; symmetric Ensembl→Entrez mapping for KEGG; symbol-level background for TF targets). Points encode the gene ratio by color, and the y-axis indicates −log10(FDR). Displayed terms are the top results by FDR, highlighting processes and pathways linked to the module’s coordinated variation.
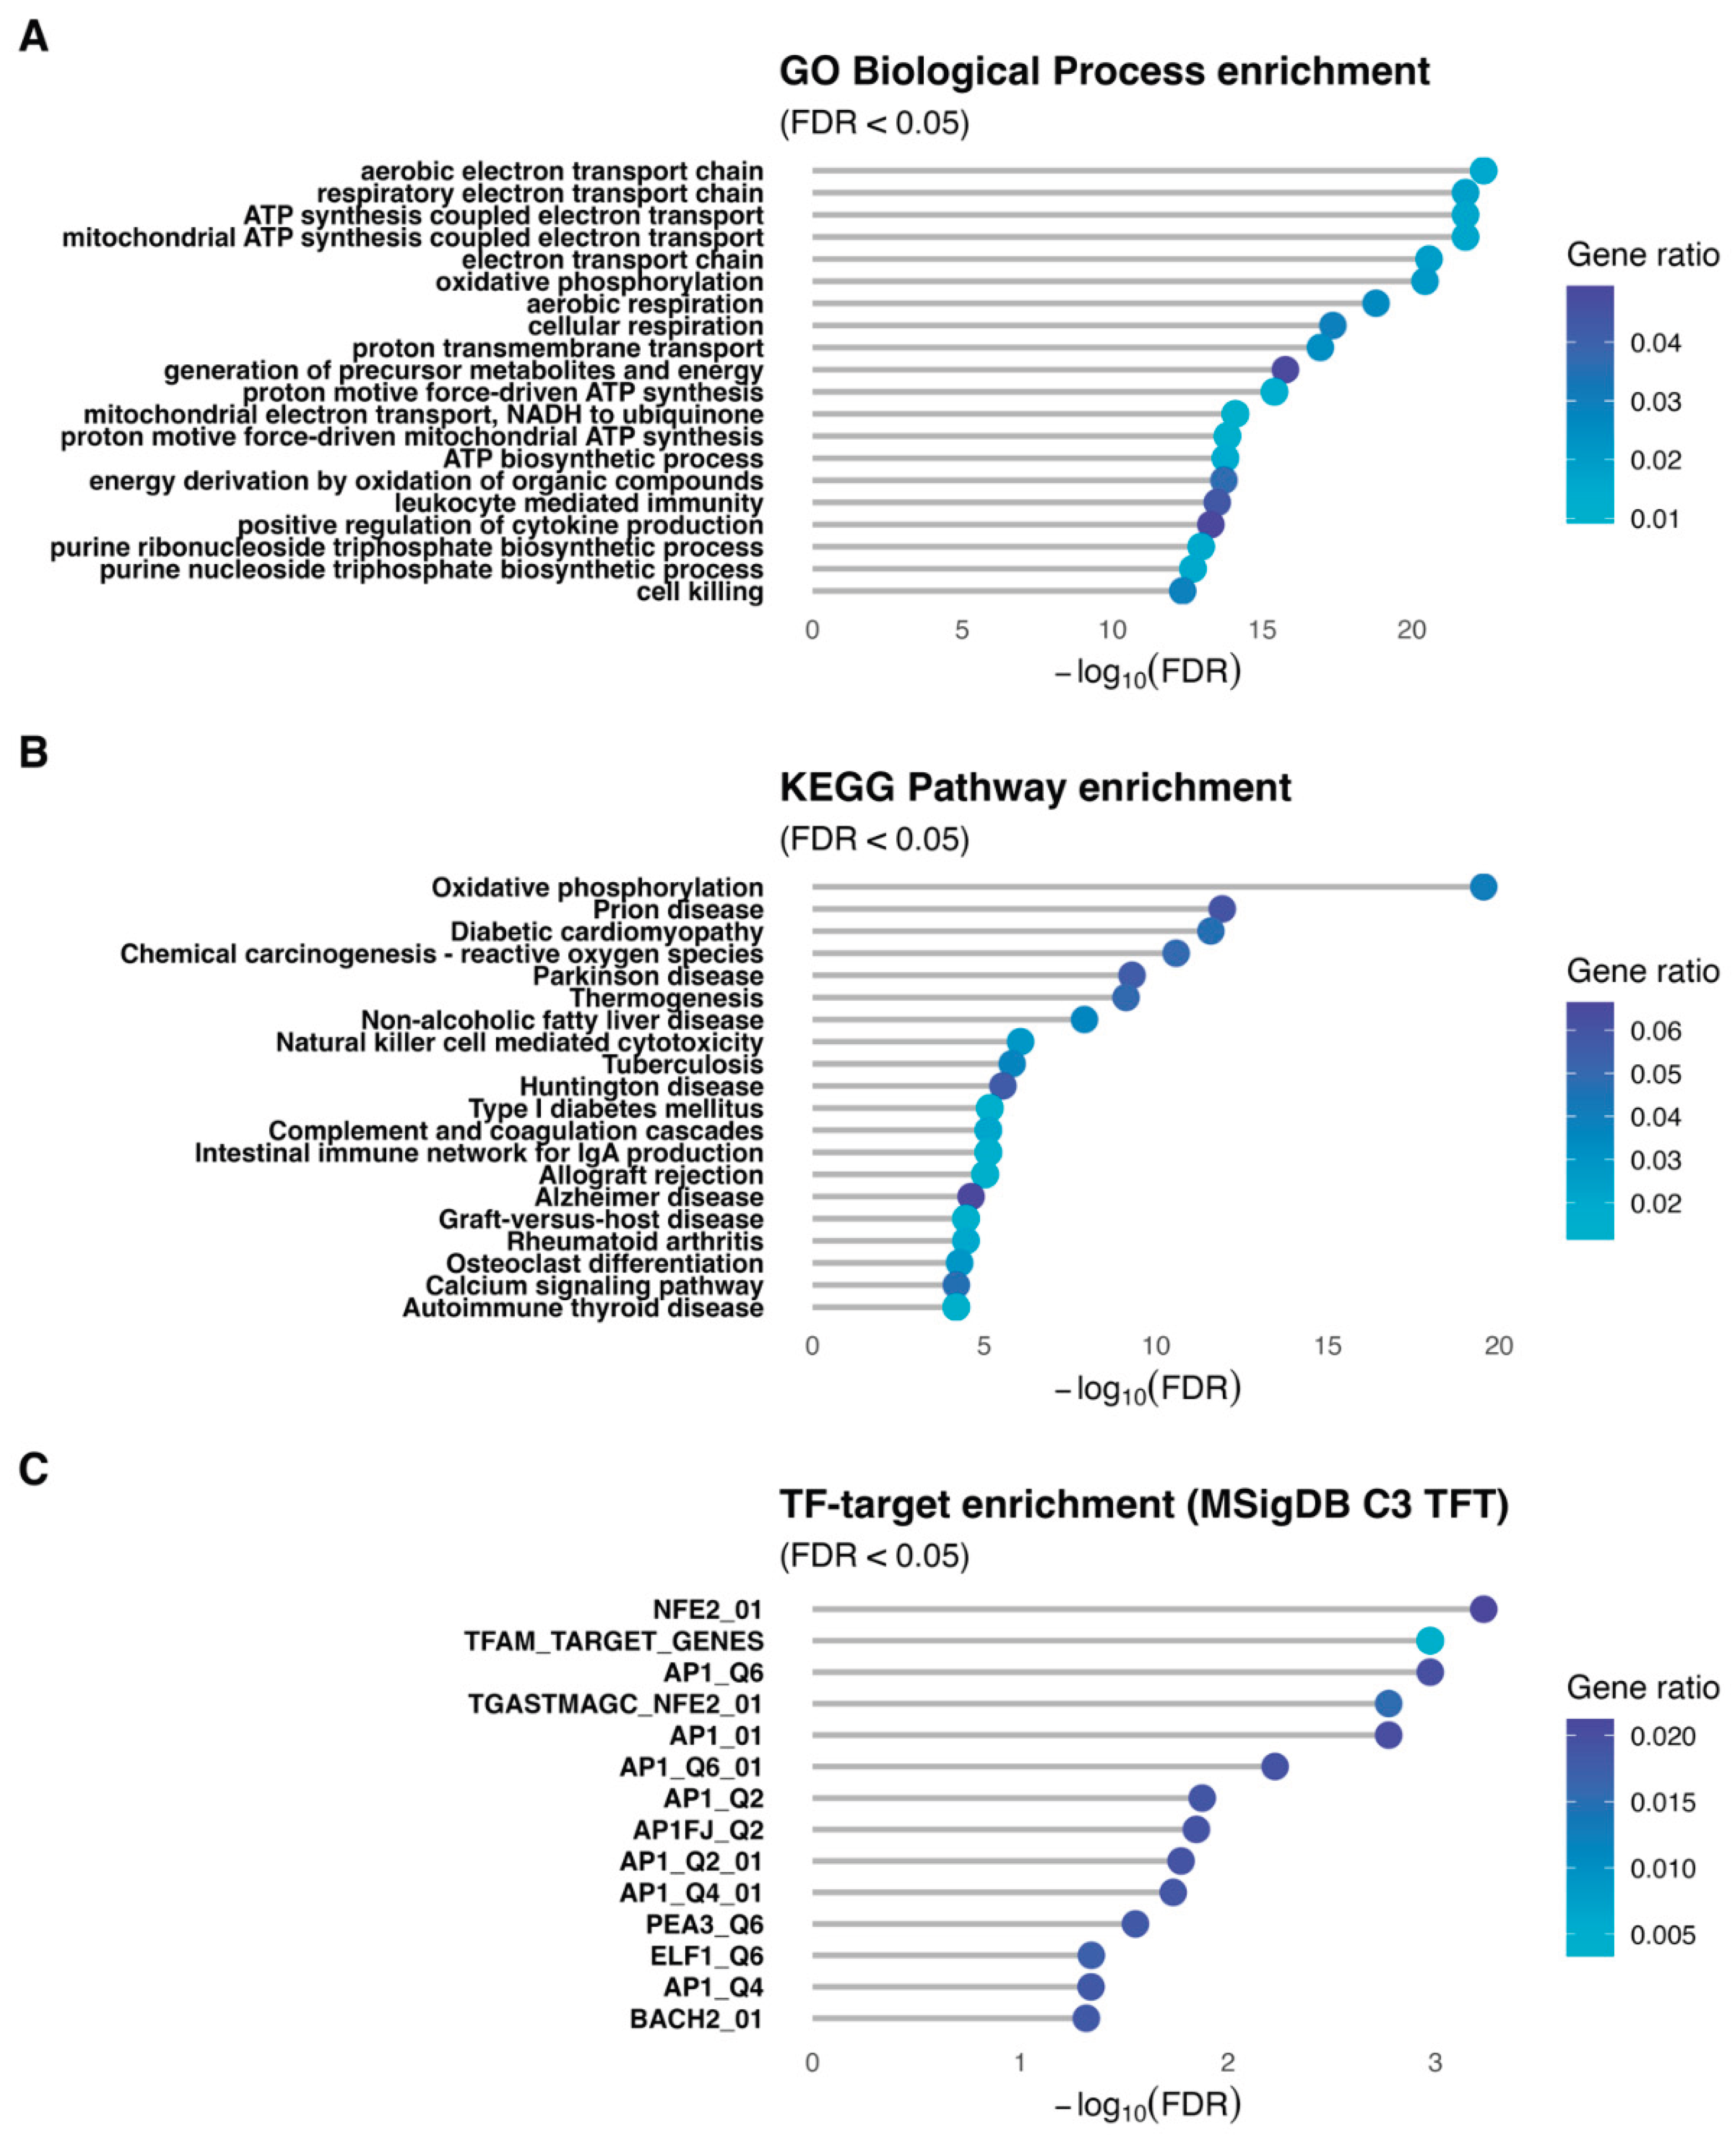

Table 1.
Pre- and post-conception SLC13A5 expression (RPKM) by tissue.
| Conception Stage | |||||||
|---|---|---|---|---|---|---|---|
| Tissue | N | Overall (N=26)1 | Pre (N=14) 1 | Post (N=12) 1 | Diff. 2 | 95% CI 2 | p-Value 2 |
| Cerebrum | 22 | 0.7 ± 0.9 | 0.2 ± 0.1 | 1.4 ± 1.1 | -1.2 | -2.1, -0.40 | 0.009 |
| Cerebellum | 20 | 0.5 ± 0.4 | 0.3 ± 0.3 | 0.7 ± 0.3 | -0.39 | -0.69, -0.09 | 0.015 |
| Heart | 19 | 0.1 ± 0.1 | 0.0 ± 0.1 | 0.1 ± 0.1 | -0.01 | -0.12, 0.09 | 0.8 |
| Kidney | 18 | 0.2 ± 0.2 | 0.2 ± 0.2 | 0.1 ± 0.1 | 0.08 | -0.08, 0.24 | 0.3 |
| Liver | 22 | 46.9 ± 14.2 | 43.5 ± 10.3 | 53.0 ± 18.6 | -9.5 | -26, 6.4 | 0.2 |
| Ovary | 12 | 0.4 ± 0.2 | 0.4 ± 0.2 | - | - | - | - |
| Testis | 21 | 0.4 ± 0.3 | 0.4 ± 0.2 | 0.4 ± 0.3 | -0.08 | -0.33, 0.18 | 0.5 |
| 1 Mean ± SD | |||||||
| 2 Welch Two Sample t-test; NA | |||||||
| Abbreviation: CI = Confidence Interval | |||||||
Disclaimer/Publisher’s Note: The statements, opinions and data contained in all publications are solely those of the individual author(s) and contributor(s) and not of MDPI and/or the editor(s). MDPI and/or the editor(s) disclaim responsibility for any injury to people or property resulting from any ideas, methods, instructions or products referred to in the content. |
© 2026 by the authors. Licensee MDPI, Basel, Switzerland. This article is an open access article distributed under the terms and conditions of the Creative Commons Attribution (CC BY) license (http://creativecommons.org/licenses/by/4.0/).
Copyright: This open access article is published under a Creative Commons CC BY 4.0 license, which permit the free download, distribution, and reuse, provided that the author and preprint are cited in any reuse.


