Preprint
Article

This version is not peer-reviewed.

From Traits to Clusters: Emotional–Sensory–Regulatory Eating Profiles in Generation Z with Implications in Sustainable Food Behavior

Submitted:

31 December 2025

Posted:

31 December 2025

You are already at the latest version

Abstract

Building on our previous systematic review that synthesized eight core sustainable appetitive traits central to food behavior research, the present study extends this framework through an empirical investigation of Generation Z university students in Greece. We have established the conceptual foundation by mapping emotional, sensory, and behavioral regulation drivers of eating behavior, underscoring their relevance for nutrition and sustainability. However, empirical applications of this multidimensional framework to Generation Z remained scarce. This study addresses this gap by examining eating behaviors among approximately 800 students at the University of Ioannina using a validated post pandemic questionnaire. Results revealed heterogeneity across six domains, with consensus observed only in sensory driven eating (M = 3.88) and openness to new foods (M = 4.00). Cluster analysis identified two distinct profiles: Exploratory and Hedonic Responders and Emotionally Regulated and Satiety Oriented Responders. These clusters delineate a novel profile of Generation Z, portraying them as digitally immersed, sustainability oriented, and emotionally sensitive, yet divided between impulsive exploration and regulated satiety. The study contributes new empirical insights into post pandemic food behavior. It establishes a comprehensive evidence base for designing culturally sensitive wellness programs and targeted nutritional interventions that support sustainable dietary practices. The continuity between the two papers underscores both theoretical importance and the practical necessity of integrating emotional, sensory, and regulatory dimensions in advancing sustainable eating futures among young adults.

Keywords: 
;  ;  ;  ;  ;  

1. Introduction

The global health crisis of the early 2020s profoundly reshaped global food behavior, altering consumption patterns, emotional responses, and sensory experiences across populations. Among young adults, particularly college students, these changes were especially pronounced due to their transitional developmental stage, digital immersion, and heightened sensitivity to emotional and sensory stimuli [1,2]. Generation Z, defined as individuals born between 1995 and 2010, represents a uniquely positioned demographic at the intersection of academic pressures, social transitions, and identity formation. Their eating behaviors provide critical insights into post-pandemic nutritional challenges and opportunities, while also reflecting broader societal shifts toward sustainability, inclusivity, and digital mediation [3,4].
We identified eight behavioral dimensions in our recent systematic review [5], as central to sustainable food behavior research, namely: Hunger, Food Responsiveness, Emotional Overeating, Enjoyment of Food, Satiety Responsiveness, Emotional Undereating, Food Fussiness, and Slowness in Eating. Building. On this framework, the present study applies these dimensions to Generation Z students in Greece, thereby extending the review’s insights into a specific demographic context and addressing an important research gap. While prior research has examined emotional eating, sustainability, or digital influence separately [6,7,8], few studies have integrated these dimensions into a comprehensive framework for Gen Z food behavior as this study does. The conceptual grouping of the eight factors is visualized in Figure 1, which illustrates their organization into emotional, sensory, and behavioral regulation drivers.
The presentation of the eight behavioral factors in brief is as follows:
  • Hunger, often perceived cognitively rather than physiologically, with stress and digital distraction influencing its recognition [1,9]. Recent studies show that academic pressure and time constraints can delay eating episodes, reframing hunger as a regulated rather than instinctive cue [10,11].
  • Food Responsiveness, reflects the influence of external sensory stimuli such as sight, smell, and social media exposure. Evidence indicates that Generation Z is particularly sensitive to aesthetic food presentation, which can trigger impulsive consumption [12,13].
  • Emotional Overeating, a coping mechanism for psychological discomfort, closely linked to anxiety and elevated body mass index. Meta-analyses and recent surveys confirm its relevance in understanding stress-related eating behaviors among young adults [14,15].
  • Enjoyment of Food, associated with openness to diverse cuisines and social connection. Generation Z demonstrates enthusiasm for culinary exploration, often reinforced by digital food cultures, though this can coexist with weaker satiety awareness [13,16].
  • Satiety Responsiveness, refers to the ability to recognize fullness and regulate intake. Stress and disrupted routines have been shown to weaken internal satiety cues, leading to inconsistent regulation among students [17,18].
  • Emotional Undereating, characterized by reduced intake under stress or anxiety, has been observed in young adults and remains underexplored in literature. It represents a coping mechanism that may risk nutritional deficiencies [19,20].
  • Food Fussiness, or reluctance to try new foods, appears to be declining among Generation Z, who show openness to global cuisines and culinary curiosity. Recent studies highlight both cultural and psychological determinants of food neophobia in this demographic [13,21].
  • Slowness in Eating, has implications for satiety and metabolic health. Faster eating, common among students under stress, is associated with reduced satiety awareness and higher BMI [22,23].
Research Gap & Contribution
This study extends the findings of our previous systematic review [5] by applying its conceptual framework to a specific demographic—Greek Generation Z students, to identify similarities and differences to sustainable food behavior. In doing so, it addresses a scientific gap: the lack of integrated analyses that combine emotional, sensory, and behavioral regulation factors within the context of a digitally immersed, sustainability-oriented generation.
By situating the eight behavioral dimensions in the lived experiences of Gen Z, this research contributes novel insights into post-pandemic food behavior, offering a foundation for culturally sensitive wellness programs and mindful eating interventions that promote sustainable dietary practices tailored to university populations.

2. Materials and Methods

2.1. Survey Methodology and Data Collection

The empirical investigation was carried out at the University of Ioannina, located in northwestern Greece in a city of approximately 112,000 residents. The institution comprises seven schools and fifteen academic departments, with a total student enrollment of nearly 30,000 (Figure 2). Nevertheless, the phenomenon of inactive enrollment, which is prevalent in Greek higher education, reduces the number of actively engaged students to about 60% of the total, corresponding to roughly 18,000 individuals. Within this group, nearly 20% (both undergraduate and postgraduate) fall outside the Generation Z cohort and were therefore excluded from the survey population. Consequently, the final eligible population amounted to 14,500 active students, from which a representative sample of 360 Generation Z students was derived.
The calculated sample size etermined using Cochran’s formula for finite populations [24]:
Preprints 192333 i001
Indeed, a total of eight hundred and four (804) active students completed the questionnaire collected using the Google Forms platform, surpassing more than two times the calculated sample size of 360 students, and shared with members of the university community through their institutional email accounts. From the 804 answers for the statistical analysis, 800 of them were used below. Authorization in line with GDPR requirements was obtained from the competent university authority, guaranteeing that all submissions and related email data remained fully anonymous.
This study employed a structured questionnaire to investigate university students’ attitudes toward food-related behaviors. The instrument comprised two main sections. The first section collected sociodemographic information, including gender, age, marital status, employment situation, and place of residence. The second section assessed eight internationally validated appetitive traits: Hunger (H, 5 items), Food Responsiveness (FR, 4 items), Emotional Overeating (EOE, 4 items), Enjoyment of Food (EF, 5 items), Satiety Responsiveness (SR, 5 items), Emotional Undereating (EUE, 5 items), Food Fussiness (FF, 3 items), and Slowness in Eating (SE, 4 items).
Beyond sociodemographic characteristics, these traits were identified through the literature review as key determinants shaping consumers’—and particularly young consumers’—attitudes toward eating behavior. The complete questionnaire is provided in Supplementary materials as Table S1.

2.2. Analytical Procedures

All items evaluating food-related attitudes were assessed using a five-point Likert scale, ranging from “Strongly disagree” (1) to “Strongly agree” (5). Descriptive statistics were calculated for each variable, and measures of central tendency were expressed through the mean Likert score. This approach allowed for a more refined depiction of participants’ attitudes, extending beyond simple frequency distributions [25,26].
To identify latent structures within the twenty-four perception-related Likert items, a principal component analysis (PCA) with Varimax rotation was conducted. PCA was applied as a dimensionality reduction method, converting the initial set of intercorrelated variables into a smaller number of orthogonal components, each reflecting an underlying dimension of sustainability-related attitudes [27]. The adequacy of the dataset for PCA was confirmed through the Kaiser–Meyer–Olkin (KMO) statistic and Bartlett’s test of sphericity [28]. Components with eigenvalues exceeding 1.0 were retained, and only items with factor loadings greater than 0.50 were included in the final solution. The internal consistency of each extracted factor was evaluated using Cronbach’s alpha, with all coefficients surpassing the recommended threshold of 0.70 [29].
The factor scores obtained from the principal component analysis (PCA) were subsequently employed as inputs for clustering procedures. To identify the appropriate number of clusters, a hierarchical clustering approach was first applied, using Ward’s linkage method in combination with squared Euclidean distances. The agglomeration schedule and dendrogram were examined to guide this decision. Thereafter, a k-means clustering analysis was performed to allocate participants into distinct, non-overlapping, and internally consistent consumer groups [28]. Each cluster reflected a unique attitudinal profile toward sustainable packaging. Differences across clusters were evaluated by comparing the mean values of the PCA-derived dimensions. In the final stage, a binary logistic regression analysis was conducted to determine which factors significantly predicted cluster assignment. Cluster membership was dichotomized according to a median split of the overall behavioral intention scale (coded as 1 = high intention, 0 = low-to-moderate). Predictor variables included all PCA components alongside key sociodemographic characteristics (gender, age category, and educational attainment). Model adequacy was assessed using the Hosmer–Lemeshow goodness-of-fit test, while odds ratios were interpreted through Exp(B) coefficients and their 95% confidence intervals [29]. All statistical procedures were carried out with IBM SPSS Statistics for Windows, Version 25.0 (IBM Corp., Armonk, NY, USA). No cases were excluded, thereby preserving the completeness and integrity of the dataset.

3. Results

To provide background context, Table 1 summarizes the demographic characteristics of the participants, including gender, age, marital and employment status, which serve as descriptive information rather than central findings.
Table 2, Table 3, Table 4, Table 5, Table 6, Table 7, Table 8 and Table 9 present the detailed findings derived from the questionnaire, focusing on the eight key behavioral parameters related to food behavior. Each table highlights specific dimensions of eating practices, offering a structured overview of the responses and statistical outcomes. Together, these tables provide a comprehensive depiction of the behavioral constructs under investigation, thereby enabling a nuanced interpretation of how Generation Z university students in Greece engage with nutrition, emotion, identity, and sustainability in their dietary choices.
The study sample was predominantly female (73.6%), with males representing 23.8% and a small proportion (2.5%) not reporting gender. This gender distribution reflects the broader demographic trends often observed in health and nutrition research among university populations, where female students are typically more represented and more engaged in studies related to dietary behaviors and sustainability [30].
Age distribution revealed that the majority of participants were between 21 and 25 years old (57.9%), followed by younger students aged 18–20 years (31.8%). Together, these groups accounted for nearly 90% of the sample, underscoring that the study primarily captures the perspectives of Generation Z in its formative academic years. A smaller proportion of respondents were aged 26–30 (8.8%), representing older or non-traditional students who may balance different life responsibilities and thus provide additional diversity in eating behavior profiles. Missing data was minimal (1.6%) and did not affect the overall interpretation.
Regarding occupational status, most participants were exclusively students (67.9%), while nearly one third (31.6%) combined studies with employment. This distinction is particularly relevant in the context of sustainability and eating behaviors, as working students may face different time constraints, financial pressures, and food choice environments compared to their non-working peers.
Taken together, the demographic profile highlights a sample that is strongly representative of Generation Z university students in Greece, with a clear predominance of young adults under 25 years of age and a notable female majority. These characteristics provide a robust foundation for examining the interplay between taste, emotion, identity, and sustainability in eating behaviors, while also allowing for nuanced comparisons across gender, age, and occupational subgroups.
Analysis of hunger-related food behavior revealed moderate mean scores across the items, indicating that participants experienced hunger cues with some regularity but not at extreme levels (Table 2.). The highest mean value was observed for the statement “I often feel hungry” (M = 2.94), suggesting that a considerable proportion of students reported recurrent sensations of hunger. Similarly, items reflecting immediate physiological responses, such as “I often feel so hungry that I have to eat something right away” (M = 2.61) and “I often notice my stomach rumbling” (M = 2.57), demonstrated moderate endorsement, highlighting the presence of tangible hunger signals in daily life.
In contrast, items associated with more disruptive consequences of delayed meals, such as “If my meals are delayed I get light-headed” (M = 2.36) and “If I miss a meal I get irritable” (M = 2.41), yielded slightly lower mean values. This pattern suggests that while students frequently recognize and respond to hunger sensations, fewer report experiencing pronounced physical or emotional discomfort when meals are postponed.
Taken together, these findings indicate that hunger is a salient but not overwhelming driver of eating behavior among Generation Z university students. The moderate scores across all items point to a balanced profile, where hunger cues are acknowledged yet do not consistently escalate into severe physiological or emotional reactions. This nuanced pattern provides an important foundation for understanding how hunger interacts with broader determinants of food behavior, including emotion, identity, and sustainability.
The analysis of food responsiveness revealed a differentiated pattern across the items, with moderate mean values for most statements and a notably higher score for sensory-driven eating cues (Table 3.). The strongest response was observed for “When I see or smell food that I like, it makes me want to eat” (M = 3.88), indicating that external sensory stimuli exert a substantial influence on participants’ eating behavior. This finding highlights the salience of environmental triggers, such as visual and olfactory cues, in shaping food choices among university students.
In contrast, items reflecting more generalized or constant preoccupation with food, such as “I am always thinking about food” (M = 2.61) and “Given the choice, I would eat most of the time” (M = 2.74), yielded moderate values, suggesting that while food occupies a meaningful place in students’ daily lives, it does not dominate their thoughts or actions. Similarly, the statement “I often feel hungry when I am with someone who is eating” (M = 2.79) points to a moderate level of social influence, where the presence of others eating can stimulate hunger but not uniformly across the sample.
Taken together, these results suggest that food responsiveness among Generation Z university students is primarily driven by external sensory cues, rather than constant internal preoccupation or strong social triggers. This profile underscores the importance of the food environment in shaping eating behaviors, with implications for both nutritional interventions and sustainability strategies. By recognizing the role of sensory stimuli, future research and public health initiatives can better address how external factors contribute to dietary choices and potentially influence the adoption of healthier and more sustainable eating patterns.
The analysis of emotional overeating revealed moderate mean values across the items, suggesting that participants generally experience satiety cues at a relatively balanced level (Table 4.). The highest mean score was observed for “I get full up easily” (M = 3.09), followed closely by “I often get full before my meal is finished” (M = 3.00). These findings indicate that many students report reaching satiety relatively quickly, which may act as a protective factor against excessive food intake.
In contrast, lower mean values were recorded for items such as “I cannot eat a meal if I have had a snack just before” (M = 2.66) and “I often leave food on my plate at the end of a meal” (M = 2.53). These responses suggest that while satiety is acknowledged, it does not consistently translate into reduced meal consumption or food waste behaviors. The relatively modest endorsement of these items points to a nuanced relationship between emotional states, satiety, and actual eating practices.
Taken together, the pattern of results highlights that Generation Z university students in Greece demonstrate a moderate tendency toward emotional overeating, with satiety cues being recognized but not always fully regulating food intake. This profile underscores the importance of considering both physiological and emotional dimensions of eating behavior, particularly in the context of nutrition and sustainability. Understanding how satiety interacts with emotional drivers of food consumption may inform targeted interventions aimed at promoting healthier and more sustainable eating practices among young adults.
The analysis of food enjoyment revealed that negative emotional states were consistently associated with reduced food intake among participants (Table 5.). The highest mean values were observed for “I eat less when I’m worried” (M = 3.47), “I eat less when I’m anxious” (M = 3.45), and “I eat less when I’m upset” (M = 3.45), indicating that psychological distress exerts a notable influence on eating behavior. These findings suggest that worry, anxiety, and emotional upset are particularly salient factors that diminish appetite and enjoyment of food in this population.
Moderate mean values were also reported for “I eat less when I’m angry” (M = 3.32) and “I eat less when I’m annoyed” (M = 3.12). While anger and irritation appear to reduce food consumption, their impact was slightly less pronounced compared to worry and anxiety. This pattern underscores the differential effects of specific emotional states on eating behavior, with internalized emotions such as worry and anxiety exerting stronger suppressive effects on appetite than externalized emotions such as anger.
Taken together, these results highlight that Generation Z university students in Greece demonstrate a clear tendency to eat less when experiencing negative emotions, particularly those linked to psychological distress. This profile emphasizes the importance of considering emotional well-being in the study of food behavior, as reduced enjoyment of food under stress may have implications for both nutritional adequacy and long-term health. Moreover, the findings provide a valuable foundation for exploring how emotional regulation strategies and supportive food environments can promote healthier and more sustainable eating practices in young adults.
The analysis of satiety responsiveness revealed a clear inclination toward openness and enjoyment of diverse food experiences among participants (Table 6.). The highest mean value was recorded for “I am interested in tasting new food I haven’t tasted before” (M = 4.00), followed closely by “I enjoy tasting new foods” (M = 3.95) and “I enjoy a wide variety of foods” (M = 3.88). These findings highlight a strong curiosity and willingness to explore novel dietary options, suggesting that Generation Z university students in Greece demonstrate a positive orientation toward food diversity and experimentation.
In contrast, lower mean values were observed for items reflecting initial reluctance or premature judgments, such as “I refuse new foods at first” (M = 2.37) and “I often decide that I don’t like a food, before tasting it” (M = 2.73). This pattern indicates that while some hesitation exists, it is relatively limited compared to the strong endorsement of openness and enjoyment.
Taken together, the results suggest that satiety responsiveness in this cohort is characterized by a balanced but predominantly exploratory approach to food. Students appear receptive to new tastes and dietary experiences, which may facilitate the adoption of healthier and more sustainable eating practices. This openness to variety and novelty is particularly relevant in the context of nutrition and public health, as it provides opportunities for interventions that promote diverse, plant-based, and environmentally sustainable diets.
The analysis of emotional under-eating revealed consistently low mean values across all items, suggesting that negative emotional states do not typically lead to increased food consumption among participants (Table 7.). The highest scores were observed for “I eat more when I’m worried” (M = 2.34) and “I eat more when I’m anxious” (M = 2.34), though these values remain below the midpoint of the scale. Similarly, items such as “I eat more when I’m upset” (M = 2.33), “I eat more when I’m annoyed” (M = 2.26), and “I eat more when I’m angry” (M = 2.22) were endorsed at comparably low levels.
This pattern indicates that emotional distress among Generation Z university students in Greece is more likely to suppress rather than stimulate food intake. Unlike emotional overeating, where satiety cues may be overridden, emotional under-eating reflects a tendency for negative effects to diminish appetite and reduce food enjoyment. The consistently low scores across all items highlight that emotional triggers such as anger, annoyance, or worry do not substantially drive overeating behaviors in this cohort.
Taking together, these findings suggest that emotional under-eating is not a dominant behavioral pattern in this population. Instead, the data point to a more nuanced relationship between emotions and eating, where negative effect may reduce appetite but does not strongly promote compensatory increases in food intake. This distinction is important for nutritional and public health research, as it underscores the need to differentiate between emotional overeating and under-eating when designing interventions aimed at supporting healthier and more sustainable eating practices among young adults.
The analysis of food fussiness revealed consistently high mean values, indicating that participants generally expressed strong enjoyment and positive attitudes toward eating (Table 8.). The highest endorsement was observed for “I love food” (M = 4.02), followed closely by “I enjoy eating” (M = 4.00). These results suggest that food is not only a functional necessity but also a source of pleasure and satisfaction for Generation Z university students in Greece.
The item “I look forward to mealtimes” (M = 3.57) received a slightly lower, though still positive, mean score. This finding implies that while anticipation of meals is present, it may be moderated by lifestyle factors such as academic schedules, social contexts, or emotional states. Nevertheless, the overall pattern reflects a cohort that values food highly and associates it with enjoyment rather than fussiness or avoidance.
Taken together, these results highlight that food fussiness is minimal in this population, with students demonstrating a clear orientation toward food appreciation and positive engagement with eating occasions. This profile is particularly relevant in the context of nutrition and sustainability, as a strong enjoyment of food may facilitate openness to diverse dietary options, including healthier and environmentally sustainable choices. By recognizing the role of food enjoyment, interventions can build on this positive foundation to encourage balanced eating behaviors and broaden acceptance of sustainable dietary practices.
The analysis of slowness in eating revealed moderate mean values across most items, suggesting that participants display a balanced eating pace rather than a consistent tendency toward either slow or rapid consumption (Table 9.). The statements “I eat slowly” (M = 2.96) and “I often finish my meals quickly” (M = 2.96) yielded identical mean scores, indicating variability within the cohort and highlighting that eating speed is not strongly polarized in this population.
Similarly, “I am often last at finishing a meal” (M = 2.88) was endorsed at a moderate level, suggesting that while some students perceive themselves as slower eaters, this is not a dominant characteristic. The lowest mean value was observed for “I eat more and more slowly during the course of a meal” (M = 2.58), pointing to limited evidence of progressive slowing as meals progress.
Taken together, these findings suggest that Generation Z university students in Greece demonstrate a relatively neutral profile with respect to eating speed. Eating pace appears to be situational rather than habitual, with moderate scores reflecting flexibility rather than a fixed behavioral pattern. This balanced profile is relevant for nutritional and public health research, as both rapid and slow eating have been linked to satiety regulation, energy intake, and long-term health outcomes. Understanding how eating speed interacts with other behavioral parameters—such as hunger, emotional states, and food responsiveness—may provide valuable insights into strategies that promote healthier and more sustainable eating practices among young adults.
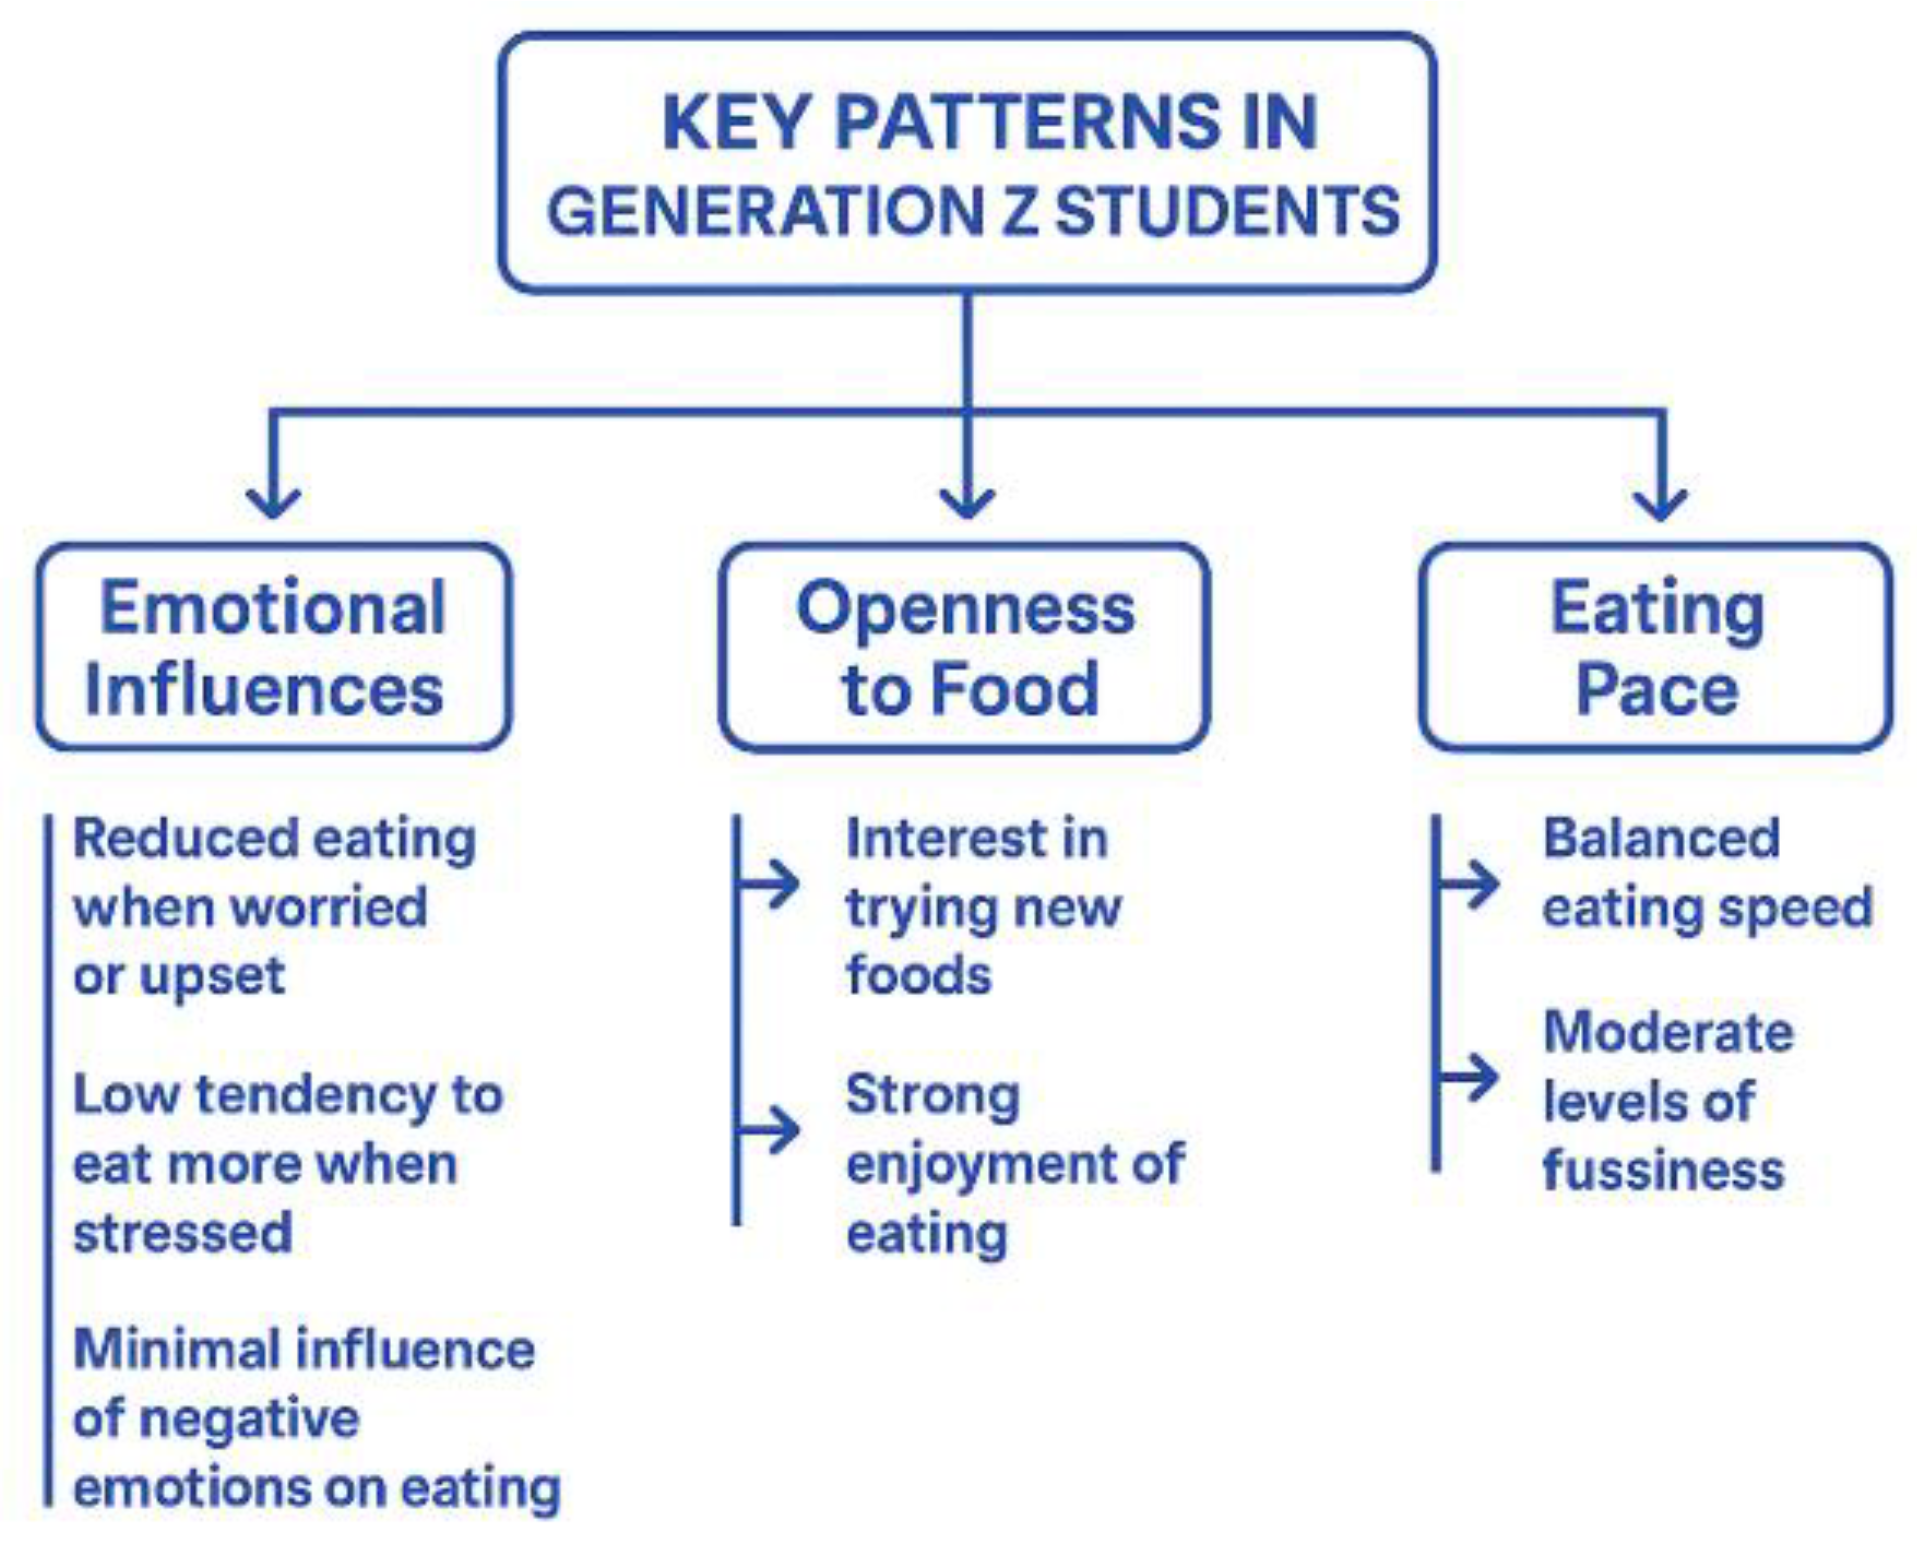
To visually consolidate the findings from Table 2, Table 3, Table 4, Table 5, Table 6, Table 7, Table 8 and Table 9, the following flow diagram (Figure 3.), presents the key behavioral trends observed among Generation Z university students in Greece. Each parameter is mapped according to its dominant pattern, offering a structured overview of how hunger, responsiveness, emotional states, satiety, and eating pace interact within the broader context of food behavior. This visualization serves as a conceptual bridge between the descriptive results and the interpretive discussion that follows.
The results of the Principal Component Analysis (PCA) are summarized in Table 10, which presents the factor loadings and communalities for all retained items. The adequacy of the data for factor analysis was confirmed by the Kaiser–Meyer–Olkin (KMO) measure of sampling adequacy (0.859) and Bartlett’s test of sphericity (χ² = 15,733.504, p < 0.001). Nine distinct components with eigenvalues greater than 1.0 were extracted using Varimax rotation with Kaiser normalization, cumulatively explaining 69.7% of the total variance. Items with loadings ≥ 0.50 were considered significant and retained in their respective components. The overall internal consistency of the scale was acceptable (Cronbach’s α = 0.698).
To facilitate interpretation of the extracted components, Table S2 in the supplementary material provides a concise mapping of all items (Q1–Q8) to their respective factors, which give a total of 9 factors. This table summarizes the questions that loaded significantly on each component and highlights the thematic content they represent. By presenting the item–factor associations in a clear format, the table complements the detailed loadings shown in Table 10 and enhances the transparency of the factor structure.
The extracted components reflect distinct dimensions of eating behavior, each capturing unique aspects of emotional, cognitive, and physiological responses to food. The following paragraphs describe the main themes represented by the nine components.
Factor description
  • Factor 1 – Emotional Under-Eating
This component reflects the tendency to eat less when experiencing negative emotions such as anxiety, upset, or anger. Strong loadings confirm that emotional distress consistently suppresses appetite, highlighting the role of affective states in reducing food intake.
  • Factor 2 – Food Neophobia vs. Food Interest
Items clustered around both reluctance and willingness to try new foods. Negative loadings captured avoidance of unfamiliar foods, while positive loadings emphasized curiosity and enjoyment of dietary variety. This bidirectional pattern illustrates individual differences in openness to novelty.
  • Factor 3 – Food Enjoyment
This factor encompassed items related to pleasure and anticipation of eating. Participants reported enjoying meals and looking forward to food, with moderate to high loads confirming that food enjoyment is a distinct and reliable dimension of eating behavior.
  • Factor 4 – Eating Pace
Items describing slow versus fast eating loaded strongly on this factor. Positive loadings reflected slow eating tendencies, while the strong negative loading for “finishing meals quickly” emphasized the inverse relationship within the same construct. This factor highlights variability in meal duration and speed.
  • Factor 5 – Emotional Over-Eating
This component captured increased food intake under emotional arousal, particularly anger and distress. High communalities support the stability of this construction, underscoring the tendency of some individuals to use food as a coping mechanism during negative emotional states.
  • Factor 6 – Satiety Responsiveness
Items reflect sensitivity to fullness and the tendency to leave food unfinished clustered together, indicating responsiveness to satiety cues. Moderate loadings suggest that satiety plays an important role in regulating meal termination and portion control.
  • Factor 7 – Hunger Sensations
This factor comprised items describing physiological hunger signals, such as stomach rumbling and urgent need to eat. These items highlight the bodily experience of hunger and its influence on eating behavior, with consistent communalities supporting the robustness of this dimension.
  • Factor 8 – Irritability and Physical Symptoms of Hunger
Items describing irritability and dizziness when meals are delayed loaded strongly. This factor isolates the emotional and physical consequences of unmet hunger, emphasizing the impact of delayed food intake on mood and physical well-being.
  • Factor 9 – Food Responsiveness
This component included items related to external food cues, such as thinking about food, eating when others eat, and responding to sensory stimuli. Although loadings were moderate, the factor contributed to the overall variance explained and highlights the influence of environmental triggers on eating behavior.
Together, these nine components provide a comprehensive framework for understanding individual differences in eating behavior. They capture both emotional regulation of food intake (under- and over-eating), cognitive and sensory responsiveness to food cues, and dispositional traits such as neophobia, enjoyment, and eating pace. Importantly, the multidimensional structure revealed by the Principal Component Analysis (PCA) reflects the eating behavior patterns of Generation Z students at the University of Ioannina, supporting the construct validity of the scale and offering valuable insights into the complex interplay between emotions, physiology, and external stimuli in shaping eating patterns within this population.
Based on the results of the PCA, the nine extracted factors were further organized into two overarching categories to facilitate interpretation of the multidimensional structure (Table 11). This grouping was informed by the thematic clustering of items and the statistical coherence observed in the rotated component matrix. Specifically, factors loading on emotional and physiological aspects of eating behavior were distinguished from those reflecting cognitive and behavioral dimensions. Together, these two categories provide a parsimonious yet comprehensive framework, cumulatively explaining 69.7% of the total variance and highlighting the dual nature of internal versus external drivers of eating.
Group analyses
Group A – Emotional and Physiological Drivers of Eating
This category encompasses factors that capture the internal regulation of food intake through both affective and physiological mechanisms. Emotional states such as anxiety, anger, or distress were found to either suppress or increase consumption, reflecting the bidirectional influence of effect on appetite. Satiety responsiveness and hunger sensations further highlight the role of physiological cues in meal initiation and termination, while irritability and dizziness when meals are delayed underscore the consequences of unmet hunger. Collectively, these components represent the internal drivers of eating behavior, with high communalities and consistent loadings confirming their statistical robustness. Importantly, these findings reflect the internal regulation patterns observed among Generation Z students at the University of Ioannina, underscoring the relevance of affective and physiological cues in this young adult cohort.
Group B – Cognitive and Behavioral Dimensions of Eating
This category reflects the cognitive and behavioral aspects of food interaction, emphasizing how attitudes, preferences, and external stimuli shape eating practices. Food neophobia versus interest captures individual differences in openness to dietary novelty, while food enjoyment highlights the anticipatory and hedonic aspects of eating. Eating pace emerged as a distinct behavioral dimension, differentiating slowly from fast eaters, and food responsiveness illustrates the impact of environmental cues such as social context and sensory stimuli. Together, these factors represent external and cognitive influences on eating, complementing the internal drivers identified in Group A and reinforcing the multidimensional nature of the construction. These external and cognitive dimensions were particularly evident in the Generation Z cohort of the University of Ioannina, highlighting how social and environmental contexts interact with individual dispositions in shaping eating behavior.
In the subsequent stage of the analysis, a cluster analysis (K-means) was performed using only the items with the highest factor loadings from the PCA (Table S2). This approach allowed the identification of distinct participant profiles based on their responses to the most discriminative questions. The items included in the clustering procedure were: Q4 [3. “I eat less when I am anxious”], Q5 [4. “I enjoy tasting new foods”], Q7 [2. “I love food”], Q8 [2. “I am often last at finishing a meal”], Q6 [5. “I eat more when I am angry”], Q3 [3. “I often leave food on my plate at the end of a meal”], Q1 [1. “I often notice my stomach rumbling”], Q4 [1. “I eat less when I’m annoyed”], and Q1 [5. “If I miss a meal I get irritable”]. The analysis yielded two clusters: the first comprising 292 participants (36.4%), and the second comprising 503 participants (52.6%). Table 12 presents the mean values of the selected items across the two clusters.
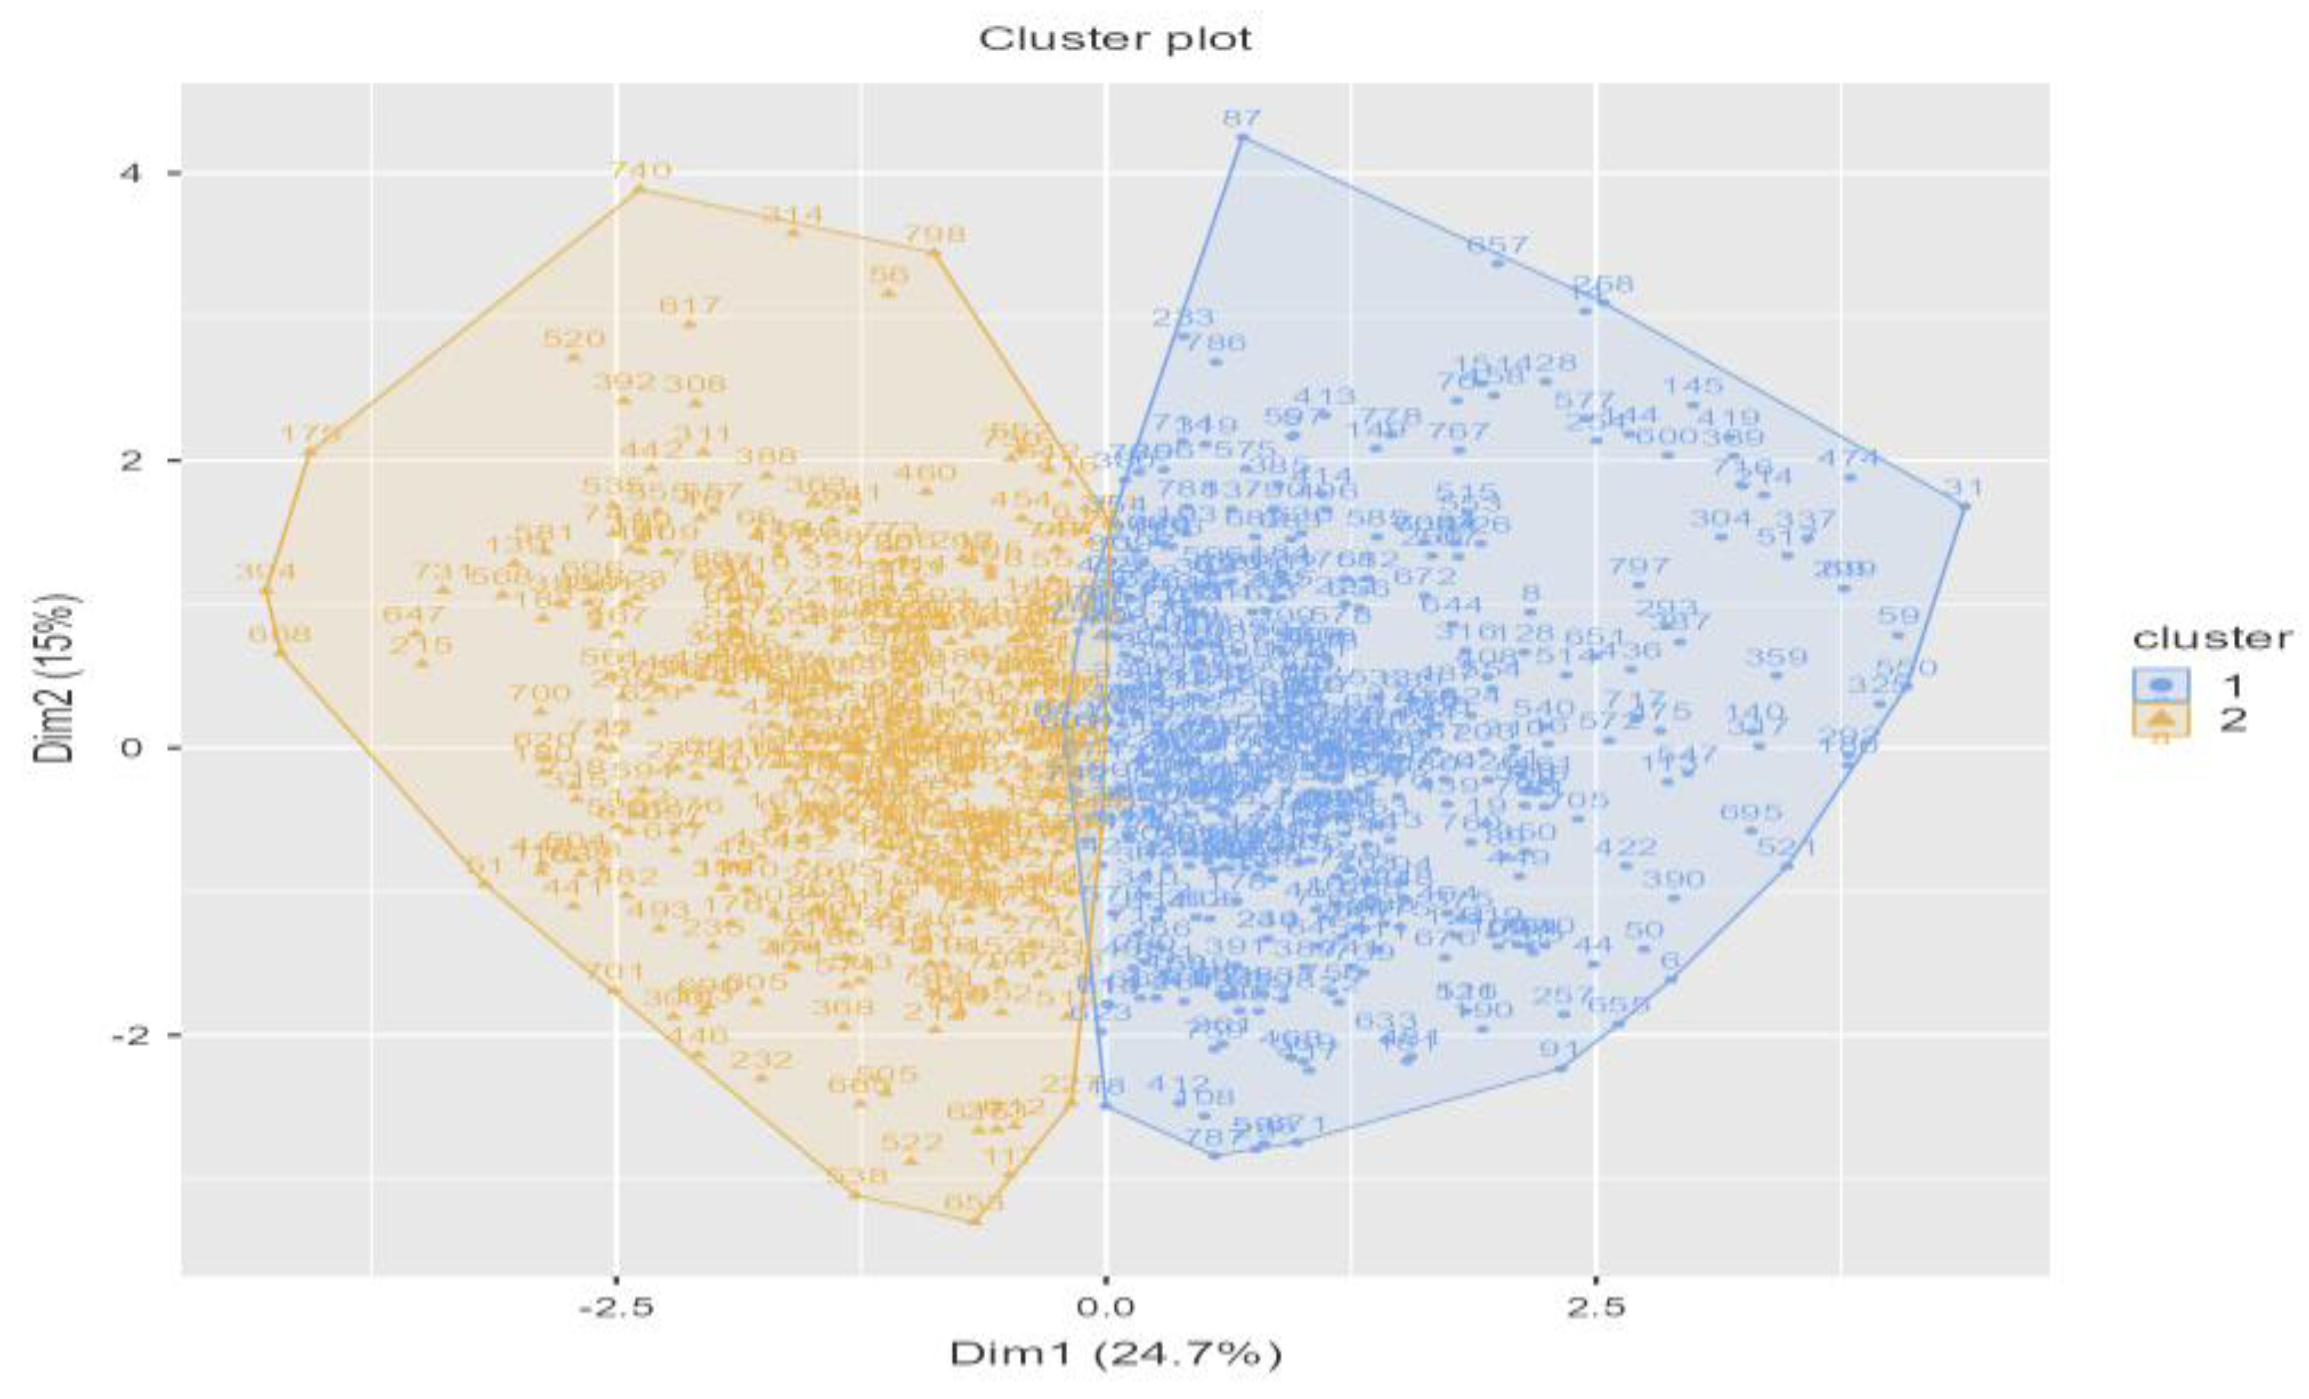
To further explore the multidimensional structure revealed by PCA, a K-means cluster analysis was performed using the most discriminative items - those with the highest factor loadings. This approach enabled the identification of distinct participant profiles based on their eating behavior patterns. The resulting clusters were visualized in a two-dimensional plot (Figure 4), offering a clear representation of the distribution and separation of individuals according to their responses. The plot illustrates the presence of two well-defined groups within the Generation Z student population at the University of Ioannina, each characterized by unique behavioral tendencies.
Cluster 1 was characterized by higher mean scores in items related to food enjoyment (Q7) and willingness to try new foods (Q5), suggesting a profile more oriented toward positive attitudes and openness toward food. This cluster also reported slightly higher sensitivity to hunger cues (Q1.1) and irritability when meals were missed (Q1.5), indicating stronger physiological responsiveness. In contrast, Cluster 2 showed relatively higher mean values in items reflecting emotional over-eating (Q6) and satiety responsiveness (Q3), suggesting a tendency toward increased food intake under negative emotions and a greater likelihood of leaving food unfinished.
Although differences between clusters were moderate, the patterns highlight meaningful distinctions in eating behavior. Specifically, Cluster 1 aligns more closely with hedonic and exploratory tendencies, whereas Cluster 2 reflects a profile shaped by emotional regulation and satiety cues. These findings underscore the heterogeneity of eating behaviors within the sample and provide further evidence for the multidimensional nature of the construct identified in the PCA.
To further substantiate these distinctions, a K-means clustering procedure was applied using the most discriminative items, those with the highest factor loadings. This analysis yielded two complementary yet differentiated participant profiles within the Generation Z student population at the University of Ioannina.
Cluster 1 – “Exploratory and Hedonic Responders”: Characterized by higher mean scores in food enjoyment and willingness to try new foods, alongside stronger sensitivity to hunger cues and irritability when meals were missed. This profile highlights openness, curiosity, and hedonic engagement with food, combined with heightened physiological responsiveness.
Cluster 2 – “Emotionally Regulated and Satiety-Oriented Responders”: Defined by relatively higher scores in emotional over-eating and satiety responsiveness, suggesting a tendency to increase food intake under negative emotions and to leave meals unfinished. This profile emphasizes the role of affective regulation and internal satiety cues in shaping eating behavior.
Together, these clusters provide a nuanced depiction of the diversity of eating patterns among young adults, complementing the multidimensional framework identified in the PCA and reinforcing the dual nature of internal versus external drivers of eating behavior.
The cluster plot visually represents (Table S3 in the appendix) the segmentation of respondents into the two distinct clusters.
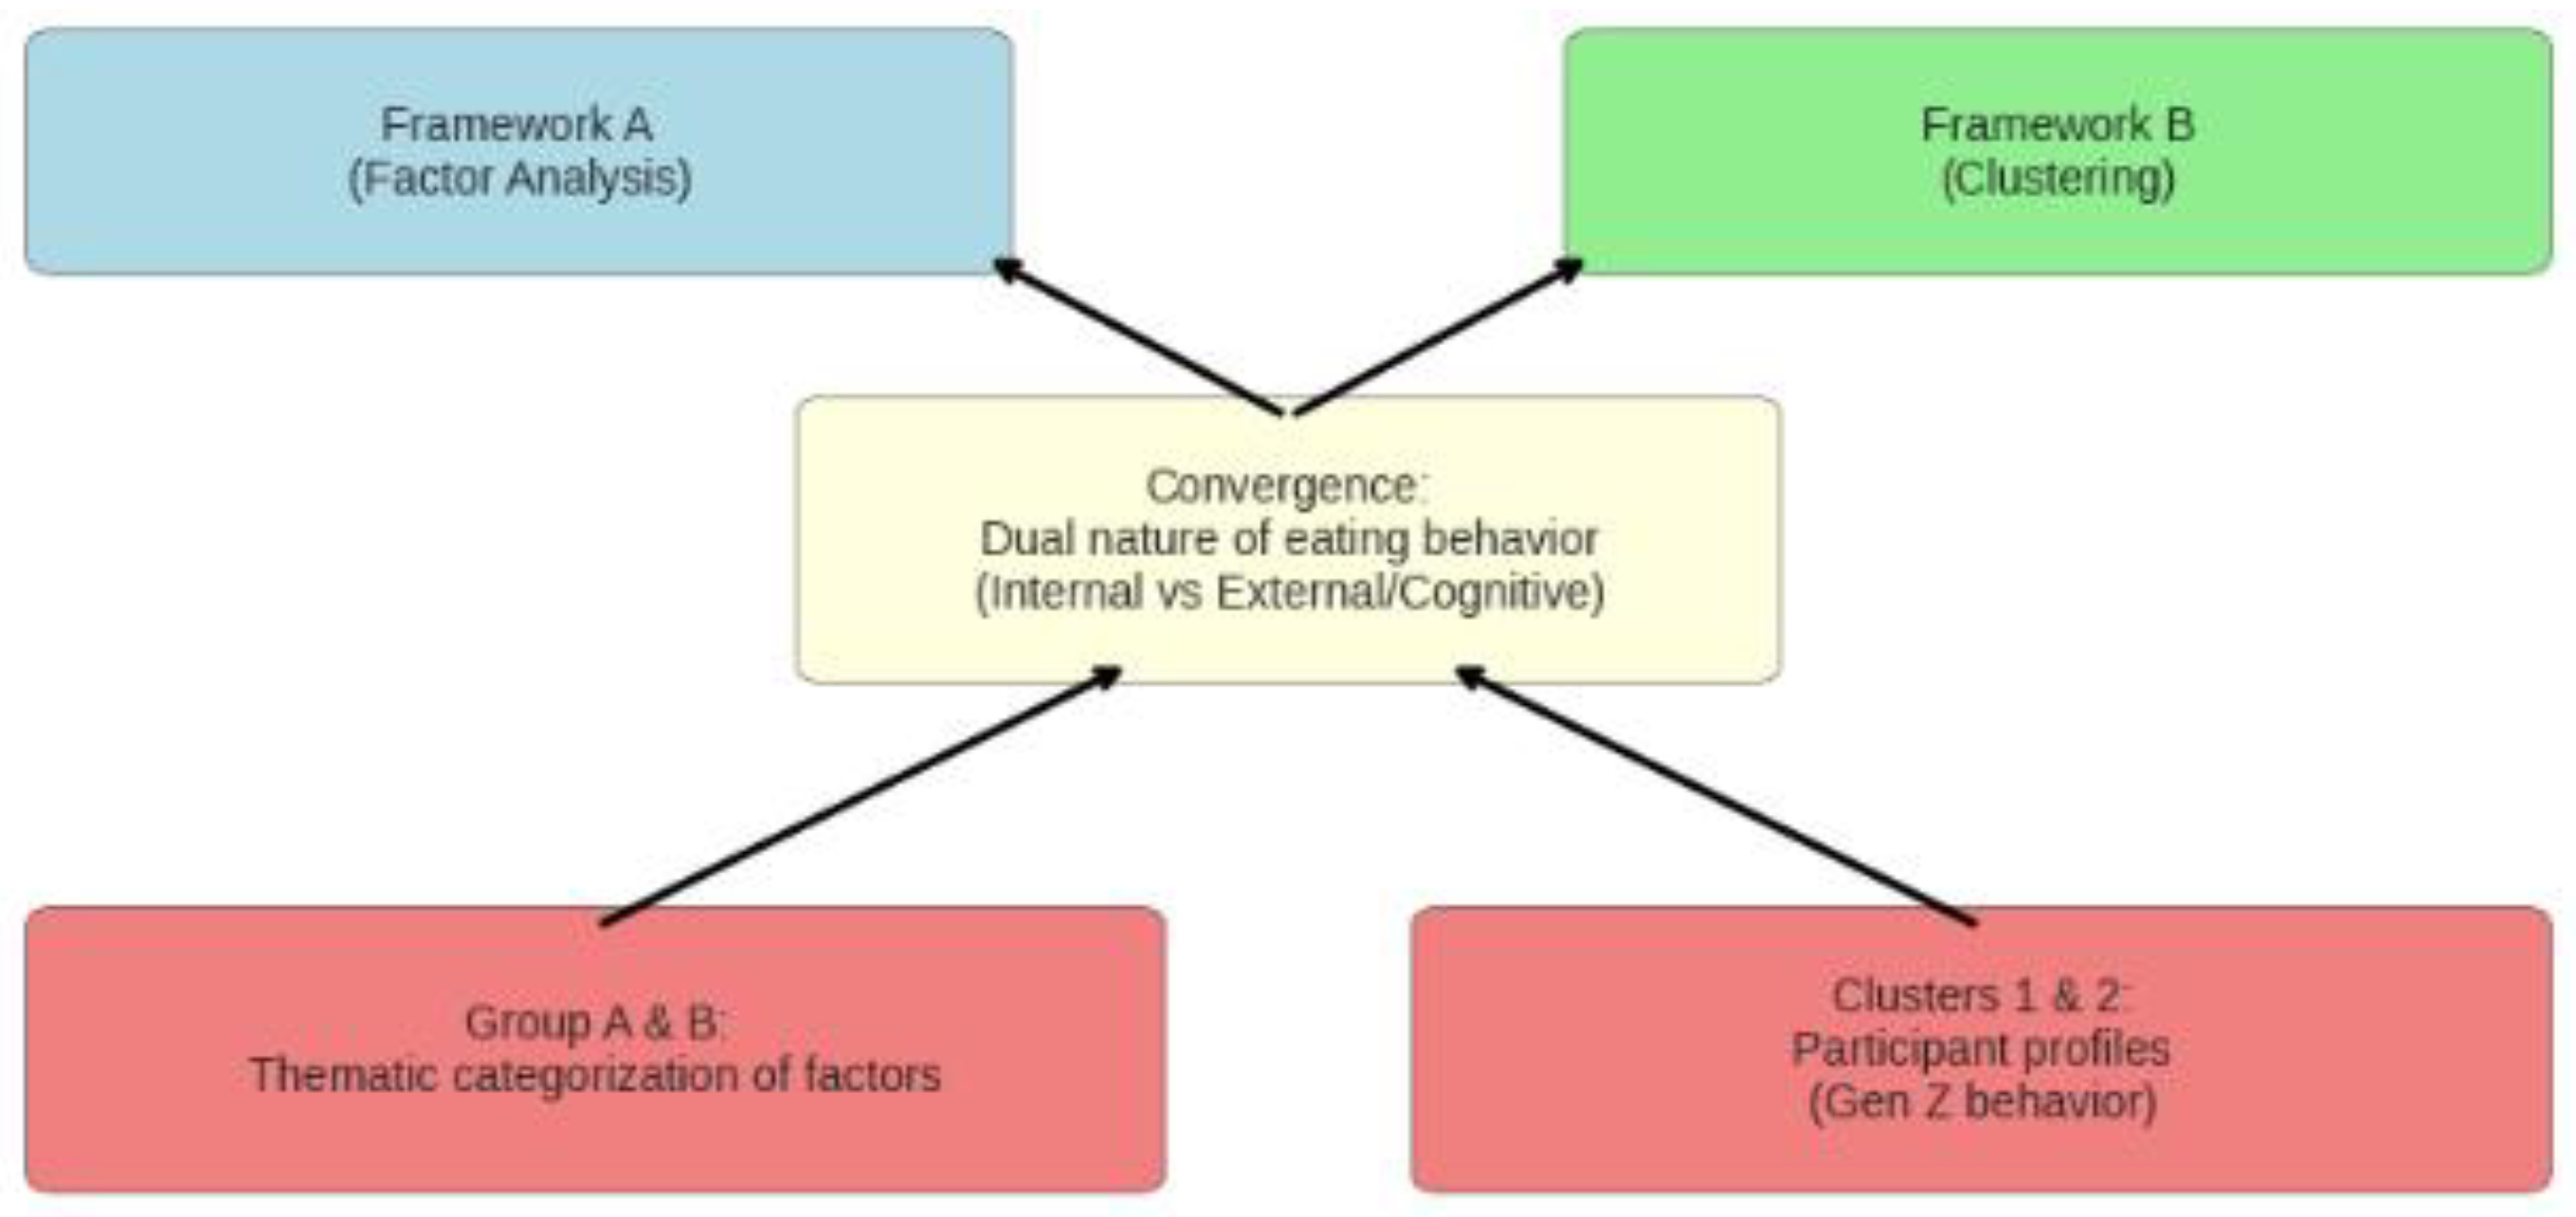
A comparative examination of the thematic grouping factors (Group A and Group B) with the participant clusters (Cluster 1 and Cluster 2) reveals important points of convergence and divergence. While the factor groups represent conceptual dimensions of eating behavior, the clusters embody lived participant profiles, thereby offering complementary perspectives on the multidimensional construct. This juxtaposition allows for a deeper understanding of how internal and external drivers of eating manifest within the Generation Z student population at the University of Ioannina, bridging theoretical categorization with empirical behavioral patterns.
Group A – Emotional and Physiological Drivers overlaps conceptually with Cluster 2, as both emphasize internal regulation through emotions, satiety, and hunger cues. Cluster 2 participants mirror the affective and physiological dimensions captured in Group A.
Group B – Cognitive and Behavioral Dimensions aligns more closely with Cluster 1, reflecting openness to novelty, enjoyment of food, and responsiveness to external cues. Cluster 1 participants embody the exploratory and hedonic tendencies highlighted in Group B.
Both frameworks underscore the dual nature of eating behavior—internal regulation versus external/cognitive influences—demonstrating consistency across methodological approaches (factor analysis vs. clustering) (Figure 5). Divergence: While Groups A and B categorize factors thematically, Clusters 1 and 2 represent actual participant profiles, showing how these dimensions manifest in lived behavior among Generation Z students (Figure 5).
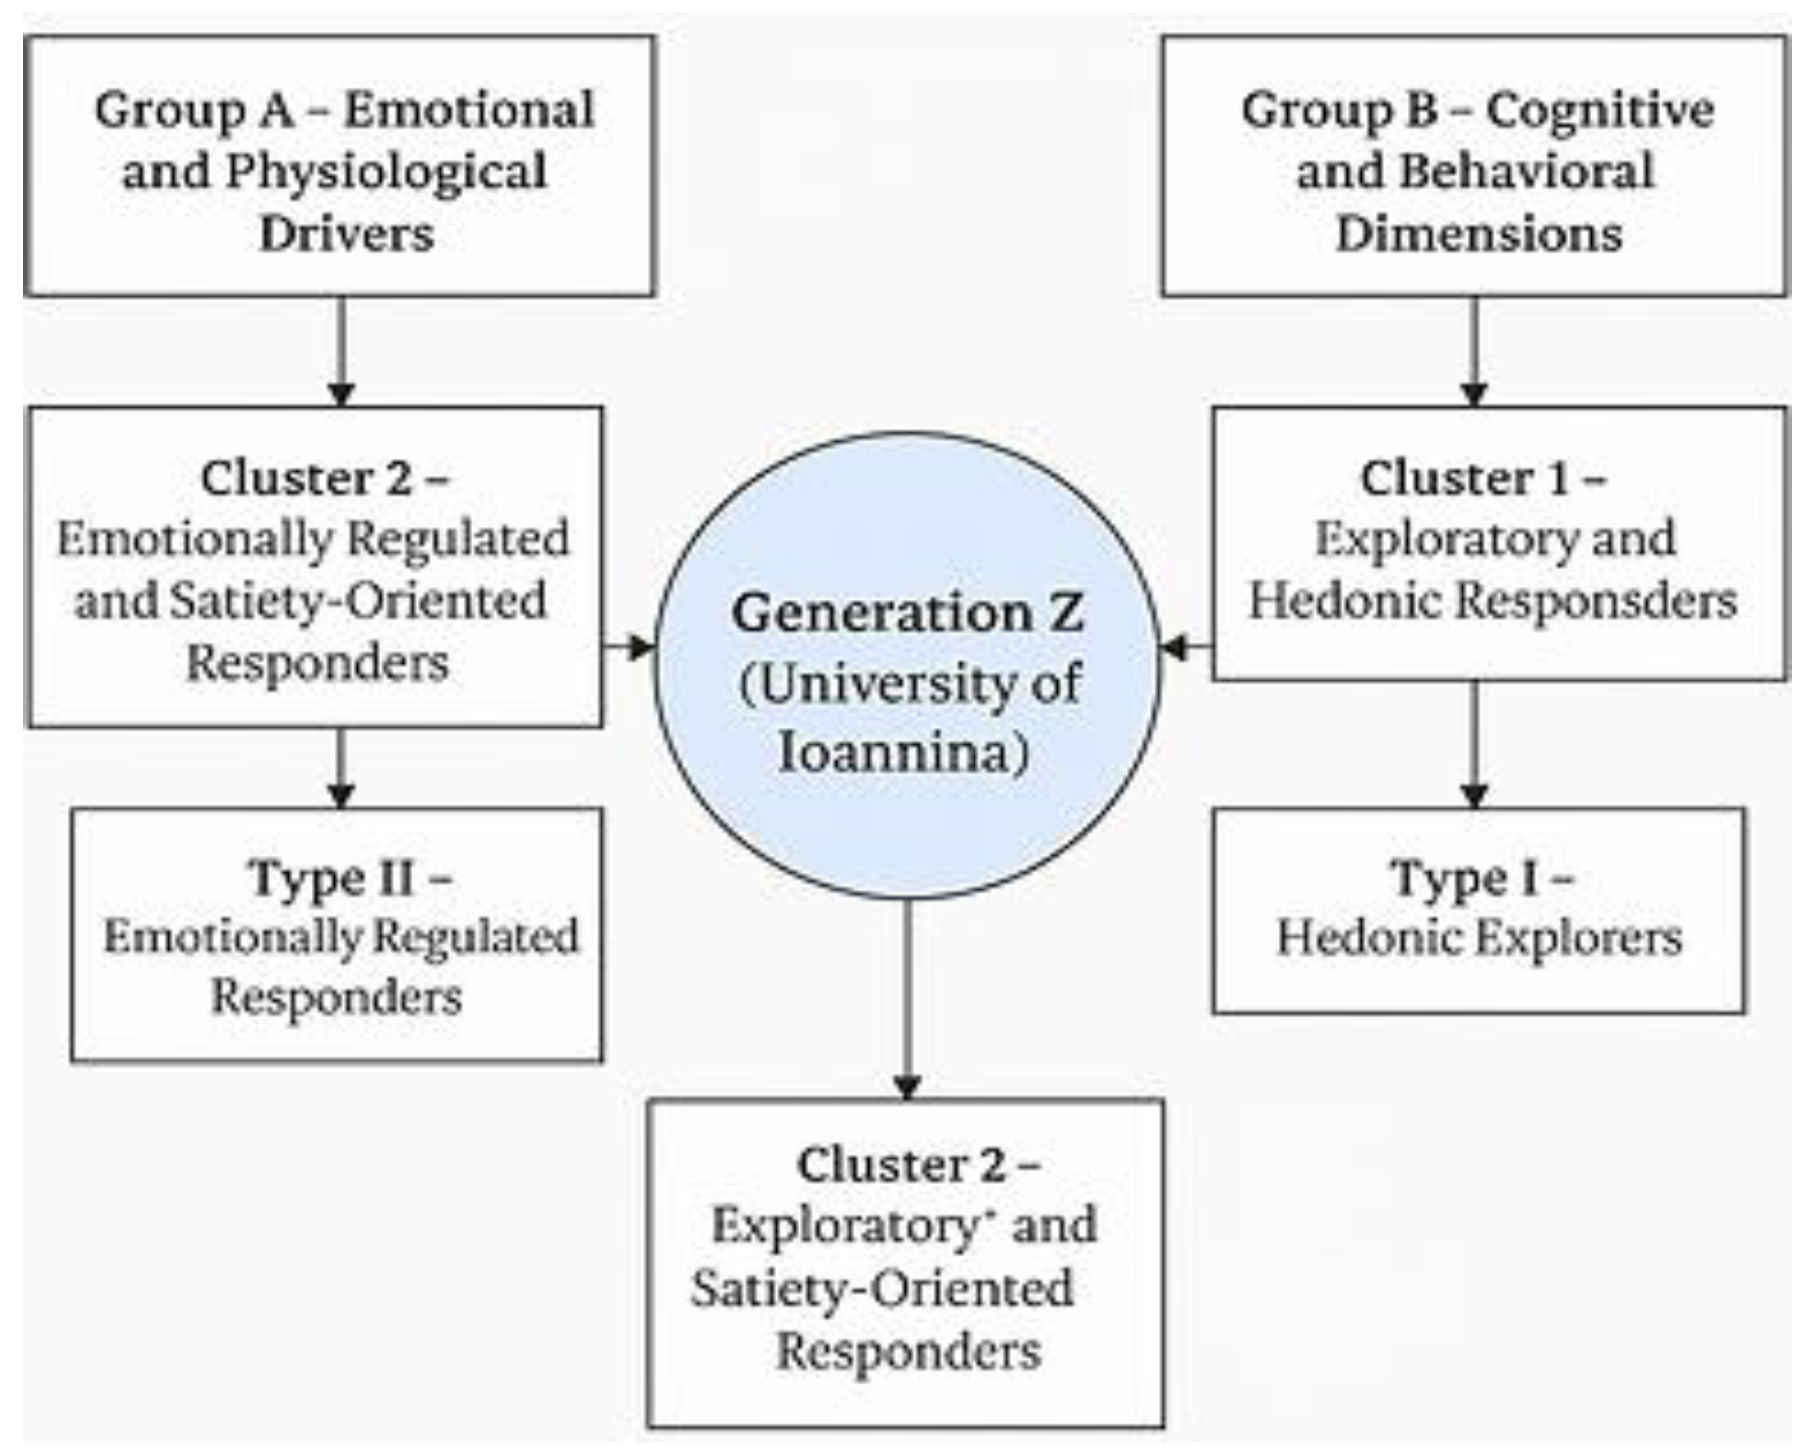
The integration of the two analytical approaches points toward a refined categorization of eating behavior within the Generation Z cohort at the University of Ioannina, offering a more comprehensive framework for interpreting their multidimensional profiles.
Type I – Hedonic Explorers (Cluster 1 + Group B): Students driven by enjoyment, curiosity, and openness to food variety, moderated by external cues.
Type II – Emotionally Regulated Responders (Cluster 2 + Group A): Students whose eating behavior is shaped by emotional states, satiety signals, and physiological sensitivity. This integrated categorization highlights the interplay of cognitive, behavioral, emotional, and physiological dimensions, offering a comprehensive framework for understanding eating behavior in this young adult cohort.
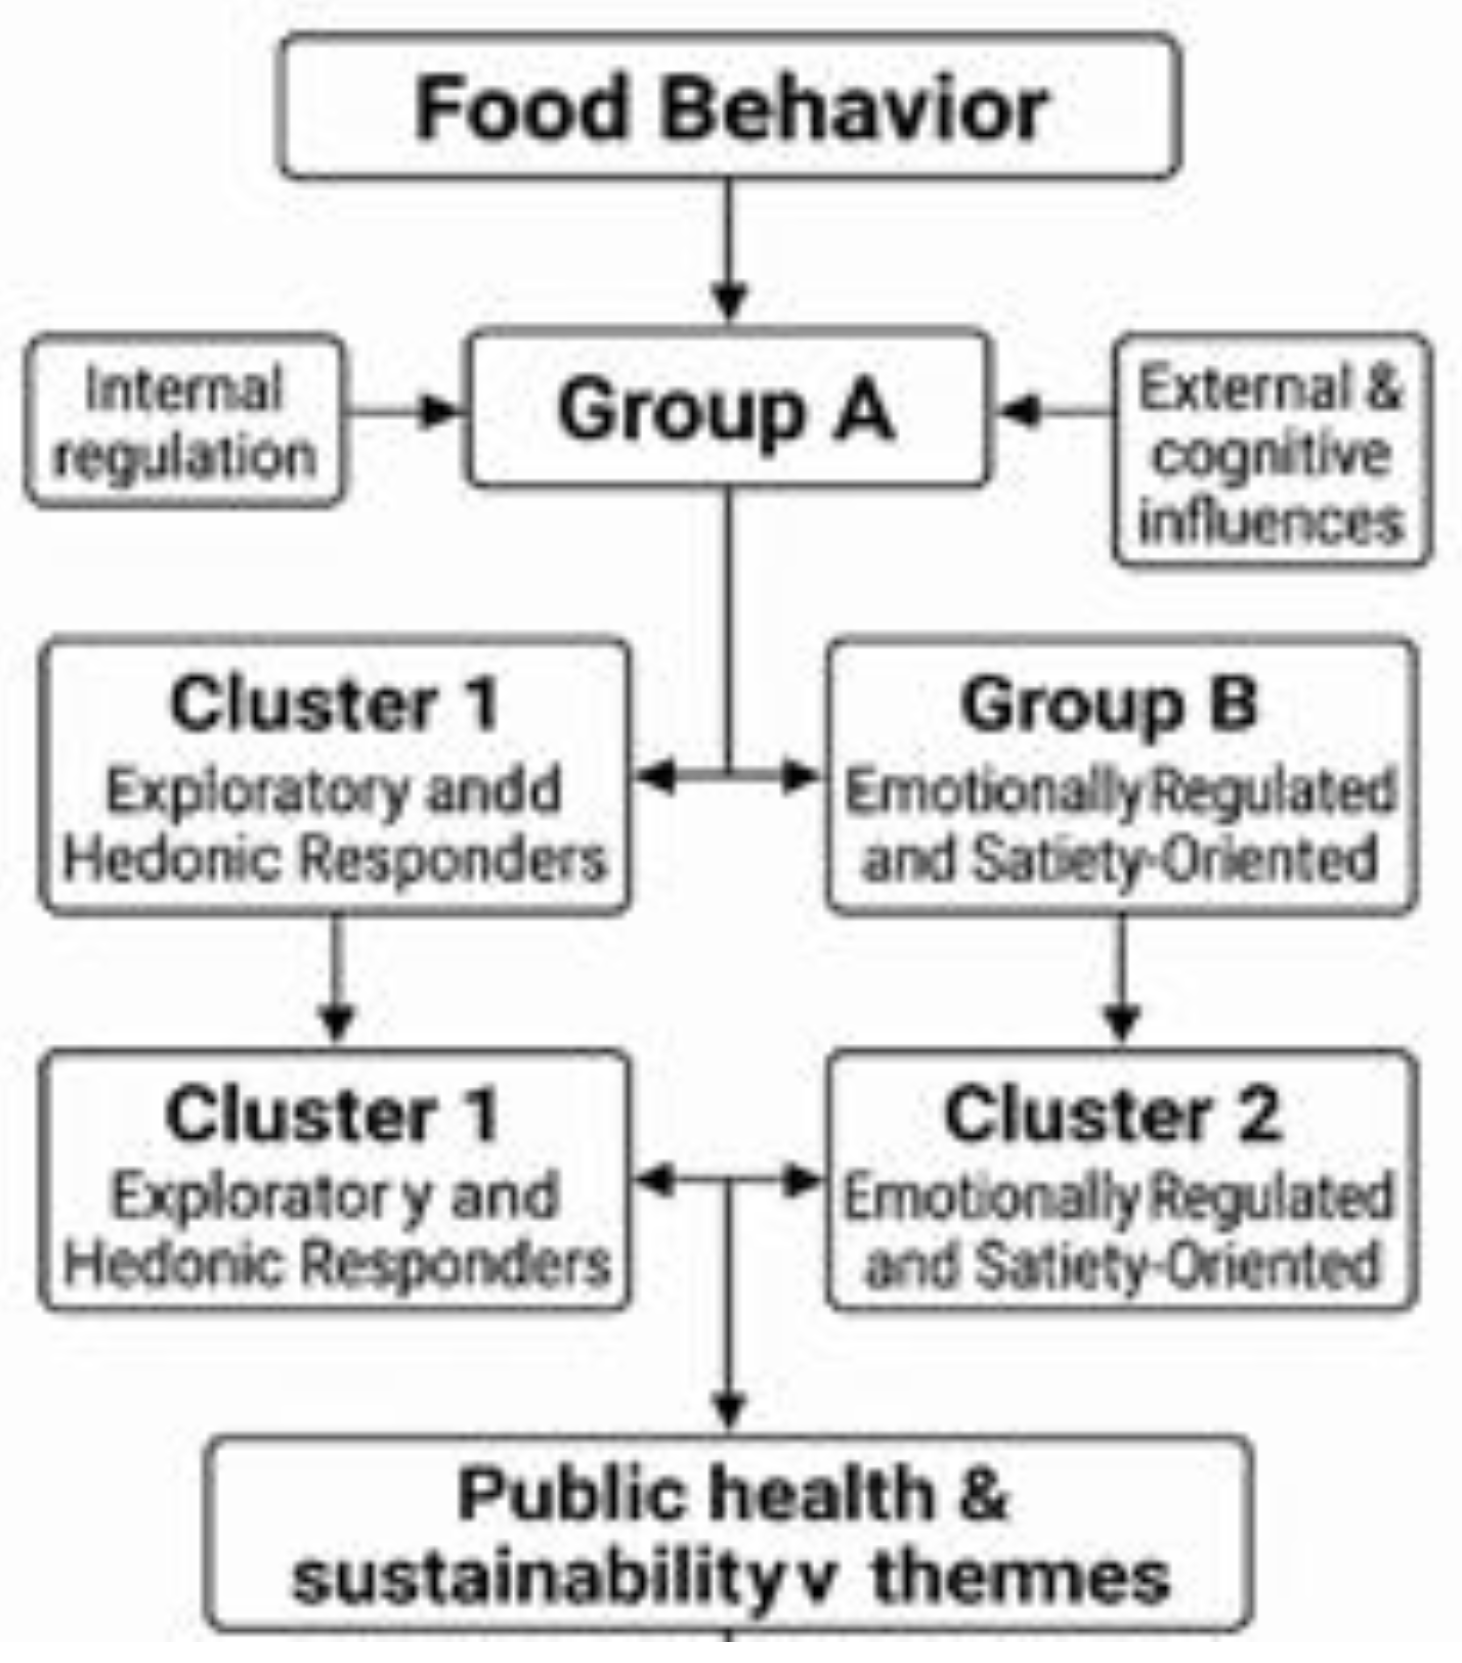
The categorizations developed thus far—encompassing thematic factor groups, participant clusters, and the refined typology—are synthesized and visually represented in the diagram below (Figure 6), illustrating their interconnections within the Generation Z cohort at the University of Ioannina.
In the final stage of the analysis, a binomial logistic regression was conducted to identify dietary attitudes that significantly predict cluster membership. All questionnaire items were initially included in the model; however, only those variables that reached statistical significance are presented here. This approach allowed the identification of specific behavioral indicators that differentiate participants between the two clusters. Table 13 summarizes the regression coefficients (B), standard errors (S.E.), Wald statistics, significance levels, and odds ratios (Exp(B)) for the significant predictors.
The logistic regression analysis highlighted several key variables that significantly contributed to the prediction of cluster membership. Negative coefficients were observed for items related to satiety responsiveness (Q3.4), hunger sensations (Q1.3), physical symptoms of hunger (Q1.4), responsiveness to social eating cues (Q2.3), and food enjoyment (Q7.1). These results indicate that higher scores on these dimensions decreased the likelihood of belonging to Cluster 2, suggesting that participants with stronger physiological and hedonic responses were more likely to be classified in Cluster 1.
Conversely, positive coefficients were found for leaving food unfinished (Q3.3) and initial reluctance toward novel foods (Q5.1), both of which increased the probability of membership in Cluster 2. This profile reflects a more restrained eating style, characterized by satiety-driven regulation and neophobic tendencies. Taken together, the regression results provide robust statistical evidence that specific emotional, physiological, and cognitive attitudes toward food are decisive in distinguishing between the two clusters, thereby reinforcing the multidimensional framework established by the PCA and cluster analyses.

4. Discussion

The present study examines eating behaviors among Generation Z university students in Greece. By situating eight validated behavioral dimensions within the lived experiences of young adults, this research provides novel insights into how emotional, sensory, and regulatory drivers interact in shaping food choices in a post-pandemic context, with particular relevance for sustainable dietary patterns. The findings highlight both convergence with established theoretical frameworks and divergence in the manifestation of behaviors across distinct student profiles.
Consistent with prior literature, the dual nature of eating behavior—internal regulation versus external and cognitive influences—was evident across methodological approaches. Factorial analysis confirmed the salience of sensory responsiveness and openness to food variety, while clustering procedures revealed how these tendencies translate into distinct participant profiles. This convergence aligns with recent evidence showing that Gen Z consumers prioritize sensory cues and sustainability considerations when making food choices [13].
The structured overview provided in Table 14 and the conceptual flow chart in Figure 7 reinforce the multidimensional nature of Generation Z food behavior, offering visual tools that future research can adopt as reference frameworks. By situating these results within broader public health and sustainability contexts, the study contributes actionable insights for designing culturally relevant wellness programs.
The coexistence of hedonic exploration and regulated satiety highlights the complexity of promoting sustainable eating among young adults. On one hand, openness to diverse cuisines and sensory curiosity may facilitate the adoption of plant-based and environmentally sustainable diets [31]. On the other, emotional suppression and reliance on satiety cues may risk nutritional imbalance if not supported by mindful eating strategies. These findings suggest that interventions must be tailored to address both impulsive and regulated tendencies, integrating emotional support with sensory-based education to foster balanced dietary practices.
By linking individual behavioral tendencies to broader public health themes, this study contributes to the design of culturally sensitive wellness programs. The identification of distinct clusters provides actionable evidence for targeted interventions: hedonic responders may benefit from strategies emphasizing moderation and awareness of external cues, while satiety-oriented responders may require support in maintaining nutritional adequacy under stress. Comparable approaches have been recommended in recent systematic reviews of post-pandemic food behavior [5,32].
Despite shared dimensions, heterogeneity was observed across six domains, with consensus limited to sensory-driven eating and openness to new foods. Cluster analysis delineated two contrasting profiles: Exploratory and Hedonic Responders, characterized by impulsive engagement with sensory cues, and Emotionally Regulated and Satiety-Oriented Responders, marked by stronger internal regulation and emotional suppression of appetite. Similar divergences have been reported in international studies, where Gen Z students balance digital immersion with emotional vulnerability in their food behaviors [33].
The integration of empirical findings with systematic review establishes a comprehensive evidence base for understanding food behavior in young adults. The continuity between the two papers demonstrates the theoretical importance and practical necessity of incorporating emotional, sensory, and regulatory dimensions into nutrition research. By bridging conceptual frameworks with lived student experiences, this study advances the discourse on sustainable eating futures and positions Generation Z as a pivotal demographic in shaping public health strategies [13,33].
A key strength of this study lies in its large sample size and use of validated instruments, which enhance the reliability of findings. The combination of factorial and cluster analyses provides methodological rigor and allows for nuanced interpretation of behavioral heterogeneity. Nevertheless, limitations include reliance on self-reported data, which may be subject to social desirability bias, and the focus on a single institutional context, which may limit generalizability. Future research should extend this framework to diverse cultural settings and longitudinal designs to capture evolving trajectories of food behavior [34].
This study demonstrates that Generation Z university students embody both hedonic curiosity and emotional regulation in their eating behaviors, reflecting the interplay of digital immersion, sustainability orientation, and emotional sensitivity. By situating these tendencies within a multidimensional framework, the research contributes empirical evidence that informs target nutritional interventions and culturally sensitive wellness programs. Ultimately, the findings reinforce the need to integrate emotional, sensory, and regulatory dimensions in advancing sustainable eating futures among young adults. To visually synthesize the convergence and divergence observed, a conceptual flow chart is presented below (Figure 8).
This diagram illustrates how internal regulation and external/cognitive influences jointly shape the construct of food behavior, which is then categorized into thematic groups and expressed through distinct participant profiles. The flow chart clarifies the directional relationships between individual behavioral tendencies and broader public health themes, reinforcing the multidimensional nature of eating behavior among Generation Z university students.

5. Conclusions

This study advances the empirical understanding of Generation Z eating behaviors by integrating emotional, sensory, and regulatory dimensions within a post-pandemic context. The findings confirm both convergence and divergence across behavioral domains, with sensory responsiveness and openness to food variety emerging as shared traits, while emotional regulation and satiety awareness delineate distinct participant profiles.
Cluster analysis identified two contrasting behavioral types—Exploratory and Hedonic Responders and Emotionally Regulated and Satiety-Oriented Responders—underscoring the heterogeneity of food behavior within this digitally immersed and emotionally sensitive generation. These profiles reflect the duality of impulse and control, curiosity and regulation, and highlight the complexity of promoting sustainable eating among young adults. Taken together, the findings demonstrate that Generation Z embodies both hedonic curiosity and emotional regulation in their eating behaviors, reflecting the interplay of digital immersion, sustainability orientation, and emotional sensitivity.
The structured overview provided (Table 16) and the conceptual flow chart (Figure 7) reinforce the multidimensional nature of Generation Z food behavior, offering visual tools that future research can adopt as reference frameworks. By situating these results within broader public health and sustainability contexts, the study contributes actionable insights for designing culturally relevant wellness programs and sustainable nutrition interventions. Taken together, the findings demonstrate that Generation Z embodies both hedonic curiosity and emotional regulation in their eating behaviors, reflecting the interplay of digital immersion, sustainability orientation, and emotional sensitivity. Cluster analysis confirmed the existence of two contrasting profiles—Exploratory and Hedonic Responders and Emotionally Regulated and Satiety-Oriented Responders—underscoring the heterogeneity of food behavior.
Ultimately, this work establishes both a conceptual and methodological foundation for subsequent investigations. The continuity between the systematic review and the present empirical study strengthens the robustness of the framework, while the inclusion of visual and tabular summaries ensures that the evidence base can serve as a point of reference for future cross-cultural comparisons, longitudinal trajectories, and policy applications. Generation Z thus emerges not only as a vulnerable demographic but also as a pivotal agent of change in advancing sustainable eating future
By situating these results within broader public health and sustainability frameworks, the study contributes actionable insights for designing culturally relevant wellness programs. The integration of behavioral regulation, emotional support, and sustainability messaging is essential for empowering Generation Z to adopt healthier and more environmentally conscious eating practices. Ultimately, the continuity between the systematic review and the present empirical study reinforces the theoretical robustness of the model and its practical relevance for advancing sustainable eating futures among young adults.

Supplementary Materials

The following supporting information can be downloaded at the website of this paper posted on Preprints.org.

Author Contributions

Conceptualization, D.S. and M.P.K.; methodology, D.S. and A.K.; validation, A.K. and Ac.K.; investigation, M.P.K.; writing—original draft preparation, M.P.K.; writing—review and editing, D.S. and A.K.; visualization, A.K.; supervision, D.S. All authors have read and agreed to the published version of the manuscript.

Funding

This research received no external funding.

Institutional Review Board Statement

No ethical approval was required for this type of study according to the GDPR (General Data Protection Regulation) of the European Union, adapted by the Greek legislation by the Law 4624/2019. Only approval by the Bureau of personal data protection of the University of Ioannina was required and obtained (27249/18-6-2024 in Greek) before the distribution of the questionnaire through Google Form, as a questionnaire with no commercial interest.

Informed Consent Statement

Not applicable based on the GDPR European Union law, adapted by the Greek law 4624/2019 for this case.

Data Availability Statement

The data presented in this study is available on request from the corresponding author.

Acknowledgments

The authors would like to thank the editor and the anonymous reviewers for their feedback and insightful comments on the original submission. All errors and omissions remain the responsibility of the authors.

Conflicts of Interest

The authors declare no conflicts of interest.

References

  1. Escrivá-Martínez, T.; Miragall, M.; Herrero, R.; Rodríguez-Arias, M.; Baños, R.M. Eating Behaviors, Eating Styles and Body Mass Index during COVID-19 Confinement in a College Sample: A Predictive Model. J Eat Disord 2022, 10. [Google Scholar] [CrossRef] [PubMed]
  2. De Pasquale, C.; Sciacca, F.; Conti, D.; Pistorio, M.L.; Hichy, Z.; Cardullo, R.L.; Di Nuovo, S. Relations Between Mood States and Eating Behavior During COVID-19 Pandemic in a Sample of Italian College Students. Front Psychol 2021, 12. [Google Scholar] [CrossRef]
  3. Ha, O.R.; Lim, S.L. The Role of Emotion in Eating Behavior and Decisions. Front Psychol 2023, 14. [Google Scholar] [CrossRef]
  4. Zaharia, A.; Gonța, I. The Healthy Eating Movement on Social Media and Its Psychological Effects on Body Image. Front Nutr 2024, 11. [Google Scholar] [CrossRef]
  5. Koliou, M.P.; Skalkos, D. Post-Pandemic Shifts in Sustainable Food Behavior: A Systematic Review of Emerging Consumer Trends. Nutrients 2025, 17, 3737. [Google Scholar] [CrossRef] [PubMed]
  6. Rodrigue, C.; Rodgers, R.F.; Carbonneau, N.; Bégin, C.; Dion, J. COVID-19-Related Distress, Body Image, and Eating Behaviors: A Cross-Sectional Explanatory Model. BMC Psychol 2024, 12. [Google Scholar] [CrossRef] [PubMed]
  7. De Pasquale, C.; Morando, M.; Platania, S.; Sciacca, F.; Hichy, Z.; Di Nuovo, S.; Quattropani, M.C. The Roles of Anxiety and Self-Esteem in the Risk of Eating Disorders and Compulsive Buying Behavior. Int J Environ Res Public Health 2022, 19. [Google Scholar] [CrossRef]
  8. Duralia, O. Food Consumption Behaviour-Influencing Factors and Trends. Studies in Business and Economics 2023, 18, 109–123. [Google Scholar] [CrossRef]
  9. Huseynov, S.; Palma, M.A. Food Decision-Making under Time Pressure. Food Qual Prefer 2021, 88. [Google Scholar] [CrossRef]
  10. Priporas, C.V.; Stylos, N.; Fotiadis, A.K. Generation Z Consumers’ Expectations of Interactions in Smart Retailing: A Future Agenda. Comput Human Behav 2017, 77, 374–381. [Google Scholar] [CrossRef]
  11. Waterhouse, P.; Samra, R. University Students’ Coping Strategies to Manage Stress: A Scoping Review. Educ Rev (Birm) 2025. [Google Scholar] [CrossRef]
  12. Forde, C.G.; de Graaf, K. Influence of Sensory Properties in Moderating Eating Behaviors and Food Intake. Front Nutr 2022, 9. [Google Scholar] [CrossRef]
  13. Halicka, E.; Kaczorowska, J.; Rejman, K.; Plichta, M. Investigating the Consumer Choices of Gen Z: A Sustainable Food System Perspective. Nutrients 2025, 17. [Google Scholar] [CrossRef]
  14. Schrempft, S.; Jiménez-Sánchez, C.; Baysson, H.; Zaballa, M.E.; Lamour, J.; Stringhini, S.; Guessous, I.; Nehme, M. Pathways Linking BMI Trajectories and Mental Health in an Adult Population-Based Cohort: Role of Emotional Eating and Body Dissatisfaction: Epidemiology and Population Health. Int J Obes 2025. [Google Scholar] [CrossRef] [PubMed]
  15. Metin, Z.E.; Bayrak, N.; Mengi Çelik, Ö.; Akkoca, M. The Relationship between Emotional Eating, Mindful Eating, and Depression in Young Adults. Food Sci Nutr 2025, 13. [Google Scholar] [CrossRef]
  16. Marinova, D.; Bogueva, D. Generation Z and Food Choices. In Food in a Planetary Emergency; Springer Nature Singapore, 2022; pp. 209–229. [Google Scholar]
  17. Sun, X.; Liu, B.; Yuan, Y.; Rong, Y.; Pang, R.; Li, Q. Neural and Hormonal Mechanisms of Appetite Regulation during Eating. Front Nutr 2025, 12. [Google Scholar] [CrossRef] [PubMed]
  18. Garutti, M.; Sirico, M.; Noto, C.; Foffano, L.; Hopkins, M.; Puglisi, F. Hallmarks of Appetite: A Comprehensive Review of Hunger, Appetite, Satiation, and Satiety. Curr Obes Rep 2025, 14. [Google Scholar] [CrossRef]
  19. Alexatou, O.; Papadopoulou, S.K.; Mentzelou, M.; Deligiannidou, G.E.; Dakanalis, A.; Giaginis, C. Exploring the Impact of Emotional Eating Among University Students: A Literature Review. Medical sciences 2025, 13. [Google Scholar] [CrossRef]
  20. Zaiser, C.; Pahlenkemper, M.; Brandt, G.; Ballero Reque, C.; Sabel, L.; Laskowski, N.M.; Paslakis, G. Feeding the Feelings: Gender Differences in Emotional Eating during COVID-19: A Systematic Review and Meta-Analysis. Front Nutr 2025, 12. [Google Scholar] [CrossRef]
  21. Shan, Y.; Wang, H.; Wang, W. Food Neophobia: Psychological Dimensions of Consumer Perception and Emotional Sentiment in Social Media Discourse. Front Nutr 2025, 12. [Google Scholar] [CrossRef]
  22. Al Sabbah, H.; Ajab, A.; Ismail, L.C.; Al Dhaheri, A.; Alblooshi, S.; Atari, S.; Polo, S.V.; Amro, M.; Qasrawi, R. The Association between Food Preferences, Eating Behavior, and Body Weight among Female University Students in the United Arab Emirates. Front Public Health 2024, 12. [Google Scholar] [CrossRef]
  23. Priede, L.; Beitane, I.; Beitane, L. A Study of Relationships Between Mental Well-Being, Sleep Quality, Eating Behavior, and BMI: A Cross-Sectional Study Among University Students. Int J Environ Res Public Health 2025, 22, 1465. [Google Scholar] [CrossRef]
  24. Barbarousis, G.; Chatzitheodoridis, F.; Kontogeorgos, A.; Skalkos, D. “Innovatives” or “Sceptics”: Views on Sustainable Food Packaging in the New Global Context by Generation Z Members of an Academic Community. Sustainability (Switzerland) 2025, 17. [Google Scholar] [CrossRef]
  25. Hair, J.F.; Black, W.C.; Babin, B.J.; Anderson, R.E. Multivariate Data Analysis. Vectors 2010, 816. [Google Scholar]
  26. Field, A. Discovering Statistics Using IBM SPSS Statistics; SAGE Publications Ltd, 2013; Vol. 58. [Google Scholar]
  27. Pallant, J., 3rd. SPSS Survival Manual; Allen & Unwin, 2005; ISBN 0335208908. [Google Scholar]
  28. Everitt, B. CLUSTER ANALYSIS 1980, Vol. 14.
  29. Scott, A.J.; Hosmer, D.W.; Lemeshow, S. Applied Logistic Regression. Biometrics 1991, 47, 1632. [Google Scholar] [CrossRef]
  30. Mastora, A.; Chatzitheodoridis, F.; Skalkos, D. Perceptions from Member-Consumers of a University Community for Sustainable and Healthy Eating: Evidence from Greece. Sustainability (Switzerland) 2024, 16. [Google Scholar] [CrossRef]
  31. Aguirre Sánchez, L.; Roa-Díaz, Z.M.; Gamba, M.; Grisotto, G.; Moreno Londoño, A.M.; Mantilla-Uribe, B.P.; Rincón Méndez, A.Y.; Ballesteros, M.; Kopp-Heim, D.; Minder, B.; et al. What Influences the Sustainable Food Consumption Behaviours of University Students? A Systematic Review. Int J Public Health 2021, 66. [Google Scholar] [CrossRef] [PubMed]
  32. Witkowiak, M.M.; Idris, A.N.; Sato, A.; Sacre, H.; Haddad, C.; Rizk, R.; Malaeb, D.; Strahler, J.; Salameh, P.; Ierodiakonou, D. Food Insecurity and Lifestyle Behaviours in University Students amidst the COVID-19 Pandemic: A Comparative Survey across Three Countries. BMC Public Health 2024, 24. [Google Scholar] [CrossRef] [PubMed]
  33. Caliskan, C.; Dedeoğlu, B.B.; Sabbağ, Ç.; Yılmaz, G.; Okumus, B. Analyzing Gen Z’s Perspectives on Anticipated Food Crises and Food Behaviors: The Significance of a Sustainability-Oriented Mindset. British Food Journal 2025, 1–22. [Google Scholar] [CrossRef]
  34. Ortaköylü, O.; Gündoğmuş, A.G.; Örsel, S. Exploring Obesity Subtypes: Cluster Analysis of Eating Behaviors, Food Addiction, and Psychopathology in Turkish Adults Seeking Obesity Treatment. Nutrients 2025, 17, 3823. [Google Scholar] [CrossRef] [PubMed]
Figure 1. Conceptual flow diagram grouping the eight behavioral factors into three overarching categories, with Generation Z at the center as the focal group.
Preprints 192333 g001
Figure 2. Overview of the institutional structure and sample selection process at the University of Ioannina.
Preprints 192333 g002
Figure 3. Flow diagram summarizing the dominant behavioral trends (Arrows show behavioral tendencies flowing outward as distinct influences and inward as integrated public health themes).
Preprints 192333 g003
Figure 4. Cluster Plot.
Preprints 192333 g004
Figure 5. Flow chart illustrates convergence and divergence between two analytical frameworks of eating behavior. Note: Arrows converge from both frameworks (factor analysis and clustering) toward the shared core—internal regulation versus external/cognitive influences—and then branch out, indicating divergence: thematic factor groups (A, B) versus empirical participant clusters (1, 2).
Preprints 192333 g005
Figure 6. Integrated framework of eating behavior among Generation Z students at the University of Ioannina. (Arrows illustrate conceptual and empirical linkages across analytical levels).
Preprints 192333 g006
Figure 7. Conceptual flow chart illustrates the behavioral profile of Generation Z. (Arrows indicate directional relationships).
Preprints 192333 g007
Figure 8. Illustrates convergence and divergence in eating behavior frameworks. (Arrows indicate directional relationships).
Preprints 192333 g008
Table 1. Sociodemographic characteristics of the sample.
Characteristics N Percentage
Gender
Male 191 23.8
Female 591 73.6
N/A 20 2.5
Age
18-20 255 31,8
21-25 465 57,9
26-30 71 8,8
Missing 13 1,6
Working or not
Exclusively Student 545 67.9
Working Student 254 31.6
Table 2. Hunger (Q1).
Question Code Hunger Mean Value*
Q1.1 I often notice my stomach rumbling 2.57
Q1.2 I often feel so hungry that I have to eat something right away. 2.61
Q1.3 I often feel hungry 2.94
Q1.4 If my meals are delayed, I get light-headed 2.36
Q1.5 If I miss a meal, I get irritable 2.41
*Note: Values range from one to five.
Table 3. Food Responsiveness (Q2).
Question Code Food Responsiveness Mean Value*
Q2.1 I am always thinking about food 2.61
Q2.2 Given the choice, I would eat most of the time 2.74
Q2.3 I often feel hungry when I am with someone who is eating 2.79
Q2.4 When I see or smell food that I like, it makes me want to eat 3.88
*Note Values range from one to five.
Table 4. Emotional Overeating (Q3).
Question Code Emotional Overeating Mean Value*
Q3.1 I get full up easily 3.09
Q3.2 I cannot eat a meal if I have had a snack just before 2.66
Q3.3 I often leave food on my plate at the end of a meal 2.53
Q3.4 I often get full before my meal is finished 3.00
*Note Values range from one to five.
Table 5. Enjoyment of Food (Q4).
Question Code Enjoyment of Food Mean Value*
Q4.1 I eat less when I’m annoyed 3.12
Q4.2 I eat less when I’m worried 3.47
Q4.3 I eat less when I’m anxious 3.45
Q4.4 I eat less when I’m upset 3.45
Q4.5 I eat less when I’m angry 3.32
*Note Values range from one to five.
Table 6. Satiety Responsiveness (Q5).
Question Code Satiety Responsiveness Mean Value*
Q5.1 I refuse new foods at first 2.37
Q5.2 I am interested in tasting new food I haven’t tasted before 4.00
Q5.3 I often decide that I don’t like a food, before tasting it 2.73
Q5.4 I enjoy tasting new foods 3.95
Q5.5 I enjoy a wide variety of foods 3.88
*Note Values range from one to five.
Table 7. Emotional Under-Eating (Q6).
Question Code Emotional Under-Eating Mean Value*
Q6.1 I eat more when I’m upset 2.33
Q6.2 I eat more when I’m worried 2.34
Q6.3 I eat more when I’m anxious 2.34
Q6.4 I eat more when I’m annoyed 2.26
Q6.5 I eat more when I’m angry 2.22
*Note Values range from one to five.
Table 8. Food Fussiness (Q7).
Question Code Food Fussiness Mean Value*
Q7.1 I enjoy eating 4.00
Q7.2 I love food 4.02
Q7.3 I look forward to mealtimes 3.57
*Note Values range from one to five.
Table 9. Slowness in Eating (Q8).
Question Code Slowness in Eating Mean Value*
Q8.1 I eat slowly 2.96
Q8.2 I am often last at finishing a meal 2.88
Q8.3 I often finish my meals quickly 2.96
Q8.4 I eat more and more slowly during the course of a meal 2.58
*Note Values range from one to five.
Table 10. Factor–Item Mapping Table.
Factor Items (Q) Description
Factor 1- Emotional Under-Eating Q4.1, Q4.2, Q4.3, Q4.4, Q4.5 Eating less when anxious, upset, or angry
Factor 2- Food Neophobia vs. Food Interest Q5.1, Q5.2, Q5.3, Q5.4, Q5.5 Reluctance vs. willingness to try new foods
Factor 3- Food Enjoyment Q7.1, Q7.2, Q7.3 Pleasure and anticipation of eating
Factor 4- Eating Pace Q8.1, Q8.2, Q8.3, Q8.4 Slow vs. fast eating tendencies
Factor 5- Emotional Over- Eating Q6.1, Q6.4, Q6.5 Increased food intake under anger or distress
Factor 6- Satiety Responsiveness Q3.1, Q3.2, Q3.3, Q3.4 Sensitivity to fullness and meal termination
Factor 7- Hunger Sensations Q1.1, Q1.2, Q1.3 Physiological hunger signals
Factor 8- Irritability & Physical Symptoms of Hunger Q1.4, Q1.5 Irritability and dizziness when meals are delayed
Factor 9- Food Responsiveness Q2.1, Q2.2, Q2.3, Q2.4 Responsiveness to external food cues
Table 11. Dual framework of eating behavior among Generation Z students at the University of Ioannina.
Group Factors included Description
A-Emotional and Physiological Drivers of Eating Factor 1, Factor 5, Factor 6, Factor 7, Factor 8 Internal regulation of food intake shaped by emotions, hunger cues, and satiety signals
B-Cognitive and Behavioral Dimensions of Eating Factor 2, Factor 3, Factor 9 Attitudes, preferences, and external cues influencing eating behavior
Table 12. Mean values in questions used in cluster analysis for the two clusters.
Question Mean Value*
Cluster 1 Cluster 2
Q4 [3. I eat less when I am anxious] 3.37 3.34
Q5 [4. I enjoy tasting new foods] 3.94 3.71
Q7 [2. I love food] 4.15 3.94
Q8 [2. I am often last at finishing a meal] 2.85 2.91
Q6 [5. I eat more when I am angry] 2.18 2.45
Q3 [3. I often leave food on my plate at the end of a meal] 2.47 2.69
Q1 [1. I often notice my stomach rumbling] 3.08 2.94
Q4 [1. I eat less when I’m annoyed] 3.10 2.98
Q1 [5. If I miss a meal I get irritable] 2.73 2.44
*Note: Values range from one to five.
Table 13. Binomial logistic regression results predicting students’ participation in clusters.
Variables Coefficient B (β) S.E. Wald statistic Wald sig. Exp(B)
Q3.4 I often get full before my meal is finished -0.305 0.099 9.539 0.002 0.737
Q1.3 I often feel hungry -0.214 0.092 5.422 0.020 0.808
Q1.4 If my meals are delayed, I get light-headed -0.183 0.069 7.112 0.008 0.833
Q2.3 I often feel hungry when I am with someone who is eating -0.160 0.080 4.017 0.045 0.852
Q3.3 I often leave food on my plate at the end of a meal 0.287 0.087 10.819 0.001 1.333
Q5.1 I refuse new foods at first 0.181 0.077 5.473 0.019 1.199
Q7.1 I enjoy eating -0.249 0.106 5.559 0.018 0.780
Constant 0.359 0.084 18.445 <.001 1.432
Note: R² = 0.324 (Nagelkerke), All predictor variables were treated as single-item Likert-type scale items, measured on a 5-point agreement scale (1 = strongly disagree, 5 = strongly agree). The odds ratios (Exp(B)) represent the change in odds of supporting sustainable packaging for each unit increase in agreement with the corresponding statement.
Table 14. Behavioral domains related to eating among Generation Z university students in Greece.
Behavioral Domain Mean Value (1-5) Key insight
Hunger 2.94 Hunger is present but not dominant; physiological cues are acknowledged moderately.
Food Responsivenss 3.88 Strong influence of sensory stimuli; visual and olfactory cues drive consumption.
Emotional Overeating 3.09 Satiety is reached quickly but emotional states may still trigger overeating.
Enjoyment of Food 3.47 Negative emotions reduce food enjoyment and intake, especially anxiety and worry
Satiety Responsiveness 3.88-4.00 High openness to new foods; strong curiosity and willingness to explore variety
Emotional Undereating 2.34 Low tendency to eat more under stress; emotional suppression of appetite is evident.
Food Fussiness 2.37-2.73 Initial reluctance exists but is outweighed by openness to novel foods.
Slowness in Eating 2.5-3.0 Faster eating under stress; reduced satiety awareness and potential metabolic impact.
Disclaimer/Publisher’s Note: The statements, opinions and data contained in all publications are solely those of the individual author(s) and contributor(s) and not of MDPI and/or the editor(s). MDPI and/or the editor(s) disclaim responsibility for any injury to people or property resulting from any ideas, methods, instructions or products referred to in the content.
Copyright: This open access article is published under a Creative Commons CC BY 4.0 license, which permit the free download, distribution, and reuse, provided that the author and preprint are cited in any reuse.
Prerpints.org logo

Preprints.org is a free preprint server supported by MDPI in Basel, Switzerland.

Subscribe

Disclaimer

Terms of Use

Privacy Policy

Privacy Settings

© 2026 MDPI (Basel, Switzerland) unless otherwise stated