
Submitted:
30 December 2025
Posted:
31 December 2025
You are already at the latest version
Abstract
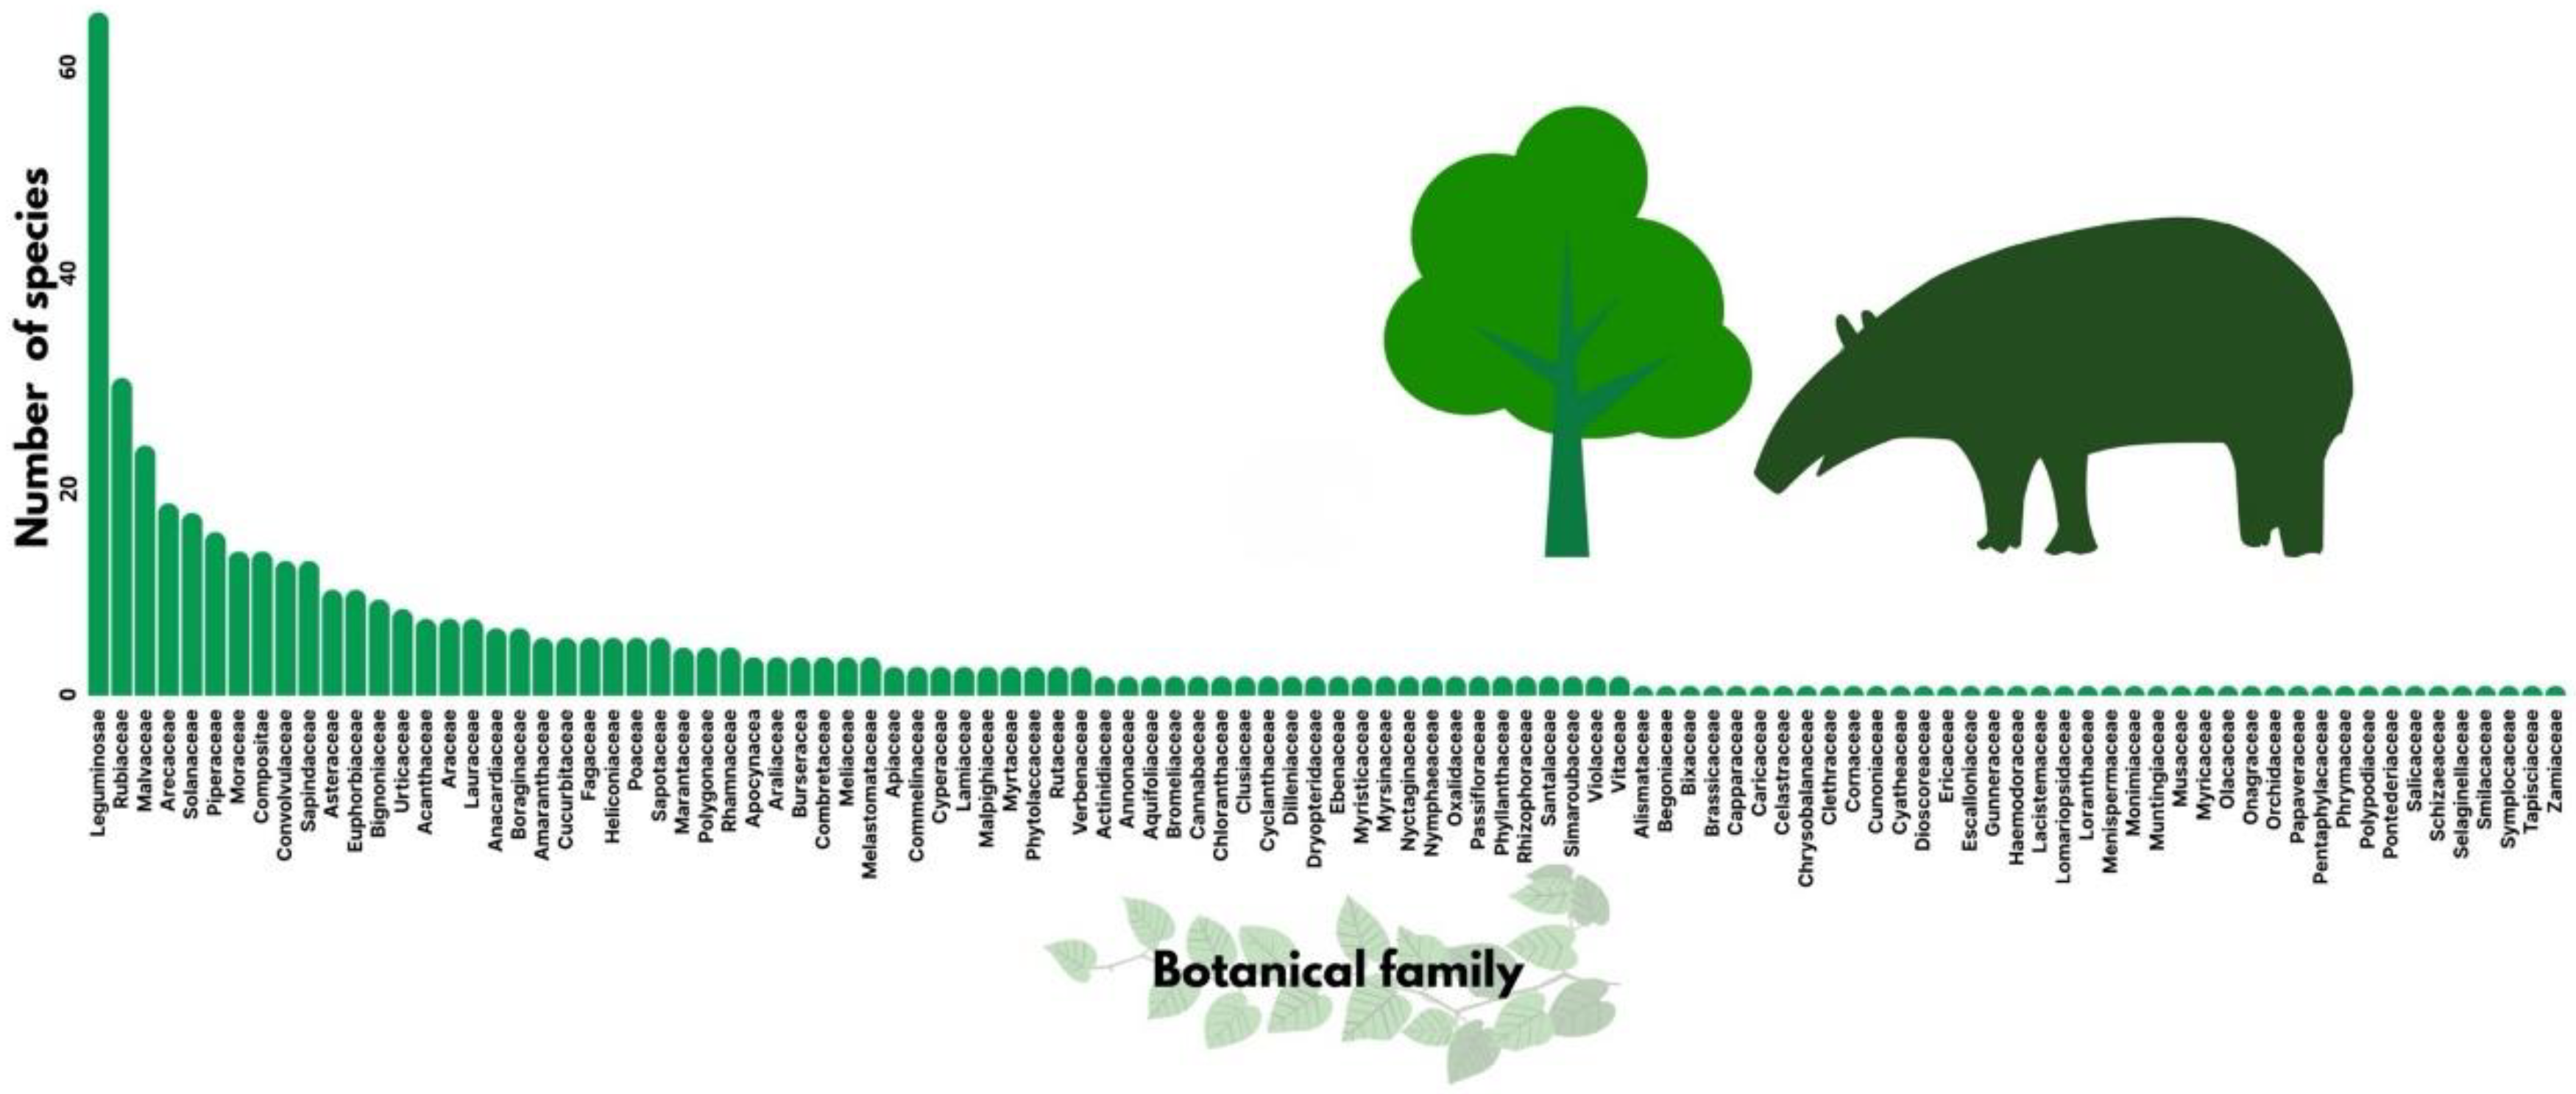
Baird’s tapir (Tapirus bairdii) plays an important ecological role in Mesoamerican forests as a browser and seed disperser, earning it the nickname of “gardener of the forest”. However, knowledge of its diet composition remains scattered. We reviewed and analyzed the available literature of diet composition of Baird’s tapir throughout its geographic distribution. We compiled evidence from 25 studies related to these topics. Baird’s tapir was found to consume 511 plant taxa belonging to 407 genera and 122 families. Five types of dietary components have been identified: fibre (stems), leaf, fruit, bark and flowers. The influence of seasonality on the tapir’s diet is unclear due to the underestimation of some components (fruit). We identified limitations in the techniques used to determine diet components and study designs. Future research should focus on develop novel techniques to improve the quantification of dietary components. Additionally, the direct and indirect effects of Baird’s tapir’s diet and plant consumption on ecosystem dynamics should be investigated to clearly understand the functional role of this species.
Keywords:
1. Introduction
2. Materials and Methods
3. Results
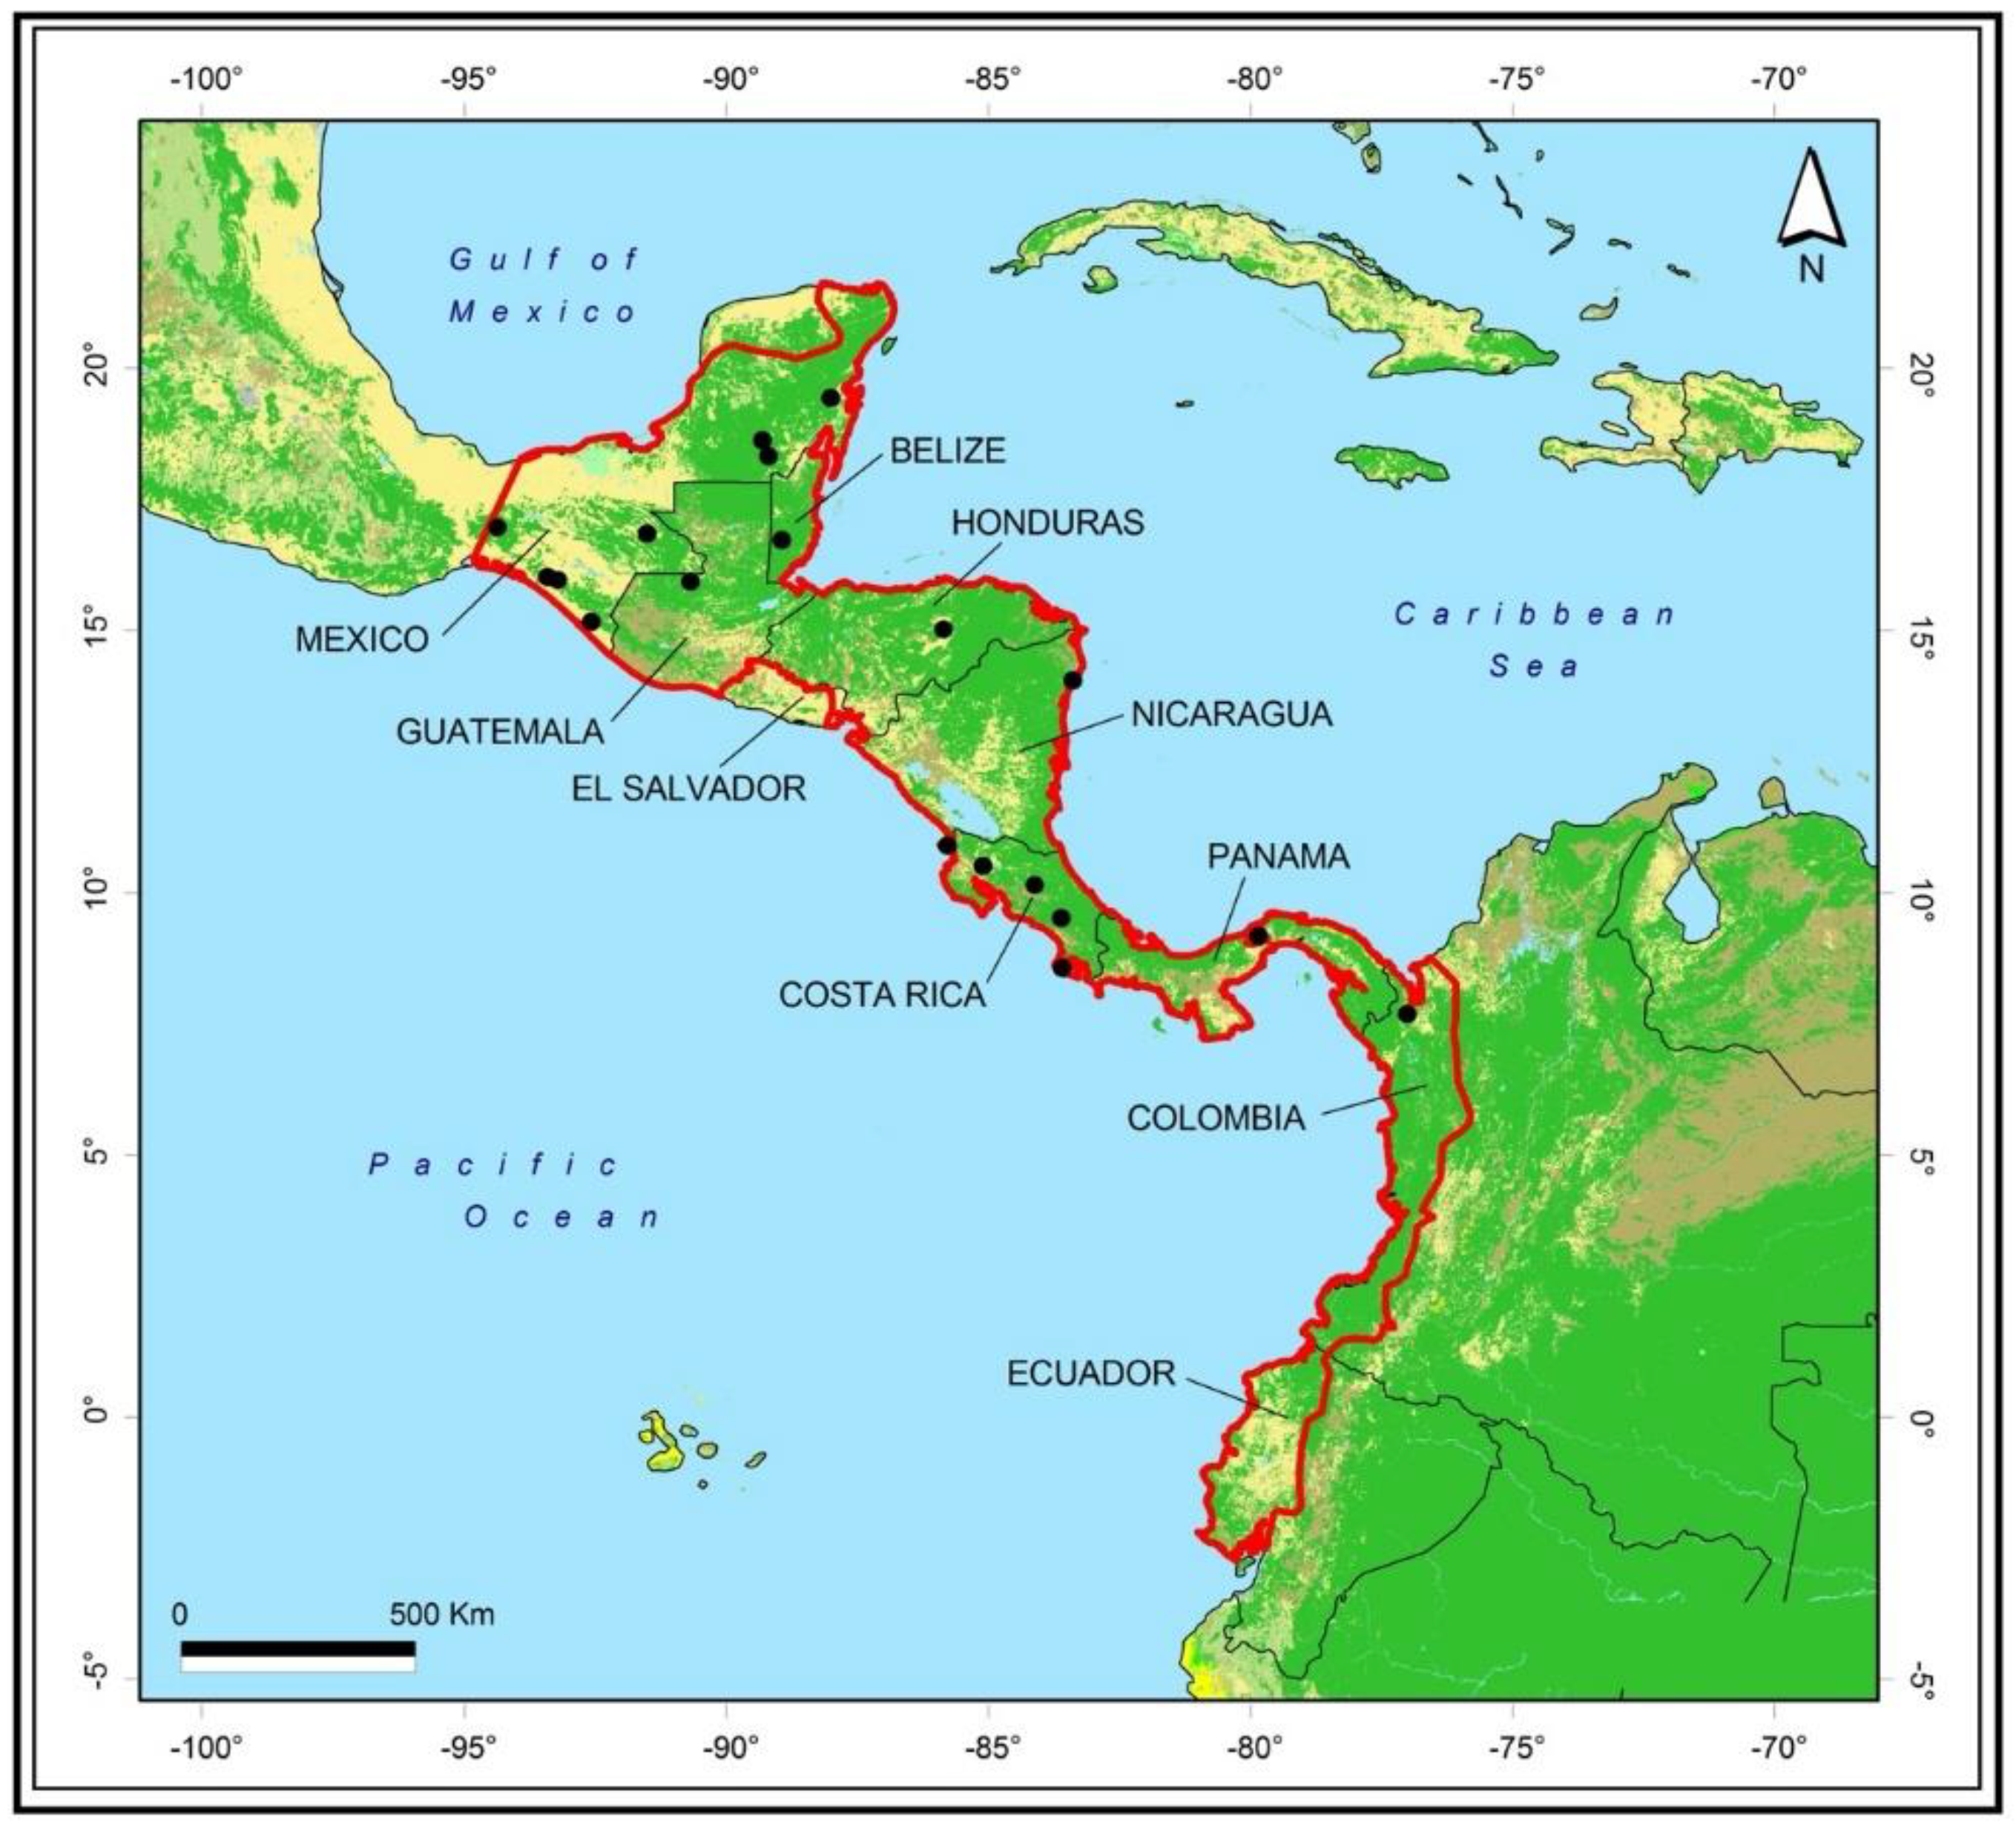
3.1. Locations
3.2. Techniques Used to Identify Plant Species Consumed
3.3. Plant Species Consumed
3.4. Techniques Used to Quantify Diet Components
3.5. Diet Composition
3.5. Influence of Seasonality on Diet
4. Discussion
4.1. Techniques Used to Identify Plant Species Consumed
4.2. Techniques Used to Quantify Diet Components
4.3. Plant Species Consumed
4.4. Diet Composition
4.5. Influence of Seasonality on Diet
5. Conclusions
Supplementary Materials
Author Contributions
Funding
Institutional Review Board Statement
Informed Consent Statement
Data Availability Statement
Acknowledgments
Conflicts of Interest
References
- Koerner, S.E; Smith, M.D.; Burkepile, D.E.; Hanan, N.P.; Avolio, M.L.; Collins, SL; Knapp, AK; Lemoine, NP; Forrestel, EJ; Eby, S; et al. Change in dominance determines herbivore effects on plant biodiversity. Nat. Ecol. Evol. 2018, 2, 1925–1932. [Google Scholar] [CrossRef]
- Hibert, F.; Taberlet, P.; Chave, J.; Scotti-Saintagne, C.; Sabatier, D.; Richard-Hansen, C. Unveiling the diet of elusive rainforest herbivores in next generation sequencing era? The tapir as a case study. PLoS ONE 2013, 8, e60799. [Google Scholar] [CrossRef]
- Ripple, W.J.; Chapron, G.; López-Bao, J.V.; Durant, S.M.; Macdonald, D.W.; Lindsey, P.A.; Bennett, E.L; Beschta, R.L.; Bruskotter, J.T.; Campos-Arceiz, A; et al. Saving the world’s terrestrial megafauna. BioScience 2016, 66, 807–812. [Google Scholar] [CrossRef]
- Vallentine, J.F. Grazing management; Academic Press: San Diego, USA, 1990. [Google Scholar]
- Harrison, K.A.; Bardgett, R.D. Impacts of grazing and browsing by large herbivores on soil and soil biological properties. In The Ecology of Browsing and Grazing. Ecological Studies; Gordon, I.J., Prins, H.H.T., Eds.; Springer: Berlin, Germany, 2008; Volume 195, pp. 201–216. [Google Scholar]
- De Vos, A. Ecological conditions affecting the production of wild herbivorous mammals on grasslands. In Advance in ecological research; Cragg, J.B., Ed.; Academic Press: London, England, 1969; Volume 6, pp. 137–183. [Google Scholar]
- McNaughton, S.J.; Georgiadis, N.J. Ecology of African grazing and browsing mammals. Annu. Rev. Ecol. Syst. 1986, 16, 39–66. [Google Scholar] [CrossRef]
- Langer, P. The mammalian herbivore stomach: comparative anatomy, function and evolution; Gustav Fischer Verlag: New York, USA, 1988. [Google Scholar]
- Belovsky, G.E. Optimal foraging and community structure: The allometry of herbivore food selection and competition. Evol. Ecol. 1997, 11, 641–672. [Google Scholar] [CrossRef]
- Kelly, J.F. Stable isotopes of carbon and nitrogen in the study of avian and mammalian trophic ecology. Can. J. Zool. 2000, 78, 1–27. [Google Scholar] [CrossRef]
- Litvaitis, J.A. Investigating food habits of terrestrial vertebrates. In Research Techniques in Animal Ecology: Controversies and Consequences; Boitani, L., Fullere, T.K., Eds.; Columbia University Press: New York, USA, 2000; pp. 165–190. [Google Scholar]
- MacFadden, B.J. Cenozoic mammalian herbivores from the Americas: Reconstructing ancient diets and terrestrial communities. Annu. Rev. Ecol. Evol. Syst. 2000, 31, 33–59. [Google Scholar] [CrossRef]
- Villar, N.; Medici, E.P. Large wild herbivores slow down the rapid decline of plant diversity in a tropical forest biodiversity hotspot. J. App. Ecol. 2021, 58, 2361–2370. [Google Scholar] [CrossRef]
- O’Farrill, G.; Galetti, M.; Campos-Arceiz, A. Frugivory and seed dispersal by tapirs: an insight on their ecological role. Integr. Zool. 2013, 8, 4–17. [Google Scholar] [CrossRef] [PubMed]
- Paolucci, L.N.; Pereira, R.L.; Rattis, L.; Silvério, D.V.; Marques, N.C.S.; Macedo, M.N.; Brando, P.M. Lowland tapirs facilitate seed dispersal in degraded Amazonian forests. Biotropica 2019, 51, 245–252. [Google Scholar] [CrossRef]
- Nowak, R.M. Walker’s mammals of the world, 6th ed.; Johns Hopkins University Press: Baltimore, USA, 1999. [Google Scholar]
- Fragoso, J.M.V.; Huffman, J. Seed-dispersal and seedling recruitment patterns by the last Neotropical megafaunal element in Amazonia, the tapir. J. Trop. Ecol. 2000, 16, 369–385. [Google Scholar] [CrossRef]
- Cordeiro, J.L.P; Fragoso, J.M.V; Crawshaw, D.; Oliveira, L.F.B. Lowland tapir distribution and habitat loss in South America. PeerJ 2016, 4, e2456. [Google Scholar] [CrossRef]
- Yanez-Montalvo, A.; Gaona, O.; de León-Lorenzana, A.; Águila, B.; Falcón, L.; Neri-Barrios, C.X.; Pérez-Flores, J. What can tapir poop teach us about healthy forests? Front. Young Minds 2023, 11, 947799. [Google Scholar] [CrossRef]
- García, M.; Jordan, C.; O’Farrill, G.; Meyer, N.; Estrada, N.; Leonardo, R.; Naranjo, E.; Simons, Á.; Herrera, A; et al. Tapirus bairdii. The IUCN Red List of Threatened Species 2016, eT214471A45173340. [Google Scholar] [CrossRef]
- Myers, N.; Mittermeier, R.A.; Mittermeier, C.G.; da Fonseca, G.A.; Kent, J. Biodiversity hotspots for conservation priorities. Nature 2000, 403, 853–358. [Google Scholar] [CrossRef] [PubMed]
- de Albuquerque, F.S.; Benito, B.; Beier, P.; Assunção-Albuquerque, M.J.; Cayuela, L. Supporting underrepresented forests in Mesoamerica. Nat. Conserv. 2015, 13, 152–158. [Google Scholar] [CrossRef]
- Reyna-Hurtado, R.; Sanvicente-López, M.; Pérez-Flores, J.; Carrillo-Reyna, N.; Calmé, S. Insights into the multiannual home range of a Baird’s tapir (Tapirus bairdii) in the Maya Forest. Therya 2016, 7, 271–276. [Google Scholar] [CrossRef]
- Yanez-Montalvo, A.; Gaona, O.; Águila, B.; Arias-Domínguez, N.; Falcón, L.I.; Pérez-Flores, J. Tapirus bairdii-associated fecal microbiome from a critical conservation area: Calakmul, México. Curr. Microbiol. 2021, 78, 2648–2659. [Google Scholar] [CrossRef] [PubMed]
- Foerster, C.R.; Vaughan, C. Home range, habitat use, and activity of Baird’s tapir in Costa Rica. Biotropica 2002, 34, 423–437. [Google Scholar] [CrossRef]
- Pérez-Flores, J.; Weissenberger, H.; López-Cen, A.; Calmé, S. Environmental factors influencing the occurrence of unhealthy tapirs in the southern Yucatan Peninsula. EcoHealth 2020, 17, 359–369. [Google Scholar] [CrossRef]
- Tobler, M.W. Habitat use and diet of Baird’s Tapirs (Tapirus bairdii) in a Montane Cloud Forest of the Cordillera de Talamanca, Costa Rica. Biotropica 2002, 34, 468–474. [Google Scholar] [CrossRef]
- Tobler, M.W.; Naranjo, E.J.; Lira-Torres, I. Habitat preferences, feeding habits and conservation of Baird’s tapir in Neotropical montane oak forests. In Ecology and conservation of Neotropical montane oak forests; Kappelle, M., Ed.; Springer: Berlin, Germany; pp. 347–361.
- Foerster, C.R. Ecología de la danta Centroamericana Tapirus bairdii en un bosque húmedo tropical de Costa Rica. Master Thesis, Universidad Nacional, Heredia, Costa Rica, 1998. [Google Scholar]
- Foerster, C.R.; Vaughan, C. Diet and foraging behavior of a female Baird’s tapir (Tapirus bairdii) in a Costa Rican lowland rainforest. Cuad. Inv. UNED 2015, 7, 259–267. [Google Scholar]
- Fragoso, J.M.V. The habitat preferences and social structure of tapirs. Master Thesis, University of Toronto, Canada, 1987. [Google Scholar]
- Restrepo, H.F.; Betancourt, O. Confirmación de la presencia del tapir centroamericano (Tapirus bairdii) en Colombia, y studio preliminar sobre algunos aspectos de su historia natural en el Parque Nacional Natural Los Katíos. Tapir Conservation, The Newsletter of the IUCN/SSC Tapir Specialist Group. 2006, 15, 29–36. [Google Scholar]
- Mejía-Correa, S.; Díaz-Martínez, A.; Molina, R. Densidad y hábitos alimentarios de la danta Tapirus bairdii en el Parque Nacional Natural Los Katios, Colombia. Tapir Conservation, The Newsletter of the IUCN/SSC Tapir Specialist Group 2014, 23, 16–23. [Google Scholar]
- Williams, K.D. The central American tapir (Tapirus bairdii Gill) in northwestern Costa Rica. Doctoral Thesis, Michigan State University, Michigan, USA, 1984. [Google Scholar]
- Naranjo, E. Hábitos de alimentación del tapir (Tapirus bairdii) en un bosque tropical húmedo de Costa Rica. Vida Silv. Neotrop 1995, 4, 32–37. [Google Scholar]
- Carvajal, J.P.; Marín-Pacheco, P.; Espinoza-Chacón, A.; Rohrmoser-Steinvorth, F.; Pérez-Pérez, C. Nuevos registros de plantas comidas por el tapir, Tapirus bairdii (Perissodactyla: Tapiridae), en el Parque Nacional Braulio Carrillo, Costa Rica. Cuad. Inv. UNED 2020, 12, e2771. [Google Scholar] [CrossRef]
- García, J.M. Caracterización de la dieta y habitat del tapir (Tapirus bairdii Gill, 1865) en ecosistemas ribereños del Parque Nacional Laguna Lachuá, Cobán, AltaVerapaz, Guatemala. Bachelor Thesis, Universidad de San Carlos Guatemala, Guatemala, 2006. [Google Scholar]
- Estrada, N. Estudio del Danto (Tapirus bairdii) en el Parque Nacional Sierra de Agalta, Olancho, Honduras; International Resources Group: Washington DC, USA, 2006. [Google Scholar]
- Naranjo, E.; Cruz-Aldán, E. Ecología del tapir (Tapirus bairdii) en la Reserva de la Biosfera La Sepultura, Chiapas, México. Acta. Zool. Mex. 1998, 73, 111–125. [Google Scholar] [CrossRef]
- Cruz-Aldán, E. Hábitos alimentarios e impacto de la actividad humana sobre el tapir en la Reserva de la Biosfera La Sepultura, Chiapas, México. Master Thesis, El Colegio de la Frontera Sur, San Cristobal de las Casas, México, 2001. [Google Scholar]
- Lira-Torres, I.; Naranjo, E.; Güiris-Andrade, M.; Cruz-Aldán, E. Ecología de Tapirus bairdii (Perissodactyla: Tapiridae) en la Reserva de la Biosfera El Triunfo (Polígono I), Chiapas, México. Acta. Zool. Mex. 2004, 20, 1–21. [Google Scholar] [CrossRef]
- Jiménez.
- Rivadeneyra, E. Hábitos alimentarios del tapir (Tapirus bairdii) en el sector sur de la Reserva de la Biosfera Montes Azules. Bachelor Thesis, Universidad Autónoma de Yucatán, México, 2007. [Google Scholar]
- Reyes-Alcaraz, L. Descripción de habitat y dieta del tapir centroamericano Tapirus bairdii Gill, 1865, en el ejido La Fortaleza, Municipio Santa María Chimalapa, Oaxaca, México. Bachelor Thesis, Universidad Nacional Autónoma de México, México, 2008. [Google Scholar]
- Pérez-Cortez, S.; Matus-Pérez, E.S. El tapir Tapirus bairdii en la región sureste del Área de Protección de Flora y Fauna Bala’an Ka’ax, Quintana Roo, México. Therya 2010, 1, 137–144. [Google Scholar] [CrossRef]
- Camargo-Sanabria, A.A; Mendoza, E. Interactions between terrestrial mammals and the fruits of two neotropical rainforest tree species. Acta Oecologica 2016, 73, 45–52. [Google Scholar] [CrossRef]
- Granados-Pérez, A. Presencia de tapir (Tapirus bairdii) en el ejido La Lucha Dos, Othón Pompeyo Balnco, Quintana Roo. Bachelor Thesis, Universidad Autónoma Agraria Antonio Narro, Coahuila, México, 2017. [Google Scholar]
- Pérez-Flores, J. Estudios relacionados con la salud del tapir centroamericano (Tapirus bairdii) en el sureste de México. Doctoral Thesis, El Colegio de la Frontera Sur, Chetumal, México, 2020. [Google Scholar]
- Puc-Sánchez, J.I.; Camargo-Sanabria, A.A.; Mendoza, E. Predation of oak acorns by Baird’s tapir one of the last remnants of mountain cloud forest in Southern Mexico. Food Webs 2023, 37, e00312. [Google Scholar] [CrossRef]
- Domeiz-Dambus, J.A.; Smith-Chow, H.H.; Cordón-Suárez, E. Hábitat potencial del Danto (Tapirus bairdii) en la Costa caribe Norte de Nicaragua. Rev. Univ. Caribe 2017, 18, 66–73. [Google Scholar] [CrossRef]
- Terwilliger, V.T. Natural history of Baird’s tapir on Barro Colorado Island, Panama Canal Zone. Biotropica 1978, 10, 211–220. [Google Scholar] [CrossRef]
- Capece, P.I.; Aliaga-Rossel, E.; Jansen, P.A. Viability of small seeds found in feces of the Central American tapir on Barro Colorado Island, Panama. Int. Zool. 2013, 8, 57–62. [Google Scholar] [CrossRef]
- DeSantis, L.G. Stable istope ecology of extant tapirs from the Americas. Biotropica 2011, 43, 746–754. [Google Scholar] [CrossRef]
- Hibert, F.; Sabatier, D.; Andrivot, J.; Scotti-Saintagne, C.; Gonzalez, S.; Prévost, M-F.; Grenand, P.; Chave, J.; Caron, H.; Richard-Hansen, C. Botany, genetics and ethnobotany: A crossed investigation on the elusive tapir’s diet in French Guiana. PloS ONE 2011, 6, E25850. [Google Scholar] [CrossRef]
- Prado, H.M. Feeding ecology of five Neotropical ungulates: A critical review. Oecologia Australis 2013, 17, 459–473. [Google Scholar] [CrossRef]
- van der Reis, A.L.; Norrie, C.R.; Jeffs, A.G.; Lavery, S.D.; Carroll, E.L. Genetic and particle modelling approaches to assessing population connectivity in a deep sea lobster. Sci. Rep. 2022, 12, 16783. [Google Scholar] [CrossRef] [PubMed]
- Cruz-Cano, R.; Kolb, M.; Saldaña-Vázquez, R.A.; Bretón-Deval, L.; Cruz-Cano, N.; Aldama-Cervantes, A. Existing evidence on the use of environmental DNA as an operational method for studying rivers: a systematic map and thematic synthesis. Environ. Evid. 2024, 13, 2. [Google Scholar] [CrossRef]
- Abwe, E.E.; Morgan, B.J.; Doudja, R.; Kentatchime, F.; Mba, F.; Dadjo, A.; Venditti, D.M.; Mitchell, M.W.; Fosso, B.; Mounga, A; et al. Dietary ecology of the Nigeria-Cameroon chimpanzee (Pan troglodytes ellioti). Int. Primatol. 2020, 41, 81–104. [Google Scholar] [CrossRef]
- Yamagiwa, J.; Basabose, A.K. Diet and seasonal changes in sympatric gorillas and chimpanzees at Kahuzi–Biega National Park. Primates 2006, 47, 74–90. [Google Scholar] [CrossRef]
- McLennan, M.R. Diet and feeding ecology of chimpanzees (Pan troglodytes) in Bulindi, Uganda: Foraging Strategies at the Forest–Farm Interface. Int. J. Primatol. 2013, 34, 585–614. [Google Scholar] [CrossRef]
- Garnick, S.; Barboza, P.S.; Walker, J.W. Assessment of animal-based methods used for estimating and monitoring rangeland herbivore diet composition. Rangel. Ecol. Manag. 2018, 71, 449–457. [Google Scholar] [CrossRef]
- Wallmo, O.C., Neff, D.J. Direct observations of tamed deer to measure their consumption of natural forage. Range and wildlife habitat evaluation—a research symposium. US Department of Agriculture and Forest Service Miscellaneous Publication no. 1147: Washington DC, USA, 1970.
- Mosquera-Guerra, F.; Moreno-Niño, N.; Barreto, S.; Pascual, D.A. Habitat suitability and representation of the potential distribution of the lowland tapir (Tapirus terrestris) within land cover types and protected areas of eastern Colombia. Mamm. Res. 2024, 69, 507–518. [Google Scholar] [CrossRef]
- Simpson, B.K.; Shukor, M.N.; Magintan, D. Food selection of the Malayan tapir (Tapirus indicus) under semi-wild conditions. AIP. Conf. Proc. 2013, 1571, 317–324. [Google Scholar]
- Matola, S.; Cuaron, A.D.; Rubio-Togler, H. Status and action plan of Baird’s tapir. In Tapirs: Status Survey and Conservation Action Plan; Brooks, D.M., Bodmer, R.E., Matola, S., Eds.; IUCN/SSC Tapir Specialist Group: Cambridge, United Kingdom, 1997; pp. 29–45. [Google Scholar]
- Naranjo, E.; Vaughan, C. Ampliación del ámbito altitudinal del tapir centroamericano (Tapirus bairdii). Rev. Biol. Trop. 2000, 48, 724. [Google Scholar]
- Clauss, M.; Lang-Deuerling, S.B.; Baumgartner, K.; Medici, E.P.; Janssens, G.P.J.; Kienzle, E.; Hummel, J. Nutrient digestibility in zoo-kept tapirs (Tapirus spp) as compared to other herbivores. J. Anim. Physiol. Anim. Nutr. 2024, 109, 867–880. [Google Scholar] [CrossRef] [PubMed]
- Hernández-Hernández, M.; López-Ortiz, S.; Jarillo-Rodríguez, J.; Ortega-Jiménez, E.; Pérez-Elizalde, S.; Díaz-Rivera, P.; Crosby-Galván, M.M. Forage yield and nutritional quality in Leucaena leucocephala and Megathyrsus maximus cv. Tanzania in an intensive silvopastoral system. Rev. Mex. Ciencias Pec 2020, 11, 53–69. [Google Scholar] [CrossRef]
- Ahrestani, F.S.; Heitkönig, I.M.A.; Prins, H.H.T. Diet and habitat-niche relationships within an assemblage of large herbivores in a seasonal tropical forest. J. Trop. Ecol. 2012, 28, 385–394. [Google Scholar] [CrossRef]
- Luna-Nieves, A.L.; Meave, J.A.; Cerdeira-Morellato, L.P.; Ibarra-Manríquez, G. Reproductive phenology of useful seasonally dry tropical forest trees: guiding patterns for seed collection and plant propagation in nurseries. Forest Ecol. Manag. 2017, 393, 52–62. [Google Scholar] [CrossRef]
- Singh, K.P.; Kushwaha, C.P. Deciduousness in tropical trees and its potential as indicator of climate change: A review. Ecol. Indic. 2016, 69, 699–706. [Google Scholar] [CrossRef]
- Wang, Y.; Yang, D.; Vargas, G.; Hao, G.; Powers, J.S.; Ke, Y.; Wang, Q.; Zhang, Y.; Zhang, J. Leaf habitat differentiation explains trait tradeoffs across savanna woody plants. For. Ecosyst. 2024, 11, 100190. [Google Scholar] [CrossRef]
- Bodmer, R.E. Fruit patch size and frugivory in the lowland tapir (Tapirus terrestris). J. Zool. Lond. 1990, 222, 121–128. [Google Scholar] [CrossRef]
- Henry, O.; Feer, F.; Sabatier, D. Diet of the lowland tapir (Tapirus terrestris) in Franch Guiana. Biotropica 2000, 32, 364–368. [Google Scholar] [CrossRef]

| Country | Site | Total Families |
Total Genera |
Identification technique | Reference | |||
|---|---|---|---|---|---|---|---|---|
| B | F | B/F | O | |||||
| Colombia | Katíos Natural National Park | 21 | 24 | - | - | X | - | [32] |
| Colombia | Katíos Natural National Park | 16 | 22 | - | - | X | - | [33] |
| Costa Rica | Santa Rosa National Park | 35 | 57 | X | - | - | - | [34] |
| Costa Rica | Parque Nacional Corcovado | 36 | 65 | - | - | X | - | [35] |
| Costa Rica | Parque Nacional Corcovado | 3 | 3 | X | - | - | - | [29] |
| Costa Rica | Cordillera de Talamanca | 24 | 24 | - | - | X | - | [27,28] |
| Guatemala | Parque Nacional Laguna Lachuá | 27 | 28 | - | - | X | - | [37] |
| Honduras | Parque Nacional Sierra de Agalta | 25 | 27 | - | - | X | - | [38] |
| Mexico | La Sepultura | 33 | 38 | - | - | X | - | [39] |
| Mexico | La Sepultura | 42 | 58 | - | X | - | - | [40] |
| Mexico | El Triunfo | 27 | 35 | - | - | X | - | [41] |
| Mexico | Calakmul | 8 | 5 | - | X | - | - | [42] |
| Mexico | Montes Azules | 20 | 29 | - | - | X | - | [43] |
| Mexico | La Fortaleza | 10 | 9 | - | X | - | - | [44] |
| Mexico | Bala’an Ka’ax | 15 | 15 | X | - | - | X | [45] |
| Mexico | Dos Luchas | 3 | 3 | X | - | - | - | [47] |
| Mexico | Calakmul | 36 | 62 | - | - | X | X | [48] |
| Nicaragua | Autonomous Region of the North Caribbean Coast | 16 | 21 | - | - | - | X | [50] |
| Panama | Barro Colorado | 44 | 81 | X | - | - | X | [51] |
| Panama | Barro Colorado | 7 | 8 | - | X | - | - | [52] |
| Reference | Diet Components (%) | ||||||||
|---|---|---|---|---|---|---|---|---|---|
| Fibre | Leaf | Fruit | |||||||
| Sample Size (n) |
Vegetation type |
Study duration (month) |
Mean | SD | Mean | SD | Mean | SD | |
| [27,28] | 13 | MCF | 5 months | 51.4 | - | 48.3 | - | 0.3 | - |
| [38] | 26 | BLF | 8 months | 66.13 | - | 18.6 | - | 2.9 | - |
| [32] | 33 | TRF | 4 months | 7.6 | 5.42 | 65.2 | 20.1 | 27.2 | 20.9 |
| [44] | 50 | TRF | 8 months | 49.4 | 9.4 | 49.5 | 9.1 | 1.1 | 5.01 |
| [39] | 62 | SDTF | 16 months | 44.1 | 11.7 | 48.8 | 14.1 | 7.1 | 10.8 |
| [41] | 90 | MCF | 10 months | 50.6 | 15.9 | 45.5 | 14.8 | 3.9 | 10.1 |
| [35] | 136 | TRF | 9 months | 25.2 | - | 65.4 | - | 9.4 | - |
| [43] | 142 | TRF | 11 months | 47.0 | 10.0 | 51.0 | 11.0 | 2.0 | 5.0 |
| [40] | 278 | MCF | 11 months | 68.0 | 4.0 | 30.4 | 5.0 | 1.6 | 1.1 |
| Reference | Diet Components (%) | ||||||||||
|---|---|---|---|---|---|---|---|---|---|---|---|
| Fibre | Leaf | Fruit | Bark | ||||||||
| Sample size (n) |
Vegetation type |
Study duration month |
Mean | SD | Mean | SD | Mean | SD | Mean | SD | |
| [32]* | 33 | TRF | 4 | 11.9 | 9.6 | 41.1 | 17.3 | 47.0 | 21.3 | - | - |
| [37] | 37 | TRF | 12 | 28.0 | - | 67.0 | - | 3.0 | - | 2.0 | - |
| [24] | 47 | SDTF | 24 | 17.5 | 0.7 | 74.0 | 11.3 | 9.8 | 4.6 | - | - |
| [44]* | 50 | TRF | 8 | 38.0 | 0.3 | 57.2 | 0.3 | 2.6 | 0.3 | - | - |
| [39]* | 62 | SDTF | 16 | 18.1 | 7.5 | 79.7 | 8.6 | 2.2 | 5.2 | - | - |
| [41]* | 90 | MCF | 10 | 38.1 | 16.7 | 57.6 | 15.2 | 4.3 | 12.4 | - | - |
| [35]* | 136 | TRF | 9 | 15.4 | - | 76.0 | - | 8.6 | - | - | - |
| Reference | Sample Size (n) |
Dry season n (%) |
Rainy season n (%) |
Diet components % | |||||
|---|---|---|---|---|---|---|---|---|---|
| Fibre | Leaf | Fruit | |||||||
| D | R | D | R | D | R | ||||
| [44] | 50 | 15 (30.0) | 35 (70.0) | 49.91 | 48.2 | 48.5 | 51.7 | 1.5 | 0.1 |
| [39] | 62 | 20 (32.2) | 42 (67.8) | 44.5 | 43.8 | 47.3 | 50.1 | 8.1 | 6.2 |
| [41] | 90 | 50 (55.6) | 40 (44.4) | 40.3 | 35.2 | 42.3 | 54.4 | 3.2 | 4.8 |
| [35] | 136 | 92 (67.6) | 44 (32.4) | 23.2 | 29.5 | 64.8 | 66.7 | 12.0 | 3.8 |
| [43] | 142 | 111 (78.0) | 31 (22.0) | 50.0 | 38.0 | 48.0 | 60.0 | 2.0 | 2.0 |
| Reference | Sample size (n) |
Dry season n (%) |
Rainy season n (%) |
Diet components % | |||||
|---|---|---|---|---|---|---|---|---|---|
| Fibre | Leaf | Fruit | |||||||
| D | R | D | R | D | R | ||||
| [37] | 37 | 24 (64.9) | 13 (35.1) | 21.5 | 38.6 | 72.9 | 55.3 | 4.6 | 2.2 |
| [24] | 47 | 30 (64.0) | 17 (36.0) | 18.0 | 17.0 | 66.0 | 82 | 16.0 | 0.3 |
| [44] | 50 | 15 (30.0) | 35 (70.0) | 38.2 | 40.4 | 56.6 | 58.8 | 3.4 | 0.8 |
| [39] | 62 | 20 (32.2) | 42 (67.8) | 19.5 | 16.9 | 78.9 | 80.5 | 1.7 | 2.6 |
| [41] | 90 | 50 (55.6) | 40 (44.4) | 40.3 | 35.2 | 55.7 | 60.0 | 3.9 | 4.8 |
| [35] | 136 | 92 (67.6) | 44 (32.4) | 12.8 | 21.2 | 76.9 | 73.9 | 10.3 | 4.9 |
Disclaimer/Publisher’s Note: The statements, opinions and data contained in all publications are solely those of the individual author(s) and contributor(s) and not of MDPI and/or the editor(s). MDPI and/or the editor(s) disclaim responsibility for any injury to people or property resulting from any ideas, methods, instructions or products referred to in the content. |
© 2025 by the authors. Licensee MDPI, Basel, Switzerland. This article is an open access article distributed under the terms and conditions of the Creative Commons Attribution (CC BY) license (http://creativecommons.org/licenses/by/4.0/).


