
Submitted:
30 December 2025
Posted:
31 December 2025
You are already at the latest version
Abstract
Ion channels in biological membranes often form spatially localized clusters that exhibit cooperative gating behavior, where the activity of one channel can modulate the opening probability of its neighbors. Understanding such inter-channel interactions is crucial for elucidating the molecular mechanisms underlying complex electrochemical signaling and for advancing channel-targeted pharmacology.
In this study, we introduce a simplified stochastic model of multi-channel gating that enables systematic analysis of cooperative phenomena under controlled conditions. Two complementary information-theoretic measures, i.e., Shannon entropy and Sample entropy, are applied to simulated multi-channel datasets to quantify the degree and modality of inter-channel cooperativity. The analyzed signals include idealized total current traces and the corresponding dwell-time sequences of channel cluster states.
We demonstrate that the dependence of Shannon entropy calculated for the idealized cluster currents on cluster size distinguishes non-cooperative from cooperative dynamics. Similarly, the Sample entropy of dwell-time series is also a potent indicator of inter-channel cooperation. Additionally, this metric provides enhanced sensitivity to temporal regularities in dwell-time data.
The observed entropic signatures allow for classification of clusters according to the strength and mode of inter-channel coupling (non-, positively-, and negatively-cooperative). Thus, they extend a general analytical framework for interpreting multi-channel recordings.
These findings, based on our simple model of channel cluster, establish entropy-based analysis as a promising approach for probing real collective gating in ion channel systems or simple biomimetic multi-nanopore devices, where some deviations from the idealized approach are expected.
Keywords:
ion channels
; cooperative gating
; shannon entropy
; sample entropy
; channel cluster
; channel cooperativity model
1. Introduction
Ion channels, being membrane proteins responsible for the rapid and selective passage of ions like Na+, K+, Ca2+, or Cl− down their electrochemical gradients, are one of the molecular key players in the regulation of cellular ion homeostasis and signaling. For this sake, they constitute a prominent group of drug targets [1,2,3,4,5,6,7,8].
Ion channels do not exhibit constant permeability to specific ions. Instead, their conductance is governed by conformational dynamics that enable transitions between conducting (open) and non-conducting (closed) states, a process known as channel gating [1,9,10]. The probability and kinetics of these transitions vary and generally depend on multiple factors. Based on the primary stimulus that promotes channel opening, ion channels are commonly classified as voltage-gated, ligand-gated, or mechanically gated [1].
Ion channels constitute a vast and diverse family of proteins, typically named according to their ion selectivity, principal activating stimuli, and basic structural and functional characteristics. The sensitivity of a given channel type to activating or deactivating stimuli can be further modulated by alternative mRNA splicing [11,12,13,14,15,16] and post-translational modifications [17,18,19,20,21,22]. These regulatory mechanisms finely tune channel behavior to the specific biological role of a given channel within a particular cell type, membrane environment, and set of external conditions [23].
Beyond these well-established mechanisms, an important yet still relatively poorly understood phenomenon that may further amplify the functional repertoire of ion channels is cooperative gating [24,25,26]. By modulating channel responsiveness through interactions between neighboring channels, cooperative gating can profoundly influence cellular electrical signaling. This phenomenon constitutes the central focus of the present work.
Some ion channels tend to self-organize in cellular and organelle membranes in the form of clusters composed of channels of the same type [27,28,29,30]. Within such clusters, channels can interact with one another and collectively modulate their gating behavior. Depending on the intrinsic nature of a particular ion channel type, the resulting collective gating can be positive or negative. Positive coupling enhances the channel-mediated signaling. In those terms, opening of one channel from the cluster increases the opening probabilities of all its neighbors from the same cluster (e.g., [31,32,33]). Channel coupling can also be negative, where opening of one channel decreases the chances of its neighbors to open, which effectively reduces the channel-generated ionic currents (e.g. [34,35]). There are multiple examples of cooperative gating in the literature including the K+ channels like S6 KvAP peptide channels [36], KcsA [30,37], KATP [34], Slack [33,38,39], Kv2.1 [35], Na+ channels [31], NaV1.5 -subunits [40], Ca2+ channels, e.g., CaV1.2 [32,41], CaV1.3 [28,42], glycine-gated chloride channels [43], ryanodine receptors 1 (RyR1 channels) [44], voltage-dependent anion channels [45], nicotinic acetylcholine receptors [46], ionotropic purinergic receptors P2X2 [47]. Across all these channels, the physiological, pathological, and pharmacological consequences of cooperative gating are substantial, underscoring the need for further focused investigation of this phenomenon.
Most investigations of collective gating rely heavily on comparing the current characteristics of multi-channel clusters with a hypothetical response obtained by summing independent single-channel signals. However, a comprehensive understanding of channel cooperativity requires a more detailed analysis of multi-channel data, encompassing the presence, strength, and temporal range of internal correlations, recurring patterns, characteristic time scales of concerted channel opening and closing, and the overall complexity of the recorded signals. Such information could not only facilitate the diagnosis of cooperative gating (particularly in situations where experimental data are limited) but also provide valuable constraints for the development of physically and biologically plausible models of the molecular mechanisms underlying inter-channel communication.
Existing analytical approaches developed for single-channel data are not readily transferable to multi-channel recordings, primarily because the responses of individual channels within a cluster cannot be measured independently [9,10]. In channel clusters, only the superimposed collective response is experimentally accessible, which poses a substantial challenge to conventional data analysis methods and motivates the development of new analytical frameworks or the critical assessment of the applicability of existing ones.
In this context, the present work focuses on evaluating the applicability of information-theoretic measures, specifically Sample Entropy (SampEn) [48,49,50,51] and Shannon Entropy [51,52,53], for the analysis of time series describing multi-channel activity. Because channel clusters exhibiting different strengths and modes of inter-channel cooperation are expected to produce electrical signals reflecting varying degrees of independent vs. concerted channel action, the internal complexity of the corresponding signals should differ substantially. Intuitively, Shannon entropy describes the diversity of the distribution of a given variable. Thus, the more versatile values it can take with considerable frequency (the more different measurable and significantly occupied states), the higher Shannon entropy [51]. In turn, Sample entropy is sensitive to the occurrence of repetitive patterns within the analyzed series. The more regular the signal, i.e., the more similar patterns of data points that remain similar when one more point is added to the considered pattern length, the lower SampEn value [50,51]. From this perspective, Shannon entropy and Sample entropy, being two complementary information-theoretic measures, emerge as promising diagnostic tools for identifying and classifying cooperative ion channel systems.
In this paper, we employ a simple toy model of ion channel activity to generate predictions for entropy-based measures applied to current recordings under conditions of channel cooperation, as well as to the corresponding series of dwell times associated with discernible channel or channel-cluster states. This purely theoretical approach enables analysis in a fully controlled setting, allowing us to focus on idealized regimes of channel operation, thereby facilitating the identification of general trends and straightforward interpretation of results. In practice, however, such well-defined regimes may be difficult to achieve experimentally due to biological variability, including, for example, precise half-activation of all channels within a cluster, identical dwell-time distributions for open and closed states, etc. By working with simulated data, we systematically examine how controlled changes in the gating dynamics of a channel cluster influence Shannon and Sample entropy values, and we develop intuition that can be directly applied to the analysis of real multi-channel patch-clamp recordings.
2. Materials and Methods
2.1. Simulation of Ion Channel Cluster Activity
In this work, we simulated the activity of a channel cluster comprising channels, ranging from 1 to 6. In that aim, we revisited and appropriately re-formulated the random-walk-based model proposed in [54]. In this approach, for each channel within the cluster, its gating is described by a discrete random walk process performed by the RC (reaction coordinate) over the one-dimensional conformational space.
The conception of the reduction of the complex structure of the channel gate into the 1D movement of an abstract variable is reasonable since the possibilities of ionic conduction through the channel depend on the inner diameter of its pore. Thus, the projection of the motion of the pore-forming channel segments into 1D dynamics can be easily imagined. The tendency of to occupy particular positions within its diffusive space reflects the degree of channel activation.
The movement of the is restricted by two boundaries located symmetrically in relation to the threshold point () separating open and closed states (Figure 1). These boundaries ( and ) may represent the impact of the membrane surroundings on the channel protein functioning. The model reproduces the experimentally confirmed Hurst memory effect. It is achieved by allowing the boundaries to change their location, where their synchronized motion effectively reduces or extends the available conformational space for [54]. The moving boundaries represent the thermal fluctuations of the membrane and the occurrence of transient internal strains within it. The and motion proceeds at a larger time scale than the motion of the (after a certain number of time units ), which is justified by the difference in mass between the pore-gate domain and its membrane surroundings. The movements of and to extend or shrink the diffusive space are equiprobable, and their maximal amplitude is given as .
The function of the RC potential (U) shapes the probability of the to jump to the left (q) or to the right (p) on the 1D lattice. It is given according to the formula:
and
where k is the Boltzmann constant, T is the absolute temperature, is a potential energy difference within a lattice step centered around the .
The U function has a peak at the , which illustrates an energetic barrier separating open and closed conformations. This peak is determined by the B parameter of the model (equation (3)) and effectively represents a barrier of large-scale structural reorganization needed to effectively open or close the pore to the K+ transport.
Different channel-activating effects, that in the real system are exerted by e.g. voltage- and ligand-sensors, are represented in the model by a drift force (A) contributing to the energetic landscape of the available positions. In the simplest considered case, the drift force is constant (i.e., the sensors induce a ramp potential contribution), and its amplitude depends on the sensors’ activation level. Such a representation aligns the allosteric picture of the system, in which sensor activation exerts an open-enhancing effect, but it is not mandatory for pore opening.
Since we adapt the original model proposed in [54] to enable the description of a multi-channel system, we introduce an additional assumption that in each step of the simulation, each channel from a cluster performs its random walk on its own lattice. The instant size of the lattice is the same for all channels, and its size is limited by the same boundaries and . Since we wish to model different types of inter-channel interactions, we propose that the motion of each representing one channel of a considered cluster is affected by the functional states of other s (i.e., by all , where and , representing the neighboring channels). We incorporate this idea into the model by introducing an appropriate component of the potential function, i.e., . In this way, the opening of one channel affects the potential of all other channels co-assembled in a given cluster. If is negative, open states are facilitated, and the opening of one channel supports the opening of its partners (positive cooperation). If is positive, closed states are facilitated after any channel in the cluster opens (negative cooperation). If equals zero, the channels gate independently (no cooperation). Alternative formulation could involve modulation of boundaries and in response to cooperation, which is a possible interaction mechanism, but not the only one; For example, an activated channel may mediate chemical signaling molecules with other channels, affect the phosphorylation state of the neighbor, or act another way, so we choose the most general approach with cooperation represented by an extra external force.
In each subsequent step of a simulation, for each channel from a cluster, its potential function is calculated, and it takes the form:
where and are the locations of the left-hand and right-hand boundaries, is the threshold point position, , , and denote the potential values at given points and , and A represents the drift force toward the open or closed states and is a potential slope between points and -1.5 (and between points +1.5 and )
B represents the potential barrier between the open and closed states and is defined by a potential slope between points -1.5 and
At the first step of the simulation, we randomly set the positions of the s illustrating the conformational states of all channels forming a cluster. From this moment on, the corresponding potentials are calculated at each subsequent step of a simulation, and based on their values, each jumps to the left or to the right with probabilities given by eqs. (1) and (2) (but it can never jump over the boundaries and , the point also cannot be reached by – it can just jump from to or reverse). The time between two subsequent steps of the simulation is called ’reaction coordinate time unit,’ and the distance between consecutive nodes of the lattice (diffusive space of the s) is called ’reaction coordinate unit’ or just ’rcu’.
The simulation procedure can be summarized as follows:
- The symmetric lattice with the point in the middle and maximum number of nodes equal to 4 on either side is set.
- The initial positions of the boundaries B1 and B2 are set to - and .
- The initial positions of all reaction coordinates s are randomly chosen between the and (the point is excluded).
- The potential function is calculated according to eq. (3) for each .
- The position of each reaction coordinate is randomly changed by one rcu, with the probabilities of movement to the right and to the left given by eqs. (1) and (2). (If the RC should reach the B1 or B2 positions, it stays in its previous position. If the RC = TP-1 and it should move to TP, it jumps to the TP+1. If the RC = TP+1 and it should move to TP, it jumps to the TP-1.)
- The position of each reaction coordinate in relation to the is checked. If the RC is at the right-hand side of the , the open state is recognized. Otherwise, the closed state is assigned.
- The idealized current through a cluster (I) is evaluated as the number of open channels in the considered cluster (number of s>). If all channels are closed (all s<), I=0.
- Steps 4–7 are repeated for a number of time steps determined by the value of
- The boundaries B1 and B2 are randomly and synchronously moved for one step length toward or away from the TP with equal probability. (If B1 reaches -2 or positions, it is reflected to its previous position. Analogously, if B2 reaches 2 or positions, it is reflected to its previous position.)
- Steps 4–8 are repeated for a desired time series length.
The results of model simulation have the form of a time series of idealized currents (I) through a cluster (Figure 2). It is called ’idealized’, since the conductivity of each channel from the cluster is considered in a dichotomized way – 1 represents its open state, 0 represents its closed state. Consequently, for each simulation step, one obtains an integer value ranging from 0 to which directly indicates how many channels were open at this simulation step (Figure 2, lower panel). Based on the obtained I series, one can easily calculate the mean value of relative cluster currents (sum of all simulated channel currents divided by the sum of maximal possible currents for the same series length and cluster size - ·, which corresponds to an average open state probability for each channel from the cluster. Another commonly used parameter in the description of the multi-channel series is , which is the mean number of channels being open throughout a simulation.
Based on the simulated series of ion-channel currents, the corresponding dwell times of channel/cluster states have been generated. In the simplest single-channel states, the dwell-time series describes how long the consecutive open and closed channel states last. In the multi-channel states, the dwell-time series describes how long successive cluster current amplitudes retained the same value.
In this study, the model parameters were as follows: = 2.0 kT, = 14, ratio of and random walk time scales = 600. We simulated the model until reaching the dwell-time series length N = 25000. To describe different activation levels of channels forming a cluster due to the action of external factors (like voltage or ligand concentration in real systems), the amplitude of drift force has been changed from -0.7 [kT/rcu] to 0.7 [kT/rcu] with a 0.1 [kT/rcu] step. Half-activation of the simulated channels is reached at = 0 [kT/rcu].
2.2. Sample Entropy
Sample Entropy [48] is a powerful tool to quantize the regularity and complexity of time series. In contrast to the Shannon Entropy, which is addressed to all symbols occurring in the time record, Sample Entropy allows to investigate and quantize the behavior of correlated sequences within the record.
The basic algorithm to calculate SampEn can be reviewed as follows:
- Consider a time series of N data points, and for this time series, construct a set of subsequences of length , for .
-
To investigate correlations, consider a similarity measure between the sequences. For this purpose, we make use of the Chebyshev distance:Having two sequences apart from each other by less than r, i.e., , with r being the similarity threshold (here: of the dwell time series standard deviation), we consider them matching (they are satisfactorily similar to each other).
- Using the similarity measure, evaluate the probability of finding matching sequences within the considered time series to a given template sequence :where is the number of sequences that meet the similarity criterion , and is the number of different sequences of length m within the record of length N.
- The probability (7) can be averaged over all sequences in the record to give:
-
The Sample Entropy is defined as:SampEn is a the negative natural logarithm of the conditional probability that two sequences similar for m points remain similar for points. Thus, it is a measure of the loss of correlation. In highly correlated process, this is close to 0, while for a sudden correlation drop, one obtains a positive value.
2.3. Shannon Entropy
Shannon Entropy is a fundamental quantity in the Information Theory [52,53]. For a sequence of symbols one can isolate the values, which occur in that sequence as , . The values can be assigned probabilities , in our case measured as the frequency to be found in the sequence X.
Given the above, we define the Shannon Entropy as:
Using a in this expression allows one to measure entropy in . In the present paper, to obtain an estimate of the Shannon Entropy we evaluate the histogram of the dwell-times of cluster states (residence times in states exhibiting different current levels), or of the idealized total current amplitudes, which after rescaling delivers the probability for (10). What is important, in the case of dwell-time distribution analysis we took 100 bins dividing logarithmically the range between the global minimal and maximal dwell times from all analyzed series. In the case of dwell-time distribution analysis, we took 100 bins, which divide the range between the global minimum and maximum dwell times from all analyzed series logarithmically. In the case of the analysis of current series, we took seven bins located at 0, 1, 2, ..., 6 (which stems from the description of maximally 6-channel clusters, so the minimal idealized total current is 0 - no open channels, and the maximal amplitude is 6 - all channels open).
3. Results
3.1. Simulation of the Collective Gating Model
The proposed model is capable of mimicking the results of cooperative behaviors, since the strength and type of coupling modify the steepness of a channel activation curve (Figure 3). The positive cooperation shifts the activation curve to the regime typical for a lower activation of the channel sensors of external channel-activating factors (to the left in Figure 3). In turn, the negative cooperation leads to the dampening of channel activation by the external stimuli. Thus, the inter-channel enhancement/deprivation may significantly alter the channel-mediated cellular firing properties.
To analyze the impact of inter-channel cooperation on crucial metrics describing cluster gating in more detail, we simulated the activity of a single channel and a channel cluster formed by 2–6 channels at half-activation (i.e. for the drift force parameter =0), and, then, evaluated the corresponding normalized current and the mean number of open channels (Figure 4). In the positive cooperation mode, the opening of ion channels strongly enhances the probability of all their neighbors to open. In these terms, gating dynamics synchronize to some extent, leading to a more frequent occurrence of the open state of each channel within the cluster. This kind of behavior is straightforwardly dependent on the cluster size because of the assumed additivity of cooperative effects. Consequently, in the positive cooperation mode, the more channels in the cluster, the stronger the open-reinforcing impact, up to a saturation level (where the open state probability exceeds 90%). Analogously, in the negative cooperation mode, where opening of any channel reduces the likelihood of its neighbors to open, the more channels in the cluster, the better pronounced the hampering effects for the ionic transport through the channel cluster.
3.2. Shannon Entropy
To rigorously quantify the complexity and the degree of synchronization within these channels, Shannon Entropy provides essential information. By characterizing the probability distribution of all possible states within the cluster, this metric serves as a direct measure of the system’s uncertainty and configurational variety. Shannon entropy considers every possible combination of open and closed states within the cluster, capturing how the system distributes itself among various combinations of open and closed states. It acts as a sensitive indicator of the information about gating process, allowing us to determine which cluster’s behavior is purely stochastic and which is more structured in collective dynamics.
3.2.1. Shannon Entropy of Cluster Currents
Shannon Entropy measurements for cluster currents (Figure 5) display expected characteristics: the increase in the number of channels within a cluster introduces new available current levels and enlarges the entropy. However, the trend is not linear and depends on the modality and strength of inter-channel cooperation. In terms of independent gating within the cluster, one observes a monotonic increase in Shannon entropy with the number of channels that form a cluster. In turn, when the channels cooperate, some of the conduction states become unlikely, and the Shannon entropy increases with until it reaches a saturation level for high . The stronger the cooperation, the faster the Shannon Entropy stabilization is reached.
The reduction in the probabilities of deeply closed (in case of positive cooperation) or deeply open (in case of negative cooperation) current levels is depicted in Figure 6). This effect of cooperation is also seen in Figure 7, where the entropy maximum (corresponding to the maximal complexity reached near the effective half activation due to drift and cooperation) moves to the left or to the right, depending on the type of cooperation.
What is important to note is that the ’asymmetry’ of how the modality of the cooperation is introduced into the model (the -related components depend only on the transient number of open channels, and not the closed ones) has its resemblance in the Shannon entropy outcomes. Introduction of the = 0.1 [kT/rcu] (negative cooperation) exerts lower effects on Shannon entropy of cluster currents for fixed cluster size than the introduction of the = -0.1 [kT/rcu] (positive cooperation) to the model Figure 5.
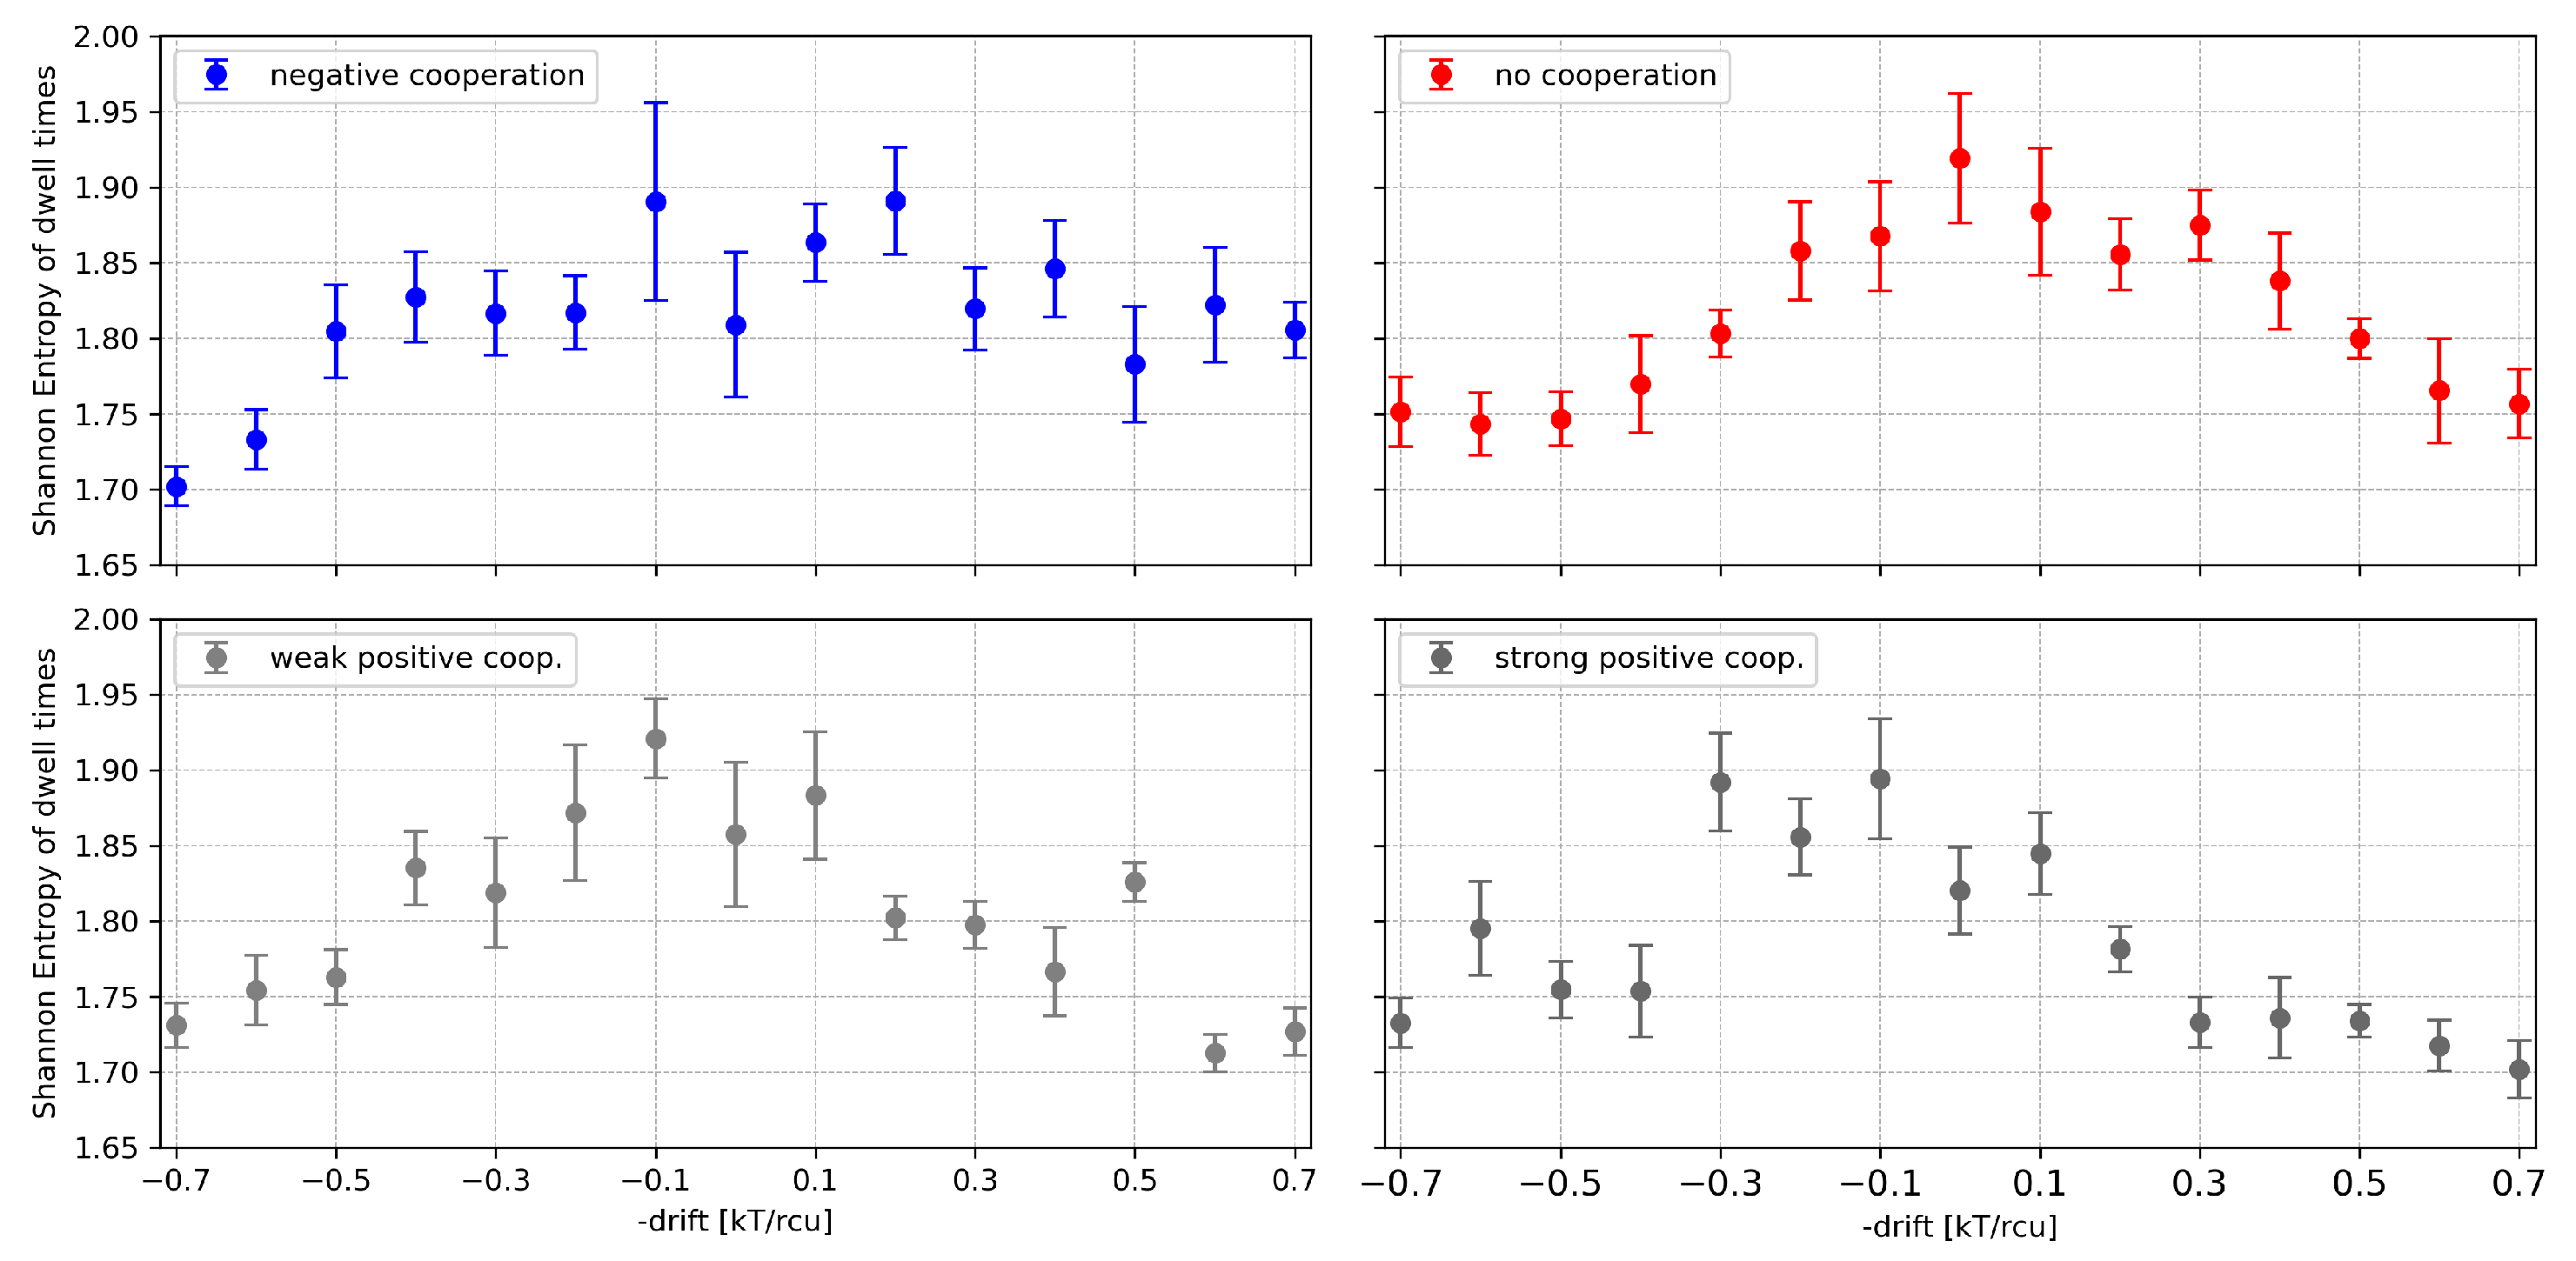
3.2.2. Shannon Entropy of Dwell Times of Cluster States
The behavior of the Shannon Entropy, when it is addressed to the dwell-time distribution, displays an opposite trend compared to the case of the current distribution (Figure 8). This is because the increase in the number of channels in the cluster allows for an easier escape from a particular conduction state (there are such states for a cluster with N channels). For example, if all N channels are open, leaving this conduction state is possible already when only one of them closes. The probability P of such an event is N times higher than in the case of a single channel dwell time. All this translates to a dwell-time histogram, which is much more concentrated at short dwell-time values, which reduces the entropy.
Going to details, in the entropy values related to a fixed number of channels, we can see, in general, that the maximum value corresponds to no cooperation. This is because the switching probability P, considered above, becomes reduced by drift in the most frequently populated conduction states. For example, in the case of positive cooperation the probability (per single channel) to escape the state with N channels “on” drops. Thus, long-lived open dwell times are in favor, which tend to interlace with short closed dwell times. This happens at the cost of intermediate length dwell times, which otherwise contribute with quite a high probability to the entropy (long lived states, because a single event takes a lot of the recording, are still rare; nevertheless, they determine the ) (Figure 9). In the case of negative cooperation, in the same figure, we can see a reduction in the probability of short dwell times. This is because the multi-channel opening activity is reduced. For example, in the extreme case, when cooperation allows only statistically a single channel in the cluster to conduct current, it will switch on/off like a single channel with a relatively broad dwell time distribution, with no reduction of time scale discussed in the preceding paragraph.
Comparing the results of Shannon Entropy addressed to the dwell times to the results obtained before for the currents, we don’t observe any clear saturation effects related to cooperation. The metric in the space of the dwell times does not allow for distinguishing cooperation from no cooperation within a cluster, as it does in the space of currents.
The effect of external channel activation on the Shannon Entropy of the dwell times can be understood in the framework of the previous observations: we have a maximum of the entropy in the case of no net drift (including possible cooperation); outside this value the entropy drops down.
Figure 10.
Shannon entropy of the dwell-time series of cluster states evaluated for a 4-channel cluster at different values of the global drift (representing the channel activation level by external stimuli, like, e.g., voltage, ligand concentration) and different strengths of the inter-channel cooperation. Red - no cooperation ( = 0), blue - negative cooperation ( = 0.1 kT/rcu; open state of a channel favors closure of its neighbors), grey - weak positive cooperation ( = -0.05 kT/rcu; open state of a channel favors opening of its neighbors), dark grey - strong positive cooperation ( = -0.1 kT/rcu). The errorbars depict the standard errors.
3.3. Sample Entropy
3.3.1. Effects of Window Length and Cluster Size on the SampEn Values
Since Sample Entropy requires identification of sequences in the recording, and some statistical analysis of this data, it requires long recordings to develop the relevant probability distributions from the sample. The shape of the dependency in Figure 11 for all clusters reflects the gradual development of the exact dwell-time distribution with a longer window length. For short window lengths, the distribution is very coarse, with a high peak at short dwell times (well modeled by an exponential distribution in the Markovian approach) and zeros in the distribution tails. Such a structure of the dwell-time distribution overestimates the probabilities of short dwell times due to the lack of long dwell-time realizations. As they become recorded, the short dwell time peaks reduce, giving rise to the distribution tails, and their entropic contributions grow.
Within each window length, entropy takes larger values when more channels occur in the cluster. That’s because the dwell-time structure becomes richer if many channels are in action within the cluster. This happens even at half-activation, and even when the closed and open single-channel dwell times are probabilistically equal. Of course, the primary probability of leaving a conduction state is still roughly (where is the probability to switch the state of a single channel), but some corrections to this estimate are possible.
For example, having all N channels “on”, the chance of leaving this state is related to the probability that at least one channel changes its state . In contrast, considering a state with channels “on”, there is a chance of that a change of the state of one of the channels in the cluster is accompanied by an opposite change of some other channel. The probability of leaving this conduction state is thus less than , and so it is possible to find minor differences between dwell times generated by different conduction states, even at half-activation.
The compromise between the availability of experimental data in typical patch-clamp recordings and the reliability of SampEn estimation (obtained while reaching an abundant population of dwell-time sequences, which describes sufficiently well the variability and relative incidence of different types of dwell-time sequences) is that we have chosen 5000-point windows for further calculations.
3.3.2. Effects of Inter-Channel Cooperation Strength and Mode on the SamEn Values
Figure 12 shows the Sample Entropy () of dwell times at half-activation as a function of the number of channels for different modes and strengths of inter-channel cooperativity. In the case of independent channel gating, an increase in the cluster size leads to a pronounced gain in . It reflects higher local temporal complexity of the dwell-time series of the multi-channel cluster states due to random switching ”on” and ”off” of the channels. The more independent channels in the cluster, the less predictable the signal on a short timescale.
Introduction of the inter-channel cooperativity modifies the function. For the negative cooperativity, increases with the number of channels and reaches a maximum for four-channel clusters, and then, for a larger number of channels, decreases. The initial rise in Sample Entropy with reflects higher local temporal complexity of cluster states due to weak opening-counteracting effects that even entangle the purely random behavior. When cluster size is sufficiently big ( = 5 or = 6), the additive effects of inter-channel negative cooperation result in some synchronization which reduces local unpredictability, causing Sample Entropy to level off or even decrease. In other words, initial growth in the number of channels delivers more conduction states with individual dwell time characteristics, enlarging the entropy. At some threshold value of , there develops a condition for the maximum number of activated channels within a cluster (where larger activation is prevented by the negative cooperation). Escape from this conduction state is reduced by compared to the single-channel conduction state, no matter the actual . In contrast, the activation from a non-conducting state is proportional to the actual number of channels in a cluster, N. This brings asymmetry to the dwell time distribution (long vs. short - and given the similarity threshold of of the standard deviation, the distribution of short dwell times becomes indistinguishable, leading to the entropy decrease. A similar trend can be seen for strong cooperation, and may be explained by the same arguments by assuming some minimum number of activated channels in a cluster .
Generally speaking, the weak and strong positive cooperativity result in systematically lower values across all channel numbers in comparison to the non-cooperating clusters. Naturally, strong positive cooperativity shows the weakest dependence on the number of channels. That is because the concerted -dependent opening-reinforcing effects mitigate the effects of global cluster state intersection by random individual ’on’ and ’off’ switching. The strength of positive cooperation between channels within the cluster easily translates to a reduction in Shannon Entropy compared to the no-cooperation mode, due to the cooperation-strength-dependent propensity of the system to become more globally ordered, leading to the situation where certain state combinations dominate. Overall, the results (Figure 12) indicate that describing dwell-times of cluster states (regardless of the m parameter in the range 2-4) may be used for a clear separation between different cluster cooperation modes and strengths.
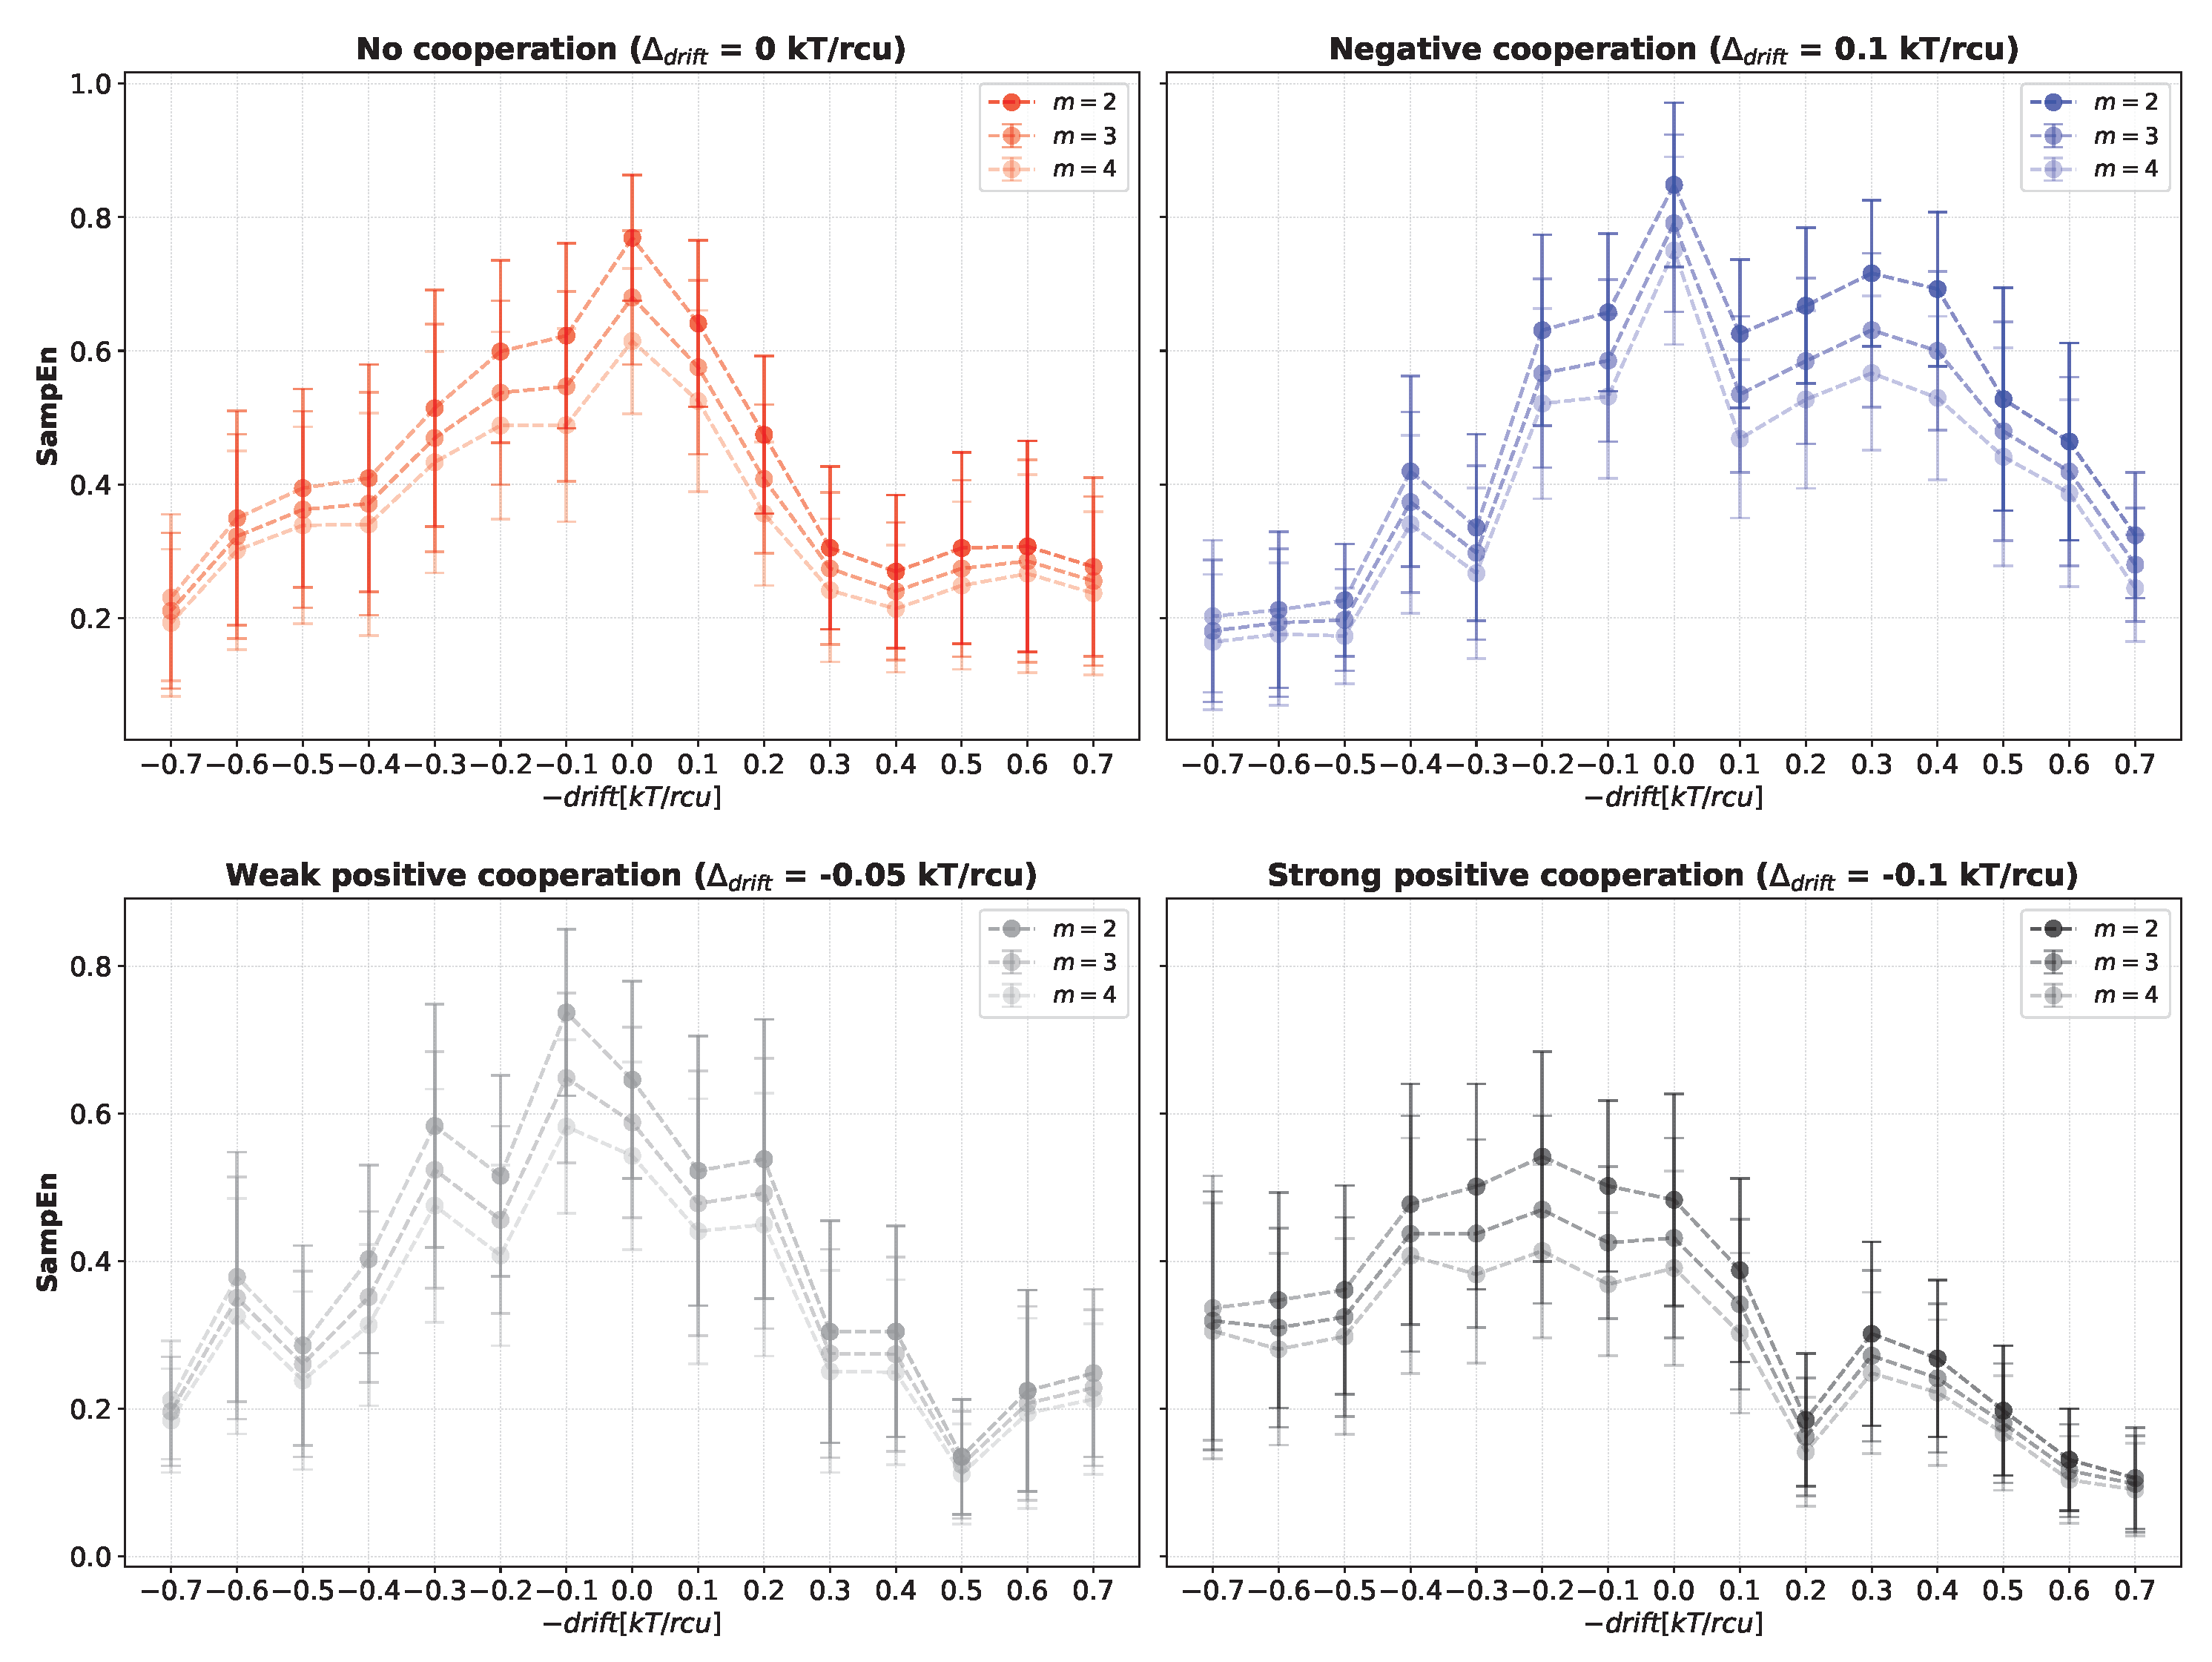
Considering the changes in as a result of global cluster activation, one can observe an expected trend to shift the maxima of sample entropy vs. drift to the right at negative cooperation and to the left at positive cooperation (Figure 13).
Except from shifting of the maxima one can also observe another effect: lifting of the curve on the diagram in the side, where drift opposes cooperation effects. This occurs because cooperation brings high diversity to the dwell times of different conduction states which manifests in elevated entropy when the drift allows for different scenarios than “fully inactivated” or “fully activated” cluster. One should keep in mind here that activation bias (the activation drift) cannot compensate cooperation drift on all conduction states at once. The range of choices for the compensating drift reflects in broader elevated entropy values over this drift range.
4. Discussion
Studies on the cooperative gating phenomenon represent one of the most promising and relatively novel directions in channel-oriented research. This growing interest arises from the phenomenon’s considerable significance in elucidating the molecular mechanisms that underlie the collective behavior of channel clusters and their impact on channel-mediated electrochemical signaling, such as gating modalities, short- and long-term memory effects, and hysteresis in cluster currents at different levels of global cluster activation by external factors (like hysteresis in IV-curve of voltage-gated channel cluster) [24,25,55]. A deeper understanding of these processes is also essential for refining fundamental biophysical theories, including the extension of the core concepts, such as the qualitative description of action potential generation, which may fundamentally alter our understanding of neuronal encoding. For example, incorporating sodium channel cooperation into the Hodgkin–Huxley model improves the accuracy of descriptions of neuronal behavior [56,57]. In fact, by understanding the role of cooperative gating in neurons, we may discover new and important paradigms for the models of artificial neural networks to further improve AI technology. Continued progress in this area is expected to drive advances in channel-targeted pharmacology, particularly in developing approaches to modulate channel clustering and inter-channel cooperation, as proposed in recent studies [58].
Studies involving multi-channel recordings require dedicated and well-tailored methodologies for data analysis. Such approaches should either be newly developed or adapted from existing analytical frameworks, which must be carefully validated for their applicability to multi-channel data or further refined to effectively capture its complex characteristics.
In this work, we demonstrate the applicability of two information entropy measures, Shannon entropy and Sample entropy, to the analysis of two readily obtainable types of multi-channel data. These include (i) idealized cluster current series, where each current amplitude corresponds to the number of simultaneously open channels, and (ii) the associated dwell-time series representing the duration of specific, consecutive cluster conduction states. The datasets were generated through simulations based on a previously introduced simple random-walk model [54], extended here to describe a multi-channel system. This approach allowed us to minimize the noise inherent in experimental data and to simplify the underlying gating mechanisms. It also enables straightforward interpretation of the resulting entropic characteristics of multi-channel systems (including concepts like dwell time variability in half activation due to switching asymmetries, which otherwise would be probably attributed to noise) and provides practical guidelines for extending such analyses to empirical patch-clamp recordings. Moreover, because the model relies on straightforward assumptions, it facilitates the formulation of general insights that can later be compared with experimental observations across various cooperative channel systems—formed by channels of different types and governed by diverse molecular gating mechanisms.
Entropic analysis has been successfully employed to describe ion channel gating both at the single-channel level [51,59] and at the whole-cell level [60]. In the present study, Shannon entropy and Sample entropy are applied for the first time to multi-channel data, where multiple channels form a cooperative cluster. Our findings indicate that entropy provides a powerful quantitative criterion for classifying data according to the mode and strength of inter-channel cooperativity. Specifically, the relationship between Shannon entropy of total idealized currents and the increasing number of co-assembled channels () under fixed external conditions depends strongly on the underlying cooperation mode. A monotonic increase in Shannon entropy with suggests an absence of cooperativity, whereas an initial rise followed by stabilization of entropy at larger values indicates the presence of cooperative interactions among channels. Moreover, the earlier this stabilization occurs, the stronger the inferred inter-channel cooperation. However, Shannon entropy proves considerably less effective in distinguishing cooperative dynamics when applied to dwell-time series of cluster states. This limitation arises because with the increase of channels in a cluster, the effective number of conduction states (affecting entropy of the current) stabilizes, while the dwell times continue to be modulated by new channel units (like channels can perturb a conduction state faster than N channels).
The dwell-time series of a single ion channel represents a sequence of transitions between conformational states of varying stability, with only a limited number of possible state-to-state switches. Consequently, such data tend to exhibit distinct internal patterns that primarily arise from recurrent transition schemes between preferred conformational states. When additional channels are introduced, these characteristic patterns become disrupted due to the stochastic and intermittent opening and closing of neighboring channels, which introduce a degree of decorrelation into the system. However, this loss of correlation can be partially mitigated or even eliminated when collective gating behavior induces synchronization among channel states. This reasoning motivated the application of an alternative information-theoretic measure, Sample Entropy, which is particularly sensitive to the presence of repetitive sequences within time series data. Accordingly, we employed Sample Entropy to analyze the dwell-time series of channel cluster states, aiming to better capture the underlying temporal regularities associated with cooperative gating phenomena [48,49,51].
Analogously to the Shannon entropy of the total idealized current series, the Sample Entropy of dwell-times turned out to be a good classification criterion for the existence, modality, and intensity of inter-channel cooperation. The observed dependence of Sample Entropy on the number of channels forming a cluster and the mode and strength of the inter-channel cooperation reflects the interplay between interaction-induced variability and collective ordering in the system.
As shown for a negatively cooperating 4-channel cluster at its half-activation by external factors (Figure 12), the initial increase in indicates that adding channels introduces stochastic disruption of the single-channel dwell-times’ correlations that enhance local temporal complexity. The subsequent saturation and decrease in for larger numbers of channels suggest the emergence of collective dynamics and partial synchronization, which reduce local unpredictability by constraining the accessible temporal patterns. As explained before, this happens mostly due to the separation of the dwell time scales between fast and slow events. For negatively cooperative systems, this implies that temporal complexity reaches its maximum at intermediate cluster sizes, beyond which collective ordering becomes dominant and suppresses variability. In contrast, strong positive cooperativity promotes synchronization even at relatively small channel numbers, leading to reduced temporal complexity and lower values compared with non-cooperative clusters. In such cases, the strong coupling among channels suppresses irregular temporal behavior, resulting in a weakened dependence of on cluster size. Weak positive cooperativity, on the other hand, introduces a modest degree of ordering that slightly reduces relative to the non-cooperative case, reflecting mild temporal structuring without full synchronization.
When relating the present results to real multi-channel systems, we anticipate that the main trends in Shannon and Sample entropy observed in our simulations, and mechanisms proposed to drive these trends, will have clear counterparts in experimental data. Specifically, when comparing the activity of cooperative versus non-cooperative channel clusters, such as those formed by different channel mutants under identical external conditions and with the same number of functionally active channels within a patch, distinct entropy values are expected. Furthermore, by analyzing how entropy varies with cluster size or with the strength of channel-activating stimuli, one can infer the interplay between the signal components that contribute to temporal ordering (e.g., synchronization induced by cooperativity or external activation) and those responsible for stochastic randomization (e.g., independent opening and closing of channels within a cluster). We also may be able to take conclusions regarding the nonlinear dependency of cooperation on stimuli and number of channels. Such relationships can significantly facilitate the rational modeling of collective gating phenomena and guide the interpretation of empirical patch-clamp data. In the long term, these insights may not only deepen our understanding of nanoscale transport phenomena in biological multi-channel systems [24] but also be helpful in the design of advanced multi-nanopore biomimetic nanofluidic devices [61] or novel activation functions for neurons in the artificial neural network technologies [57].
5. Conclusions
The Shannon entropy of total idealized currents and the Sample entropy of dwell-time series in multi-channel clusters effectively capture the transition from independent multi-channel behavior to cooperation-induced temporal ordering. These entropy-based measures can therefore serve as diagnostic indicators of inter-channel cooperativity within clustered ion channel systems. The presented results, derived from a simplified model, provide a useful reference framework that can be directly compared with empirical observations from cooperative channel assemblies.
Author Contributions
Conceptualization, A.W.-J.; methodology, A.W.-J., P.T., and P.B.; software, A.W.-J. and P.T.; validation, A.W.-J., P.T., and P.B.; formal analysis, A.W.-J., P.T. and P.B.; investigation, A.W.-J., P.T., M.W, and P.B.; resources, A.W.-J.; data curation, A.W.-J. and P.T.; writing—original draft preparation, A.W.-J., P.T. and P.B.; writing—review and editing, A.W.-J., P.T. and P.B.; visualization, A.W.-J., P.T., M.W. and P.B.; supervision, A.W.-J., P.T. and P.B.; project administration, A.W.-J.; funding acquisition, A.W.-J. All authors have read and agreed to the published version of the manuscript.
Funding
This research was funded by the National Science Centre, Poland under the project no. 2024/55/D/ST3/03115 for A.W.-J., P.T., M.W., and P.B.
Institutional Review Board Statement
Not applicable
Informed Consent Statement
Not applicable
Data Availability Statement
The research data are available at DOI: 10.5281/zenodo.18042547.
Conflicts of Interest
The authors declare no conflicts of interest.
Abbreviations
The following abbreviations are used in this manuscript:
| Nch | Number of co-assemblied channels forming a cluster |
| RC | Reaction coordinate |
| SampEn | Sample Entropy |
| TP | Threshold separating open and closed channel states |
| U | Potential function |
References
- Hille, B. Ion channels of excitable membranes, 3rd Ed. ed; 2001. [Google Scholar]
- Männikkö, R.; Kullmann, D.M. Structure–function and pharmacologic aspects of ion channels relevant to neurologic channelopathies. Handbook of Clinical Neurology 2024, 203, 1–23. [Google Scholar]
- McGowan, B.R.; Schwaede, A.N.; De Simone, L.; Rao, V.K. Muscle channelopathies: A review. Annals of the Child Neurology Society 2023, 1, 273–288. [Google Scholar] [CrossRef]
- Schreiber, J.A.; Seebohm, G. Cardiac K+ channels and channelopathies. Pharmacology of Potassium Channels 2021, 113–138. [Google Scholar]
- Prevarskaya, N.; Skryma, R.; Shuba, Y. Ion channels in cancer: are cancer hallmarks oncochannelopathies? Physiological reviews 2018, 98, 559–621. [Google Scholar] [CrossRef]
- Wawrzkiewicz-Jałowiecka, A.; Lalik, A.; Lukasiak, A.; Richter-Laskowska, M.; Trybek, P.; Ejfler, M.; Opałka, M.; Wardejn, S.; Delfino, D.V. Potassium channels, glucose metabolism and glycosylation in cancer cells. International Journal of Molecular Sciences 2023, 24, 7942. [Google Scholar] [CrossRef]
- Echeverría, F.; Gonzalez-Sanabria, N.; Alvarado-Sanchez, R.; Fernández, M.; Castillo, K.; Latorre, R. Large conductance voltage-and calcium-activated K+ (BK) channel in health and disease. Frontiers in Pharmacology 2024, 15, 1373507. [Google Scholar] [CrossRef] [PubMed]
- Picci, G.; Marchesan, S.; Caltagirone, C. Ion channels and transporters as therapeutic agents: from biomolecules to supramolecular medicinal chemistry. Biomedicines 2022, 10, 885. [Google Scholar] [CrossRef] [PubMed]
- Hill, C.L.; Stephens, G.J. An introduction to patch clamp recording. Patch Clamp Electrophysiology: Methods and Protocols 2021, 1–19. [Google Scholar]
- Sakmann, B. Single-channel recording; Springer Science & Business Media, 2013. [Google Scholar]
- Meredith, A.L. Alternative splicing. In Textbook of Ion Channels Volume III; CRC Press, 2023; pp. 1–14. [Google Scholar]
- Mittendorf, K.F.; Deatherage, C.L.; Ohi, M.D.; Sanders, C.R. Tailoring of membrane proteins by alternative splicing of pre-mRNA. Biochemistry 2012, 51, 5541–5556. [Google Scholar] [CrossRef]
- Dai, A.; Temporal, S.; Schulz, D. Cell-specific patterns of alternative splicing of voltage-gated ion channels in single identified neurons. Neuroscience 2010, 168, 118–129. [Google Scholar] [CrossRef]
- Lin, W.H.; Wright, D.E.; Muraro, N.I.; Baines, R.A. Alternative splicing in the voltage-gated sodium channel DmNav regulates activation, inactivation, and persistent current. Journal of neurophysiology 2009, 102, 1994–2006. [Google Scholar] [CrossRef] [PubMed]
- Gray, A.C.; Raingo, J.; Lipscombe, D. Neuronal calcium channels: splicing for optimal performance. Cell calcium 2007, 42, 409–417. [Google Scholar] [CrossRef]
- Sarao, R.; Gupta, S.K.; Auld, V.J.; Dunn, R.J. Developmentaly regulated alternative RNA splicing of rat brain sodium channel mRNAs. Nucleic acids research 1991, 19, 5673–5679. [Google Scholar] [CrossRef]
- Onwuli, D.O.; Beltran-Alvarez, P. An update on transcriptional and post-translational regulation of brain voltage-gated sodium channels. Amino Acids 2016, 48, 641–651. [Google Scholar] [CrossRef]
- Laedermann, C.J.; Abriel, H.; Decosterd, I. Post-translational modifications of voltage-gated sodium channels in chronic pain syndromes. Frontiers in pharmacology 2015, 6, 263. [Google Scholar] [CrossRef]
- Kyle, B.D.; Braun, A.P. The regulation of BK channel activity by pre-and post-translational modifications. Frontiers in physiology 2014, 5, 316. [Google Scholar] [CrossRef]
- Loh, K.W.Z.; Liang, M.C.; Soong, T.W.; Hu, Z. Regulation of cardiovascular calcium channel activity by post-translational modifications or interacting proteins. Pflügers Archiv-European Journal of Physiology 2020, 472, 653–667. [Google Scholar] [CrossRef]
- López, X.; Palacios-Prado, N.; Güiza, J.; Escamilla, R.; Fernández, P.; Vega, J.L.; Rojas, M.; Marquez-Miranda, V.; Chamorro, E.; Cárdenas, A.M.; et al. A physiologic rise in cytoplasmic calcium ion signal increases pannexin1 channel activity via a C-terminus phosphorylation by CaMKII. Proceedings of the National Academy of Sciences 2021, 118, e2108967118. [Google Scholar] [CrossRef] [PubMed]
- Zheng, J.; Ponce-Balbuena, D.; Ríos Pérez, E.B.; Xiao, L.; Dooge, H.C.; Valdivia, H.H.; Alvarado, F.J. Preventing the phosphorylation of RyR2 at canonical sites reduces Ca2+ leak and promotes arrhythmia by reactivating the I Na current. Nature Cardiovascular Research 2025, 4, 976–990. [Google Scholar] [CrossRef] [PubMed]
- Ohya, S.; Kito, H.; Hatano, N.; Muraki, K. Recent advances in therapeutic strategies that focus on the regulation of ion channel expression. Pharmacology & therapeutics 2016, 160, 11–43. [Google Scholar]
- Dixon, R.E.; Navedo, M.F.; Binder, M.D.; Santana, L.F. Mechanisms and physiological implications of cooperative gating of clustered ion channels. Physiological reviews 2022, 102, 1159–1210. [Google Scholar] [CrossRef]
- Suma, A.; Sigg, D.; Gallagher, S.; Gonnella, G.; Carnevale, V. Ion channels in critical membranes: clustering, cooperativity, and memory effects. PRX Life 2024, 2, 013007. [Google Scholar] [CrossRef]
- Choi, K.H. Cooperative gating between ion channels. General physiology and biophysics 2013, 33, 1–12. [Google Scholar] [CrossRef]
- Nirenberg, V.A.; Yifrach, O. Bridging the molecular-cellular gap in understanding ion channel clustering. Frontiers in Pharmacology 2020, 10, 1644. [Google Scholar] [CrossRef]
- Schwenzer, N.; Teiwes, N.K.; Kohl, T.; Pohl, C.; Giller, M.J.; Lehnart, S.E.; Steinem, C. CaV1. 3 channel clusters characterized by live-cell and isolated plasma membrane nanoscopy. Communications Biology 2024, 7, 620. [Google Scholar] [CrossRef] [PubMed]
- Matsumoto, C.; O’Dwyer, S.C.; Manning, D.; Hernandez-Hernandez, G.; Rhana, P.; Fong, Z.; Sato, D.; Clancy, C.E.; Vierra, N.C.; Trimmer, J.S.; et al. The formation of KV2. 1 macro-clusters is required for sex-specific differences in L-type CaV1. 2 clustering and function in arterial myocytes. Communications Biology 2023, 6, 1165. [Google Scholar] [CrossRef] [PubMed]
- Sumino, A.; Yamamoto, D.; Iwamoto, M.; Dewa, T.; Oiki, S. Gating-associated clustering–dispersion dynamics of the KcsA potassium channel in a lipid membrane. The journal of physical chemistry letters 2014, 5, 578–584. [Google Scholar] [CrossRef]
- Undrovinas, A.I.; Fleidervish, I.A.; Makielski, J.C. Inward sodium current at resting potentials in single cardiac myocytes induced by the ischemic metabolite lysophosphatidylcholine. Circulation research 1992, 71, 1231–1241. [Google Scholar] [CrossRef] [PubMed]
- Dixon, R.E.; Moreno, C.M.; Yuan, C.; Opitz-Araya, X.; Binder, M.D.; Navedo, M.F.; Santana, L.F. Graded Ca2+/calmodulin-dependent coupling of voltage-gated CaV1. 2 channels. Elife 2015, 4, e05608. [Google Scholar] [CrossRef]
- Kim, G.E.; Kronengold, J.; Barcia, G.; Quraishi, I.H.; Martin, H.C.; Blair, E.; Taylor, J.C.; Dulac, O.; Colleaux, L.; Nabbout, R.; et al. Human slack potassium channel mutations increase positive cooperativity between individual channels. Cell reports 2014, 9, 1661–1672. [Google Scholar] [CrossRef]
- Choi, K.H.; Licht, S. ATP-sensitive potassium channels exhibit variance in the number of open channels below the limit predicted for identical and independent gating. Plos one 2012, 7, e37399. [Google Scholar] [CrossRef]
- O’Connell, K.M.; Loftus, R.; Tamkun, M.M. Localization-dependent activity of the Kv2. 1 delayed-rectifier K+ channel. Proceedings of the National Academy of Sciences 2010, 107, 12351–12356. [Google Scholar] [CrossRef] [PubMed]
- Malik, C.; Ghosh, S. S6 peptide derived from KvAP channel shows cooperativity in gating on bilayer lipid membrane. PLoS One 2013, 8, e78845. [Google Scholar] [CrossRef] [PubMed]
- Molina, M.L.; Barrera, F.N.; Fernández, A.M.; Poveda, J.A.; Renart, M.L.; Encinar, J.A.; Riquelme, G.; González-Ros, J.M. Clustering and coupled gating modulate the activity in KcsA, a potassium channel model. Journal of Biological Chemistry 2006, 281, 18837–18848. [Google Scholar] [CrossRef] [PubMed]
- Tang, Q.Y.; Zhang, F.F.; Xu, J.; Wang, R.; Chen, J.; Logothetis, D.E.; Zhang, Z. Epilepsy-related slack channel mutants lead to channel over-activity by two different mechanisms. Cell reports 2016, 14, 129–139. [Google Scholar] [CrossRef]
- Wu, J.; Quraishi, I.H.; Zhang, Y.; Bromwich, M.; Kaczmarek, L.K. Disease-causing Slack potassium channel mutations produce opposite effects on excitability of excitatory and inhibitory neurons. Cell reports 2024, 43. [Google Scholar] [CrossRef]
- Clatot, J.; Coulombe, A.; Deschênes, I.; Guicheney, P.; Neyroud, N. Trafficking and gating cooperation between deficient Nav1. 5-mutant channels to rescue INA. Frontiers in Bioscience-Landmark 2022, 27. [Google Scholar] [CrossRef]
- Ghosh, D.; Nieves-Cintrón, M.; Tajada, S.; Brust-Mascher, I.; Horne, M.C.; Hell, J.W.; Dixon, R.E.; Santana, L.F.; Navedo, M.F. Dynamic L-type CaV1. 2 channel trafficking facilitates CaV1. 2 clustering and cooperative gating. Biochimica Et Biophysica Acta (BBA)-Molecular Cell Research 2018, 1865, 1341–1355. [Google Scholar] [CrossRef]
- Moreno, C.M.; Dixon, R.E.; Tajada, S.; Yuan, C.; Opitz-Araya, X.; Binder, M.D.; Santana, L.F. Ca2+ entry into neurons is facilitated by cooperative gating of clustered CaV1. 3 channels. Elife 2016, 5, e15744. [Google Scholar] [CrossRef]
- Schaefer, N.; Roemer, V.; Janzen, D.; Villmann, C. Impaired glycine receptor trafficking in neurological diseases. Frontiers in molecular neuroscience 2018, 11, 291. [Google Scholar] [CrossRef]
- Marx, S.O.; Ondrias, K.; Marks, A.R. Coupled gating between individual skeletal muscle Ca2+ release channels (ryanodine receptors). Science 1998, 281, 818–821. [Google Scholar] [CrossRef]
- Shrivastava, R.; Ghosh, S. Collective dynamics of ion channels on bilayer lipid membranes. ACS omega 2021, 6, 7544–7557. [Google Scholar] [CrossRef]
- Keleshian, A.M.; Edeson, R.O.; Liu, G.J.; Madsen, B.W. Evidence for cooperativity between nicotinic acetylcholine receptors in patch clamp records. Biophysical Journal 2000, 78, 1–12. [Google Scholar] [CrossRef]
- Sattler, C.; Eick, T.; Hummert, S.; Schulz, E.; Schmauder, R.; Schweinitz, A.; Unzeitig, C.; Schwede, F.; Benndorf, K. Unravelling the intricate cooperativity of subunit gating in P2X2 ion channels. Scientific reports 2020, 10, 21751. [Google Scholar] [CrossRef]
- Richman, J.S.; Moorman, J.R. Physiological time-series analysis using approximate entropy and sample entropy. American Journal of Physiology-heart and Circulatory Physiology 2000, 278, H2039–H2049. [Google Scholar] [CrossRef]
- Costa, M.; Goldberger, A.L.; Peng, C.K. Multiscale entropy analysis of complex physiologic time series. Physical Review Letters 2002, 89, 068102. [Google Scholar] [CrossRef] [PubMed]
- Wawrzkiewicz-Jałowiecka, A.; Krasowska, M.; Strzelewicz, A.; Cho, A.D.; Siwy, Z.S. Asymmetric nanopores sustain hours long stationary ion current instabilities with voltage controlled temporal patterns and predictability. Measurement 2025, 249, 116950. [Google Scholar] [CrossRef]
- Borys, P.; Trybek, P.; Dworakowska, B.; Sekrecka-Belniak, A.; Wojcik, M.; Wawrzkiewicz-Jałowiecka, A. Applying Entropic Measures, Spectral Analysis, and EMD to Quantify Ion Channel Recordings: New Insights into Quercetin and Calcium Activation of BK Channels. Entropy 2025, 27, 1047. [Google Scholar] [CrossRef] [PubMed]
- Shannon, C.E. A mathematical theory of communication. The Bell system technical journal 1948, 27, 379–423. [Google Scholar] [CrossRef]
- Yeung, R. A First Course in Information Theory. In Information Technology Series; Springer US, 2002. [Google Scholar]
- Wawrzkiewicz, A.; Pawelek, K.; Borys, P.; Dworakowska, B.; Grzywna, Z.J. On the simple random-walk models of ion-channel gate dynamics reflecting long-term memory. European Biophysics Journal 2012, 41, 505–526. [Google Scholar] [CrossRef]
- Pfeiffer, P.; Egorov, A.V.; Lorenz, F.; Schleimer, J.H.; Draguhn, A.; Schreiber, S. Clusters of cooperative ion channels enable a membrane-potential-based mechanism for short-term memory. Elife 2020, 9, e49974. [Google Scholar] [CrossRef]
- Naundorf, B.; Wolf, F.; Volgushev, M. Unique features of action potential initiation in cortical neurons. Nature 2006, 440, 1060–1063. [Google Scholar] [CrossRef]
- Kumar, J.; Gupta, P.D.; Ghosh, S. Investigating the role of axonal ion channel cooperativity in action potential dynamics: Studies on Hodgkin-Huxley’s model. Biophysical Chemistry 2024, 311, 107257. [Google Scholar] [CrossRef] [PubMed]
- Spooner, H.C.; Costa, A.D.; Westhoff, M.; Hernández-González, A.; Ibrahimkhail, H.; Yarov-Yarovoy, V.; Horne, M.C.; Dickson, E.J.; Dixon, R.E. 14-3-3 promotes sarcolemmal expression of cardiac CaV1. 2 and nucleates isoproterenol-triggered channel superclustering. Proceedings of the National Academy of Sciences 2025, 122, e2413308122. [Google Scholar] [CrossRef] [PubMed]
- Machura, L.; Wawrzkiewicz-Jałowiecka, A.; Bednarczyk, P.; Trybek, P. Linking the sampling frequency with multiscale entropy to classify mitoBK patch-clamp data. Biomedical Signal Processing and Control 2022, 76, 103680. [Google Scholar] [CrossRef]
- Akilli, M.; Söğüt, F.; Çömelrkoğlu, Ü.; Tuncel, H. Investigation of biophysical properties of ion channels with nonlinear methods. Biochimica et Biophysica Acta (BBA)-Biomembranes 2025, 184437. [Google Scholar] [CrossRef]
- Zhang, H.; Ai, B.; Gong, Z.; Sui, T.; Siwy, Z.S.; Qiu, Y. Ion Transport through Differently Charged Nanoporous Membranes: From a Single Nanopore to Multinanopores. Analytical Chemistry 2025, 97, 19218–19231. [Google Scholar] [CrossRef]
Figure 1.
The schematic representation of the model system. (a) Each channel is represented by a reaction coordinate (). Each position of the within its diffusive space, restricted by two moving boundaries and , corresponds to either an open (conducting) or a closed (non-conducting) macro-state of the channel. At half-activation, the open and closed states are equiprobable (there is no global drift toward open/closed states in the model system). (b) The schematic representation of the shape of the potential function (U). At half-activation, it is flat beside the direct vicinity of the threshold point (), which separates open and closed states. In a no-cooperativity mode, in these terms, the probabilities of jump to the left and to the right are equal. (c) When there is a non-zero drift, acting in the direction down the potential energy gradient, the has a greater probability to jump in the direction of the drift. This represents the tendency of a channel to occupy either open or closed states depending on its activation level by some channel-modulating factors (activators/inhibitors). (d) The representation of the potential function in terms of a non-zero drift.
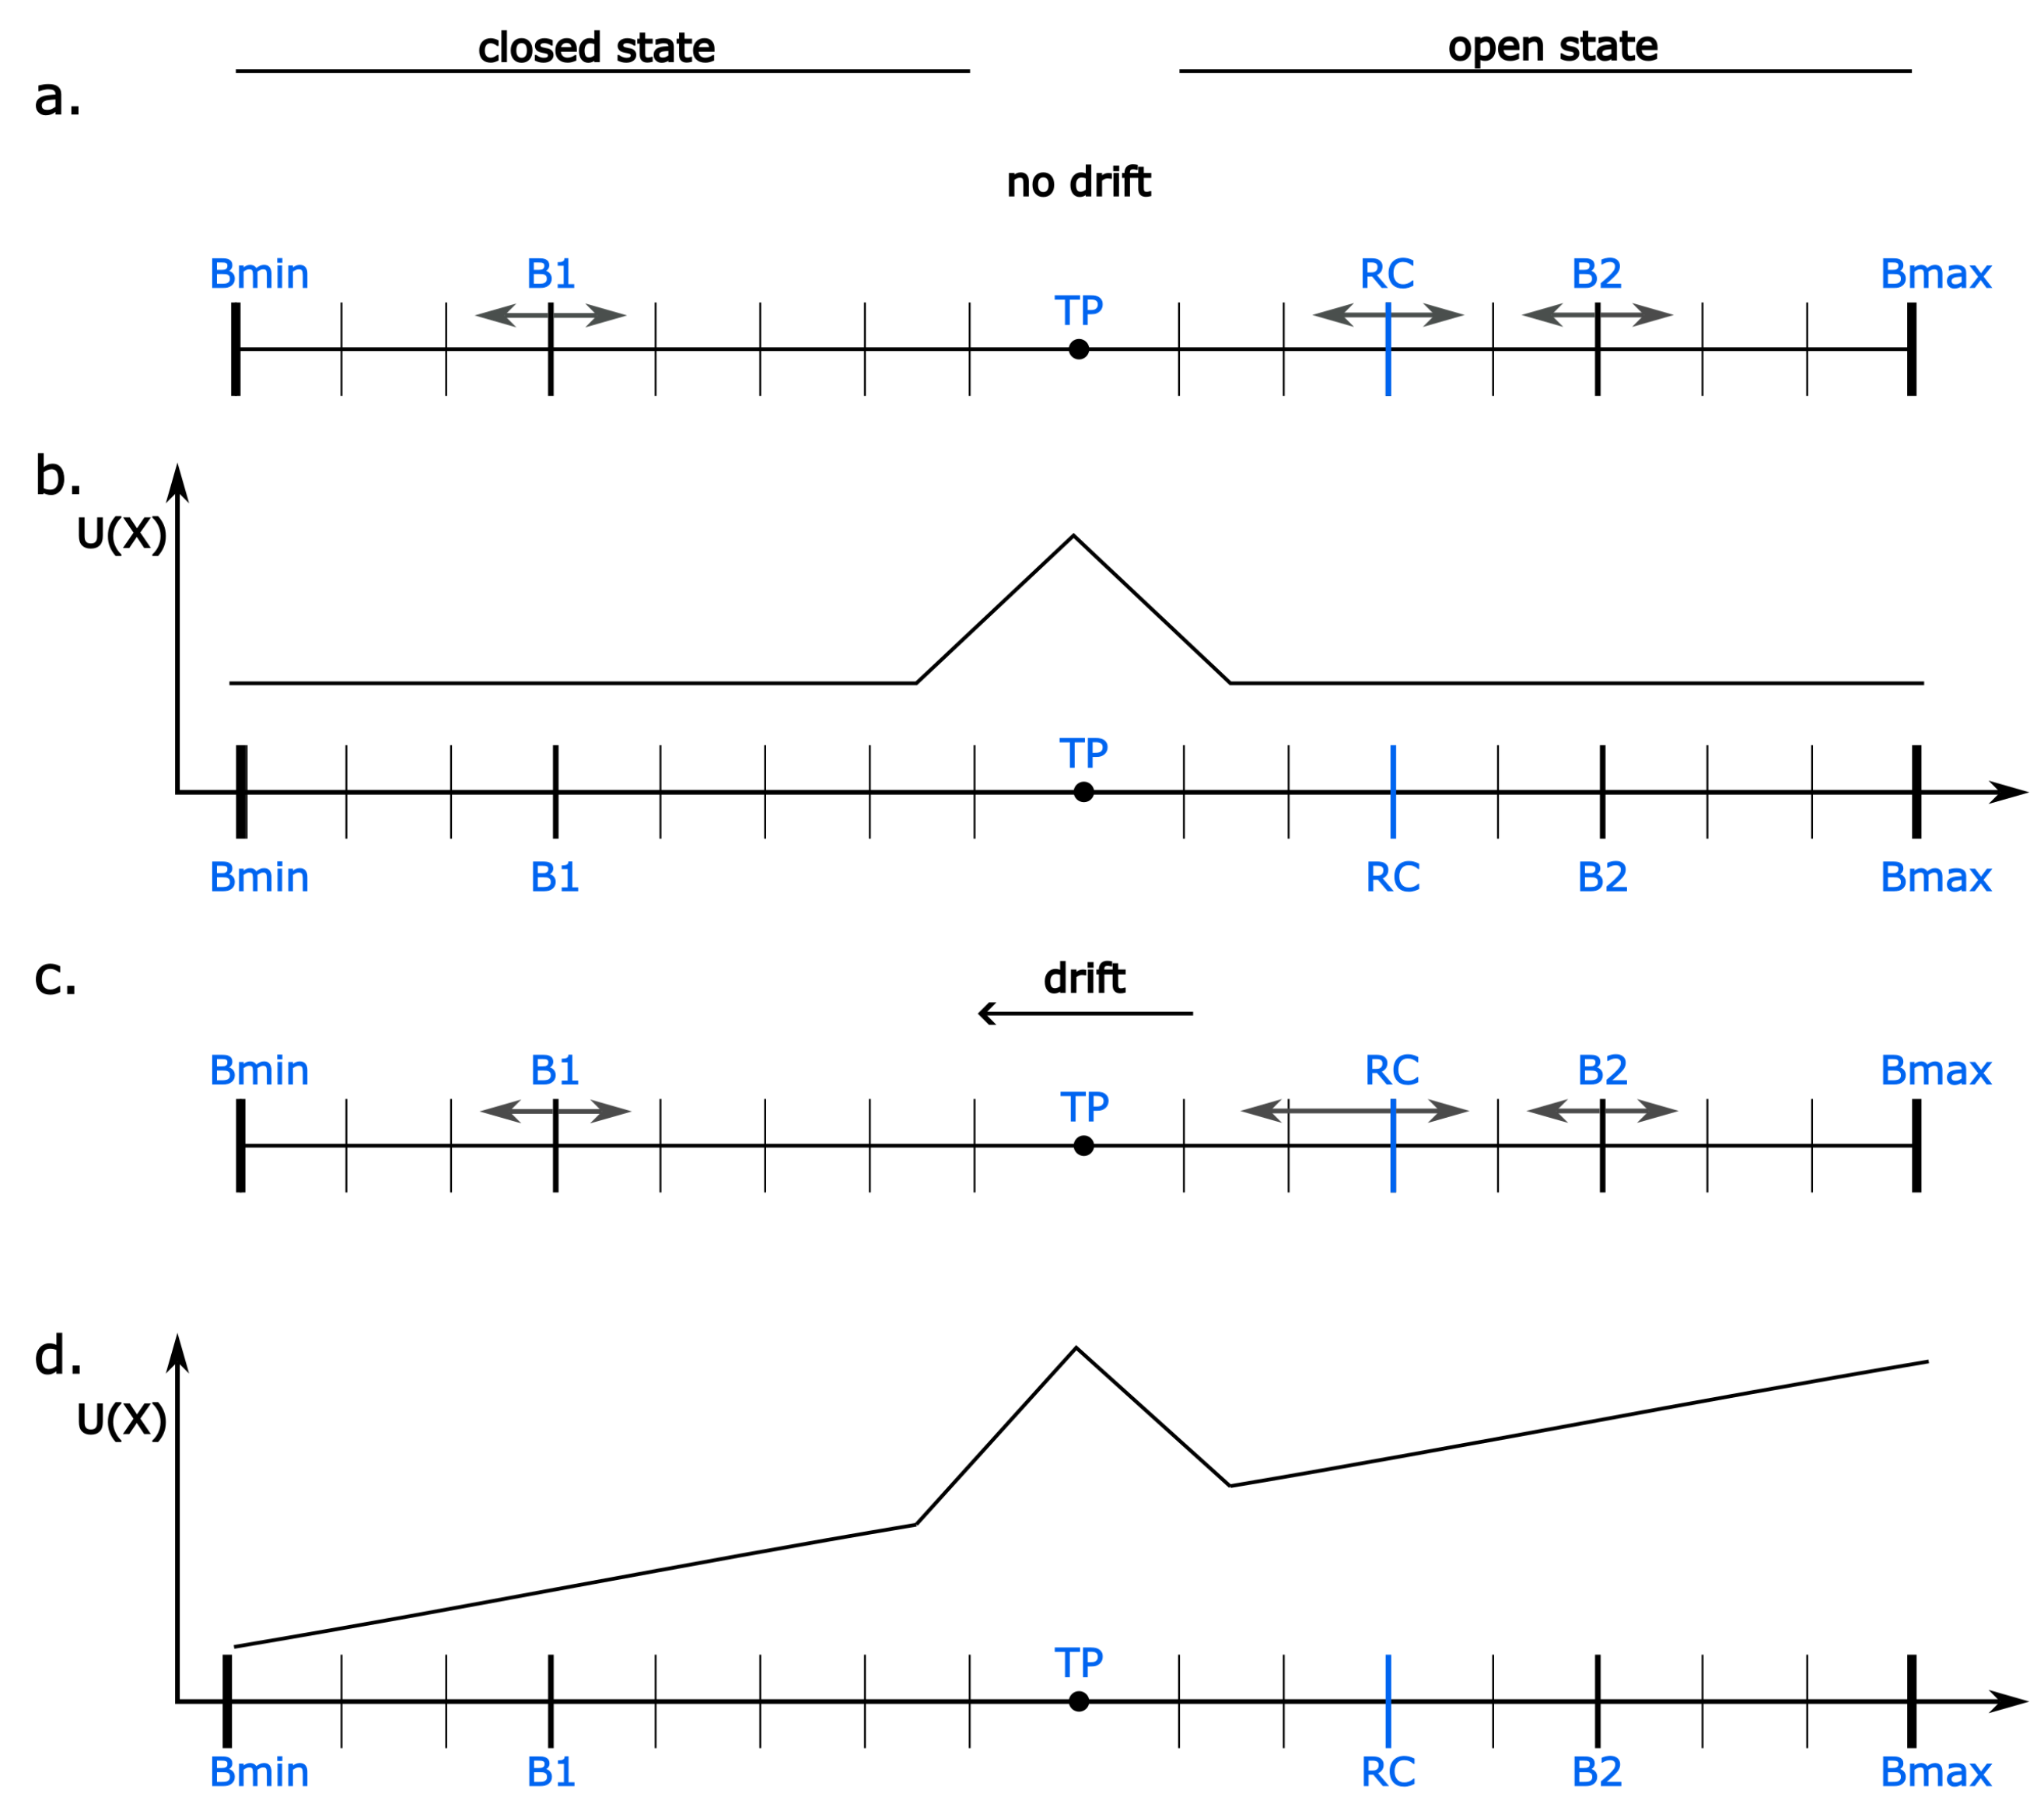
Figure 2.
A sample of the idealized currents generated by the model simulation. Upper panel: a single-channel variant at half-activation ( = 0), lower panel: 5-channel variant ( = 0, no cooperation). Example dwell time periods , , , , are shown; the remaining periods are just delimited by gray/white background stripes for clarity.
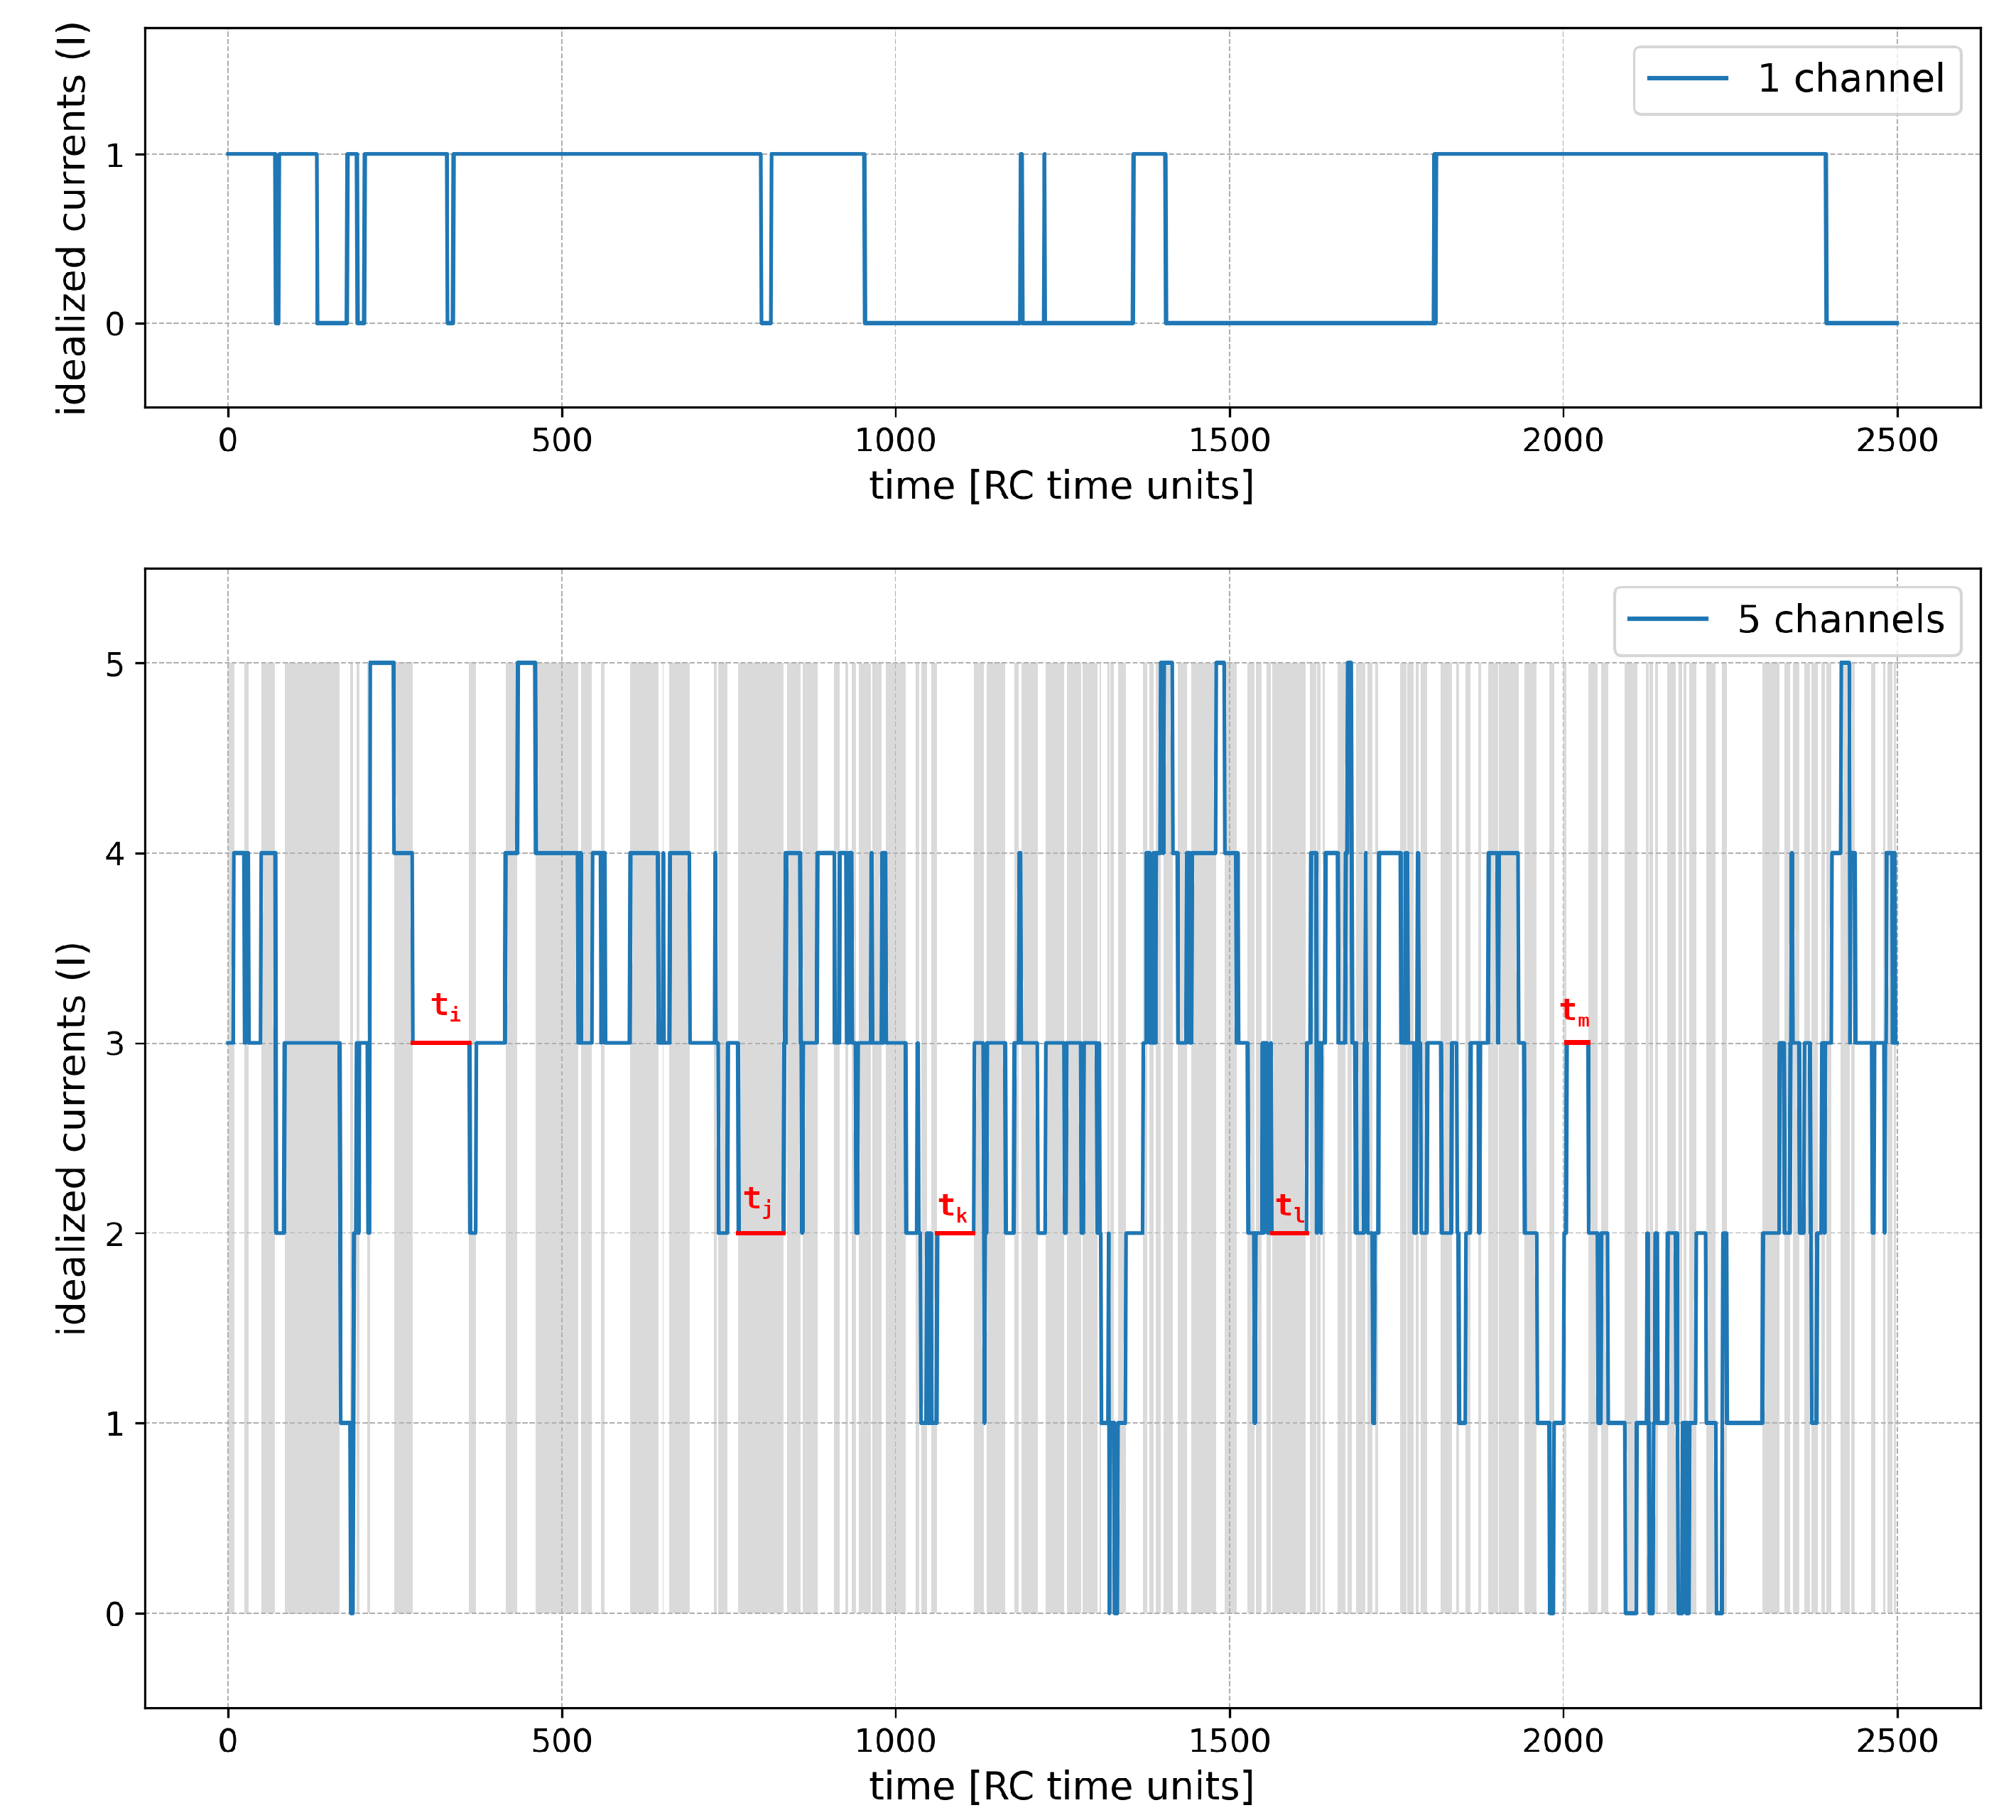
Figure 3.
The activation curves obtained as a result of model simulation for 4-channel cluster at different strength of their mutual cooperation. The results represented by the mean values of relative cluster currents . Red - no cooperation ( = 0), blue - negative cooperation ( = 0.1 kT/rcu; open state of a channel favors closure of its neighbors), grey - weak positive cooperation ( = -0.05 kT/rcu; open state of a channel favors opening of its neighbors), dark grey - strong positive cooperation ( = -0.1 kT/rcu).
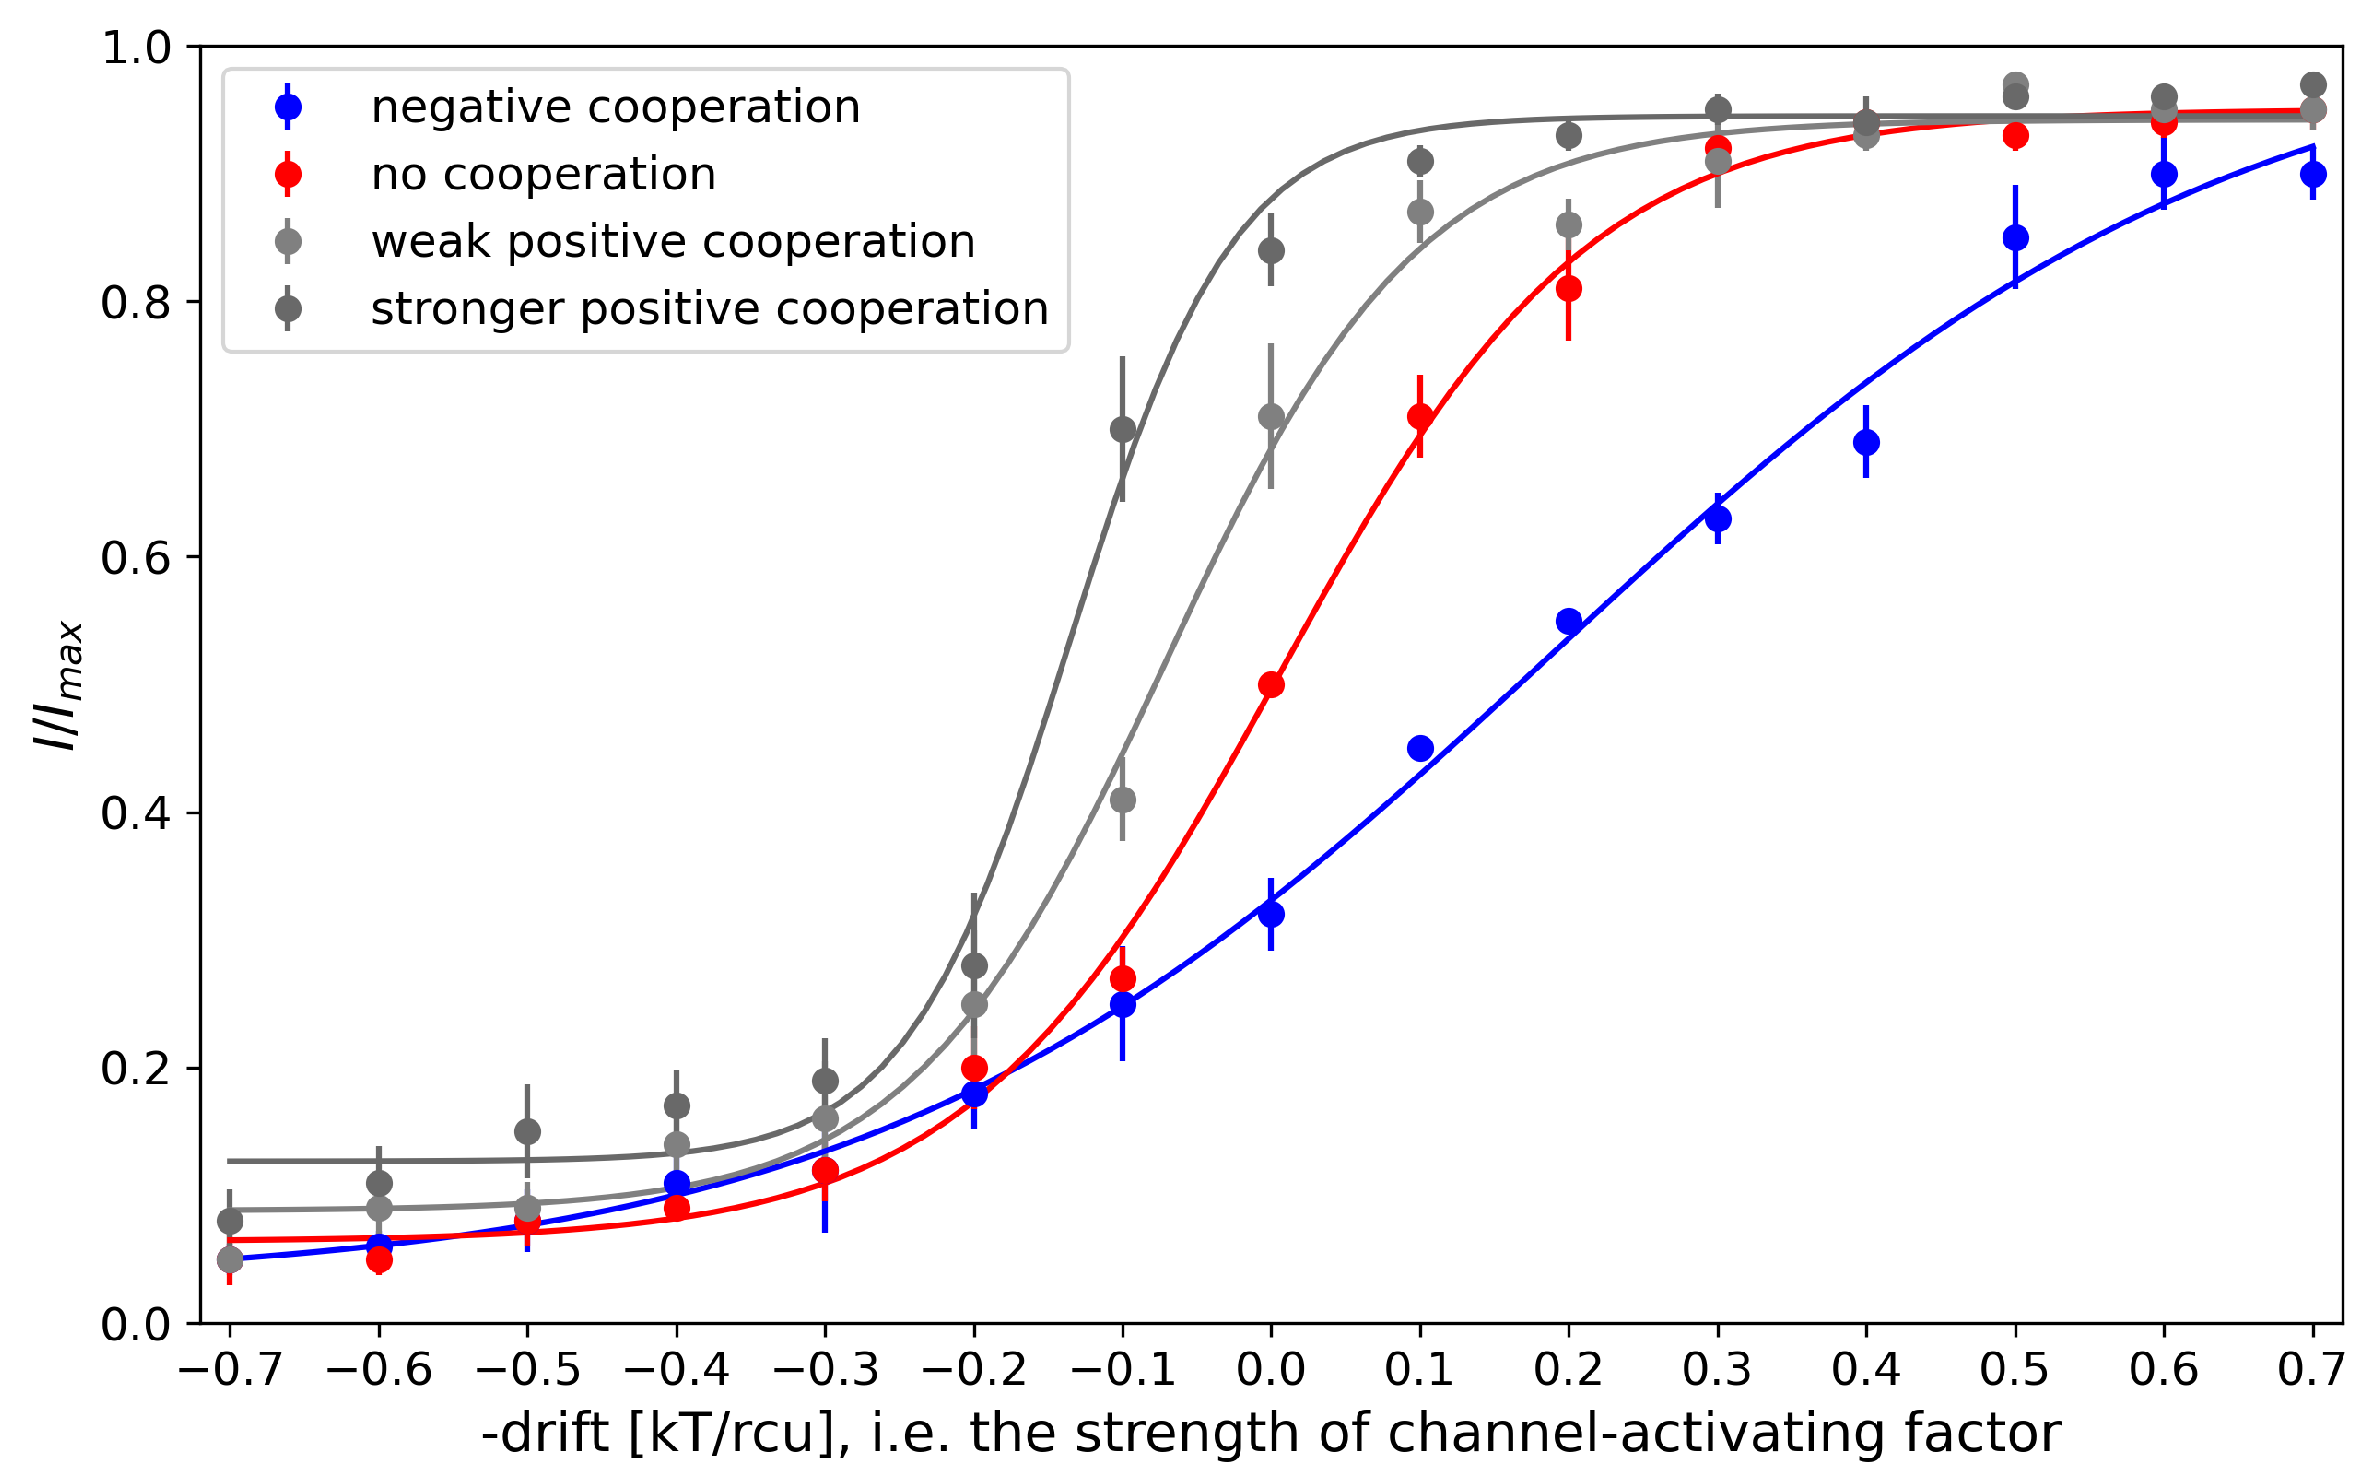
Figure 4.
The relative cluster currents (left panel) and mean number of channels open within the analyzed length of simulation, , (right panel) for different cluster sizes and different strengths of the inter-channel cooperation. The values of and were calculated at half activation of each channel forming a cluster ( = A = 0). Red - no cooperation ( = 0), blue - negative cooperation ( = 0.1 kT/rcu; open state of a channel favors closure of its neighbors), grey - weak positive cooperation ( = -0.05 kT/rcu; open state of a channel favors opening of its neighbors), dark grey - strong positive cooperation ( = -0.1 kT/rcu).
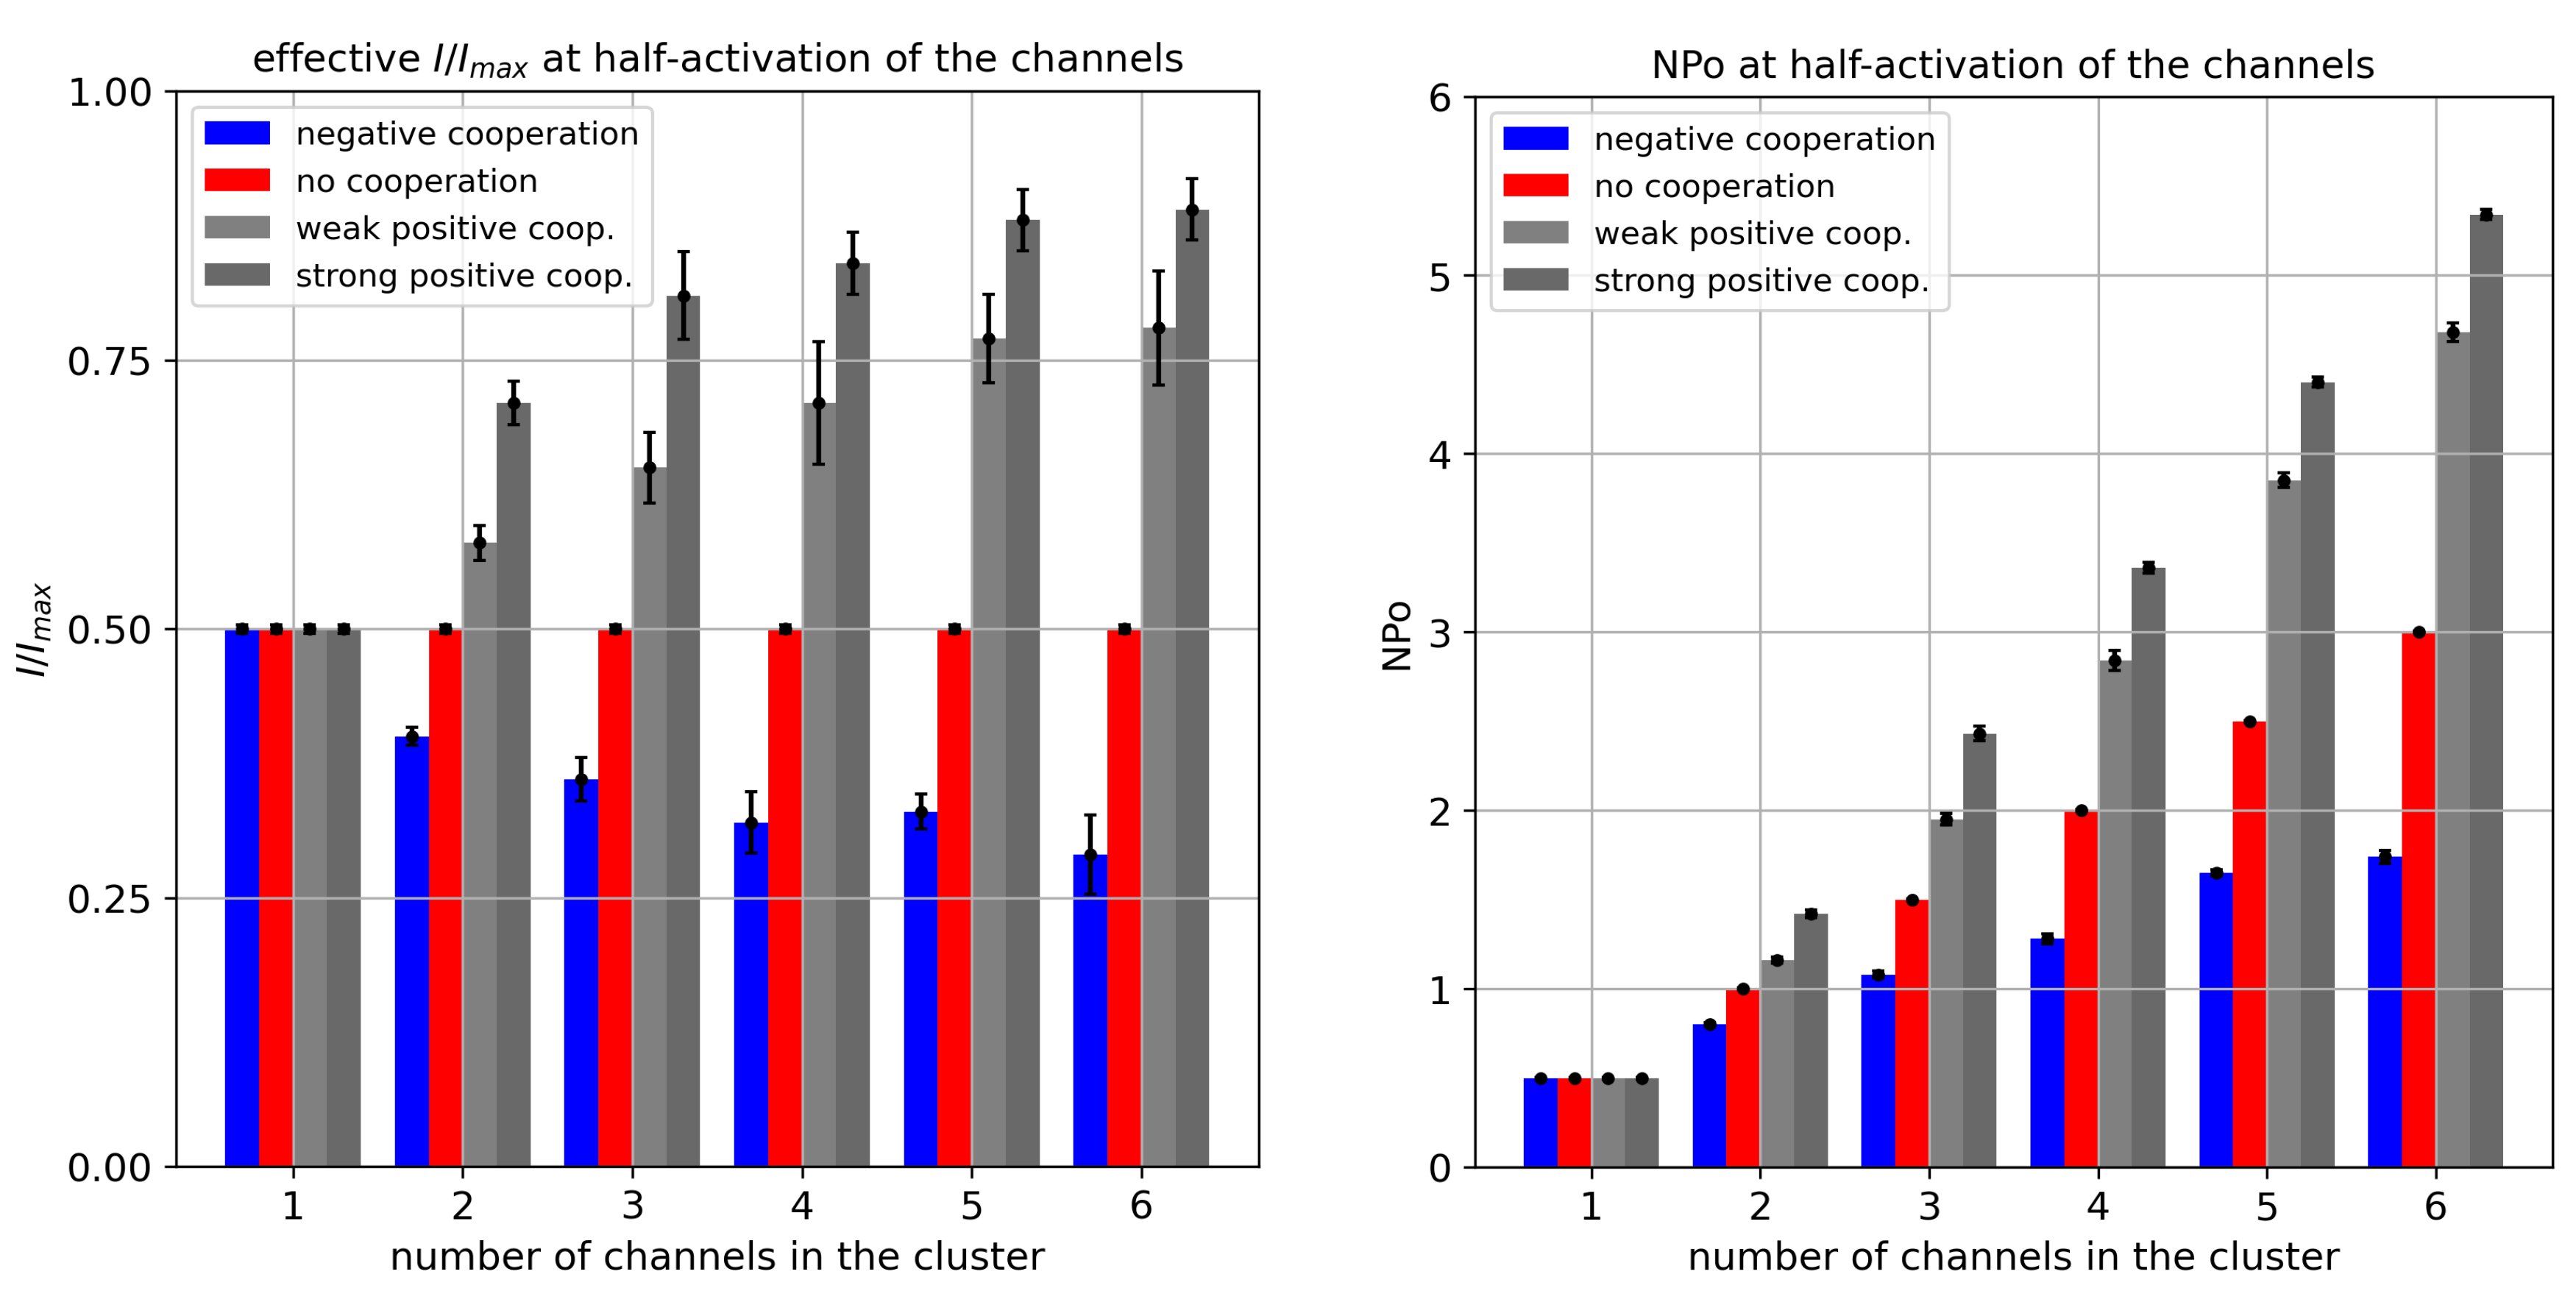
Figure 5.
Shannon entropy of cluster currents evaluated for different cluster sizes and different strengths of the inter-channel cooperation. The data obtained at half-activation of channels (i.e., drift = A = 0). Red - no cooperation ( = 0), blue - negative cooperation ( = 0.1 kT/rcu; open state of a channel favors closure of its neighbors), grey - weak positive cooperation ( = -0.05 kT/rcu; open state of a channel favors opening of its neighbors), dark grey - strong positive cooperation ( = -0.1 kT/rcu).
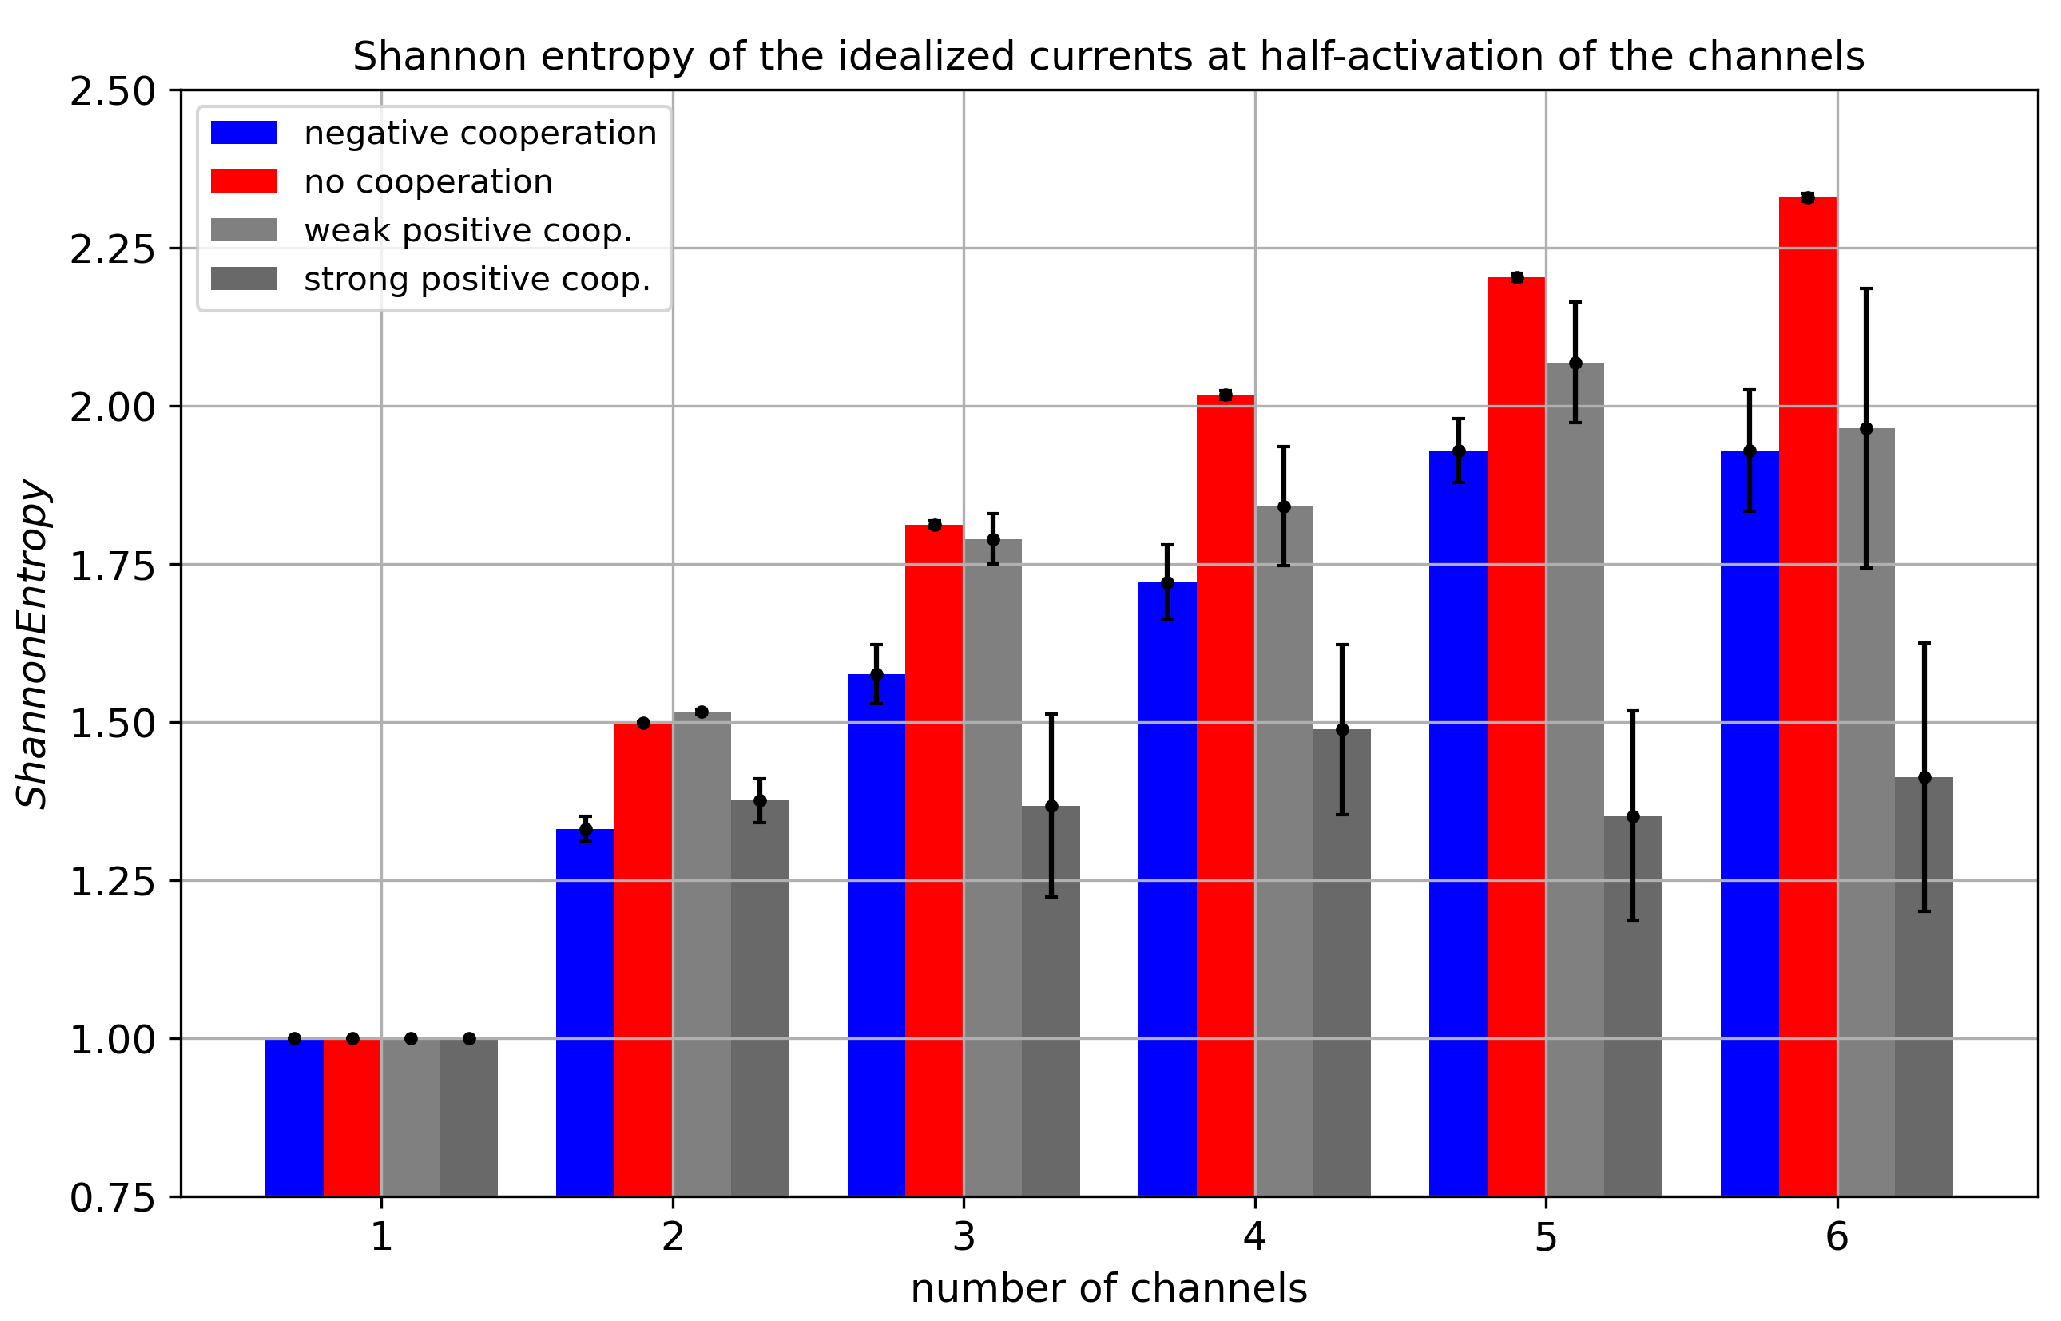
Figure 6.
Histograms of cluster currents evaluated for different cluster sizes and different strengths of the inter-channel cooperation. The data obtained at half-activation of channels (i.e., drift = A = 0). Red - no cooperation ( = 0), blue - negative cooperation ( = 0.1 kT/rcu; open state of a channel favors closure of its neighbors), grey - weak positive cooperation ( = -0.05 kT/rcu; open state of a channel favors opening of its neighbors), dark grey - strong positive cooperation ( = -0.1 kT/rcu). Prob. abbreviates probability.
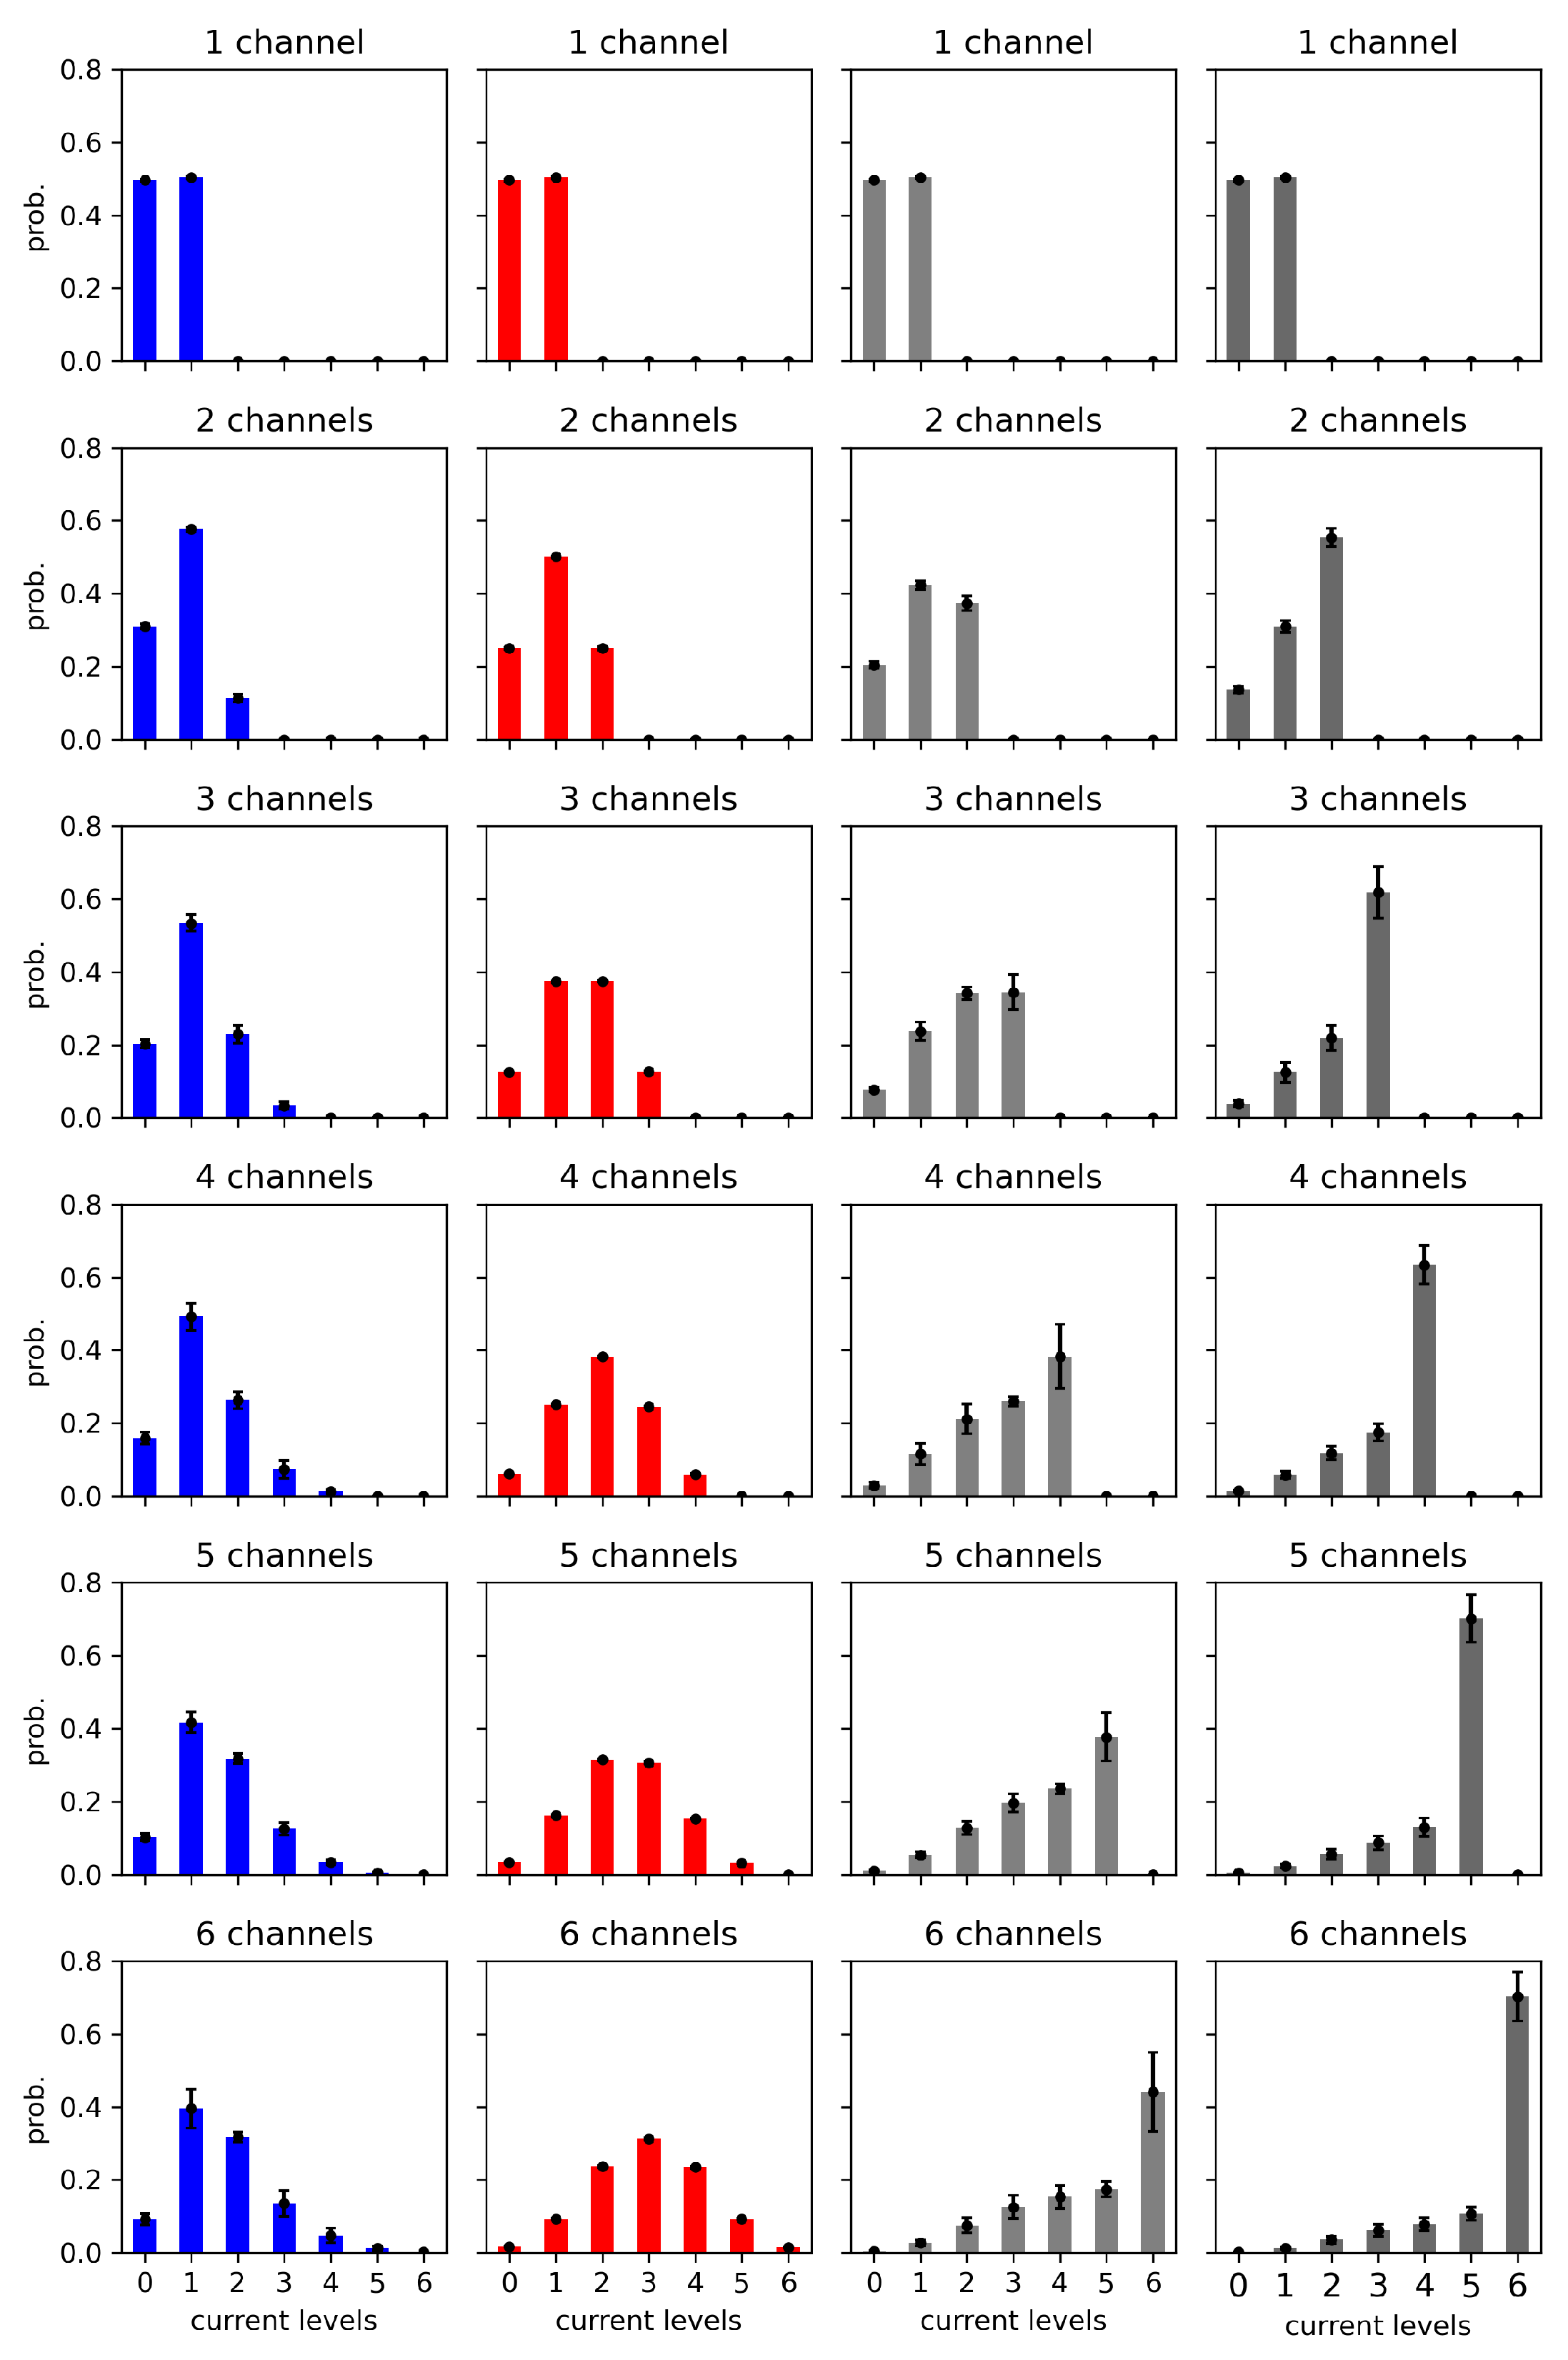
Figure 7.
Shannon entropy of time series of total currents flowing through a 4-channel cluster at different values of the global drift (representing the channel activation level by external stimuli, like, e.g., voltage, ligand concentration) and different strengths of the inter-channel cooperation. Red - no cooperation ( = 0), blue - negative cooperation ( = 0.1 kT/rcu; open state of a channel favors closure of its neighbors), grey - weak positive cooperation ( = -0.05 kT/rcu; open state of a channel favors opening of its neighbors), dark grey - strong positive cooperation ( = -0.1 kT/rcu).
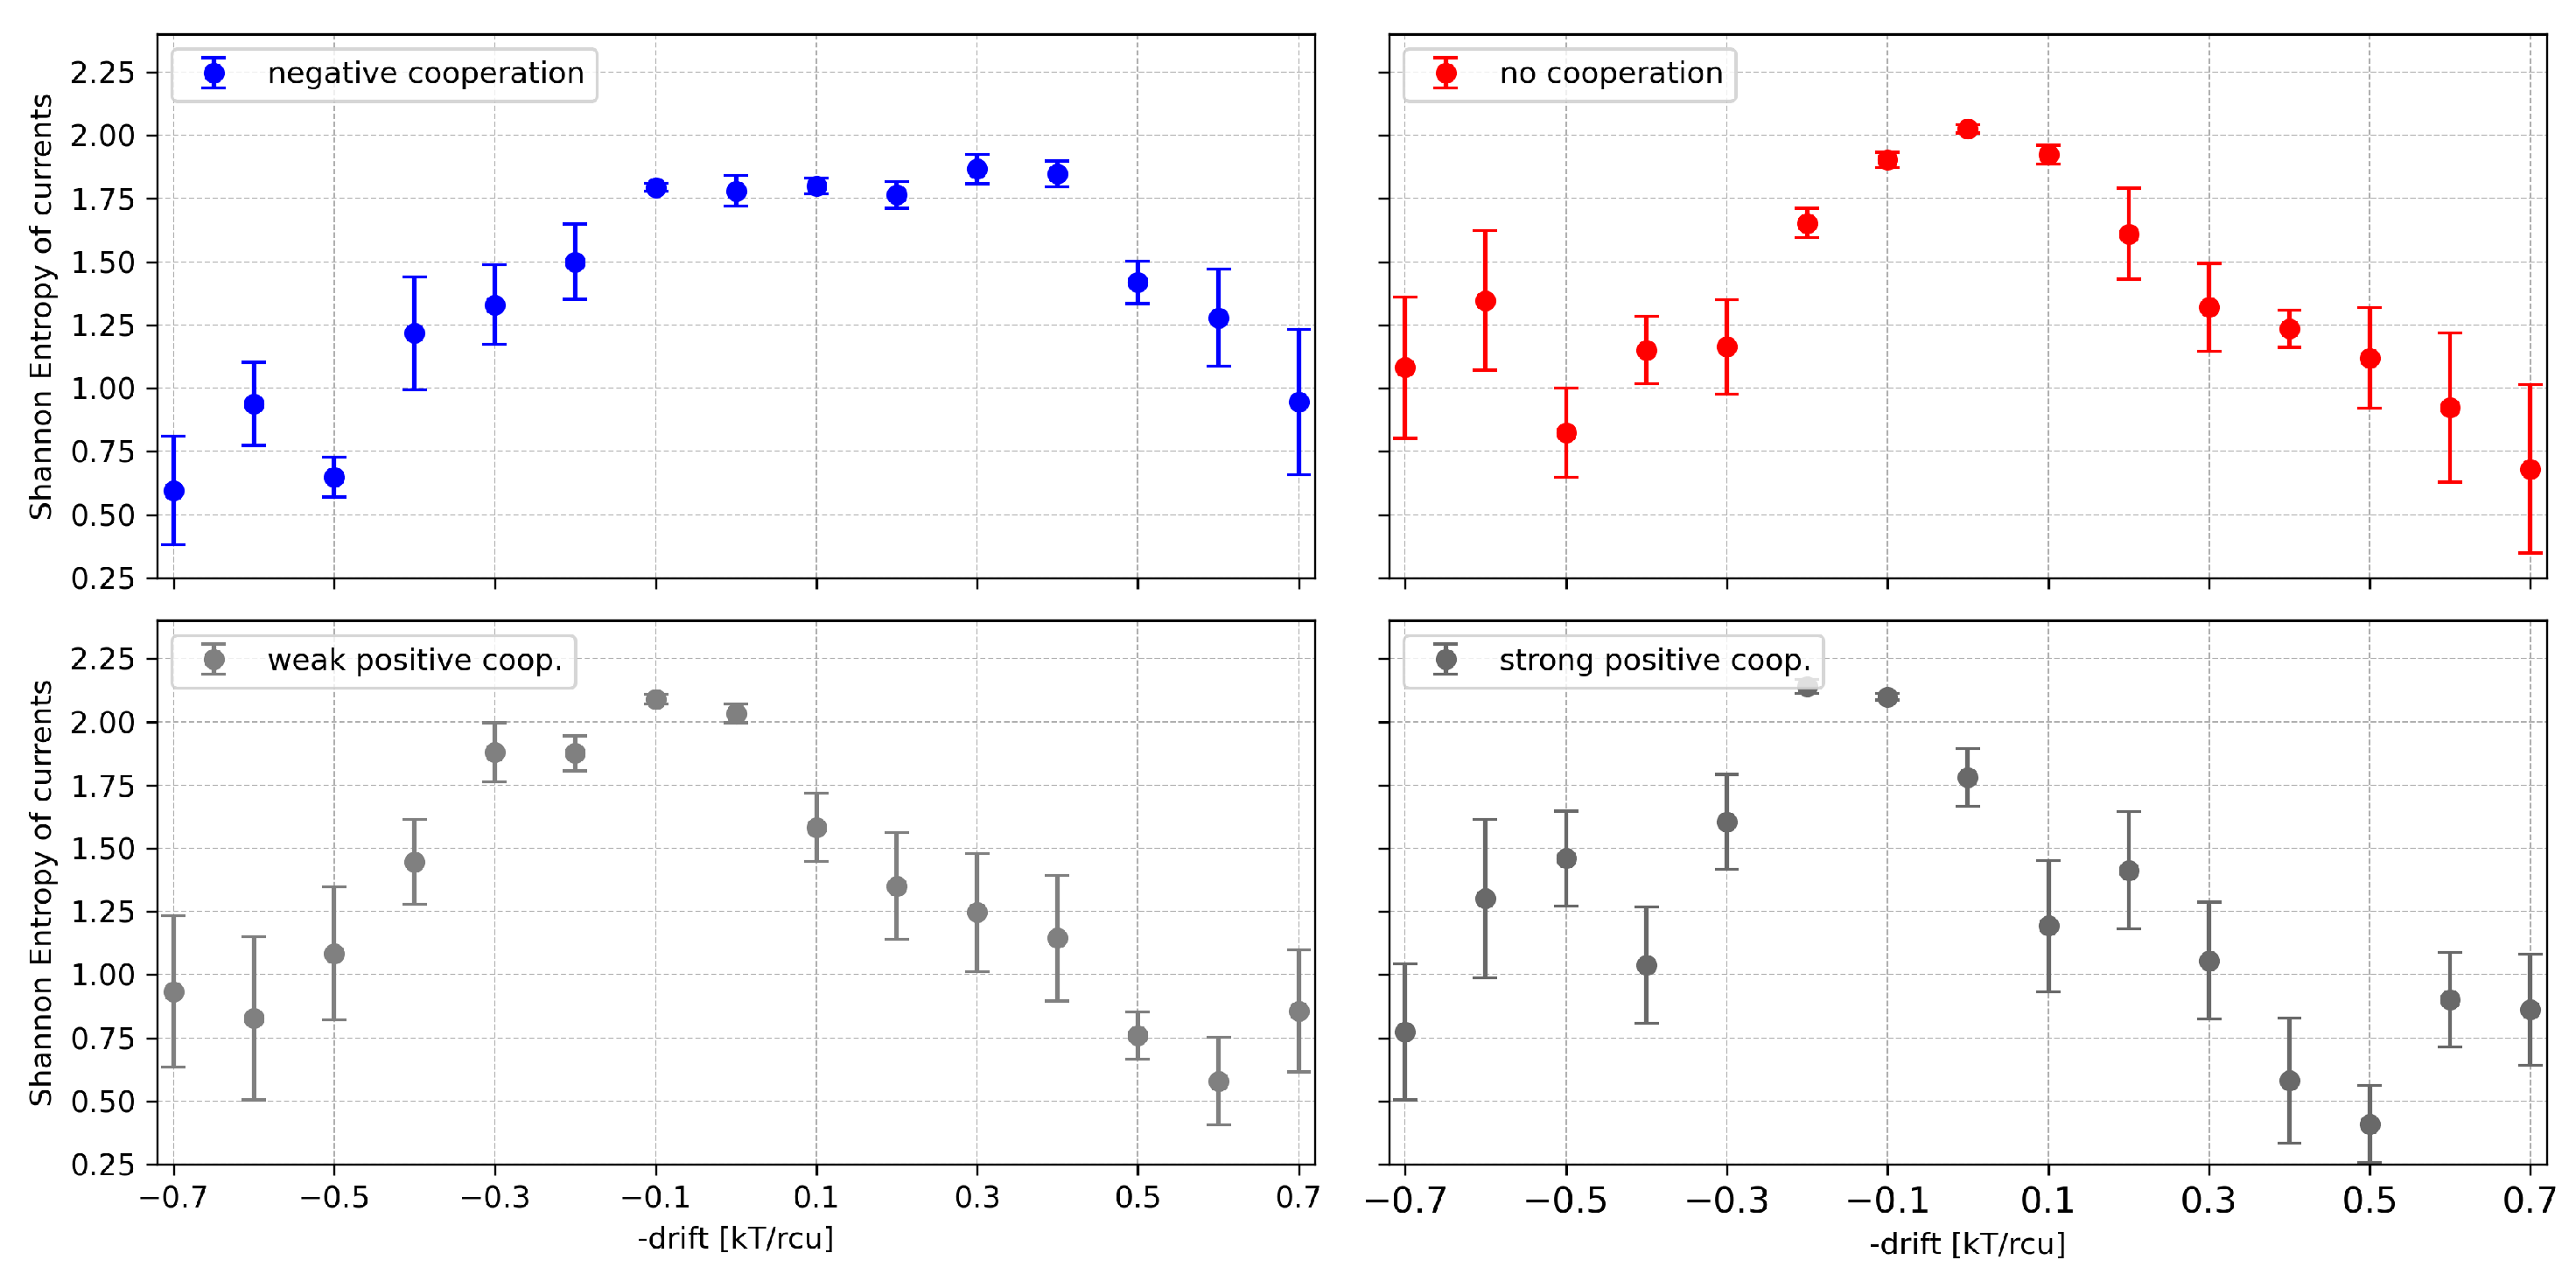
Figure 8.
Shannon entropy of dwell times of cluster states evaluated for different cluster sizes and different strengths of the inter-channel cooperation. The data obtained at half-activation of channels (i.e., drift = A = 0). Red - no cooperation ( = 0), blue - negative cooperation ( = 0.1 kT/rcu; open state of a channel favors closure of its neighbors), grey - weak positive cooperation ( = -0.05 kT/rcu; open state of a channel favors opening of its neighbors), dark grey - strong positive cooperation ( = -0.1 kT/rcu).
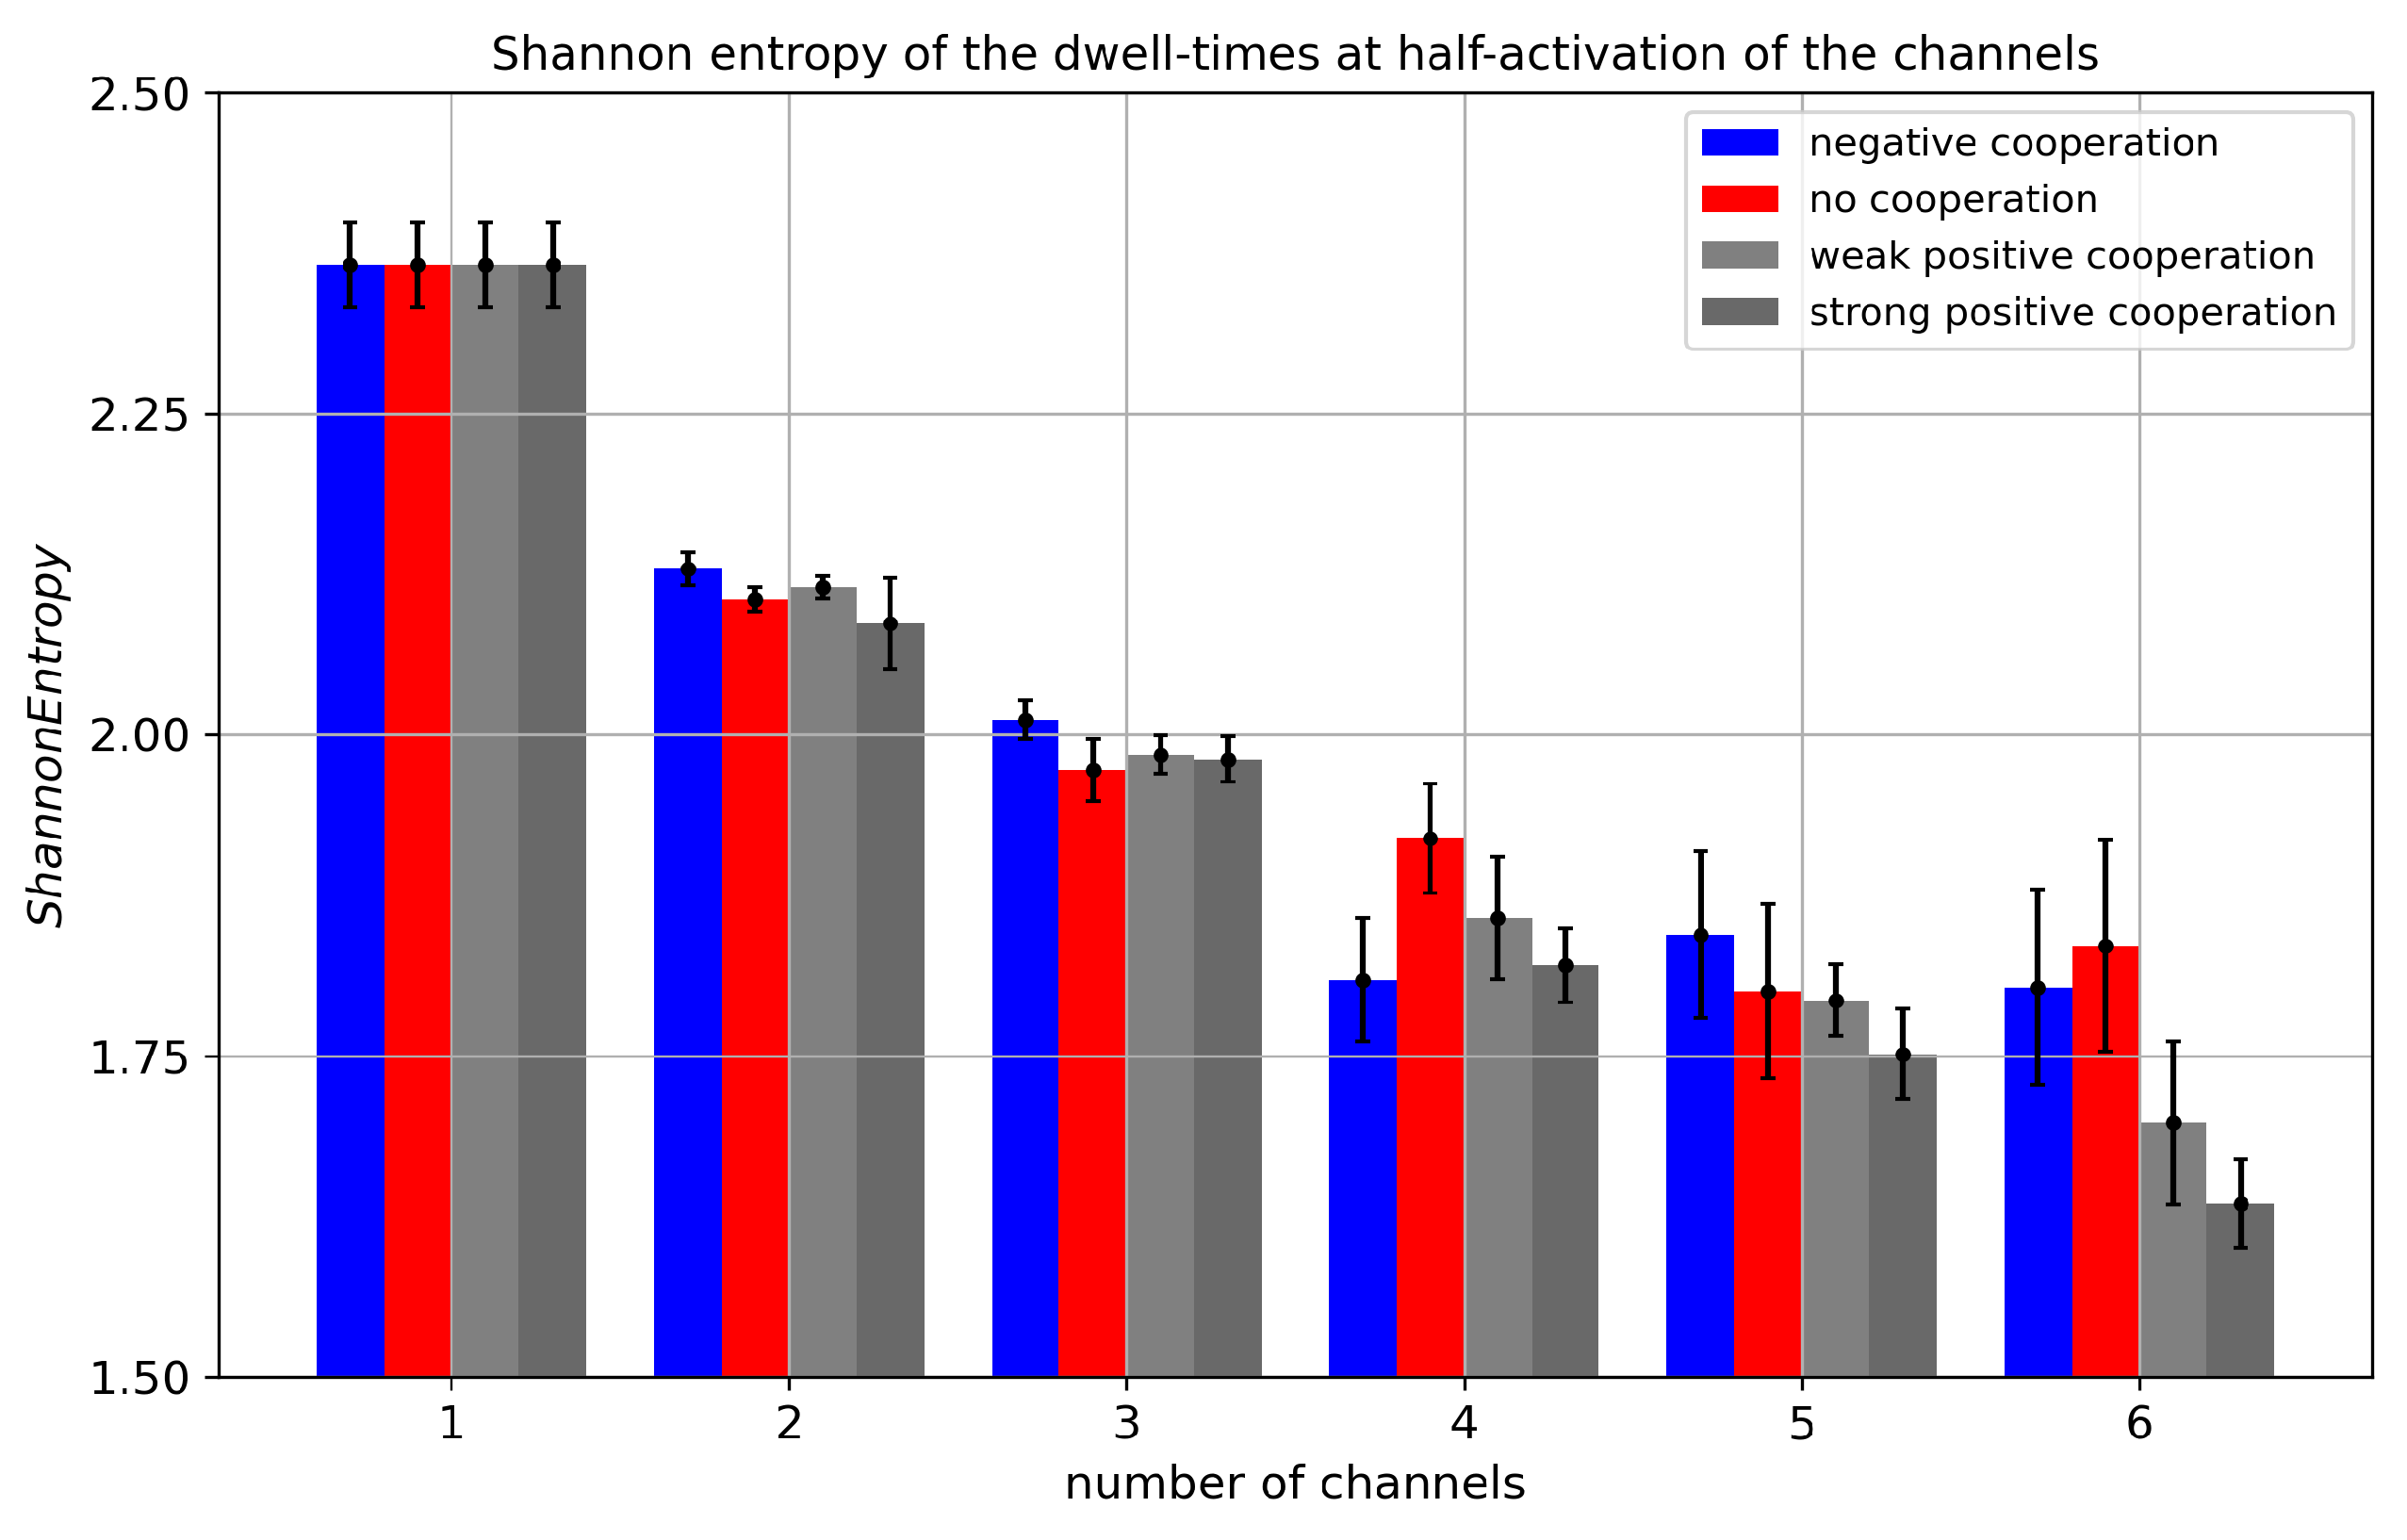
Figure 9.
Histograms of dwell-times of cluster states evaluated for different strengths of the inter-channel cooperation at = 6. The data obtained at half-activation of channels (i.e., drift = A = 0). Red - no cooperation ( = 0), blue - negative cooperation ( = 0.1 kT/rcu; open state of a channel favors closure of its neighbors), grey - weak positive cooperation ( = -0.05 kT/rcu; open state of a channel favors opening of its neighbors), dark grey - strong positive cooperation ( = -0.1 kT/rcu). Prob. abbreviates probability.
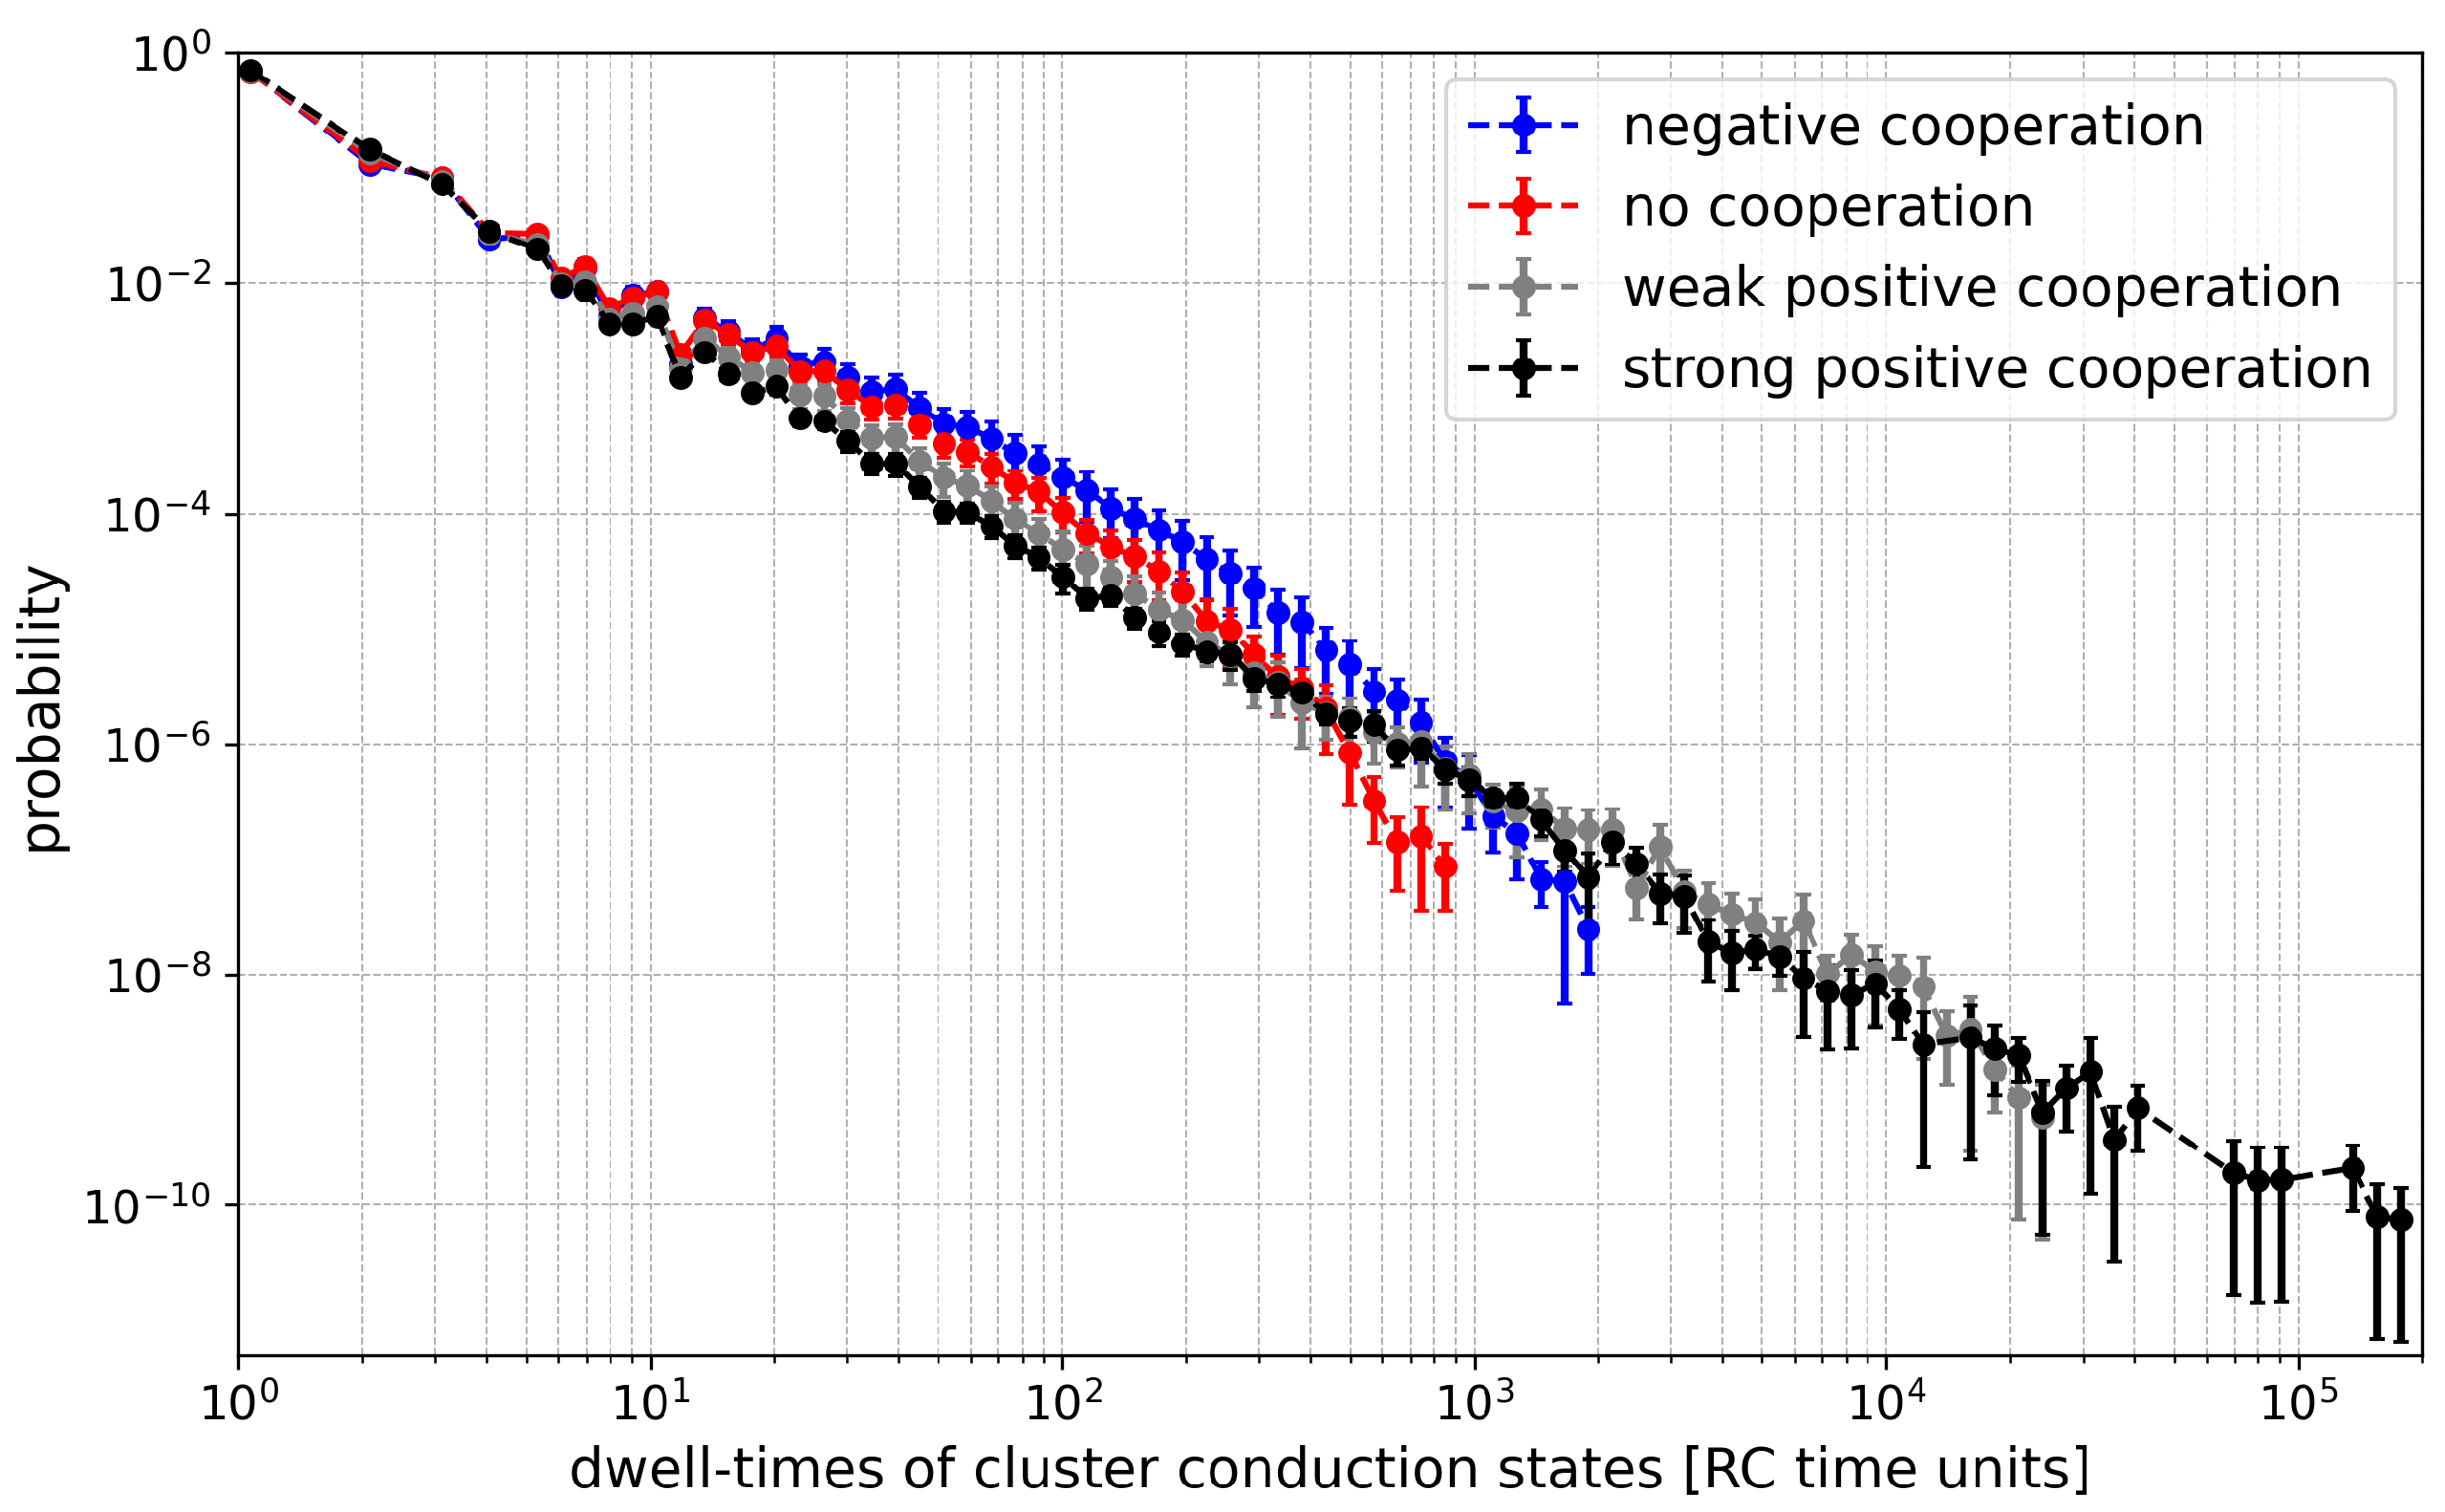
Figure 11.
The dependency of average Sample entropy (SampEn) describing dwell-time series of channel cluster states on window size at the sequence length m = 2. The presented SampEns were evaluated for different number of channels in the cluster (depicted in different colors). No cooperation between the channels is assumed. The error is given by standard deviation of a sample population (SE).
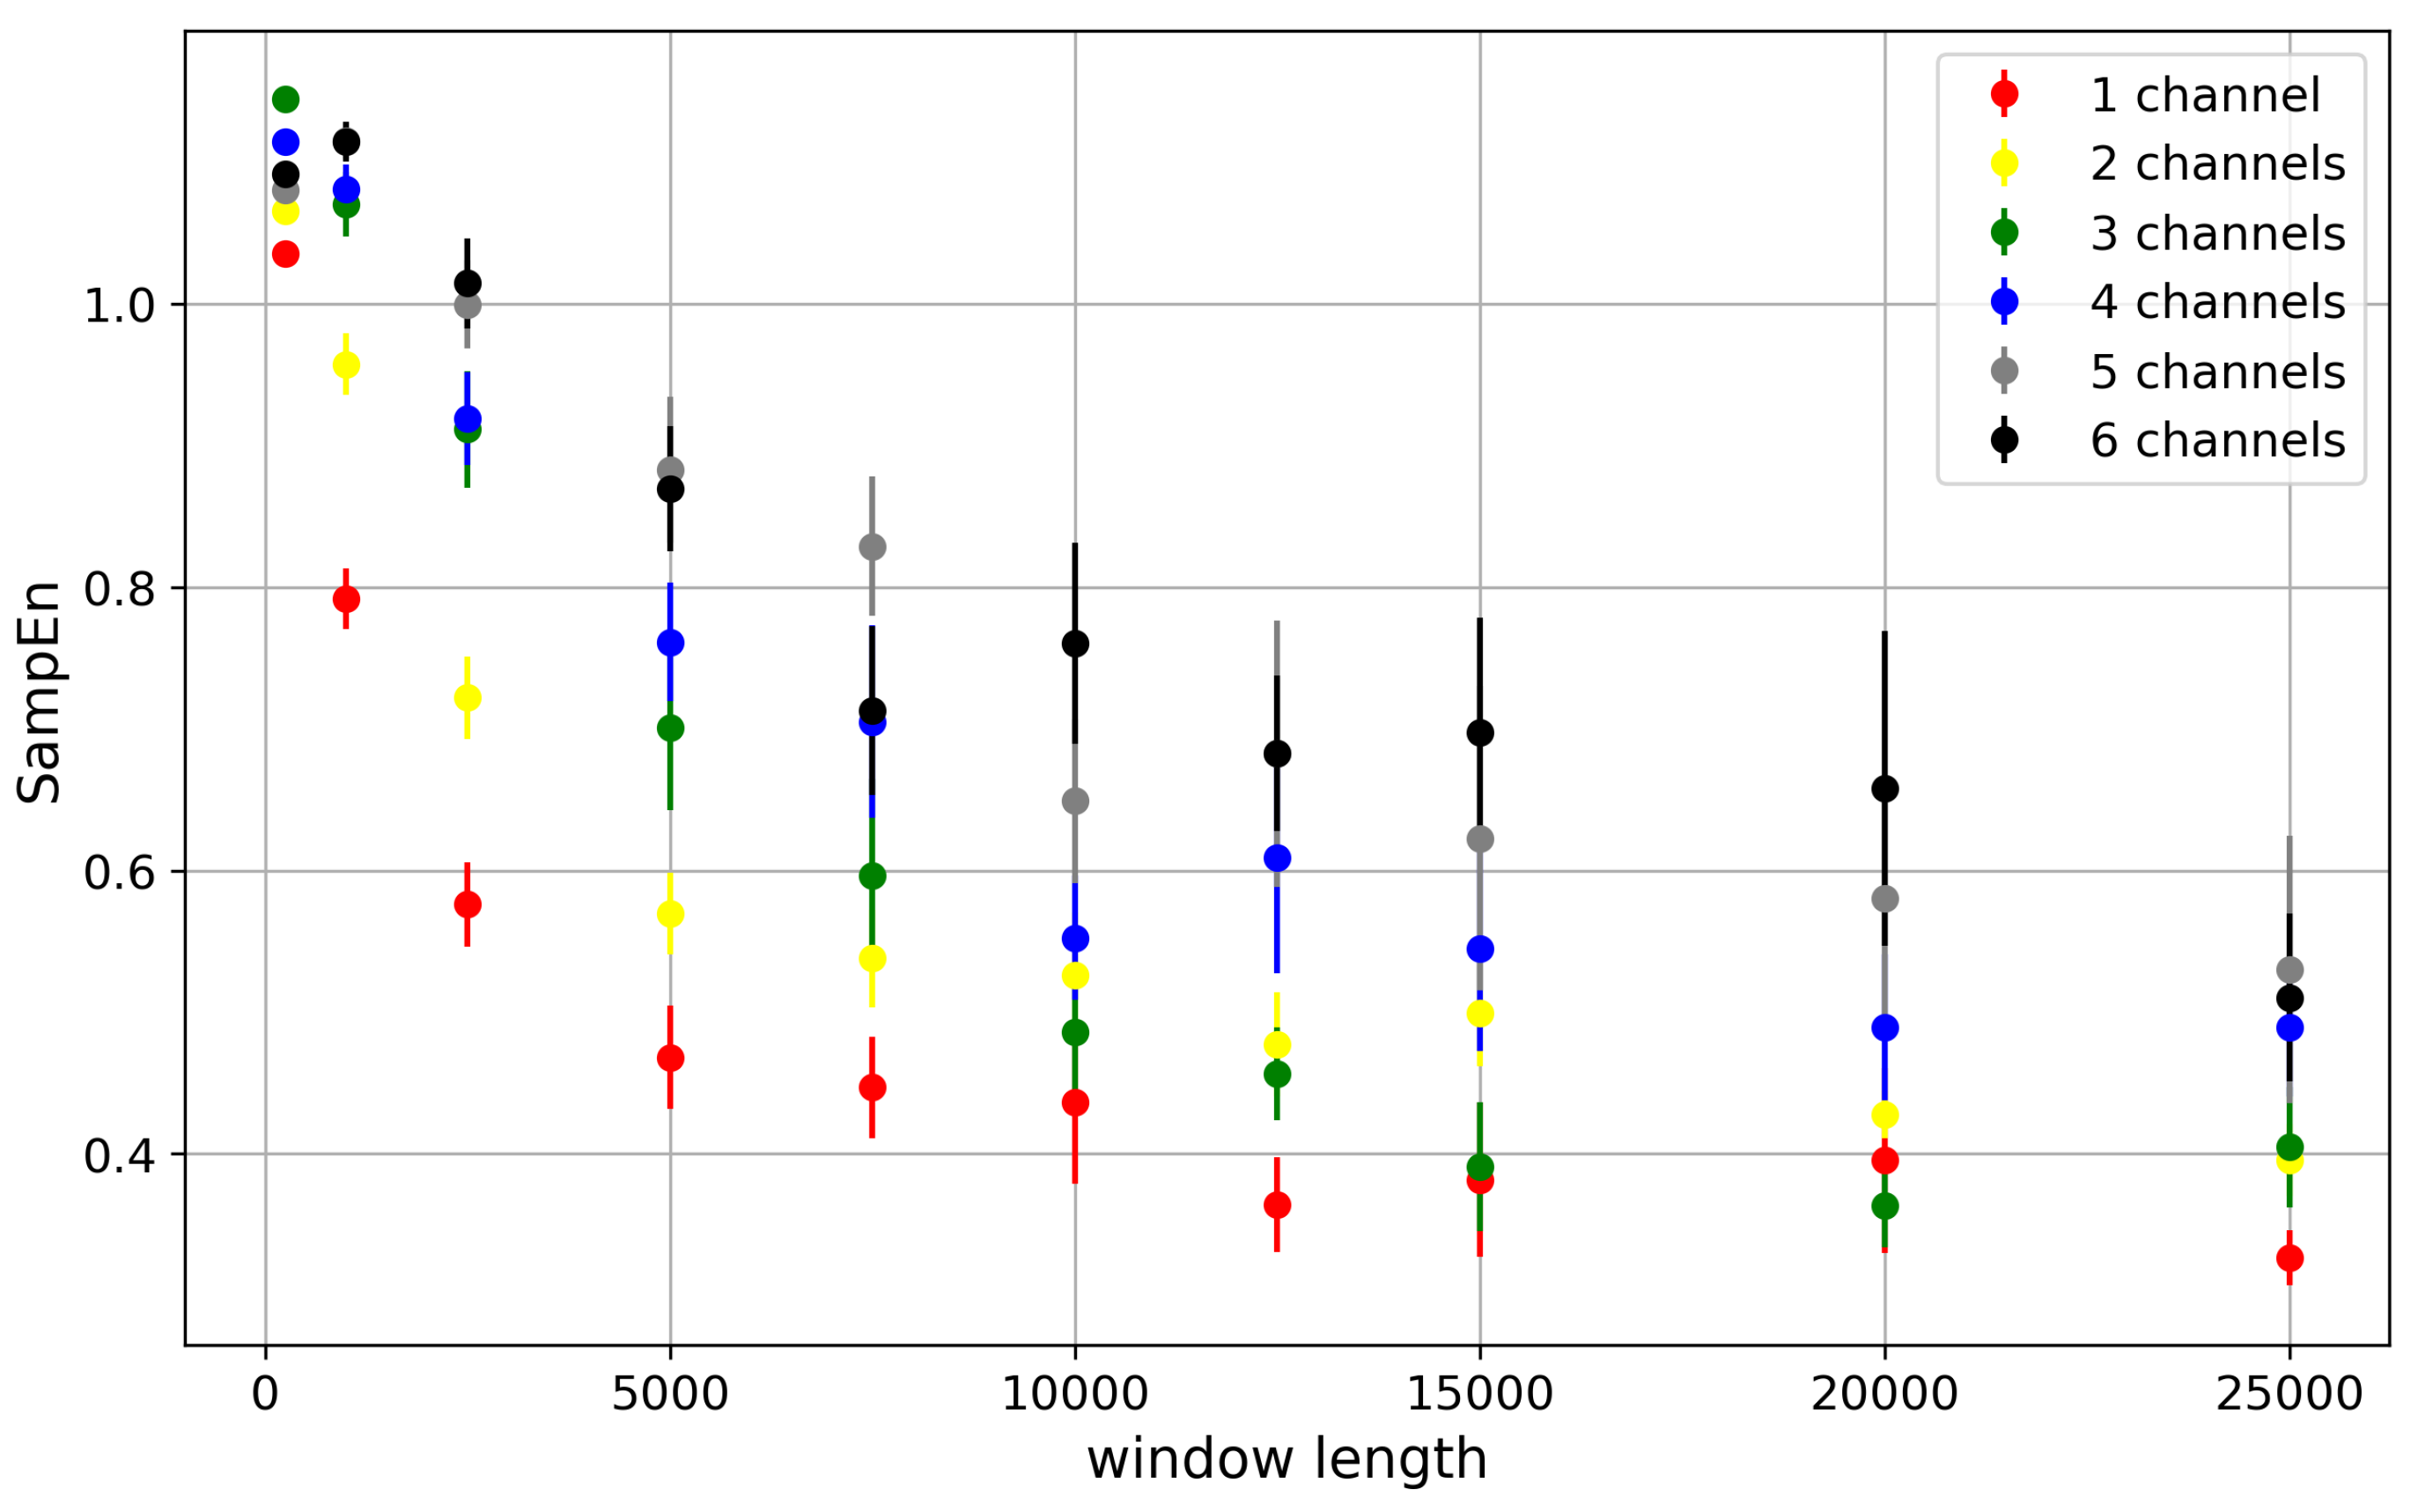
Figure 12.
Sample entropy of dwell times of cluster states evaluated for different cluster sizes and different strengths of the inter-channel cooperation. SampEn was calculated for the segment-length parameter m equal to 2 (top panel), 3 (middle panel), and 4 (bottom panel) at half-activation of channels (i.e., for drift = A = 0). Red - no cooperation ( = 0), blue - negative cooperation ( = 0.1 [kT/rcu]; open state of a channel favors closure of its neighbors), gray - weak positive cooperation ( = -0.05 [kT/rcu]; open state of a channel favors opening of its neighbors), dark gray - strong positive cooperation ( = -0.1 [kT/rcu]). The green hatched bar indicates the results for one channel.
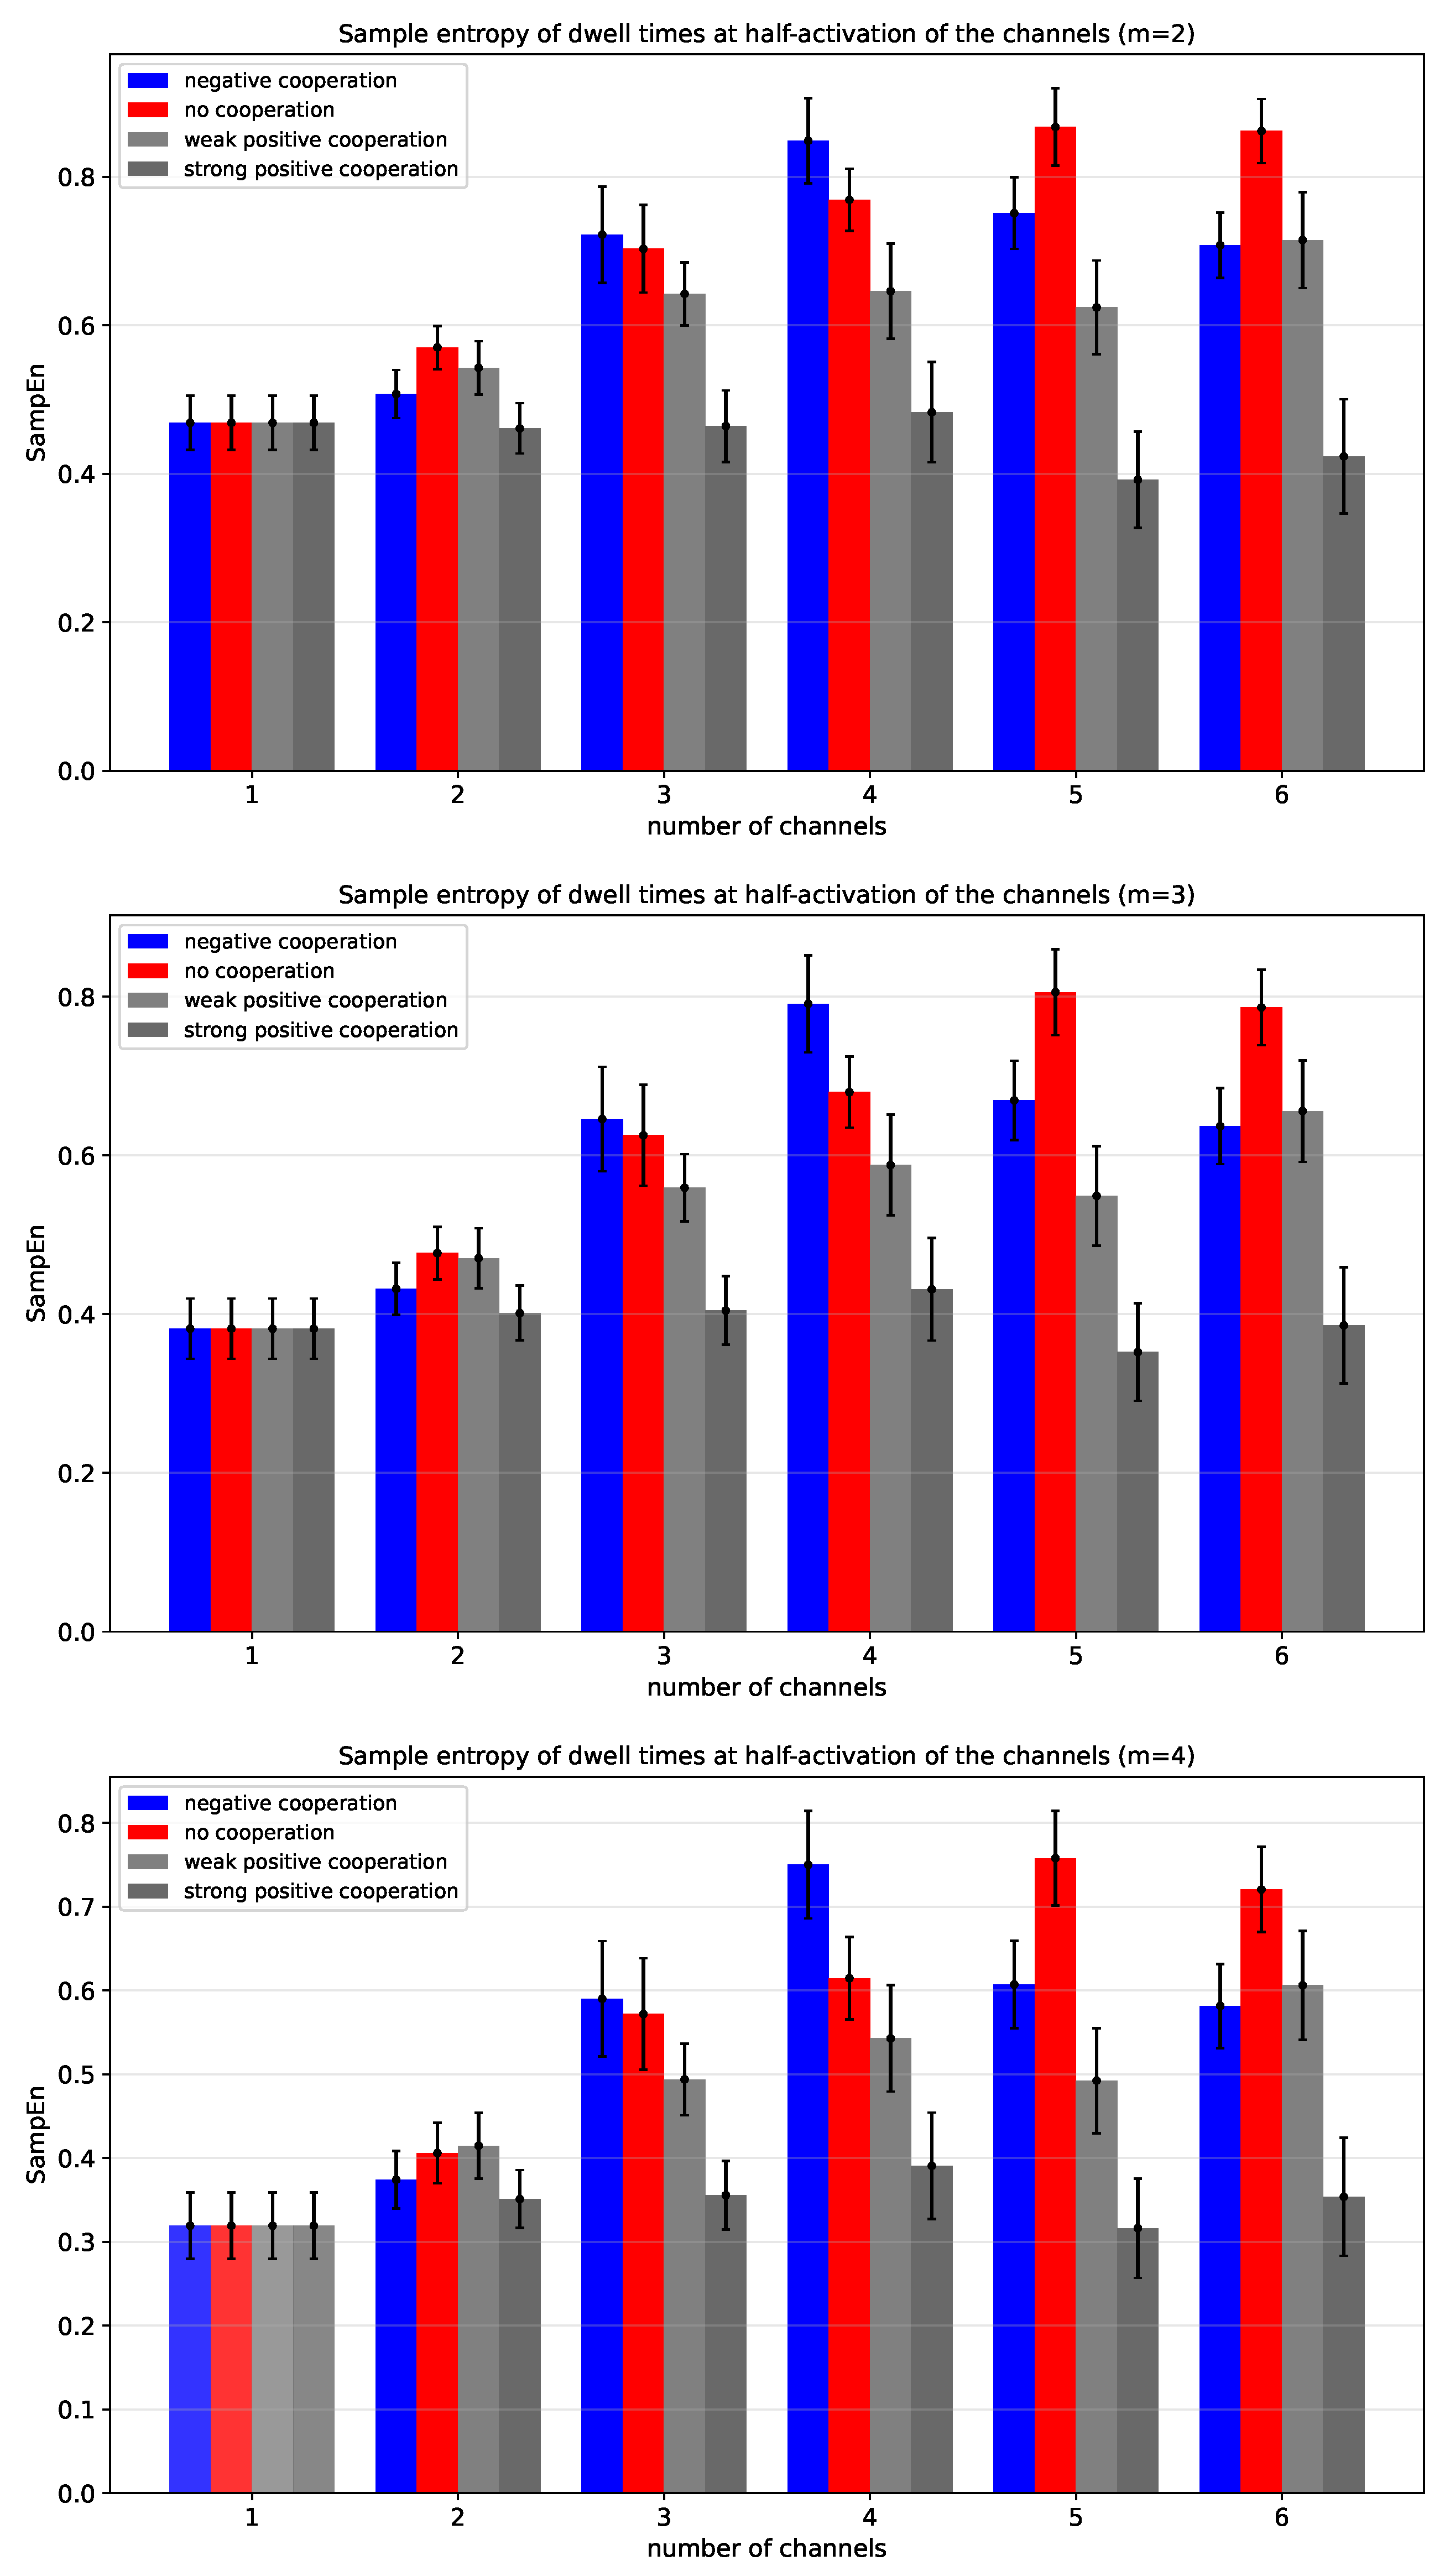
Figure 13.
The dependency of on the drift force for 4-channel cluster cooperating with different values of the global drift (representing the channel activation level by external stimuli, like, e.g., voltage, ligand concentration) and different strengths of the inter-channel cooperation. Red - no cooperation ( = 0), blue - negative cooperation ( = 0.1 kT/rcu; open state of a channel favors closure of its neighbors), grey - weak positive cooperation ( = -0.05 kT/rcu; open state of a channel favors opening of its neighbors), dark grey - strong positive cooperation ( = -0.1 kT/rcu). Each plot contains the results calculated for the different segment-length parameter: m=2, m=3, m=4. The errorbars depict the standard errors of the mean.
Disclaimer/Publisher’s Note: The statements, opinions and data contained in all publications are solely those of the individual author(s) and contributor(s) and not of MDPI and/or the editor(s). MDPI and/or the editor(s) disclaim responsibility for any injury to people or property resulting from any ideas, methods, instructions or products referred to in the content. |
© 2025 by the authors. Licensee MDPI, Basel, Switzerland. This article is an open access article distributed under the terms and conditions of the Creative Commons Attribution (CC BY) license (http://creativecommons.org/licenses/by/4.0/).
Copyright: This open access article is published under a Creative Commons CC BY 4.0 license, which permit the free download, distribution, and reuse, provided that the author and preprint are cited in any reuse.


