
Submitted:
30 December 2025
Posted:
31 December 2025
You are already at the latest version
Abstract
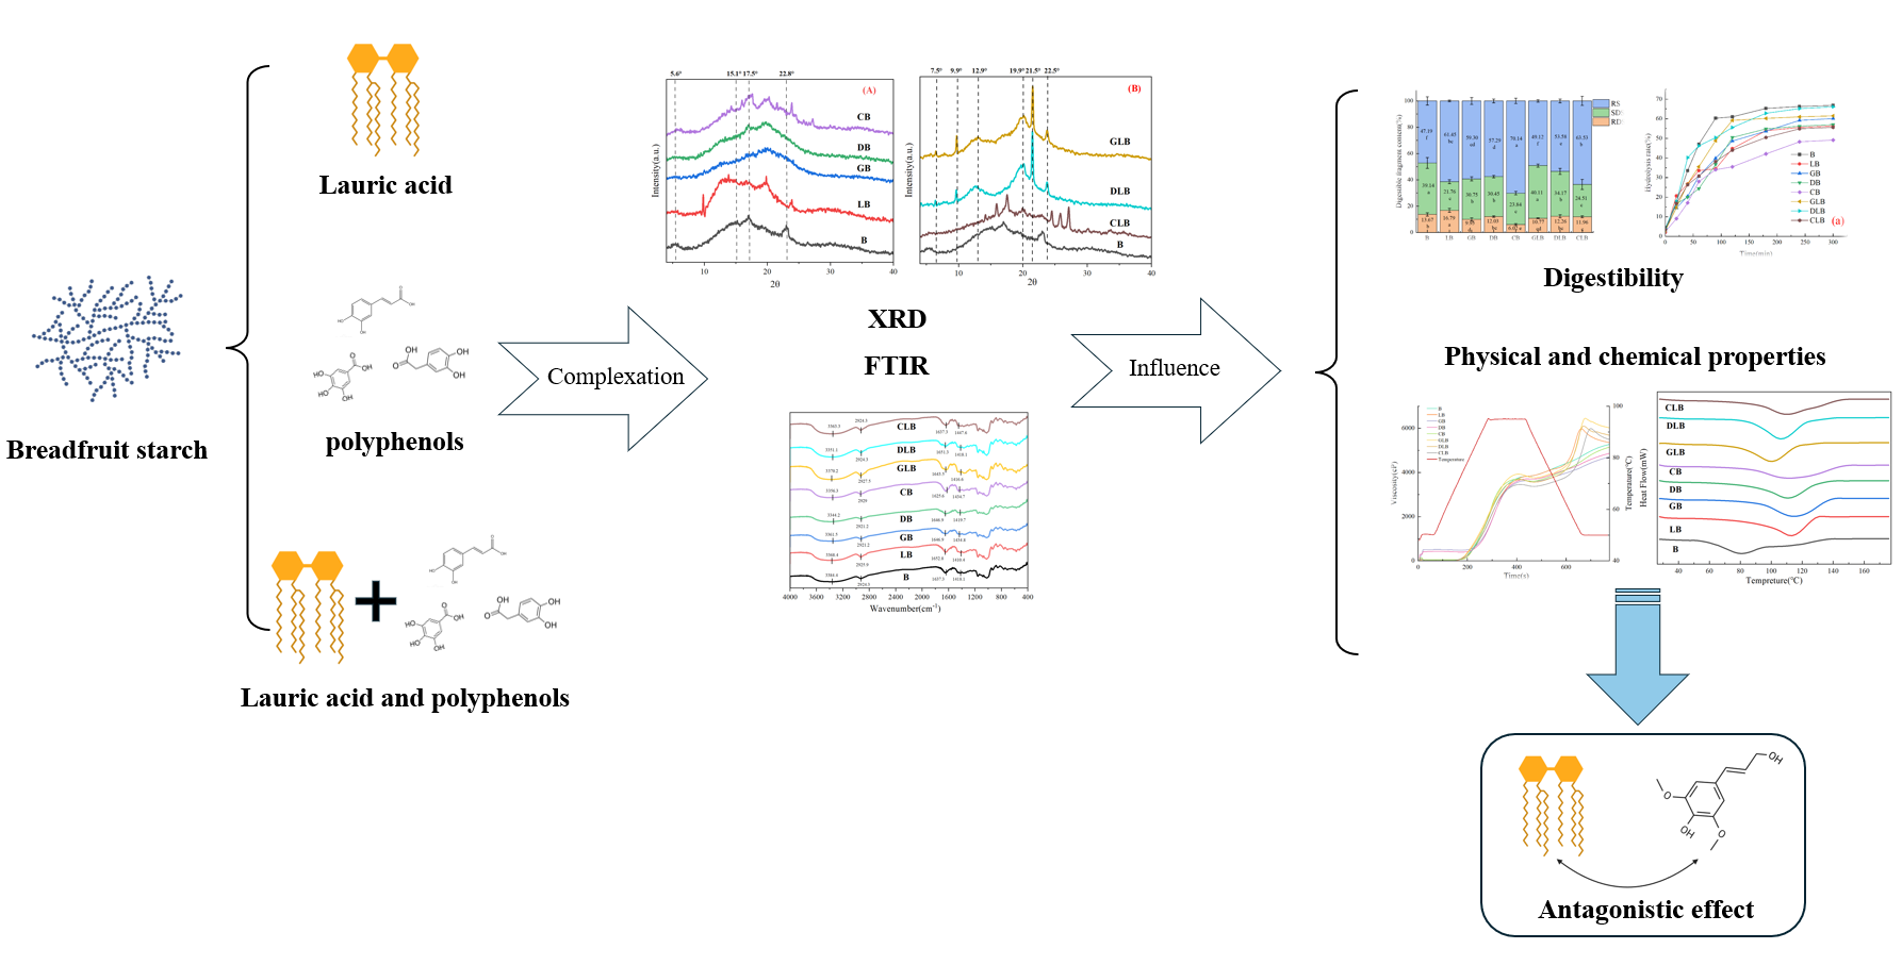
This study investigated how complexes formed by lauric acid (LA) and polyphenols (gallic acid, GA; 3,4-dihydroxyphenylacetic acid, DOPAC; caffeic acid, CA) with bread-fruit starch affect starch’s digestibility and properties. The digestibility resistance of ternary complexes was not superior to that of binary complexes but remained higher than native starch. Among them, the CA complex (CB) showed the highest RS and the lowest hydrolysis, indicating CA's prominent role in enhancing digestibility resistance. A decreased breakdown value and increased gelatinization temperatures were revealed, indicating inhibited gelatinization. During cooling phase, samples with LA showed viscosity peaks, confirming V-type complex formation, which was absent in polyphe-nol-only samples. R1047/1022 and Rc values were increased in complexes. Ternary complexes exhibited a lower R1047/1022 ratio but a higher Rc than binary complexes, suggesting LA mainly influenced long-range order, while polyphenols affected both short- and long-range order. This may explain the antagonistic effect on digestibility in ternary complexes.
Keywords:
breadfruit starch
; lauric acid
; phenolic acids
; complexes
; in vitro digestibility
1. Introduction
Starch, a polymeric carbohydrate widely present in plant roots, stems, seeds, and fruits, provides energy to organisms through enzymatic hydrolysis into glucose, playing a vital role in sustaining life activities. In recent years, the global incidence of metabolic diseases has risen significantly, with diabetes and other conditions characterized by postprandial hyperglycemia being particularly prominent. In this context, food science has increasingly focused on enhancing starch digestibility resistance and developing low glycemic index (GI) foods.
Based on digestive properties, starch is classified into three categories: rapidly digestible starch (RDS), slowly digestible starch (SDS), and resistant starch (RS). Among these, SDS and RS contents exhibit a positive correlation with digestibility resistance and a negative correlation with postprandial glycemic response. Studies indicate that lipids and polyphenols can form complexes with starch through non-covalent interactions—including hydrophobic interactions, electrostatic forces, and hydrogen bonds—thereby increasing SDS and RS contents, enhancing digestibility resistance, and significantly altering physicochemical properties [1]. These interactions typically result in two types of complexes: V-type complexes and non-inclusion complexes. Starch-lipid V-type complexes, also known as RS5, are classified as a type of resistant starch [2]. Polyphenols, in addition to forming V-type complexes, can establish non-inclusion complexes with starch molecules via hydrogen bonding between their carbonyl and hydroxyl groups, further influencing starch digestibility [3]. Current research on starch complexes has predominantly focused on protein-lipid-starch ternary systems. Studies have reported synergistic effects between proteins and lipids in regulating starch digestibility, with ternary complexes typically showing stronger resistance to digestion and slower retrogradation rates compared with binary systems [4,5]. However, studies on polyphenol-lipid-starch ternary complexes remain scarce, and their interaction mechanisms are not fully understood.
Breadfruit, a large tropical cash crop belonging to the Moraceae family and the Artocarpus genus, includes more than one hundred varieties and is native to the Pacific and Malay archipelagos [6], Introduced to China in 1992, it is now cultivated in regions such as Hainan and Guangdong. The white pulp of breadfruit is rich in carbohydrates, proteins, dietary fiber, vitamins, and trace elements. With its high RS content and low-fat levels, breadfruit starch shows promise for developing low-GI foods [7]. Although recent studies have investigated the physicochemical properties of breadfruit starch, knowledge regarding its interactions with polyphenol-lipid composite systems remains limited. Thus, investigating the interactions among polyphenols, lipids, and Breadfruit starch is of considerable importance. Given the current research gaps, we hypothesize that Polyphenols and fatty acids can simultaneously form multi-component complex with breadfruit starch and form a synergistic enhancement effect, affecting the anti-digestibility and other properties of breadfruit starch.
In this study, three phenolic acids—gallic acid (GA), 3,4-dihydroxyphenylacetic acid (DOPAC), and caffeic acid (CA)—and a medium-chain fatty acid, lauric acid (LA), were selected to systematically investigate the effect of their multi-component complexes with breadfruit starch on the properties of breadfruit starch. The three selected polyphenols exhibit similar structure with different function groups. They all have a benzene ring and a carboxyl group, which is the basis of their similarity. However, the "bridge" connecting carboxyl groups and benzene rings, as well as the different positions of hydroxyl groups on the benzene ring, result in significant differences in their molecular conformation and chemical properties. Gallic acid features an ortho-trihydroxyphenyl structure with a formic acid side chain, 3,4-dihydroxyphenylacetic acid possesses an ortho-dihydroxyphenyl ring and a flexible acetic acid side chain, while caffeic acid similarly contains an ortho-dihydroxyphenyl ring along with a conjugated acrylic acid side chain. These structural features are often closely associated with hydrogen bonding interactions, which facilitates a clear contrast with the lauric acid–starch interplay. This selection aids in investigating how the molecular structures of ligands cooperatively or competitively influence the properties of small molecule complexes formed with breadfruit starch, thereby offering experimental insights for modulating starch functional properties. This study systematically investigated the effects of the complexes formed between the above three polyphenols, lauric acid, and breadfruit starch on breadfruit starch properties, thereby provide experimental insights into the interaction mechanisms of polyphenol-lipid-starch complexes and to establish a foundation for the development of functional starch-based foods.
2. Materials and Methods
2.1. Materials
Breadfruit starch (Breadfruit Starch, B) was provided by the Spice and Beverage Research Institute, Chinese Academy of Tropical Agricultural Sciences. Gallic acid (GA), 3,4-dihydroxyphenylacetic acid (DOPAC), and caffeic acid (CA) were purchased from Shanghai Yuanye Bio-Technology Co., Ltd. Lauric acid (LA) was obtained from Shanghai Aladdin Biochemical Technology Co., Ltd. The starch content assay kit (Amyloglucosidase/α-Amylase Method), protein content assay kit (Coomassie Brilliant Blue method), and glucose content assay kit were purchased from Suzhou Grace Biotechnology Co., Ltd. α-amylase (Porcine pancreatic) and amyloglucosidase were purchased from Shanghai Yuanye Bio-Technology Co., Ltd. Potassium iodide and iodine (Analytical Reagent grade) were purchased from Shanghai Yuanye Bio-Technology Co., Ltd. The GOPOD Assay Kit (Glucose Oxidase-Peroxidase) was purchased from Suzhou Geruisi Biotechnology Co., Ltd.
2.2. Extraction of Breadfruit Starch
Breadfruit starch was extracted according to the method of Zhong et al. [8] with slight modifications. Fresh breadfruit was thawed, peeled, washed, and sliced. The slices were mixed with deionized water at a solid-to-liquid ratio of 1:3 (g/mL) and homogenized in a multifunctional blender for 30 s. A 0.15% neutral protease solution was added, and the mixture was transferred to conical flasks. The flasks were incubated in a shaking incubator at 55 °C (150 rpm) for 24 h. After incubation, the slurry was filtered through a 100-mesh sieve. The residue was washed twice with deionized water, and the filtrates were combined and allowed to settle at room temperature for 2 h. The supernatant was discarded, and the flocculent precipitate was washed with distilled water. The precipitate was centrifuged at 8000 rpm for 15 min, after which the upper yellowish layer was carefully removed. The precipitate was washed and centrifuged twice more. The flocculant was collected, freeze-dried under vacuum, ground into powder, and stored at room temperature for further analysis.
2.3. Compositional Analysis of Extracted Starch Samples
The extracted starch samples were analyzed for proximate composition. Starch content was determined using the Amyloglucosidase/α-Amylase Method (Starch Content Assay Kit, Suzhou Grace Biotechnology Co., Ltd.), while protein content was measured using the Coomassie Brilliant Blue method (Protein Content Assay Kit, Suzhou Grace Biotechnology Co., Ltd.). Lipid content was quantified by Soxhlet extraction with petroleum ether as the solvent. Moisture content was measured using a rapid moisture analyzer (Halogen Heating Module, 105 °C), and ash content was determined using the muffle furnace method (550 °C, 6 h). All analyses were performed in triplicate (n ≥ 3), and results were expressed as mean ±standard deviation (g/100 g dry basis).
2.4. Preparation of Starch Complex Samples and Pasting Characteristics
The complexes were prepared by RVA method [9]. Briefly, 2.75 g of starch, 125 mg of LA, and 125 mg of GA/DOPAC/CA were placed into a Rapid Visco Analyzer (RVA, RVA Tec Master, Perten, Australia). Deionized water was added to adjust the total weight to 28.0 g. The complexes were prepared using the built-in “Standard 1” program of the RVA. The viscosity profiles of all sample groups were measured using the same program. The sample groups were designated as B, LB, GB, DB, CB, GLB, DLB, and CLB, based on the initials of starch (B), lipid (L), and phenolic acids (G/D/C). After preparation, the samples were freeze-dried under vacuum, ground into powder, and stored at -20 °C for further analysis.
2.5. Thermal Performance Analysis
Analyze the thermodynamic properties of the sample through DSC experiments [3]. A 3.0 mg sample was placed in an aluminum crucible, mixed with 5 μL of deionized water, and hermetically sealed. An empty aluminum crucible was used as the reference. Differential scanning calorimetry (DSC) was performed using a DSC200PC instrument (Naichi Pump Industry Co., Ltd., Germany) within a temperature range of 40–100 °C at a heating rate of 10 °C/min.
2.6. Amylose Leaching Rate
The Amylose leaching rate of the complex prepared in Section 2.4 was determined using the iodine binding method [10]. A 1% iodine-potassium iodide (I-KI) solution was prepared. Briefly, 100 mg of starch sample was mixed with 10 mL of deionized water, heated in a boiling water bath for 20 min, and cooled to room temperature. The solution was made up to 100 mL with deionized water. From this, a 2.5 mL portion was combined with 1 mL of I-KI reagent, followed by incubation in the dark at room temperature for 20 minutes. Absorbance readings were then recorded at 620 nm and 550 nm with a spectrophotometer. A blank sample (I-KI solution without starch) served for baseline adjustment. A calibration curve was prepared using amylose standards, and the amylose concentration in the test samples was determined from the absorbance values in reference to the standard curve.
2.7. In Vitro Starch Digestibility
A dual-enzyme hydrolysis method was applied to evaluate in vitro digestion, based on previous studies [11]. A mixed enzyme solution containing porcine pancreatic α-amylase (150 U/mL) and amyloglucosidase (20 U/mL) was prepared in sodium acetate buffer (0.2 mol/L, pH 5.5). A 100 mg starch sample was homogenized with 10 mL of sodium acetate buffer, and 0.75 mL of the enzyme solution was added. The mixture was incubated in a shaking water bath at 37 °C (120 rpm). Aliquots (100 μL) were withdrawn at 0, 20, 40, 60, 90, 120, 180, 240, and 300 min and immediately mixed with 900 μL of absolute ethanol to terminate the reaction. Glucose content was quantified using the glucose oxidase-peroxidase (GOPOD) method, with absorbance measured at 620 nm using a microplate reader (Synergy H1, BioTek, USA). The RDS, SDS, and RS contents were calculated based on glucose levels at 0, 20, and 120 min using the following equations:
where G0, G20, and G120 represent the glucose concentrations (mg/mL) in the hydrolysate at 0, 20, and 120 min, respectively, and TS denotes the total starch content (mg) of the sample.
The hydrolysis rate at each time point was calculated according to Eq. (4) to plot the time-dependent hydrolysis profile [12]. The formula is expressed as:
where Ct represents the hydrolysis rate (%) of the sample at time t (min), and Gt denotes the glucose release equivalent (mg/g dry starch) in the hydrolysate at time t (min).
The hydrolysis curve of starch was fitted to a first-order kinetic model, expressed by the following equations:
where C∞ represents the equilibrium hydrolysis concentration (%) estimated from the regression curve, and k denotes the hydrolysis rate constant.
Hydrolysis Index (HI) and Estimated Glycemic Index (eGI) were calculated using the following equations [13]:
where AUC represents the area under the hydrolysis curve, and tn denotes the end time of each digestion phase.
2.8. Solubility and Swelling Power
A 200 mg sample was weighed into a pre-weighed centrifuge tube and dispersed in deionized water to prepare a 2% (w/v) starch suspension. The suspension was homogenized, gelatinized in a water bath at 70 °C for 30 min with constant stirring, and cooled to room temperature. The mixture was centrifuged at 6000 rpm for 15 min. The supernatant was transferred to a pre-weighed bottle and dried at 105 °C to constant weight (W2). Solubility (S, %) and swelling power (SP, g/g) were calculated using the following equations [14]:
where W1 is the initial sample weight (g), W2 is the mass of dried supernatant (g), and W3 is the mass of the precipitate after centrifugation (g).
2.9. Freeze-Thaw Stability Analysis
A 0.1 g sample was dispersed in deionized water to prepare a 5% (w/v) starch suspension, heated at 70 °C for 30 min with continuous stirring, and cooled to room temperature to form a gel. A 3 mL aliquot of gel was transferred to a pre-weighed centrifuge tube and weighed (M1). The tube was frozen at –20 °C for 24 h, thawed at 25 °C for 3 h, and subjected to three freeze-thaw cycles. After the third cycle, the sample was centrifuged at 5000 rpm for 20 min, the supernatant discarded, and the precipitate weighed (M2). The syneresis rate was calculated using Eq. (12) [15]:
where M1 is the gel mass before freezing (g), and M2 is the precipitate mass after freeze-thaw centrifugation (g).
2.10. Particle Size Analysis
Particle size distribution was determined using a Malvern Mastersizer 3000 (Malvern, England). Distilled water was used as the dispersant. After background calibration, the sample was introduced, and obscuration levels were monitored in real time. Upon complete dispersion, continuous measurement was performed to obtain particle size distribution data [16].
2.11. Fourier Transform Infrared (FTIR) Spectroscopy
A 1.5 mg sample was ground with 150 mg of anhydrous potassium bromide (KBr, 99.99% spectroscopic grade) at a 1:100 mass ratio in an agate mortar. The mixture was pressed into transparent pellets under 10-ton hydraulic pressure for 5 min. FTIR spectra were acquired using a Nicolet 6700 spectrometer (Thermo Fisher, USA) equipped with a DTGS detector, with parameters set to: spectral range 500–4000 cm–1, 32 scans, and 4 cm–1 resolution.
2.12. X-Ray Diffraction (XRD) Analysis
Samples were scanned from 4° to 40° at a rate of 5°/min and step size of 0.02°, under 40 mA and 40 kV operating conditions. XRD patterns were integrated using OriginPro 2024 software, and relative crystallinity (Rc) was calculated as the ratio of crystalline peak area to total diffraction area. Relative crystallinity (RC) was calculated using Eq. (13).
where Ac represents the diffraction peak area of the crystalline region of the sample, and Aa represents the diffraction peak area of the amorphous region of the sample.
2.13. Statistical Analysis
All experiments were performed in triplicate (n = 3) with technical replicates. Data were expressed as mean ±standard deviation. Statistical analysis was carried out using Microsoft Excel 365 (v16.0) for descriptive statistics and Minitab 21.4 for inferential analysis. One-way ANOVA followed by Duncan’s multiple range test (DMRT) at α = 0.05 was used to determine significance, with homogeneity of variance confirmed by Levene’s test (p > 0.1).
3. Results
3.1. Chemical Composition Analysis of Starch Samples
The chemical composition analysis of starch included determining starch content and non-starch components to assess whether the extracted samples met the requirements for subsequent experiments. The isolated starch samples primarily consisted of starch (about 99.09%), with minor amounts of protein (0.13%), fat (0.37%), and ash (0.11%). Compared with the results reported by Zhong et al. [8] (protein 0.55%, fat 0.25%, ash 0.30%), the samples in this study exhibited higher fat content but lower protein and ash contents. According to Louis M. Nwokocha et al. [17], endogenous proteins in starch samples may originate from cell wall residues or enzyme remnants, which can influence surface charge, hydration rate, swelling, and gelatinization properties. Endogenous lipids can interact with amylose to form helical inclusion complexes, which restrict swelling and decrease paste clarity. The ash fraction indicates the presence of trace minerals that frequently act as impurities, influencing both gelatinization and gelation behavior. According to Karim et al. [18], potato starch containing elevated levels of phosphorus shows a lower gelatinization temperature, increased paste viscosity, higher clarity, and diminished retrogradation. In this study, the extracted starch displayed high purity, with all non-starch components below 0.50%, minimizing their effect on starch properties. Furthermore, composition analysis confirmed that the samples complied with the Chinese national food safety standard GB 31637-2016 [19]-for edible starch, qualifying them for use in subsequent experiments.
3.2. In Vitro Starch Digestibility
As shown in Figure 1, gelatinized breadfruit starch without added LA or polyphenols (B) exhibited RDS, SDS, and RS contents of about 13.67%, 39.14%, and 47.19%, respectively. Tan et al. [20] measured breadfruit starch RDS, SDS, and RS contents as 88.59%, 2.99%, and 8.42%, respectively, indicating substantial variation compared to the results obtained in this study. According to Li et al. [9], differences among breadfruit varieties may account for these variations in digestibility. The RS content in LB significantly increased to 61.45% compared with B, suggesting that LA likely formed complexes with starch, thereby inhibiting digestion and elevating RS levels. Liu et al. [21] reported similar findings, where LA addition increased the RS content of extruded starch from 2%–4% to 10.0%–16.7%, significantly enhancing digestibility resistance, with RS levels rising proportionally to LA concentration.
Among the single polyphenol treatment groups, all three exhibited significantly higher RS content compared with B. CB showed the highest RS and lowest RDS, confirming its strongest digestion-inhibiting effect. GB exhibited an RS content of 59.30%, while DB displayed 57.29%, with no significant difference between the two. Mao et al. [22] reported that phenolic acids reduced potato starch RDS from 34.20% to 13.53% and increased RS from 41.89% to 58.00%, with CA demonstrating the most pronounced effect. Huo et al. [23] suggested that this phenomenon may be due to the number and distribution of functional groups in phenolic compounds, which determine their molecular electrostatic potentials and reactivities. Polyphenols with varying structural complexity (hydroxyl group number, molecular size, and steric hindrance) exhibit different binding capacities with starch. For example, CA, with its longer carbon skeleton and side-chain carbon-carbon double bond forming a conjugated system, may enhance hydrophobicity, thereby more effectively inhibiting starch digestion.
For ternary complex samples containing both LA and polyphenols, RS content in DLB and CLB significantly increased compared with B, rising from 47.19% to 53.58% and 63.53%, respectively. GLB exhibited an RS content of 49.12%, not significantly different from B. Among the three groups, CLB showed the highest RS content, consistent with the trend observed in the binary complex samples. These findings indicated that when LA formed complexes with CA and DOPAC, they still significantly enhanced digestibility resistance, with the CA-LA-starch ternary complex showing the strongest inhibitory effect. In contrast, GA combined with LA only delayed digestion slightly, without significantly increasing RS. This discrepancy may be attributed to the relatively weak hydrogen bond networks formed by CA and DOPAC, which allowed LA to interact with starch and promote V-type complex formation. Conversely, the three hydroxyl groups of GA strongly bonded to starch, hindering the interaction between LA and starch and suppressing the formation of V-type complexes, a key factor in RS formation [24].
Comparing GB, DB, and CB with LB, CB exhibited significantly higher RS content than LB while DB exhibited lower RS content. GB showed no significant difference from LB. These results suggest that CA enhanced digestibility resistance more effectively than LA, whereas GA and DOPAC influenced only early-stage digestion, with weaker overall effects compared to LA. This may be due to the ability of V-type complexes formed between LA and starch to increase hydrophobicity, thereby improving resistance, while CA, with its hydrophobic acryl side chain and ortho-diphenolic hydroxyl groups, demonstrated superior effects. GA and DOPAC, however, formed fewer effective complexes and thus failed to substantially improve resistance.
In ternary complex samples compared with LB, CLB showed no significant difference in RS content, whereas GLB and DLB exhibited significantly lower RS contents. Furthermore, compared with their corresponding binary polyphenol-starch complexes, all ternary complexes showed reduced RS content. This indicates that when LA coexists with polyphenols, their effects on starch digestibility display clear antagonism. Instead of synergistically enhancing resistance, LA and polyphenols mutually inhibited each other’s effects, leading to reduced RS. Previous studies [25,26] reported that polyphenols and lipids may competitively bind to starch single helices via hydrophobic interactions, impairing complex formation and lowering resistance. Additionally, interactions between polyphenols and lipids themselves may disrupt their individual effects. Wang et al. [27] reported a similar phenomenon in rice starch supplemented with genistein and LA, where ternary complexes showed weaker resistance than binary complexes. They attributed this to the ability of LA-genistein complexes to increase short-range order, relative crystallinity, and structural stability, thereby reducing RS in ternary complexes.
3.3. Hydrolysis Kinetics Analysis
The evaluation of starch digestibility commonly employs RDS, SDS, and RS as key indicators. However, these parameters only reflect the digestive status at specific time points and fail to capture the overall hydrolysis process. To address this limitation, the in vitro hydrolysis characteristics of different sample groups were systematically investigated by dynamically monitoring starch hydrolysis rates. As shown in Figure 2, the starch hydrolysis kinetic curves varied significantly among sample groups. Consistent with previous reports [9], samples with higher RS contents generally exhibited hydrolysis curves located in the lower region of the graph, with gentler slopes.
Table 1 summarizes the parameters C∞, k, HI, and eGI for each group. LB showed significantly lower values, indicating that the incorporation of LA substantially reduced both the extent and rate of starch digestion. This is consistent with Wu et al. [28], who reported reduced digestibility of adzuki bean starch following LA addition, attributing this effect to the structural influence of fatty acids on starch digestibility and physicochemical properties. Similarly, Liu et al. [29] suggested that starch-lipid complexes hinder starch hydration and swelling, restricting enzymatic accessibility.
For the single-polyphenol treatment groups, GB, DB, and CB exhibited significantly lower C∞, HI, and eGI values compared with B. Among these, CB displayed the lowest values, followed by GB and then DB, consistent with Section 3.2. All polyphenol-treated groups also showed significantly reduced k values compared with B, although no significant differences were observed among the three, indicating that polyphenols effectively reduced the hydrolysis rate but did not differ substantially in their inhibitory effects. These findings corroborate Jenkins et al. [30], who reported that polyphenols could reduce starch digestion rates, thereby lowering HI and eGI values.
When LA was co-administered with polyphenols, all ternary complex groups showed significantly lower C∞ values compared with B, except GLB, which did not show a significant reduction in k. Among these, CLB displayed the most pronounced effect, followed by DLB. Statistical analysis confirmed that CLB’s C∞ and k values were significantly lower than those of GLB and DLB, while no significant difference was observed between GLB and DLB. All ternary complexes also exhibited significantly lower HI and eGI values compared with B. CLB showed the lowest values, followed by DLB, while GLB displayed the highest values among ternary samples. These results indicated that LA combined with polyphenols retained the capacity to inhibit starch digestibility, with CA showing the strongest inhibitory effect—consistent with Section 3.2. Notably, GLB’s digestion rate did not significantly differ from B, reflecting the finding in Section 3.2 that GLB’s RS content was also statistically unchanged, confirming that GA exerts a negligible influence on breadfruit starch digestibility.
Comparisons of GB, DB, and CB with LB showed that only CB exhibited a significantly lower C∞ than LB. GB and DB displayed significantly higher values than LB. Combined with Section 3.2, where CB showed significantly higher RS content than LB while GB and DB showed lower RS contents, these findings suggested that GA and DOPAC reduce starch digestion rate only in the short term, but their overall inhibitory capacity is weaker than that of CA and LA. The k values of GB, DB, and CB were significantly lower than that of LB. Liu et al. [1] observed similar phenomenon and attributed this to polyphenols not only forming complexes but also altering the secondary structure of α-amylase, leading to conformational disorder and reduced catalytic activity—possibly explaining the stronger inhibition of digestion rate in polyphenol groups compared with LB. CB also showed significantly lower HI and eGI than LB, whereas GB and DB displayed values statistically comparable to LB. Zheng et al. [31] suggested that these differences may be attributed to variations in the physicochemical properties of the complexes.
In ternary complexes compared with LB, GLB and DLB showed significantly higher values than LB, whereas CLB showed significantly lower values. This demonstrated that CA-LA-breadfruit starch ternary complexes were more stable and conferred stronger inhibition of digestibility than those involving GA or DOPAC, likely due to CA’s unique carbon skeleton and side-chain functional groups.
Notably, all ternary complexes exhibited significantly increased C∞, k, HI, and eGI values compared with their binary counterparts, indicating enhanced hydrolysis extent and rate in ternary systems. This is consistent with Section 3.2, where samples with higher RS contents generally displayed lower HI and eGI values, a phenomenon also reported by Mardiah et al. [32]. While both LA and polyphenols individually enhanced starch digestibility resistance, their combined application produced antagonistic effects, likely because intermolecular interactions of LA impaired the regulatory influence of polyphenols on starch digestibility.
Overall, the antagonistic interaction between LA and polyphenols was evident not only in digestible fraction variations but throughout the entire starch hydrolysis process. Previous studies have shown that changes in starch digestibility are closely correlated with its physicochemical properties [29]. Complex formation can also significantly influence the structural order and crystalline type of starch, often reducing molecular accessibility to water and digestive enzymes and thereby decreasing digestibility [32]. Therefore, this study further investigated the effects of complex formation on starch gelatinization, hydration, granular characteristics, and short-range molecular order to comprehensively evaluate the influence of complex formation on starch properties.
3.4. Pasting Properties
Figure 3 and Table 2 illustrate the changes in gelatinization viscosity properties of starch composite samples during complex formation. As shown in Table 2, compared with B, LB showed significantly reduced peak viscosity and breakdown value, while the setback value remained unchanged. This indicated that LA inhibited starch breakdown and structural disruption during gelatinization. According to Zheng et al. [2], this may be attributed to the formation of starch-lipid complexes in the gel system, which reduces the water absorption capacity of starch granules and consequently suppresses gelatinization, thereby enhancing starch digestibility resistance.
For phenolic acid-modified samples, GB exhibited a significantly higher setback value compared with B, while peak viscosity showed no significant difference, and breakdown value decreased markedly. Similarly, DB and CB showed significantly higher peak viscosities and setback values, accompanied by significantly reduced breakdown values. These results suggest that GA, DOPAC, and CA may preserve starch granule structural integrity through molecular interactions and promote amylose realignment during cooling, thereby enhancing retrogradation properties. This mechanism contributes to increased RS content and improved digestibility resistance, as reported by Zhao et al. [33]. No significant differences in breakdown or setback values were observed among the three phenolic acid-modified groups, indicating similar effects of these polyphenols on starch gelatinization.
The ternary composites showed significantly lower peak viscosities, breakdown values, and setback values compared with B. Additionally, GLB and DLB exhibited significantly reduced trough and final viscosities, while CLB showed significantly higher trough viscosity but no significant change in final viscosity. These results indicated that the combined effect of polyphenols and LA enhanced gelatinization stability and anti-retrogradation properties of breadfruit starch, with reduced pasting viscosity contributing to digestibility resistance. Among the three composites, CLB exhibited significantly higher trough viscosity, final viscosity, and setback value than the other two groups. This may be attributed to the counterbalancing effects of LA’s hydrophobic inhibition and CA’s hydrophilic polar groups, resulting in setback values comparable to B. No significant differences in breakdown values were observed among the ternary composites. Yin et al. [24] reported that hydroxyl groups in polyphenols compete with starch hydroxyl groups for water molecules, thereby restricting water mobility and reducing starch pasting viscosity. In this study, differences in the number of phenolic hydroxyl groups did not lead to differential effects on starch pasting viscosity, likely due to the counteracting influence of LA.
Compared with LB, the polyphenol-treated groups showed significantly lower breakdown values and higher setback values while maintaining similar gelatinization temperatures. This indicated that polyphenol-starch complexes conferred gelatinization characteristics associated with stronger digestibility resistance. Furthermore, polyphenols exhibited a distinct pro-retrogradation effect during cooling compared with LA, which may contribute to RS formation and enhanced digestibility resistance. Mao et al. [22] attributed this phenomenon to polyphenols aggregating starch molecules through hydrogen bonding, thereby altering the coupling strength between crystalline and amorphous regions of starch granules and modifying starch viscosity.
When comparing ternary complexes with LB, no significant differences in breakdown values were observed. However, setback values were significantly decreased, suggesting that the introduction of polyphenols to LA-modified starch inhibited retrogradation, which is unfavorable for digestibility resistance. Yin et al. [24] reported similar findings, attributing this effect to reduced water mobility and availability within starch granules due to complex formation, thereby suppressing both gelatinization and retrogradation. Compared with binary polyphenol-starch complexes, ternary systems showed markedly higher breakdown values and reduced setback values. This suggests that the simultaneous presence of LA and polyphenols lessened their individual inhibitory roles in starch gelatinization. The polyphenol-lipid-starch ternary system exhibited weaker structural stability during gelatinization and hindered ordered molecular rearrangement upon cooling, both of which are unfavorable for RS formation and resistance to digestion. These findings indicate possible antagonistic interactions between polyphenols and LA in starch binding. The ternary complexes displayed gelatinization properties less favorable for digestibility resistance, most likely due to competitive binding of LA and polyphenols with amylose through non-covalent forces during V-type complex formation. Such competition may lower complexation efficiency and reduce control over gelatinization behavior, thereby weakening resistance, in agreement with the observations in Section 3.2 and Section 3.3.
When comparing ternary complexes with LB, no significant differences in breakdown values were observed. However, setback values were significantly decreased, suggesting that the introduction of polyphenols to LA-modified starch inhibited retrogradation, which is unfavorable for digestibility resistance. Yin et al. [24] reported similar findings, attributing this effect to reduced water mobility and availability within starch granules due to complex formation, thereby suppressing both gelatinization and retrogradation. Compared with binary polyphenol-starch complexes, ternary systems showed markedly higher breakdown values and reduced setback values. This suggests that the simultaneous presence of LA and polyphenols lessened their individual inhibitory roles in starch gelatinization. The polyphenol-lipid-starch ternary system exhibited weaker structural stability during gelatinization and hindered ordered molecular rearrangement upon cooling, both of which are unfavorable for RS formation and resistance to digestion. These findings indicate possible antagonistic interactions between polyphenols and LA in starch binding. The ternary complexes displayed gelatinization properties less favorable for digestibility resistance, most likely due to competitive binding of LA and polyphenols with amylose through non-covalent forces during V-type complex formation. Such competition may lower complexation efficiency and reduce control over gelatinization behavior, thereby weakening resistance, in agreement with the observations in Section 3.2 and Section 3.3.
Figure 3 shows the RVA profiles of different sample groups during gelatinization. LB, GLB, DLB, and CLB exhibited a distinct characteristic peak in the cooling phase of their viscosity curves, consistent with the reported formation of V-type complexes [5]. This suggested that amylose interacted with LA via hydrophobic interactions during gelatinization to form single-helical cavities that encapsulated lipid molecules, generating V-type lipid-starch complexes. In contrast, the RVA curves of the polyphenol-treated groups showed no such peaks. According to Zhang et. al. [5], this suggests that polyphenol-starch interactions occur primarily through intermolecular hydrogen bonding, forming non-inclusion complexes with polyphenols binding to the exterior of starch molecules. Previous studies have shown that such complex formation generally enhances starch digestibility resistance [10,14,22], consistent with the findings in Section 3.2 and Section 3.3. Notably, GLB, DLB, and CLB showed delayed appearance of viscosity peaks during cooling compared with LB, indicating that polyphenols may hinder the formation of V-type complexes between LA and breadfruit starch. This further supports the presence of antagonistic effects when polyphenols and lipids coexist.
3.5. Thermodynamic Properties
The effects of three polyphenols on the thermodynamic properties of breadfruit starch were measured using differential scanning calorimetry (DSC). As shown in Figure 4 and Table 3, the peak temperature (Tp), onset temperature (To), conclusion temperature (Tc), and gelatinization enthalpy (ΔH) of all sample groups were significantly higher than those of B. According to Wang et al. [3], the increase in gelatinization temperature may be related to interactions among lipids, polyphenols, and water. These interactions can disrupt hydrophobic interactions between amylose and amylopectin, thereby delaying starch gelatinization and inhibiting digestibility.
In binary complexes, the Tp and ΔH of LB were significantly higher than those of GB and DB. The Tp of LB was significantly lower than CB, but no significant difference in ΔH was observed between LB and CB. This indicated that LA delayed starch gelatinization less effectively than CA but more effectively than GA and DOPAC. These results are consistent with the ability of LA and the three polyphenols to enhance starch digestibility resistance, as discussed in Section 3.2.
Among the ternary complexes, CLB showed significantly higher Tp values for all indicators compared with GLB and DLB, while GLB values were significantly higher than DLB. This indicated that the synergistic delaying effect of CA and LA on starch gelatinization was the strongest, followed by DOPAC, with GA being the weakest. These trends positively correlated with digestibility resistance and aligned with the results in Section 3.2. No significant differences in ΔH were observed among the ternary complexes, suggesting that the degree of retrogradation in the three ternary groups was relatively similar.
Compared with binary complexes, the ternary complexes exhibited significantly lower Tp, To, Tc, and ΔH values, indicating that when LA and polyphenols were applied together, their inhibitory effect on starch gelatinization was weaker than when used individually. This antagonistic effect was not conducive to enhancing digestibility resistance, consistent with the results observed in Section 3.2. These findings further suggested that the degree of retrogradation in ternary complexes was lower than in binary complexes, possibly due to disruption of the natural crystalline structure and the formation of a new crystalline arrangement. This was consistent with the experimental observations in Section 3.4 and Section 3.10.
3.6. Amylose Leaching Rate
Amylose leaching rates across sample groups are shown in Figure 5. B exhibited an amylose leaching rate of 50.61%. Among binary complexes, DB, CB, and LB showed significantly lower leaching rates than B, while GB exhibited significantly higher leaching rates comparable to B. According to He et al. [34], higher amylose content is usually associated with stronger digestibility resistance. GA’s inability to significantly inhibit amylose leaching may therefore be unfavorable for maintaining resistance, consistent with its weaker effect on digestibility enhancement observed in Section 3.2.
Amylose leaching rates across sample groups are shown in Figure 5. B exhibited an amylose leaching rate of 50.61%. Among binary complexes, DB, CB, and LB showed significantly lower leaching rates than B, while GB exhibited significantly higher leaching rates comparable to B. According to He et al. [34], higher amylose content is usually associated with stronger digestibility resistance. GA’s inability to significantly inhibit amylose leaching may therefore be unfavorable for maintaining resistance, consistent with its weaker effect on digestibility enhancement observed in Section 3.2.
3.7. Hydration Properties of Starch
Hydration parameters of the sample groups—including solubility, swelling power, and syneresis—are presented in Table 4. B exhibited swelling power, solubility, and syneresis values of 12.92 g/g, 3.23%, and 54.57%, respectively. The incorporation of LA significantly modified these properties. This indicated that LA decreased hydration characteristics, thereby enhancing digestibility resistance. Liu et al. [35] attributed this to steric hindrance and hydrophobic effects between LA and starch, which impede water penetration into starch granules.
Compared with B, polyphenol-treated groups exhibited significantly higher solubility and reduced syneresis, while showing no significant changes in swelling power. These results suggested that polyphenol-starch complexes improved water retention and solubility, thereby promoting digestibility resistance, consistent with Martins [36]. Among polyphenol samples, CB showed significantly lower solubility and syneresis compared with GB, while no significant differences were observed between CB and DB. This demonstrated that starch complexes with CA and DOPAC formed relatively compact molecular structures that more effectively hindered starch-water interactions, enhancing resistance. GA showed comparatively weaker effects, consistent with the results in Section 3.5.
Ternary complexes exhibited significantly reduced swelling power and syneresis compared with B. Among these, CLB showed significantly lower swelling power, solubility, and syneresis than GLB and DLB. No significant differences were observed between GLB and DLB. This trend was consistent with that of the binary polyphenol groups. Liu et al. [35] reported that denser and more stable starch complexes generally exhibit lower hydration properties. Combined with this study’s findings, this suggested that the CA-starch complex had the most compact and stable structure, contributing to enhanced digestibility resistance.
Compared with LB, all polyphenol-treated groups exhibited significantly higher swelling power and solubility, with no significant differences in syneresis except for GB. GB showed significantly higher freeze-thaw stability than LB. These results indicated that the inhibitory effects of phenolics on starch-water interactions were weaker than those of LA. Liu et al. [35] explained this as lipid-induced molecular rearrangement of starch into single-helical structures, which effectively fill granule pores and create a denser three-dimensional network, thereby better inhibiting water absorption and release and enhancing resistance.
The ternary composites showed intermediate values between LB and polyphenol-treated groups for all parameters. This suggested an antagonistic effect between LA and polyphenols in regulating hydration properties, with mutual weakening of their individual impacts. Such antagonism may compromise digestibility resistance, consistent with Section 3.2, and further supports the hypothesis of competitive binding effects during starch modification.
3.8. Particle Size Analysis
As shown in Table 5, the specific surface area, D [3,2], D [4,3], and Dx50 were measured for all sample groups, providing quantitative data to evaluate the relationship between particle size characteristics and starch digestibility. LB showed no significant differences in specific surface area or D [3,2] compared with B, but its D [4,3] and Dx50 were significantly smaller. Normally, this would contribute to enhanced digestibility. However, contrary to expectation, LB showed significantly reduced digestibility compared with B (Section 3.2). This may be explained by the reduced water-binding capacity of starch granules after LA incorporation (Section 3.7). The reduction in water accessibility ultimately dominated over particle size effects, resulting in lower digestibility.
All polyphenol-treated groups exhibited significantly lower specific surface areas than B. GB had a significantly smaller Dx50 than B, DB showed no significant difference, while CB exhibited a significantly larger Dx50. CB showed the lowest specific surface area, significantly lower than GB and DB, with DB also significantly lower than GB. The order of particle size (D [3,2], D [4,3], and Dx50) was CB > DB > GB. These results indicated that CA treatment enlarged starch granules, whereas GA and DOPAC exerted weaker effects. According to Rahmadani et al. [32], starch granule aggregation can increase particle size, reducing available active sites for water and enzyme binding, thereby conferring stronger resistance to digestion. This suggested that CA had the most significant effect on digestibility resistance among the three polyphenols, while GA had the weakest, consistent with Section 3.2.
Compared with B, CLB exhibited significantly reduced specific surface area and significantly increased D [3,2], D [4,3], and Dx50, which may contribute to enhanced digestibility resistance. These results were consistent with Section 3.2. In contrast, GLB and DLB showed significantly smaller particle size parameters compared with CLB. GLB had a significantly lower specific surface area, while DLB exhibited a significantly higher specific surface area than CLB. Among ternary samples, only CLB showed consistent changes in all particle size parameters associated with enhanced resistance. These changes may result from grinding effects on particle size, where mechanical processing disrupts crystallinity and broadens size distribution [32]. This indicated that GA and DOPAC likely did not influence digestibility resistance by altering granule size but instead through modifying gelatinization properties, as suggested in Section 3.4.
Polyphenol-treated groups showed significantly lower specific surface areas than LB, while exhibiting significantly higher D [3,2] and D [4,3] values. GB’s Dx50 showed no significant difference from LB, while both DB and CB displayed significantly higher values. This indicated that polyphenols significantly reduced surface area and increased particle size compared with LA. According to Tian et al. [37], such modifications may arise from non-inclusion complexes formed between polyphenols and starch through hydrogen bonding, which promotes granule aggregation and thereby enhances digestibility resistance.
In ternary complexes, CLB showed significantly lower specific surface area, D [4,3], and Dx50 compared with LB. These changes contributed to improved digestibility resistance and aligned with Section 3.2. When compared with CB, CLB showed no significant differences in specific surface area and D [3,2], but significantly higher D [4,3] and Dx50 values. This suggested that in the CA-LA-starch system, CA contributed more to granule enlargement, while LA may have influenced structural integrity. These modifications were generally beneficial for enhancing resistance. The simultaneous complexation of LA and CA promoted synergistic enlargement of particle size. Xu et al. [38] reported that increased particle size from enhanced intermolecular interactions could improve starch resistance, though antagonistic effects on digestibility regulation may not be reflected in particle size changes. This may be explained by strengthened hydrophobic interactions and hydrogen bonding when LA and polyphenols co-complex with starch, promoting granule aggregation and increasing average particle size [20]. However, as shown in Section 3.2, CLB’s digestibility resistance was significantly lower than CB’s. This discrepancy may be attributed to antagonistic interactions between LA and CA within the complex, producing a dominant antagonistic effect on digestibility despite positive particle size changes.
3.9. Short-Range Orderliness Analysis
Figure 6 shows the FTIR spectra of starch samples within the range of 4000–800 cm–1. The broad peak observed at 3600–3000 cm–1 was attributed to O-H stretching vibrations, while the peaks in the 1200–800 cm–1 region primarily reflected vibrational features of covalent bonds such as glycosidic linkages (C–O–C) [21]. Comparative analysis revealed that none of the composite samples exhibited new characteristic absorption peaks compared with B, confirming that no covalent bonds were formed between starch and polyphenols/lipids, and that the interactions were primarily non-covalent. All composite samples showed a reduction in peak intensity at 1650 cm–1, accompanied by the formation of a new peak nearby, which corresponded to O-H stretching vibrations of absorbed water [21]. This suggested weakened starch-water interactions and enhanced hydrophobic effects in the composite system, leading to increased complexation between starch molecules and LA/polyphenols, consistent with Section 3.6. Both polyphenol-treated and polyphenol-lipid-treated groups exhibited a noticeable redshift of the hydroxyl peak near 3300 cm–1, indicating significantly strengthened intermolecular hydrogen bonding. These findings aligned with the RVA results and supported the conclusion in Section 3.4 that polyphenols primarily bound to the starch surface through hydrogen bonding, forming non-inclusion complexes.
As shown in Table 5, the R1047/1022 ratio of B was 0.722, while all binary complexes exhibited significantly higher values. This indicated that complexes formed by starch, LA, and polyphenols enhanced short-range molecular order. Hydrophobic interactions of LA and hydrogen bonding effects of polyphenols contributed to this increased order, which was beneficial for improving digestibility resistance. These results were consistent with Section 3.2. No significant differences in R1047/1022 were observed among GB, DB, and CB, suggesting that polyphenols with different structures exerted comparable effects on short-range molecular order.
Compared with B, the ternary complexes also showed significantly higher R1047/1022 ratios, with no significant differences among them. This indicated that combined regulation by LA and polyphenols enhanced short-range molecular order. Similar results were reported by Huo et al. [23], who found that adding phenolic acids such as CA to rice starch increased the R1047/1022 ratio due to hydrogen bonding between polyphenols and starch, thereby reinforcing ordered structure and improving resistance. Chen et al. [39] also reported a significant increase in R1047/1022 when fatty acids were incorporated into indica rice starch.
The R1047/1022 values of GB, DB, and CB were significantly higher than LB, demonstrating that the hydrogen bonding effect of polyphenols enhanced short-range molecular order more effectively than the hydrophobic effect of LA, which contributed to digestibility resistance. However, LB exhibited slightly higher RS content than GB and DB in Section 3.2, possibly due to lipids exerting stronger inhibition on starch-water interactions. No significant differences in R1047/1022 were observed among GLB, DLB, CLB, and LB. This suggested that LA primarily influenced composite structure in ternary systems rather than short-range molecular ordering. Compared with their corresponding polyphenol-only binary complexes, all ternary complexes exhibited significantly lower R1047/1022 values. This indicated reduced short-range molecular order in ternary complexes, potentially compromising digestibility resistance, consistent with Section 3.2.
Overall, these results demonstrated that both LA and polyphenols significantly enhanced short-range molecular order in starch molecules, promoting the formation of more stable and compact microstructures and effectively improving digestibility resistance. Polyphenols showed stronger ordering effects than LA. However, when LA and polyphenols coexisted, their mutual inhibitory interactions during complexation decreased regulatory efficacy, further confirming their antagonistic effects in starch modification. This trend was consistent with the digestibility resistance results in Section 3.2.
3.10. Long-Range Orderliness Analysis
Long-range ordered structures can characterize changes in starch digestibility. In this study, XRD analysis was used to investigate the crystalline structures of various sample groups. As shown in Figure 6, the XRD pattern of B exhibited characteristic diffraction peaks at 5.6°, 17.5°, and 22.8°, confirming that breadfruit starch belongs to the B-type, consistent with previous reports [9,14]. The XRD pattern of LB displayed characteristic peaks at 12.9° and 19.7°, typical of V-type crystals, indicating the formation of a V-type complex between LA and starch, consistent with Section 3.4. The polyphenol-treated groups showed characteristic peaks at 5.8°, 17.5°, and 20.1°, corresponding to B-type starch, suggesting that polyphenols did not alter crystalline type and instead formed non-inclusion complexes, as also supported by Section 3.4.
For ternary complexes, GLB and DLB exhibited characteristic peaks at 12.9°, 19.9°, and within the 21.5°–22.5° range, indicating the coexistence of B-type and V-type starch crystals. This may be attributed to LA-induced V-type formation while polyphenols preserved B-type crystalline regions. The XRD pattern of CLB displayed peaks at 15.9°, 17.5°, and 25.0°, characteristic of C-type starch (a mixture of A- and B-type crystals), suggesting that the incorporation of CA and LA preserved B-type crystalline regions while introducing A-type crystalline features.
As shown in Table 5, relative crystallinity (Rc) was significantly higher in all treated samples compared with B. This indicated that LA and polyphenols, either individually or jointly, enhanced long-range structural order. According to Chen et al., V-type crystalline structures formed by lipid insertion into the starch helical cavity significantly enhance long-range order, thereby improving digestibility resistance [14].
Among binary complexes, Rc of LB was significantly lower than DB and CB, but showed no difference from GB. Within polyphenol groups, GB exhibited significantly lower Rc than DB and CB, indicating that GA provided the weakest enhancement of crystalline order, consistent with Section 3.6.
In ternary complexes, Rc values of GLB, DLB, and CLB were not significantly different from each other. These values were significantly higher than those of LB, GB, and DB, but not significantly different from CB. This indicated that the enhancement of long-range order in GLB and DLB was equivalent to that achieved by CA alone, while the simultaneous presence of LA and CA did not significantly amplify CA’s effect. From a structural perspective, GLB and DLB would be expected to enhance digestibility resistance; however, this contradicted Section 3.2 results. A potential explanation is that although crystallinity was enhanced, stronger antagonistic effects in other physicochemical properties (such as pasting and hydration) outweighed this contribution, resulting in overall weaker resistance in ternary systems compared with binary ones.
As shown in Table 5, both LA and polyphenols significantly improved the long-range order of breadfruit starch, with their combined action exhibiting synergistic effects on long-range order but antagonistic effects on short-range order. This indicated that while the coexistence of LA and polyphenols reduced short-range molecular ordering, it enhanced long-range crystalline structures. This phenomenon may be explained by competition for binding sites in the starch helix cavity: steric hindrance from polyphenols disrupted the regular V-type single helix, while non-covalent interactions among polyphenol-LA-starch components promoted ordered chain arrangements at larger spatial scales, facilitating the formation of advanced long-range structures.
4. Discussion
This study examined the regulatory effects of lauric acid (LA) and three phenolic acids (GA, DOPAC, CA) on the in vitro digestibility and physicochemical properties of breadfruit starch (B). Experimental results demonstrated that both LA and the polyphenols significantly enhanced digestibility resistance, increasing RS content from 47.19% to 49.12%–70.14%. Notably, contrary to the hypothesis in Introduction, ternary complexes showed reduced RS content compared with binary complexes, indicating antagonistic effects of LA-polyphenol coexistence. Among the individual regulators, CA exerted the strongest enhancement, followed by LA, GA, and DOPAC. Additionally, the LA-DOPAC combination exhibited stronger resistance than LA-GA. CA-treated samples consistently showed the most distinctive physicochemical changes: reduced breakdown viscosity, increased setback viscosity, reduced hydration capacity, enlarged particle size, decreased specific surface area, and enhanced structural order—changes strongly correlated with increased digestibility resistance. Other phenolic acids and LA alone showed less consistent effects. RVA analysis revealed a characteristic cooling-phase peak in LA-containing samples, confirming V-type lipid-starch complex formation, whereas polyphenol-treated samples lacked this peak, suggesting non-inclusion complexes. DSC analysis showed that both LA and polyphenols increased thermal stability and inhibited gelatinization, while ternary complexes exhibited lower gelatinization temperatures than binary ones, reflecting antagonism. FTIR analysis confirmed stronger hydrogen bonding networks, which corresponded to the view in RVA analysis that polyphenols bind to starch through hydrogen bonding. XRD analysis demonstrated that both LA and polyphenols altered starch crystalline patterns, with ternary complexes forming more ordered long-range structures. Combined with previous FTIR analysis, it is believed that LA primarily influenced the long-range molecular order of breadfruit starch, while polyphenols affected both short-range and long-range molecular order. This may explain why ternary complexes of lauric acid and polyphenols exhibited antagonistic rather than synergistic effects on starch digestibility. This study provides theoretical and experimental foundations for understanding lipid-polyphenol-starch ternary systems and their regulatory effects on digestibility. Future research should focus on structural characterization, thermodynamic profiling, and application-oriented evaluation of such complexes in food processing.
Author Contributions
Conceptualization, Writing – original draft, J.T.; Formal analysis, X.Z. and W.Z.; Data curation, K.Z.; Investigation, Writing – review & editing, X.C. and Y.Z.; Visualization, Supervision, Z.X., L.Z. and Y.Z.; Supervision, Methodology, Y.Z. and J.L. All authors have read and agreed to the published version of the manuscript.
Funding
This research was funded by Chinese Academy of Tropical Agricultural Sciences for Science and Technology InnovationTeam of National Tropical Agricultural Science Center (CATASCXTD202511, CATASCXTD202304). The APC was funded by Jiangxi Innovation Leading Talent Program (S2021DQKJ2267).
Institutional Review Board Statement
Not applicable.
Informed Consent Statement
Not applicable.
Data Availability Statement
All data are available in the main text or supplementary materials.
Acknowledgments
We are grateful to the study participants.
Conflicts of Interest
The authors declare no conflicts of interest.
References
- LIU S, MENG F, GUO S, et al. Inhibition of α-amylase digestion by a Lonicera caerulea berry polyphenol starch complex revealed via multi-spectroscopic and molecular dynamics analyses. [J]. International Journal of Biological Macromolecules, 2024, 260(P2): 129573-.
- ZHENG B, WANG T, WANG H, et al. Studies on nutritional intervention of rice starch- oleic acid complex (resistant starch type V) in rats fed by high-fat diet [J]. Carbohydrate Polymers, 2020, 246: 116637-.
- WANG L, HUANG Y, REN Y, et al. Effect of ethanol addition on the physicochemical, structural and in vitro digestive properties of Tartary buckwheat starch-quercetin/rutin complexes [J]. Food Chemistry, 2024, 451: 139350-.
- SHUJUN W, MENGGE Z, JINGLIN Y, et al. Insights into the Formation and Structures of Starch-Protein-Lipid Complexes. [J]. Journal of agricultural and food chemistry, 2017, 65(9): 1960-6.
- GENYI Z, R H B. A three component interaction among starch, protein, and free fatty acids revealed by pasting profiles. [J]. Journal of agricultural and food chemistry, 2003, 51(9): 2797-800.
- UMERIE S C. Isolation and characterization of breadfruit (Artocarpus communis) seed starch [J]. Tropical Science, 2000, 40(4): 174-6.
- RIVERA C S C, NEVES G N, MAURO R R, et al. Physico-chemical and nutritional properties of breadfruit pulp and peel flours: Insights into starch molecular characteristics and their impact on starch digestibility. [J]. International journal of biological macromolecules, 2025, 305(P2): 141224.
- ZHONG X, WANG S, ZHANG Y, et al. Effects of different extraction methods on the properties of breadfruit starch [J]. Science and Technology of Food Industry, 2020, 41(17): 131-4+40.
- LI B. Study on the in vitro enzymatic digestion mechanism of self-assembled ternary complexes of breadfruit starch [D]. Guangxi University; Guangxi University, 2023.
- WU X, WU X, ZHANG X, et al. Structural, physicochemical and in vitro digestibility of white kidney bean protein-corn starch complexes under various heat treatments [J]. Food Research International, 2025, 200: 115479-.
- QIN Y, ZHANG Y, CHEN X, et al. Synergistic effect of pectin and the flavanols mixture on in vitro starch digestion and the corresponding mechanism [J]. Food Hydrocolloids, 2025, 158: 110554-.
- MENG R, FENG R, WU S J, et al. New insights into rice starch-gallic acid-whey protein isolate interactions: Effects of multiscale structural evolution and enzyme activity on starch digestibility [J]. Carbohydrate Polymers, 2025, 350: 123039-.
- DU Z, LI X, ZHAO X, et al. Multi-scale structural disruption induced by radio frequency air cold plasma accelerates enzymatic hydrolysis/ hydroxypropylation of tapioca starch. [J]. International Journal of Biological Macromolecules, 2024, 260(P2): 129572-.
- CHEN L, HAO Y, WANG Y, et al. Effect of different soluble pectin in breadfruit on starch digestibility [J]. Food Hydrocolloids, 2025, 162: 110945-.
- WANG S. Study on the effects of pea polyphenol extract on the physicochemical properties and digestibility of pea starch [D]. Shandong University of Technology; Shandong University of Technology, 2023.
- TAO X, YONGHENG Z, QI C, et al. Modulating the digestibility of cassava starch by esterification with phenolic acids [J]. Food Hydrocolloids, 2021, (prepublish): 107432-.
- NWOKOCHA L M, WILLIAMS P A. Characterization of irradiated starches by using FT-Raman and FTIR spectroscopy. [J]. Journal of agricultural and food chemistry, 2002, 50(14): 3912-8.
- A K A, C T L, L L V P, et al. Effects of phosphorus contents on the gelatinization and retrogradation of potato starch. [J]. Journal of food science, 2007, 72(2): C132-8.
- National Food Safety Standard: Edible Starch [Z]. National Health Commission of the People's Republic of China; State Administration for Market Regulation. 2025: 8.
- TAN X, LI X, CHEN L, et al. Effect of heat-moisture treatment on multi-scale structures and physicochemical properties of breadfruit starch. [J]. Carbohydrate Polymers, 2017, 161: 286-94.
- QING L, YIHUI W, YUEYUE Y, et al. Structure, physicochemical properties and in vitro digestibility of extruded starch-lauric acid complexes with different amylose contents [J]. Food Hydrocolloids, 2023, 136(PA).
- SHUIFANG M, YANMING R, XINGQIAN Y, et al. Regulating the physicochemical, structural characteristics and digestibility of potato starch by complexing with different phenolic acids. [J]. International journal of biological macromolecules, 2023, 253(P7): 127474-.
- HUO J, WANG L, MA J, et al. Different effects of polyphenols on hydration, pasting and rheological properties of rice starch under extrusion condition: From the alterations in starch structure. [J]. Food chemistry, 2024, 465(Pt 2): 142002.
- YIN L, ZHENG Z, LIU Q, et al. Structural and physicochemical properties of starch with varying degrees of gelatinization and complexation with polyphenol. [J]. International journal of biological macromolecules, 2025: 144390.
- A. O S, SUREN S, O. A E. A review on structural, digestibility and physicochemical properties of legume starch-lipid complexes [J]. Food Chemistry, 2021, 349: 129165-.
- LI M, NDIAYE C, CORBIN S, et al. Starch-phenolic complexes are built on physical CH-π interactions and can persist after hydrothermal treatments altering hydrodynamic radius and digestibility of model starch-based foods. [J]. Food Chemistry, 2020, 308(C): 125577.
- WANG J, HE L, MENG W, et al. Cooperative complexation of genistein and lauric acid with starch and its impact on starch digestibility. [J]. International Journal of Biological Macromolecules, 2025, 310(P3): 143318-.
- WU X, YU H, BAO G, et al. Preparation of adzuki bean starch-lipid complexes and their anti-digestion mechanism. [J]. Journal of Food Measurement and Characterization, 2021, 16(2): 1-12.
- LIU P, GAO W, ZHANG X, et al. Physicochemical properties of pea starch-lauric acid complex modified by maltogenic amylase and pullulanase [J]. Carbohydrate Polymers, 2020, 242(prepublish): 116332.
- JENKINS D J, WOLEVER T M, TAYLOR R H, et al. Glycemic index of foods: a physiological basis for carbohydrate exchange [J]. The American Journal of Clinical Nutrition, 1981, 34(3): 362-6.
- MENGGE Z, CHEN C, JINGLIN Y, et al. Effects of Chain Length and Degree of Unsaturation of Fatty Acids on Structure and in Vitro Digestibility of Starch-Protein-Fatty Acid Complexes. [J]. Journal of agricultural and food chemistry, 2018, 66(8): 1872-80.
- RAHMADANI M, FIDRIYANTO R, NAHROWI, et al. Investigating the impact of modified cassava starch with tannic acid and heat moisture treatment on physicochemical and in vitro starch digestibility. [J]. Journal of Agriculture and Food Research, 2025, 19: 101686-.
- ZHAO B, SUN S, LIN H, et al. Physicochemical properties and digestion of the lotus seed starch-green tea polyphenol complex under ultrasound-microwave synergistic interaction. [J]. Ultrasonics Sonochemistry, 2019, 52: 50-61.
- HE T, ZHAO L, WANG L, et al. Gallic acid forms V-amylose complex structure with starch through hydrophobic interaction. [J]. International Journal of Biological Macromolecules, 2024, 260(P1): 129408-.
- LIU P, KANG X, CUI B, et al. Effects of amylose content and enzymatic debranching on the properties of maize starch-glycerol monolaurate complexes. [J]. Carbohydrate Polymers, 2019, 222: 115000.
- MARTINS P C, GUTKOSKI L C, MARTINS V G. Impact of acid hydrolysis and esterification process in rice and potato starch properties. [J]. International Journal of Biological Macromolecules, 2018, 120(PA): 959-65.
- SHUANGQI T, YINGQI Y. Molecular characteristics and digestion properties of corn starch esterified by l-malic acid. [J]. Journal of Food Processing and Preservation, 2021, 45(5).
- TAO X, YONGHENG Z, QI C, et al. Modulating the digestibility of cassava starch by esterification with phenolic acids. [J]. Food Hydrocolloids, 2021, (prepublish): 107432-.
- JIN C, HAOLIANG C, MENGNA Z, et al. Effects of rice protein on the formation and structural properties of starch-lipid complexes in instant rice noodles incorporated with different fatty acids. [J]. Food Bioscience, 2023, 54.
Figure 1.
Content of RDS、SDS and RS of different sample groups. Different letters below the numbers in the bar chart indicate statistically significant differences between samples (p < 0.05).
Figure 1.
Content of RDS、SDS and RS of different sample groups. Different letters below the numbers in the bar chart indicate statistically significant differences between samples (p < 0.05).
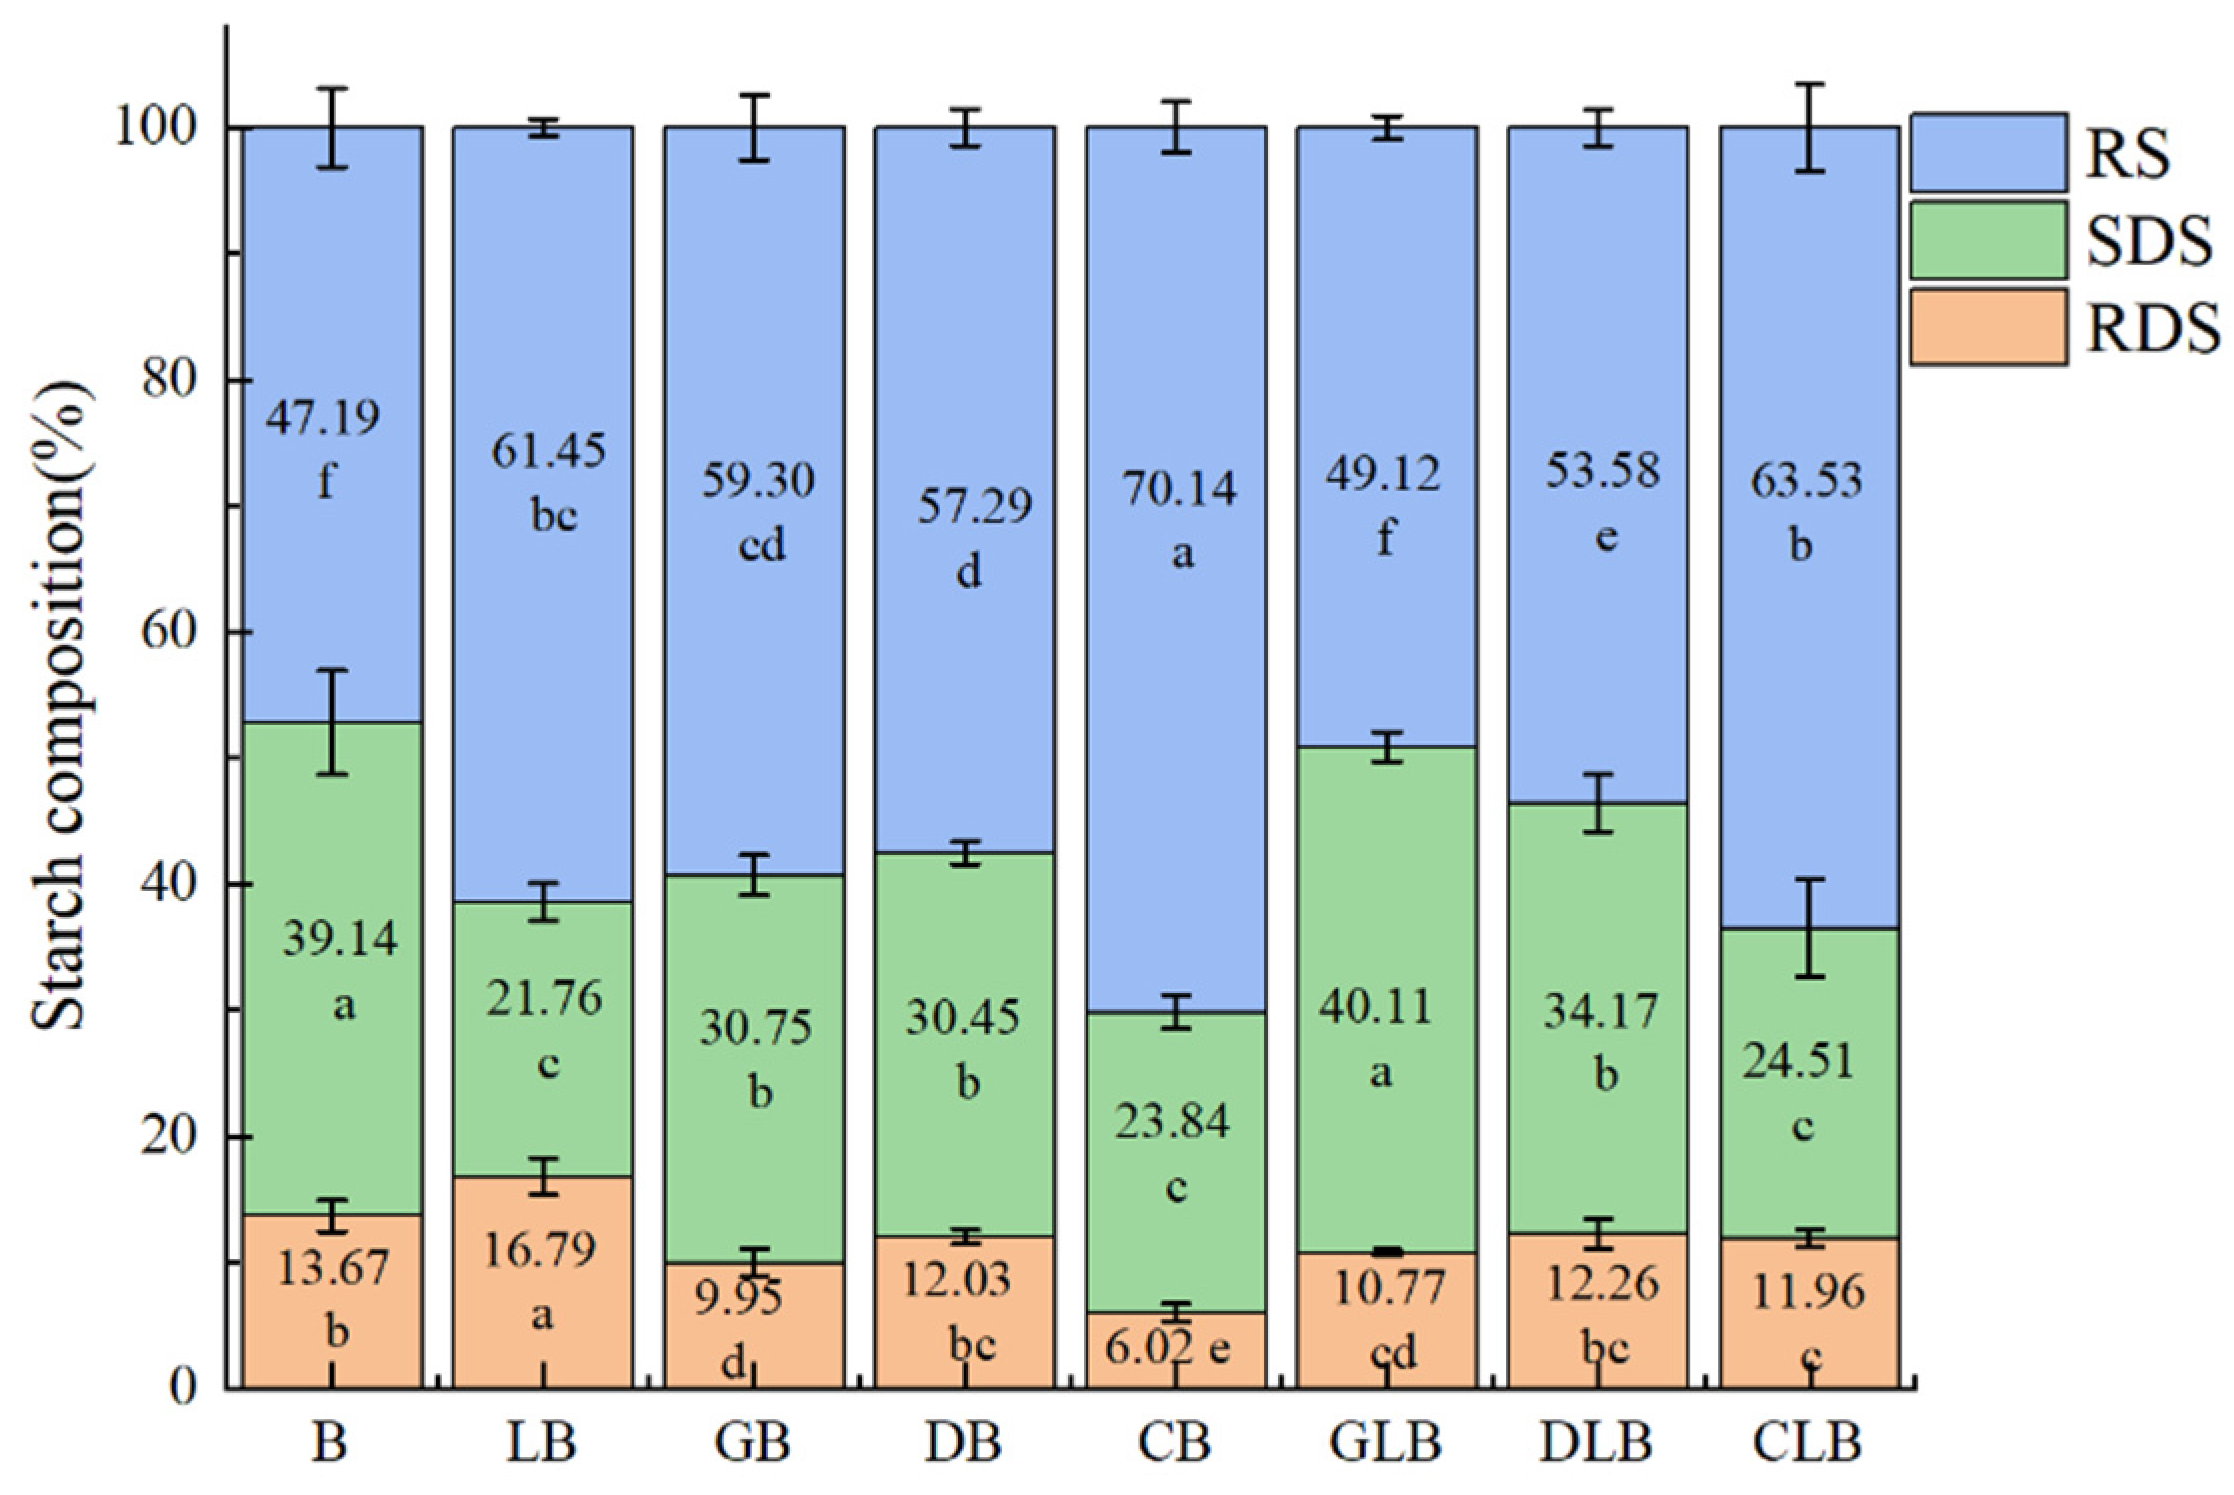
Figure 2.
Hydrolysis curves of sample groups. (a) Original profiles. (b) Fitted profiles.
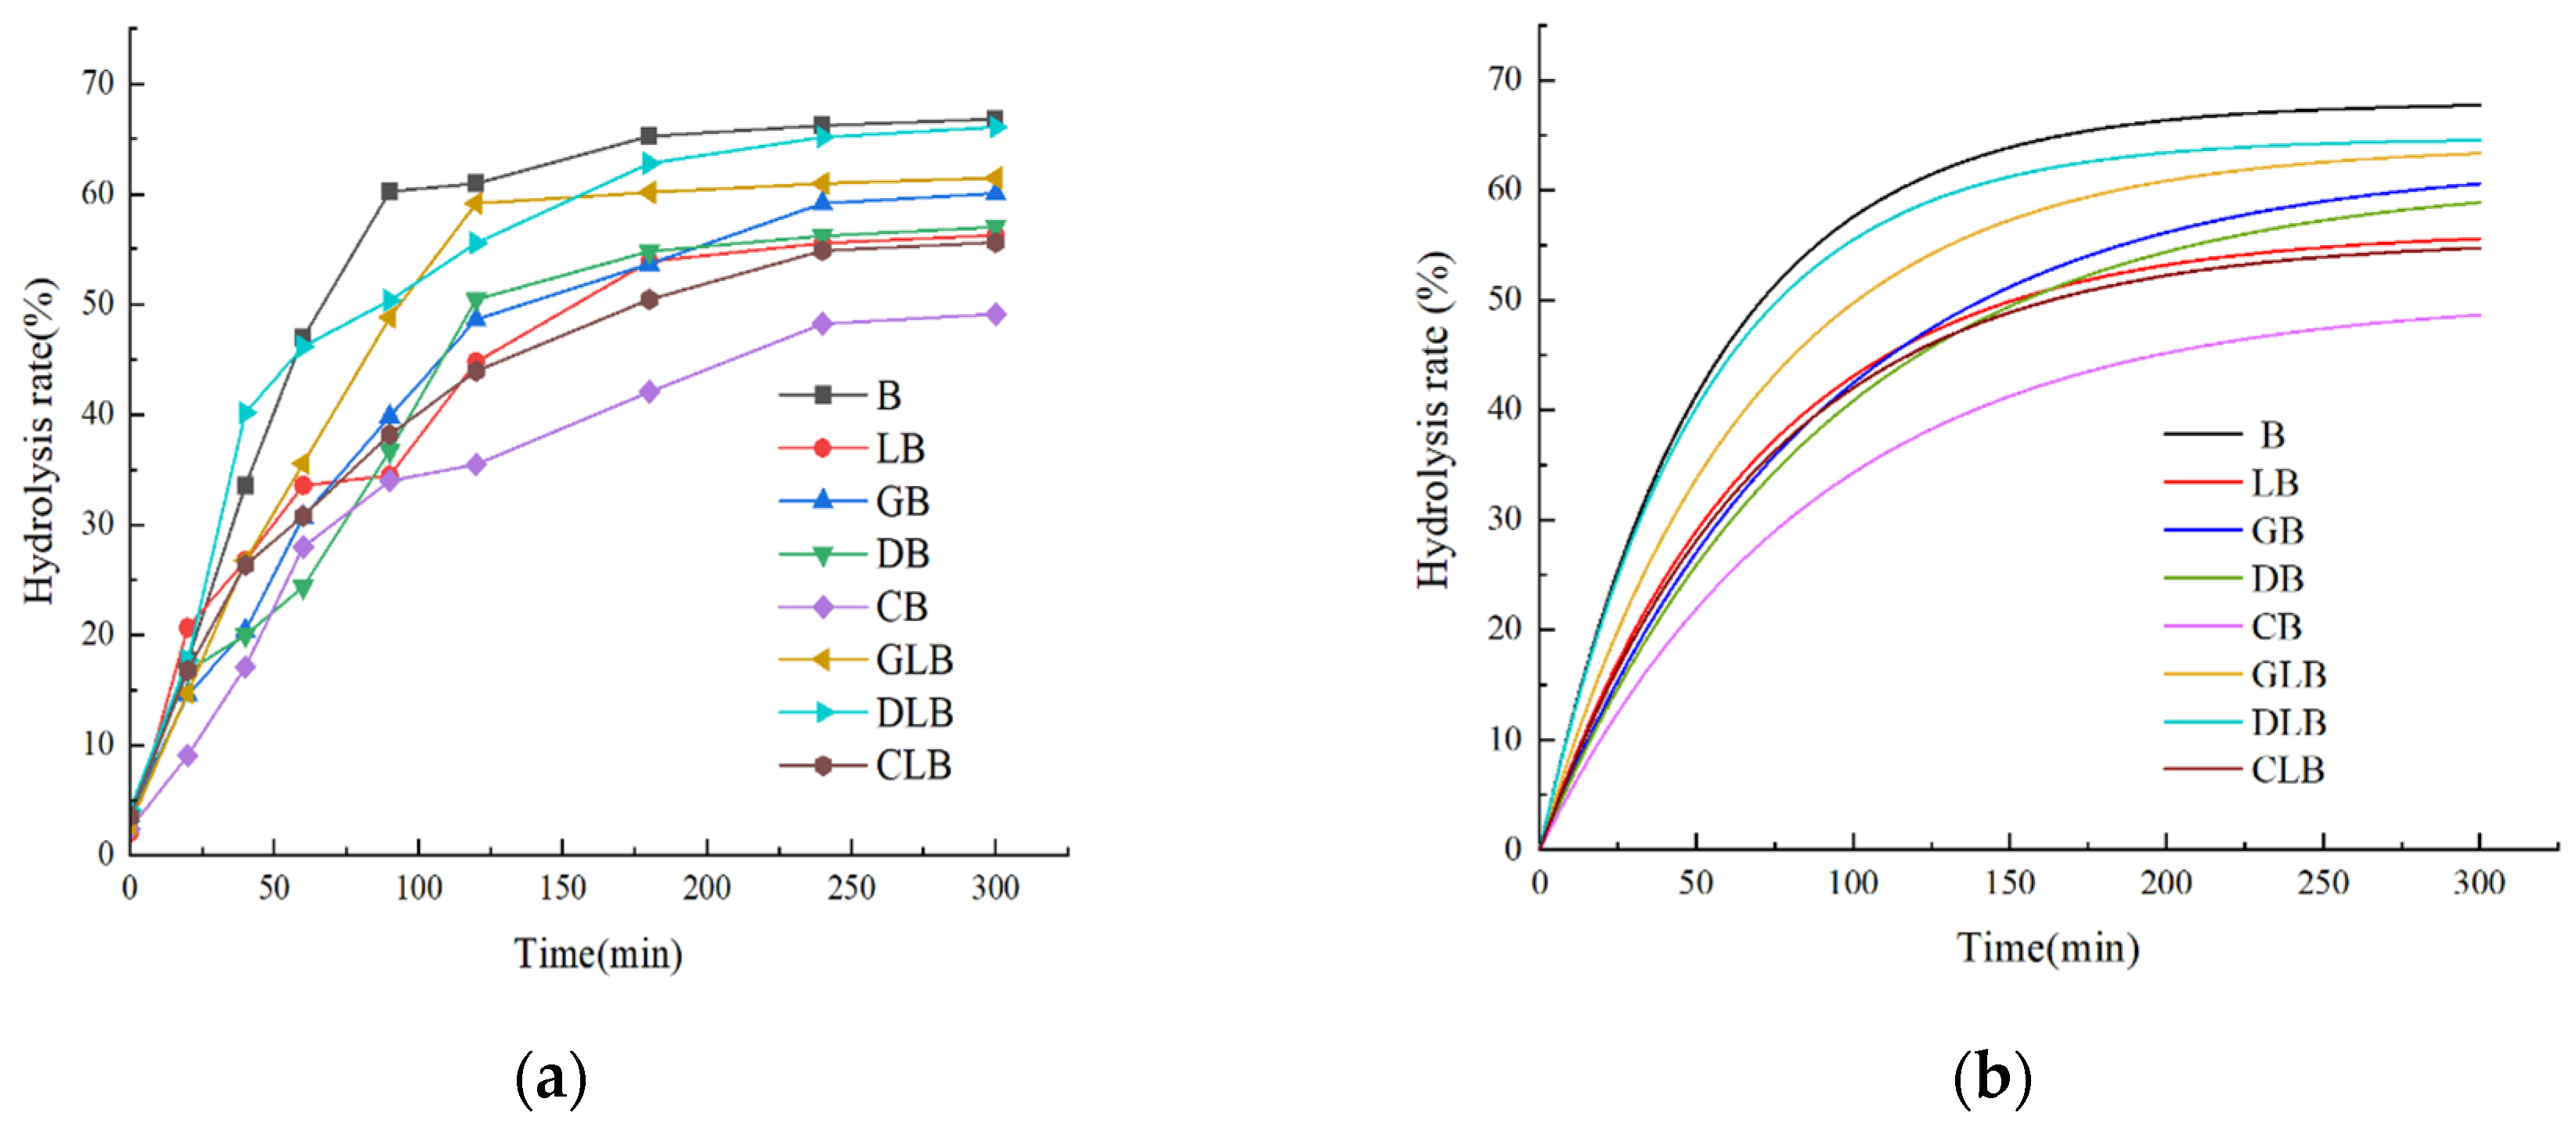
Figure 3.
RVA pasting profiles of sample groups during complex formation.
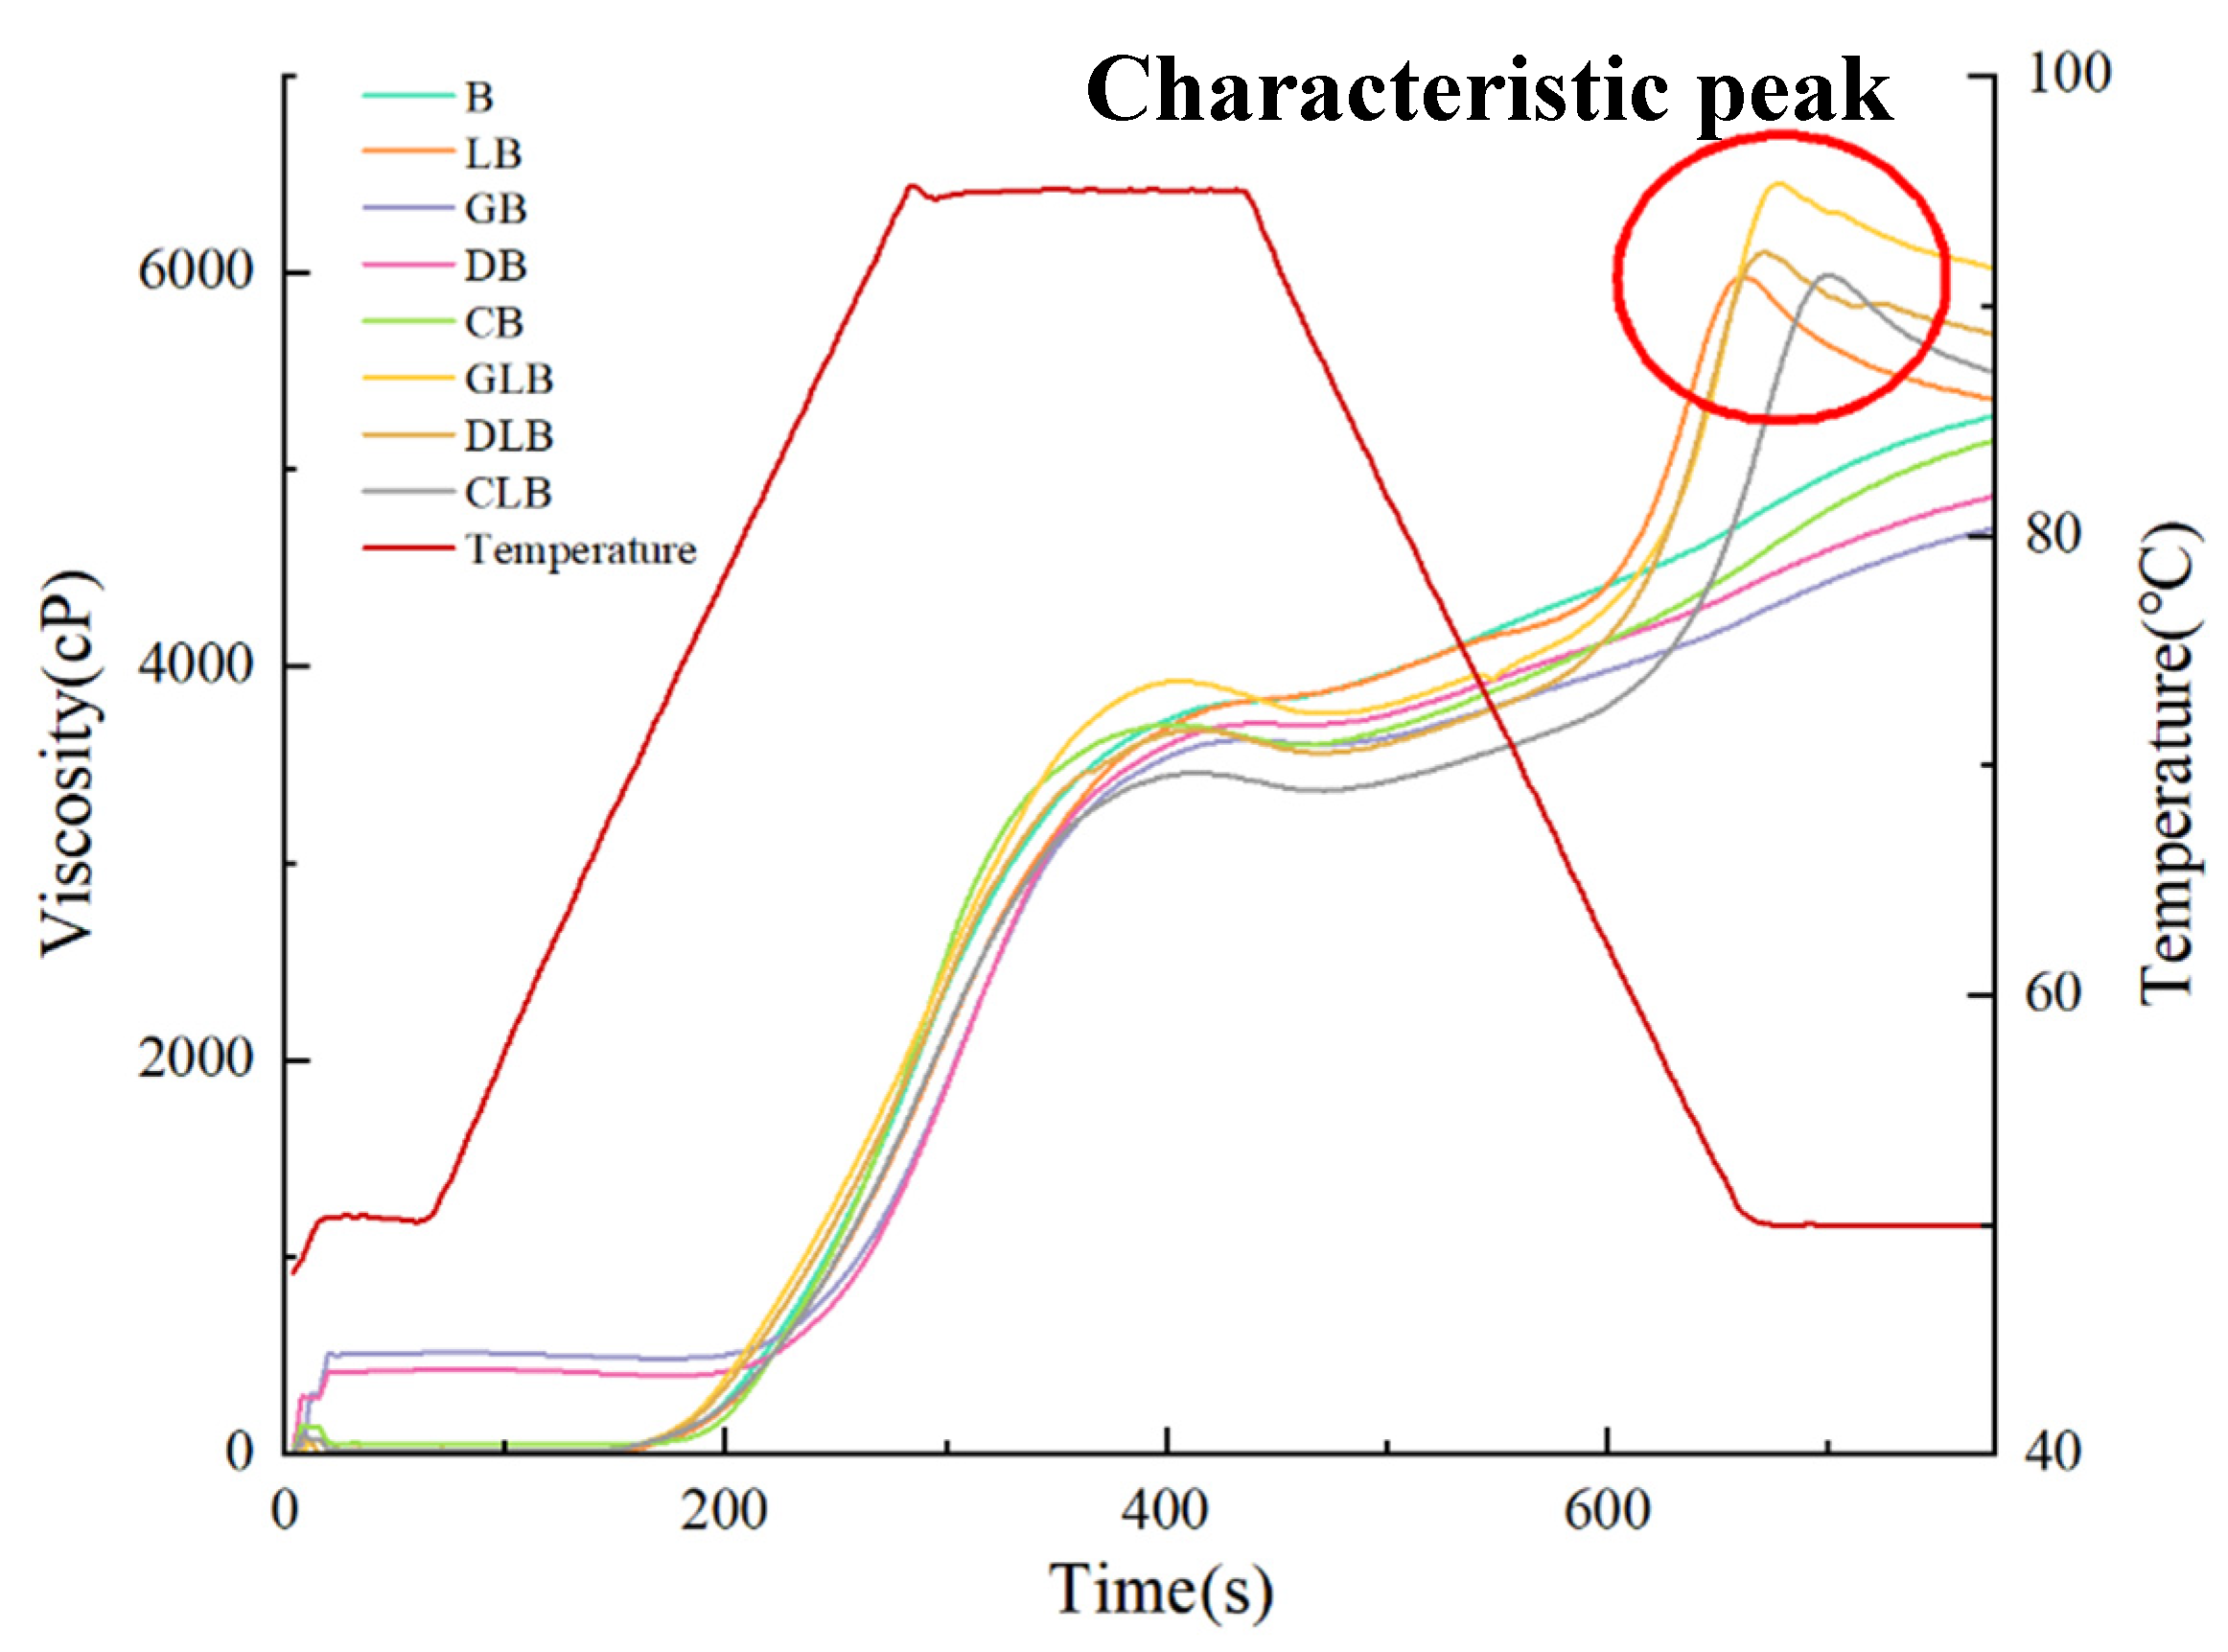
Figure 4.
DSC curves of various sample groups.
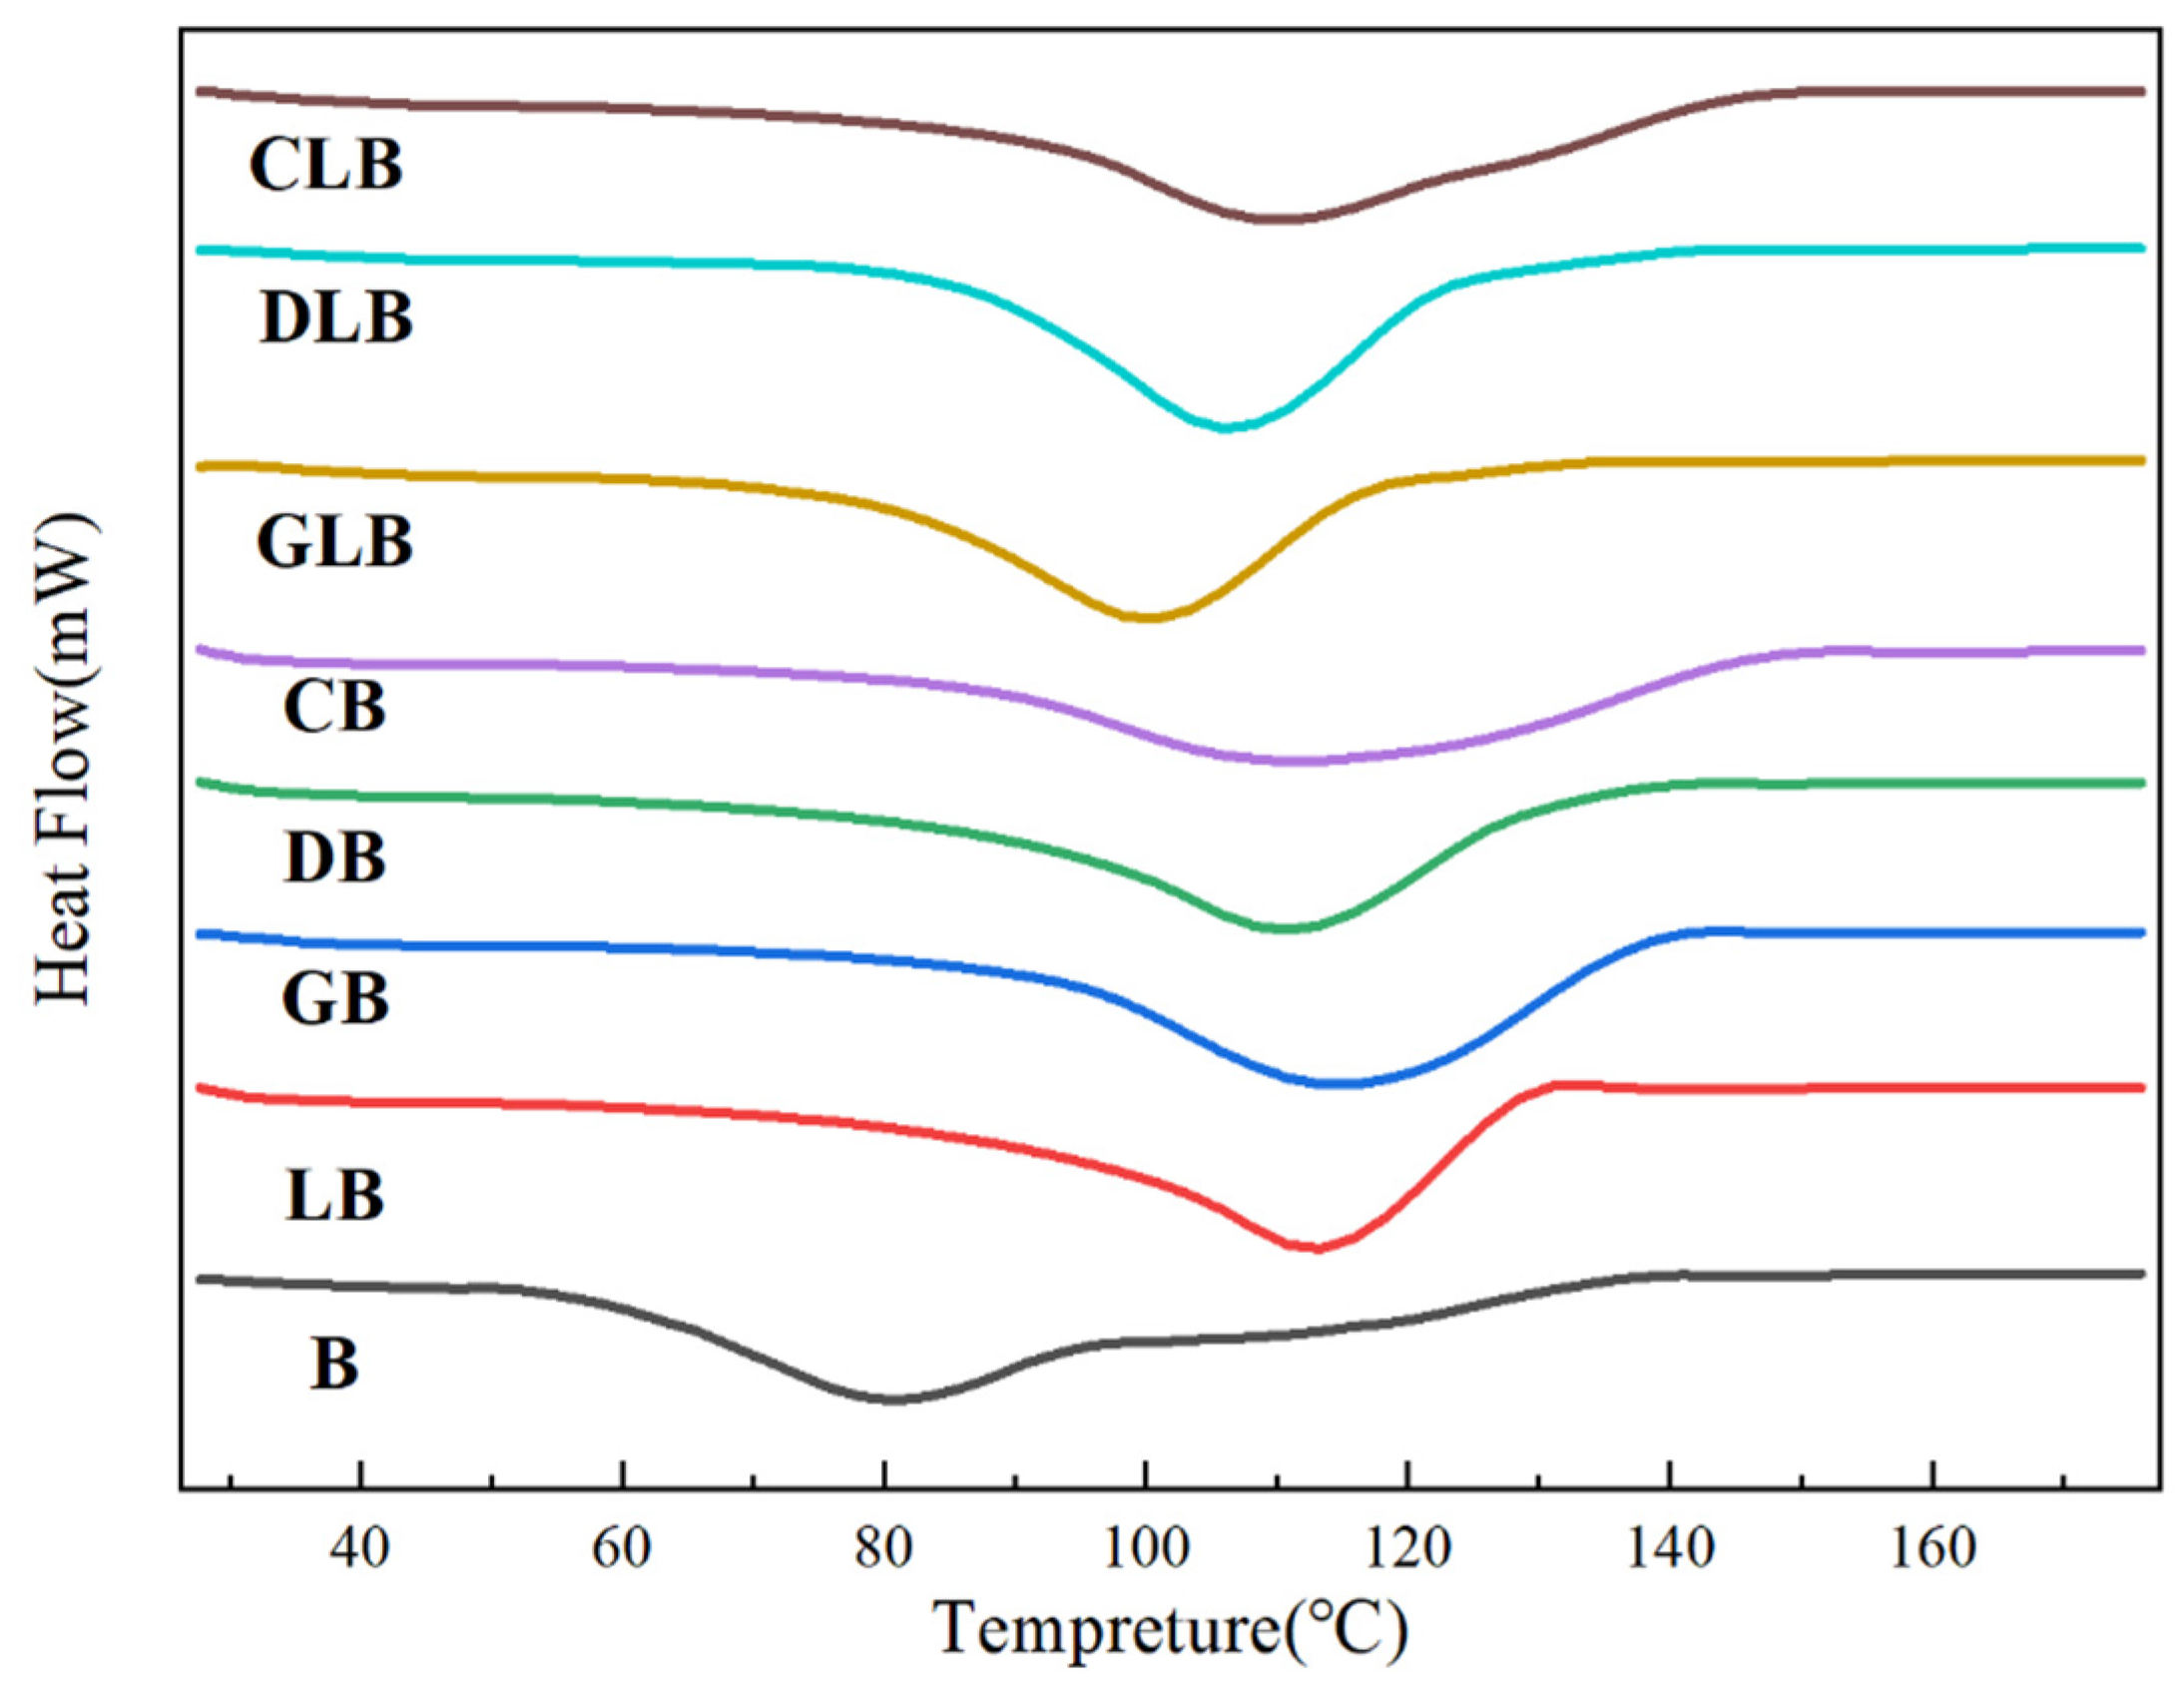
Figure 5.
Amylose extraction rate of sample groups.
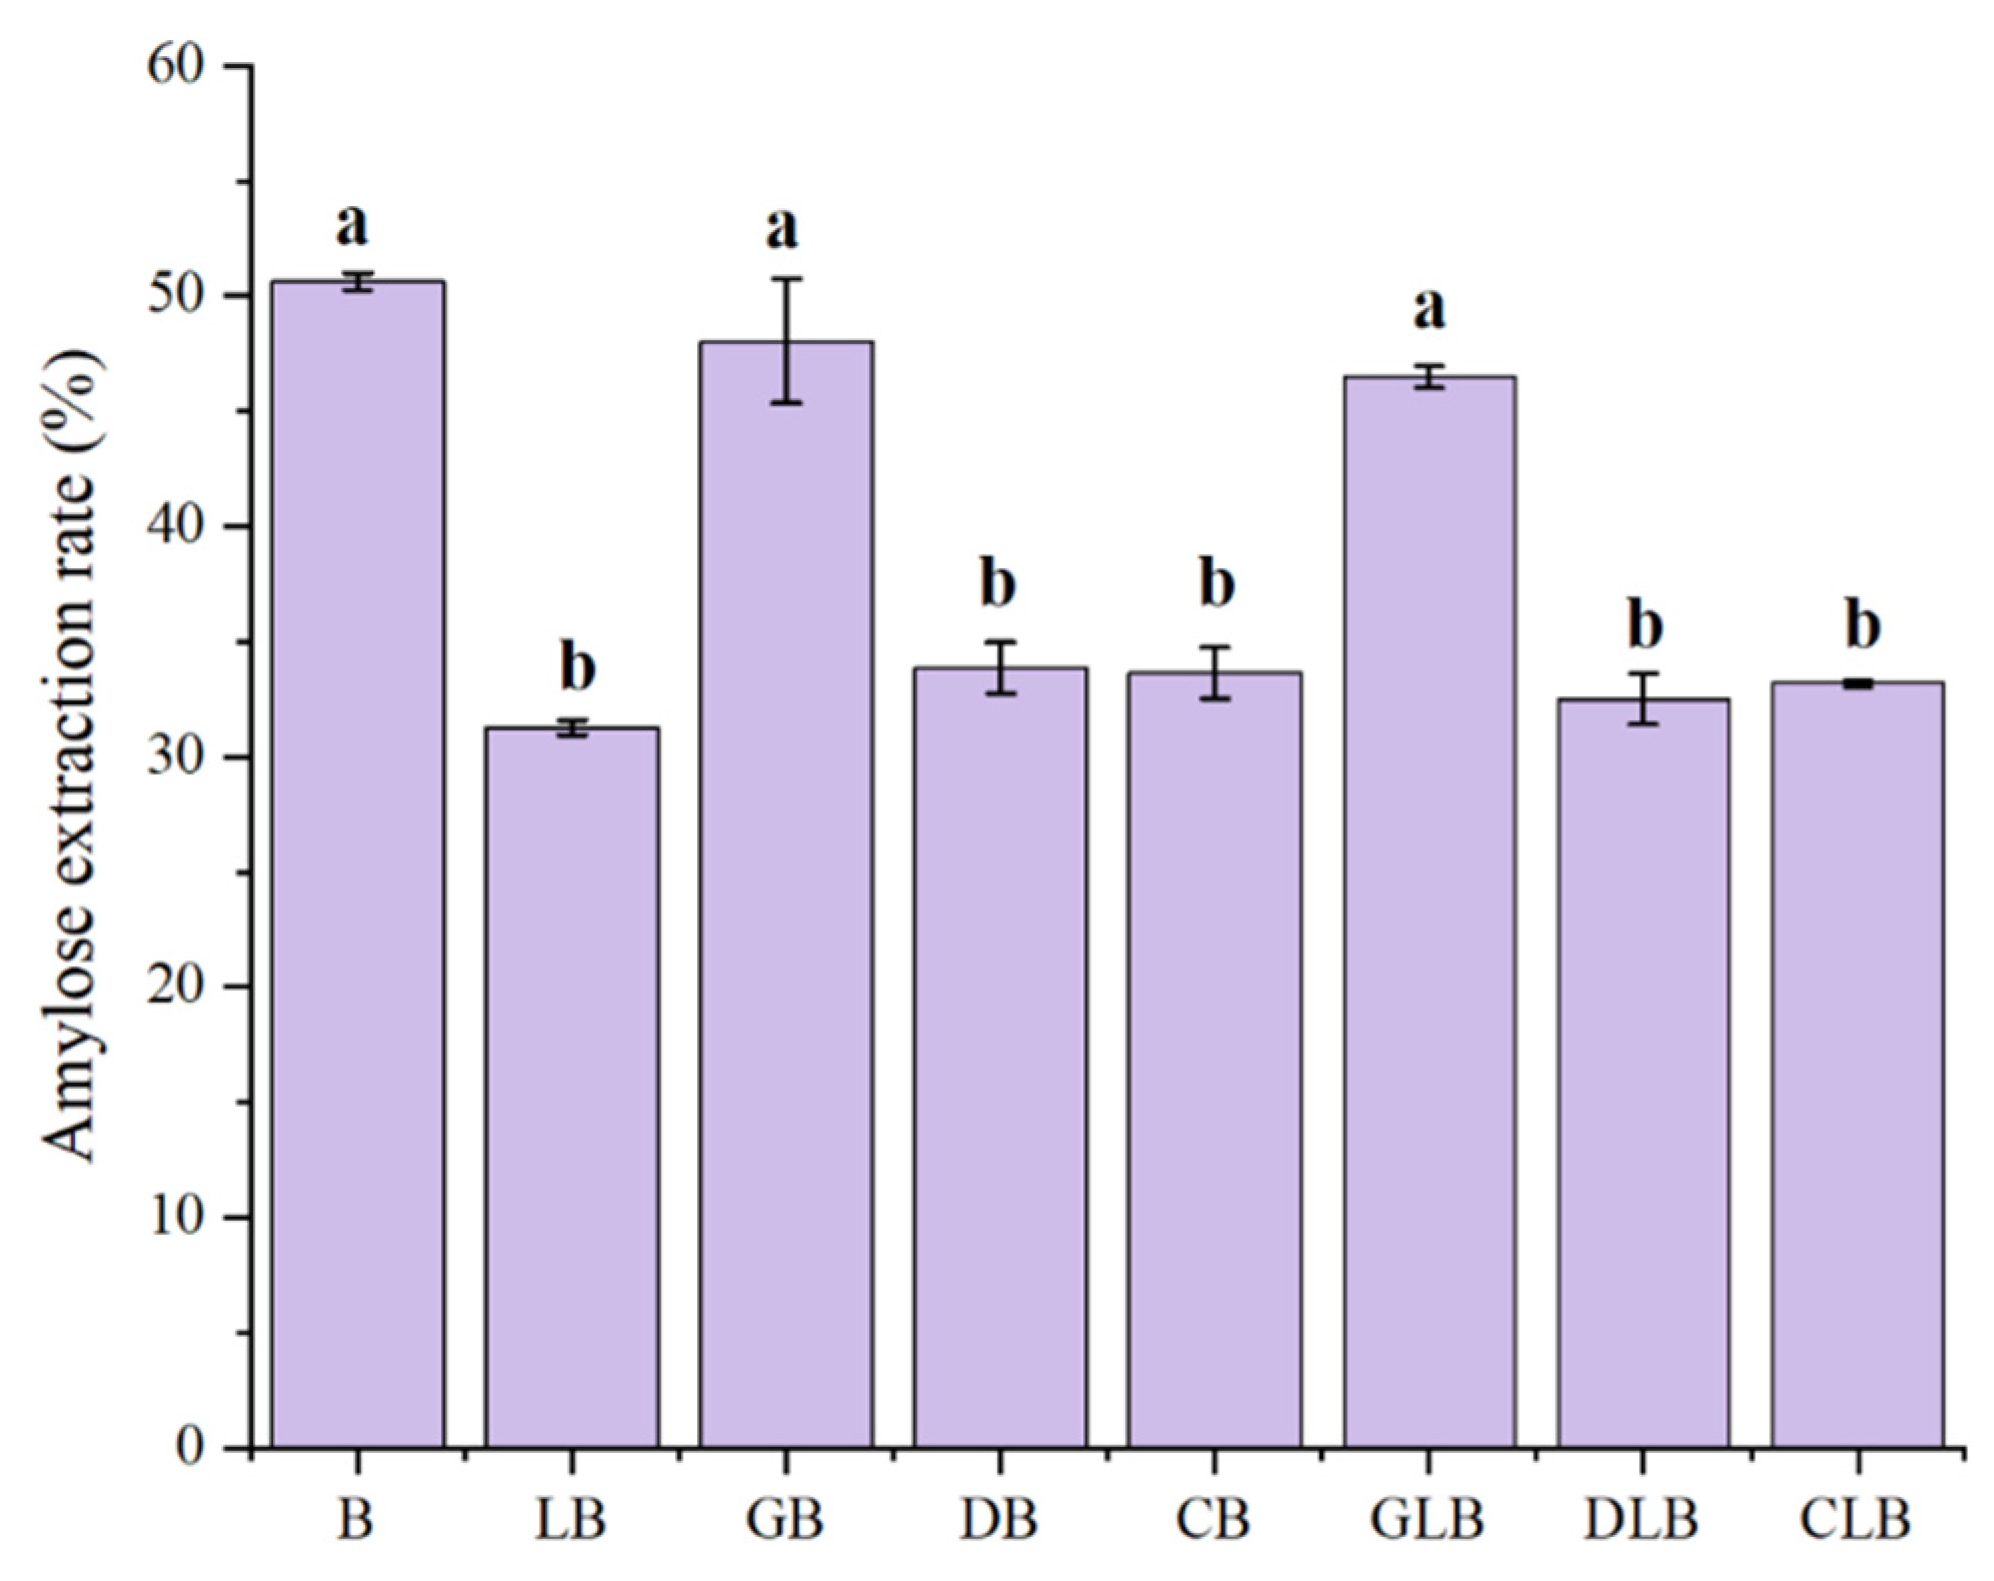
Figure 6.
FTIR spectra (A) and XRD patterns (B, C) of different sample groups.
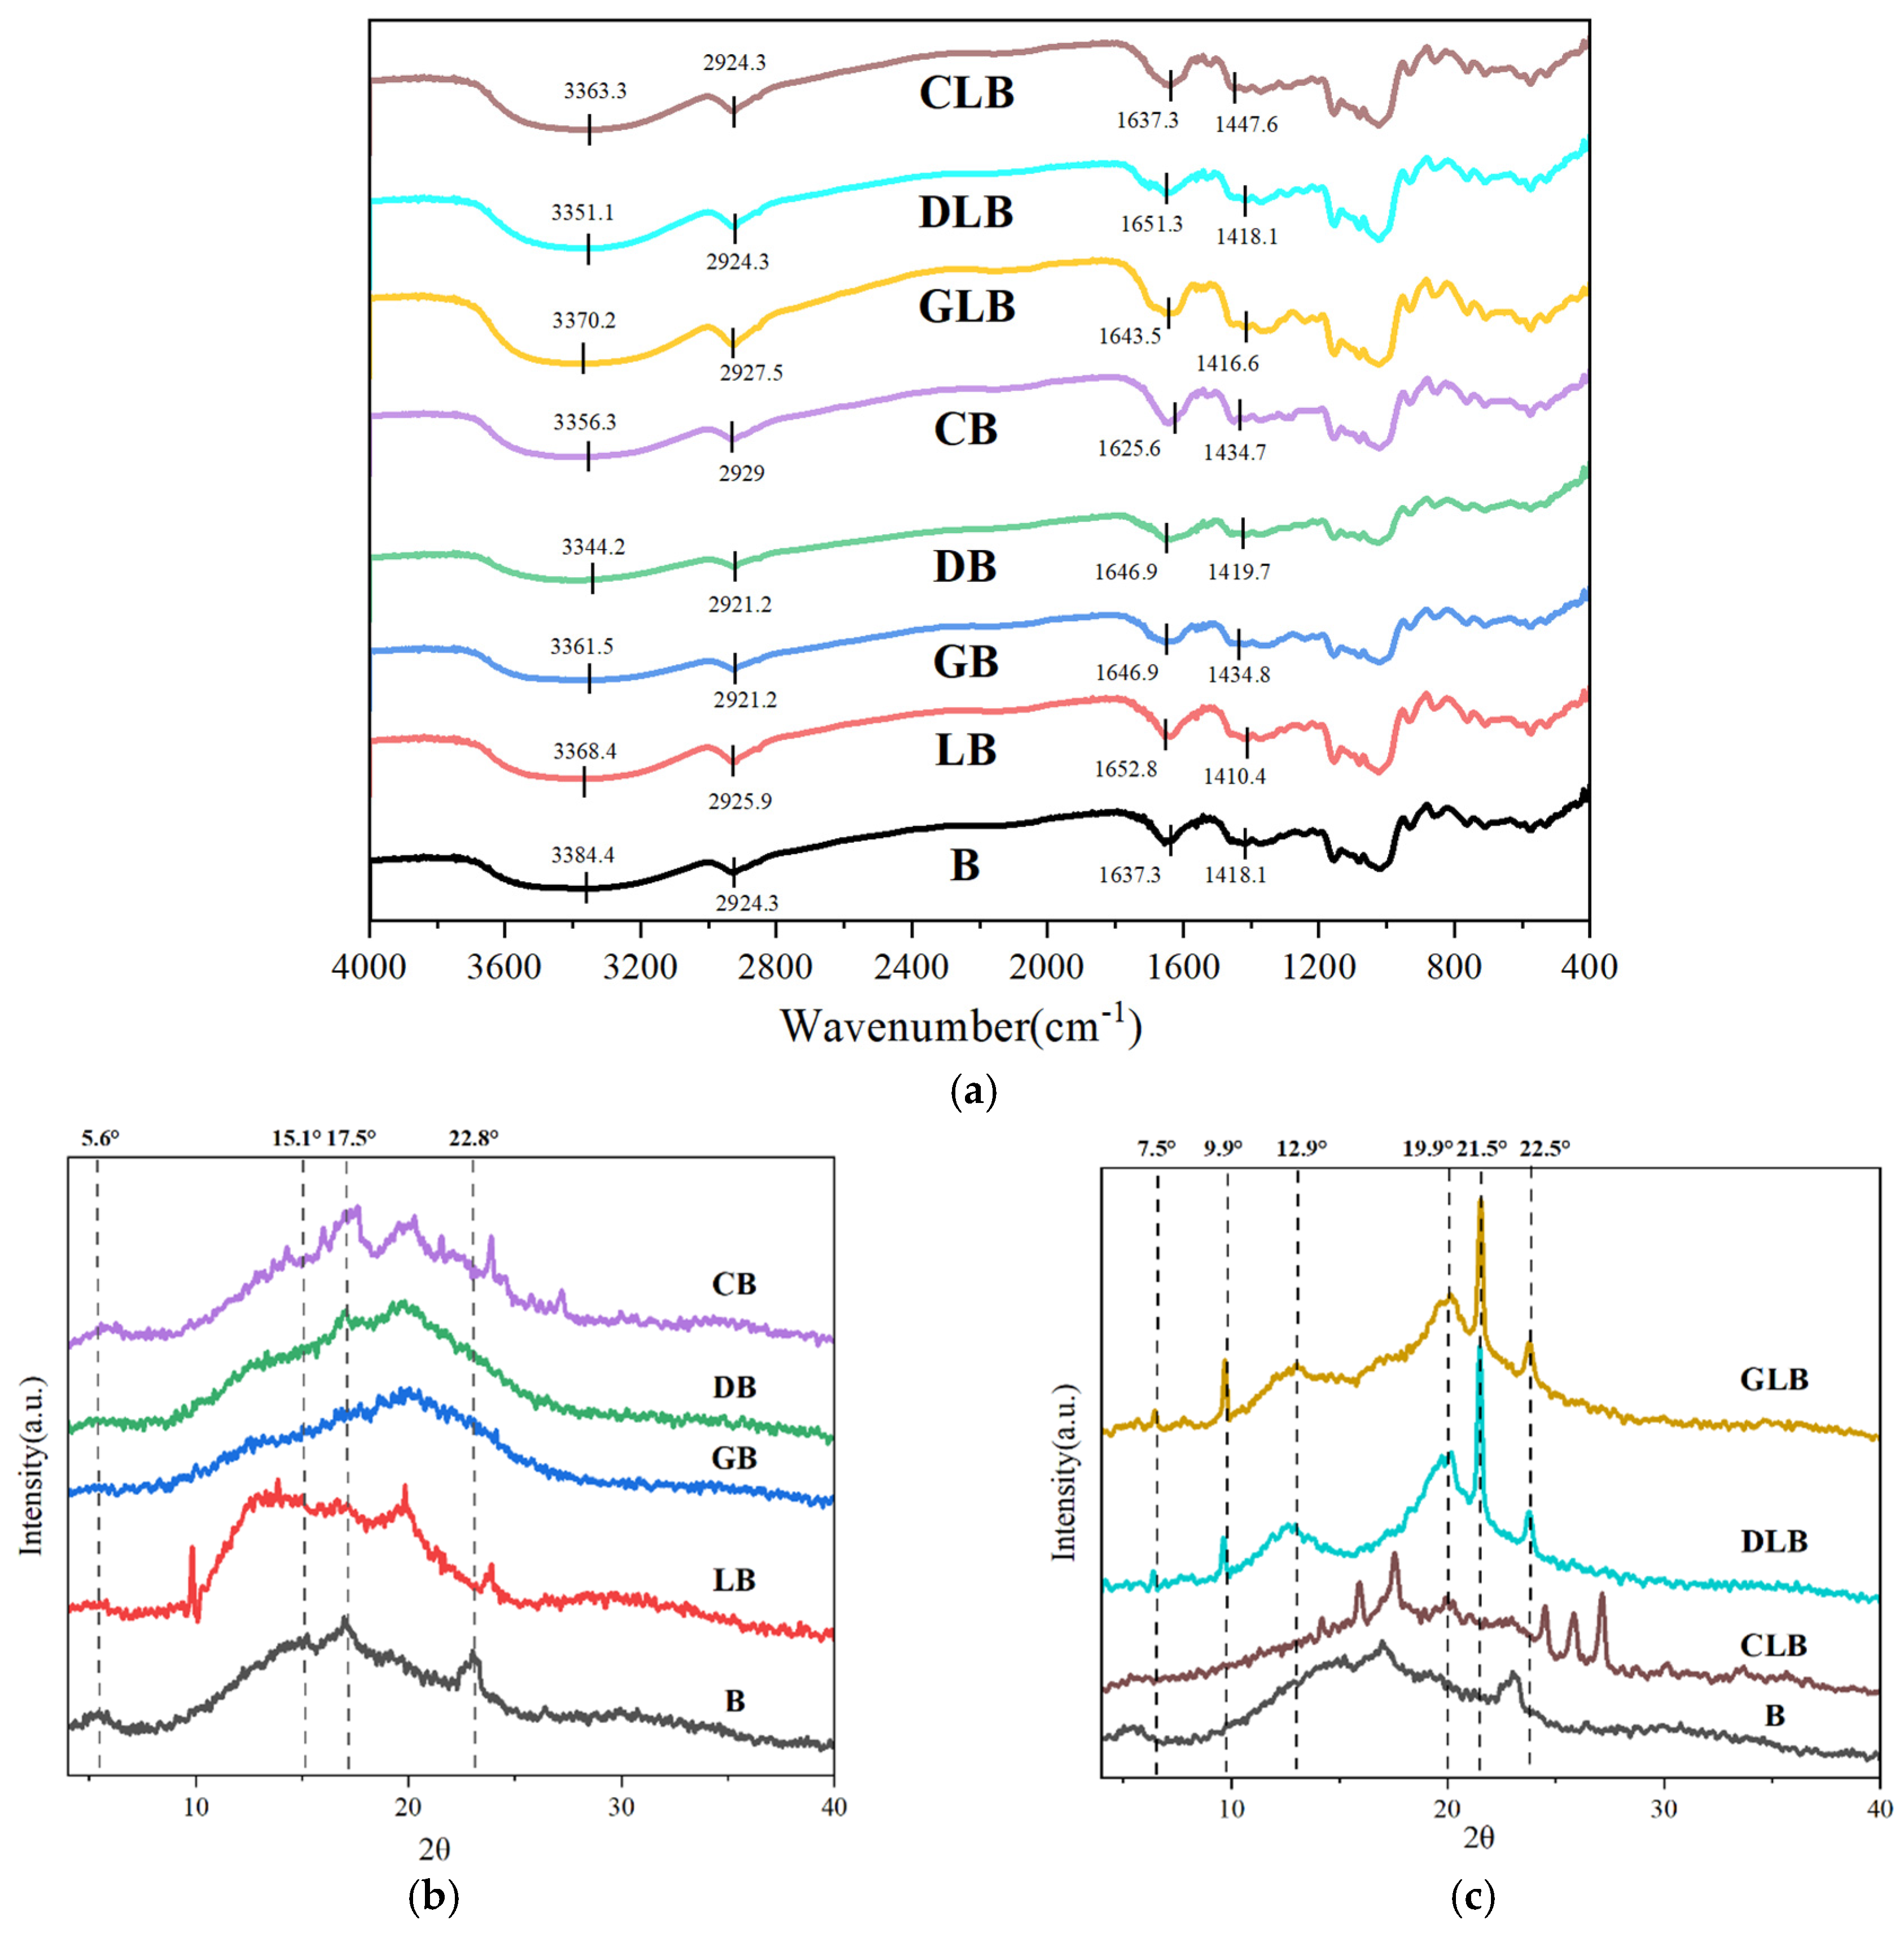

Table 1.
Equilibrium concentration (C∞), hydrolysis rate constant (k), hydrolysis index (HI), and glycemic index (eGI) of different sample groups.
Table 1.
Equilibrium concentration (C∞), hydrolysis rate constant (k), hydrolysis index (HI), and glycemic index (eGI) of different sample groups.
| Sample | C∞ (%) | k (*10^ (-2)) | HI | eGI |
| B | 67.97±0.02a | 1.88±1.71a | 80.61±0.74a | 83.97±0.41a |
| LB | 56.33±0.02f | 1.45±0.21b | 63.42±0.27e | 74.53±0.15e |
| GB | 61.14±0.04e | 1.10±0.17c | 63.24±0.18e | 74.43±0.1e |
| DB | 62.71±0.02d | 1.13±0.09c | 65.17±0.14d | 75.49±0.08d |
| CB | 50.28±0.02h | 1.15±0.11c | 52.60±0.20g | 68.59±0.11g |
| GLB | 64.76±0.02b | 1.94±0.21a | 78.17±0.02b | 82.62±0.01b |
| DLB | 64.09±0.02c | 1.50±0.15b | 72.58±0.19c | 79.56±0.10c |
| CLB | 55.57±0.02g | 1.41±0.13b | 62.13±0.04f | 73.82±0.02f |
C∞, equilibrium concentration; k, digestive rate constants; HI, hydrolysis index; EGI, estimated glycemic index. Different letters in one column indicating statistically significant differences between samples (p < 0.05).
Table 2.
Pasting properties of different sample groups.
| Sample | Peak Viscosity (cP) | Trough Viscosity (cP) | Final Viscosity (cP) | Breakdown value (cP) | Setback value (cP) | Pasting temperature (℃) |
| B | 3915.00±107.51a | 3464.33±11.50b | 5313.67±33.47c | 450.67±115.15a | 1849.33±42.77b | 73.45±0.83a |
| LB | 3768.67±30.04abc | 3328.33±34.50cde | 5245.67±100.60c | 340.33±44.79b | 1917.33±66.86b | 74.27±1.37a |
| GB | 3928.67±30.09a | 3705.00±11.53a | 6039.00±19.00a | 232.00±36.86c | 2227.67±10.26c | 73.95±7.30a |
| DB | 3654.00±38.16c | 3447.33±29.14bc | 5665.00±30.35b | 206.67±9.45c | 2217.67±2.89c | 75.02±5.58a |
| CB | 3454.33±39.80d | 3222.33±30.35e | 5450.00±38.94bc | 223.67±18.77c | 2334.00±14.80c | 71.82±1.42a |
| GLB | 3609.67±4.04cd | 3274.33±9.02de | 4703.67±86.01d | 335.33±12.58b | 1429.33±90.47a | 71.43±0.60a |
| DLB | 3681.33±32.08c | 3346.67±42.74bcd | 4853.33±104.77d | 334.67±23.46b | 1506.67±74.33a | 73.22±0.53a |
| CLB | 3749.67±104.43bc | 3605.67±95.13a | 5258.00±188.80c | 344.00±17.06b | 1719.00±48.69b | 72.33±2.31a |
Different letters in one column indicating statistically significant differences between samples (p < 0.05).
Table 3.
Gelatinization thermal properties of different sample groups.
| Samples | To (°C) | Tp (°C) | Tc (°C) | ΔH (J/g) |
| B | 70.15±0.93d | 78.62±0.60e | 86.05±0.87d | 7.74±0.56d |
| LB | 95.52±0.71a | 115.84±0.00b | 122.01±3.16b | 10.63±1.68a |
| GB | 94.86±0.04a | 113.34±0.00b | 126.44±0.06b | 9.10±0.06bc |
| DB | 93.84±1.84a | 113.42±0.46b | 122.39±0.64b | 9.81±0.15b |
| CB | 93.89±0.62a | 120.87±0.02a | 143.43±0.53a | 12.52±0.38a |
| GLB | 80.13±0.02c | 100.61±0.17d | 111.79±0.31c | 8.83±0.09c |
| DLB | 87.48±0.29b | 108.17±0.02c | 122.68±5.40b | 9.01±0.00c |
| CLB | 89.45±0.45b | 115.33±4.09b | 124.16±0.71b | 9.19±0.03bc |
To, onset temperature; Tp, peak temperature/gelatinization temperature; Tc, conclusion temperature; ΔH, gelatinization enthalpy; Different letters in one column indicate statistically significant differences between samples (p < 0.05).
Table 4.
Solubility, swelling power, and freeze-thaw stability of different sample groups.
| Sample | Swelling power (g/g) | Solubility (%) | Freeze-thaw stability (%) |
| B | 12.92±0.94ab | 3.23±0.32d | 54.57±2.73a |
| LB | 9.56±0.36de | 1.77±0.61e | 44.00±1.47cde |
| GB | 12.87±1.14ab | 6.83±0.78a | 49.04±1.39b |
| DB | 13.48±0.56a | 5.32±0.83b | 47.21±2.96bc |
| CB | 12.54±0.37ab | 5.42±0.25b | 44.57±2.29cd |
| GLB | 11.62±0.41bc | 4.06±0.38cd | 40.66±0.74ef |
| DLB | 10.57±0.05cd | 4.90±0.55bc | 43.15±3.34de |
| CLB | 8.91±0.76e | 3.50±0.43d | 38.75±3.12f |
Different letters in one column indicate statistically significant differences between samples (p < 0.05).
Table 5.
Particle size characteristics、R1047/1022 and Rc of different sample groups of different sample groups.
Table 5.
Particle size characteristics、R1047/1022 and Rc of different sample groups of different sample groups.
| Sample | Specific surface area (m²/kg) | D [3,2] (μm) | D [4,3] (μm) | Dx (50) (μm) | R1047/1022 | Rc (%) |
| B | 61.54±6.19b | 93.33±9.38d | 381.44±11.49d | 357.92±2.12c | 0.722±0.088a | 2.54±0.28d |
| LB | 59.98±1.12b | 95.29±1.77d | 316.49±13.57f | 298.34±8.44d | 0.795±0.002bd | 6.77±0.56bc |
| GB | 51.04±0.06c | 111.96±0.12c | 355.51±9.35de | 293.20±2.63d | 0.877±0.009c | 4.83±0.43cd |
| DB | 40.26±2.60d | 142.25±9.17b | 425.45±24.95c | 359.99±30.81c | 0.888±0.002c | 8.21±0.15b |
| CB | 32.92±1.19e | 173.74±6.31a | 472.84±20.29b | 418.07±24.73b | 0.863±0.003c | 9.31±1.12b |
| GLB | 55.64±0.59bc | 102.72±1.09cd | 320.41±3.69ef | 273.57±8.96d | 0.794±0.006bd | 14.12±0.99a |
| DLB | 75.73±1.66a | 75.48±1.66e | 243.89±5.69g | 179.74±3.51e | 0.765±0.003b | 16.08±0.30a |
| CLB | 34.95±1.77de | 163.73±8.30a | 653.32±19.59a | 558.85±21.44a | 0.806±0.007bd | 16.27±1.45a |
D [3,2], surface area average diameter; D [4,3], volume average diameter; Dx (50), median particle size, the particle size value corresponding to 50% of the cumulative particle size distribution. R1047/1022, absorption rate of 1047 cm−1/1022 cm−1. Rc, relative crystallinity. Different letters in one column indicate statistically significant differences between samples (p < 0.05).
Disclaimer/Publisher’s Note: The statements, opinions and data contained in all publications are solely those of the individual author(s) and contributor(s) and not of MDPI and/or the editor(s). MDPI and/or the editor(s) disclaim responsibility for any injury to people or property resulting from any ideas, methods, instructions or products referred to in the content. |
© 2025 by the authors. Licensee MDPI, Basel, Switzerland. This article is an open access article distributed under the terms and conditions of the Creative Commons Attribution (CC BY) license (http://creativecommons.org/licenses/by/4.0/).
Copyright: This open access article is published under a Creative Commons CC BY 4.0 license, which permit the free download, distribution, and reuse, provided that the author and preprint are cited in any reuse.


