Submitted:
30 December 2025
Posted:
31 December 2025
You are already at the latest version
Abstract
This study investigated the kinetics of aptamer-cardiac troponin I (cTnI) interaction to establish a new dynamic quantitative indicator for the rapid, highly sensitive detection of cTnI, a critical myocardial infarction biomarker. The goal was to overcome the limitations of conventional diagnosis based on saturated binding amounts, which takes excessive time for point-of-care testing (POCT). Cyclic voltammetry (CV) was performed on a gold electrode immobilized with double-stranded aptamers, and the interaction kinetics were rigorously analyzed across cTnI concentrations from 10 pg/mL to 90 pg/mL. The adsorption process, quantified by changes in charge amount, was found to follow a similar first-order interaction model. The most significant findings were the establishment of a robust power function (R2=0.9515) relating the cTnI concentration to the derived interaction rate constant. This high explanatory power confirms the predictable and quantitative relationship between concentration and reaction speed. In conclusion, the interaction rate constant is proposed as a novel dynamic indicator for predicting cTnI concentration, providing a crucial technological foundation for developing next-generation, high-speed, high- sensitivity aptamer-based biosensors essential for time-critical POCT applications.
Keywords:
cardiac troponin I
; aptamer
; cyclic voltammetry
1. Introduction
Troponin is a core protein complex of thin filaments that regulates the contraction of skeletal and heart muscles [1]. This complex coordinates the basic mechanism activity by playing a decisive role in linking changes in intracellular calcium ion concentration and the occurrence of muscle contraction [2]. The troponin complex consists of three subunits: troponin C (TnC), which is a Ca2+ binding site, troponin I (TnI), which inhibits actin-myosin interaction, and troponin T (TnT), which is a tropomyosin binding site [1]. Ca2+-dependent muscle contraction regulation is achieved through their structural and biochemical interactions. Cardiac troponin I (cTnI) and cardiac troponin T (cTnT), which are expressed in the heart muscle, are distinct from skeletal muscle isomorphic proteins in their structures and metabolic characteristics and act as key regulators of heart function [3]. Understanding the physiological roles of cardiac troponin is essential for understanding not only the normal function of the myocardium but also the mechanism by which it develops various cardiomyopathy [2].
When myocardial cells are damaged, cardiac troponin (cTnI and cTnT) is released into the bloodstream. Owing to their high specificity and sensitivity to heart injury, they have been widely used as gold-standard biomarkers for the diagnosis of cardiovascular diseases including acute myocardial infarction (AMI) for the past 25 years [2]. Consequently, accurate and rapid measurement of cardiac troponin concentration is critical for early diagnosis, prognosis prediction, and timely clinical decision-making. To date, standard troponin detection methods have primarily relied on immunochemical diagnostics based on specific antibody-antigen interactions, such as enzyme-linked immunoassays (ELISA), surface plasmon resonance (SPR), and fluorescence-based immunoassays [4,5,6]. Although these techniques provide excellent analytical performance, they typically require complex labeling or washing procedures, expensive instrumentation, and relatively long assay times, which limit their applicability in point-of-care testing (POCT) environments where rapid and simple analysis is essential.
To address these limitations, aptamers have emerged as promising alternatives to antibodies as molecular recognition elements. Aptamers are single-stranded oligonucleotides that can be synthetically produced with high batch-to-batch reproducibility, enhanced chemical stability, and flexible surface immobilization strategies [7,8]. These advantages have led to increasing interest in aptamer-based biosensors (aptasensors) for cardiac troponin detection. Electrochemical aptasensors have attracted significant attention due to their low cost, portability, rapid response, and compatibility with miniaturized sensing platforms, making them well suited for POCT applications [9,10,11,12]. However, despite these advantages, many reported electrochemical aptasensors still rely primarily on endpoint or saturated signal measurements. Such approaches often require relatively long interaction times to reach equilibrium and do not fully exploit the dynamic information inherent in the aptamer-target binding process, thereby limiting their usefulness for rapid quantitative analysis.
Cyclic voltammetry (CV) is one of the most fundamental electrochemical techniques for probing interfacial electron transfer processes and surface-confined reactions. By linearly sweeping the electrode potential in forward and reverse directions, CV provides characteristic current-potential responses that are highly sensitive to changes in surface charge and electron transfer behavior [13]. Owing to its simple experimental configuration, label-free detection capability, and strong sensitivity to surface modifications, CV has been widely employed in electrochemical biosensing applications, including affinity-based protein detection [14,15]. Compared to other electrochemical techniques, CV enables direct and intuitive evaluation of surface-confined charge transfer processes, making it particularly suitable for kinetic analysis of biomolecular interactions occurring at electrode interfaces.
In this study, we investigated the concentration-dependent kinetics of the interaction between a double-stranded aptamer immobilized on a gold electrode and cardiac troponin I using cyclic voltammetry. Rather than relying on conventional saturated binding signals, we focus on the dynamic interaction process and derive the interaction rate constant as a new quantitative indicator. By establishing a functional relationship between cTnI concentration and the interaction rate constant, this work proposes a time-efficient and predictive strategy for rapid and sensitive cTnI quantification. This approach provides a crucial technological foundation for the development of next-generation, high-speed aptamer-based biosensors suitable for time-critical POCT applications.
2. Materials and Methods
The aptamer sequence targeting cardiac troponin I (cTnI) was 5’-CGTGCAGTACGCCAACCTTTCTCATGCGCTGCCCCTCTTA-3’ [9,16]. The double-stranded (ds) aptamer was prepared by annealing this sequence with its complementary strand, which was modified with a thiol-C6 functional group at its 5’ end for immobilization onto the gold surface. Chemical reagents are Tris(2-carboxyethyl)phosphine hydrochloride (TCEP), Ethylenediaminetetraacetic acid (EDTA), Tris(hydroxymethyl)aminomethane (Tris-HCl), Sodium chloride (NaCl), 6-Mercapto-1-hexanol (MCH), Potassium hexacyanoferrate(Ⅲ) (K3Fe(CN)6), Potassium nitrate (KNO3), Phosphate Buffered Saline (PBS, 10 mM). Cardiac troponin I (cTnI) was purchased from Sigma-Aldrich. All aqueous solutions were prepared using deionized water (distilled water), and ethanol was used for electrode cleaning.
The bare gold electrode was prepared by sequentially polishing its surface with distilled water and ethanol. The electrochemical characteristics of the bare electrode were then verified using CV. The CV measurement was conducted in an electrolyte solution consisting of 5 mM K3Fe(CN)6 (redox probe) and 0.1 M KNO3 (supporting electrolyte). The CV was performed over an applied potential range from – 200 mV to 600 mV, and the corresponding current change was recorded to establish a baseline [17].
A 30 nmol stock of the ds-aptamer was diluted into a dedicated hybridization and immobilization buffer to achieve a final concentration 1 μM [18,19]. The buffer composition was 5 mM TCEP in a solution of 10 mM Tris-HCl, 1 mM EDTA, and 100 mM NaCl (pH 7.4) [20,21]. The pre-treated gold was immersed in 300 μL of the 1 μM aptamer solution and incubated at room temperature for 2 hours. During this period, the thiol-C6 group on the complementary strand forms a self-assembled monolayer, fixing the aptamer onto the electrode surface. This immobilization process was expected to cause a decrease in the electrochemical signal (peak current) due to charge hindrance. Following immobilization, the electrode was thoroughly washed with distilled water. CV was performed again using electrolyte solution to verity the successful aptamer binding based on the observed change in peak current values.
To prevent nonspecific binding between the target analyte (cTnI) and any residual bare areas of the gold electrode surface, a surface blocking step was implemented using MCH. MCH was mixed with 5 mM TCEP to prepare a blocking solution with a final MCH concentration of 5 mM. The aptamer-modified electrode was reacted by 300 μL of the 5 mM MCH solution for 1 hour at room temperature. The electrode was washed with distilled water and measured via CV to confirm the completion of the blocking step. Figure 1 is a schematic diagram of electrode surface modification.
The 50 μg stock of cTnI was dissolved in 10 mM PBS and subsequently diluted to a set of target concentrations: 10, 30, 50, 70, and 90 pg/mL. To identify the optimal incubation time, CV was performed while incrementally increasing the interaction time of the aptasensor with a 10 pg/mL cTnI solution. The saturation point was defined as the interaction time at which the change in the electrochemical signal resulting from the troponin-aptamer binding stabilized. Based on the determined saturation point, the aptasensor was exposed to the various cTnI concentrations (10 to 90 pg/mL). CV measurements were taken after the optimized incubation time for each concentration to establish the voltage-current curve.
3. Results
3.1. Time-Dependent CV Results and Saturation Point Determination
We first observed how the interaction of troponin with aptamer changed with time at a concentration of 10 pg/mL. (a) in Figure 2 shows the CV results measured by time at a concentration of 10 pg/mL. The interaction time started 20 minutes and lasted for 4 hours. The amount of charge was calculated through time and current graphs. Through the charge value, the increase and decrease were repeated after 2 hours, we set 2 hours as the saturation point because the mean value showed a plateau state, although there was an increase until 2 hours.
Based on the CV results at 10 pg/mL, the result of the interaction time of 20 min at different concentrations was measured. (b) in Figure 2 is a graph of voltage-current from 10 to 90 pg/mL.
3.2. Concentration-Dependent Kinetics Analysis and Functional Relationship Derivation
The following is the process of calculating the reaction rate according to the concentration. The reaction between cTnI and aptamer changes the double strand to a single strand, and the surface charge transfer resistance decreases, increasing the amount of charge. The amount of charge reflects the fraction, which is the rate at which aptamer reacted, and it depends on the concentration of cTnI, and the higher the concentration, the higher the amount of charge. Therefore, it was judged that the fraction could be calculated from the change in the amount of charge, and that the rate constant k at each concentration could be obtained from the pattern of the fraction over time. After that, we thought that it would be possible to derive a functional relationship between concentration and the rate constant by comparing the concentration and the value of k.
Since the aptamer is fixed to the surface and only the protein concentration changes, it was determined that the fraction and reaction rate constant are related to the following pseudo first-order reactions.
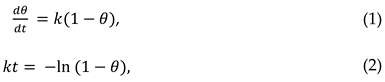
As the charge amount and fraction are correlated, the calculation was made from the charge amount of 10pg/mL.
Table 1 shows the relationship between the fraction and the amount of charge. Before troponin I reacted was set to 0, and the difference value for each time was calculated, and the saturated value was set as the average of the difference values after 2 hours, which was 3.43 μA. The fraction was calculated as the ratio of the difference in charge to the saturated value.
Fitting was attempted from the time and derived fraction to be confirmed by the first-order reaction model, and from the graph in Figure 3, it was found that the slope of the graph was interaction rate constant through Equation 2.
And the fraction and the amount of charge for each time were recalculated using the k value obtained from Figure 3. The fraction in Table 2 was calculated by expanding Equation 2 with respect to θ, and the amount of charge was calculated by multiplying the calculated fraction by the saturated value.
Next, to find the relationship between concentration and interaction rate constant, the amount of charge was calculated from CV result for each concentration. The difference in charge amount by concentration was calculated in the same way as before. The fraction by concentration was calculated using the derived value in Table 2, and the interaction rate constant was calculated by Equation 2.
Through the concentration and k value in Table 3, the functional relationship could be obtained, and it was found that the interaction rate constant was 0.64 square of concentration in the form of a power function shown Figure 5.
To know the tendency of the results obtained from the actual experiment with the fitted value, the fraction and concentration were compared. The square point is the fraction obtained by fitting in Table 3, and the circle point is the fraction obtained by adding the difference in charge, which is the experimental data, to the functional relationship in Figure 5. From Figure 6, the actual result value has a similar tendency to the fitted value. The experimental data in this study were found to have values in the range of about 14.5%.
Accurate and rapid measurement of cTnI concentration is essential for the diagnosis of AMI and rapid treatment determination. The clinical concentration, which is the criterion for AMI diagnosis, that is, the upper reference limit (URL) of the 99th percentile of the high-sensitivity cTnI (hs-cTnI) assay is reported as 18 ng/L (18 pg/mL) for Korean health reference group [22].
However, it takes about 10 minutes to detect this clinically important concentration (18 ng/L) in this study system. This is more than 8 minutes, which is the time it takes to arrive in the emergency room in case of patient [23]. The 10-minute detection time risks missing the golden time.
Therefore, a technical improvement is required to shorten the detection time of the current 10 minutes in an emergency so that results can be derived within 8 minutes.
4. Conclusions
This study precisely analyzed the kinetics of aptamer-cTnI interaction by electrochemical method (Cyclic Voltammetry, CV) to detect cardiac troponin I (cTnI), a key biomarker for the diagnosis of cardiovascular disease, with high sensitivity and speed. The interaction of double-stranded aptamer immobilized on the surface of gold electrode and cTnI by concentration was observed through CV, and interaction kinetics analysis was performed based on the change in charge amount obtained therefrom.
As a result of the experiment, it was confirmed that the interaction between the aptamer and cTnI at the concentration of 10 pg/mL was saturated after about 2 hours. In addition, as the cTnI concentration increased from 10 pg/mL to 90 pg/mL, it was confirmed that the current peak and charge amount change due to the aptamer-cTnI binding on the electrode surface clearly increased, and the concentration-dependent detection possibility was proved.
The most important result is a quantitative demonstration that the adsorption process follows well the pseudo first-order interaction (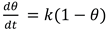 ) model. By applying this model, we successfully derived the interaction rate constant (k) for each concentration and finally established the power function relationship between the cTnI concentration and the interaction rate constant.
) model. By applying this model, we successfully derived the interaction rate constant (k) for each concentration and finally established the power function relationship between the cTnI concentration and the interaction rate constant.This functional relationship has a very high R2 value of 0.9515, quantitatively proving that the cTnI concentration and the interaction rate constant have a close relationship. A similar trend was shown when the derived fitting data were compared with actual experimental data (fraction), which supports the predictive power of established kinetic models.
In conclusion, this study presented a scientific basis for using the interaction rate of aptamer-cTnI binding as a new quantitative indicator, away from the existing diagnostic method that simply depends on the final interaction amount (saturated charge amount). This is expected to be a key foundation technology for the development of a high-sensitivity biosensor that dramatically shortens the diagnosis time by providing accurate concentration information within a short interaction time, especially when applied to a point-of-care testing (POCT) environment where rapid diagnosis is essential.
Author Contributions
Conceptualization, J.-W.P.; methodology, S.J.J. and J.-W.P.; validation, J.-W.P.; writing, S.J.J.; review and editing, J.-W.P.; supervision, J.-W.P. All authors have read and agreed to the published version of the manuscript.
Funding
This research received no external funding.
Institutional Review Board Statement
Not applicable.
Informed Consent Statement
Not applicable.
Data Availability Statement
Data are contained within the article.
Acknowledgments
This study was supported by the Research Program funded by Seoul National University of Science and Technology.
Conflicts of Interest
The authors declare no conflicts of interest.
Abbreviations
The following abbreviations are used in this manuscript:
| cTnI | Cardiac Troponin I |
| CV | Cyclic Voltammetry |
| POCT | Point-of-Care Testing |
References
- Filatov, V.L.; Katrukha, A.G.; Bulargina, T.V.; Gusev, N.B. Troponin: structure, properties, and mechanism of functioning. Biochemistry (Mosc) 1999, 64, 969–985. [Google Scholar]
- Katrukha, I.A. Human cardiac troponin complex. Structure and functions. Biochemistry (Mosc) 2013, 78, 1447–1465. [Google Scholar] [CrossRef]
- Chaulin, A.M. Biology of Cardiac Troponins: Emphasis on Metabolism. Biology (Basel) 2022, 11. [Google Scholar] [CrossRef]
- Ma, H.; Cassedy, A.; O'Kennedy, R. The role of antibody-based troponin detection in cardiovascular disease: A critical assessment. Journal of Immunological Methods 2021, 497. [Google Scholar] [CrossRef]
- Homola, J. Surface plasmon resonance sensors for detection of chemical and biological species. Chem Rev 2008, 108, 462–493. [Google Scholar] [CrossRef] [PubMed]
- Radha, R.; Shahzadi, S.K.; Al-Sayah, M.H. Fluorescent Immunoassays for Detection and Quantification of Cardiac Troponin I: A Short Review. Molecules 2021, 26. [Google Scholar] [CrossRef] [PubMed]
- Song, S.P.; Wang, L.H.; Li, J.; Zhao, J.L.; Fan, C.H. Aptamer-based biosensors. Trac-Trend Anal Chem 2008, 27, 108–117. [Google Scholar] [CrossRef]
- Palchetti, I.; Mascini, M. Electrochemical nanomaterial-based nucleic acid aptasensors. Anal Bioanal Chem 2012, 402, 3103–3114. [Google Scholar] [CrossRef] [PubMed]
- Jo, H.; Gu, H.; Jeon, W.; Youn, H.; Her, J.; Kim, S.K.; Lee, J.; Shin, J.H.; Ban, C. Electrochemical aptasensor of cardiac troponin I for the early diagnosis of acute myocardial infarction. Anal Chem 2015, 87, 9869–9875. [Google Scholar] [CrossRef]
- Ma, J.; Feng, L.; Li, J.; Zhu, D.; Wang, L.; Su, S. Biological Recognition-Based Electrochemical Aptasensor for Point-of-Care Detection of cTnI. Biosensors (Basel) 2023, 13. [Google Scholar] [CrossRef]
- Li, J.; Zhang, S.; Zhang, L.; Zhang, Y.; Zhang, H.; Zhang, C.; Xuan, X.; Wang, M.; Zhang, J.; Yuan, Y. A Novel Graphene-Based Nanomaterial Modified Electrochemical Sensor for the Detection of Cardiac Troponin I. Front Chem 2021, 9, 680593. [Google Scholar] [CrossRef]
- Zhang, J.F.; Sun, K.; Ren, J.T.; Wang, H.; Cheng, J. An electrochemical metallic nanowire aptasensor for rapid and ultrasensitive detection of cardiac troponin I. Sensor Actuat B-Chem 2024, 401. [Google Scholar] [CrossRef]
- Grieshaber, D.; MacKenzie, R.; Vörös, J.; Reimhult, E. Electrochemical biosensors -: Sensor principles and architectures. Sensors-Basel 2008, 8, 1400–1458. [Google Scholar] [CrossRef] [PubMed]
- Elgrishi, N.; Rountree, K.J.; McCarthy, B.D.; Rountree, E.S.; Eisenhart, T.T.; Dempsey, J.L. A Practical Beginner's Guide to Cyclic Voltammetry. J Chem Educ 2018, 95, 197–206. [Google Scholar] [CrossRef]
- Semenova, D.; Zubov, A.; Silina, Y.E.; Micheli, L.; Koch, M.; Fernandes, A.C.; Gernaey, K.V. Mechanistic modeling of cyclic voltammetry: A helpful tool for understanding biosensor principles and supporting design optimization. Sensor Actuat B-Chem 2018, 259, 945–955. [Google Scholar] [CrossRef]
- Ropii, B.; Bethasari, M.; Anshori, I.; Koesoema, A.P.; Shalannanda, W.; Satriawan, A.; Setianingsih, C.; Akbar, M.R.; Aditama, R.; Fahmi, F.; et al. The molecular interaction of six single-stranded DNA aptamers to cardiac troponin I revealed by docking and molecular dynamics simulation. PLoS One 2024, 19, e0302475. [Google Scholar] [CrossRef]
- Chen, K.; Zhao, H.; Wang, Z.; Zhou, F.; Shi, Z.; Cao, S.; Lan, M. Sandwich-type electrochemical aptasensor based on Au-modified conductive octahedral carbon architecture and snowflake-like PtCuNi for the sensitive detection of cardiac troponin I. Biosens Bioelectron 2022, 212, 114431. [Google Scholar] [CrossRef]
- Chen, K.; Zhao, H.; Wang, Z.; Zhou, F.; Lan, M. Sandwich-type electrochemical aptasensor based on polydopamine-Au-metal ions as signal label and coralloid Au-conductive carbon architecture-modified electrode for the simultaneous detection of cardiac troponin I and myoglobin. Sensors and Actuators B: Chemical 2023, 390. [Google Scholar] [CrossRef]
- Jalalian, S.H.; Ramezani, M.; Danesh, N.M.; Alibolandi, M.; Abnous, K.; Taghdisi, S.M. A novel electrochemical aptasensor for detection of aflatoxin M1 based on target-induced immobilization of gold nanoparticles on the surface of electrode. Biosensors & Bioelectronics 2018, 117, 487–492. [Google Scholar] [CrossRef]
- Pali, M.; Suni, I.I. Impedance Detection of 3-Phenoxybenzoic Acid Comparing Wholes Antibodies and Antibody Fragments for Biomolecular Recognition. Electroanal 2018, 30, 2899–2907. [Google Scholar] [CrossRef]
- Liu, Z.B.; Zhou, B.; Wang, H.Q.; Lu, F.; Liu, T.J.; Song, C.X.; Leng, X.G. Highly sensitive detection of human IgG using a novel bio-barcode assay combined with DNA chip technology. J Nanopart Res 2013, 15. [Google Scholar] [CrossRef]
- Ji, M.; Moon, H.W.; Hur, M.; Yun, Y.M. Determination of high-sensitivity cardiac troponin I 99th percentile upper reference limits in a healthy Korean population. Clin Biochem 2016, 49, 756–761. [Google Scholar] [CrossRef] [PubMed]
- Goldberg, A.; McGrath, S.; Marber, M. How Close Are We to Patient-Side Troponin Testing? J Clin Med 2024, 13. [Google Scholar] [CrossRef] [PubMed]
Figure 1.
Schematic diagram of aptamer and MCH interaction on the electrode surface.
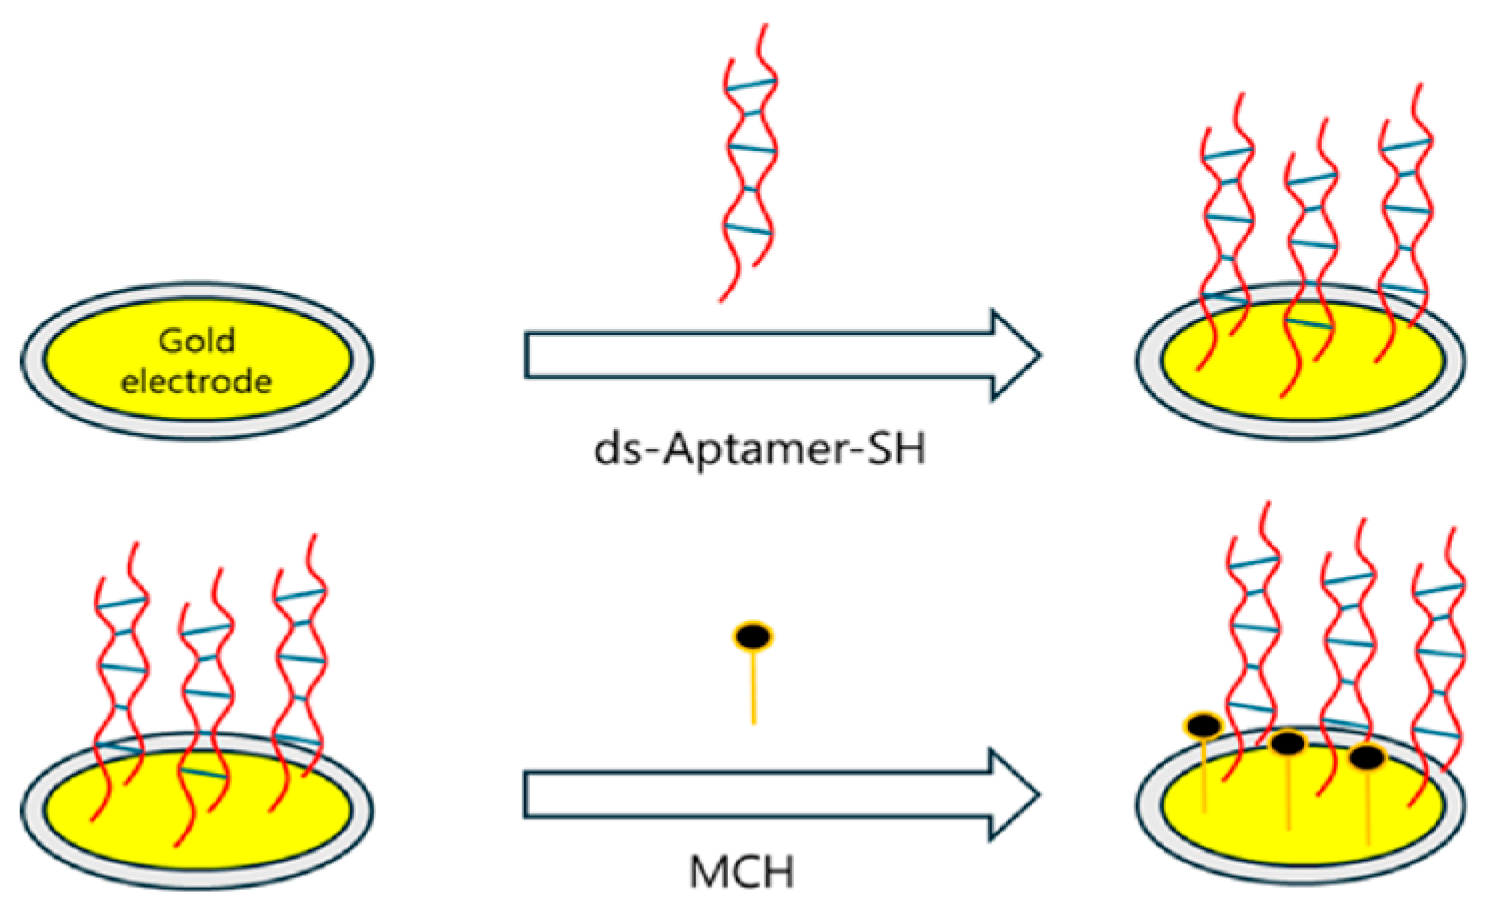
Figure 2.
CV results of interaction between aptamer and cTnI: (a) Time-dependent change at cTnI 10 pg/mL; (b) 20-minute interaction by cTnI concentration.
Figure 2.
CV results of interaction between aptamer and cTnI: (a) Time-dependent change at cTnI 10 pg/mL; (b) 20-minute interaction by cTnI concentration.
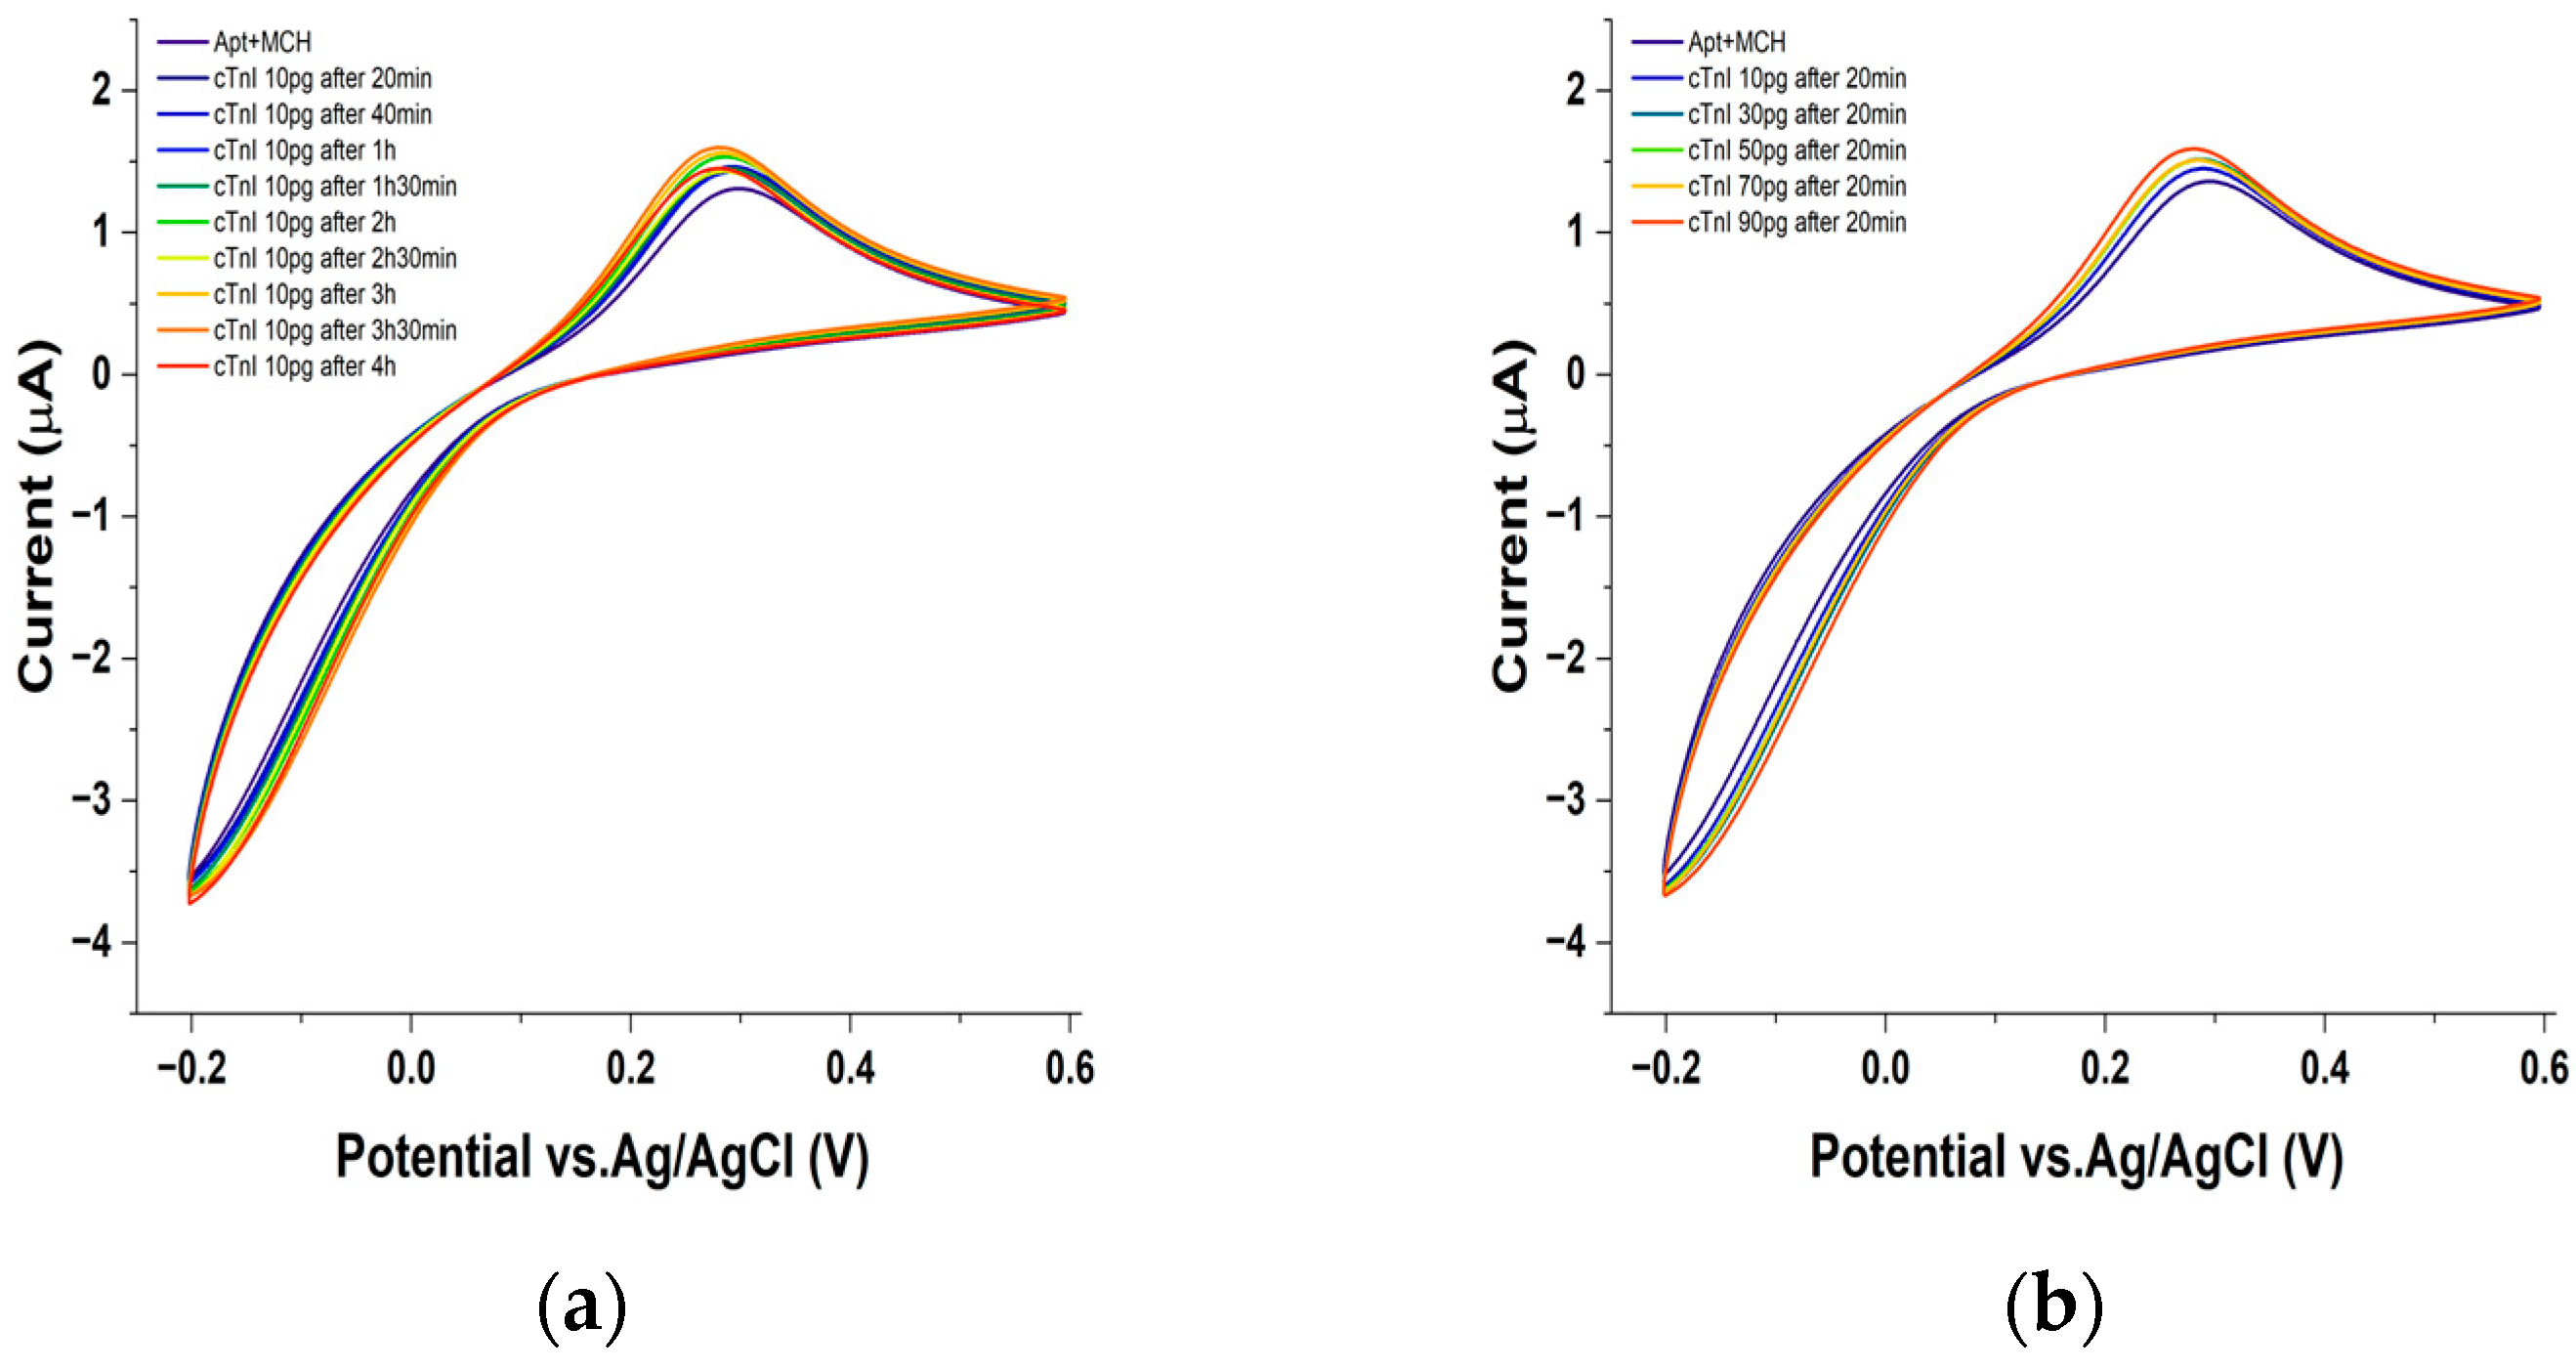
Figure 3.
Time and fraction relationship.
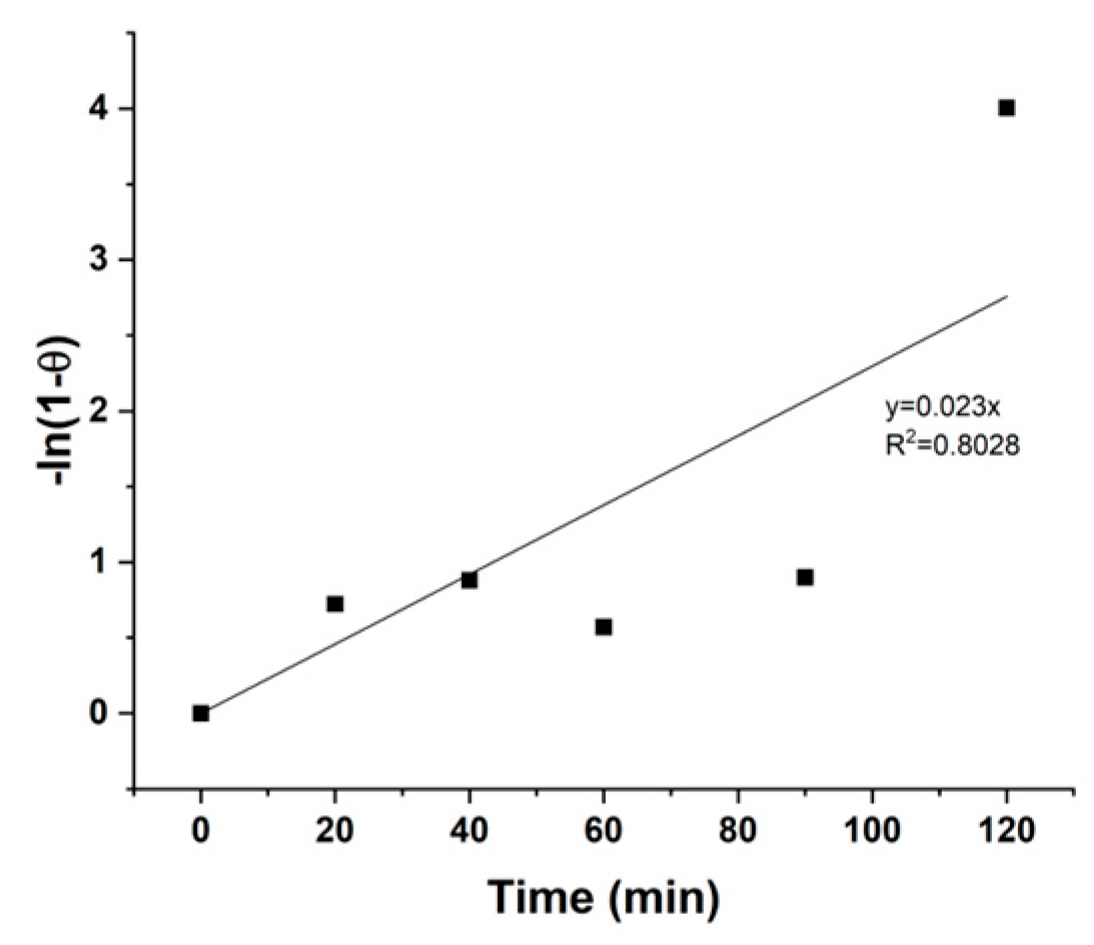
Figure 5.
Relationship between concentration and interaction rate constant.
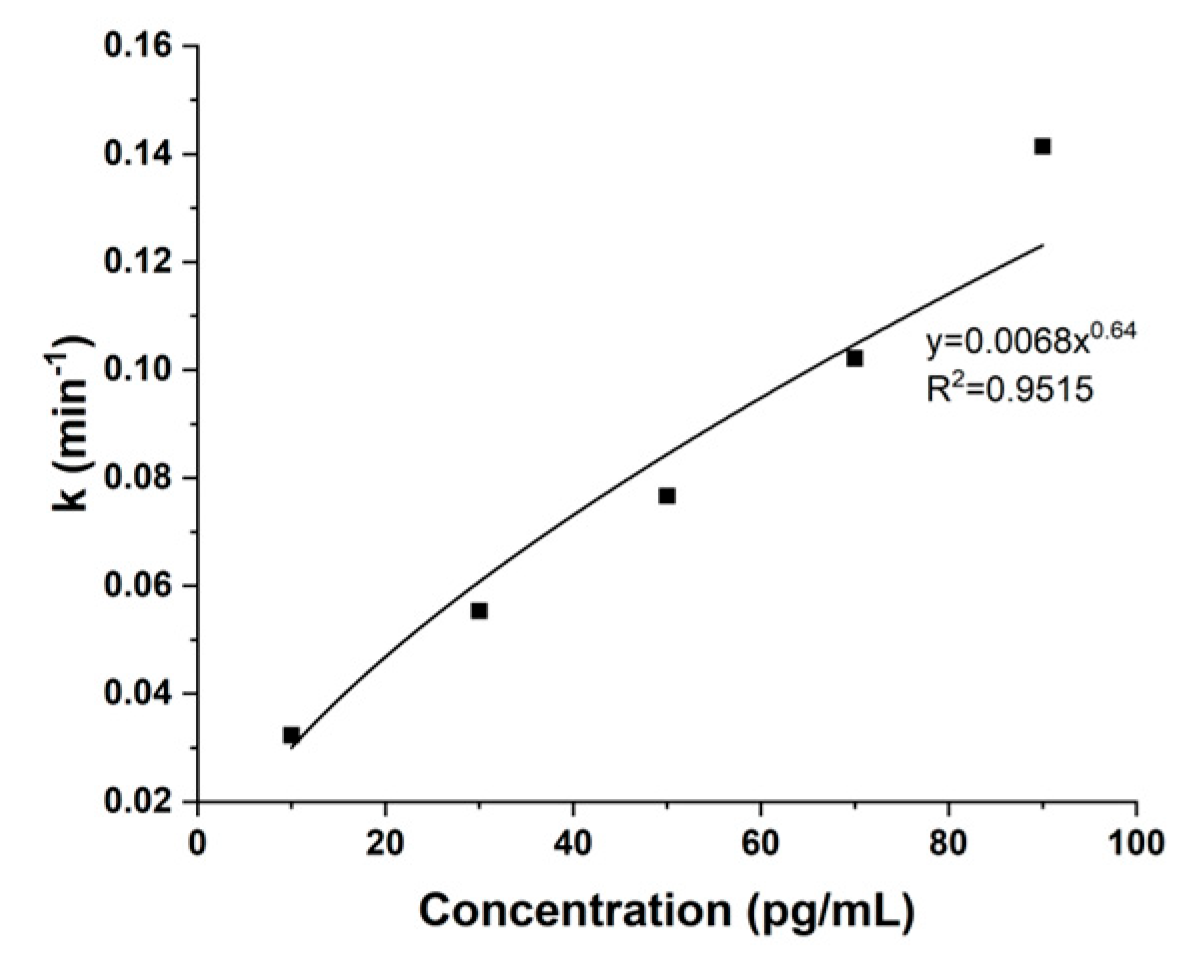
Figure 6.
Comparison of trends between fitting data and actual data.
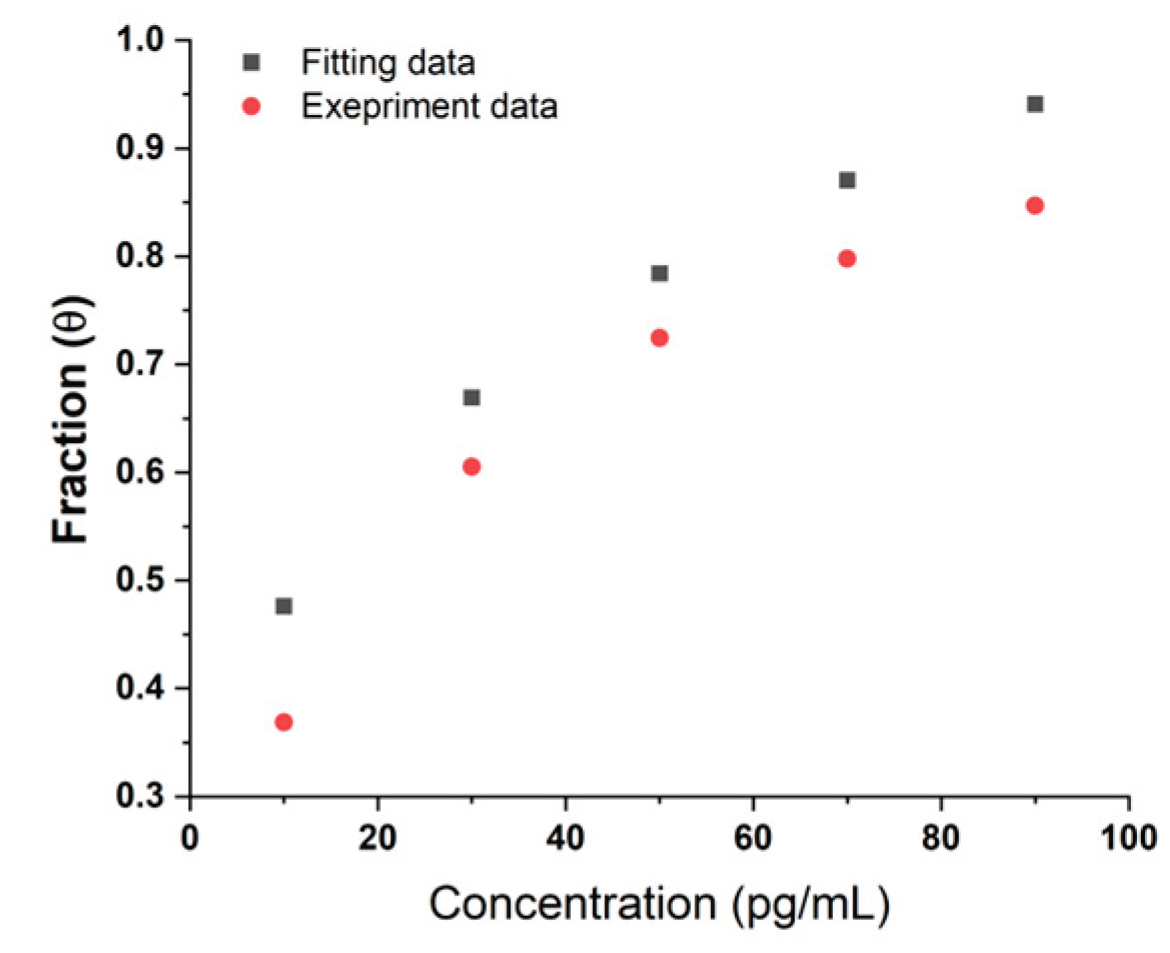

Table 1.
The relationship between charge and fraction.
| Time (min) | Charge (μA) | Charge change (μA) | Fraction (θ) | - ln(1-θ) |
| 0 | 25.64 | 0 | 0 | 0 |
| 20 | 27.40 | 1.76 | 0.51 | 0.72 |
| 40 | 27.65 | 2.01 | 0.58 | 0.88 |
| 60 | 27.13 | 1.49 | 0.43 | 0.57 |
| 90 | 27.67 | 2.03 | 0.59 | 0.90 |
| 120 | 29.01 | 3.37 | 0.98 | 4.00 |
Table 2.
Fitting of fraction and charge
| Time (min) | Fraction from fitting | Charge from fitting (μA) |
| 0 | 0 | 0 |
| 20 | 0.37 | 1.26 |
| 40 | 0.60 | 2.06 |
| 60 | 0.75 | 2.57 |
| 90 | 0.87 | 2.99 |
| 120 | 0.94 | 3.21 |
Table 3.
Concentration and interaction rate constant derivation.
| Concentration (pg/mL) | Charge change (μA) | Fraction (θ) | - ln(1-θ) | k (min-1) |
| 10 | 1.63 | 0.48 | 0.65 | 0.03 |
| 30 | 2.29 | 0.67 | 1.11 | 0.06 |
| 50 | 2.69 | 0.78 | 1.53 | 0.08 |
| 70 | 2.99 | 0.87 | 2.04 | 0.10 |
| 90 | 3.23 | 0.94 | 2.83 | 0.14 |
Disclaimer/Publisher’s Note: The statements, opinions and data contained in all publications are solely those of the individual author(s) and contributor(s) and not of MDPI and/or the editor(s). MDPI and/or the editor(s) disclaim responsibility for any injury to people or property resulting from any ideas, methods, instructions or products referred to in the content. |
© 2025 by the authors. Licensee MDPI, Basel, Switzerland. This article is an open access article distributed under the terms and conditions of the Creative Commons Attribution (CC BY) license (http://creativecommons.org/licenses/by/4.0/).
Copyright: This open access article is published under a Creative Commons CC BY 4.0 license, which permit the free download, distribution, and reuse, provided that the author and preprint are cited in any reuse.


