Submitted:
30 December 2025
Posted:
31 December 2025
You are already at the latest version
Abstract
This paper addresses the challenges in traditional enterprise performance analysis, including complex multi-source data structures, ambiguous indicator correlations, and poor decision interpretability. It proposes an enterprise performance optimization decision model that integrates knowledge graphs with causal inference. The model constructs a multi-entity and multi-relation knowledge graph to semantically integrate heterogeneous information from financial, market, and operational dimensions, enabling high-level representation of structured relationships among enterprise features. It further incorporates causal structure learning and inference mechanisms to identify key performance drivers and estimate intervention effects, revealing the true causal pathways among variables. In the optimization layer, the model combines knowledge representation with causal relationships to establish an interpretable decision objective function, ensuring that predictions possess both numerical accuracy and causal consistency with logical traceability. Experiments conducted on public enterprise datasets demonstrate that the proposed method outperforms mainstream deep learning and sequence modeling approaches in terms of error control and generalization performance, showing higher robustness and stability. Sensitivity analysis further confirms that the model maintains strong adaptability and consistent performance under different embedding dimensions, noise levels, and optimization strategies. This study provides a novel methodological framework and theoretical foundation for building interpretable and intervention-oriented intelligent decision systems, offering significant implications for data-driven performance evaluation and decision optimization.
Keywords:
knowledge graphs
; causal reasoning
; enterprise performance optimization
; intelligent decision-making
1. Introduction
The global economic environment is undergoing a profound digital transformation [1]. Corporate growth models and performance management methods are shifting from experience-driven to data-driven, intelligent decision-making. Enterprise performance not only reflects operational outcomes but also serves as a key indicator of resource allocation efficiency, strategic execution capability, and market competitiveness. However, as external uncertainty intensifies and internal structures become more complex, traditional performance analysis methods based on experience or single financial indicators can no longer address the multidimensional and temporal characteristics of modern data [2]. Data-driven management thinking provides a new solution to this challenge, yet extracting interpretable decision information and uncovering latent structural relationships from massive data remain core difficulties in intelligent decision-making research.
Against this background, the integration of knowledge graphs and causal inference offers a new theoretical and methodological foundation for enterprise performance optimization. Knowledge graphs integrate internal and external heterogeneous data-such as financial reports, supply chain relationships, industrial policies, public opinion, and market behavior-into a structured and semantic knowledge network. Through graph-based modeling, the competitive landscape, cooperation networks, and upstream-downstream dependencies among enterprises become explicit, providing semantic support for reasoning and decision-making [3]. Meanwhile, causal inference focuses on the directionality and intervention among variables, revealing not only statistical correlations but also the underlying “why” and “what-if” relationships. Combining these two approaches enables the construction of interpretable performance optimization mechanisms at the knowledge level, achieving a shift from correlation analysis to causal insight [4].
The formation of enterprise performance is influenced by multiple interacting factors, including the macroeconomic environment, industry cycles, managerial decisions, technological innovation, and human resource allocation. These factors exhibit complex nonlinear coupling and potential dependencies. Traditional statistical or machine learning models can capture correlations but fail to reveal the underlying causal chains. For example, sales growth and marketing expenditure often form a bidirectional feedback loop, while supply chain fluctuations may affect profitability through multiple pathways [5]. The semantic modeling ability of knowledge graphs allows these relationships to be represented in a visual and computational form, while causal inference identifies key driving factors and intervention paths. This enables enterprises to move from merely observing problems to understanding mechanisms and formulating actionable strategies [6].
In addition, the growth of enterprise data is reflected not only in volume but also in diversity and dynamics. Internal operational indicators, external policies, competitor behaviors, and social media signals together form a high-dimensional spatiotemporal network. Knowledge graphs create a unified semantic layer to support the integration and reasoning of such heterogeneous data, while causal inference performs intervention simulation and impact evaluation on this semantic layer [7]. This helps decision-makers assess the potential consequences of different strategies and achieve data-driven performance optimization. The fusion framework enhances model interpretability and robustness, allowing enterprises to maintain stronger adaptability and foresight in complex environments.
Overall, an enterprise performance optimization decision model that integrates knowledge graphs and causal inference represents a significant direction for the evolution of intelligent decision systems. By structuring knowledge, rationalizing reasoning, and enabling intelligent decision-making, this approach overcomes the limitations of traditional models in interpretability and generalization. It marks a transition from experience-driven to cognition-driven decision-making. The study has practical significance for improving operational efficiency and strategic responsiveness at the firm level and offers a scientific foundation for industrial policy formulation, regional economic forecasting, and sustainable development at the macro level. Therefore, it enriches the theoretical framework of enterprise performance optimization and provides solid methodological guidance for building next-generation data-driven intelligent decision systems.
2. Proposed Framework
2.1. Knowledge Graph Construction and Semantic Modeling
Within the overall framework of enterprise performance optimization, the first step is to perform unified knowledge modeling on multi-source heterogeneous data. Let the set of enterprises be , the set of attributes is , and the set of relations is . Through knowledge extraction and alignment processes, a set of triples can be constructed, forming an enterprise knowledge graph. To achieve semantic embedding, nodes and relations are mapped to a low-dimensional continuous space, and a knowledge representation function is defined:
Where represents the vector representations of the head entity, relation, and tail entity, respectively. Based on this embedding, the objective function can be minimized:
To achieve preservation of knowledge graph structure and semantic consistency, where is a negative sample and is the margin hyperparameter. Its overall model architecture is shown in Figure 1.
2.2. Causal Structure Learning and Relation Recognition
Above the knowledge layer, the driving forces behind corporate performance can be identified using a causal structure learning model. Let be the set of random variables, where each variable represents a key corporate indicator (such as revenue, debt ratio, investment scale, etc.). Their causal dependencies can be represented as a directed acyclic graph . Through a constraint-based causal discovery algorithm, the directionality of edges can be determined using conditional independence tests. For any triple , if:
We then assume that and are independent given , and there are no direct causal edges between them. Furthermore, this is achieved by minimizing the structural risk function:
Learn the causal structure matrix , where is the sample covariance matrix, is the model latent covariance matrix, and is the acyclic constraint term.
2.3. Causal Reasoning and Performance Effect Estimation
Once the cause-and-effect diagram structure is established, performance intervention analysis can be conducted. Let the enterprise performance indicator be , the intervention variable be , and the control variable is . According to causal reasoning theory, the intervention effect can be expressed as the expected difference:
To estimate this effect, weighted regression modeling is used. The causal effect function is defined as follows:
By performing nonlinear modeling on A (such as neural networks or kernel regression), changes in performance before and after intervention can be estimated.
2.4. Decision Optimization and Knowledge Causal Fusion Mechanism
In the fusion layer, the semantic relationships in the knowledge graph and the performance-driven relationships obtained from causal reasoning are unified into the optimization decision-making model. Let the enterprise’s decision vector be A, and the objective be to maximize the comprehensive performance function B, which consists of knowledge reasoning terms and causal effect terms.
Where represents the latent semantic constraints inherent in the knowledge graph, represents the predictive effect of the intervention on performance, and is the weight coefficient. A gradient optimization strategy is employed.
It can obtain the optimal decision-making solution and achieve synergistic optimization of knowledge-driven and causal reasoning. This mechanism can not only understand the performance formation mechanism from a global perspective, but also provide enterprises with explanatory strategic guidance, thereby realizing a closed-loop linkage of data, knowledge, and decision-making.
3. Experimental Analysis
3.1. Dataset
The dataset used in this study is the Corporate Financial Risk Assessment Dataset. It was obtained from an open financial data platform and covers corporate financial and operational indicators from multiple industries. The dataset includes annual financial data and performance labels for approximately 5,000 enterprises, spanning the years 2013 to 2022. The main variables include total assets, debt ratio, current ratio, operating income growth rate, net profit margin, cash flow status, proportion of R&D investment, and market valuation. It also contains information on each enterprise’s industry, region, and credit rating. This dataset provides a solid foundation for building multidimensional models of enterprise performance evaluation and growth potential analysis.
During data preprocessing, the original data were cleaned and standardized. Samples with a high proportion of missing values or extreme anomalies were removed. All continuous variables were normalized using the Z-score method to eliminate differences in measurement units, while categorical variables were converted into numerical form through one-hot encoding. To ensure model comparability across enterprises of different sizes and industries, industry median correction and scale adjustment mechanisms were applied. This balanced the differences in financial structure and maintained statistical consistency in cross-industry prediction tasks.
In addition, since enterprise performance exhibits strong temporal dependency, the dataset was organized into time-series slices based on fiscal years. This allows the model to capture enterprise development trends and dynamic changes over time. Finally, the dataset was divided into training, validation, and test sets with a ratio of 70%, 15%, and 15%. This structured dataset contains comprehensive financial and non-financial features, with strong temporal relevance and wide industry coverage. It provides high-quality support for the subsequent construction of the knowledge graph and causal inference modeling.
3.2. Experimental Results
This paper first conducts a comparative experiment, and the experimental results are shown in Table 1.
From the comparative results presented in Table 1, it is evident that the proposed model achieves the best overall performance across all evaluation metrics. Traditional sequence models such as LSTM and BiLSTM exhibit relatively high error levels due to their limited ability to capture long-term dependencies and complex multi-dimensional relationships within enterprise data. While these models can model sequential correlations, they fail to effectively extract the structural and semantic dependencies underlying multi-source financial indicators. Consequently, their predictions are more sensitive to noise and temporal fluctuations, resulting in higher MSE and MAE values compared with transformer-based methods.
The transformer-family models, including Informer, FedFormer, and BERT, demonstrate notable improvements owing to their attention mechanisms and global context modeling capabilities. These architectures effectively capture cross-temporal dependencies and heterogeneous financial signals, leading to lower prediction errors. However, despite their strength in learning abstract representations, these models remain limited in causal interpretability and lack an explicit mechanism to reason over the latent inter-relationships among corporate indicators. This limitation constrains their capacity to distinguish between correlation and true causal influence, which is critical in performance optimization scenarios that involve dynamic enterprise decision-making processes.
By contrast, the proposed method integrates knowledge graph representation with causal reasoning, enabling the model to understand not only the associations but also the causal pathways influencing enterprise performance. The incorporation of structured semantic knowledge enhances interpretability, while the causal inference layer allows the model to simulate intervention effects and identify key performance drivers. As a result, the proposed model achieves the lowest MSE (0.5827), MAE (0.4678), and RMSE (0.7632), representing a substantial improvement over both transformer-based and language-model baselines. These findings confirm that the joint modeling of knowledge and causality provides a more robust, explainable, and data-driven approach to enterprise performance optimization.
This paper also presents a sensitivity analysis of the MSE index for different embedding dimensions, and the experimental results are shown in Figure 2.
As shown in Figure 2, the MSE index exhibits a clear downward trend as the embedding dimension increases, indicating that larger representation spaces enable the model to capture richer and more discriminative semantic features. When the embedding dimension is small (e.g., Dim-32 and Dim-64), the model’s expressive capacity is constrained, leading to higher reconstruction errors. As the dimension expands to 128 and beyond, the performance stabilizes and the MSE value decreases significantly, reflecting that the model achieves a balance between feature compactness and representation sufficiency.
However, the improvement becomes marginal once the embedding dimension exceeds 256, implying that excessively large latent spaces contribute limited additional information and may introduce redundancy or overfitting risk. The lowest MSE observed at Dim-512 demonstrates that the proposed framework benefits from a moderately high-dimensional embedding, where the integration of knowledge-graph semantics and causal dependencies reaches optimal synergy. This result confirms that embedding dimensionality plays a crucial role in model generalization and performance optimization within the enterprise performance prediction framework.
This paper further presents an assessment of the sensitivity of noise injection intensity to MAPE, and the experimental results are shown in Figure 3.
From the figure, it can be observed that as the intensity of noise injection gradually increases, the model performance shows a clear degradation trend. This indicates that perturbations in the input features have a direct impact on the overall stability of the prediction. When the noise level is low, the model can effectively capture and represent key features, and the output remains stable. However, as the noise becomes stronger, the extraction of structured information and the identification of causal relationships are disturbed, leading to a certain degree of fluctuation and instability.
This phenomenon shows that although the proposed framework has some resistance to disturbances within a limited range, it still depends on the purity of the input signals. When the noise level is too high, the collaborative mechanism between knowledge representation and causal inference is disrupted, causing a shift in the decision space. The overall trend confirms the importance of data quality control and feature robustness modeling in enterprise performance optimization. It also demonstrates that the model’s behavior under noisy conditions reflects its essential characteristics of generalization and stability.
This paper also presents the impact of different optimizers on the experimental results of MAE, and the experimental results are shown in Figure 4.
From the figure, it can be observed that different optimizers exhibit clear performance differences during model training. This indicates that the optimization algorithm plays a crucial regulatory role in the framework that integrates knowledge graphs and causal inference. Overall, optimizers with adaptive learning rate mechanisms perform better in terms of stable convergence and error control. Among them, Adam achieves a good balance between update direction and learning step adjustment, enabling the model to optimize quickly and stably in a multidimensional feature space and obtain lower error values. In contrast, optimizers based on traditional gradient descent are more likely to fall into local minima when modeling complex nonlinear features, resulting in slightly inferior overall performance.
These results highlight the importance of optimizer selection in learning multi-layer semantic features and causal dependencies within the integrated model. In this research framework, the knowledge graph component requires capturing semantic associations among multiple entities, while causal structure learning relies on the stability of gradient propagation. If the optimizer cannot maintain a proper adaptive learning rate between global and local features, the model may experience feature drift or unstable convergence, leading to a decline in overall performance. Therefore, optimizers with dynamic learning rate adjustment and gradient normalization capabilities are better suited to handle the model’s complex feature distributions.
Furthermore, the results show that the model’s sensitivity to the optimizer is closely related to the characteristics of the task. In the process of integrating knowledge and causal reasoning, the parameter space exhibits a high degree of nonlinear coupling. Choosing an appropriate optimization strategy affects not only the error convergence speed but also the efficiency of information coordination across different feature layers. The best-performing optimizer can ensure stable convergence while enhancing the model’s ability to capture potential structural patterns, providing more reliable support for enterprise performance prediction and optimization.
4. Conclusions
This study focuses on data-driven enterprise performance optimization and proposes an intelligent decision-making framework that integrates knowledge graphs with causal inference. The method overcomes the limitations of traditional enterprise performance prediction models that rely on single statistical features or shallow machine learning approaches. By introducing semantic structural modeling and causal relationship identification mechanisms, it systematically captures the intrinsic connections among multidimensional enterprise features. Experimental results verify the robustness and high interpretability of the framework in complex economic environments. They demonstrate that integrating structured knowledge with causal reasoning effectively enhances the model’s accuracy and generalization in performance evaluation, risk control, and strategic decision-making. This research provides new insights for intelligent enterprise management and establishes a methodological foundation for applying multi-source heterogeneous data in decision science.
The theoretical significance of this study lies in the organic integration of knowledge representation learning and causal modeling. The model not only “sees” the surface correlations among data but also “understands” the underlying logical drivers. By incorporating knowledge graphs, enterprise financial, market, and behavioral data are represented within a unified semantic space, enhancing the model’s interpretability and transferability. The introduction of causal inference enables the system to simulate potential changes in enterprise performance under different intervention conditions, providing a scientific basis for strategic optimization. Compared with traditional black-box prediction models, this framework emphasizes structured knowledge representation and verifiable causal logic, offering scalable technical support for transparent and intelligent enterprise decision-making.
At the application level, the proposed model has broad potential in fields such as financial technology, enterprise management, supply chain optimization, and macroeconomic monitoring. Through semantic association and causal impact analysis of enterprise data, the system can identify key performance drivers and support multi-dimensional applications, including credit evaluation, investment decision-making, and risk warning. In complex scenarios such as policy regulation, industry forecasting, and strategic planning, this framework provides a general paradigm for building interpretable intelligent decision systems. Its characteristics of multi-source integration and dynamic reasoning enable the model to maintain high stability and decision value even under uncertainty and data heterogeneity.
Future research will further enhance the model’s adaptability and scalability in dynamic environments. On one hand, integrating temporal evolution mechanisms with reinforcement learning strategies can enable real-time updates of the knowledge graph and optimization of causal structures to adapt to rapid changes in market conditions and enterprise behavior. On the other hand, incorporating multimodal data such as text, images, and social network information can enrich semantic representations and strengthen the model’s analytical power in complex economic systems. The ultimate goal is to build an intelligent decision-making system with knowledge understanding, causal reasoning, and policy generation capabilities. Such a system can provide enterprises and policymakers with more accurate, reliable, and interpretable analytical tools, advancing the deep application and sustainable development of artificial intelligence in economic decision-making.
References
- Wei, Y.; Wang, X.; Nie, L.; Li, S.; Wang, D.; Chua, T.-S. Causal Inference for Knowledge Graph Based Recommendation. IEEE Trans. Knowl. Data Eng. 2022, 35, 11153–11164. [Google Scholar] [CrossRef]
- Gopalakrishnan, S.; Chen, V.Z.; Dou, W.; Hahn-Powell, G.; Nedunuri, S.; Zadrozny, W. Text to Causal Knowledge Graph: A Framework to Synthesize Knowledge from Unstructured Business Texts into Causal Graphs. Information 2023, 14, 367. [Google Scholar] [CrossRef]
- Langen, H.; Huber, M. How causal machine learning can leverage marketing strategies: Assessing and improving the performance of a coupon campaign. PLOS ONE 2023, 18, e0278937. [Google Scholar] [CrossRef] [PubMed]
- Zhang, Y; Zhang, W. CausE: towards causal knowledge graph embedding[C]//China Conference on Knowledge Graph and Semantic Computing; Springer Nature Singapore: Singapore, 2023; pp. 17–28. [Google Scholar]
- Jawad, M.; Dhawale, C.; Bin Ramli, A.A.; Mahdin, H. Adoption of knowledge-graph best development practices for scalable and optimized manufacturing processes. MethodsX 2023, 10, 102124. [Google Scholar] [CrossRef] [PubMed]
- Kosasih, E.E.; Margaroli, F.; Gelli, S.; Aziz, A.; Wildgoose, N.; Brintrup, A. Towards knowledge graph reasoning for supply chain risk management using graph neural networks. Int. J. Prod. Res. 2022, 62, 5596–5612. [Google Scholar] [CrossRef]
- Dehal, R.S.; Sharma, M.; Rajabi, E. Knowledge Graphs and Their Reciprocal Relationship with Large Language Models. Mach. Learn. Knowl. Extr. 2025, 7, 38. [Google Scholar] [CrossRef]
- Xu, Z. Factors Influencing the Predictive Performance of the LSTM Model on Stock Prices and Its Application in Forecasting US Technology Sector Stock Prices—Sample Time Span, Time Window Length, Feature Selection, and Prediction Days. In Proceedings of the International Conference on Image Processing, Machine Learning and Pattern Recognition, 2024; pp. 370–375. [Google Scholar]
- Fan, Y.; Tang, Q.; Guo, Y.; Wei, Y. BiLSTM-MLAM: A Multi-Scale Time Series Prediction Model for Sensor Data Based on Bi-LSTM and Local Attention Mechanisms. Sensors 2024, 24, 3962. [Google Scholar] [CrossRef]
- Zhou, H; Zhang, S; Peng, J; et al. Informer: Beyond efficient transformer for long sequence time-series forecasting. Proceedings of the AAAI conference on artificial intelligence 2021, 35(12), 11106–11115. [Google Scholar] [CrossRef]
- Zhou, T; Ma, Z; Wen, Q; et al. Fedformer: Frequency enhanced decomposed transformer for long-term series forecasting. International conference on machine learning PMLR, 2022; pp. 27268–27286. [Google Scholar]
- Su, L.; Zuo, X.; Li, R.; Wang, X.; Zhao, H.; Huang, B. A systematic review for transformer-based long-term series forecasting. Artif. Intell. Rev. 2025, 58, 1–29. [Google Scholar] [CrossRef]
- Chen, G W; Hsu, I C. Integrating Taiwan financial BERT sentiment analysis with CNN-BiLSTM-SA model for stock prediction. Discover Computing 2025, 28(1), 248. [Google Scholar] [CrossRef]
Figure 1.
Overall model architecture.
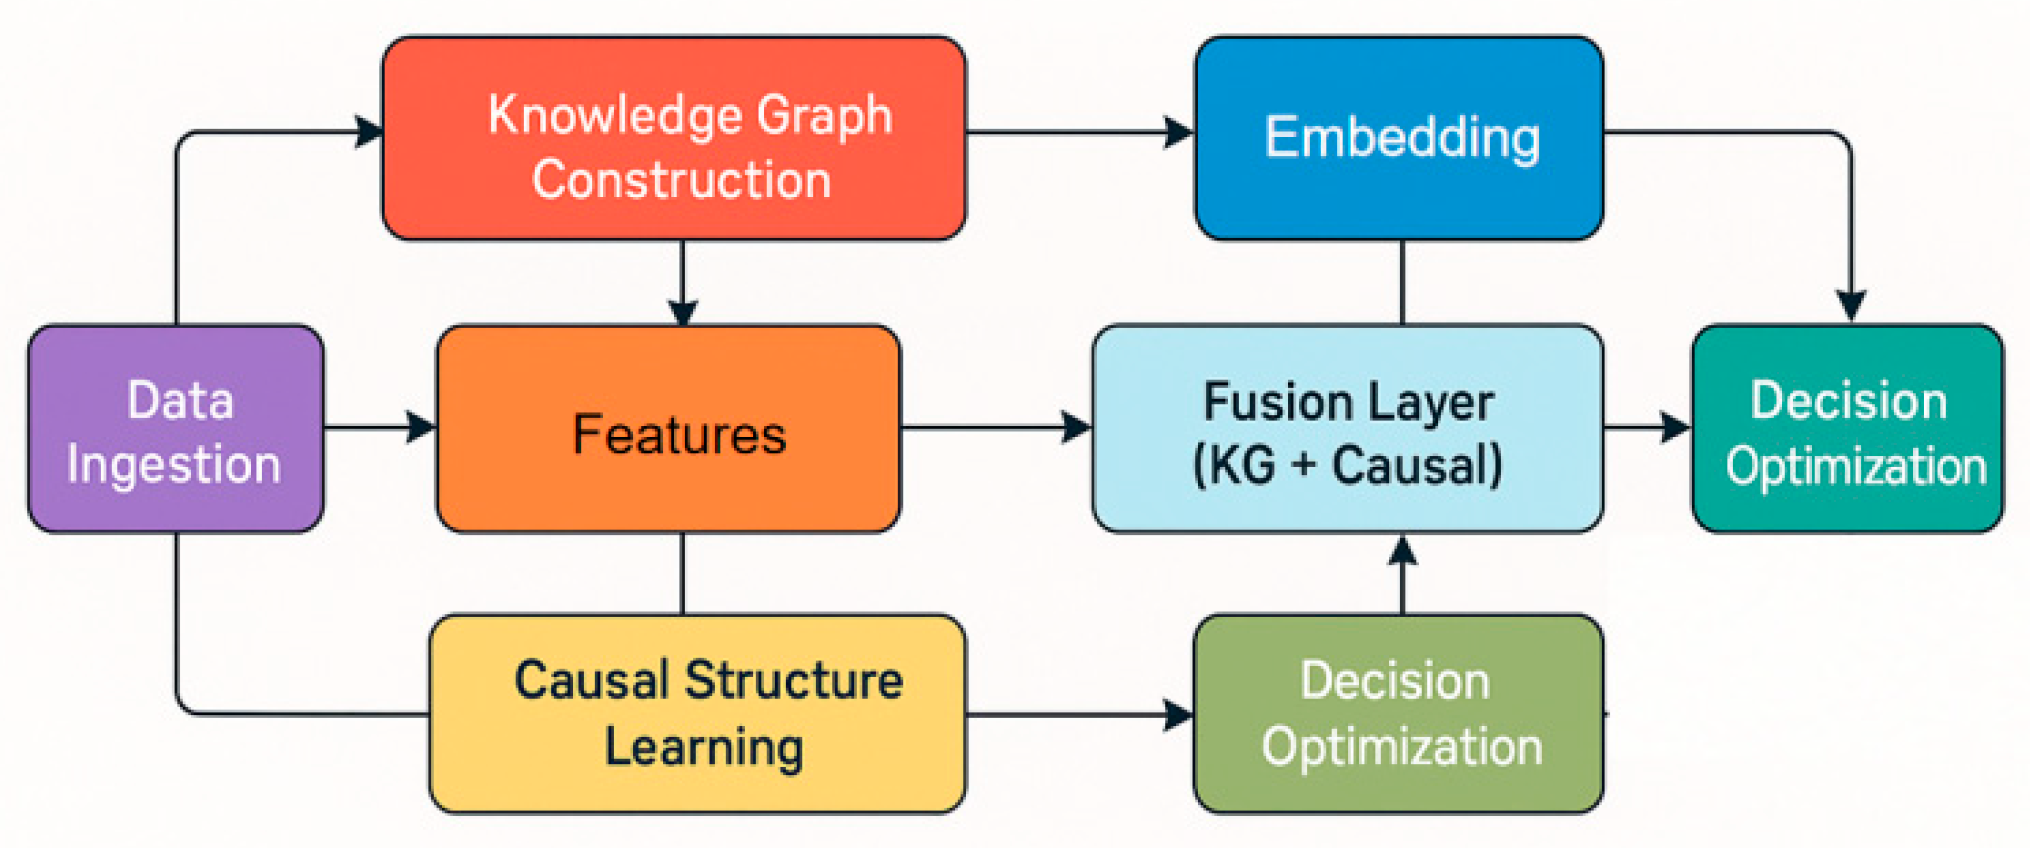
Figure 2.
Sensitivity analysis of different embedding dimensions to the MSE index.
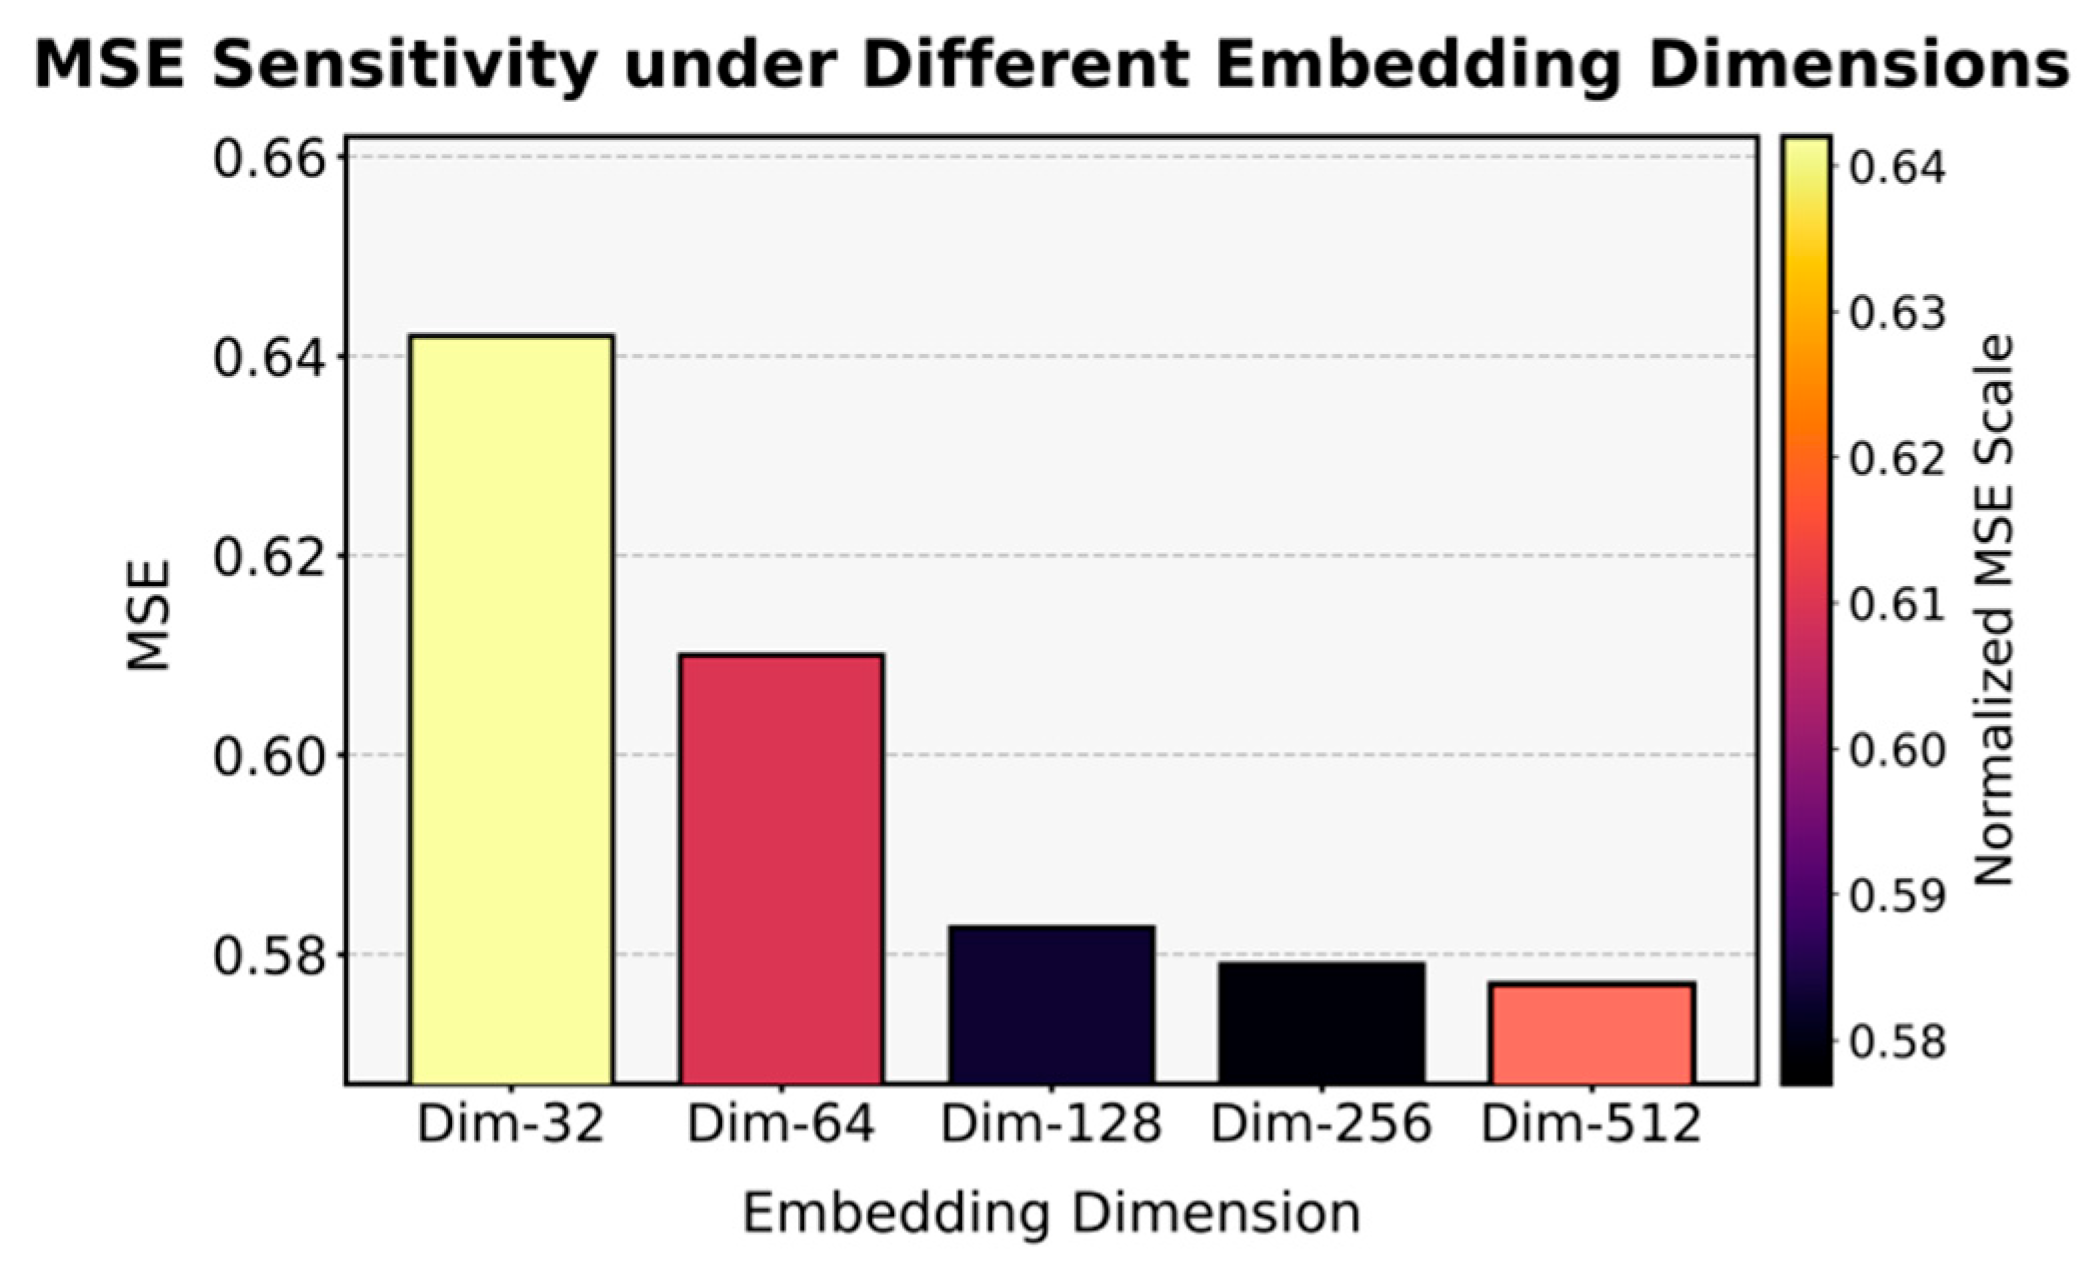
Figure 3.
Sensitivity assessment of noise injection intensity to MAPE.
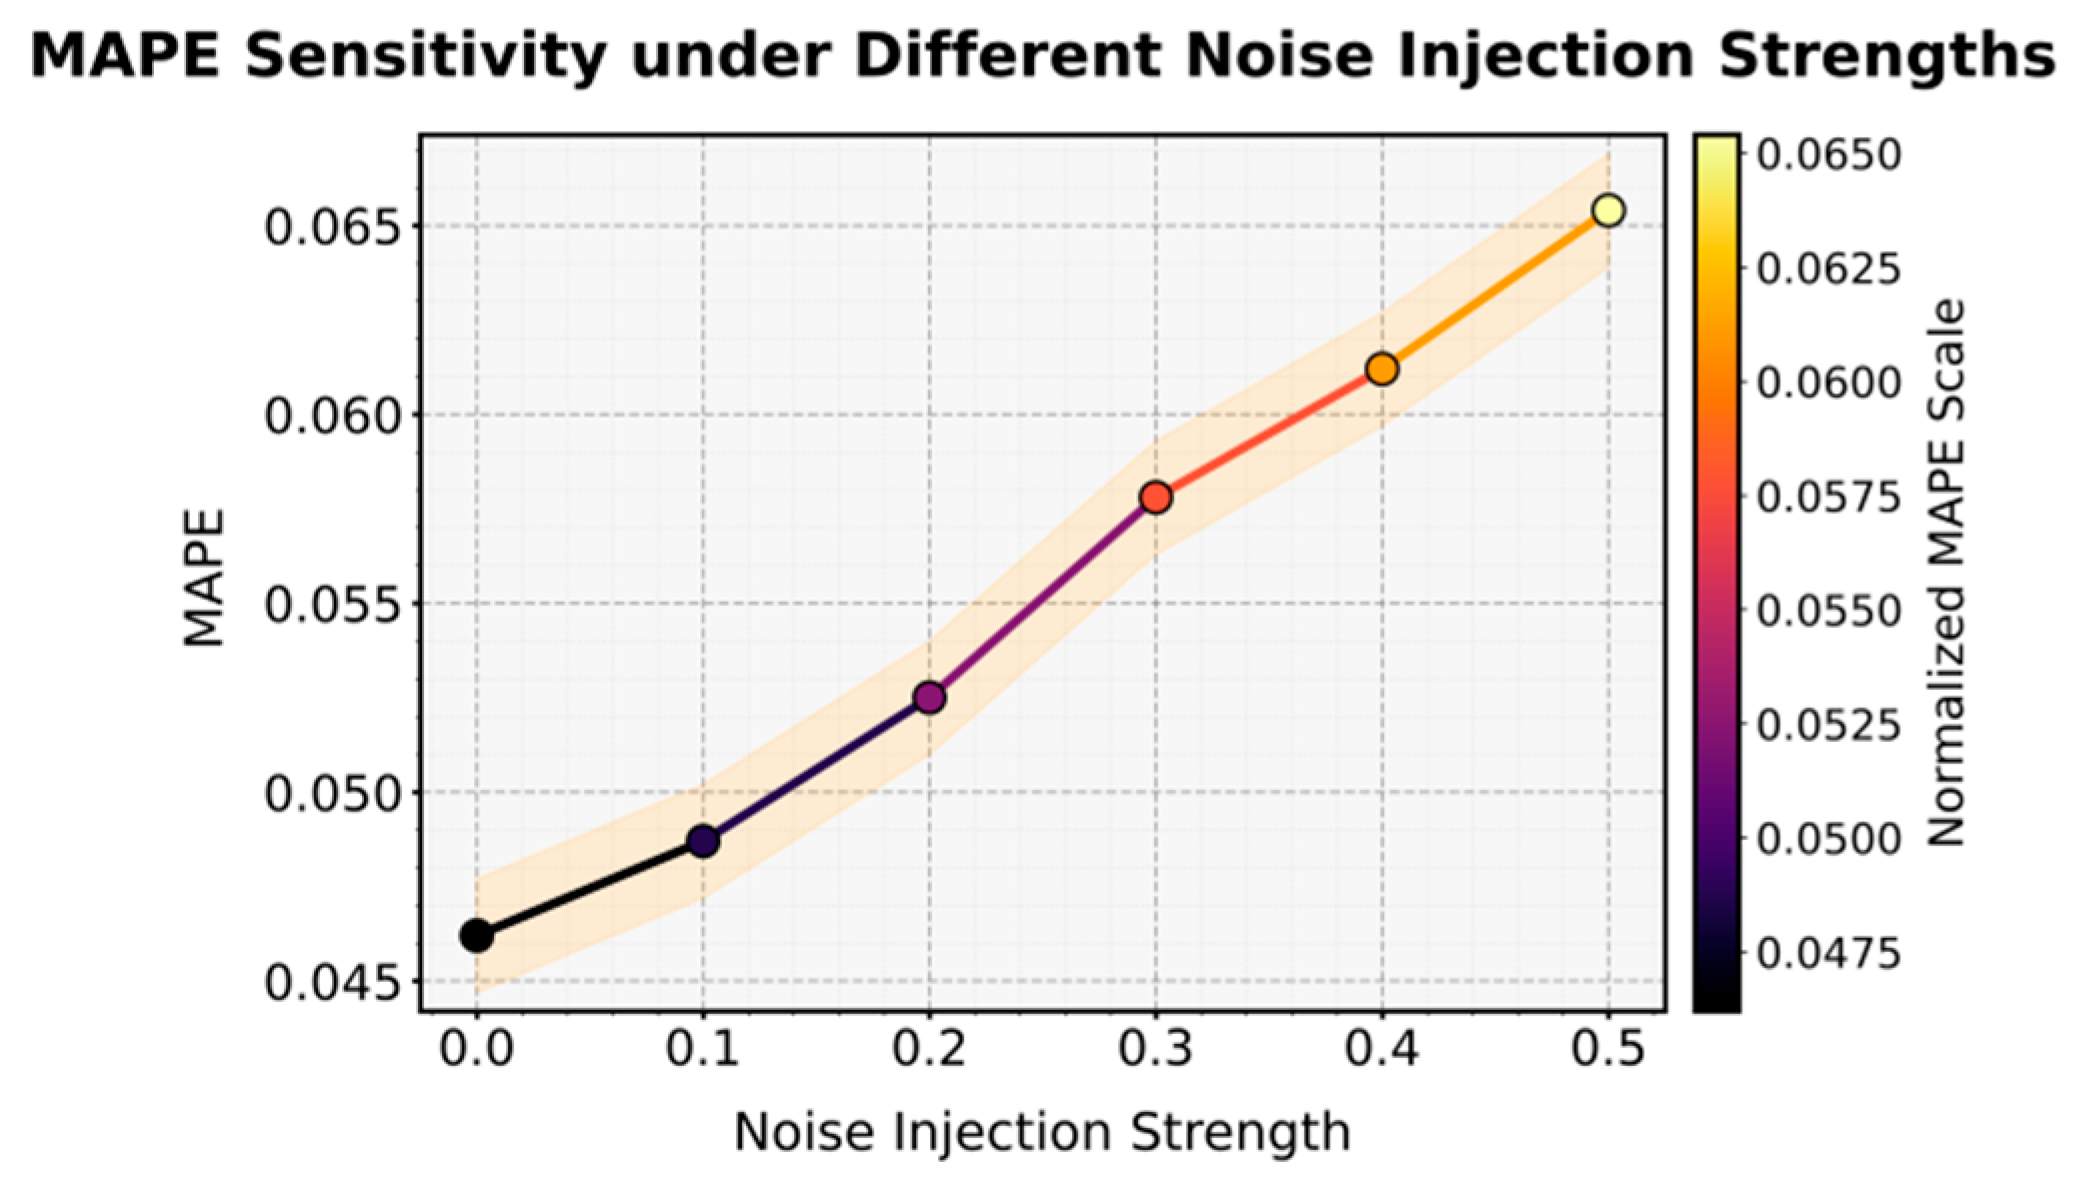
Figure 4.
The impact of different optimizers on the experimental results of MAE.
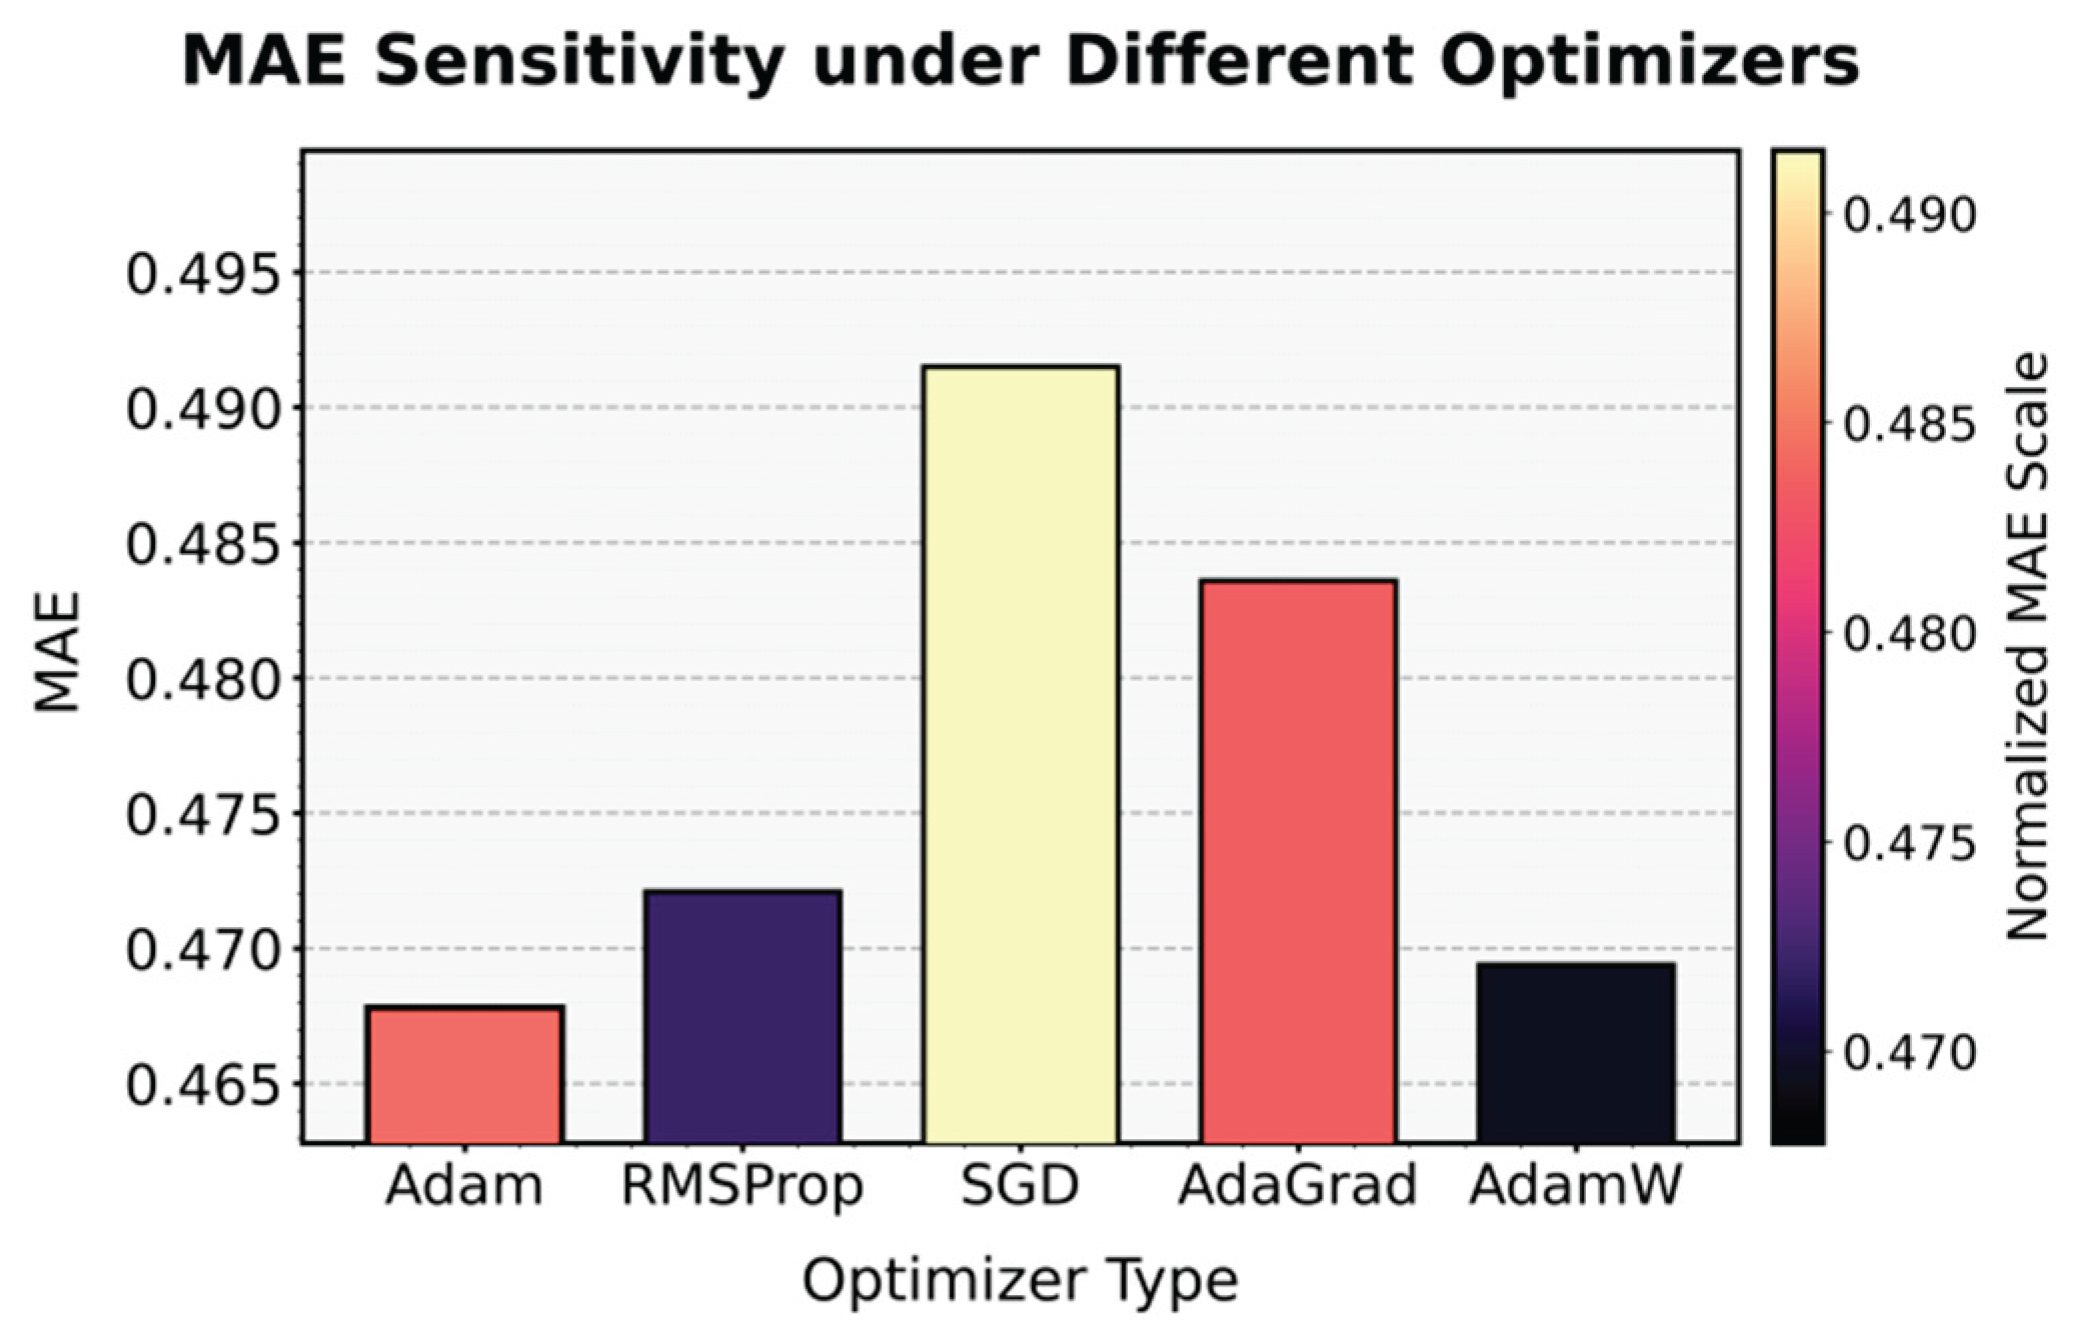

Table 1.
Comparative experimental results.
| Method | MSE | MAE | MAPE(%) | RMSE |
|---|---|---|---|---|
| LSTM [8] | 0.8421 | 0.6175 | 6.324 | 0.9177 |
| BILSTM [9] | 0.7934 | 0.5889 | 5.891 | 0.8907 |
| Informer [10] | 0.7218 | 0.5531 | 5.603 | 0.8496 |
| FedFormer [11] | 0.6885 | 0.5262 | 5.281 | 0.8297 |
| Transformer [12] | 0.6743 | 0.5195 | 5.165 | 0.8212 |
| BERT [13] | 0.6539 | 0.5110 | 5.048 | 0.8086 |
| Ours | 0.5827 | 0.4678 | 4.623 | 0.7632 |
Disclaimer/Publisher’s Note: The statements, opinions and data contained in all publications are solely those of the individual author(s) and contributor(s) and not of MDPI and/or the editor(s). MDPI and/or the editor(s) disclaim responsibility for any injury to people or property resulting from any ideas, methods, instructions or products referred to in the content. |
© 2026 by the authors. Licensee MDPI, Basel, Switzerland. This article is an open access article distributed under the terms and conditions of the Creative Commons Attribution (CC BY) license.
Copyright: This open access article is published under a Creative Commons CC BY 4.0 license, which permit the free download, distribution, and reuse, provided that the author and preprint are cited in any reuse.


