
Submitted:
30 December 2025
Posted:
30 December 2025
You are already at the latest version
Abstract
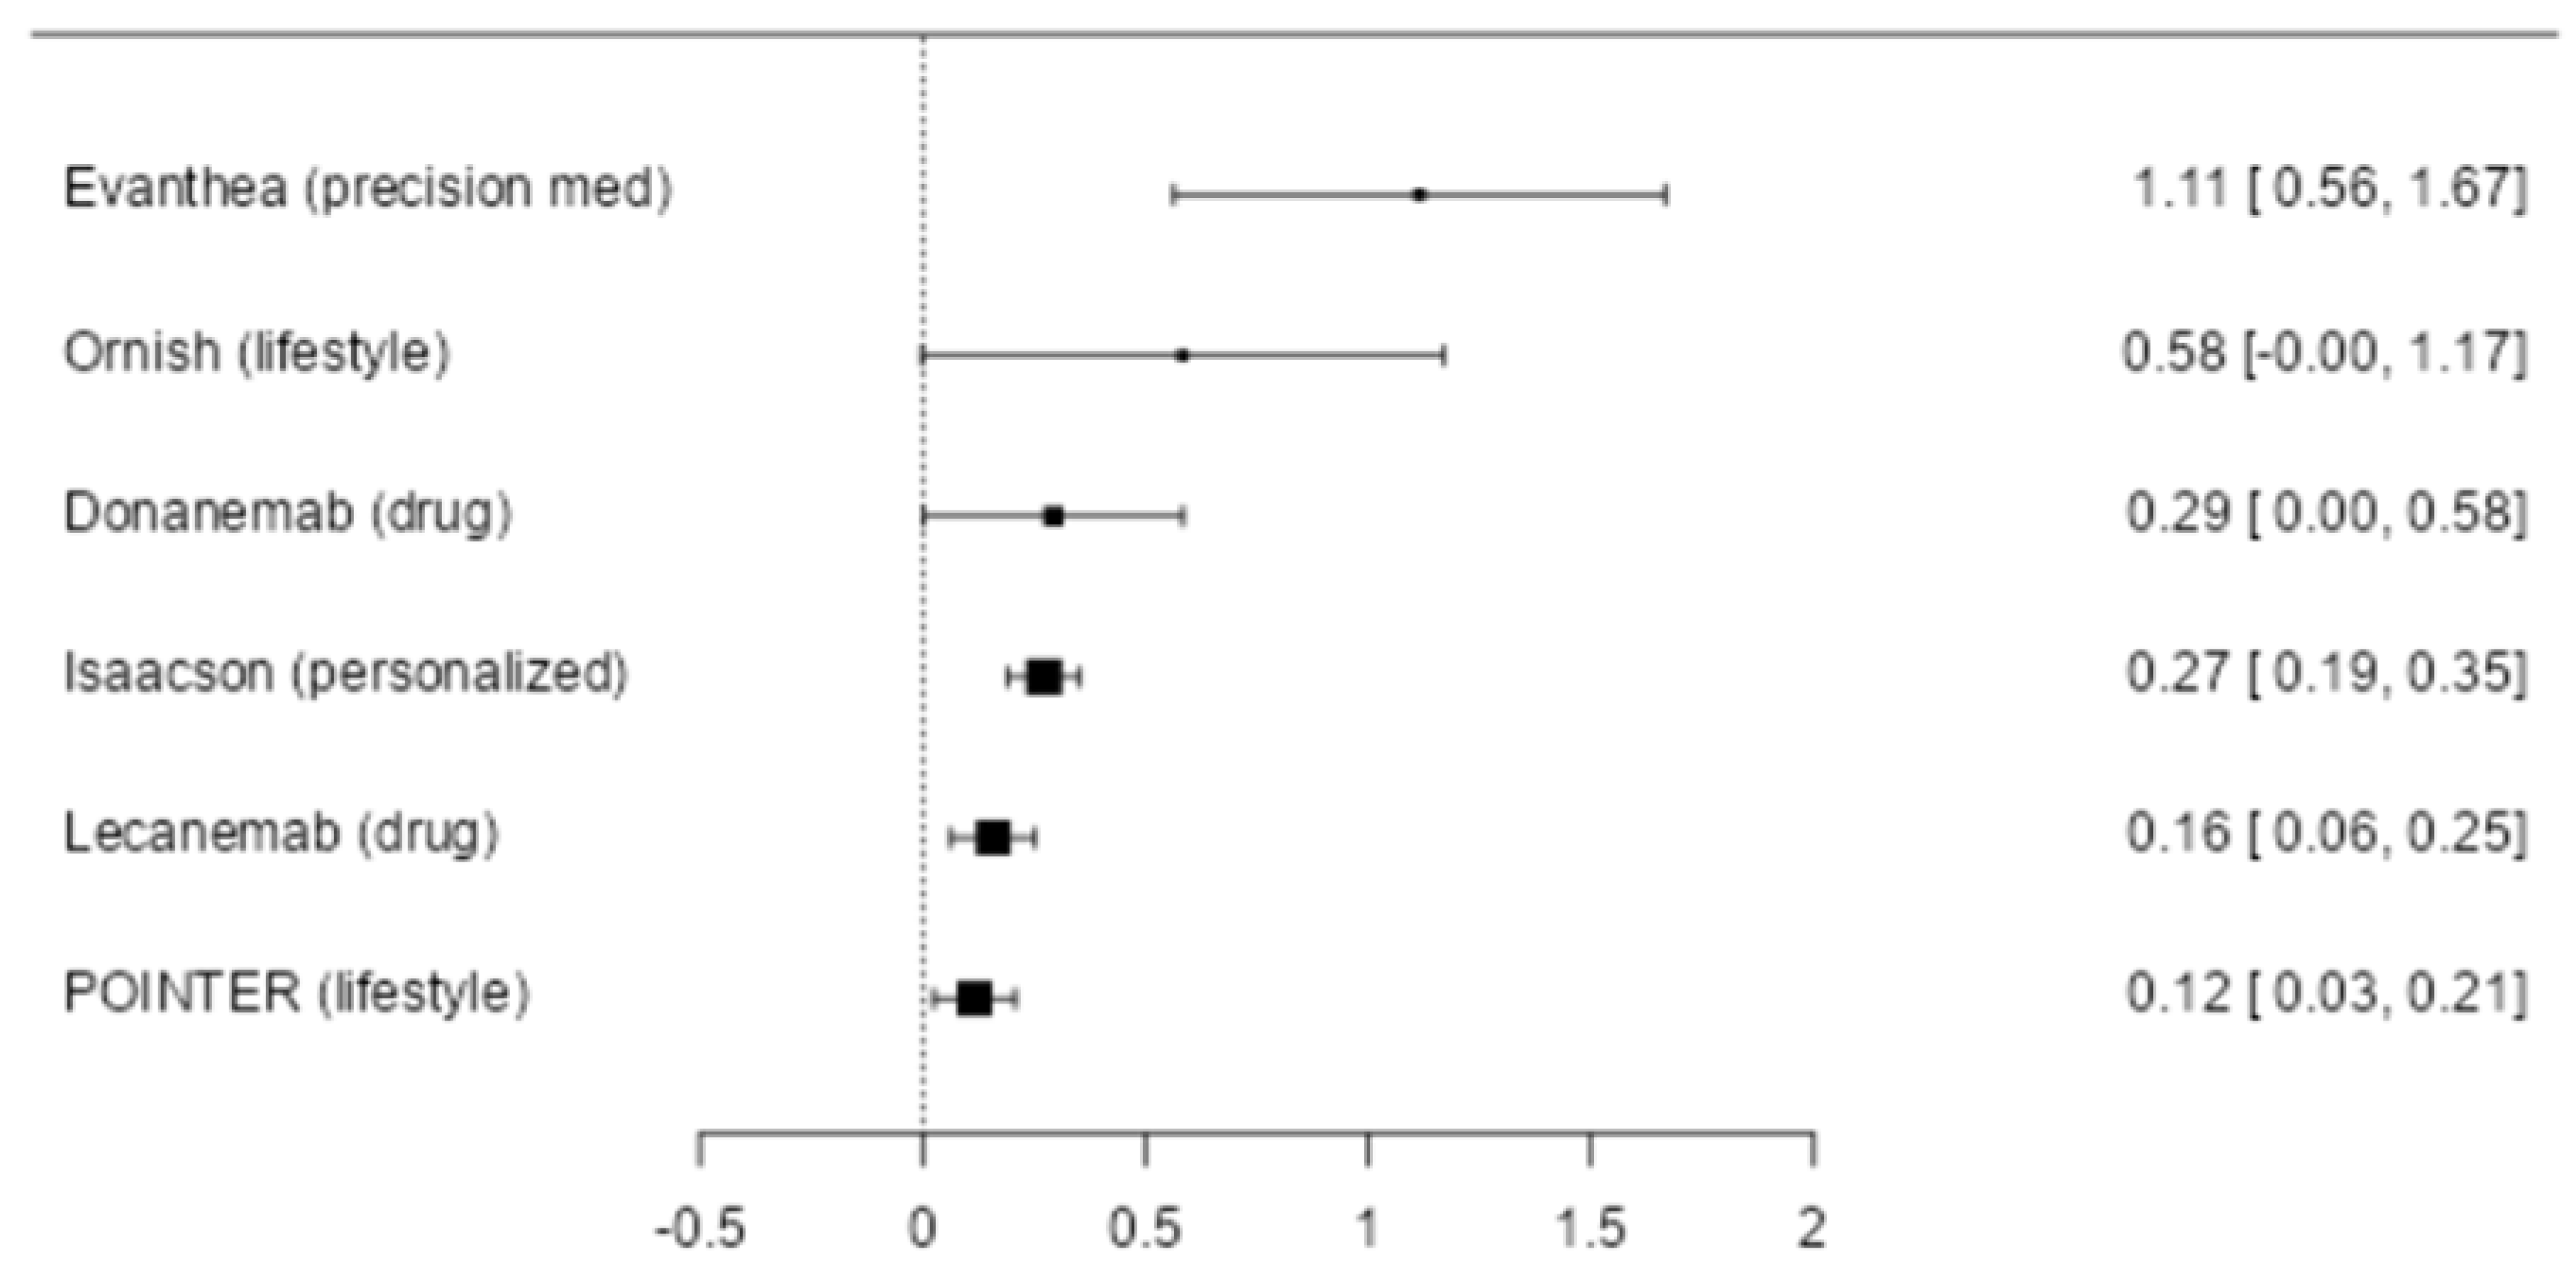
Background: There is a critical need for effective therapeutics for Alzheimer’s disease. However, the majority of previous clinical trials have pre-determined a single treatment modality, such as a drug candidate or therapeutic procedure, which may be unrelated to the primary drivers of the neurodegenerative process. Therefore, a personalized, precision medicine approach, with increased data set size to include the potential contributors to cognitive decline for each patient, and treatment of the identified potential contributors, has emerged as a potentially more effective strategy. Recent proof-of-concept trials have provided clinical data that support this approach. Objective: To determine whether a precision medicine approach to Alzheimer’s disease at the mild cognitive impairment or early dementia stage is effective in a randomized controlled clinical trial. Methods: Seventy-three patients with mild cognitive impairment or early dementia, with Montreal Cognitive Assessment (MoCA) scores of 18 or higher, were evaluated for markers of inflammation, chronic infection, dysbiosis, immune dysfunction, insulin resistance, protein glycation, vascular disease, nocturnal hypoxemia, hormone insufficiency or dysregulation, nutrient deficiency, toxin or toxicant exposure, and other biochemical parameters associated with cognitive decline. Genetic and epigenetic evaluations were included, as well as Alzheimer’s-associated biomarkers. Brain magnetic resonance imaging with volumetrics was performed at baseline and study conclusion. Participants were randomly assigned to either a personalized, precision medicine protocol or standard of care treatment. Cognition and clinical symptoms were assessed at 0, 3, 6, and 9 months. Results: Relative to the standard of care protocol, statistically significant incremental effects of the precision medicine protocol were observed for broad neurocognitive functioning, composite memory (verbal plus visual), executive function, processing speed, cognitive symptom severity, and Alzheimer’s disease symptom severity. Furthermore, overall health was enhanced, with improvements in blood pressure, body mass index, glycemic index, lipid profiles, and methylation status. The treatment effect size for overall cognitive function was calculated to be greater than previously published clinical trials, seven times the effect size of the lecanemab trial and four times the effect size of the donanemab trial. Conclusion: A personalized, precision medicine approach represents an effective treatment for patients with mild cognitive impairment or early-stage dementia due to Alzheimer’s disease. In most cases, this treatment leads to cognitive improvement rather than simply retarding decline, and it does so without significant negative side effects such as brain edema, microhemorrhage, or atrophy.
Keywords:
1. Introduction
2. Methods
3. Results
4. Discussion
5. Limitations of the Study
Funding
Acknowledgments
Conflicts of Interest
References
- James, B.D.; Leurgans, S.E.; Hebert, L.E.; Scherr, P.A.; Yaffe, K.; Bennett, D.A. Contribution of Alzheimer disease to mortality in the United States. Neurology 2014, 82, 1045–1050. [Google Scholar] [CrossRef] [PubMed]
- Mintun, M.A.; Wessels, A.M.; Sims, J.R. Donanemab in Early Alzheimer's Disease. Reply. N Engl J Med 2021, 385, 667. [Google Scholar] [CrossRef] [PubMed]
- Kato, S.; Kim, K.H.; Lim, H.J.; Boichard, A.; Nikanjam, M.; Weihe, E.; Kuo, D.J.; Eskander, R.N.; Goodman, A.; Galanina, N.; Fanta, P.T.; Schwab, R.B.; Shatsky, R.; Plaxe, S.C.; Sharabi, A.; Stites, E.; Adashek, J.J.; Okamura, R.; Lee, S.; Lippman, S.M.; Sicklick, J.K.; Kurzrock, R. Real-world data from a molecular tumor board demonstrates improved outcomes with a precision N-of-One strategy. Nat Commun 2020, 11, 4965. [Google Scholar] [CrossRef] [PubMed]
- Toups, K.; Hathaway, A.; Gordon, D.; Chung, H.; Raji, C.; Boyd, A.; Hill, B.D.; Hausman-Cohen, S.; Attarha, M.; Chwa, W.J.; Jarrett, M.; Bredesen, D.E. Precision Medicine Approach to Alzheimer’s Disease: Successful Pilot Project. Journal of Alzheimer's Disease 2022, 88, 1411–1421. [Google Scholar] [CrossRef]
- Sandison, H.; Callan, N.G.L.; Rao, R.V.; Phipps, J.; Bradley, R. Observed Improvement in Cognition During a Personalized Lifestyle Intervention in People with Cognitive Decline. J Alzheimers Dis 2023. [Google Scholar] [CrossRef]
- Kandimalla, R.; Thirumala, V.; Reddy, P.H. Is Alzheimer's disease a Type 3 Diabetes? A critical appraisal. Biochim Biophys Acta Mol Basis Dis 2017, 1863, 1078–1089. [Google Scholar] [CrossRef]
- Itzhaki, R.F.; Lathe, R.; Balin, B.J.; Ball, M.J.; Bearer, E.L.; Braak, H.; Bullido, M.J.; Carter, C.; Clerici, M.; Cosby, S.L.; Del Tredici, K.; Field, H.; Fulop, T.; Grassi, C.; Griffin, W.S.; Haas, J.; Hudson, A.P.; Kamer, A.R.; Kell, D.B.; Licastro, F.; Letenneur, L.; Lovheim, H.; Mancuso, R.; Miklossy, J.; Otth, C.; Palamara, A.T.; Perry, G.; Preston, C.; Pretorius, E.; Strandberg, T.; Tabet, N.; Taylor-Robinson, S.D.; Whittum-Hudson, J.A. Microbes and Alzheimer's Disease. J Alzheimers Dis 2016, 51, 979–984. [Google Scholar] [CrossRef]
- Karran, E.; De Strooper, B. The amyloid cascade hypothesis: are we poised for success or failure? J Neurochem 2016, 139 Suppl. 2, 237–252. [Google Scholar] [CrossRef]
- Kametani, F.; Hasegawa, M. Reconsideration of Amyloid Hypothesis and Tau Hypothesis in Alzheimer's Disease. Front Neurosci 2018, 12, 25. [Google Scholar] [CrossRef]
- Aoyagi, A.; Condello, C.; Stohr, J.; Yue, W.; Rivera, B.M.; Lee, J.C.; Woerman, A.L.; Halliday, G.; van Duinen, S.; Ingelsson, M.; Lannfelt, L.; Graff, C.; Bird, T.D.; Keene, C.D.; Seeley, W.W.; DeGrado, W.F.; Prusiner, S.B. Abeta and tau prion-like activities decline with longevity in the Alzheimer's disease human brain. Sci Transl Med 2019, 11. [Google Scholar] [CrossRef]
- Heneka, M.T.; Carson, M.J.; El Khoury, J.; Landreth, G.E.; Brosseron, F.; Feinstein, D.L.; Jacobs, A.H.; Wyss-Coray, T.; Vitorica, J.; Ransohoff, R.M.; Herrup, K.; Frautschy, S.A.; Finsen, B.; Brown, G.C.; Verkhratsky, A.; Yamanaka, K.; Koistinaho, J.; Latz, E.; Halle, A.; Petzold, G.C.; Town, T.; Morgan, D.; Shinohara, M.L.; Perry, V.H.; Holmes, C.; Bazan, N.G.; Brooks, D.J.; Hunot, S.; Joseph, B.; Deigendesch, N.; Garaschuk, O.; Boddeke, E.; Dinarello, C.A.; Breitner, J.C.; Cole, G.M.; Golenbock, D.T.; Kummer, M.P. Neuroinflammation in Alzheimer's disease. Lancet Neurol 2015, 14, 388–405. [Google Scholar] [CrossRef] [PubMed]
- Craft, S. Insulin resistance and Alzheimer's disease pathogenesis: potential mechanisms and implications for treatment. Curr Alzheimer Res 2007, 4, 147–152. [Google Scholar] [CrossRef] [PubMed]
- Ye, X; Tai, W; Zhang, D. The early events of Alzheimer's disease pathology: from mitochondrial dysfunction to BDNF axonal transport deficits. Neurobiol Aging 2012, 33, 1122 e1121–1110. [Google Scholar] [CrossRef] [PubMed]
- Bredesen, D.E. Reversal of cognitive decline: a novel therapeutic program. Aging (Albany NY) 2014, 6, 707–717. [Google Scholar] [CrossRef]
- Bredesen, D.E.; Amos, E.C.; Canick, J.; Ackerley, M.; Raji, C.; Fiala, M.; Ahdidan, J. Reversal of cognitive decline in Alzheimer's disease. Aging (Albany NY) 2016, 8, 1250–1258. [Google Scholar] [CrossRef]
- Bredesen, D.E.; Sharlin, K.; Jenkins, K.; Okuno, M.; Youngberg, W. Reversal of Cognitive Decline: 100 Patients. J Alzheimers Dis Parkinsonism 2018, 8, 450. [Google Scholar] [CrossRef]
- Bredesen, D.E.; Toups, K.; Hathaway, A.; Gordon, D.; Chung, H.; Raji, C.; Boyd, A.; Hill, B.D.; Hausman-Cohen, S.; Attarha, M.; Chwa, W.J.; Kurakin, A.; Jarrett, M. Precision Medicine Approach to Alzheimer's Disease: Rationale and Implications. J Alzheimers Dis 2023, 96, 429–437. [Google Scholar] [CrossRef]
- Teipel, S.; Gustafson, D.; Ossenkoppele, R.; Hansson, O.; Babiloni, C.; Wagner, M.; Riedel-Heller, S.G.; Kilimann, I.; Tang, Y. Alzheimer Disease: Standard of Diagnosis, Treatment, Care, and Prevention. J Nucl Med 2022, 63, 981–985. [Google Scholar] [CrossRef]
- Malek-Ahmadi, M.; Sabbagh, M.N. Development and Validation of the Alzheimer's Questionnaire (AQ). J Nat Sci 2015, 1, e104. [Google Scholar]
- Attarha, M.; Mahncke, H.; Merzenich, M. The Real-World Usability, Feasibility, and Performance Distributions of Deploying a Digital Toolbox of Computerized Assessments to Remotely Evaluate Brain Health: Development and Usability Study. JMIR Form Res 2024, 8, e53623. [Google Scholar] [CrossRef]
- Attarha, M.; De Figueiredo Pelegrino, A.; Ouellet, L.; Toussaint, P.J.; Grant, S.J.; Van Vleet, T.; de Villers-Sidani, E. Association of a Brief Computerized Cognitive Assessment With Cholinergic Neurotransmission: Assessment Validation Study. JMIR Form Res 2025, 9, e68374. [Google Scholar] [CrossRef]
- Attarha, M.; Carolina de Figueiredo Pelegrino, A.; Ouellet, L.; Grant, S.J.; de Villers-Sidani, E.; Van Vleet, T. Bringing Executive Function Testing Online: Assessment Validation Study. JMIR Form Res 2025, 9, e75687. [Google Scholar] [CrossRef]
- Horvath, S. DNA methylation age of human tissues and cell types. Genome Biol 2013, 14, R115. [Google Scholar] [CrossRef] [PubMed]
- Hannum, G.; Guinney, J.; Zhao, L.; Zhang, L.; Hughes, G.; Sadda, S.; Klotzle, B.; Bibikova, M.; Fan, J.-B.; Gao, Y.; Deconde, R.; Chen, M.; Rajapakse, I.; Friend, S.; Ideker, T.; Zhang, K. Genome-wide Methylation Profiles Reveal Quantitative Views of Human Aging Rates. Molecular Cell 2013, 49, 359–367. [Google Scholar] [CrossRef] [PubMed]
- Levine, M.E.; Lu, A.T.; Quach, A.; Chen, B.H.; Assimes, T.L.; Bandinelli, S.; Hou, L.; Baccarelli, A.A.; Stewart, J.D.; Li, Y.; Whitsel, E.A.; Wilson, J.G.; Reiner, A.P.; Aviv, A.; Lohman, K.; Liu, Y.; Ferrucci, L.; Horvath, S. An epigenetic biomarker of aging for lifespan and healthspan. Aging (Albany NY) 2018, 10, 573–591. [Google Scholar] [CrossRef] [PubMed]
- Lu, A.T.; Binder, A.M.; Zhang, J.; Yan, Q.; Reiner, A.P.; Cox, S.R.; Corley, J.; Harris, S.E.; Kuo, P.L.; Moore, A.Z.; Bandinelli, S.; Stewart, J.D.; Wang, C.; Hamlat, E.J.; Epel, E.S.; Schwartz, J.D.; Whitsel, E.A.; Correa, A.; Ferrucci, L.; Marioni, R.E.; Horvath, S. DNA methylation GrimAge version 2. Aging (Albany NY) 2022, 14, 9484–9549. [Google Scholar] [CrossRef]
- Pelegí-Sisó, D.; de Prado, P.; Ronkainen, J.; Bustamante, M.; González, J.R. methylclock: a Bioconductor package to estimate DNA methylation age. Bioinformatics 2020, 37, 1759–1760. [Google Scholar] [CrossRef]
- de Lima Camillo, L.P. pyaging: a Python-based compendium of GPU-optimized aging clocks. Bioinformatics 2024, 40. [Google Scholar] [CrossRef]
- Ying, K.; Paulson, S.; Eames, A.; Tyshkovskiy, A.; Li, S.; Eynon, N.; Jacques, M.; Grolaux, R.; Seale, K.; Jacques, E.; Goeminne, L.J.E.; Cipriano, A.; Perez-Guevara, M.; Emamifar, M.; Casas Martínez, M.; Kwon, D.; Kosheleva, A.; Snyder, M.; Gobel, D.; Herzog, C.; McCartney, D.L.; Marioni, R.E.; Lasky-Su, J.; Poganik, J.R.; Moqri, M.; Gladyshev, V.N. A unified framework for systematic curation and evaluation of aging biomarkers. Nature Aging 2025, 5, 2323–2339. [Google Scholar] [CrossRef]
- Belsky, D.W.; Caspi, A.; Corcoran, D.L.; Sugden, K.; Poulton, R.; Arseneault, L.; Baccarelli, A.; Chamarti, K.; Gao, X.; Hannon, E.; Harrington, H.L.; Houts, R.; Kothari, M.; Kwon, D.; Mill, J.; Schwartz, J.; Vokonas, P.; Wang, C.; Williams, B.S.; Moffitt, T.E. DunedinPACE, a DNA methylation biomarker of the pace of aging. eLife 2022, 11, e73420. [Google Scholar] [CrossRef]
- Higgins-Chen, A.T.; Thrush, K.L.; Wang, Y.; Minteer, C.J.; Kuo, P.L.; Wang, M.; Niimi, P.; Sturm, G.; Lin, J.; Moore, A.Z.; Bandinelli, S.; Vinkers, C.H.; Vermetten, E.; Rutten, B.P.F.; Geuze, E.; Okhuijsen-Pfeifer, C.; van der Horst, M.Z.; Schreiter, S.; Gutwinski, S.; Luykx, J.J.; Picard, M.; Ferrucci, L.; Crimmins, E.M.; Boks, M.P.; Hägg, S.; Hu-Seliger, T.T.; Levine, M.E. A computational solution for bolstering reliability of epigenetic clocks: Implications for clinical trials and longitudinal tracking. Nat Aging 2022, 2, 644–661. [Google Scholar] [CrossRef]
- Shireby, G.L.; Davies, J.P.; Francis, P.T.; Burrage, J.; Walker, E.M.; Neilson, G.W.A.; Dahir, A.; Thomas, A.J.; Love, S.; Smith, R.G.; Lunnon, K.; Kumari, M.; Schalkwyk, L.C.; Morgan, K.; Brookes, K.; Hannon, E.; Mill, J. Recalibrating the epigenetic clock: implications for assessing biological age in the human cortex. Brain 2020, 143, 3763–3775. [Google Scholar] [CrossRef]
- Gadd, D.A.; Hillary, R.F.; McCartney, D.L.; Zaghlool, S.B.; Stevenson, A.J.; Cheng, Y.; Fawns-Ritchie, C.; Nangle, C.; Campbell, A.; Flaig, R.; Harris, S.E.; Walker, R.M.; Shi, L.; Tucker-Drob, E.M.; Gieger, C.; Peters, A.; Waldenberger, M.; Graumann, J.; McRae, A.F.; Deary, I.J.; Porteous, D.J.; Hayward, C.; Visscher, P.M.; Cox, S.R.; Evans, K.L.; McIntosh, A.M.; Suhre, K.; Marioni, R.E. Epigenetic scores for the circulating proteome as tools for disease prediction. Elife 2022, 11. [Google Scholar] [CrossRef] [PubMed]
- Chen, Q.; Dwaraka, V.B.; Carreras-Gallo, N.; Mendez, K.; Chen, Y.; Begum, S.; Kachroo, P.; Prince, N.; Went, H.; Mendez, T.; Lin, A.; Turner, L.; Moqri, M.; Chu, S.H.; Kelly, R.S.; Weiss, S.T.; Rattray, N.J.W.; Gladyshev, V.N.; Karlson, E.; Wheelock, C.; Mathé, E.A.; Dahlin, A.; McGeachie, M.J.; Smith, R.; Lasky-Su, J.A. OMICmAge: An integrative multi-omics approach to quantify biological age with electronic medical records. bioRxiv 2023. [Google Scholar]
- Carreras-Gallo, N.; Chen, Q.; Balagué-Dobón, L.; Aparicio, A.; Giosan, I.M.; Dargham, R.; Phelps, D.; Guo, T.; Mendez, K.M.; Chen, Y.; Carangan, A.; Vempaty, S.; Hassouneh, S.; McGeachie, M.; Mendez, T.; Comite, F.; Suhre, K.; Smith, R.; Dwaraka, V.B.; Lasky-Su, J.A. Leveraging DNA methylation to create Epigenetic Biomarker Proxies that inform clinical care: A new framework for Precision Medicine. medRxiv 2024. [Google Scholar] [CrossRef] [PubMed]
- Benjamini, Y.; Hochberg, Y. Controlling the False Discovery Rate: A Practical and Powerful Approach to Multiple Testing. Journal of the Royal Statistical Society: Series B (Methodological) 2018, 57, 289–300. [Google Scholar] [CrossRef]
- Du, P.; Zhang, X.; Huang, C.C.; Jafari, N.; Kibbe, W.A.; Hou, L.; Lin, S.M. Comparison of Beta-value and M-value methods for quantifying methylation levels by microarray analysis. BMC Bioinformatics 2010, 11, 587. [Google Scholar] [CrossRef]
- Smyth, G.K. Linear models and empirical bayes methods for assessing differential expression in microarray experiments. Stat Appl Genet Mol Biol 2004, 3, 3. [Google Scholar] [CrossRef]
- Ritchie, M.E.; Phipson, B.; Wu, D.; Hu, Y.; Law, C.W.; Shi, W.; Smyth, G.K. limma powers differential expression analyses for RNA-sequencing and microarray studies. Nucleic Acids Res 2015, 43, e47. [Google Scholar] [CrossRef]
- Peters, T.J.; Buckley, M.J.; Statham, A.L.; Pidsley, R.; Samaras, K.; R VL; Clark, S.J.; Molloy, P.L. De novo identification of differentially methylated regions in the human genome. Epigenetics Chromatin 2015, 8, 6. [Google Scholar] [CrossRef]
- Yu, G.; Wang, L.-G.; He, Q.-Y. ChIPseeker: an R/Bioconductor package for ChIP peak annotation, comparison and visualization. Bioinformatics 2015, 31, 2382–2383. [Google Scholar] [CrossRef] [PubMed]
- Gu, Z.; Hübschmann, D. rGREAT: an R/bioconductor package for functional enrichment on genomic regions. Bioinformatics 2022, 39. [Google Scholar] [CrossRef] [PubMed]
- Ahdidan, J.; Raji, C.A.; DeYoe, E.A.; Mathis, J.; Noe, K.O.; Rimestad, J.; Kjeldsen, T.K.; Mosegaard, J.; Becker, J.T.; Lopez, O. Quantitative Neuroimaging Software for Clinical Assessment of Hippocampal Volumes on MR Imaging. J Alzheimers Dis 2016, 49, 723–732. [Google Scholar] [CrossRef] [PubMed]
- Cunnane, S.C.; Sieber, C.C.; Swerdlow, R.H.; Cruz-Jentoft, A.J. Mild cognitive impairment: when nutrition helps brain energy rescue-a report from the EuGMS 2020 Congress. Eur Geriatr Med 2021, 12, 1285–1292. [Google Scholar] [CrossRef]
- Field, L.H.; Edwards, S.D.; Edwards, D.J.; Dean, S.E. Influence of HeartMath Training Programme on Physiological and Psychological Variables. Global Journal of Health Science 2018, 10, 126–133. [Google Scholar] [CrossRef]
- Shah, T.M.; Weinborn, M.; Verdile, G.; Sohrabi, H.R.; Martins, R.N. Enhancing Cognitive Functioning in Healthly Older Adults: a Systematic Review of the Clinical Significance of Commercially Available Computerized Cognitive Training in Preventing Cognitive Decline. Neuropsychol Rev 2017, 27, 62–80. [Google Scholar] [CrossRef]
- Attarha, M.; de Figueiredo Pelegrino, A.; Ouellet, L.; Toussaint, P.J.; Grant, S.J.; Van Vleet, T.; de Villers-Sidani, E. Effects of Computerized Cognitive Training on Vesicular Acetylcholine Transporter Levels using [18F]Fluoroethoxybenzovesamicol Positron Emission Tomography in Healthy Older Adults: Results from the Improving Neurological Health in Aging via Neuroplasticity-based Computerized Exercise (INHANCE) Randomized Clinical Trial. JMIR Serious Games 2025, 13, e75161. [Google Scholar]
- Smith, G.E.; Housen, P.; Yaffe, K.; Ruff, R.; Kennison, R.F.; Mahncke, H.W.; Zelinski, E.M. A cognitive training program based on principles of brain plasticity: results from the Improvement in Memory with Plasticity-based Adaptive Cognitive Training (IMPACT) study. J Am Geriatr Soc 2009, 57, 594–603. [Google Scholar] [CrossRef]
- Rebok, G.W.; Ball, K.; Guey, L.T.; Jones, R.N.; Kim, H.Y.; King, J.W.; Marsiske, M.; Morris, J.N.; Tennstedt, S.L.; Unverzagt, F.W.; Willis, S.L.; Group, A.S. Ten-year effects of the advanced cognitive training for independent and vital elderly cognitive training trial on cognition and everyday functioning in older adults. J Am Geriatr Soc 2014, 62, 16–24. [Google Scholar] [CrossRef]
- Wharton, W.; Gleason, C.E.; Lorenze, K.R.; Markgraf, T.S.; Ries, M.L.; Carlsson, C.M.; Asthana, S. Potential role of estrogen in the pathobiology and prevention of Alzheimer's disease. Am J Transl Res 2009, 1, 131–147. [Google Scholar]
- Brown, N.; Panksepp, J. Low-dose naltrexone for disease prevention and quality of life. Med Hypotheses 2009, 72, 333–337. [Google Scholar] [CrossRef] [PubMed]
- Miklossy, J. Alzheimer's disease - a neurospirochetosis. Analysis of the evidence following Koch's and Hill's criteria. J Neuroinflammation 2011, 8, 90. [Google Scholar] [CrossRef] [PubMed]
- Feng, J.; Leone, J.; Schweig, S.; Zhang, Y. Evaluation of Natural and Botanical Medicines for Activity Against Growing and Non-growing Forms of B. burgdorferi. Frontiers in Medicine 2020, 7. [Google Scholar] [CrossRef] [PubMed]
- Ramanishankar, A.; A.S., S; Begum, R.F.; Jayasankar, N.; Nayeem, A.; Prajapati, B.G.; Nirenjen, S. Unleashing light's healing power: an overview of photobiomodulation for Alzheimer's treatment. Future Sci OA 2024, 10, Fso922. [Google Scholar] [CrossRef]
- Gualtieri, C.T.; Johnson, L.G. Reliability and validity of a computerized neurocognitive test battery, CNS Vital Signs. Arch Clin Neuropsychol 2006, 21, 623–643. [Google Scholar] [CrossRef]
- Bojar, I.; Wojcik-Fatla, A.; Owoc, A.; Lewinski, A. Polymorphisms of apolipoprotein E gene and cognitive functions of postmenopausal women, measured by battery of computer tests - Central Nervous System Vital Signs. Neuro Endocrinol Lett 2012, 33, 385–392. [Google Scholar]
- Mohammadi, S.; Rahmani, F.; Dolatshahi, M.; Schindler, S.E.; Raji, C.A.; Collaborators, A. Effects of obesity on plasma biomarker and amyloid PET trajectories in Alzheimer's disease. Alzheimers Dement (Amst) 2025, 17, e70143. [Google Scholar] [CrossRef]
- Hardy, J.; Allsop, D. Amyloid deposition as the central event in the aetiology of Alzheimer's disease. Trends Pharmacol Sci 1991, 12, 383–388. [Google Scholar] [CrossRef]
- Ngandu, T.; Lehtisalo, J.; Solomon, A.; Levalahti, E.; Ahtiluoto, S.; Antikainen, R.; Backman, L.; Hanninen, T.; Jula, A.; Laatikainen, T.; Lindstrom, J.; Mangialasche, F.; Paajanen, T.; Pajala, S.; Peltonen, M.; Rauramaa, R.; Stigsdotter-Neely, A.; Strandberg, T.; Tuomilehto, J.; Soininen, H.; Kivipelto, M. A 2 year multidomain intervention of diet, exercise, cognitive training, and vascular risk monitoring versus control to prevent cognitive decline in at-risk elderly people (FINGER): a randomised controlled trial. Lancet 2015, 385, 2255–2263. [Google Scholar] [CrossRef]
- van Dyck, C.H.; Swanson, C.J.; Aisen, P.; Bateman, R.J.; Chen, C.; Gee, M.; Kanekiyo, M.; Li, D.; Reyderman, L.; Cohen, S.; Froelich, L.; Katayama, S.; Sabbagh, M.; Vellas, B.; Watson, D.; Dhadda, S.; Irizarry, M.; Kramer, L.D.; Iwatsubo, T. Lecanemab in Early Alzheimer's Disease. N Engl J Med 2023, 388, 9–21. [Google Scholar] [CrossRef]
- Isaacson, R.S.; Hristov, H.; Saif, N.; Hackett, K.; Hendrix, S.; Melendez, J.; Safdieh, J.; Fink, M.; Thambisetty, M.; Sadek, G.; Bellara, S.; Lee, P.; Berkowitz, C.; Rahman, A.; Melendez-Cabrero, J.; Caesar, E.; Cohen, R.; Lu, P.L.; Dickson, S.P.; Hwang, M.J.; Scheyer, O.; Mureb, M.; Schelke, M.W.; Niotis, K.; Greer, C.E.; Attia, P.; Mosconi, L.; Krikorian, R. Individualized clinical management of patients at risk for Alzheimer's dementia. Alzheimers Dement 2019, 15, 1588–1602. [Google Scholar] [CrossRef]

| Group | Comparison | ||||
|---|---|---|---|---|---|
| Variable | Total sample (N=73) | A (N=50) | B (N=23) | p | ES |
| Age, M (SD) | 65.0 (7.6) | 65.1 (7.3) | 64.7 (8.2) | .868 | d=0.04 |
| Education, M (SD) | 16.2 (2.9) | 15.9 (2.9) | 16.8 (2.7) | .211 | d=-0.32 |
| Education, n (%) | -- | -- | -- | .629 | V=.154 |
| High school or less | 6 (8.2) | 5 (10.0) | 1 (4.3) | -- | -- |
| Some college | 17 (23.3) | 11 (22.0) | 6 (26.1) | -- | -- |
| College graduate | 27 (37.0) | 20 (40.0) | 7 (30.4) | -- | -- |
| Post-graduate | 23 (31.5) | 14 (28.0) | 9 (39.1) | -- | -- |
| Sex, n (%) | -- | -- | -- | .191 | φ=-.153 |
| Female | 46 (63.0) | 29 (58.0) | 17 (73.9) | -- | -- |
| Male | 27 (37.0) | 21 (42.0) | 6 (26.1) | -- | -- |
| Race, n (%) | -- | -- | -- | .213 | V=.248 |
| White | 68 (93.2) | 48 (96.0) | 20 (87.0) | -- | -- |
| Black | 1 (1.4) | 0 (0.0) | 1 (4.5) | -- | -- |
| Asian | 3 (4.1) | 2 (4.0) | 1 (4.5) | -- | -- |
| Not reported | 1 (1.4) | 0 (0.0) | 1 (4.5) | ||
| Ethnicity, n (%) | -- | -- | -- | .824 | V=.073 |
| Not Hispanic | 63 (86.3) | 44 (88.0) | 19 (82.6) | -- | -- |
| Hispanic | 5 (6.8) | 3 (6.0) | 2 (8.7) | -- | -- |
| Not reported | 5 (6.8) | 3 (6.0) | 2 (8.7) | -- | -- |
| ApoE alleles, n (%) | -- | -- | -- | .485 | V=.219 |
| ε2/ε3 | 4 (5.5) | 3 (6.0) | 1 (4.3) | -- | -- |
| ε2/ε4 | 1 (1.4) | 0 (0.0) | 1 (4.3) | -- | -- |
| ε3/ε3 | 33 (45.2) | 24 (48.0) | 9 (39.1) | -- | -- |
| ε3/ε4 | 28 (38.4) | 19 (38.0) | 9 (39.1) | -- | -- |
| ε4/ε4 | 6 (8.2) | 3 (6.0) | 3 (13.0) | -- | -- |
| Δ within group | Δ between groups | ||||||
| Group | Variable, Med (IQR) | Month 0 | Month 9 | Med (IQR) | da | Med dif | db |
| Precision | Vitamin D (25-OH) | 43.3 (18.3) | 62.6 (19.9) | 20.5 (33.7) | 1.60‡ | 22.8 | 0.86† |
| medicine | hs-CRP | 0.6 (1.0) | 0.6 (1.4) | -0.02 (0.6) | -0.44 | 0.0 | -0.42 |
| Fasting glucose | 96.0 (11.0) | 91.0 (9.0) | -6.0 (11.0) | -1.18† | -4.5 | -0.38 | |
| HDL cholesterol | 65.0 (26.0) | 72.0 (27.0) | 3.0 (10.0) | 0.54 | 3.0 | -0.26 | |
| Hgb A1c | 5.5 (0.3) | 5.3 (0.3) | -0.2 (0.3) | -1.93‡ | -0.3 | -1.14‡ | |
| Homocysteine | 9.8 (3.5) | 7.8 (3.8) | -2.1 (3.0) | -2.04‡ | -1.3 | -0.86† | |
| Fasting insulin | 5.9 (6.3) | 5.0 (4.9) | -1.1 (3.2) | -0.83† | -1.8 | -0.51 | |
| Total cholesterol | 212.5 (55.0) | 204.0 (68.0) | -3.0 (65.0) | -0.54 | 0.5 | -0.17 | |
| Triglycerides | 77.0 (45.0) | 61.0 (29.0) | -13 (37.0) | -1.08† | -19.5 | -0.59† | |
| Vitamin B12 | 647.0 (428.0) | 1452.0 (846.0) | 659.5 (768.3) | 2.58‡ | 685.5 | 1.18‡ | |
| HOMA-IR | 1.4 (1.3) | 1.1 (1.1) | -0.4 (0.8) | -1.46‡ | -0.4 | -0.61† | |
| TG:HDL ratio | 1.2 (1.1) | 0.9 (0.7) | -0.3 (0.6) | -1.07† | -0.4 | -0.55† | |
| BMI | 24.0 (6.8) | 22.4 (5.4) | -1.2 (3.1) | -1.52‡ | -1.7 | -1.27‡ | |
| Systolic BP | 123.0 (25.5) | 118.0 (18.0) | -9.0 (23.5) | -0.99† | -10.0 | -0.49‖ | |
| Diastolic BP | 73.0 (11.3) | 70.0 (9.3) | -5.0 (14.3) | -0.84† | -5.0 | -0.36 | |
| Standard | Vitamin D (25-OH) | 43.2 (23.3) | 51.5 (30.3) | -2.3 (17.9) | -0.02 | -- | -- |
| of care | hs-CRP | 0.5 (1.2) | 0.8 (2.0) | 0.2 (1.0) | 0.62 | -- | -- |
| Fasting glucose | 92.5 (14.0) | 93.0 (10.0) | -1.5 (10.3) | -0.50 | -- | -- | |
| HDL cholesterol | 62.0 (38.0) | 62.0 (28.0) | 0.0 (14.8) | -0.08 | -- | -- | |
| Hgb A1c | 5.7 (0.3) | 5.7 (0.5) | 0.1 (0.3) | 0.42 | -- | -- | |
| Homocysteine | 9.6 (3.0) | 9.6 (3.4) | -0.8 (3.7) | -0.24 | -- | -- | |
| Fasting insulin | 6.3 (6.3) | 7.4 (5.9) | 0.7 (5.1) | 0.33 | -- | -- | |
| Total cholesterol | 230.0 (73.0) | 220.5 (45.0) | -3.5 (42.5) | -0.23 | -- | -- | |
| Triglycerides | 82.0 (39.0) | 89.0 (68.0) | 6.5 (59.0) | 0.29 | -- | -- | |
| Vitamin B12 | 819.5 (686.0) | 960.0 (965.0) | -26.0 (223.0) | -0.31 | -- | -- | |
| HOMA-IR | 1.4 (1.3) | 1.6 (1.5) | 0.02 (1.2) | 0.22 | -- | -- | |
| TG:HDL ratio | 1.5 (1.5) | 1.6 (1.3) | 0.1 (1.0) | 0.30 | – | – | |
| BMI | 24.0 (6.4) | 25.0 (6.5) | 0.5 (0.8) | 1.76* | -- | -- | |
| Systolic BP | 121.0 (22.5) | 124.0 (23.5) | -1.0 (18.5) | 0.19 | -- | -- | |
| Diastolic BP | 74.0 (11.5) | 74.0 (10.5) | 0.0 (14.0) | -0.27 | -- | -- | |
| Variable, M (SD) | Timepoint (month) | Δ from baseline, M (d)a | Δ between groups, M (d)b | Group x timepoint interaction | ||||||
|---|---|---|---|---|---|---|---|---|---|---|
| Group | 0 | 3 | 6 | 9 | F | p | ||||
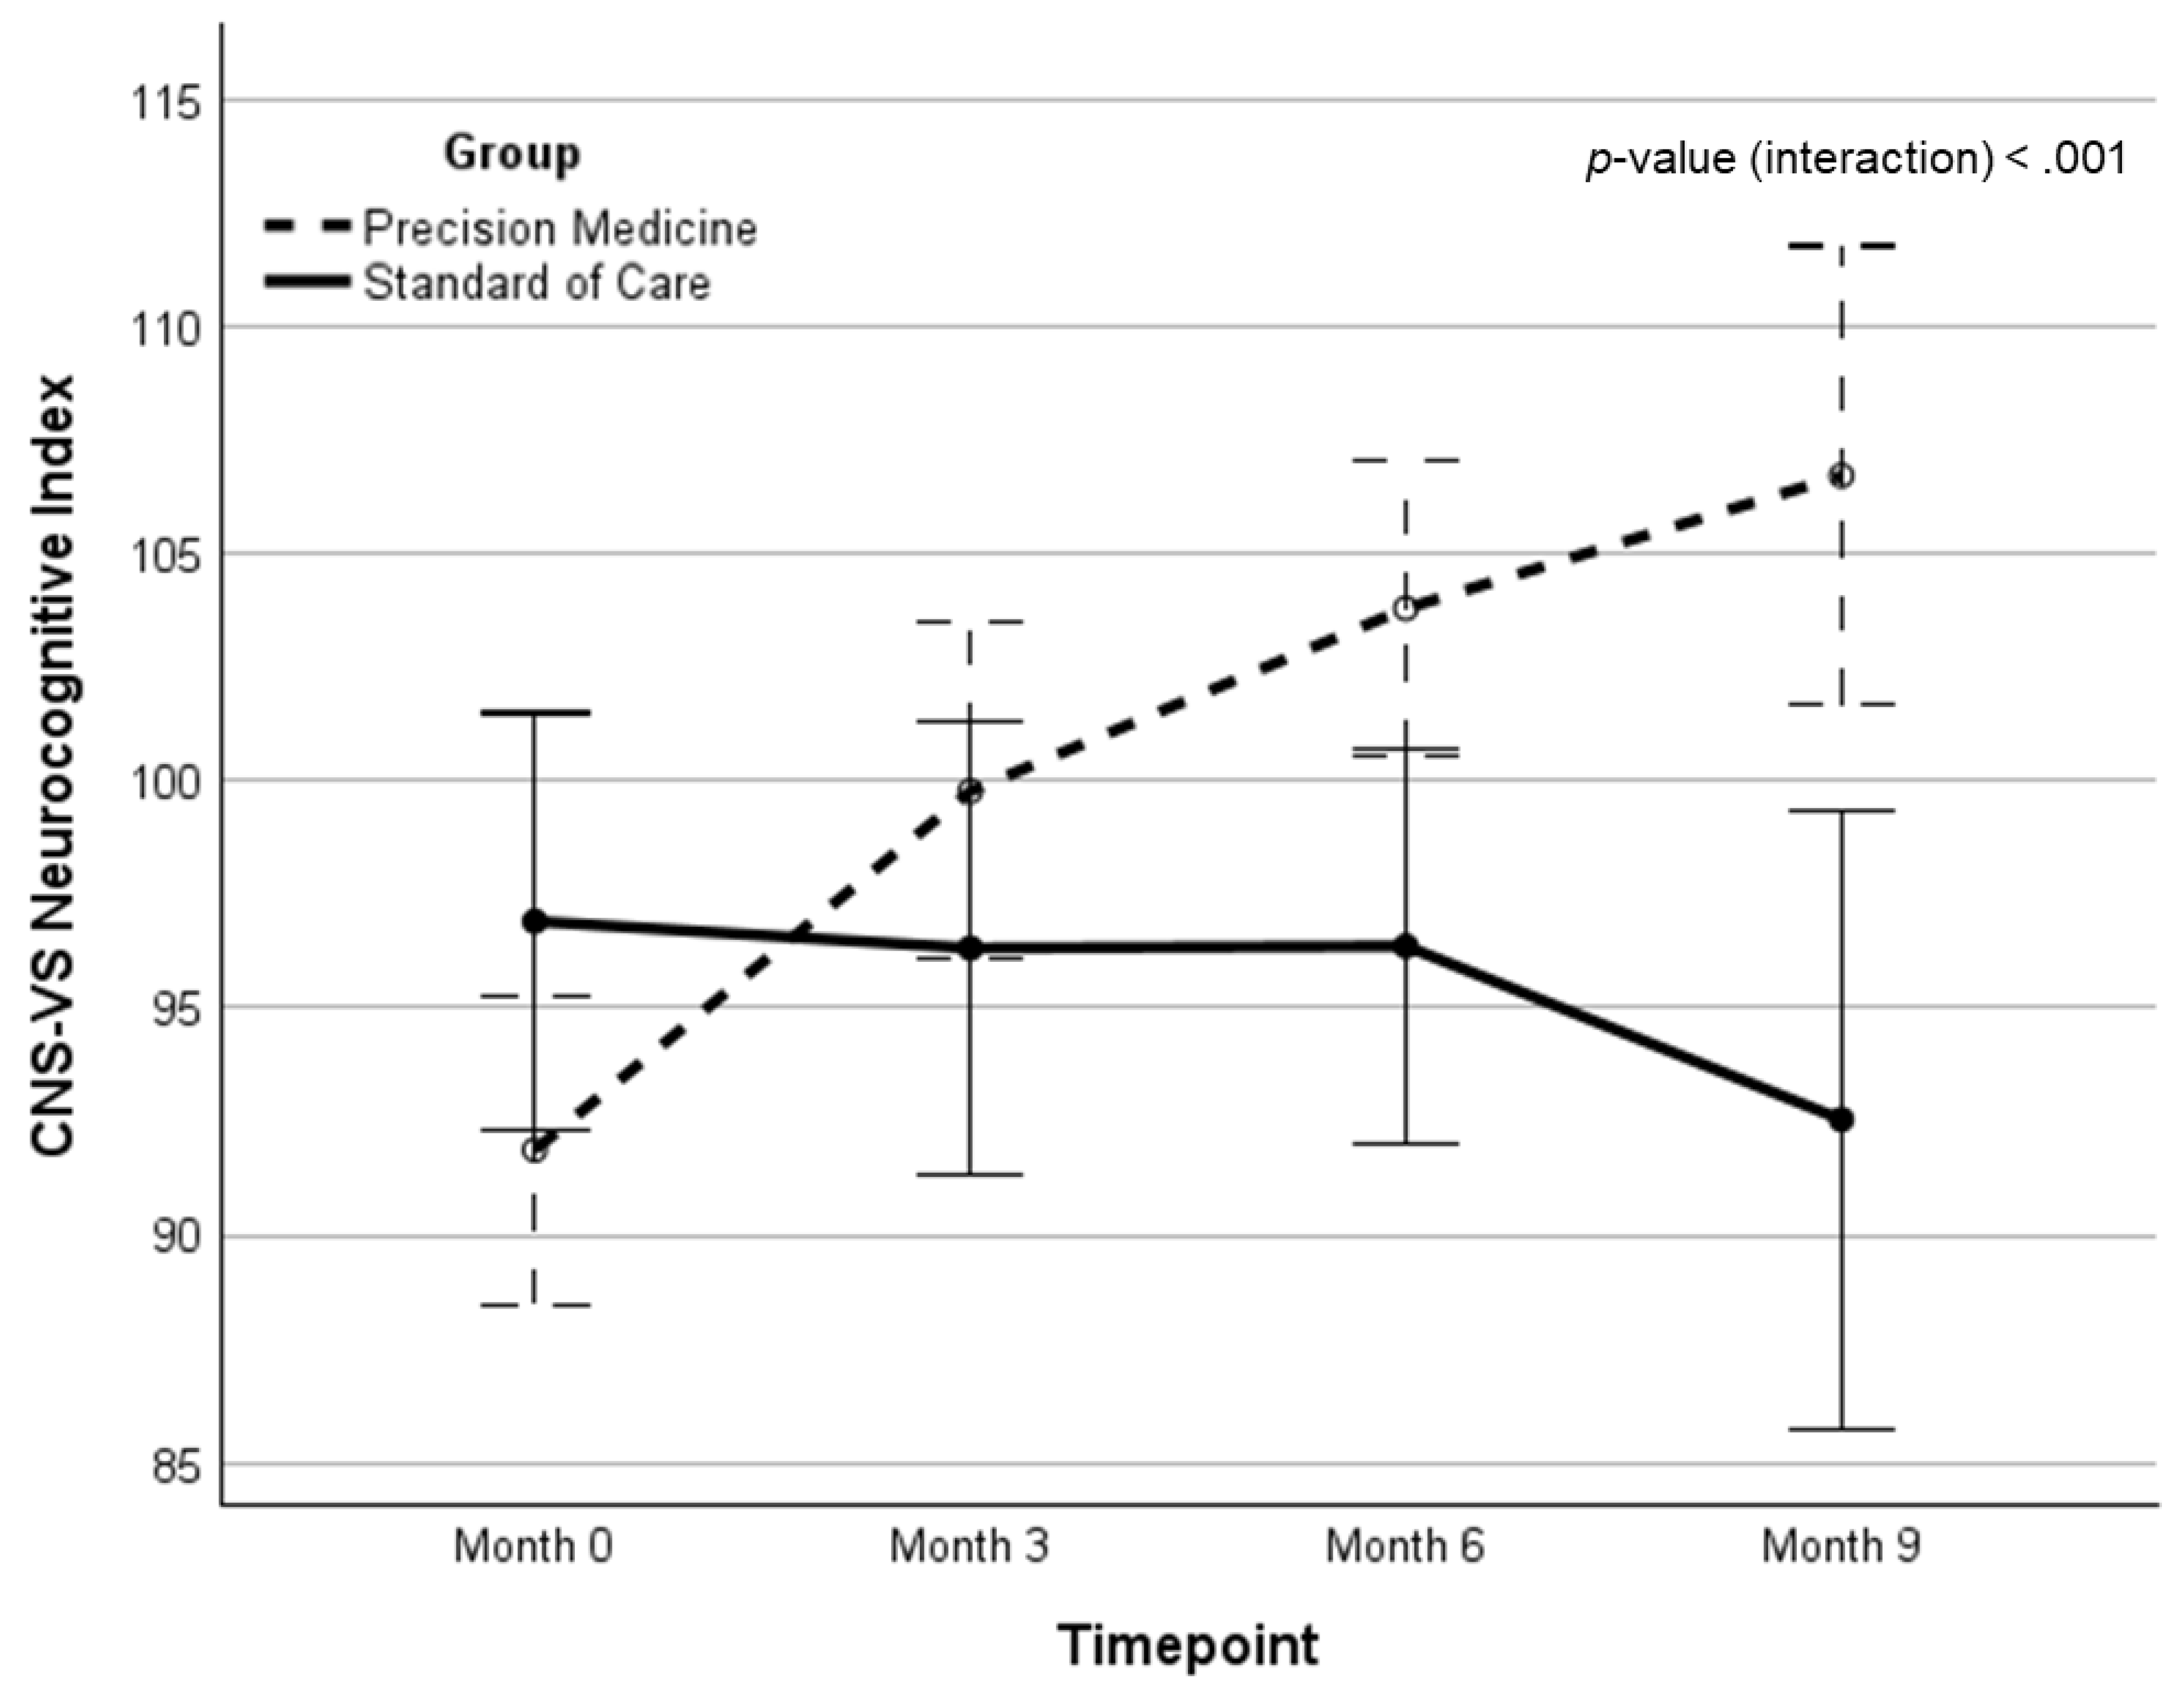
| Precision Medicine | NCI | 92.04 (12.3) | 98.89 (11.1) | 103.76 (8.9) | 106.19 (8.1) | 14.02 (1.23)‡ | 18.39 (1.12)‡ | 21.08 | <.001 | .260 |
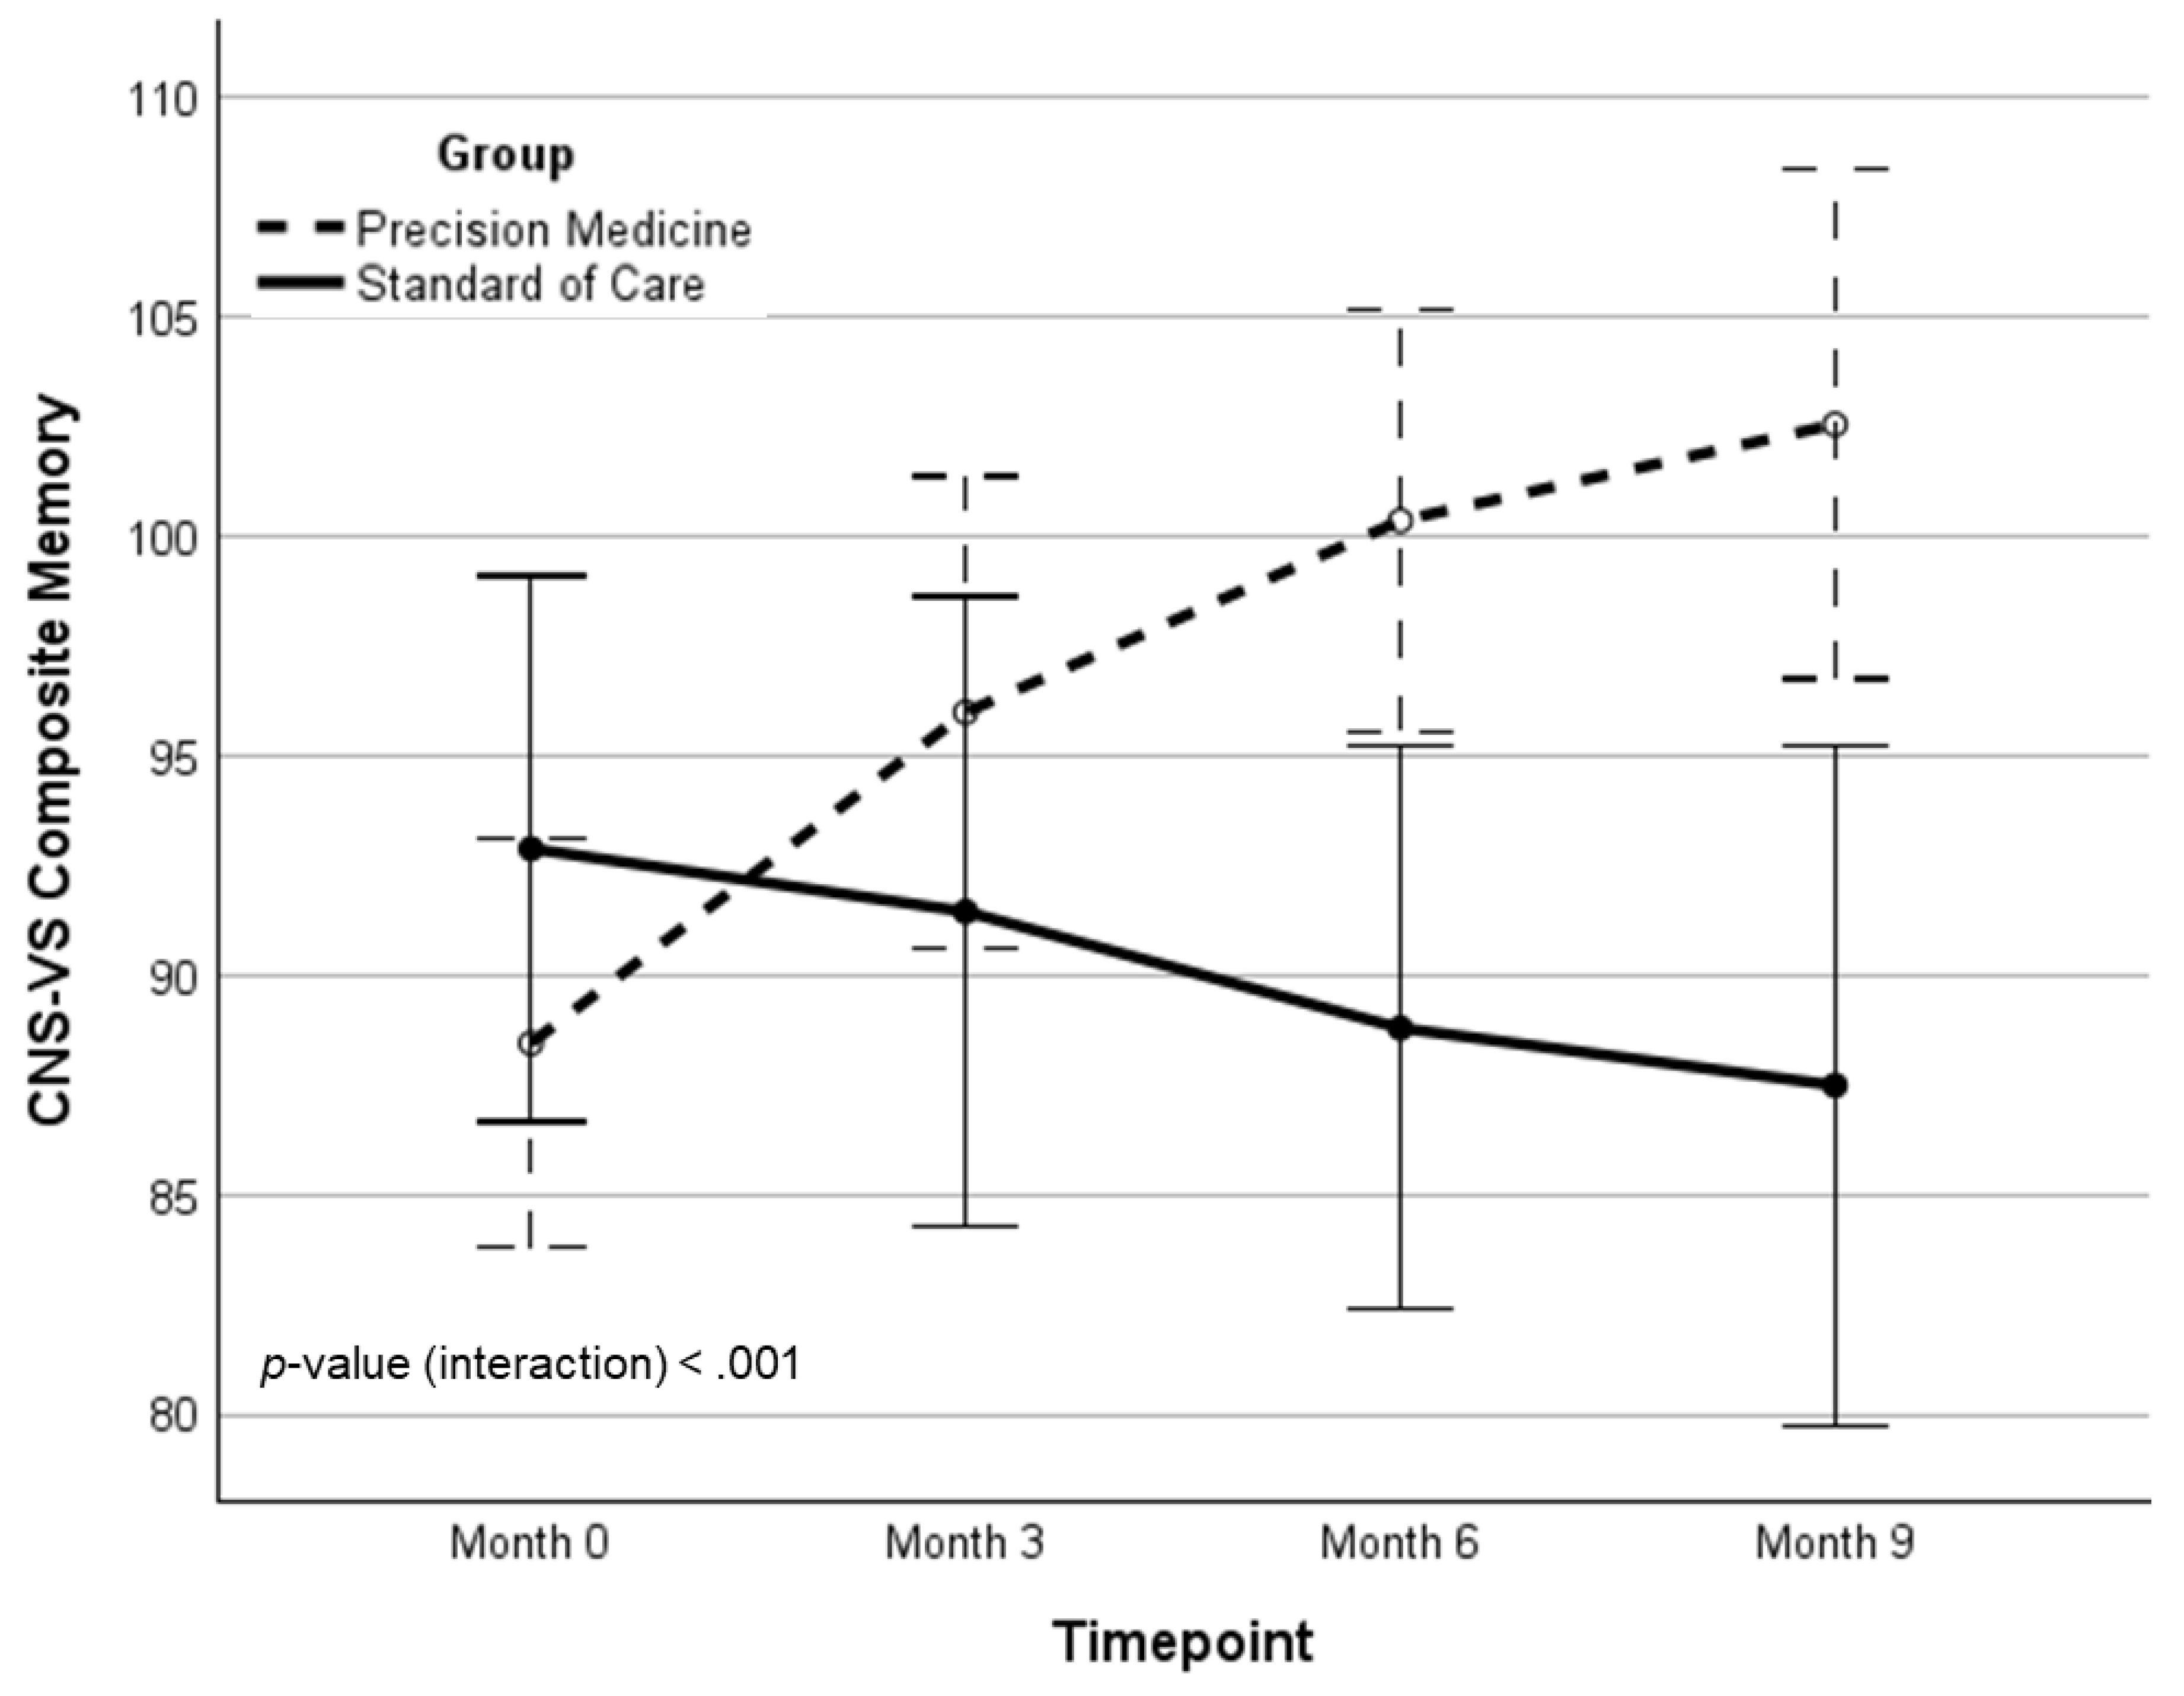
| CM | 89.45 (16.4) | 95.29 (17.3) | 100.38 (15.9) | 101.56 (17.0) | 13.12 (0.73)‡ | 18.51 (0.94)‡ | 17.92 | <.001 | .224 | |
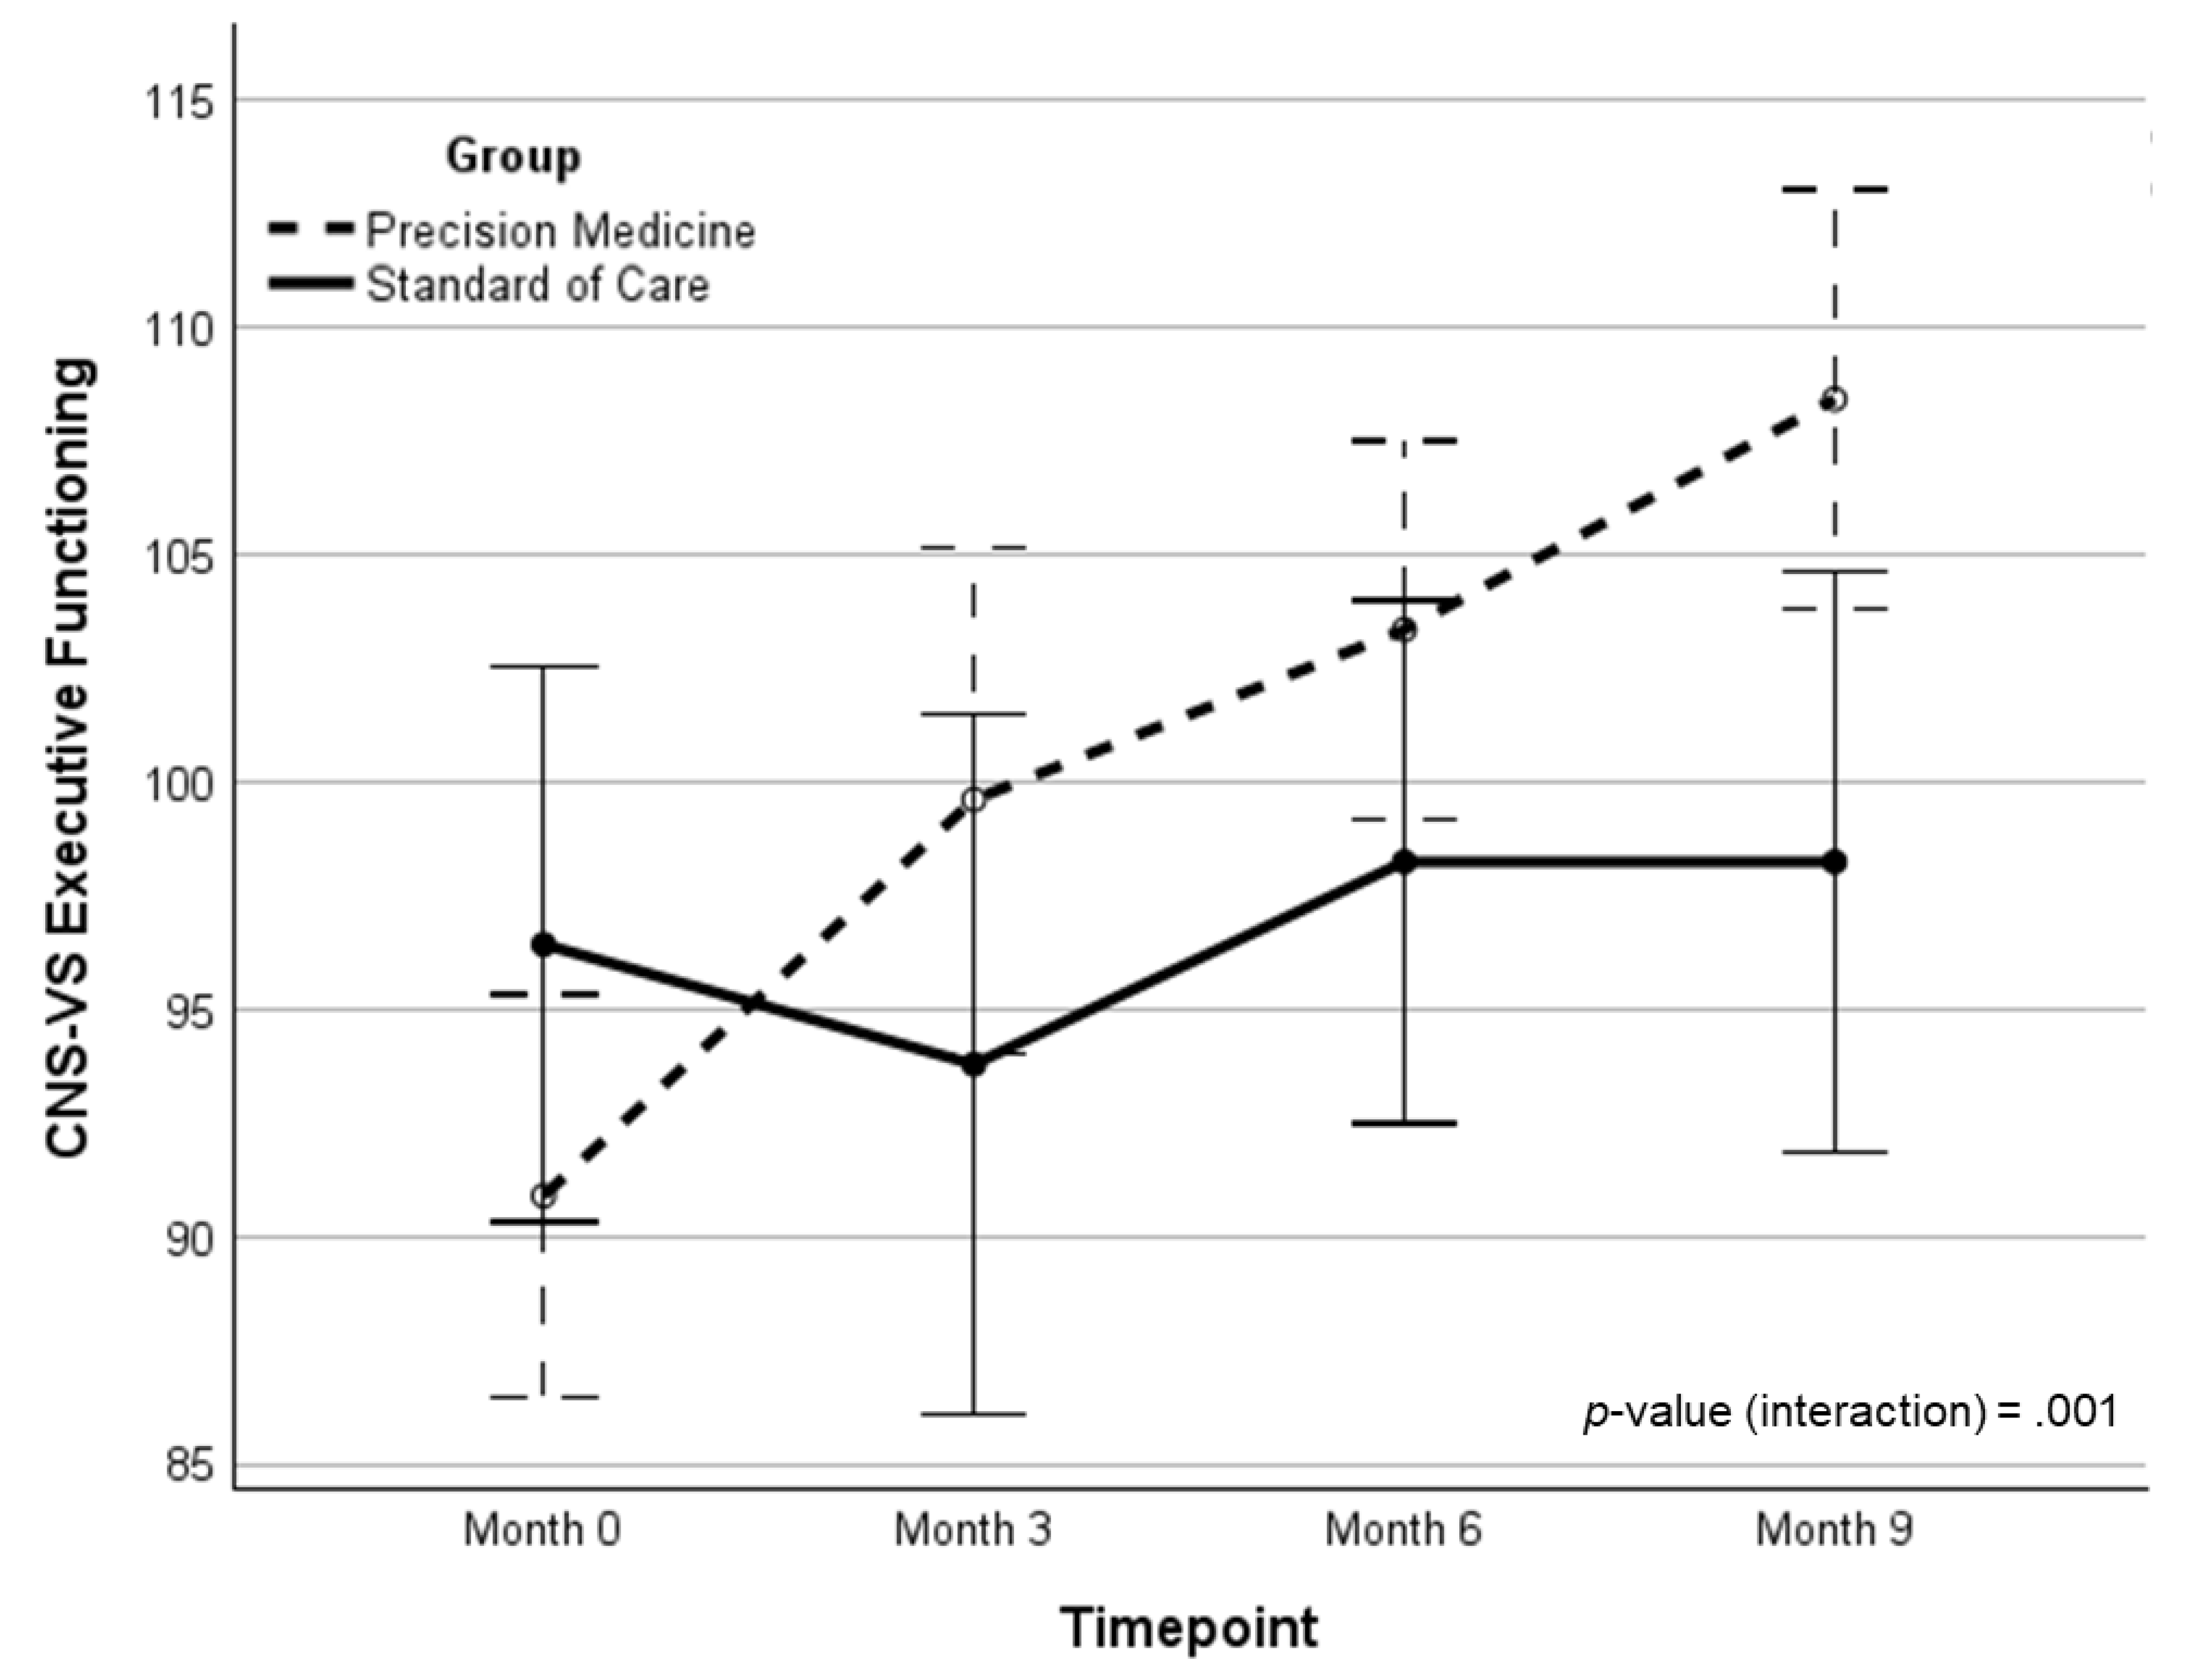
| EF | 90.63 (16.0) | 99.13 (15.6) | 103.16 (13.2) | 108.02 (10.8) | 16.86 (1.19)‡ | 15.04 (0.89)‡ | 11.25 | .001 | .154 | |
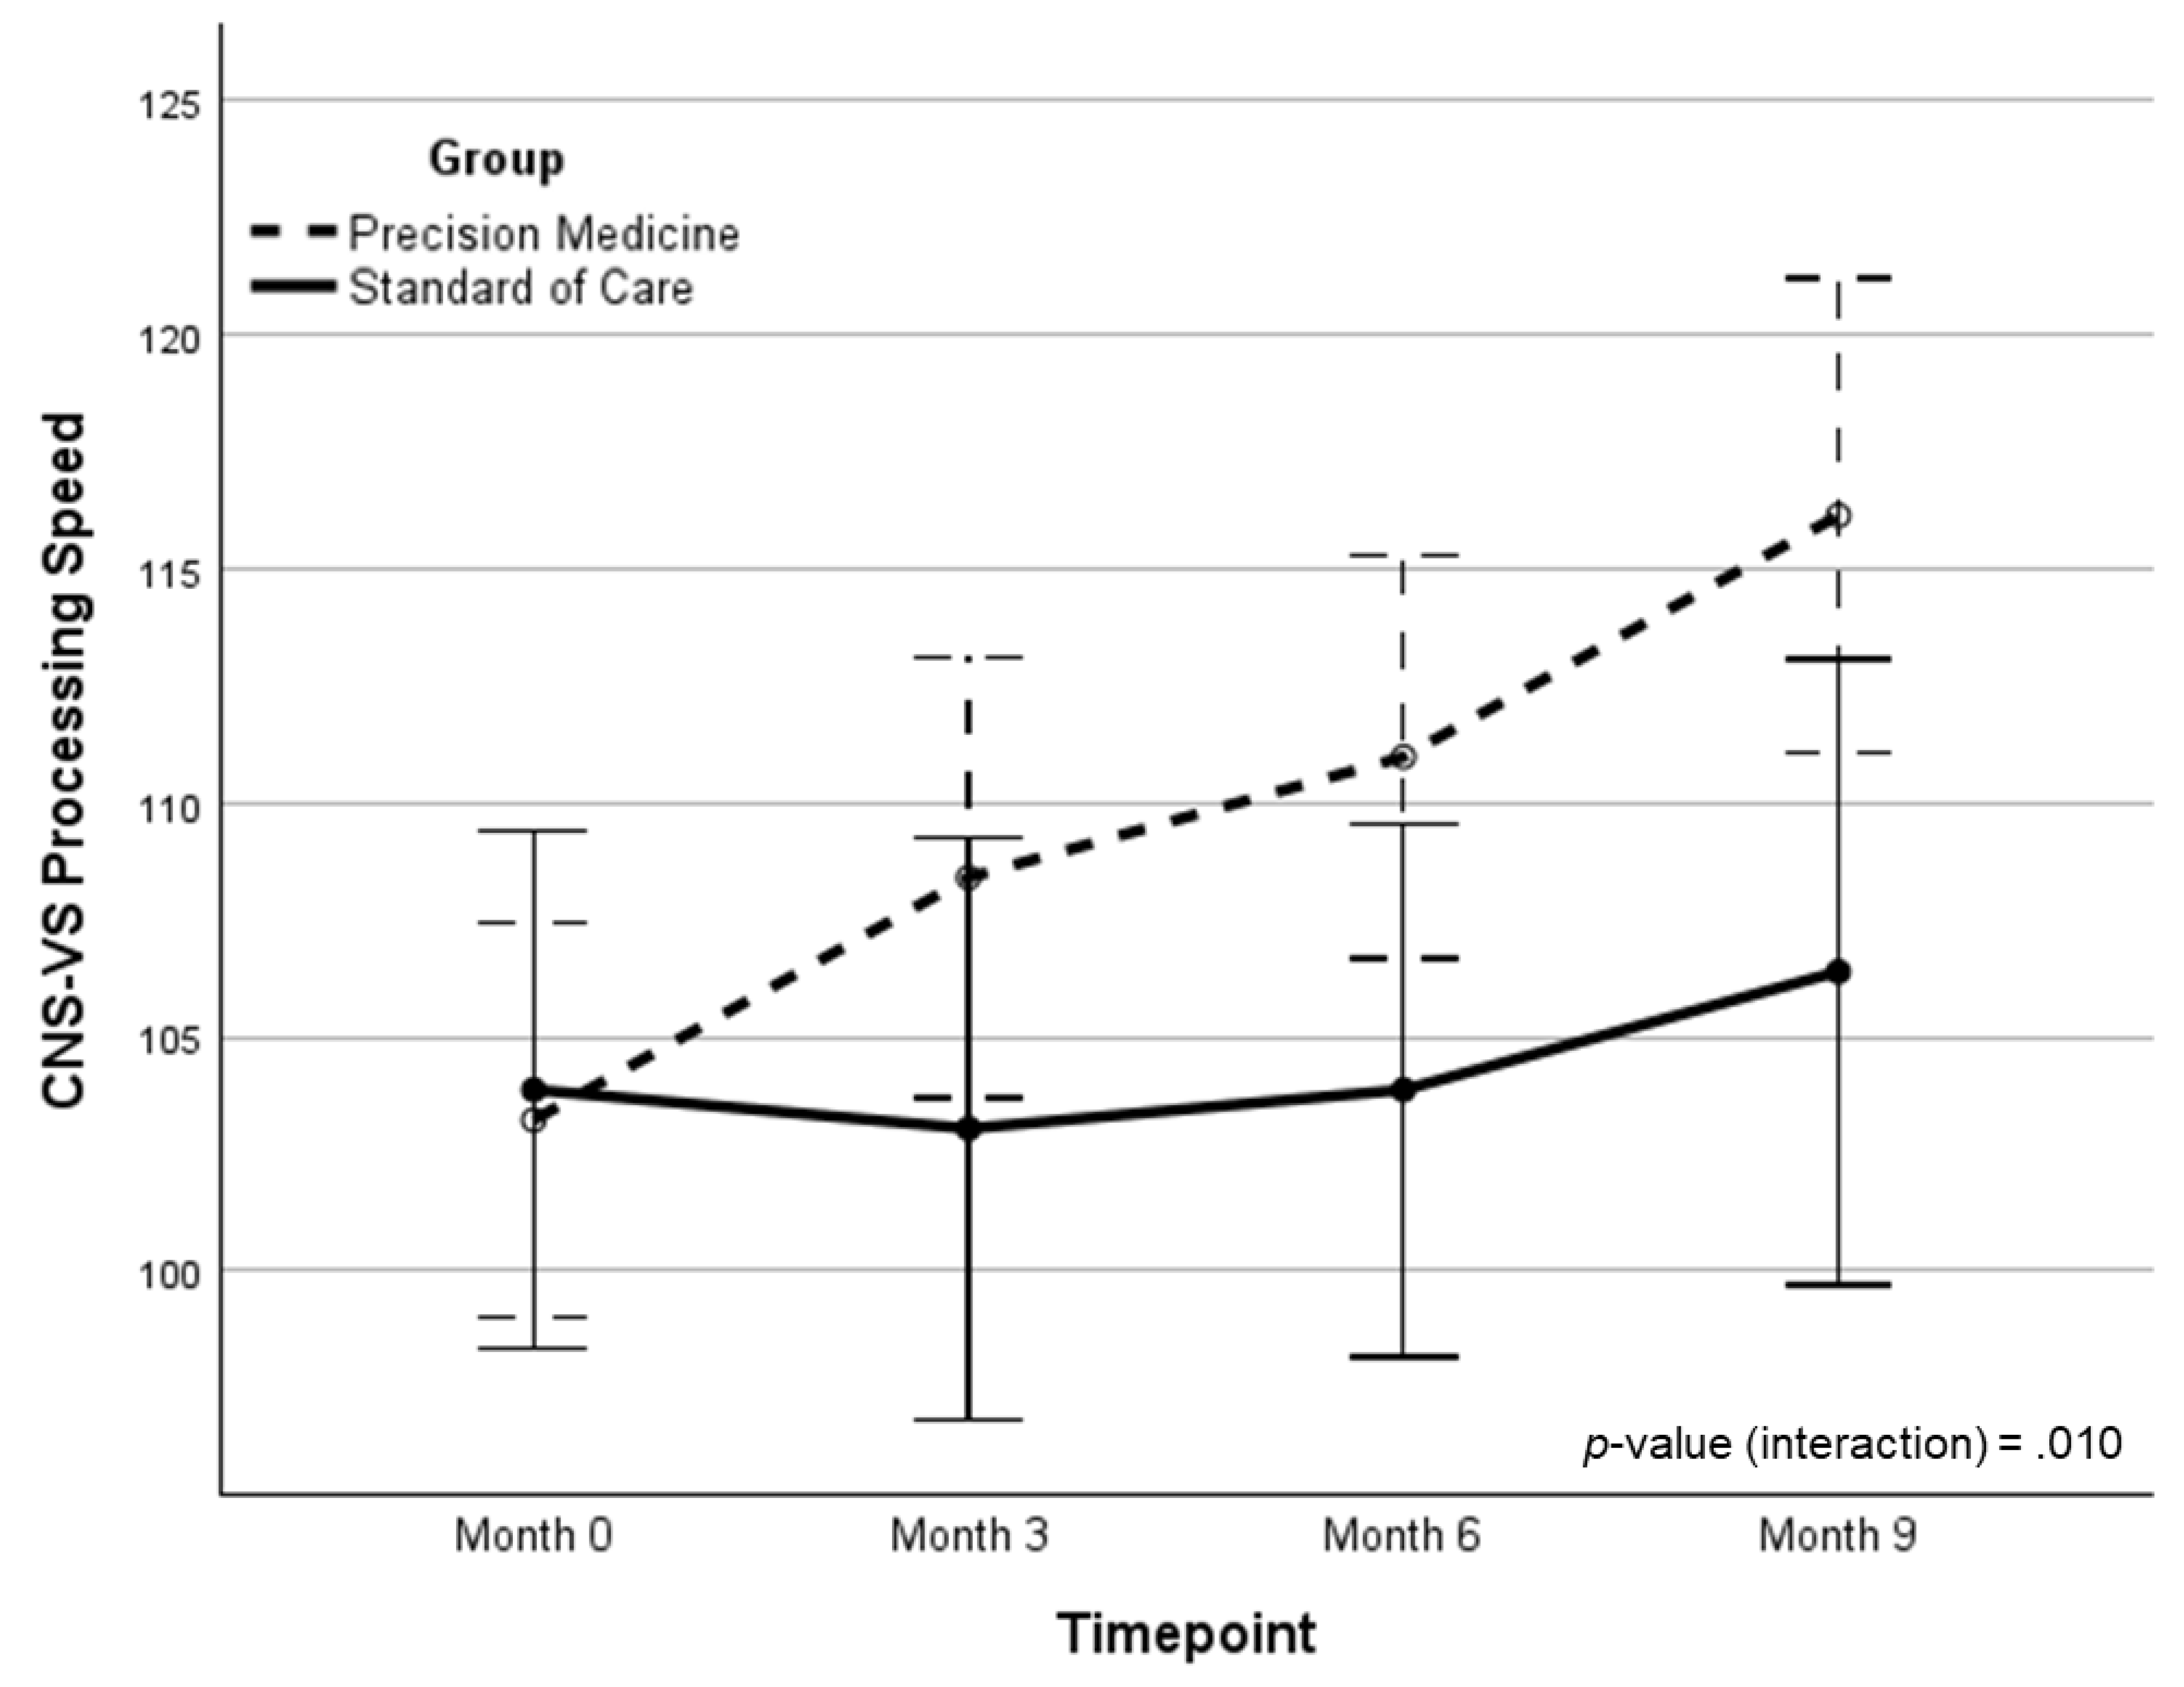
| PS | 103.5 (13.0) | 107.6 (16.0) | 111.0 (13.3) | 116.1 (15.7) | 12.26 (0.85)‡ | 9.74 (0.67)† | 6.98 | .010 | .103 | |
| BrainHQ | 33.1 (10.9) | -- | -- | 58.2 (20.5) | 25.15 (1.27)‡ | 14.8 (0.75)‡ | 6.98 | .011 | .111 | |
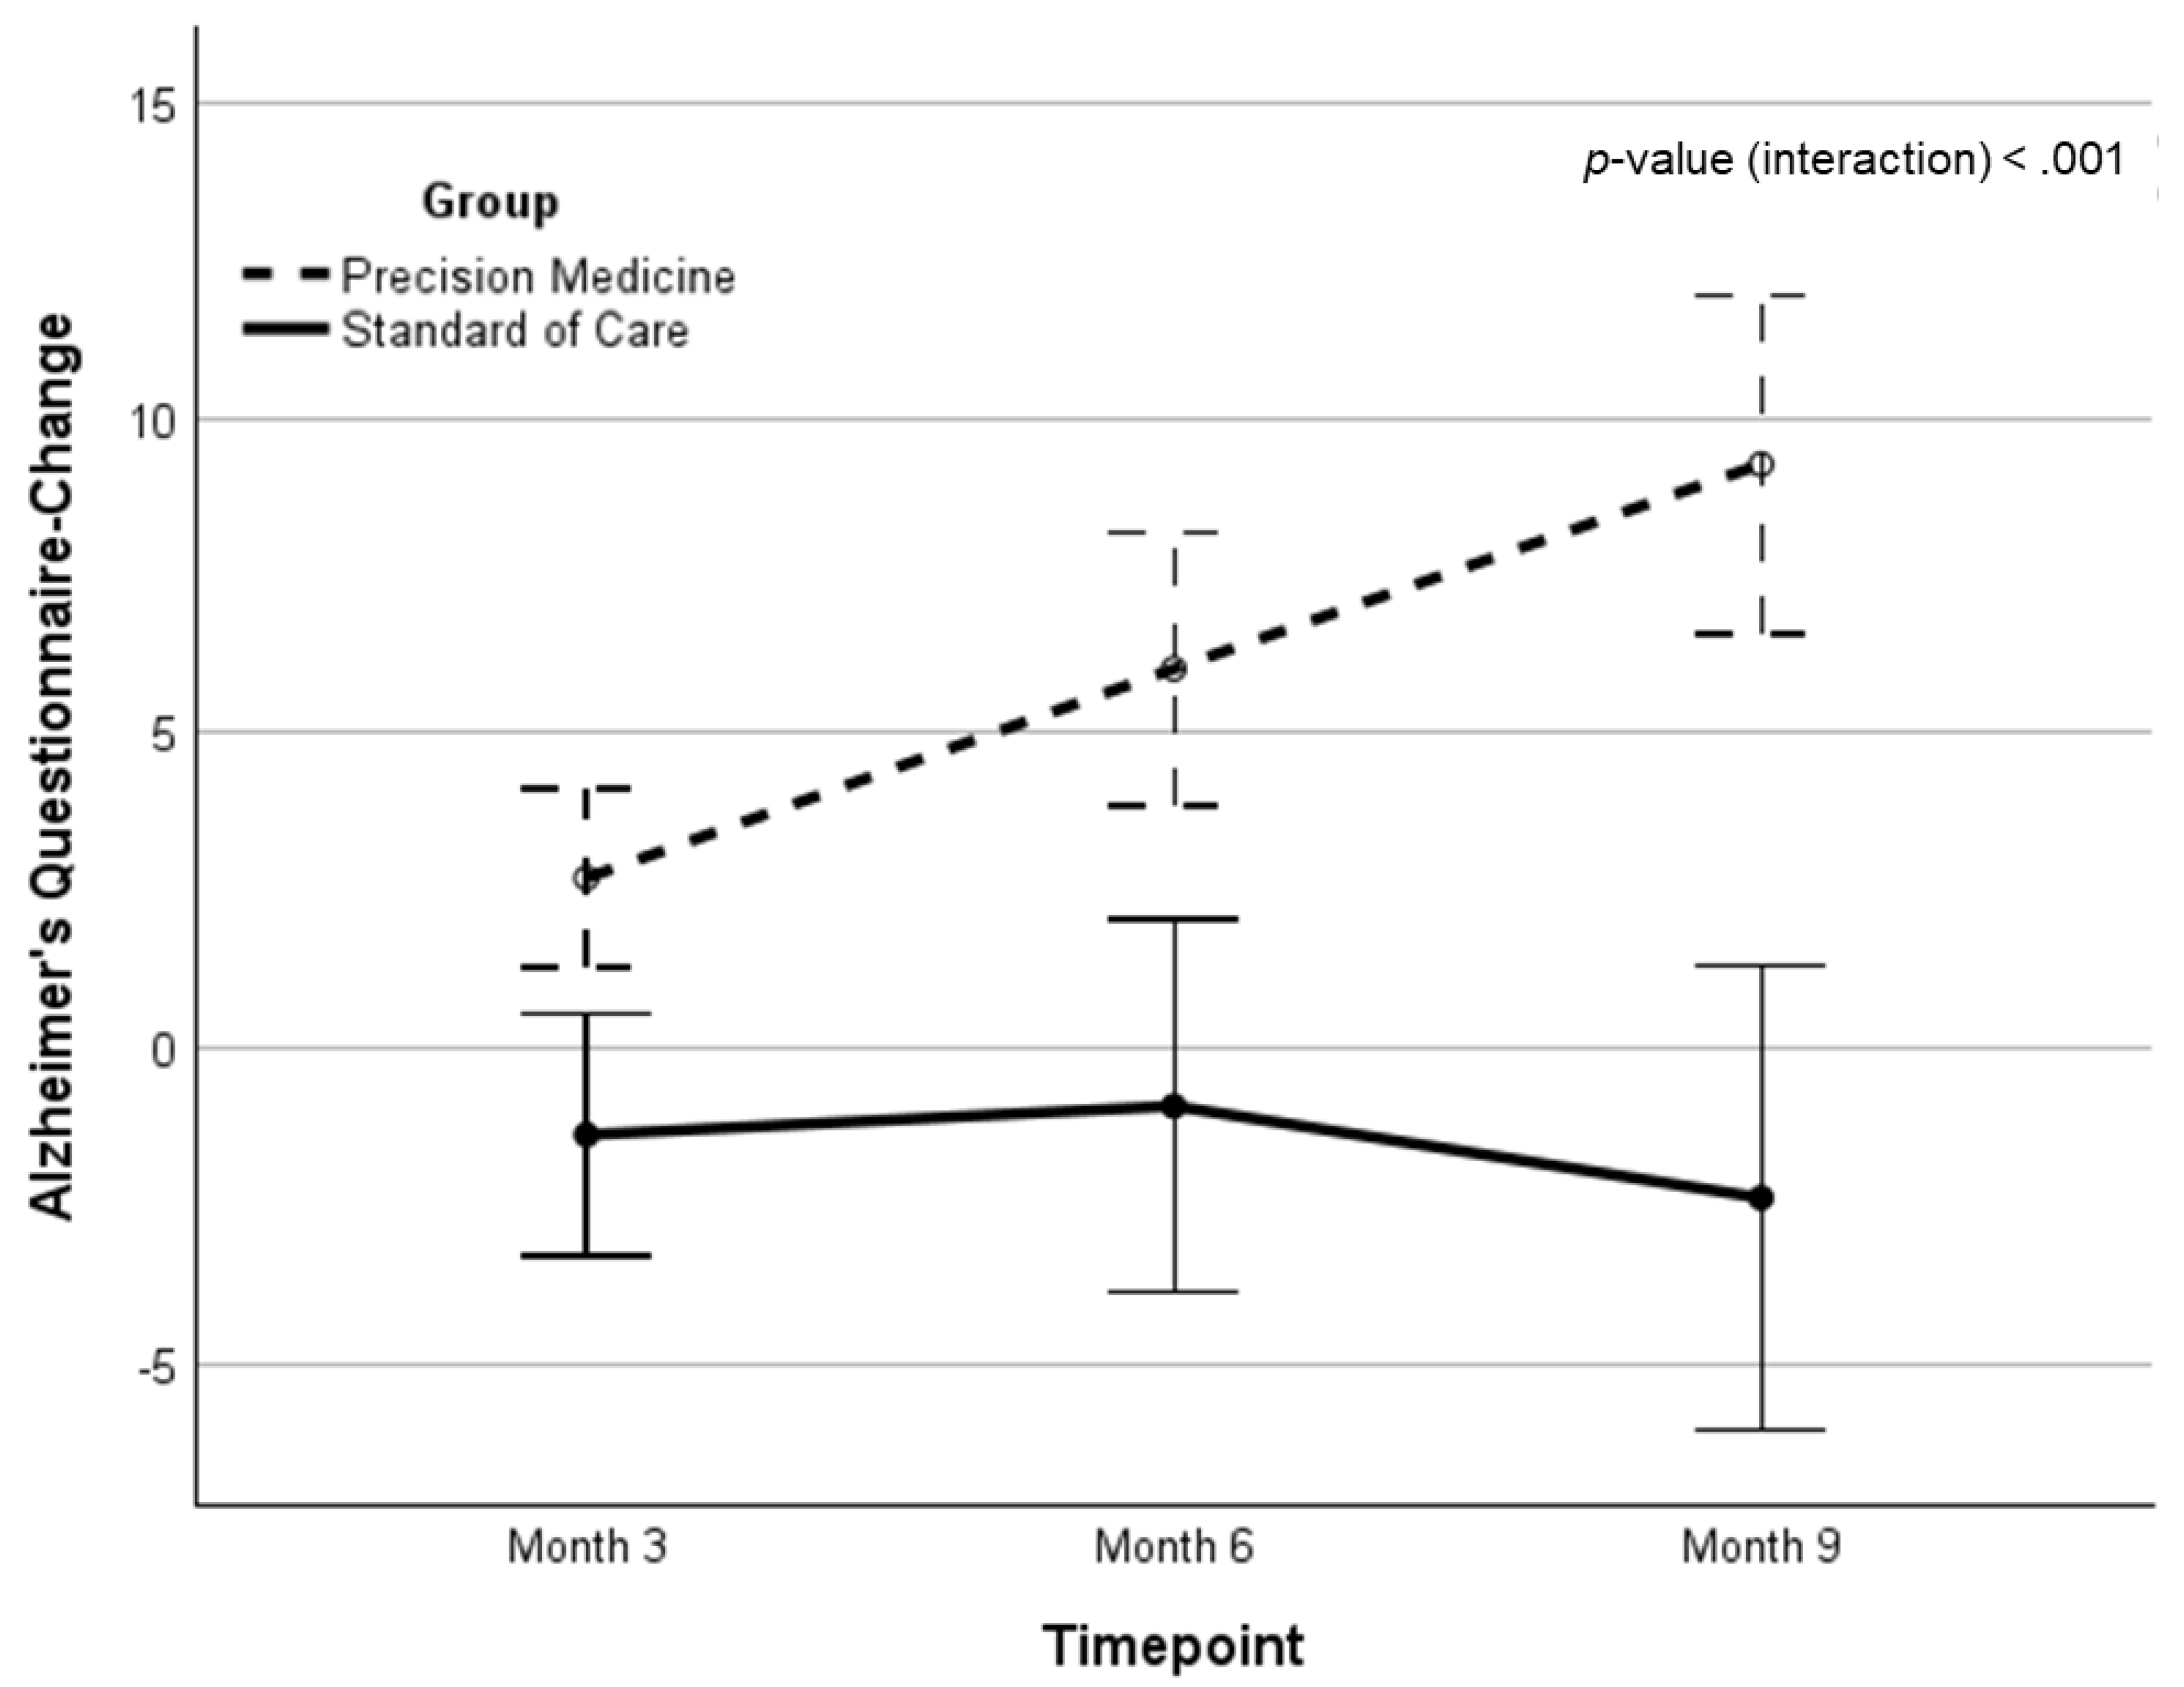
| AQ* | 10.46 (3.3) | 2.70 (5.1) | 5.93 (7.3) | 8.74 (10.4) | 8.74 (10.4)** | 11.11 (1.26)‡ | 16.34 | <.001 | .211 | |
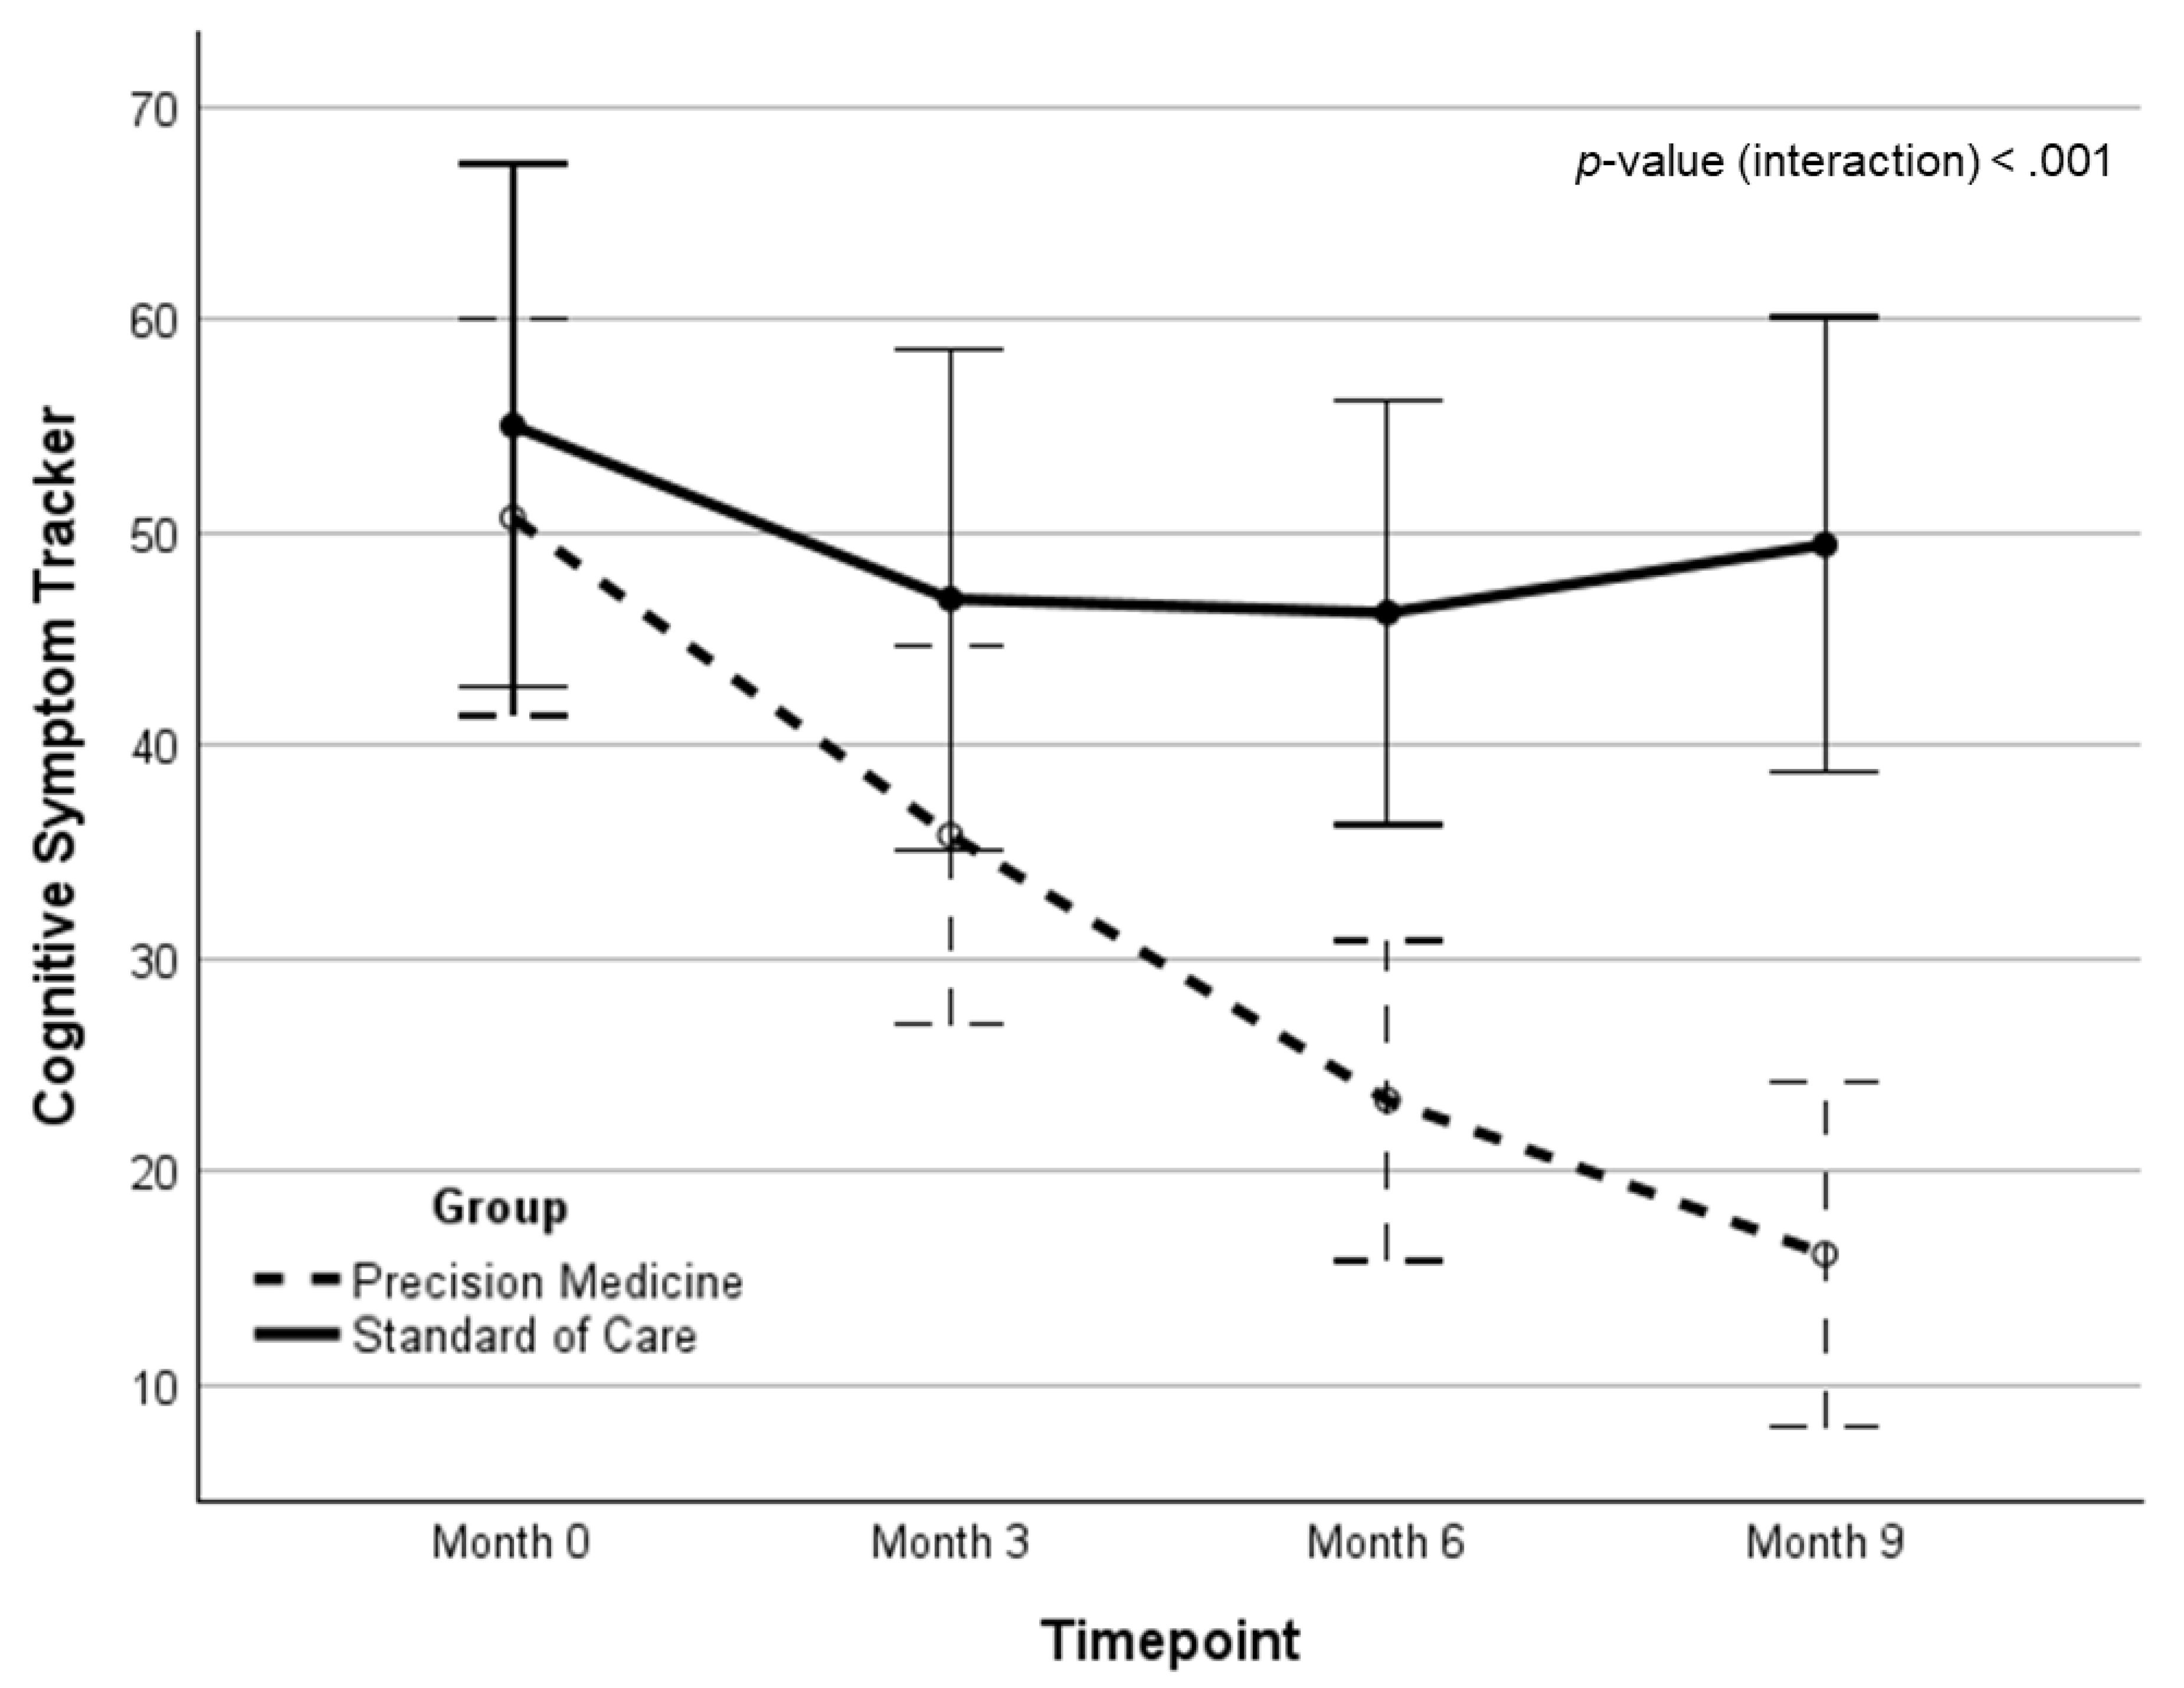
| CST | 47.57 (28.4) | 36.79 (26.4) | 24.84 (22.6) | 16.35 (21.4) | -33.27 (-1.19)‡ | -28.27 (-1.05)‡ | 15.94 | <.001 | .231 | |
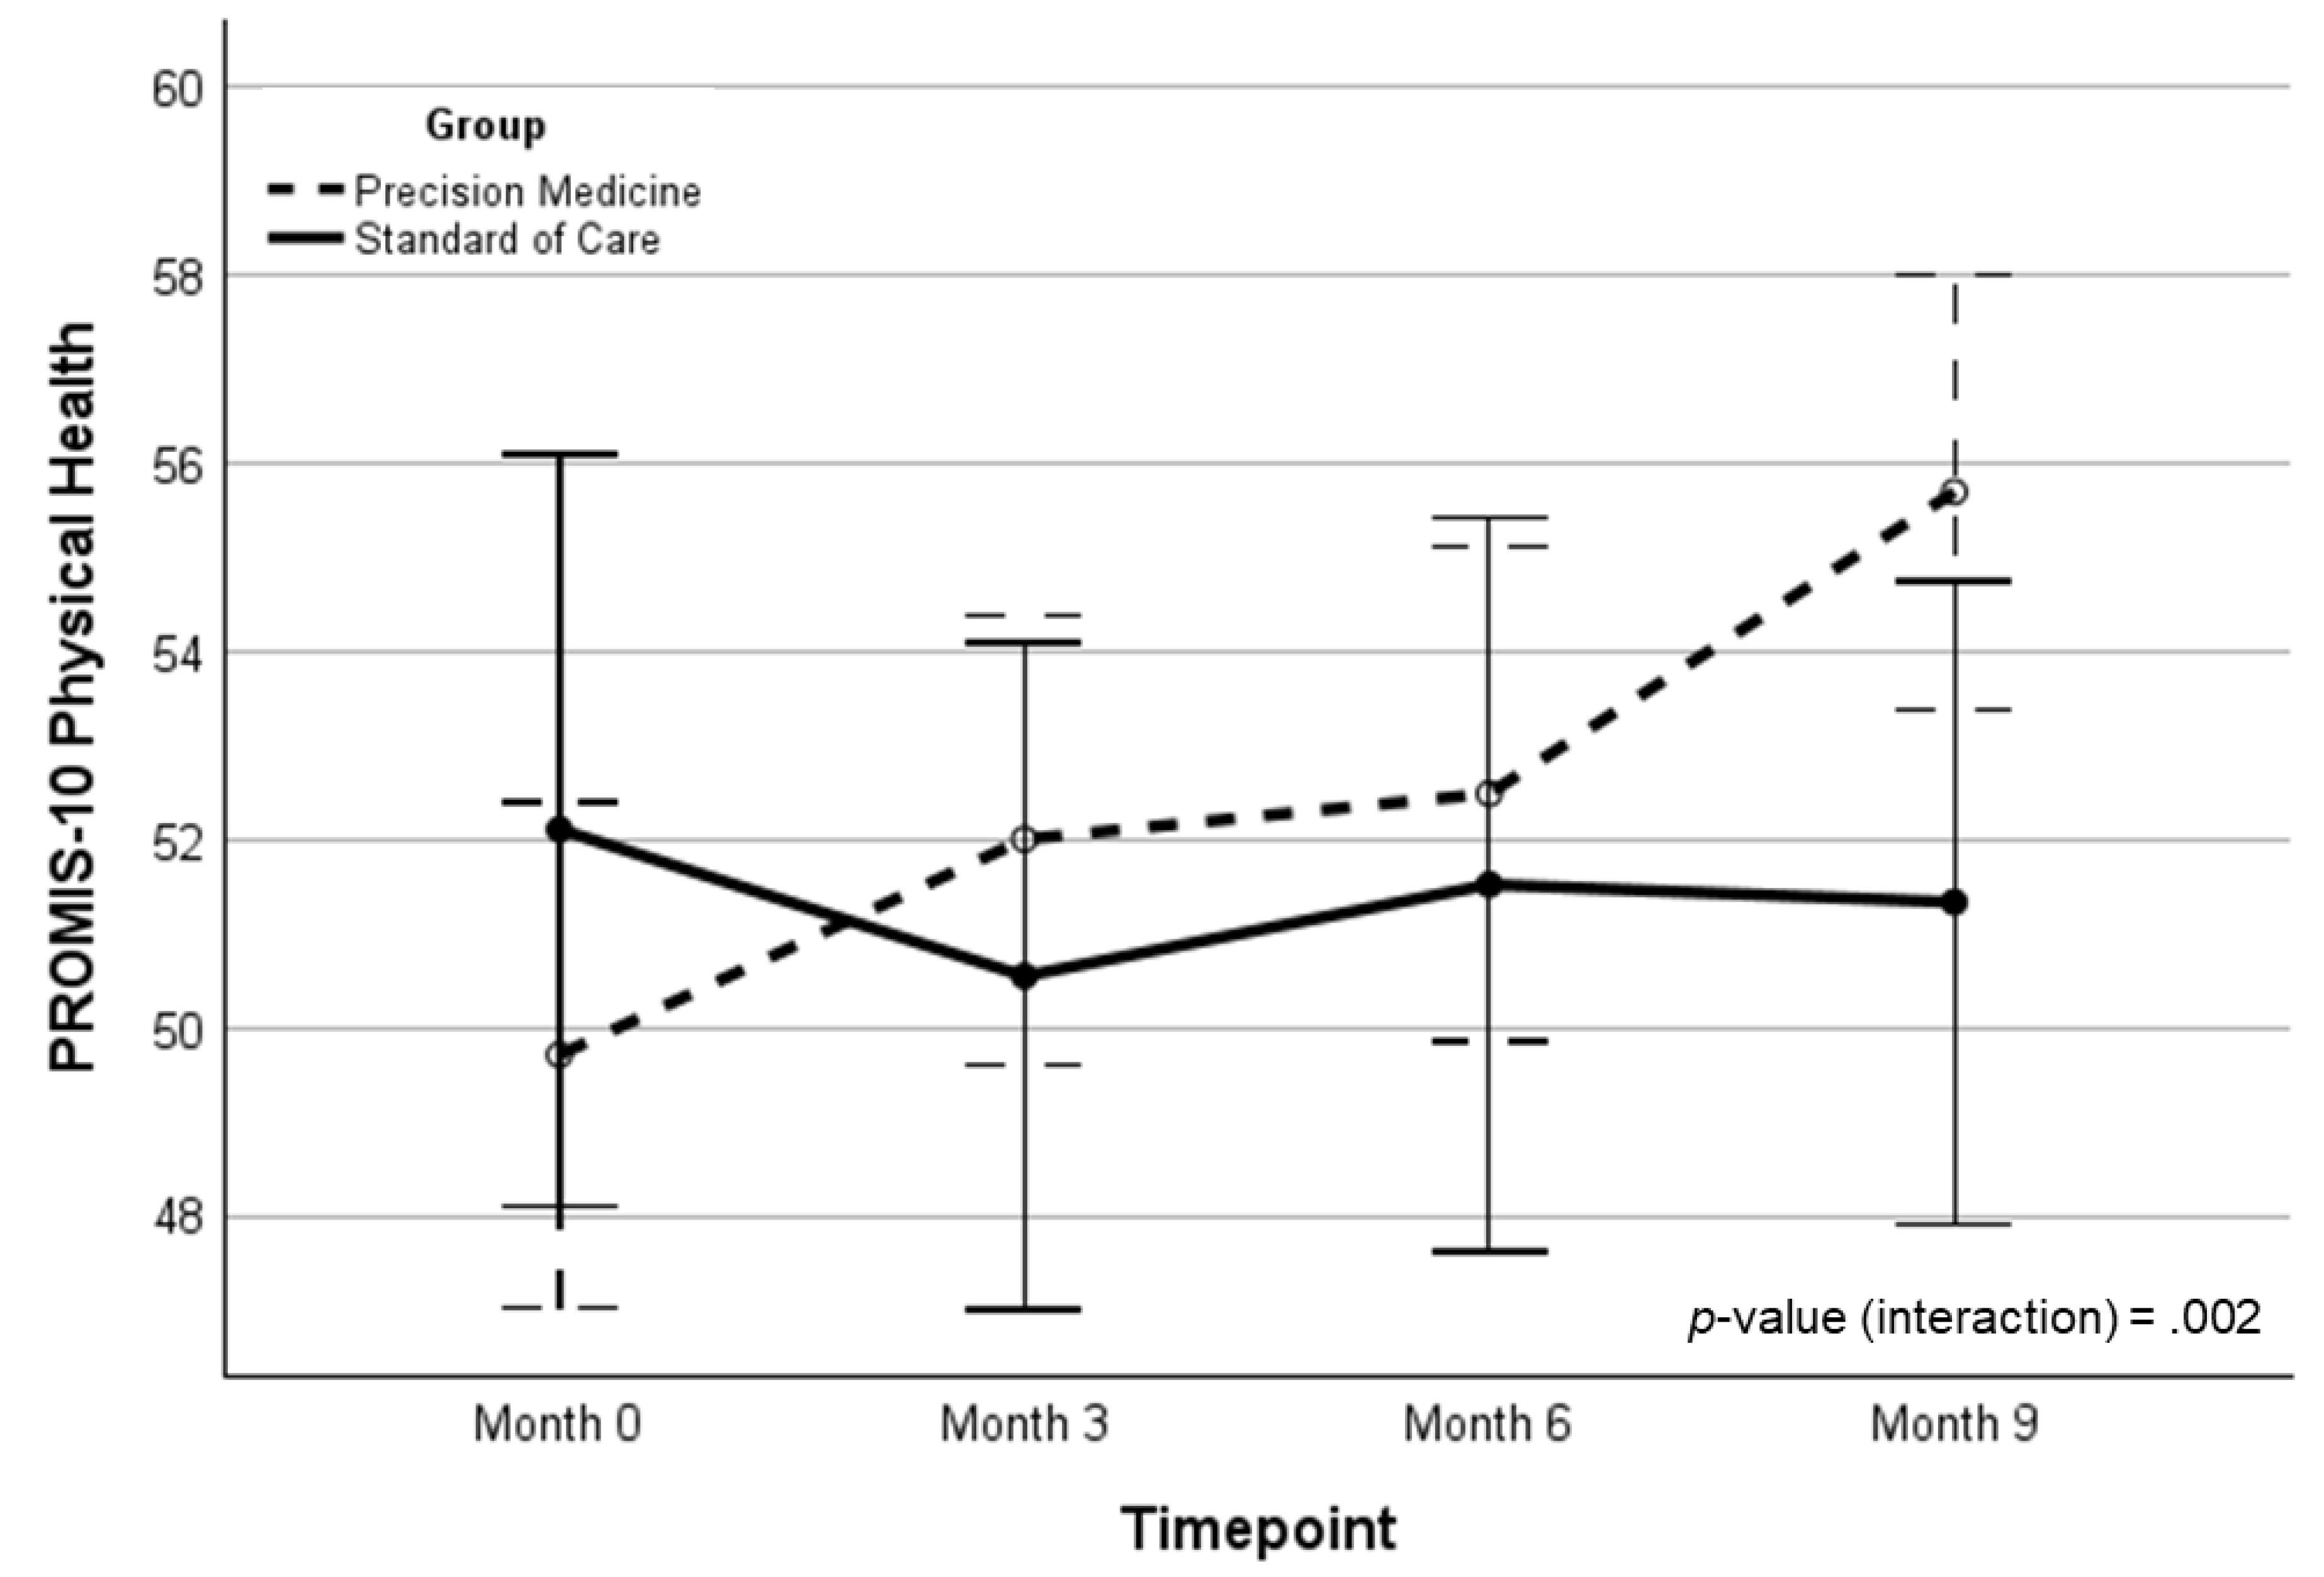
| PROMIS-P | 49.1 (8.5) | 51.7 (6.5) | 52.8 (6.0) | 55.1 (6.1) | 5.36 (0.77)‡ | 5.25 (0.77)‡ | 11.02 | .002 | .193 | |
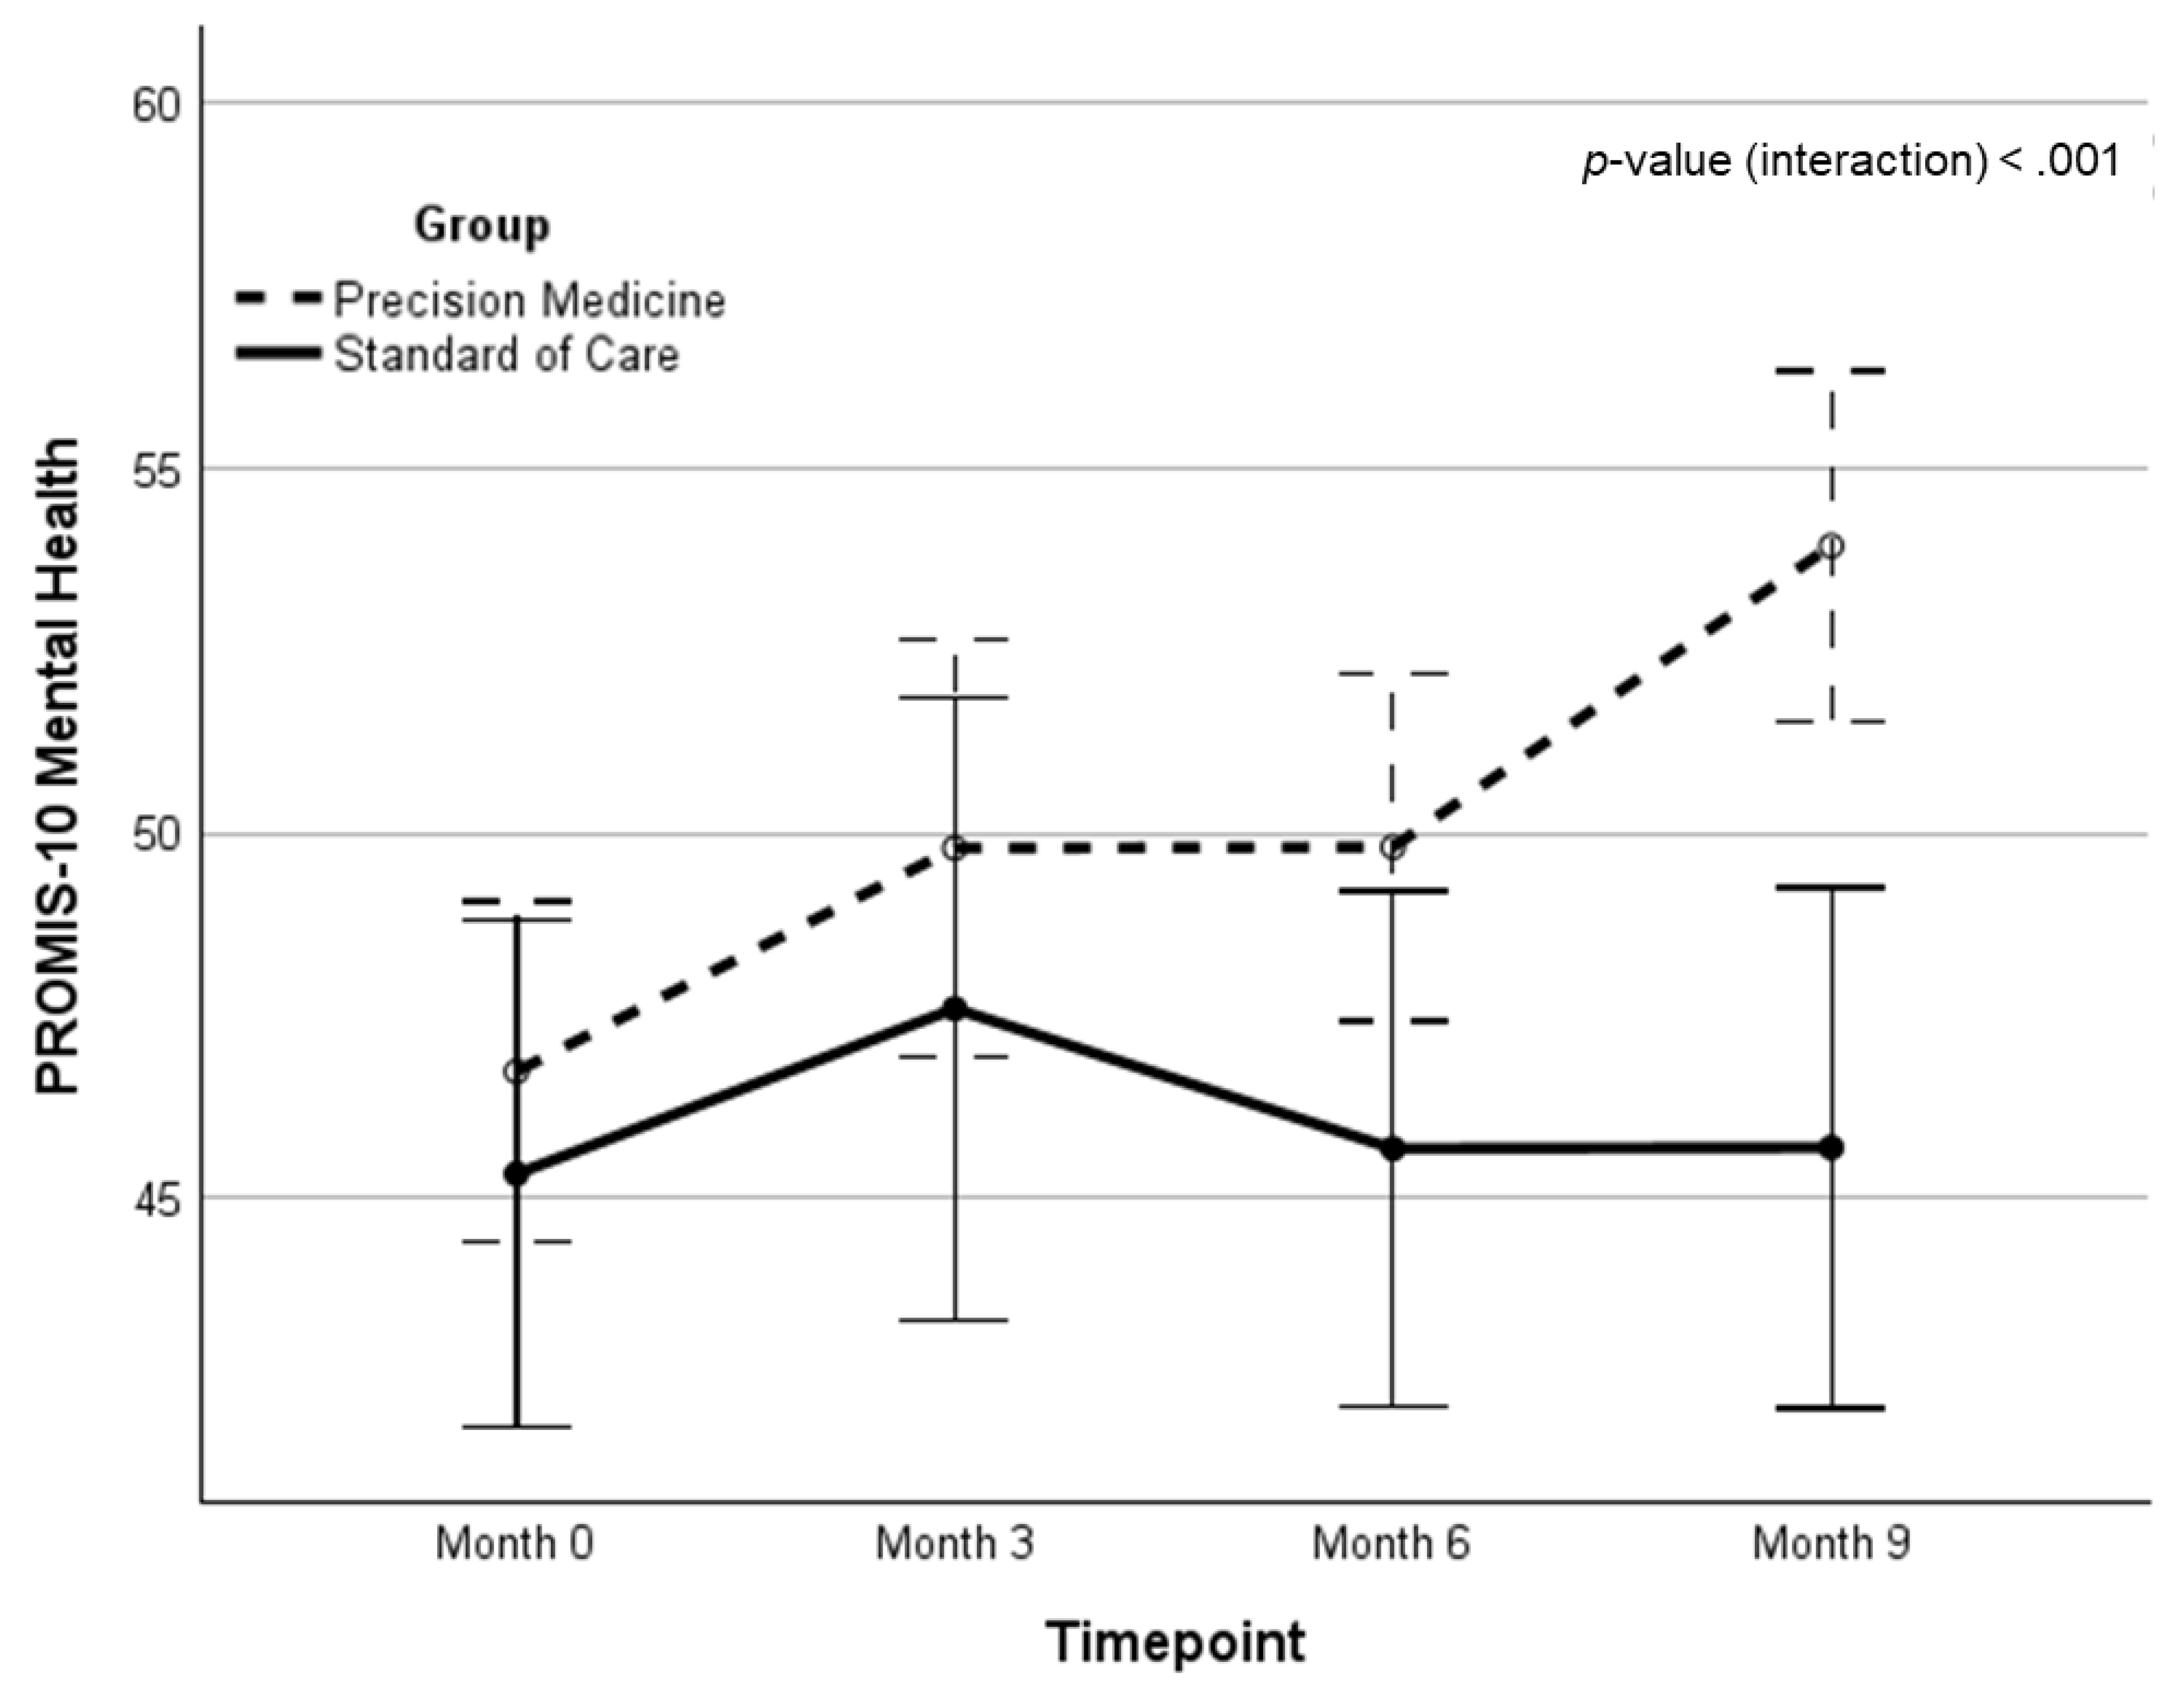
| PROMIS-M | 46.5 (8.1) | 49.4 (8.5) | 50.2 (6.4) | 54.1 (6.3) | 6.70 (0.93)‡ | 6.35 (0.97)‡ | 12.41 | <.001 | .212 | |
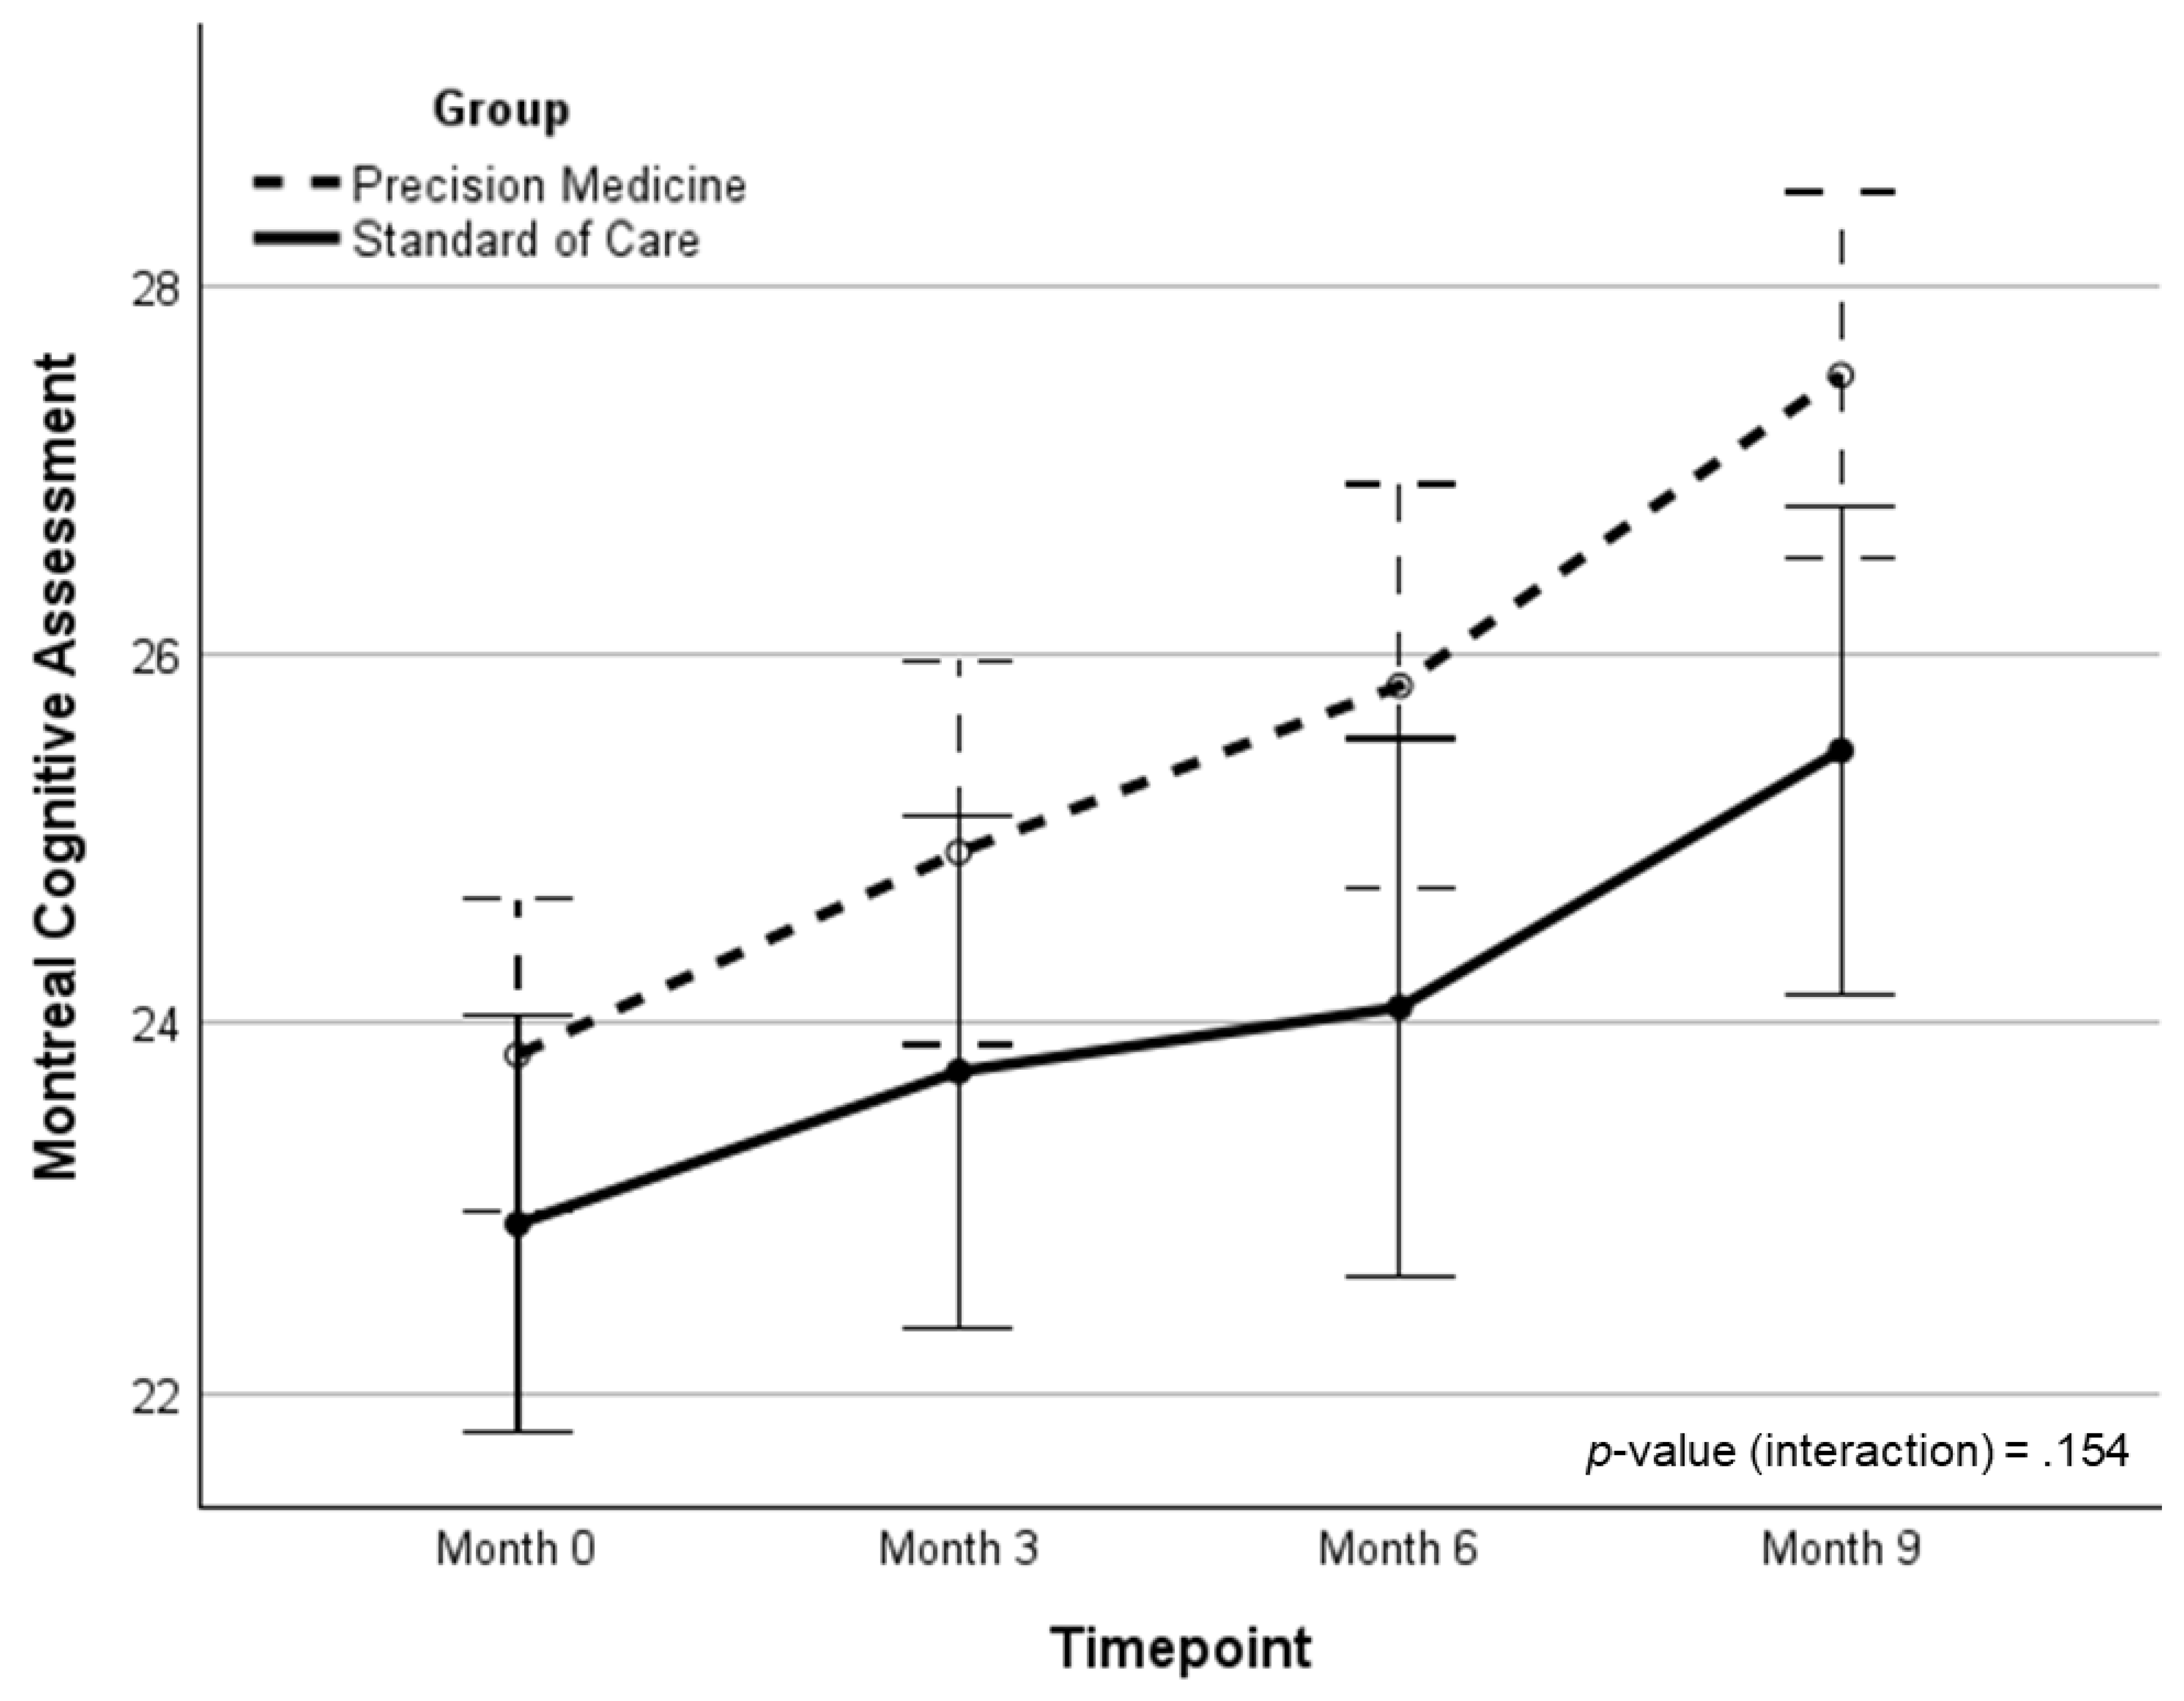
| MoCA | 24.0 (2.4) | 25.1 (3.2) | 25.8 (3.1) | 27.6 (2.5) | 3.79 (1.52)‡ | 1.23 (0.41) | 2.08 | .154 | .032 | |
| Standard of care | NCI | 96.91 (6.7) | 95.74 (13.6) | 96.09 (11.9) | 92.35 (24.2) | -4.36 (-0.19) | -- | -- | -- | -- |
| CM | 92.87 (14.1) | 91.43 (17.8) | 88.78 (14.1) | 87.48 (22.0) | -5.39 (-0.24) | -- | -- | -- | -- | |
| EF | 96.41 (10.1) | 93.04 (21.5) | 97.83 (13.7) | 97.74 (20.7) | 1.82 (0.09) | -- | -- | -- | -- | |
| PS | 103.9 (11.9) | 103.0 (13.0) | 103.9 (13.6) | 106.4 (16.1) | 2.52 (0.17) | -- | -- | -- | -- | |
| BrainHQ | 33.1 (10.4) | -- | -- | 42.4 (18.9) | 10.36 (0.54)† | -- | -- | -- | -- | |
| AQ* | 9.52 (3.2) | -1.30 (2.4) | -0.87 (5.7) | -2.36 (4.4) | -2.36 (4.4)** | -- | -- | -- | -- | |
| CST | 51.55 (26.9) | 48.10 (25.4) | 46.18 (21.2) | 46.95 (25.8) | -5.00 (-0.20) | -- | -- | -- | -- | |
| PROMIS-P | 52.0 (8.2) | 50.4 (6.8) | 51.4 (9.4) | 52.3 (7.5) | 0.11 (0.02) | -- | -- | -- | -- | |
| PROMIS-M | 46.3 (5.8) | 47.5 (6.5) | 46.8 (6.5) | 46.4 (6.5) | 0.35 (0.07) | -- | -- | -- | -- | |
| MoCA | 22.91 (3.0) | 23.74 (3.5) | 24.09 (4.0) | 25.48 (4.0) | 2.57 (0.67)† | -- | -- | -- | -- | |
| Brain Region | Group A Increase | Group A Decrease | Group B Increase | Group B Decrease | p-value | Odds Ratio |
|---|---|---|---|---|---|---|
| Gray Matter | 20 | 20 | 7 | 15 | 0.167 | 2.12 |
| White Matter | 23 | 17 | 13 | 9 | 0.903 | 0.94 |
| Lateral Ventricles | 32 | 8 | 15 | 7 | 0.298 | 1.85 |
| Frontal Lobes | 19 | 21 | 5 | 17 | 0.055 | 3.02 |
| Temporal Lobes | 21 | 19 | 10 | 12 | 0.596 | 1.32 |
| Hippocampi | 23 | 17 | 12 | 10 | 0.822 | 1.13 |
| Parietal Lobes | 22 | 18 | 6 | 16 | 0.036 | 3.20 |
| Occipital Lobes | 25 | 15 | 11 | 11 | 0.340 | 1.65 |
| Cerebella | 27 | 13 | 10 | 12 | 0.090 | 2.45 |
| Variable | Mean A (%) | SD A (%) | Mean B (%) | SD B (%) | p-value (Wilcoxon) |
|---|---|---|---|---|---|
| Gray Matter Vol / mTIV (rate) | −2.59 | 9.83 | −1.30 | 7.52 | NS |
| White Matter Vol / mTIV (rate) | 0.026 | 19.9 | 0.868 | 6.47 | NS |
| Lateral Ventricle Vol / mTIV (rate) | 5.85 | 14.9 | 4.59 | 7.82 | NS |
| Frontal Lobe Vol / mTIV (rate) | −2.08 | 8.65 | −1.44 | 4.43 | NS |
| Temporal Lobe Vol /mTIV (rate) | −1.50 | 8.92 | −0.829 | 5.59 | NS |
| Hippocampus Vol / mTIV (rate) | −0.578 | 9.68 | 1.32 | 9.48 | NS |
| Parietal Lobe Vol / mTIV (rate) | −1.60 | 7.59 | 0.311 | 6.33 | NS |
| Occipital Lobe Vol / mTIV (rate) | −0.237 | 12.3 | 0.499 | 7.56 | NS |
| Cerebellum Vol / mTIV (rate) | 1.46 | 4.24 | 0.215 | 3.36 | NS |
Disclaimer/Publisher’s Note: The statements, opinions and data contained in all publications are solely those of the individual author(s) and contributor(s) and not of MDPI and/or the editor(s). MDPI and/or the editor(s) disclaim responsibility for any injury to people or property resulting from any ideas, methods, instructions or products referred to in the content. |
© 2025 by the authors. Licensee MDPI, Basel, Switzerland. This article is an open access article distributed under the terms and conditions of the Creative Commons Attribution (CC BY) license (http://creativecommons.org/licenses/by/4.0/).


