
Submitted:
29 December 2025
Posted:
30 December 2025
You are already at the latest version
Abstract
Background/Objectives: Latinos are approximately 1.5 times more likely to develop Alzheimer’s disease (AD) than non-Hispanic populations, with contributing factors including genetics, lifestyle, and cultural values such as familism. Favorable lifestyle behaviors and strong familism have been linked to reduced disease risk. This study examined the relationships among familism, APOE gene, and lifestyle with to cogni-tive function in a Latino population.
Methods: Latino participants aged 45–96 years from the Rio Grande Valley (RGV), Texas, were recruited. Data on demographics, medical and family history, lifestyle, cognitive function, and familism were collected. Multivariable regression models were applied to evaluate associations among these variables.
Results: A high prevalence of cognitive impairment was observed in this population. Familism—Factor 4—was significantly associated with cognitive impairment (p = 0.038). The APOE ε4 allele was significantly associated with AD. Both AD and mild cognitive impairment (MCI) were associated with lower physical activity, older age, and lower educational attainment.
Conclusions: This study highlights the elevated prevalence of AD and MCI in the RGV Latino population and, for the first time, identifies familism as a factor associated with cognitive function. Findings emphasize the need for culturally informed strategies to reduce cognitive health disparities in this underserved community.
Keywords:
alzheimerʹs disease
; familism and healthy lifestyle
; rio grande valley latino population
1. Introduction
According to the 2020 U.S. census, clinical Alzheimer’s disease (AD) affects 11.3% of individuals aged 65 and older. It is estimated that as of 2024, 6.9 million Americans aged 65 and older have AD. For Latino Americans, AD rates rise to 14%. By 2060, Latinos are expected to face the largest increase in AD [1]. Latinos face an elevated risk of developing AD and at an earlier age, experiencing symptoms onset 6.8 years earlier than non-Latino Whites [2]. A growing body of evidence suggests that the epidemiology and biology of cognitive changes in the Latino population, like Mexican Americans (MAs), differ from those observed in other ethnic groups. MAs tend to be younger (around the age of 45) at the age of diagnosis compared to other ethnic groups[3], including a study conducted in Cameron County, Texas [4].
Although the exact cause of AD remains unclear, AD is influenced by complex interactions between genetics (e.g., AD-associated APOE gene) and environmental factors (e.g., cultural values, or lifestyle).[5] Certain genes have been identified as increasing or decreasing the risk of AD. Individuals with the APOE-ε4 allele, for instance, are at a higher risk than those carrying the ε3 allele, while the ε2 allele is linked to a lower risk [6]. Various genome wide association’s (GWA) meta-analysis and candidate gene studies [7,8,9] suggested that the several genes are at-risk for developing AD [10] in non-Latino populations.
Certain lifestyle choices can increase or decrease the risk of developing AD and impact on one’s overall general health. Lifestyle factors include, but are not limited to, physical activity, dietary habits, sleep patterns, stress levels, social interactions, mental stimulation, educational attainment, and habits such as smoking and alcohol consumption[11,12,13]. Each element can be modified to reduce the risk of cognitive impairment. It is important to note that these lifestyle choices are not made in isolation. Instead, they are shaped by a complex interplay of cultural, social, and economic factors. Furthermore, certain medical conditions including hypertension, diabetes, and high cholesterol, particularly in mid-life can increase AD risk. Other conditions such as obesity, depression, and poor hearing can also raise the likelihood of developing AD and serious head injuries or trauma, especially those involving loss of consciousness. Significance of better lifestyle choices as potential protective factors for AD, has been well established in non-Latino populations (diet and physical activity)[14,15]. However, limited studies conducted among Latino population[16,17].
In addition to healthy lifestyle choices, familism [18], one of cultural values, also serve as a potential protective factor for cognitive impairment. Familism, a cultural value, places high emphasis on the family unit in terms of respect, support, loyalty, and obligation. Familism (familismo) refers to norms prioritizing strong, supportive family bonds and the family as a central reference for decisions and obligations in many Latino communities. The construction was first operationalized by Steidel et al. (2003) [18] in an 18-item scale with four domains— familial support, familial interconnectedness, familial honor, and subjugation of self for family. At the population level, the Latino American cultural values provide familism, strengthening confidence in the construct’s validity for Latino populations and beyond. In traditional Latino cultures, familism holds a pivotal role [19] and serves as a protective resource, contributing to better health outcomes and aiding in disease prevention. In Latino, familism has also been implicated as a protective factor against mental health problems (e.g., depression [20], substance use [21], stress [22], smoking salient cessation interventions [23], eating disorder [24], cardiovascular traits [25], skin cancer [26], and diabetes [27]). High levels of familism in global regions enhance family empathy, flexibility, and communication, therefore, leading to improved health outcomes, and preventing AD/dementia in Colombians [28], Spanish population [29], heart health [25], and brain health in both older Latinos without AD [30] and Chinese population [31]. Familism is also inversely linked to tobacco/nicotine use in Latino population [32,33]. This value of familism is often more pronounced in immigrant communities, especially those from minorities, such as Latino and Asian backgrounds. The strength of familism among immigrant populations may play a significant role in the positive outcomes observed in the “Immigrant Paradox”. However, familism in association with AD impact may lack content validity among Hispanic groups. Cultural variation in how familism is expressed, as well as differences in measurement tools, may limit the extent to which these instruments capture the construct accurately. Therefore, further validation studies, like the current study, are needed to ensure that the measures reflect the lived experiences and health-related contexts of diverse Hispanic groups.
Amyloid plaques and tau tangles disrupt neuronal function; plaques block signaling, while abnormal tau forms tangles that destabilize microtubules. [34].
Recent studies have shown that different lifestyle choices, such as diet and exercise influence the pathophysiology of AD. Adherence to specific dietary patterns, such as Mediterranean and Okinawa Japan diets, has been linked to decreased rate of Aꞵ accumulation. In a similar manner, those individuals that are more active, a lower level of Aꞵ accumulation can be observed. The way diet and exercise interfere in the pathway is still unclear. However, it is believed that exercise may inhibit the processing of APP, resulting in the absence of Aꞵ accumulation [35].
In addition to familism, lifestyles, Genome Wide Association’s (GWA) meta-analysis, genomic sequence and candidate gene studies[7,8,9] suggested that the several genes, including APOE-ε4 allele, are at-risk for developing AD[36], as well as population-specific variants including a recent large-scale multi-omics analysis in Latino population[37,38]. Mounting evidence also suggests that Latinos, nearly one-fifth of the US population, are less likely to carry an APOE-ε4 allele and have less risk for AD due to the ε4 allele compared to other populations such as non-Hispanic Whites[39,40] Moreover, educational attainment is one of the most important modifiable determinants of cognitive function [41].
Cognitive impairment is a multifactorial disorder, and increasing evidence suggests that lifestyle choices, cultural values such as familism, genetics, and their interactions may influence cognitive function in non-Latino populations. However, lack of study of those factors involved in cognitive function in the underserved population, RGV Latino population. Therefore, the explicit hypothesis includes that higher levels of familism, better lifestyle choice and protective gene/allele are associated with a lower risk of developing mild cognitive impairment (MCI) and AD among the Latino population in the RGV. We aim to explore how genetic risk (e.g., APOE ε4) interacts with cultural and lifestyle factors in influencing the risk of MCI and AD among Latinos in the RGV. Understanding these interactions may help identify protective sociocultural factors that can buffer genetic risk in this underserved population
2. Materials and Methods
2.1. Material
The University of Texas Rio Grande Valley (UTRGV)- Institutional Review Board (UTRGV-IRB-19-0024, approved date of April 3, 2019) has evaluated and approved the study protocol. Our study spanned four recruitment centers (RGV clinics, adult day care centers, students’ families and Alzheimer's Disease Resource Center for Minority Aging Research, AD-RCMAR). Since late 2019, we have successfully recruited 423 of whom 333 subjects with completion of all 138 variables in our study (including APOE genotypes), even with challenges of the COVID-19 pandemic. Eligibility inclusion criteria included (1) ≥45 years of age (no upper limit). Participants with and without AD or MCI were able to understand the scope of the project and were willing to consent to the study; (2) all participants lived in the RGV. Participants who were unable to respond to familism or cognition-related questions due to moderate to severe conditions, alternative approaches were used to ensure their eligibility while maintaining ethical standards and data integrity, including a legally authorized representative (LAR), caregiver, or close family member were asked to respond on behalf of the participant. Exclusion criteria were the subjects who have a terminal illness and are younger than 45 years and are not Latino. If an individual expresses interest in participating in the study, an appointment is made from south Texas, such as Brownsville, Harlingen, and Edinburg areas. After signing the consent form (English and Spanish versions), participants were given an information booklet outlining the project's purpose. Then a short interview was conducted in which over 113 variables, encompassing demographics, lifestyle factors, medical history, familism, and cognitive scores were gathered.
Demographic questionnaires used the same standardized set of questions and were conducted by a well-trained PI and/or research assistants, who used either laptop computer/tablet or a hard copy of forms/questionnaires for an interview depending on participants’ preference. Medical history and diagnoses of chronic conditions were based on self-report.
Simple Lifestyle Indicator Questionnaire (SLIQ) was used to measure healthy behaviors as a previous study [42]. The SLIQ questionnaire consists of 12 questions with 5 components: diet (3 questions), activity (3 questions), alcohol consumption (3 questions), smoking (2 questions), and stress (1 question). The total score is categorized as unhealthy (0-4), intermediate (5-7) and healthy (8-10).
Familism: The Attitudinal Familism Scale, a scale ranging from 0 (strongly disagree) to 10 (strongly agree), was used to measure familism with 18 questions (F18) as a previous study [18]. A higher score indicates higher endorsement of familism and higher levels of agreement with familial obligations and family.
Montreal Cognitive Assessment (MoCA) [43] was used to measure cognitive function and diagnoses for AD and MCI. MoCA assesses seven cognitive domains, comprising short-term memory, visuospatial abilities, executive function, attention, concentration, working memory, and language. We defined cognitive categories as follows, based on Becker's criteria [44]: normal cognition as control group (MoCA score 26–30), MCI (MoCA score 20–25), and probable dementia or AD (MoCA score 0–19)[44].
All Instruments/Measures of demographics, familism and MoCA were completed by subject and research team members’ observation.
All questionnaires, including those on lifestyle, familism, MoCA, and consent forms, were available in both English and Spanish versions.
2.2. Method
Saliva samples were collected from participants using DNA Genotek kit (www.dnagenotek.com) for genomic analysis. DNA was extracted from these samples using Prep-It L2P reagent (Genotek, Ottawa) as utilized in our previous studies[45,46]. Genotyping was conducted using TaqMan Single Nucleotide Polymorphism (SNP) genotyping assay. All primers/probes were pre-designed by Thermo Fisher Scientific. The SNPs of APOE gene at positions 112 (rs429358) and 158 (rs7412) will determine alleles: ε2 (rs429358-T + rs7412-T), ε4 (rs429358-C + rs7412-C) and ε3 allele (rs429358-T + rs741-C) as shown in our previous studies[47,48,49,50,51]. For genotyping quality control, negative controls (no DNA) were included in all SNP genotyping and 5% of samples were randomly selected and analyzed in duplicates and the concordance rate was 98%. Genotyping analyses were performed on the Real Time PCR system, QuantStudioTM 6 (Thermo Fisher) according to the manufacturer’s protocol. For genotyping quality control, negative controls (no DNA) were included in all SNP genotyping and 5% of samples were randomly selected and analyzed in duplicates and the concordance rate was 100%. The APOE genotyping was blinded to all characteristics of participants.
Differences of diagnostic groups (AD, MCI, and control) for familism and lifestyles were analyzed with generalized linear models adjusting for age, social-demographic factors, chronic diseases (diabetes, hypertension) and APOE-allele status. Education level was determined based on years of education as follows: Education 1: primary education or below; Education 2: secondary education (e.g., diploma and certificate) and Education 3: post-secondary education.
2.3. Statistical Methods
2.3.1. Descriptive Statistics
The PROC FREQ in SAS stands for the frequency procedure. It is a procedure used to analyze and display the frequency distribution of categorical variables. It calculates counts and percentages and can also perform chi-square tests to assess associations between variables. SAS PROC FREQ was used to estimate the population proportion of case groups, which included both MCI and AD to increase the sample size and enhance statistical power. Chi-square statistics were used to compare the prevalence of cases across gender and age. Independent t-test and one-way ANOVA were used to compare the means between 2 groups and 3 groups, respectively.
2.3.2. Factor Analysis
To reduce the number of variables to explain and to interpret the results, factor analysis of the Attitudinal Familism Scale (AFS with 18 questions, F18) were conducted using a principal component analysis (PCA) as the measurement model, consistent with prior study [52]. Components were retained based on eigenvalues greater than one and inspection of the scree plot, and factor loadings were examined after varimax rotation to evaluate the underlying structure and construct validity.
2.3.3. General Linear Model (GLM) for Continuous Outcome
Bivariate general linear model (GLM) was used to independent variables with top factors as continuous outcomes. The multiple GLM was used to perform significant factors with MoCA-total score as continuous outcome adjusted for age, gender and education. In addition, health outcomes were not accounted for in the statistical models as covariates, since they are associated with cognitive functions.
2.3.4. Multiple Logistic Regression for Binary Outcome
Multiple logistic models were used to perform significant factors with binary outcomes adjusted for age, gender and education. Multiple multinominal logistic models for outcome with 3 categories. Multiple multinominal logistic models were used to perform significant factors with multinomial outcome with 3 levels adjusted for age, gender and education.
2.3.5. Power Analysis
The power analysis was conducted by using G*Power v3.9.1.4. We performed power analysis using multiple linear regression. Using F-tests in linear multiple regression: Fixed model, R2 deviation from zero, given error probability (α) of 0.05, effect size f from the squared multiple
correlation coefficient f= 0.15 (f= 0.15 for moderate effect), power = 1- β = 0.80, 10 predictors, sample size is 118. For power = 0.95, sample size was 172. With 333 subjects in the study, there was ample power to detect associations or correlations.
3. Results
3.1. Demographics and Individual Characteristics
The participants were on average 68.59 ± 18.8 years old (range: 45-96) and 63.36% were female with no differences between the case groups and the control group as shown in Table 1.
In our studied RGV Latino population, we observed an increased prevalence of hypertension (55%) and high cholesterol (36%) compared to the prevalences reported by the Centers for Disease Control and Prevention (CDC) and previous studies, which are 31% for hypertension, 12% for diabetes, and respectively (CDC, National Center for Health Statistics. Health, United States, 2019). https://dx.doi.org/10.15620/cdc:100685; American Diabetes Association. Statistics About Diabetes; CDC, High Cholesterol Facts). However, the prevalence of diabetes in our RGV Latino population (42.9%) is similar to the CDC report (45%).
In terms of education, 46.15% had primary education (elementary education), 34.46% had secondary education (middle school to high school level) and 19.38% had post-secondary education (college and university level), 80.61% had ≤12 years of education.
Moreover, the current findings also showed that the patients with diabetes (P<0.001), hypertension (P=0.012), and high cholesterol (P=0.008) were more likely to have cognitive impairment (Table 1) using chi-square analysis.
In terms of APOE allele distributions, in the studied RGV Latino population, 11.4% of people carried the APOE e4 allele, while 57.7% carried the e3 allele, and 0% carried the e2 allele.
3.2. Cognitive Function in RGV Latino Population Using One-Way ANOVA and GLM Analysis of MoCA
Approximately 423 participants were involved in the study; however, only 333 completed the cognitive tests in either English or Spanish. Language preference was recorded for each participant and taken into account in the analysis to ensure comparability across groups. We observed a high prevalence of cognitive impairment among the RGV Latino population. Specifically, 52.25% of individuals exhibited signs of cognitive decline with 31.95% having AD and 37.59% having MCI. This rate is significantly higher than the national average for all ethnic groups. We found a significant association between APOE genotypes containing e4 allele and cognitive function (p=0.014) (Table 1). Specifically, individuals carrying the APOE e4 allele had lower MoCA scores, indicating poorer cognitive performance, while those with the e3 allele showed higher MoCA scores, suggesting better cognitive function (Table 2).
Using a GLM, we found that MoCA scores, treated as a continuous variable, were significantly associated with age, education, and the APOE e4 allele (Table 3). presents the APOE ε4 allele status. A value of 0 indicates the absence of the ε4 allele, 1 indicates heterozygosity for the ε4 allele (e.g., ε3/ε4 or ε2/ε4), and 2 indicates homozygosity for the ε4 allele (ε4/ε4). Specifically, older age and the presence of the APOE e4 allele were associated with lower MoCA scores, while higher education levels were associated with higher MoCA scores (F=30.10, p<0.001) with mean values of MoCA scores of 19.11 for participants with primary education, 24.48 with secondary education and 25.02 with post-secondary education, respectively using one-way ANOVA analysis (Table 2). Using GLM, we also confirmed the association between low education levels and lower MoCA scores (P< 0.05).
In terms of lifestyle, we observed increased physical activity (high activity score) significantly associated with better cognitive function (with higher MoCA scores) (t=2.94, p=0.004, Table 3), but this association did not remain after adjusted for other variables in the multiple GLM. However, no significant associations were observed between dietary habits, stress levels, smoking, or alcohol consumption and cognitive function as measured by the MoCA.
Moreover, we further demonstrated that the Latino participants with one or two APOE e3 allele(s) had significantly higher MoCA scores as compared to those without any APOE e3 allele (Table 3). Conversely, Latino participants with two APOE e4 alleles had lower MoCA scores as compared to those without APOE e4 alleles (t=-2.89, p=0.004) and this association persisted in multiple GLM (Table 3).
3.3. Factor Analysis
Exploratory factor analysis (EFA) with oblique rotation was performed on the pooled dataset to identify underlying familism patterns, determining individual factor loadings for the 18 familism-related questions. Principal component analysis (PCA) revealed that a 4-factor model provided the best fit, with the first four principal components (eigenvalues >1) explaining 62.85% of the variance (Figure 1). Oblique rotation, allowing for factor correlation, produced more interpretable loadings. The factor loadings for each of the 18 familism variables are listed in Table 4. We interpret the 4 factors based on biological meanings. We defined loading >0.48 as a significant contribution. A 4-factor structure had excellent goodness-of-fit as shown in Figure 1 and Table 4. A scree plot and factor analysis with Oblique rotation were used to determine the individual factor loading of the Attitudinal Familism Scale (F18). Oblique rotation allows factors to be correlated with each other, frequently resulting in more interpretable factor loadings.
Factor analysis of familism (F18) identified four key factors, each representing different dimensions of familism: Each factor helps explain different dimensions of the underlying data structure of F18, providing insight into how the variables cluster together.
Factor 1 (Respect & Obligation): Emphasizes respect for elders, family honor, and obedience to family authority. This factor includes questions 7, 9, 11, 14, 15, 16, and 18, which reflect strong hierarchical family values and obligations [53].
Factor 2 (Family Support & Togetherness): Highlights reliance on and engagement with family, including emotional and physical support. This factor includes questions 5, 6, 8, and 10, emphasizing shared activities and mutual family assistance [54].
Factor 3 (Parental Care & Living Arrangements): Focuses on caring for aging parents and expectations for co-residence. This factor includes questions 1, 2, and 3, which reflect the importance of intergenerational living and caregiving responsibilities [55].
Factor 4 (Family Responsibility & Sacrifice): Reflects financial contributions, responsibility for younger siblings, and preserving family honor. This factor includes questions 4, 12, and 13, highlighting duties such as providing financial support, protecting the family’s reputation, and assisting younger family members [18].
These factors capture different dimensions of familism, which may influence social behaviors and health outcomes, including cognitive reserve and chronic disease risk. The results of factor analysis are similar to the previous study [18].
3.4. Bivariate General Linear Models for Potential Variables with Four Factors of Familism
Among the four factors, factor 4 was significantly associated with low MoCA scores (t= -2.38, p=0.020) and cognitive impairment (t= -2.46, p=0.016) (Table 5). Among four factors, the association of factor 4 with cognitive impairment remained even after adjusting for age, gender, and education using GLM (c2=4.31, p=0.038, Table 6).
3.5. Multiple General Linear Models and Logistic Regression Analyses of Factors of Familism with Clinical Outcomes
As shown in Table 6, age was associated with lower MoCA scores as we expected (c2=17.85, p <0.001). Furthermore, factor 4 was negatively associated with cognitive impairment measured by MoCA using multiple GLMs. However, the high level of education was not associated with cognitive function measured by MoCA after adjusting for potential confounding factors (p>0.05).
4. Discussion
In this cohort study of 333 Latino adults from the RGV, we examined the association between familism and the prevention of cognitive impairment. Contrary to our hypothesis, low levels of familism were associated with better overall cognitive health. In addition, the significant disparity in hypertension and high cholesterol in the current studied population, suggests potential regional factors or lifestyle choices influencing these health outcomes, while the comparable diabetes rates indicate a widespread issue within the Latino community that aligns with national trends.
4.1. Cognitive Function in RGV Latino Population
High prevalence of 52% cognitive impairment (including MCI and AD) in our current RGV Latino population, aligns with findings from previous studies, such as those by Gonzalez et al. (2021), which reported similar rates (42.3%)[56] of cognitive impairment in Latino communities. Contributing factors may include socioeconomic disparities, limited access to healthcare, and higher rates of diabetes and hypertension, which are known risk factors for cognitive decline.[57] According to CDC reports, the prevalence of cognitive impairment among Latino adults aged 65 and older is notably high. Approximately 28% of older Latino adults experience cognitive impairment, which is higher than the prevalence among non-Latino whites. This disparity may be influenced by factors such as lower socioeconomic status, higher rates of chronic diseases like diabetes and hypertension, and barriers to accessing healthcare and educational resources. Addressing these disparities is crucial for reducing the burden of cognitive impairment in this growing population (CDC, 2021 https://www.cdc.gov/aging/pdf/cognitive_impairment/cogimp_poilicy_final.pdf ).
We were focus on the RGV Latinos since RGV is a predominantly Hispanic region in South Texas with unique demographic, cultural, and health characteristics that make it particularly relevant for this study. The population faces disproportionate rates of chronic diseases, including diabetes and cognitive impairment, and exhibits strong cultural values such as familism, which may influence health behaviors and outcomes. By conducting the study in the RGV, we are able to examine the interplay of cultural, lifestyle, and genetic factors in a population that is historically underrepresented in research. Including this context highlights the study’s significance and enhances the relevance of our findings.
4.2. Certain Lifestyle Factors Associated with Cognitive Function Measured by MoCA
In our study, higher education levels were associated with better cognitive function measured by MoCA. This observation is consistent with studies that report that lower education level significantly influences MoCA scores, leading to lower scores, and vice versa. Low education among the RGV Latino individuals associated with cognitive impairment in the current study supports a previous report [58]. A study in Columbia, for example, reports that participants with an average education of 4.8 years performed poorly on the MoCA, particularly in subtests assessing attention, repetition, verbal fluency, and abstraction[59]. A possible reason for this correlation may be that higher education levels provide individuals with more cognitive stimulation, offering individuals opportunities to learn new information, engage in complex tasks, and develop critical thinking and problem-solving skills. The activities enhance cognitive function and help delay cognitive decline. This is first study of high levels of education associated with better cognitive function in the RGV Latino population; however, a future large sample size is needed to confirm the current findings to understand how education impacts cognitive function in this growing demographic, considering potential cultural, socioeconomic, and environmental factors that may influence cognitive aging differently from other populations.
Similarly, our findings demonstrated a positive correlation between participants with high physical activity levels and higher MoCA scores, indicating better cognitive function. This trend is consistent with a previous study showing that a healthy lifestyle, including regular exercise, a balanced diet, and the avoidance of alcohol and tobacco, is associated with improved MoCA scores in the Chinese population[60]. Physical activity is associated with larger brain volume in older adults in Latino population [61,62]. While the exact mechanisms by which lifestyle factors like exercise enhance cognitive function remain unclear, it is theorized that exercise may help prevent Aβ accumulation, potentially protecting against cognitive decline. No association of dietary habits, stress levels, smoking, or alcohol consumption with cognitive function suggests that these lifestyle factors may play a less prominent role in cognitive outcomes than familism or other cultural and social determinants in this Latino population. The current findings together with previous reports suggest that improving disease risk reduction strategies, targeting higher-risk groups (e.g., Latino adults with low levels of education) and tailoring interventions based on current risk factor profiles may prove more effective in the disease prevention, such as cognitive impairment.
4.3. APOE Allele Distributions
In our study, 11.4% of participants carried the APOE ε4 allele. Although this frequency is notably lower than that reported in other studies, it is consistent with findings that Latinos are generally less likely to carry the APOE ε4 allele than non- Latino Whites. For instance, a study by Campos (2013) reported that the ε4 allele frequency is lower in Latino AD cases (21.4%) and controls (12.5%) compared to white non-Latino cases (42.9%) and controls (19.6)[39]. Additionally, 57.7% of participants in our study carried the APOE ε3 allele, and 0% of participants carried the APOE ε2 allele. This is consistent with other studies showing that the APOE ε3 allele is the most common, while the APOE ε2 allele is less frequent. However, the percentages observed in our study are still notably lower.
APOE ε4 carrier and ε2 carrier have been reported in Hispanic/Latino populations to between 16-29% and 5.1-18.8%, respectively [63]. APOE ε4 and ε2 allele frequencies have been previously reported, supporting our current findings on the ε4 allele. However, unlike these reports, no ε2 alleles were detected in our sample of 333 participants from the RGV Latino population. This absence suggests potential subpopulation differences within the Latino community, possibly due to variations in location, culture, or genetic diversity. These findings indicate that the RGV Latino population may represent a genetically distinct subgroup compared to those previously studied, highlighting the importance of considering regional and cultural diversity when studying genetic factors in this population.
4.4. Familism Associated with Cognitive Function
Familism, the cultural value that emphasizes strong family bonds, loyalty, and sense of responsibility to one’s family, plays a significant role in cognitive function [18]. Familism is a key family process that has been linked to disease prevention as we described in introduction and is defined as interdependence with the family system and creates a sense of obligation of family care and consideration when making decisions. However, familism has not been empirically examined in relation to cognitive impairment in the RGV Latino population. Previous studies in a combined cohort of Latino, European, and East Asian Americans suggests that a greater emphasis on family ties, such as familism, is closely associated with higher health ratings [64]. It is widely embraced in collectivistic cultures, including Asian American, Black/African American, and Latinx communities [65].
The results of the current study also support this finding. Specifically, factor 4 (including questions of 4, 12 and 13 of F18) of familism was associated with prevention of cognitive impairment. Our findings suggest that higher familism is negatively associated with cognitive impairment, indicating a protective effect. However, given the cross-sectional design and possible confounding factors, this association should be interpreted with caution and does not imply a causal relationship. Strong family connections may promote mental stimulation, stress reduction, and healthier lifestyles, enhancing cognitive resilience.
We also aware that the results of factor analysis presented in the current study were different from a previous study [18], since our study identified four distinct factors of familism based on 18 questions, which differ significantly from those found by Steidel and Contreras [18]. This discrepancy may result from variations in Hispanic subgroups, age, or regional differences, highlighting the complexity of familism. Future studies should focus on specific subgroups, geographic regions, and additional contributing factors.
The current research findings together with previous studies suggest that a pronounced sense of family obligation may contribute to the role of familism as a source of several health conditions including cognitive impairment in family-centered cultures like RGV Latino. A most recent study supports our findings, and the authors reported that low level of familism predicted not only decline in global cognition (GC), but also decline in verbal learning, and memory using the 14-item Familism Scale in 2155 Latino subjects, ages>45 years [66]. This 14-item Familism Scale was used to measure the Latino-centric ethos of familism (e.g., prioritizing one’s family over the self). The familism scale includes three subscales assessing family obligations, family support, and family as referent [67]. However, in our study, we employed a different measure: an 18-item Familism Scale, F18. While constructions are similar, our version provides a more comprehensive assessment of familism, potentially capturing additional dimensions of family dynamics that are relevant to our research context.
These familism related studies provide a useful foundation for various stakeholders to develop culturally targeted interventions and programs to support Latino American caregivers and their family members with cognitive impairment and highlight the necessity of developing culturally informed interventions that take into consideration of prevention for cognitive decline. This suggests that family as referent and perceived familial obligations may further support a participant’s positive health-related brain aging in older Latino adults. Familism has the potential to buffer the negative effect of cognitive impairment in ways that are protective for health among Latinas at risk for AD, MCI or other types of dementia.
Taken together, results, for the first, suggest that high levels of familism-obligation and Latino-centric aspects of familism contribute to cognitive function in the RGV Latino population. These findings confirmed previous studies on cognitive function [28,30] in non-RGV Latino population [22].
Protect factors like high levels of familism and education, and social support are important for maintaining overall health including mental health, stress environments [20] and others in Latino communities [68].
We are aware of certain strengths and limitations of the current study. Strengths include (1) our results are the first report on familism associated with cognitive function in the RGV Latinos, as underserved population. (2) our study continues to support familism, one of cultural values, differentially contributes to cognitive health in the older Latino population (>45 years of age) and extends this work. We are aware of several limitations in our study and offer some possible solutions: (1) collecting a complete dataset during one visit can be quite time-consuming and challenging for the elderly. Occasionally, we also need second and third visits to collect complete data (e.g., contact family members or care givers for missing data). This is ongoing study, we will be able to collect more complete information, (2) self-report for some health conditions such as diabetes and hypertension, which may introduce recall bias (3) a small sample size of a total of 333 subjects, it is well known that LTabatino population is heterogeneous geographically, culturally, and genetically, and in their historical experiences [69]. Small sample size may reduce the generalizability of findings to broader Hispanic populations or other ethnic groups. Larger studies are needed to validate these results. This ongoing study will allow us to generate more data to confirm the current findings by recruiting larger number subjects, (4) we are also aware of several other psychosocial variables which also impact cognitive function, such as intrapersonal factors (ethnic identity, and purpose in life), interpersonal factors (e.g., social network embeddedness), and social stressors as different psychosocial variables have differential relationships with cognitive function[70].
5. Conclusions
The current study addresses gaps in family processes by exploring the association of familism with cognitive function in the RGV Latino population. This study contributes to the literature on familism and cognitive function. The results indicate that the indirect pathway linking familism, one of cultural values, to cognitive function and highlight the distinct effects of familism-support and obligation for prevention of cognitive impairment as well as the need to consider sociodemographic diversity and lifestyle chose within Latino communities. Future studies should be focus on replicating these findings in a large sample size of Latino population and expect consistent result.
Author Contributions
For research articles with several authors, a short paragraph specifying their individual contributions must be provided. The following statements should be used “Conceptualization, C.X. and K.W.; methodology, C.X. ; K.W.; D.O.; L.A. software, K.W.; validation, D.O.; L.A..; formal analysis, C.X. and K.W.; investigation, C.X. and K.W.; writing—original draft preparation, C.X. ; K.W.; D.O.; L.A.; E.G.; writing— C.X. ; K.W.; S. M.; G.M.; supervision, C.X.; G.M .and K.W.; All authors have read and agreed to the published version of the manuscript.
Funding
The authors received no financial support for the research, authorship, and/or publication of this article.
Institutional Review Board Statement
The study was conducted in accordance with the Declaration of Helsinki, and approved by the University of Texas Rio Grande Valley (UTRGV)- Institutional Review Board (UTRGV-IRB-19-0024, approved date of April 3, 2019).
Informed Consent Statement
Informed consent was obtained from all subjects involved in the study. The research was conducted in accordance with institutional guidelines and approved protocols. Participant data were de-identified prior to analysis to protect privacy and confidentiality.
Data Availability Statement
The data supporting the findings of this study are available from the corresponding author upon reasonable request.
Acknowledgments
The authors acknowledge the researchers, staff, and participants of Project Frontier for their continued data collection and their valuable contribution.
Conflicts of Interest
The authors declare no conflicts of interest.
Abbreviations
The following abbreviations are used in this manuscript:
| AD | Alzheimer’s Disease |
| RGV | Rio Grande Valley |
| MCI | Mild Cognitive Impairment |
| Mas GWA SLIQ |
Mexican Americans Genome Wide Association Simple Lifestyle Indicator Questionnaire |
| F18 | Familism with 18 Questions |
| MoCA | Montreal Cognitive Assessment |
| GLM | General linear model |
References
- Rajan, K.B., et al., Population estimate of people with clinical Alzheimer's disease and mild cognitive impairment in the United States (2020-2060). Alzheimers Dement, 2021. 17(12): p. 1966-1975. [CrossRef]
- Clark, C.M., et al., Earlier onset of Alzheimer disease symptoms in latino individuals compared with anglo individuals. Arch Neurol, 2005. 62(5): p. 774-8. [CrossRef]
- Gupta, S., Racial and ethnic disparities in subjective cognitive decline: a closer look, United States, 2015-2018. BMC Public Health, 2021. 21(1): p. 1173. [CrossRef]
- Bukhbinder, A.S., et al., Population-Based Mini-Mental State Examination Norms in Adults of Mexican Heritage in the Cameron County Hispanic Cohort. J Alzheimers Dis, 2023. 92(4): p. 1323-1339. [CrossRef]
- Migliore, L. and F. Coppede, Gene-environment interactions in Alzheimer disease: the emerging role of epigenetics. Nat Rev Neurol, 2022. 18(11): p. 643-660. [CrossRef]
- Liu, C.C., et al., Apolipoprotein E and Alzheimer disease: risk, mechanisms and therapy. Nat Rev Neurol, 2013. 9(2): p. 106-18.
- Karch, C.M., C. Cruchaga, and A.M. Goate, Alzheimer's disease genetics: from the bench to the clinic. Neuron, 2014. 83(1): p. 11-26. [CrossRef]
- Van Cauwenberghe, C., C. Van Broeckhoven, and K. Sleegers, The genetic landscape of Alzheimer disease: clinical implications and perspectives. Genet Med, 2016. 18(5): p. 421-30.
- Zhao, B., et al., Genome-wide association analysis of 19,629 individuals identifies variants influencing regional brain volumes and refines their genetic co-architecture with cognitive and mental health traits. Nat Genet, 2019. 51(11): p. 1637-1644. [CrossRef]
- Farrer, L.A., et al., Effects of age, sex, and ethnicity on the association between apolipoprotein E genotype and Alzheimer disease. A meta-analysis. APOE and Alzheimer Disease Meta Analysis Consortium. JAMA, 1997. 278(16): p. 1349-56.
- Szabo-Reed, A.N. and M.N. Key, A Narrative Review Evaluating Diet and Exercise as Complementary Medicine for the Management of Alzheimer's Disease. Nutrients, 2025. 17(11). [CrossRef]
- Dolgacheva, L.P., et al., Serotonergic Regulation in Alzheimer's Disease. Int J Mol Sci, 2025. 26(11). [CrossRef]
- Wilson, R.S., et al., Loneliness and risk of Alzheimer disease. Arch Gen Psychiatry, 2007. 64(2): p. 234-40.
- Feng, X., et al., Mendelian Randomization Analysis Reveals Causal Factors behind Alzheimer's Disease Risk: Evidence, Opportunities, and Challenges. J Prev Alzheimers Dis, 2024. 11(3): p. 749-758. [CrossRef]
- Gelfo, F., et al., Land/Water Aerobic Activities: Two Sides of the Same Coin. A Comparative Analysis on the Effects in Cognition of Alzheimer's Disease. J Alzheimers Dis, 2024. 98(4): p. 1181-1197. [CrossRef]
- Klapp, R., et al., The association of a healthy lifestyle index and imaging-based body fat distribution with glycemic status and Type 2 diabetes in the Multi Ethnic Cohort: a cross-sectional analysis. Eur J Clin Nutr, 2024. 78(3): p. 236-242. [CrossRef]
- Bronas, U.G., et al., Ecological Momentary Intervention to Replace Sedentary Time With Physical Activity to Improve Executive Function in Midlife and Older Latino Adults: Pilot Randomized Controlled Trial. J Med Internet Res, 2024. 26: p. e55079. [CrossRef]
- Steidel, A. and J. Contreras, New Familism Scale for Use With Latino Populations. Hispanic Journal of Behavioral Sciences, 2003. 25(3). [CrossRef]
- Savage, B., et al., Familism and Health Care Provision to Hispanic Older Adults. J Gerontol Nurs, 2016. 42(1): p. 21-9; quiz 30-1. [CrossRef]
- Valdivieso-Mora, E., et al., A Systematic Review of the Relationship between Familism and Mental Health Outcomes in Latino Population. Front Psychol, 2016. 7: p. 1632. [CrossRef]
- Soto, C., et al., Cultural values associated with substance use among Hispanic adolescents in southern California. Subst Use Misuse, 2011. 46(10): p. 1223-33. [CrossRef]
- Corona, K., et al., Do cultural values have a role in health equity? A study of Latina mothers and daughters. Cultur Divers Ethnic Minor Psychol, 2019. 25(1): p. 65-72. [CrossRef]
- Medina-Ramirez, P., et al., Hispanic/Latinx Ethnic Subgroup Differences in Sociodemographic, Sociocultural, and Smoking Characteristics in a Cessation Trial: An Exploratory Study. Nicotine Tob Res, 2022. 24(10): p. 1589-1596. [CrossRef]
- Reyes-Rodriguez, M.L., et al., Promoviendo una Alimentacion Saludable (PAS) results: Engaging Latino families in eating disorder treatment. Eat Behav, 2021. 42: p. 101534. [CrossRef]
- Lamar, M., et al., A Longitudinal Study of Acculturation in Context and Cardiovascular Health and Their Effects on Cognition Among Older Latino Adults. J Am Heart Assoc, 2023. 12(6): p. e027620. [CrossRef]
- Lacson, J.C.A., et al., Skin cancer prevention behaviors, beliefs, distress, and worry among hispanics in Florida and Puerto Rico. BMC Public Health, 2023. 23(1): p. 2234. [CrossRef]
- Diaz, C.J. and M. Nino, Familism and the Hispanic Health Advantage: The Role of Immigrant Status. J Health Soc Behav, 2019. 60(3): p. 274-290. [CrossRef]
- Sutter, M., et al., Linking family dynamics and the mental health of Colombian dementia caregivers. Am J Alzheimers Dis Other Demen, 2014. 29(1): p. 67-75. [CrossRef]
- Huertas-Domingo, C., et al., Sociocultural factors, guilt and depression in family caregivers of people with dementia. Kinship differences. Aging Ment Health, 2023. 27(9): p. 1655-1665. [CrossRef]
- Fleischman, D.A., et al., Acculturation in Context and Brain Health in Older Latino Adults: A Diffusion Tensor Imaging Study. J Alzheimers Dis, 2023. 95(4): p. 1585-1595. [CrossRef]
- Liu, Y.E., et al., Caregiving burden and positive aspects of caregiving among family caregivers of people living with schizophrenia: Two sides of the same coin. Appl Nurs Res, 2022. 67: p. 151619. [CrossRef]
- McCabe, B.E., et al., Acculturation, acculturative stress, and tobacco/nicotine use of Latin American immigrants. Ethn Health, 2024. 29(7): p. 880-891. [CrossRef]
- Castro, Y., et al., Revisiting the Relationship Between Acculturation and Smoking Cessation Among Mexican Americans. Ann Behav Med, 2019. 53(3): p. 211-222. [CrossRef]
- Selkoe, D.J. and J. Hardy, The amyloid hypothesis of Alzheimer's disease at 25 years. EMBO Mol Med, 2016. 8(6): p. 595-608. [CrossRef]
- Martins, R.N., et al., Neurodegeneration and Alzheimer's Disease : The Role of Diabetes, Genetics, Hormones, and Lifestyle. 2019, Newark, UNITED KINGDOM: John Wiley & Sons, Incorporated.
- Farrer, L.A., et al., Effects of age, sex, and ethnicity on the association between apolipoprotein E genotype and Alzheimer disease. A meta-analysis. APOE and Alzheimer Disease Meta Analysis Consortium. JAMA, 1997. 278(16): p. 1349-1356. [CrossRef]
- Petty, L.E., et al., Large-scale multi-omics analyses in Hispanic/Latino populations identify genes for cardiometabolic traits. Nat Commun, 2025. 16(1): p. 3438. [CrossRef]
- Lee, J.H., et al., Mortality and apolipoprotein E in Hispanic, African-American, and Caucasian elders. Am J Med Genet, 2001. 103(2): p. 121-7. [CrossRef]
- Campos, M., S.D. Edland, and G.M. Peavy, Exploratory study of apolipoprotein E epsilon4 genotype and risk of Alzheimer's disease in Mexican Hispanics. J Am Geriatr Soc, 2013. 61(6): p. 1038-1040. [CrossRef]
- Gonzalez, H.M., et al., Apolipoprotein E genotypes among diverse middle-aged and older Latinos: Study of Latinos-Investigation of Neurocognitive Aging results (HCHS/SOL). Sci Rep, 2018. 8(1): p. 17578. [CrossRef]
- Hayward, M.D., et al., The Importance of Improving Educational Attainment for Dementia Prevalence Trends From 2000 to 2014, Among Older Non-Hispanic Black and White Americans. J Gerontol B Psychol Sci Soc Sci, 2021. 76(9): p. 1870-1879. [CrossRef]
- Godwin, M., et al., Testing the Simple Lifestyle Indicator Questionnaire: Initial psychometric study. Can Fam Physician, 2008. 54(1): p. 76-7.
- Nasreddine, Z.S., et al., The Montreal Cognitive Assessment, MoCA: a brief screening tool for mild cognitive impairment. J Am Geriatr Soc, 2005. 53(4): p. 695-9. [CrossRef]
- Becker, C.J., et al., Differential Impact of Stroke on Cognitive Impairment in Mexican Americans and Non-Hispanic White Americans. Stroke, 2022. 53(11): p. 3394-3400. [CrossRef]
- Xu, C., et al., Mutation identified for of ADHD families in the US Hispanic population by Whole exome sequencing, in American Scioety of Human Genetics. 2018: San Diego.
- Acevedo, P. and C. Xu, Mutation identified for of ADHD families in the US Hispanic population by Whole exome sequencing in Annual meeting of American Society of Human Genetics. 2018.
- Wang, K.S., et al., Family-based association analysis of NAV2 gene with the risk and age at onset of Alzheimer's disease. J Neuroimmunol, 2017. 310: p. 60-65. [CrossRef]
- Xu, C.A., M:, Wang, KS, APOE gene associated with dementia related disorders and neuropsychiatric related phenotypes in the Hispanic/Latino population, in International Alzheimer’s Disease & Dementia Conference 2021.
- Lozano, S., et al., APOE Gene Associated with Cholesterol-Related Traits in the Hispanic Population. Genes (Basel), 2021. 12(11). [CrossRef]
- J. Saveron, D.G., C. Xu, Ongoing Study on the Association of APOE Gene Polymorphisms and Education with Cognitive Impairment in the Rio Grande Valley Hispanic Population, in UTRGV SOM Research Symposium 2024. 2024: Mission Event Center, Mission, TX.
- E. Guajardo, L.A., D. Ollervides-Charles, K. Wang, G. Maestre, C. Xu, Examining familsim and CETP Gene Associated with AD-Related Diseases of The Hispanic Population in The Rio Grande Valley, in UTRGV SOM Research Symposium 2024. 2024: Mission Event Center, Mission, TX.
- Knekta, E., C. Runyon, and S. Eddy, One Size Doesn't Fit All: Using Factor Analysis to Gather Validity Evidence When Using Surveys in Your Research. CBE Life Sci Educ, 2019. 18(1): p. rm1. [CrossRef]
- Knight, G.P., et al., The Mexican American Cultural Values scales for Adolescents and Adults. J Early Adolesc, 2010. 30(3): p. 444-481. [CrossRef]
- Campos, B., et al., Familialism, social support, and stress: positive implications for pregnant Latinas. Cultur Divers Ethnic Minor Psychol, 2008. 14(2): p. 155-62. [CrossRef]
- Fuligni, A.J., Tseng, V., & Lam, M. , Attitudes toward family obligations among American adolescents with Asian, Latin American, and European backgrounds. Child Development, 1999. 70: p. 1030. [CrossRef]
- Gonzalez, D.A., et al., Cognitive screening with functional assessment improves diagnostic accuracy and attenuates bias. Alzheimers Dement (Amst), 2021. 13(1): p. e12250. [CrossRef]
- Vega, W.A. and L.M. Gutiérrez Robledo, Can Brain Health Interventions Reduce Mexico’s Dementia Burden? An Essay, in Understanding the Context of Cognitive Aging: Mexico and the United States, J.L. Angel, M. López Ortega, and L.M. Gutierrez Robledo, Editors. 2021, Springer International Publishing: Cham. p. 253-264.
- Nianogo, R.A., et al., Risk Factors Associated With Alzheimer Disease and Related Dementias by Sex and Race and Ethnicity in the US. JAMA Neurol, 2022. 79(6): p. 584-591. [CrossRef]
- Gomez, F., et al., Applicability of the MoCA-S test in populations with little education in Colombia. Int J Geriatr Psychiatry, 2013. 28(8): p. 813-20. [CrossRef]
- Li, M., et al., Effect of long-term lifestyle intervention on mild cognitive impairment in hypertensive occupational population in China. Medicine (Baltimore), 2018. 97(34): p. e11975. [CrossRef]
- Gu, Y., et al., Assessment of Leisure Time Physical Activity and Brain Health in a Multiethnic Cohort of Older Adults. JAMA Netw Open, 2020. 3(11): p. e2026506. [CrossRef]
- Gardener, H., et al., Ideal Cardiovascular Health and Biomarkers of Subclinical Brain Aging: The Northern Manhattan Study. J Am Heart Assoc, 2018. 7(16): p. e009544. [CrossRef]
- Sofer, T., et al., A polygenic risk score for Alzheimer's disease constructed using APOE-region variants has stronger association than APOE alleles with mild cognitive impairment in Hispanic/Latino adults in the U.S. Alzheimers Res Ther, 2023. 15(1): p. 146. [CrossRef]
- Corona, K., B. Campos, and C. Chen, Familism is associated with psychological well-being and physical health: Main effects and stress-buffering effects. Hispanic Journal of Behavioral Sciences, 2017. 39(1).
- Christophe, N.K. and G.L. Stein, Facilitating the study of familism across racial/ethnic groups: Creation of the Short Attitudinal Familism Scale. J Fam Psychol, 2022. 36(4): p. 534-544. [CrossRef]
- Sabogal, F. and M. G, Hispanic Familism and Acculturation: What Changes and What Doesn't? Hispanic Journal of Behavioral Sciences, 1987.
- Estrella, M.L., et al., Psychosocial factors associated with 7-year change in cognition among middle-aged and older Hispanics/Latinos: The Hispanic Community Health Study/Study of Latinos-Investigation of Neurocognitive Aging (SOL-INCA) and Sociocultural ancillary studies. Alzheimers Dement, 2024. 20(2): p. 1137-1148. [CrossRef]
- Campos, B., et al., Familism and psychological health: the intervening role of closeness and social support. Cultur Divers Ethnic Minor Psychol, 2014. 20(2): p. 191-201. [CrossRef]
- Mehta, K.M. and G.W. Yeo, Systematic review of dementia prevalence and incidence in United States race/ethnic populations. Alzheimers Dement, 2017. 13(1): p. 72-83. [CrossRef]
- Estrella, M.L., et al., Psychosocial Factors Associated with Cognitive Function Among Middle-Aged and Older Hispanics/Latinos: The Hispanic Community Health Study/Study of Latinos and its Sociocultural Ancillary Study. J Alzheimers Dis, 2021. 79(1): p. 433-449. [CrossRef]
Figure 1.
Scree plot of eigenvalues suggesting four principal components/factors for familism (F18).
Figure 1.
Scree plot of eigenvalues suggesting four principal components/factors for familism (F18).
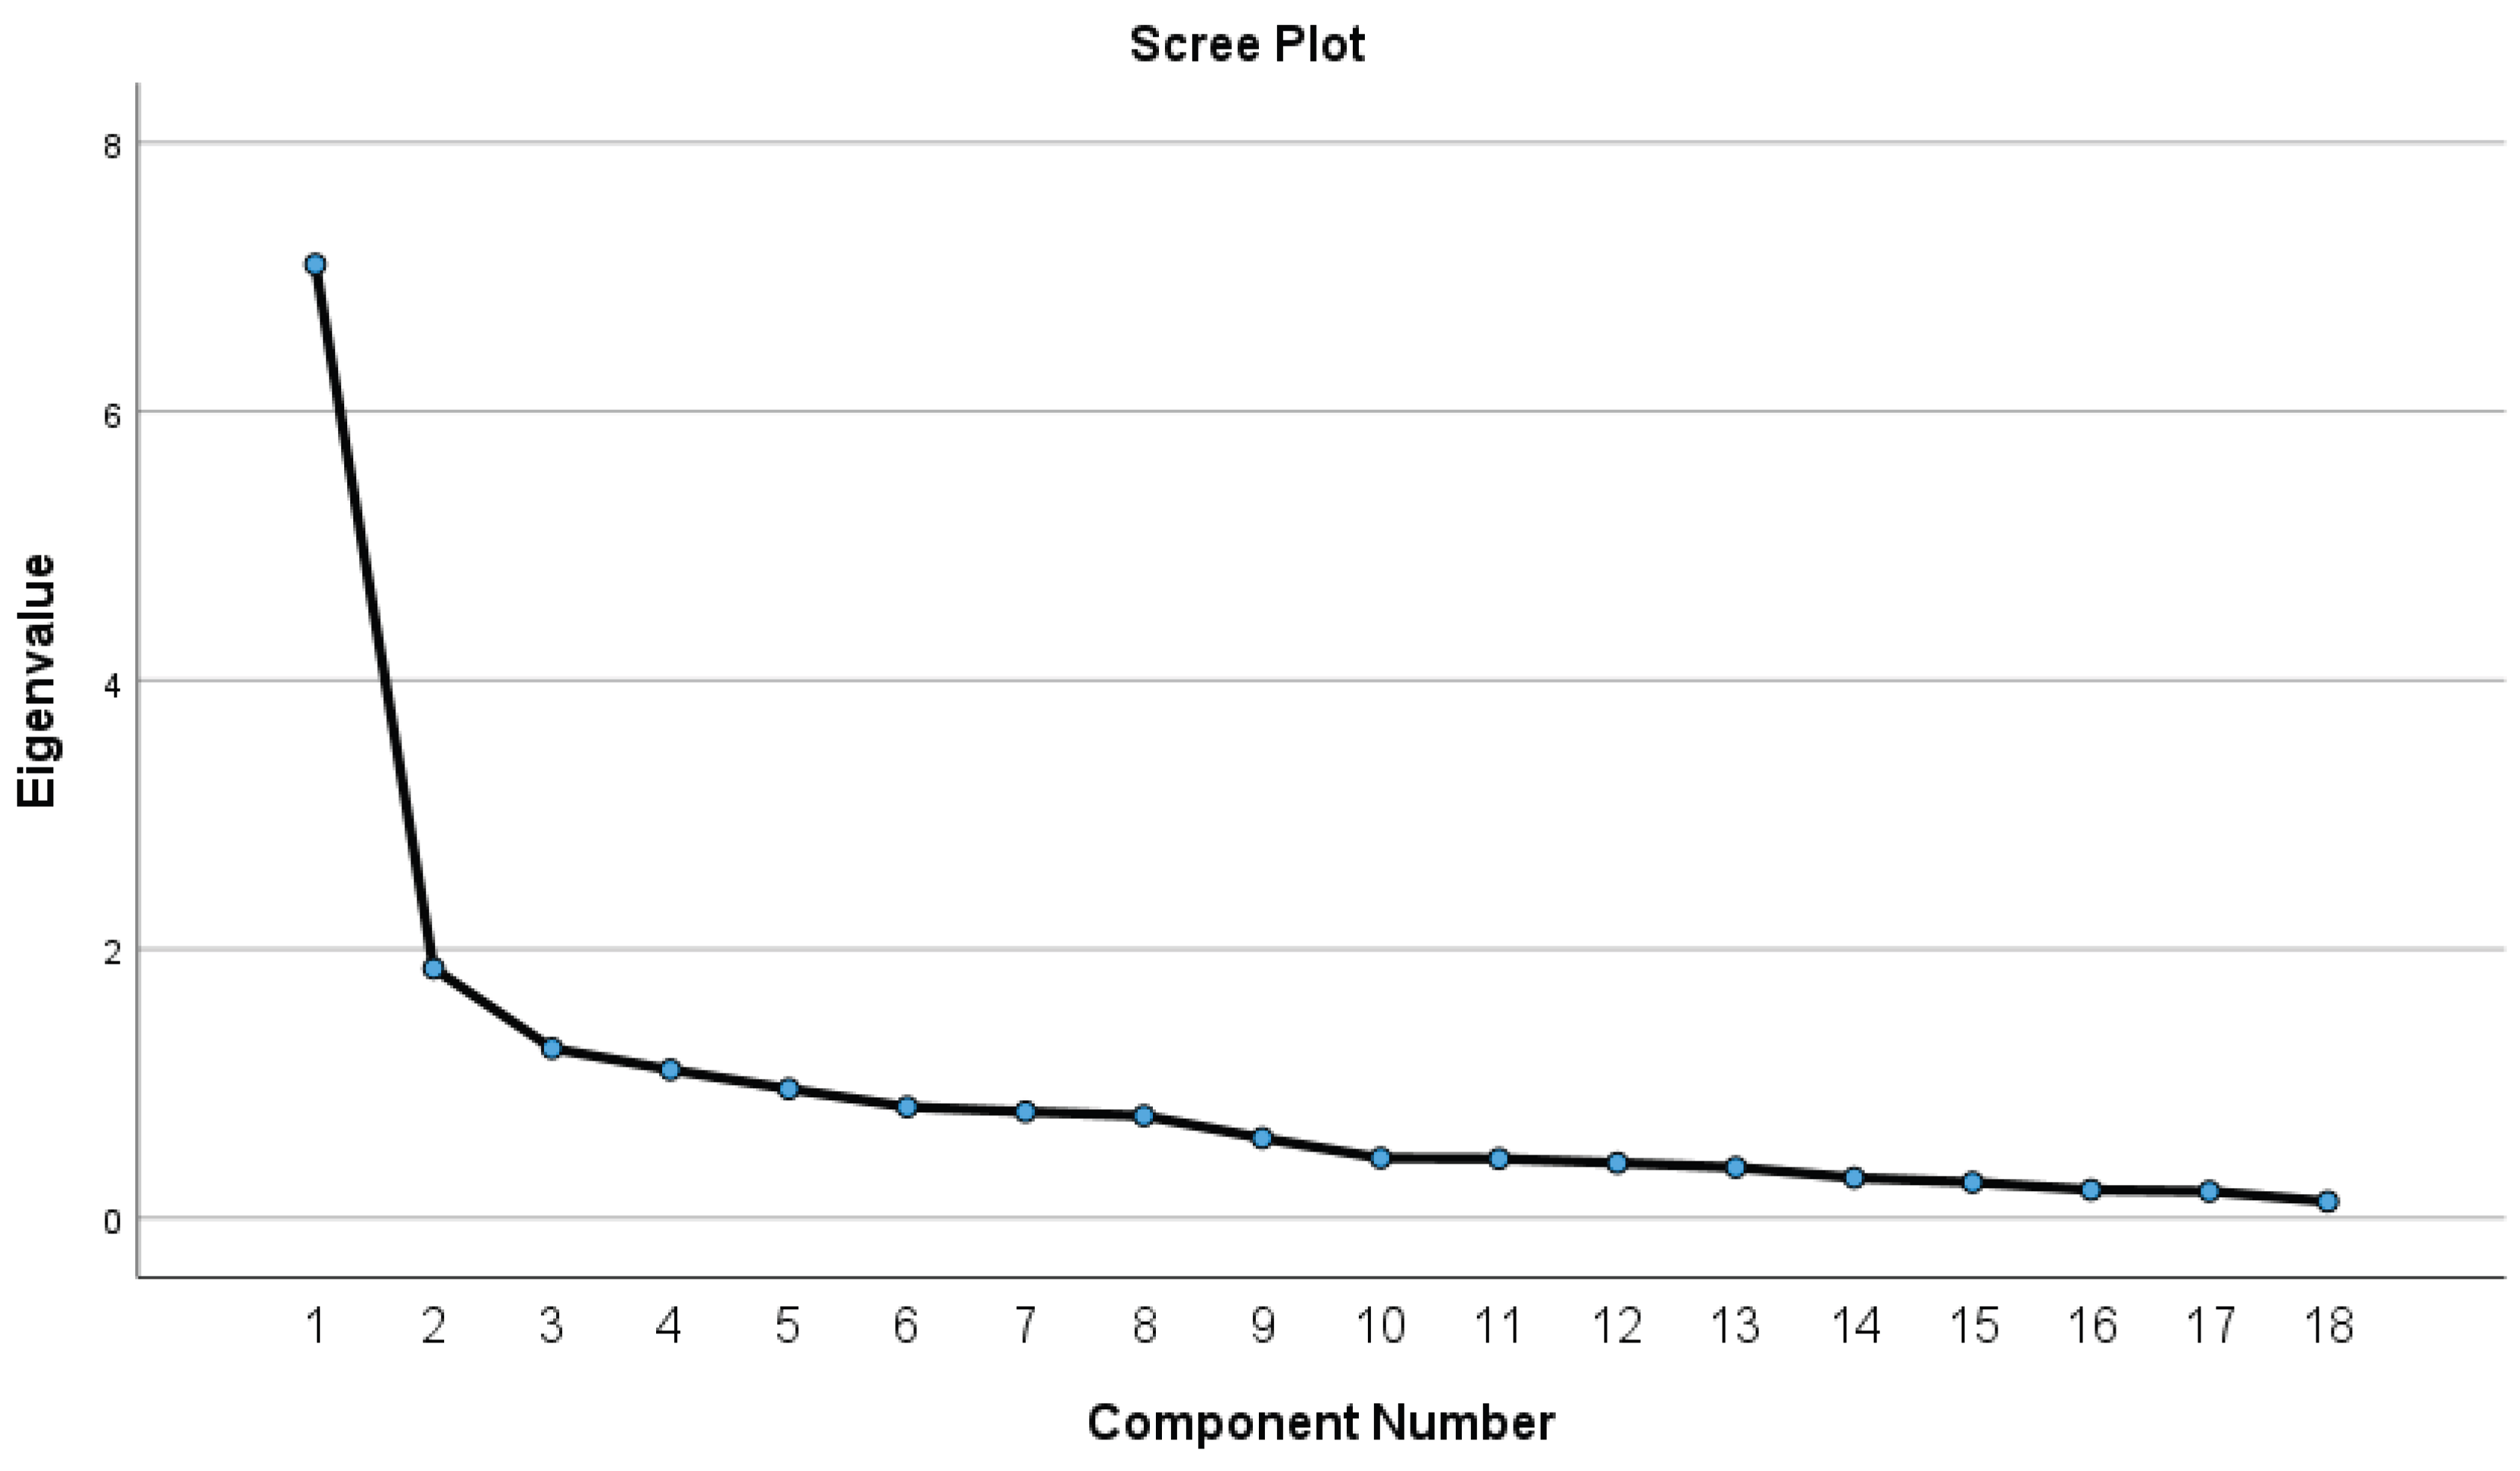

Table 1.
Descriptive statistics.
| Variable | Total (N) |
Control (N, %) |
AD or MCI (N, %) |
χ2/t | p-value |
| Gender 333 | 92 (27.63) | 174 (52.25) | |||
| Male | 122 | 33 (33.0) | 67 (67.0) | 0.27 | 0.602 |
|
Age group (45-96 yr) Education |
260 | 81 (31.2) | 179 (69.1) | ||
| Primary | 150 | 22 (18.2) | 99 (81.8) | 27.61 | <0.001* |
| Secondary | 112 | 46 (50.0) | 46 (50.0) | ||
| Post secondary | 63 | 24 (47.2) | 28 (52.8) | ||
|
Diabetes |
|||||
| No | 199 | 88 (44.2) | 111 (55.8) | 14.25 | <0.001* |
| Yes | 134 | 29 (21.8) | 104 (78.2) | ||
|
Hypertension |
|||||
| No | 150 | 66 (43.9) | 84 (56.1) | 6.32 | 0.012 |
| Yes | 183 | 53 (28.9) | 130 (71.1) | ||
|
e3_allele |
|||||
| 0 | 8 | 1 (12.5) | 7 (87.5) | 5.62 | 0.065 |
| 1 | 33 | 16 (48.5) | 17 (51.5) | ||
| 2 | 136 | 41 (30.1) | 95 (69.9) | ||
| e4_allele | |||||
| 0 | 151 | 46 (30.5) | 105 (69.5) | 8.42 | 0.014 |
| 1 | 18 | 11 (61.1) | 7 (38.9) | ||
| 2 | 8 | 1 (12.5) | 7 (87.5) | ||
* P < 0.008 after adjusting for multiple testing.
Table 2.
One-way ANOVA for cognitive function measured by MoCA total score.
| Variable | Mean | SD | F | p-value |
| Education | ||||
| Primary | 19.11 | 6.72 | 30.10 | <0.001* |
| Secondary | 24.48 | 5.24 | ||
| Post secondary | 25.02 | 4.54 | ||
| e3_allele | ||||
| 0 | 15.38 | 8.65 | 6.43 | 0.002* |
| 1 | 23.88 | 5.10 | ||
| 2 | 21.63 | 6.15 | ||
| e4_allele | ||||
| 0 | 21.77 | 5.99 | 6.20 | 0.003* |
| 1 | 24.50 | 5.76 | ||
| 2 | 15.38 | 8.65 |
SD = standard deviation, * P < 0.008 after adjusting for multiple testing.
Table 3.
General linear models for potential variables with cognitive function measured by MoCA total score.
Table 3.
General linear models for potential variables with cognitive function measured by MoCA total score.
| Variable |
Bivariate a β ± SE |
t-value, p |
Multiple b β ± SE |
t-value, p |
Multiple c β ± SE |
t-value, p |
| Gender (ref=Female) | ||||||
| Male | 0.05±0.84 | 0.06, 0.952 | 0.13±0.87 | 0.15, 0.885 | -0.13±0.87 | -0.15, 0.878 |
| Age | -0.19±0.02 | -9.82, <0.001* | -0.14±0.04 | -3.29, 0.001* | -0.13±0.05 | -3.23, 0.002* |
| Education (ref=Post secondary) | ||||||
| Primary | -6.82±0.97 | -7.1, <0.001* | -2.81±1.26 | -2.24, 0.027 | -2.85±1.26 | -2.26, 0.025 |
| Secondary | -1.50±1.02 | -1.47, 0.143 | 0.73±1.23 | 0.59, 0.557 | 0.72±1.24 | 0.58, 0.561 |
| Activity score | 0.24±0.08 | 2.94, 0.004* | -0.03±0.15 | -0.16, 0.873 | -0.23±0.15 | -0.16, 0.873 |
| SLIQ score | -0.13±0.24 | -0.53, 0.594 | 0.05±0.27 | 0.19,0.852 | 0.05±0.28 | 0.19, 0.846 |
| Diabetes (ref=No) | --3.00±0.78 | -3.83, <0.001* | -2.03±0.89 | -2.27, 0.024 | -2.07±0.89 | -2.31, 0.022 |
| Hypertension (ref=No) | -2.17±0.80 | -2.17, 0.007* | 0.42±0.92 | 0.46, 0.648 | 0.42±0.92 | 0.46, 0.647 |
| APOE e3 (ref=0) | ||||||
| 1 | 8.50±2.40 | 3.54, <0.001* | 6.14±2.16 | 2.85, 0.005* | ||
| 2 | 6.25±2.22 | 2.82, 0.005* | 4.97±1.99 | 2.50, 0.013 | ||
| APOE e4 (ref=0) | ||||||
| 1 | 2.73±1.52 | 1.79, 0.075 | -0.94±1.39 | 0.672, 0.502 | ||
| 2 | -6.40±2.22 | -2.89, 0.004** | -5.08±1.99 | -2.56, 0.012 | ||
Abbreviations: a β is regression coefficient for bivariate GLM, b β is regression coefficient for multiple GLM including E3, c β is regression coefficient for multiple GLM including E4, SE is standard error. p value is based on t test. *P < 0.008 after adjusting for multiple testing.
Table 4.
Results of factor analysis of familism (F18) showing rotated component for 4 factors.
| Rotated Component Matrix a | Factors | |||
| 1 | 2 | 3 | 4 | |
| Q16. A person should respect his or her older brothers and sisters regardless of their differences in views | .802 | .113 | ||
| Q7. Parents and grandparents should be treated with great respect regardless of their differences in views | .775 | .306 | .108 | |
| Q15. A person should always be expected to defend his or her family’s honor no matter what the cost | .714 | .284 | ||
| Q18. Children should obey their parents without question even if they believe they are wrong | .676 | .457 | ||
| Q14. Children should live with their parents until they get married. | .673 | .160 | .240 | .298 |
| Q11. Children should help out around the house without expecting an allowance. | .592 | .264 | ||
| Q9. The family should control the behavior of children younger than 18. | .589 | .125 | .354 | .150 |
| Q6. A person should always support members of the extended family, for example, aunts, uncles, and in-laws, if they are in need even if it is a big sacrifice | .537 | .494 | .154 | |
| Q17. A person should be a good person for the sake of his or her family. | .767 | -.101 | .389 | |
| Q10. A person should cherish time spent with his or her relatives | .689 | .235 | .103 | |
| Q5. A person should rely on his or her family if the need arises | .297 | .679 | .369 | |
| Q8. A person should often do activities with his or her immediate and extended families, for example, eat meals, play games, go somewhere together, or work on things together. | .491 | .512 | .408 | -.244 |
| Q3. A person should help his or her elderly parents in times of need, for example, help financially or share a house | .245 | .390 | .763 | |
| Q 2. Aging parents should live with their relatives | -.181 | .186 | .672 | .332 |
| Q 1. A person should live near his or her parents and spend time with them on a regular basis | .515 | .665 | .189 | |
| Q13. A person should feel ashamed if something he or she does dishonor the family name. | .222 | .117 | .741 | |
| Q 12. Children younger than 18 should give almost all their earnings to their parents. | .257 | .125 | .285 | .605 |
| Q 4. Children should always help their parents with the support of younger brothers and sisters, for example, help them with homework, help the parents take care of the children, and so forth | .373 | .239 | .305 | .480 |
Extraction Method: Principal Component Analysis. Rotation Method: Varimax with Kaiser Normalization. a. Rotation converged in 9 iterations. Bold items indicate factor loadings > 0.48.
Table 5.
Bivariate general linear models for potential variables with four factors of familism.
| Variable |
Factor 1 β ± SE |
t-value, p |
Factor 2 β ± SE |
t-value, p |
Factor 3 β ± SE |
t-value, p |
Factor 4 β ± SE |
t-value, p | ||||
| Cognitive impairment status (ref =No) | ||||||||||||
| AD or MCI | -0.28±0.31 | -0.90, 0.372 | -0.16±0.32 | -0.50, 0.622 | 0.03±0.32 | 0.09, 0.932 | 0.75±0.30 | 2.46, 0.016 | ||||
| Diabetes (ref= No) | ||||||||||||
| Yes | 0.41±0.22 | 1.84,0.070 | -.44±0.22 | -2.00, 0.049 | -0.15±0.23 | 0.67, 0.504 | 0.67±0.21 | 3.12, 0.003** | ||||
| Hypertension (ref=No) | ||||||||||||
| Yes | 0.19±0.24 | 0.81,0.420 | 0.02±0.24 | 0.07, 0.945 | 0.28±0.24 | 1.16, 0.248 | -0.05±0.24 | -0.21, 0.837 | ||||
| MoCA total score | -0.01±0.02 | -0.45, 0.655 | -0.01±0.02 | -0.18, 0.858 | -0.01±0.02 | -0.60, 0.549 | -0.04±0.02 | -2.38, 0.020 | ||||
Abbreviations: β is adjusted regression coefficient, SE is standard error. p value is based on t test. *P < 0.008 after adjusting for multiple testing.
Table 6.
Multiple general linear models and logistic regression analyses of factors of familism with clinical outcomes.
Table 6.
Multiple general linear models and logistic regression analyses of factors of familism with clinical outcomes.
| Variable |
MoCA_Total β ± SE |
χ2, p |
MoCA_Cog β ± SE |
χ2, p |
Diabetes β ± SE |
χ2, p |
| Gender (ref=Female) | ||||||
| Male | 2.33±1.24 | 3.55,0.060 | -0.80±0.69 | 1.38, 0.240 | 0.61±0.59 | 1.06, 0.304 |
| Education (ref= post-secondary) | ||||||
| Primary | -1.00±1.64 | -0.37,0.542 | -0.65±0.96 | 0.46, 0.498 | 2.14±0.84 | 6.42, 0.011 |
| Secondary | 0.25±1.64 | 0.02,0.878 | -0.54±0.95 | 0.33, 0.569 | 1.64±0.83 | 3.91, 0.048 |
| Age | -0.31±0.07 | 17.58, <0.001* | 0.03±0.05 | 0.48, 0.491 | 0.01±0.04 | 0.01, 0.997 |
| Factor 1 | ||||||
| Factor 2 | -0.82±0.34 | 5.89, 0.015 | ||||
| Factor 3 | ||||||
| Factor 4 | -0.86±0.59 | 2.15, 0.143 | 0.71±0.34 | 4.31, 0.038 | 0.76±0.31 | 6.41, 0.011 |
Abbreviations: β is adjusted regression coefficient, SE is standard error. p value is based on chi-square test. a is for self with dementia vs. no, b is for family with dementia vs no. *P < 0.008 after adjusting for multiple testing. Factor 4 (no is reference).
Disclaimer/Publisher’s Note: The statements, opinions and data contained in all publications are solely those of the individual author(s) and contributor(s) and not of MDPI and/or the editor(s). MDPI and/or the editor(s) disclaim responsibility for any injury to people or property resulting from any ideas, methods, instructions or products referred to in the content. |
© 2025 by the authors. Licensee MDPI, Basel, Switzerland. This article is an open access article distributed under the terms and conditions of the Creative Commons Attribution (CC BY) license (http://creativecommons.org/licenses/by/4.0/).
Copyright: This open access article is published under a Creative Commons CC BY 4.0 license, which permit the free download, distribution, and reuse, provided that the author and preprint are cited in any reuse.


