Preprint
Article

This version is not peer-reviewed.

Efficacy of a Naturally Calcium- and Magnesium-Rich Mineral Water on Musculoskeletal Fragility: A Randomized, Double-Blind Controlled Trial

Submitted:

30 December 2025

Posted:

31 December 2025

You are already at the latest version

Abstract

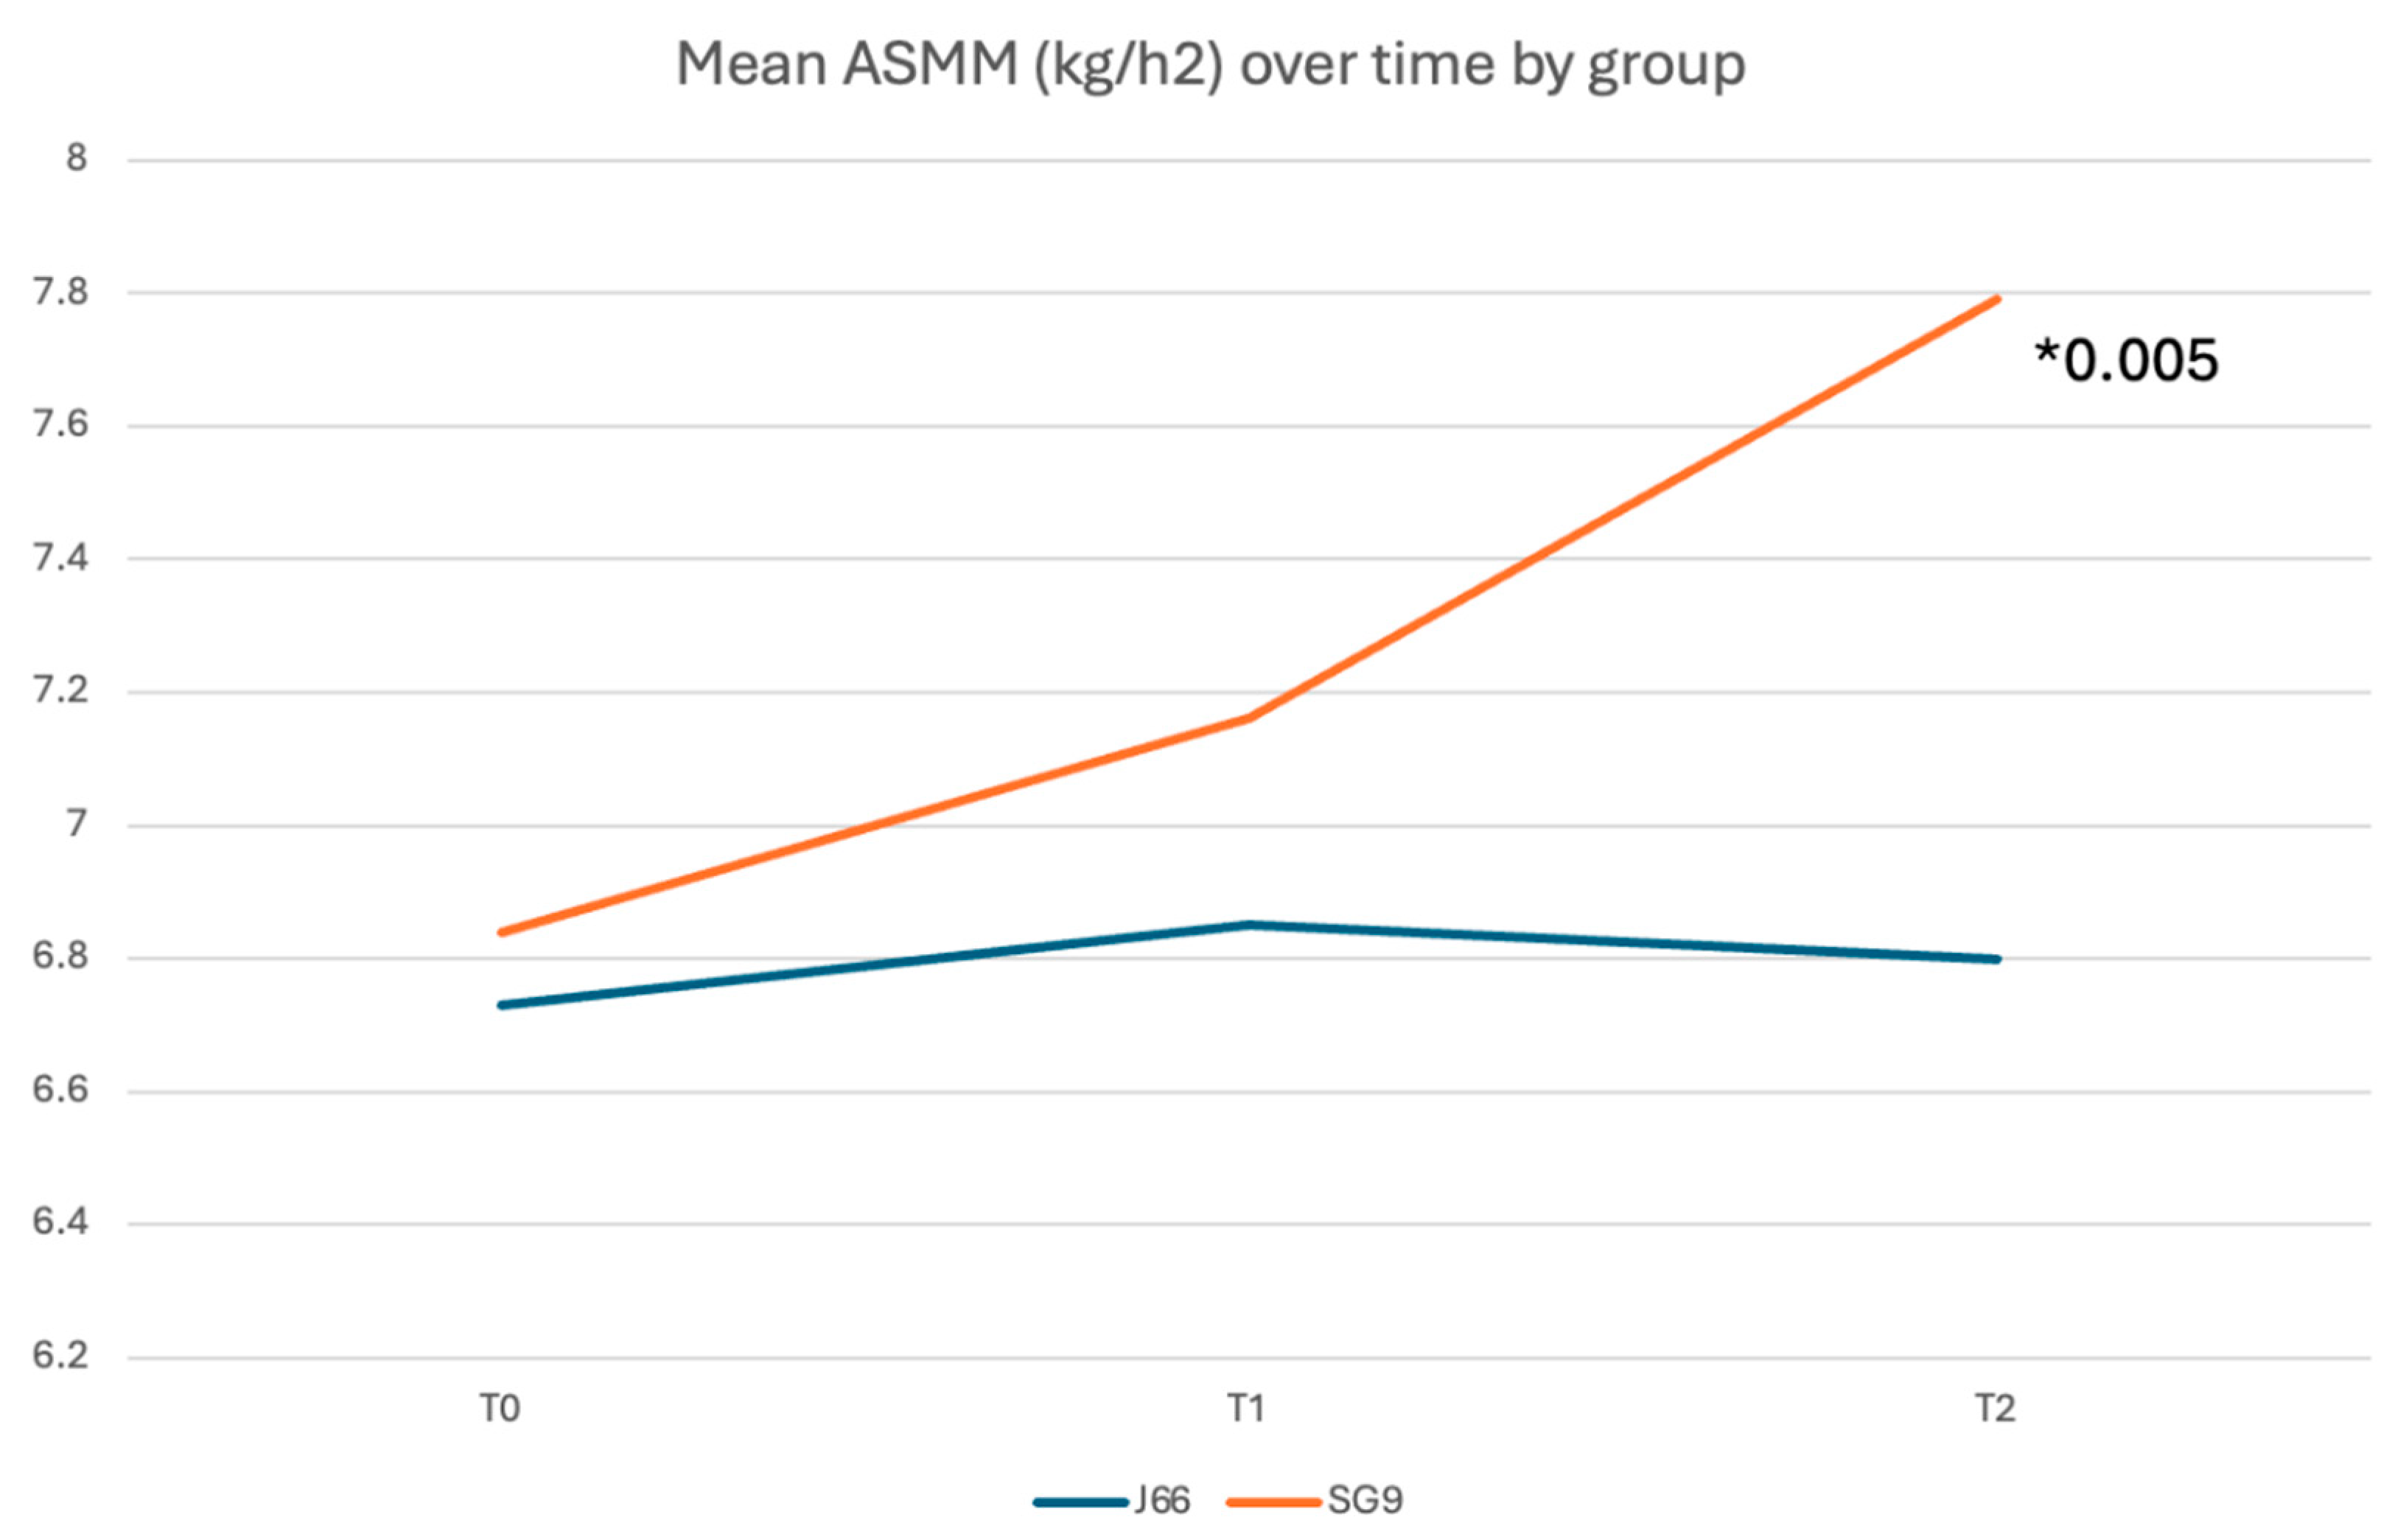
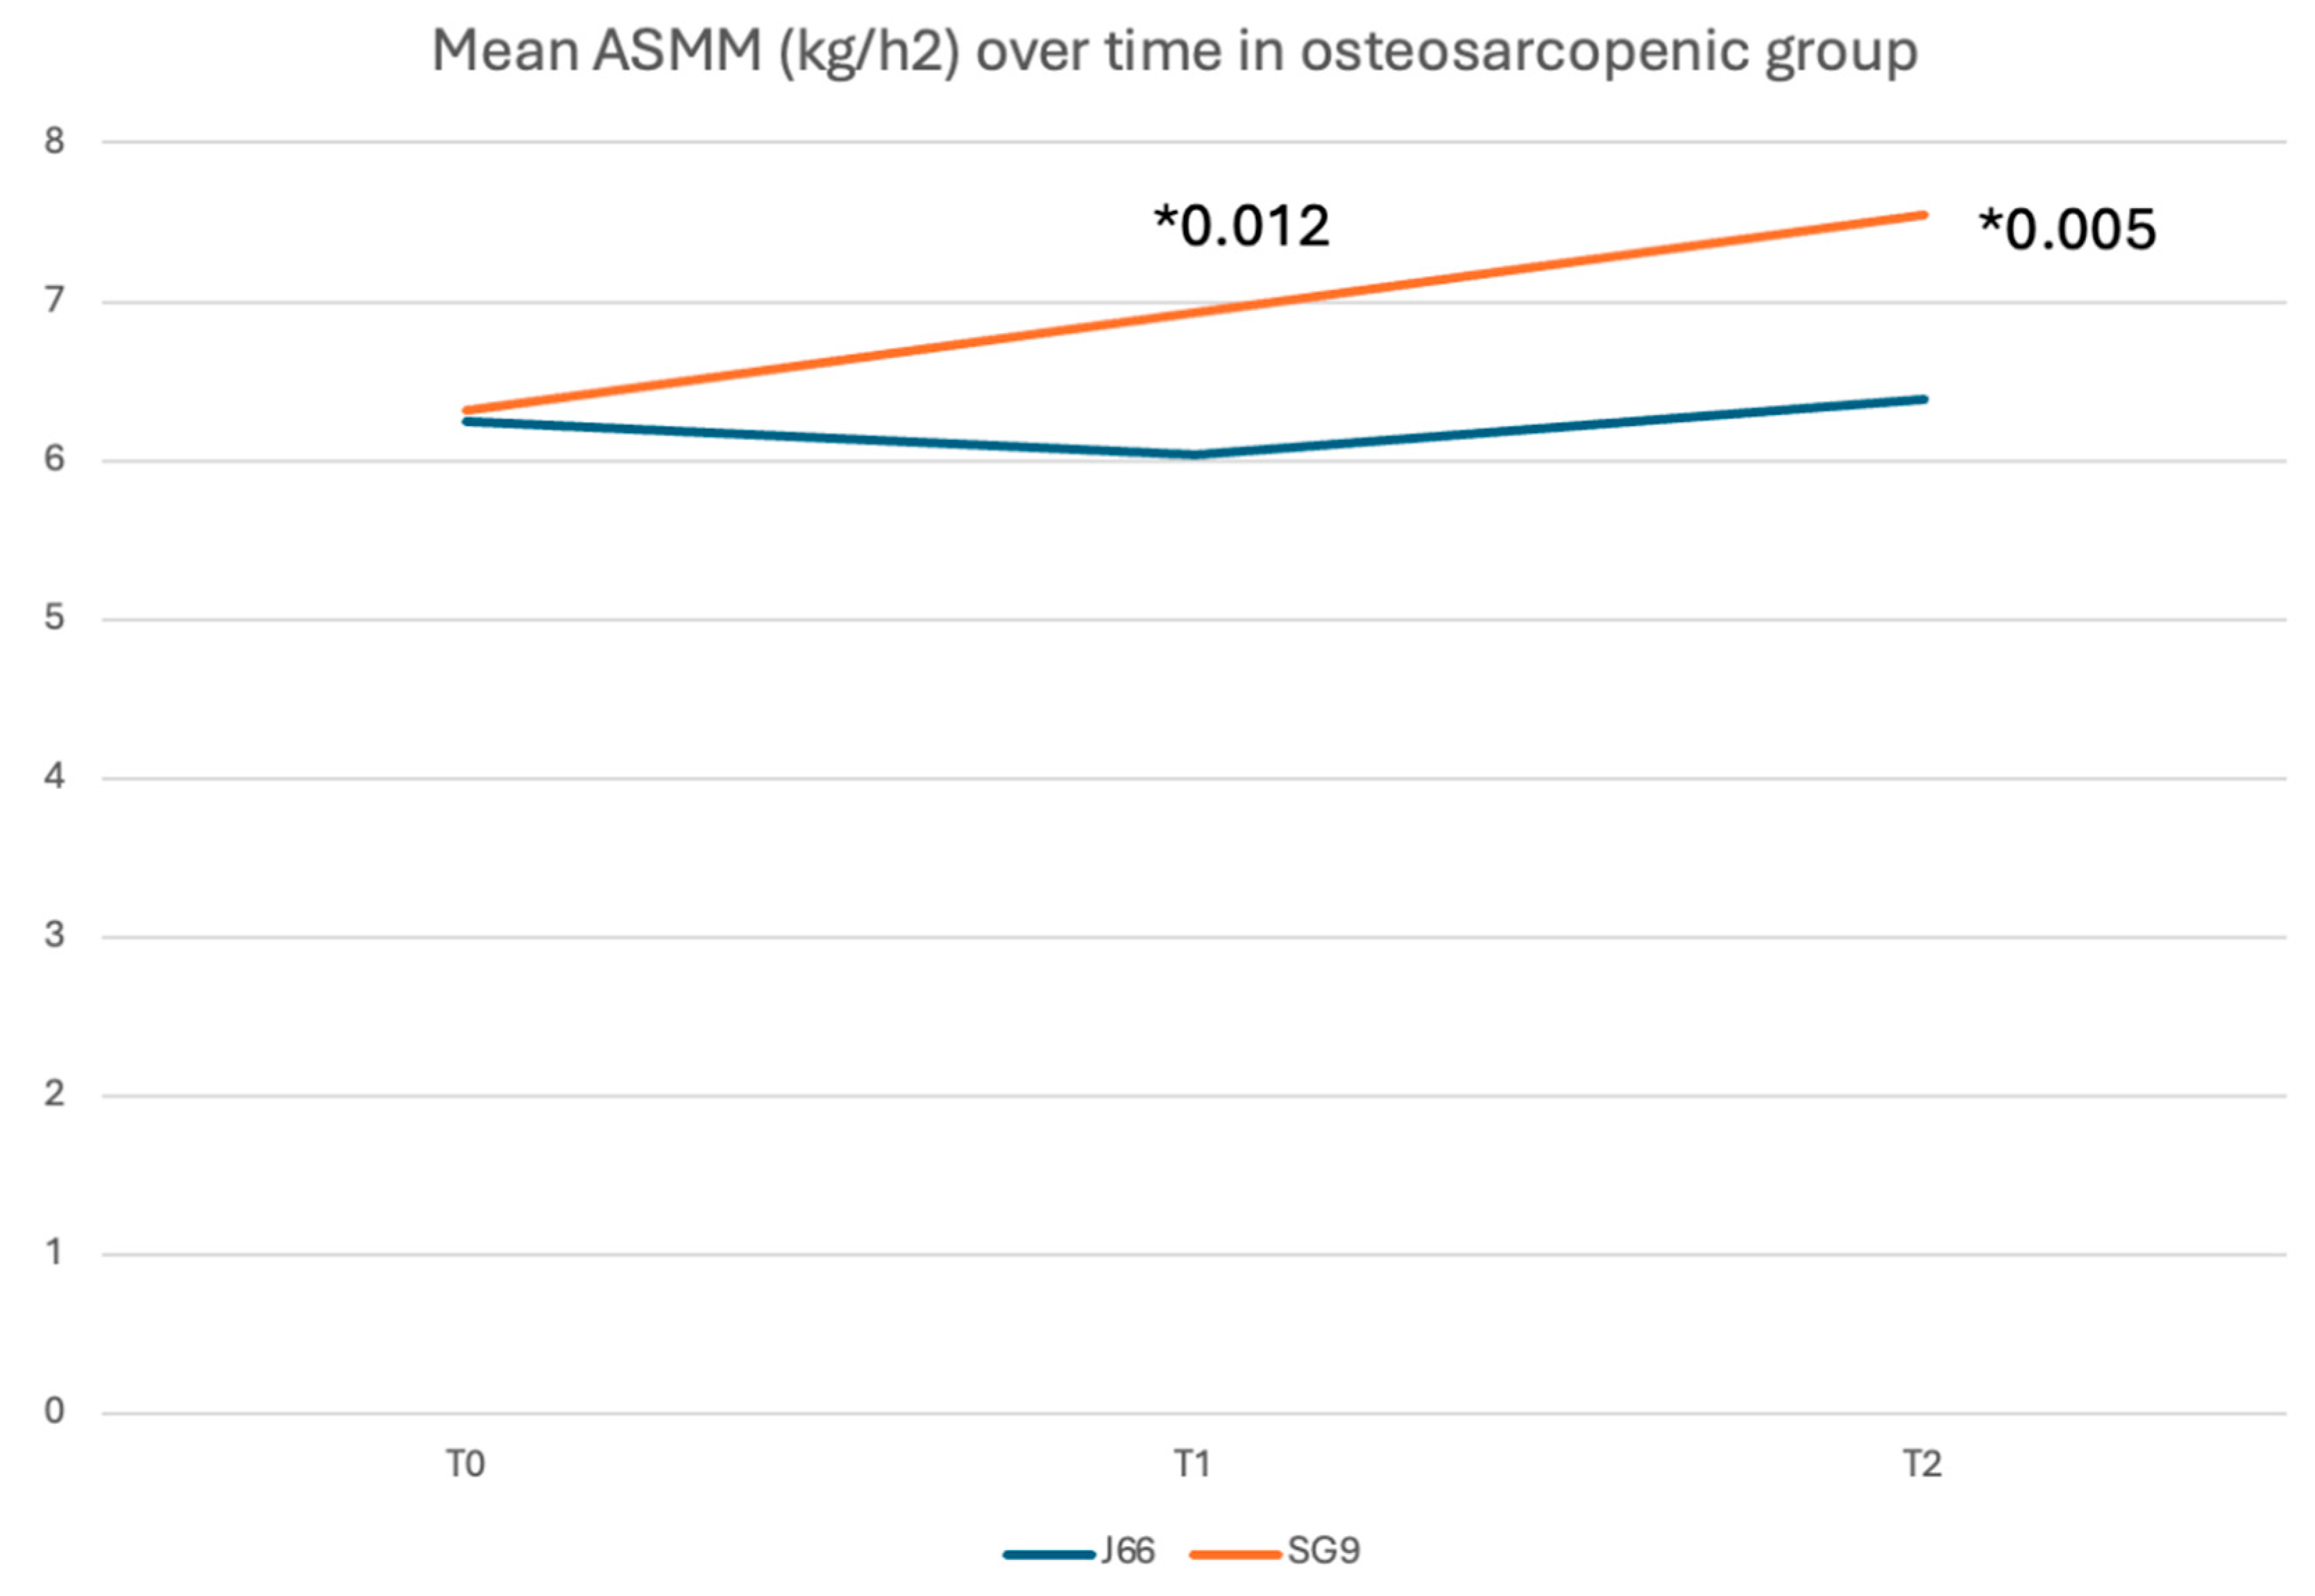
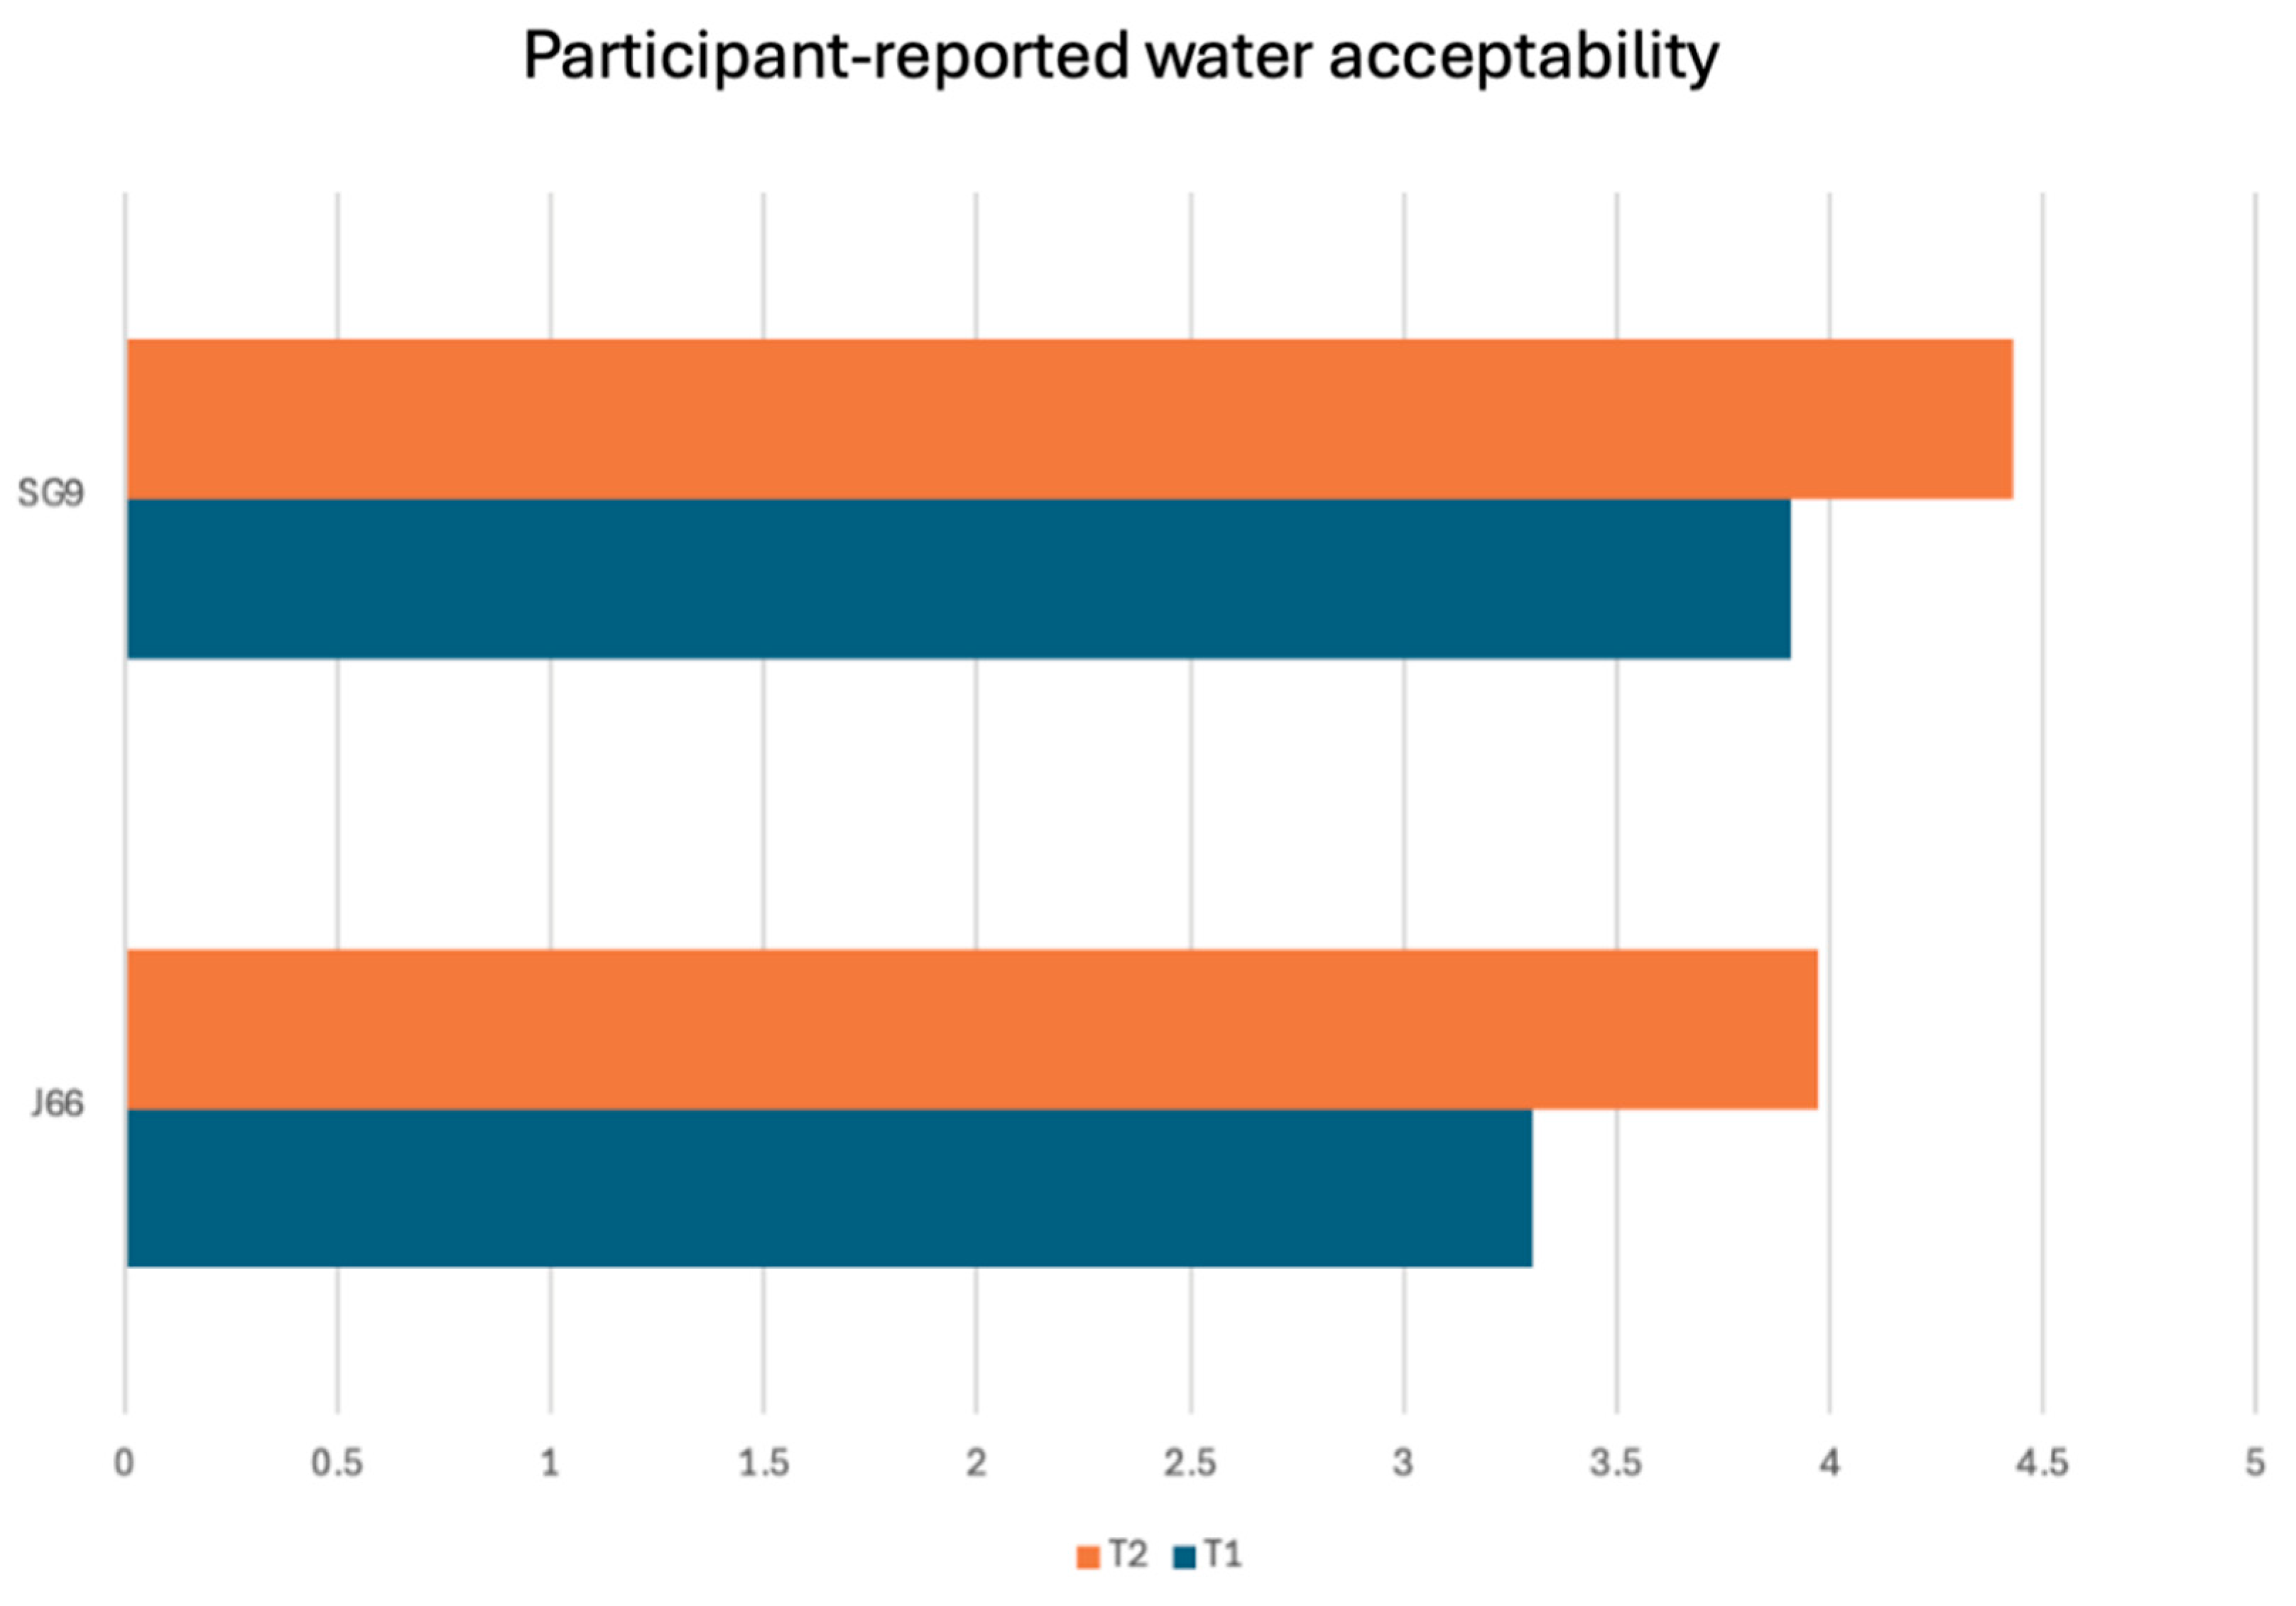
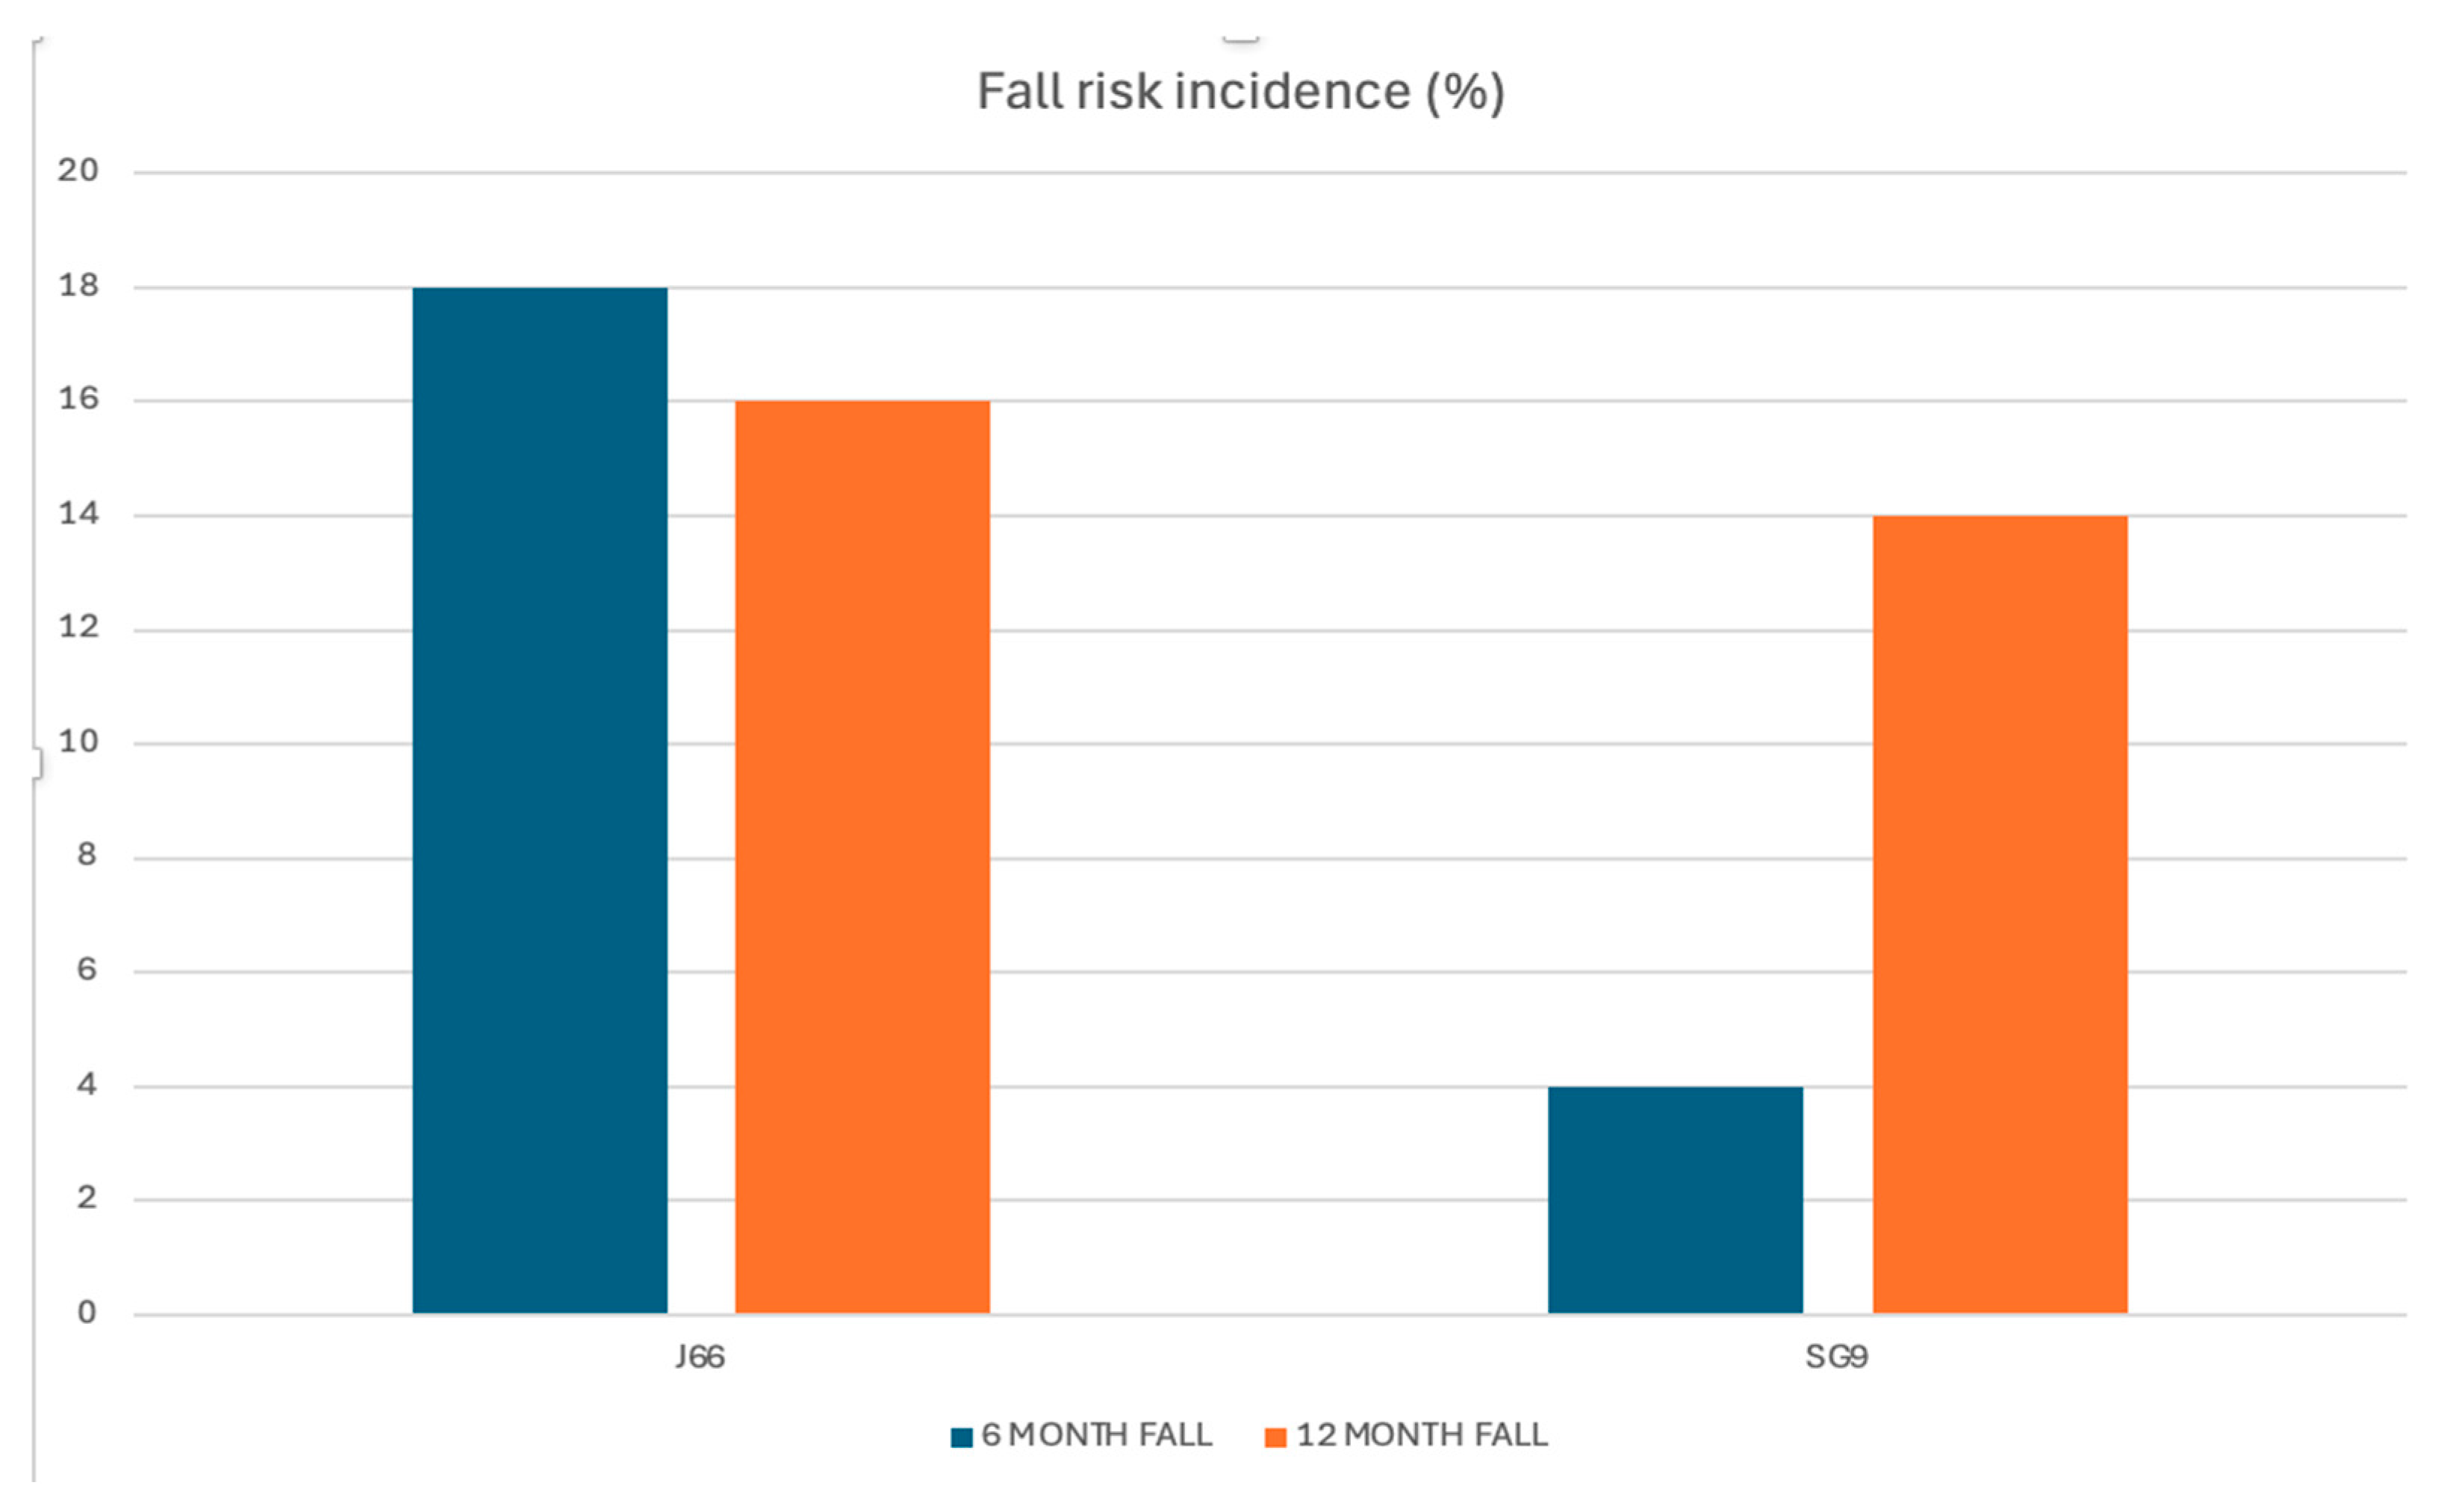
Background/Objectives: Calcium and magnesium are essential minerals involved in neuromuscular function, bone metabolism, and fall prevention. Deficiency of these minerals contributes to musculoskeletal fragility, including osteoporosis, sarcopenia, and falls. While dairy products are the traditional source of dietary calcium, mineral waters naturally rich in calcium and magnesium offer a highly bioavailable alternative. This study evaluated the efficacy of daily intake of a naturally calcium‑ and magnesium‑rich mineral water compared with low-mineral water on fall risk, muscle mass, and muscle function in adults aged ≥50 years, with or without osteosarcopenia. Methods: In this 12‑month, randomized, double‑blind, controlled trial, 98 participants were assigned to consume 1 L/day of either SG9 (mineral water with high calcium and magnesium content) or J66 (low-mineral water). Outcomes included incidence of falls (primary endpoint), appendicular skeletal muscle mass (ASMM), muscle strength, physical performance, biochemical markers, and patient-reported measures. Assessments were performed at baseline, 6 months, and 12 months following CONSORT guidelines. Results: Ninety-eight participants (mean age ~63 years) were randomized and completed the 12-month follow-up. At 6 months, the incidence of falls was significantly lower in the SG9 group compared with the J66 group (relative risk reduction 82%; RR = 0.18, 95% CI 0.04–0.88; p < 0.05), whereas no significant between-group difference was observed at 12 months. Appendicular skeletal muscle mass indexed to height (ASMM/h²) was significantly higher in the SG9 group at 12 months (p = 0.005). In participants with osteosarcopenia, SG9 intake was associated with a consistent improvement in ASMM/h² at 6 and 12 months (p = 0.012 and p = 0.005, respectively). No significant between-group differences were detected in physical performance scores, biochemical markers, or quality-of-life measures. Conclusions: Daily consumption of calcium- and magnesium rich mineral water reduced fall risk and improved muscle mass in adults over 50 years, with or without osteosarcopenia. These findings support the role of calcium- and magnesium-rich mineral water as a complementary nutritional strategy for musculoskeletal health and fragility prevention.

Keywords: 
;  ;  ;  ;  ;  ;  ;  

1. Introduction

Calcium is an essential mineral involved in numerous physiological functions, including energy metabolism, muscle contraction, nerve impulse transmission, and bone mineralization [1]. Approximately 99% of the body’s calcium is stored in mineralized tissues, while the remaining fraction is distributed in body fluids and soft tissues, including muscle [2]. Serum calcium acts as the primary modulator of the calcium–vitamin D–parathyroid hormone (PTH) axis, tightly regulating PTH secretion through calcium-sensing receptors and, in turn, influencing vitamin D activation and systemic calcium homeostasis [3]. Magnesium is another key mineral for musculoskeletal physiology. It serves as a cofactor in more than 300 enzymatic reactions, including ATP synthesis, muscle contraction and relaxation, neuromuscular transmission, and vitamin D metabolism [4]. Suboptimal magnesium intake is common in older adults and has been associated with reduced muscle performance, impaired bone quality, and increased fall risk [5]. Importantly, magnesium and calcium share interconnected regulatory pathways, and inadequate magnesium status may compromise calcium homeostasis and musculoskeletal function [6]. Calcium deficiency is common among older adults and represents major risk factors for osteoporosis, sarcopenia, and falls, thereby increasing the likelihood of fragility fractures [7]. Sarcopenia is characterized by the progressive loss of muscle mass and strength, frequently associated with aging [8]. Its coexistence with osteoporosis has led to the definition of osteosarcopenia, a multifactorial condition with significant healthcare and social costs. Among the modifiable risk factors for osteosarcopenia, nutrition plays a central role. Adequate intake of calcium has been associated with higher bone mineral density (BMD) and better muscle function, including fall risk reduction [9,10,11]. Traditionally, dairy products are the main dietary sources of calcium. However, not everyone can or choose to consume them due to lactose intolerance, dietary preferences, or medical contraindications [12]. In this context, mineral waters naturally rich in calcium and magnesium represent a valid alternative, as the bioavailability of calcium from these waters is comparable to that from dairy sources, and they simultaneously provide a readily absorbable source of magnesium [13,14]. This is particularly relevant for postmenopausal women, for whom sufficient intake of both minerals is crucial in preventing bone loss and supporting neuromuscular function. While calcium-rich water has been recognized for its potential benefits on bone health, its effects on muscle function are less well understood. Several epidemiological and clinical studies have already demonstrated an association between higher calcium intake—including from drinking water—and improved bone health. As early as 1979, Matković et al. [15] studied two Yugoslavian populations living in areas with differing calcium concentrations in drinking water. Their findings showed that higher calcium intake was associated with increased cortical bone mass and a lower incidence of fractures. Later, Cepollaro et al. [16] confirmed that, in early postmenopausal women, regular consumption of calcium-rich mineral water can help maintain BMD. Despite growing evidence supporting the benefits of mineral waters for bone health, limited data are available on their impact on muscle mass and function. Given the high bioavailability of calcium contained in naturally calcium-rich mineral waters, and the synergistic role of magnesium in neuromuscular function, the daily intake of 1 L of calcium- and magnesium-rich mineral water may help maintain musculoskeletal function, support the preservation of muscle mass, and potentially slow age-related muscle loss, particularly in individuals with musculoskeletal fragility. However, clinical evidence on the effects of such waters on muscle mass and fall risk remains limited, underscoring the need for controlled trials to clarify these potential benefits.
The primary aim of this study is to evaluate the efficacy of daily intake of a naturally calcium- and magnesium-rich mineral water on fall risk, muscle mass and function, in adults over the age of 50, with or without musculoskeletal fragility.

2. Materials and Methods

This study is a 12-month, randomized, double-blind, controlled clinical trial, conducted at the Unit of Physical and Rehabilitation Medicine of the University Hospital “Luigi Vanvitelli” in Naples, Italy. The protocol was developed in accordance with the principles of the Declaration of Helsinki, approved by the local Ethics Committee (Protocol No. 0035084/i, dated 15 December 2023), and registered on ClinicalTrials.gov (Identifier: NCT06851676). The trial was reported following the CONSORT guidelines for randomized controlled trials [17]. Adults aged ≥50 years, community-dwelling and ambulatory, referring to the rehabilitation outpatient service, were eligible for inclusion. Participants could present with normal musculoskeletal status or with osteopenia, osteoporosis, sarcopenia, or osteosarcopenia, diagnosed either previously or at baseline according to standardized criteria (DXA-based T-scores for bone status and EWGSOP2 criteria for sarcopenia). All participants were required to be independent in basic activities of daily living and not receive pharmacological calcium and/or magnesium supplementation. Participants were consecutively screened among all adults aged ≥50 years attending the outpatient rehabilitation service during the recruitment period. Screening was performed systematically by trained investigators according to predefined eligibility criteria. This recruitment strategy was designed to reflect a real-world clinical population at risk of musculoskeletal fragility, thereby enhancing the external validity of the findings. We excluded individuals with secondary causes of osteoporosis, such as prolonged glucocorticoid therapy, chronic liver or kidney disease, endocrine disorders, or malignancies, or musculoskeletal impairments leading to loss of independence in activities of daily living (ADLs). Other exclusion criteria included neurodegenerative or inflammatory conditions, advanced degenerative joint diseases, chronic obstructive pulmonary disease, psychiatric disorders that could impair informed consent, and pregnancy or lactation. All participants provided written informed consent before enrollment. The intervention consisted of daily consumption of one liter of mineral water. Participants were randomized to receive 1 L/day of Fonte Fausta® (SG9 code, naturally calcium- and magnesium-rich mineral water; calcium 587 mg/L, magnesium 128 mg/L, sodium 18.8 mg/L, bicarbonate 256 mg/L) or Natia® (J66 code, low-mineral water; calcium 36 mg/L, magnesium 4.9 mg/L, sodium 30 mg/L, bicarbonate 230 mg/L). Participants were instructed to consume 1 L/day of the assigned water, distributed throughout the day. Both waters were still and packaged identically to ensure blinding. Randomization was performed using computer-generated blocks, stratified by sex and osteosarcopenia status, with allocation concealed in sealed envelopes held by Ferrarelle S.p.A. Allocation concealment was guaranteed by sealed coding, which was released only after completion of data collection and statistical analysis. Neither participants nor investigators were aware of group assignments throughout the study, ensuring a double-blind design. The primary outcome of the trial was the incidence of falls, assessed at six and twelve months, considered as a key outcome of musculoskeletal fragility. Alongside this, a broad set of secondary outcomes was evaluated to capture structural, functional, biochemical, and patient-reported dimensions of musculoskeletal health. Body composition was assessed by bioelectrical impedance analysis (BIA 101 BIVA® PRO, Akern) to measure appendicular skeletal muscle mass (ASMM), while muscle strength was measured using handgrip dynamometry (Jamar dynamometer, Sammons Preston Rolyan, Bolingbrook, IL). Comorbidity burden was assessed using the Cumulative Illness Rating Scale (CIRS), which evaluates the severity and number of chronic medical conditions across multiple organ systems. The CIRS Severity Index, Comorbidity Index, and Total Score were calculated and used to characterize baseline clinical complexity and comparability between groups. Physical performance was assessed using the Short Physical Performance Battery, including balance, gait speed, and sit-to-stand testing, along with a direct measurement of gait speed in meters per second. The level of physical activity was determined using the International Physical Activity Questionnaire (IPAQ) and objectively measured in metabolic equivalent of task (MET) units using the ActiGraph GT3X+ accelerometer. Biochemical outcomes comprised serum calcium, phosphate, magnesium, creatinine, parathyroid hormone (PTH), 25-hydroxyvitamin D, alkaline phosphatase (ALP), bone-specific ALP, and inflammatory markers such as C-reactive protein (CRP) and erythrocyte sedimentation rate (ESR). In addition, bone turnover markers, myokines, and adipokines were analyzed, including CTX, P1NP, P3NP, sclerostin, irisin, leptin, and TNF-α. Urinary outcomes were also collected, consisting of 24-hour calcium, magnesium, and phosphate excretion, together with creatinine clearance. Finally, patient-reported outcomes were assessed using the EuroQoL-5D-3L index and visual analogue scale, complemented by a 7-point Likert scale evaluating the acceptability of the intervention. All assessments were performed at baseline (T0), 6 months (T1), and 12 months (T2), under standardized conditions (morning, fasting, same operator). Sample size was calculated a priori to detect a 20% relative reduction in fall incidence with 80% power and a two-sided α of 0.05, resulting in a target enrollment of 98 participants (49 per group). All statistical analyses were performed using IBM SPSS Statistics, version 29 (IBM Corp., Armonk, NY, USA). Continuous variables were expressed as mean ± standard deviation (SD) or median and interquartile range (IQR), according to their distribution, assessed using the Shapiro-Wilk test. Categorical variables were reported as absolute frequencies and percentages. For each group, comparisons across the time points were conducted using the Friedman test. When the overall test was significant, post-hoc pairwise comparisons between time points were carried out using the Mann–Whitney U test. For between-group comparisons at the time points, a multivariate General Linear Model (GLM) was applied to evaluate mean differences across groups. Bonferroni-adjusted post-hoc tests were used to control multiple comparisons. In addition, fall risk at 6- and12- months was compared between groups using the χ² test. Relative risk (RR) and 95% confidence intervals were calculated to quantify the difference in fall occurrence between the two water interventions. A two-tailed p-value < 0.05 was considered statistically significant. Missing data were handled using an intention-to-treat approach with appropriate imputation.

3. Results

A total of 108 individuals were screened for eligibility, of whom 98 met inclusion criteria and were randomized to receive either J66 water (n = 48) or SG9 water (n = 50). All participants completed the 12-month follow-up, with no losses or discontinuations (Figure 1). Baseline demographic, biochemical, and functional characteristics were generally comparable between groups (Table 1). No significant baseline differences were observed within the osteosarcopenic subgroup (Table 2). At 6 months, no significant differences were observed between the two groups in serum and urinary biochemical markers or patient-reported outcomes (Table 3). Fall risk differed significantly between groups. At the 6-month fall risk assessment, conducted using the χ² test, a comparison between the two groups revealed that 9 patients in the J66 group and 2 patients in the SG9 group had experienced at least one fall in the previous six months (“fallers”). The risk of falling in the SG9 group was 82.0% lower than the J66 group (RR = 0.18; 95% CI: 0.04–0.88). In the 12-month analysis (T2), the risk of falling was not statistically significant between water groups (RR = 0.69; 95% CI: 0.227–2.129) (Figure 2).
In the osteosarcopenic subgroup, both 6- and 12-month risk of fall was not statistically significant (T1 p= 0.069; T2 p = 0.536).
Measures of physical performance, including SPPB total score, balance, gait speed, sit-to-stand, and handgrip strength, did not differ significantly between groups. No other body-composition parameters differed significantly. After 12 months, serum and urinary biochemical parameters remained largely comparable between groups (Table 4). However, urinary magnesium excretion was significantly higher in the SG9 group (p = 0.03), while urinary calcium excretion was significantly lower in the J66 group (p = 0.05). Functional outcomes, including SPPB components, gait speed, and handgrip strength, did not differ significantly between groups at 12 months. ASMM/h² was significantly higher in the SG9 group compared with the J66 group at 12 months (mean difference = -0.890 kg/m²; 95% CI: -1.499 to -0.281; p = 0.005). A predefined subgroup analysis was conducted in participants with osteosarcopenia (J66: n = 12; SG9: n = 8). At 6 months, no significant differences were detected between groups for biochemical markers or SPPB performance (Table 5). At both 6- and 12- months, subgroup analyses highlighted a consistent trend toward improved ASMM in participants receiving SG9, with values higher than those observed in the J66 group (T1: mean difference = -0.88 kg/m²; 95% CI: -1.51; -0.26; p = 0.012 T2: mean difference = -0.988 kg/m²; 95% CI: -1.682, -0.294; p = 0.005, respectively). These detailed outcomes are reported in Table 6, which summarizes the comparative results for the osteosarcopenic population.
At both 6 and 12 months, participants’ ratings of water palatability showed a consistent preference for the SG9 water compared with J66. In the J66 group, mean acceptability increased from 3.30 at the first assessment to 3.97 at 12 months, indicating a gradual improvement over time. In contrast, the SG9 group started with a higher baseline appreciation (3.91) and further increased to 4.43 at 12 months. This pattern suggests that SG9 water was not only better accepted from the outset but also continued to gain favor throughout the follow-up period. However, despite these numerical differences, none of the comparisons reached statistical significance, indicating that the observed trends should be interpreted with caution (J66 p-value = 0.746 SG9 p-value = 0.064) (Figure 5).
Figure 3. Muscle mass changes in general population.
Preprints 192088 g003
Figure 4. Muscle mass changes in osteosarcopenic patients.
Preprints 192088 g004
Figure 5. Participant-reported water acceptability.
Preprints 192088 g005

4. Discussion

This randomized, double-blind controlled trial investigated the efficacy of a naturally calcium- and magnesium-rich mineral water on fall risk reduction, muscle mass, and muscle strength improvements in patients with or without a diagnosis of osteosarcopenia. Although a significant reduction in fall incidence was observed at 6 months in participants consuming calcium- and magnesium-rich mineral water, this effect was not maintained at the 12-month follow-up. This finding should be interpreted in light of the multifactorial and dynamic nature of falls. Early improvements may reflect short-term neuromuscular benefits of optimized calcium and magnesium availability, including enhanced muscle excitability and postural control, which may precede measurable changes in strength or physical performance. Over time, however, fall risk is increasingly influenced by behavioral, environmental, and clinical factors that are not directly modulated by mineral intake alone [18]. Notably, despite a significant increase in appendicular skeletal muscle mass at 12 months, no parallel improvements in muscle strength or physical performance were detected, supporting the concept that gains in muscle mass per se may be insufficient to ensure sustained fall prevention. Furthermore, the relatively low number of fall events at 12 months and the resulting wide confidence intervals may have limited the statistical power to detect between-group differences at later time points. Taken together, these findings suggest that calcium- and magnesium-rich mineral water may contribute to early fall risk reduction and long-term preservation of muscle mass, but that durable fall prevention likely requires a multimodal approach integrating nutritional strategies with targeted exercise and balance interventions. The dual high content of calcium and magnesium in SG9 may contribute synergistically to neuromuscular function, potentially explaining the observed reduction in falls and the improvement in muscle mass. Magnesium plays a key role in ATP production, muscle contraction and relaxation, neuromuscular transmission, and vitamin D activation; thus, its co-delivery with calcium may enhance the physiological impact on muscle performance and balance [4]. These findings align with the growing body of evidence supporting the importance of adequate mineral intake, particularly calcium and magnesium, in fall prevention. A recent Japanese observational study involving over 38,000 adults reported that low dietary calcium intake was significantly associated with an increased risk of falls, with adjusted odds ratios of 1.29 in men and 1.12 in women (lowest vs. highest quartile) in cross-sectional analyses, with similar results confirmed longitudinally after a 5-year follow-up [19]. Although the study by Asano et al. assessed calcium intake from food rather than water, its findings reinforce the hypothesis that sufficient calcium intake, regardless of source, may help maintain musculoskeletal efficiency and reduce the risk of falls and, ultimately, fragility fractures. Magnesium intake has also been associated with improved muscle performance, reduced frailty, and better physical function in older adults, further supporting the biological plausibility of our results [5,20,21]. Our study is among the few to specifically evaluate the impact of mineral water intake providing both calcium and magnesium on musculoskeletal health. Previous research has shown that the bioavailability of calcium from mineral waters is comparable to, or even greater than, that from milk and dairy products, supporting the hypothesis that such waters may represent an effective and accessible source of dietary calcium, especially for individuals who are lactose intolerant or have low adherence to dairy consumption [22]. Importantly, magnesium from mineral water is also highly bioavailable, and its co-absorption may facilitate optimal calcium utilization and endocrine regulation [23]. The intestinal absorption of calcium from certain mineral waters can reach levels similar to or higher than those of traditional calcium sources, making them a useful alternative for maintaining musculoskeletal health [22]. Another notable finding in our study was the significant change in body composition, with an increase in ASMM observed in the subgroup of osteosarcopenic patients treated with SG9 water. This result is particularly relevant as it suggests that patients with reduced muscle reserve are more responsive to high-bioavailability mineral supplementation. Recent evidence indicates that calcium is not only essential for bone health and muscle contraction but may also influence muscle mass through various cellular mechanisms [24]. Specifically, intracellular calcium contributes to muscle mass maintenance via the activity of the mechanosensitive channel Piezo1. Reduced Piezo1 expression, as seen during immobilization, is associated with activation of the KLF15/IL-6 pathway and muscle atrophy. Furthermore, calcium may indirectly regulate protein synthesis through the AMPK/mTOR signaling pathway. Magnesium, in turn, is required for ATP stability, ribosomal function, and protein synthesis, and low magnesium status has been linked to reduced muscle mass and strength. Together, these mechanisms support the hypothesis that adequate calcium and magnesium supply, including through mineral water intake, may help maintain muscle mass, especially in individuals with osteosarcopenia (Figure 6). [25]. The physiological increase in urinary calcium observed in the SG9 group, remaining within normal limits, likely reflects improved calcium bioavailability and a more efficient calcium–vitamin D–PTH axis, with reduced parathyroid stimulation. Similarly, the increase in urinary magnesium observed at 12 months is consistent with the higher magnesium content of SG9 and may indicate adequate absorption and renal handling of the mineral. This optimized mineral homeostasis may represent a key mechanistic link between adequate calcium and magnesium intake and the observed reduction in fall risk and improvement in muscle mass, particularly in individuals with osteosarcopenia [26]. In this context, urinary calcium and magnesium emerge as integrative and clinically meaningful indicators of effective mineral utilization at the musculoskeletal level, reinforcing the concept that functional outcomes may depend more on mineral bioavailability and endocrine balance than on static serum measurements alone. In our study, daily intake of SG9 resulted in a significant increase in ASMM, suggesting a potential role in supporting the maintenance of muscle mass and slowing its age-related decline. The reduction in fall risk observed at 6 months further indicates a possible benefit on overall musculoskeletal function, consistent with the physiological roles of calcium and magnesium in muscle contraction, neuromuscular transmission, and postural stability. The high assimilability of calcium from mineral waters such as SG9, well documented in previous literature, is supported by the stable biochemical profile observed in our cohort and by the increased urinary magnesium excretion in the intervention group. Although our study did not directly assess bone mineral density or fracture incidence, the reduction in falls represents a clinically meaningful outcome in the prevention of fragility fractures, particularly in individuals with osteopenia or osteoporosis. This study has several strengths. To our knowledge, it represents the first randomized, double-blind controlled trial specifically investigating the efficacy of a naturally calcium and magnesium rich mineral water on both functional and metabolic outcomes related to musculoskeletal health. The pragmatic trial design, including adults over 50 years at increased risk of musculoskeletal fragility and minimal interference with usual lifestyle habits, enhances real-world applicability. The long follow-up period, high adherence, and blinding procedures strengthen internal validity. Moreover, the integrated evaluation of falls, physical performance, body composition, biochemical markers, and patient-reported outcomes provides a comprehensive and clinically meaningful assessment that aligns with current multidimensional approaches to musculoskeletal health. However, several limitations of the present study should be acknowledged. First, although the trial was adequately powered for the primary outcome, it was not powered to detect definitive effects within specific clinical subgroups. Participants included adults over 50 years with heterogeneous musculoskeletal profiles, ranging from individuals without diagnosed musculoskeletal fragility to those with osteosarcopenia. Consequently, all subgroup analyses should be considered exploratory and hypothesis-generating rather than confirmatory, particularly for the osteosarcopenic subgroup, which included a limited number of participants. Second, the heterogeneity of the enrolled population, while increasing the external validity and pragmatic relevance of the study, may have diluted intervention effects in the overall analysis and complicated the interpretation of subgroup-specific findings. Future studies specifically designed and powered for homogeneous populations are needed to confirm these observations. Third, the study population was predominantly female, reflecting the epidemiology of osteosarcopenia and related conditions in older adults. However, this sex imbalance limits the generalizability of the findings to male populations and precluded sex-stratified analyses. Fourth, although participants were instructed to maintain their usual diet throughout the study period, detailed dietary intake was not strictly controlled. Therefore, residual confounding from unmeasured nutritional or behavioral factors cannot be completely excluded. Finally, while the study followed a double-blind randomized design and included an extensive panel of biochemical and functional outcomes, the mechanistic pathways underlying the observed effects of calcium- and magnesium-rich mineral water on muscle and bone metabolism cannot be fully elucidated within the present framework and warrant further investigation in targeted clinical studies. Overall, our findings suggest that daily consumption of mineral water naturally rich in calcium and magnesium may represent a simple and well-tolerated strategy to improve musculoskeletal function, particularly in individuals with osteosarcopenia, thereby reducing the risk of falls and potential fragility fractures.

5. Conclusions

Daily intake of 1 L of SG9, a mineral water rich in bioavailable calcium and magnesium, was associated with clinically meaningful improvements in musculoskeletal health, including reduced fall risk and increased muscle mass, particularly in individuals with osteosarcopenia. These findings indicate that calcium- and magnesium-rich mineral water may serve as a practical, safe, and scalable nutritional intervention to support musculoskeletal function and mitigate age-related muscle loss in adults over 50 years. Larger, long-term studies are needed to confirm these effects, elucidate underlying mechanisms, and determine potential benefits on bone health and fracture risk.

Author Contributions

Conceptualization, G.I., F.G., and A.M.; methodology, G.I., A.M., and S.L.; formal analysis, S.L.; investigation, X.X.; resources, X.X.; data curation, G.I., A.M., and S.L.; writing—original draft preparation, G.I., F.G., A.M., and M.P..; writing—review and editing, A.M., and M.P..; supervision, F.G.; funding acquisition, G.I., A.M. All authors have read and agreed to the published version of the manuscript.

Funding

This research was funded by Ferrarelle S.p.A.

Institutional Review Board Statement

The study was conducted in accordance with the Declaration of Helsinki and approved by the Ethics Committee “Campania 2” (Protocol No. 0035084/i, dated 15 December 2023).

Informed Consent Statement

Informed consent was obtained from all subjects involved in the study.

Data Availability Statement

The raw data supporting the conclusions of this article will be made available by the authors on request.

Conflicts of Interest

The authors declare no conflicts of interest. The funders had no role in the design of the study; in the collection, analyses, or interpretation of data; in the writing of the manuscript; or in the decision to publish the results.

References

  1. Vannucci, L.; Fossi, C.; Quattrini, S.; Guasti, L.; Pampaloni, B.; Gronchi, G.; Giusti, F.; Romagnoli, C.; Cianferotti, L.; Marcucci, G.; Brandi, M. L. Calcium Intake in Bone Health: A Focus on Calcium-Rich Mineral Waters. Nutrients 2018, 10(12), 1930. [Google Scholar] [CrossRef] [PubMed]
  2. Veldurthy, V.; Wei, R.; Oz, L.; et al. Vitamin D, calcium homeostasis and aging. Bone Res 2016, 4, 16041. [Google Scholar] [CrossRef] [PubMed]
  3. Goltzman, D; Mannstadt, M; Marcocci, C. Physiology of the Calcium-Parathyroid Hormone-Vitamin D Axis. Front Horm Res. 2018, 50, 1–13. [Google Scholar] [CrossRef] [PubMed]
  4. Fatima, G; Dzupina, A; B Alhmadi, H; Magomedova, A; Siddiqui, Z; Mehdi, A; Hadi, N. Magnesium Matters: A Comprehensive Review of Its Vital Role in Health and Diseases. Cureus 2024, 16(10), e71392. [Google Scholar] [CrossRef] [PubMed] [PubMed Central]
  5. Dominguez, LJ; Mérida, DM; Donat-Vargas, C; Banegas, JR; Veronese, N; Barbagallo, M; Rodríguez-Artalejo, F; Guallar-Castillón, P. Higher Magnesium Intake Is Associated with a Lower Risk of Frailty in Older Adults. J Am Med Dir Assoc.;Epub 2025, 26(1), 105335. [Google Scholar] [CrossRef] [PubMed]
  6. Pietropaolo, G; Castiglioni, S; Maier, JA; Wolf, FI; Trapani, V. Magnesium Preserves Calcium Homeostasis and Contributes to Protect Myotubes from Inflammation-Induced Damage. Int J Mol Sci 2025, 26(20), 9912. [Google Scholar] [CrossRef] [PubMed] [PubMed Central]
  7. Kanis, JA; McCloskey, EV; Johansson, H.; Oden, A.; Melton, L.J., 3rd; Khaltaev, N. A reference standard for the description of osteoporosis. Bone 2008, 42(3), 467–75. [Google Scholar] [CrossRef] [PubMed]
  8. Cruz-Jentoft, AJ; Bahat, G; Bauer, J; et al. Sarcopenia: revised European consensus on definition and diagnosis. Age Ageing 2019, 48(1), 16–31. [Google Scholar] [CrossRef]
  9. Clynes, MA; Gregson, CL; Bruyère, O; Cooper, C; Dennison, EM. Osteosarcopenia: where osteoporosis and sarcopenia collide. Rheumatology (Oxford) 2021, 60(2), 529–537. [Google Scholar] [CrossRef] [PubMed]
  10. Tang, BM; Eslick, GD; Nowson, C; Smith, C; Bensoussan, A. Use of calcium or calcium in combination with vitamin D supplementation to prevent fractures and bone loss in people aged 50 years and older: a meta-analysis. Lancet 2007, 370, 657–666. [Google Scholar] [CrossRef]
  11. Bolland, MJ; Leung, W; Tai, V; et al. Calcium intake and risk of fracture: systematic review. BMJ 2015, 351, h4580. [Google Scholar] [CrossRef]
  12. Thabit, H; Barry, M; Sreenan, S; Smith, D. Proximal myopathy in lacto-vegetarian Asian patients responding to Vitamin D and calcium supplement therapy - two case reports and review of the literature. J Med Case Rep 2011, 5, 178. [Google Scholar] [CrossRef] [PubMed]
  13. Hodges, JK; Cao, S; Cladis, DP; Weaver, CM. Lactose Intolerance and Bone Health: The Challenge of Ensuring Adequate Calcium Intake. Nutrients 2019, 11(4), 718. [Google Scholar] [CrossRef]
  14. Moretti, A; Liguori, S; Paoletta, M; Migliaccio, S; Toro, G; Gimigliano, F; Iolascon, G. Bone fragility during the COVID-19 pandemic: the role of macro- and micronutrients. Ther Adv Musculoskelet Dis. 2023, 15, 1759720X231158200. [Google Scholar] [CrossRef] [PubMed]
  15. Matković, V; Kostial, K; Simonović, I; Buzina, R; Brodarec, A; Nordin, BE. Bone status and fracture rates in two regions of Yugoslavia. Am J Clin Nutr 1979, 32(3), 540–549. [Google Scholar] [CrossRef] [PubMed]
  16. Cepollaro, C; Orlandi, G; Gonnelli, S; Ferrucci, G; Arditti, JC; Borracelli, D; Toti, E; Gennari, C. Effect of calcium supplementation as a high-calcium mineral water on bone loss in early postmenopausal women. Calcif Tissue Int. 1996, 59(4), 238–239. [Google Scholar] [CrossRef]
  17. Hopewell, S; Chan, AW; Collins, GS; Hróbjartsson, A; Moher, D; Schulz, KF; Tunn, R; Aggarwal, R; Berkwits, M; Berlin, JA; Bhandari, N; Butcher, NJ; Campbell, MK; Chidebe, RCW; Elbourne, D; Farmer, A; Fergusson, DA; Golub, RM; Goodman, SN; Hoffmann, TC; Ioannidis, JPA; Kahan, BC; Knowles, RL; Lamb, SE; Lewis, S; Loder, E; Offringa, M; Ravaud, P; Richards, DP; Rockhold, FW; Schriger, DL; Siegfried, NL; Staniszewska, S; Taylor, RS; Thabane, L; Torgerson, D; Vohra, S; White, IR; Boutron, I. CONSORT 2025 statement: updated guideline for reporting randomised trials. BMJ 2025, 389, e081123. [Google Scholar] [CrossRef] [PubMed] [PubMed Central]
  18. Iolascon, G; de Sire, A; Calafiore, D; Benedetti, MG; Cisari, C; Letizia Mauro, G; Migliaccio, S; Nuti, R; Resmini, G; Gonnelli, S; Moretti, A. Multifactorial Assessment of Risk of Falling in 753 Post-Menopausal Women: A Multicenter Cross-Sectional Study by the Italian Group for the Study of Metabolic Bone Diseases. Clin Interv Aging 2020, 15, 1077–1084. [Google Scholar] [CrossRef] [PubMed] [PubMed Central]
  19. Asano, K; Kabasawa, K; Takachi, R; Sawada, N; Tsugane, S; Ito, Y; Narita, I; Nakamura, K; Tanaka, J. Association of dietary calcium intake with risk of falls in community-dwelling middle-aged and older adults. J Nutr Health Aging 2025, 29(3), 100465. [Google Scholar] [CrossRef]
  20. Liguori, S; Moretti, A; Paoletta, M; Gimigliano, F; Iolascon, G. Role of Magnesium in Skeletal Muscle Health and Neuromuscular Diseases: A Scoping Review. Int J Mol Sci. 2024, 25(20), 11220. [Google Scholar] [CrossRef] [PubMed] [PubMed Central]
  21. Moretti, A. What is the role of magnesium for skeletal muscle cramps? A Cochrane Review summary with commentary. J Musculoskelet Neuronal Interact 2021, 21(1), 1–3. [Google Scholar] [PubMed] [PubMed Central]
  22. Vannucci, L; Fossi, C; Quattrini, S; Guasti, L; Pampaloni, B; Gronchi, G; Giusti, F; Romagnoli, C; Cianferotti, L; Marcucci, G; Brandi, ML. Calcium Intake in Bone Health: A Focus on Calcium-Rich Mineral Waters. Nutrients 2018, 10(12), 1930. [Google Scholar] [CrossRef] [PubMed]
  23. Schneider, I; Greupner, T; Hahn, A. Magnesium bioavailability from mineral waters with different mineralization levels in comparison to bread and a supplement. Food Nutr Res 2017, 61(1), 1384686. [Google Scholar] [CrossRef] [PubMed] [PubMed Central]
  24. Canfora, I; Tarantino, N; Pierno, S. Metabolic Pathways and Ion Channels Involved in Skeletal Muscle Atrophy: A Starting Point for Potential Therapeutic Strategies. Cells 2022, 11(16), 2566. [Google Scholar] [CrossRef] [PubMed]
  25. Polito, A; Barnaba, L; Ciarapica, D; Azzini, E. Osteosarcopenia: A Narrative Review on Clinical Studies. Int J Mol Sci 2022, 23(10), 5591. [Google Scholar] [CrossRef]
  26. Romagnoli, C; Brandi, ML. Muscle Physiopathology in Parathyroid Hormone Disorders. Front Med (Lausanne) 2021, 8, 764346. [Google Scholar] [CrossRef]
Figure 1. CONSORT flow diagram illustrating the progress of participants through the phases of the randomized, double-blind controlled trial, including enrollment, allocation, follow-up, and analysis.
Preprints 192088 g001
Figure 2. Six- and twelve-month fall incidence in the J66 and SG9 groups.
Preprints 192088 g002
Figure 6. a-b. In image 6a, low calcium bioavailability leads to a reduction in PIEZO1 channel expression, resulting in the upregulation of the genes KLF-15 and IL-6, which induce muscle atrophy; conversely, in image 6b, adequate calcium bioavailability maintains PIEZO1 expression, promoting healthy muscle mass.
Preprints 192088 g006
Table 1. Baseline comparison of general characteristics, laboratory parameters, and functional scales between the two groups divided by type of water.
Parameters J66 Water (N = 48) SG9 Water (N = 50) p-value
Age (years) 64.08 ± 6.61 62.96 ± 8.10 0.424
BMI (kg/m²) 24.52 ± 3.71 26.23 ± 4.69 0.065
Creatinine (mg/dL) 0.77 ± 0.16 0.77 ± 0.12 0.927
ALT (U/L) 18.40 ± 7.80 19.38 ± 8.34 0.456
AST (U/L) 21.42 ± 4.65 21.76 ± 6.32 0.628
Magnesium (mEq/L) 2.01 ± 0.17 2.03 ± 0.24 0.896
Phosphate (mg/dL) 3.45 ± 0.47 3.40 ± 0.43 0.559
Calcium (mg/dL) 9.45 ± 0.45 9.50 ± 0.44 0.889
Total ALP (U/L) 72.35 ± 23.83 75.08 ± 18.96 0.463
25OH-Vitamin D (ng/mL) 32.02 ± 10.15 31.87 ± 10.82 0.907
bALP (%) 11.85 ± 4.94 12.80 ± 8.64 0.710
PTH (pg/mL) 33.66 ± 11.99 34.56 ± 15.11 0.930
Magnesium (urinary, mEq/24h) 8.05 ± 3.66 8.36 ± 4.63 0.970
Phosphate (urinary, mg/24h) 596.81 ± 248.28 645.62 ± 323.46 0.409
Calcium (urinary, mg/24h) 164.37 ± 95.99 165.86 ± 116.43 0.802
Creatinine clearance (mL/min) 87.05 ± 25.98 95.56 ± 52.22 0.947
TNF-ALFA 44.88 ± 70.17 44.06 ± 124.5 0.265
P3NP 10.59 ± 3.30 10.31 ± 2.72 0.594
Sclerostin 74.21 ± 50.53 67.05 ± 45.99 0.518
Leptin 12.25 ± 11.00 17.00 ± 18.62 0.593
CTX 0.21 ± 0.17 0.24 ± 0.29 0.657
Irisin 140.83 ± 38.5 137.99 ± 39.89 0.341
P1NP (µg/L) 544.36 ± 258.24 503.31 ± 235.29 0.334
CIRS Severity Index 1.37 ± 0.24 1.33 ± 0.24 0.226
CIRS Comorbidity Index 2.0 (0–6) 1.0 (0–6) 0.601
CIRS Total Score 5 (0–13) 4 (0–13) 0.110
EuroQoL-5D Index 0.99 ± 0.09 0.97 ± 0.10 0.110
EuroQoL-5D (VAS) 70.52 ± 13.50 72.80 ± 13.75 0.527
SPPB Total Score 7.0 (1–11) 7.0 (2–12) 0.173
SPPB Balance 3.0 (0–4) 4.0 (0–4) 0.155
SPPB Gait Speed 2.0 (1–4) 2.0 (1–4) 0.178
SPPB Sit-to-Stand 2.0 (0–4) 2.0 (0–4) 0.470
Handgrip Strength (kg) 22.98 ± 6.86 23.69 ± 8.64 0.577
ASMM (kg) 17.68 ± 3.13 19.19 ± 4.74 0.063
ASMM (kg)/h2(m) 6.73 ± 0.92 6.84 ± 1.71 0.055
IPAQ 4083.02 ± 3989.10 4717.61 ± 3821.65 0.346
MET (total) 11817.29 ± 3572.44 11735.26 ± 4169.68 0.744
MET (week) 1771.20 ± 517.54 1765.60 ± 531.18 0.755
Note: Continuous variables are expressed as mean ± standard deviation or median with interquartile range; categorical variables are expressed as total number (%). *All pairwise time-point comparisons were significant. Abbreviations: Body Mass Index (BMI), Alanine Aminotransferase (ALT), Aspartate Aminotransferase (AST), Total Alkaline Phosphatase (Total ALP), 25-Hydroxy Vitamin D (25OH-Vitamin D), Bone-specific Alkaline Phosphatase (bALP), Parathyroid Hormone (PTH), Tumor Necrosis Factor-alpha (TNF α), Procollagen Type III N-terminal Propeptide (P3NP), C-terminal Telopeptide of Type I Collagen (CTX), Procollagen Type I N-terminal Propeptide (P1NP) (µg/L), Cumulative Illness Rating Scale (CIRS), EuroQoL-5Dimension (EuroQoL-5D), Visual Analogue Scale (VAS), Short Physical Performance Battery (SPPB), Handgrip Strength Examination (HGSE), Appendicular Skeletal Muscle Mass (ASMM), International Physical Activity Questionnaire (IPAQ); Metabolic Equivalent of Task (MET).
Table 2. Baseline comparison of general characteristics, laboratory parameters, and functional scales between the two groups divided by type of water in the osteosarcopenic population.
Parameters J66 Water (N = 8) SG9 Water (N = 12) p-value
Age (years) 68.42 ± 7.11 65.5 ± 8.53 0.424
BMI (kg/m²) 22.15 ± 2.57 25.54 ± 3.94 0.076
Creatinine (mg/dL) 0.73 ± 0.15 0.77 ± 0.06 0.463
ALT (U/L) 18.29 ± 7.65 25.50 ± 15.52 0.462
AST (U/L) 20.86 ± 3.67 26.88 ± 11.37 0.536
Magnesium (mEq/L) 2.08 ± 0.06 2.06 ± 0.15 0.776
Phosphate (mg/dL) 3.47 ± 0.36 3.35 ± 0.46 0.561
Calcium (mg/dL) 9.5± 0.16 9.29 ± 0.45 0.557
Total ALP (U/L) 71.57 ± 19.75 84.63 ± 21.05 0.247
25OH-Vitamin D (ng/mL) 38.47 ± 8.55 32.41 ± 12.48 0.280
bALP (%) 12.45 ± 4.54 14.22 ± 6.41 0.537
PTH (pg/mL) 35.15 ± 19.96 35.90 ± 304. 0.939
Magnesium (urinary, mEq/24h) 5.92 ± 1.53 6.72 ± 3.67 0.821
Phosphate (urinary, mg/24h) 439.71 ± 110.8 483.88 ± 323.46 0.353
Calcium (urinary, mg/24h) 142.42 ± 72.65 113.05 ± 100.17 0.554
Creatinine clearance (mL/min) 63.14 ± 17.3 115.00 ± 101.88 0.185
TNF-ALFA 3.42 ± 5.19 25.14 ± 60.33 0.486
P3NP 10.42 ± 2.82 8.52 ± 2.54 0.758
Sclerostin 48.1 ± 25.02 54.53 ± 39.29 0.787
Leptin 8.04 ± 5.6 14.11 ± 12.89 0.355
CTX 0.23 ± 0.18 0.41 ± 0.62 0.728
Irisin 134.47 ± 40.27 111.06 ± 59.19 0.616
P1NP (µg/L) 481.24 ± 148.73 524.15± 311.05 0.817
CIRS Severity Index 1.55 ± 0.29 1.39 ± 0.31 0.096
CIRS Comorbidity Index 4.0 (0–6) 2.50 (0–6) 0.256
CIRS Total Score 7 (1–13) 5 (0–13) 0.151
EuroQoL-5D Index 0.96 ± 0.09 1.01 ± 0.03 0.610
EuroQoL-5D (VAS) 73.57 ± 13.75 68.75 ± 13.56 0.430
SPPB Total Score 5.0 (1–8) 5.50 (2–8) 0.876
SPPB Balance 2.0 (0–4) 1.0 (0–4) 1.000
SPPB Gait Speed 1.0 (1–2) 2.0 (1–2) 0.276
SPPB Sit-to-Stand 2.0 (0–3) 1.50 (0–3) 0.904
Handgrip Strength (kg) 15.48 ± .68 15.61 ± 2.74 0.876
ASMM (kg) 15.57 ± 1.99 18.03 ± 3.51 0.063
ASMM (kg)/h2 (m) 6.24 ± 0.57 6.31 ± 2.0 0.057
IPAQ 2962.14 ± 1539.72 1360.63 ± 800.84 0.589
MET (total) 9528.00 ± 4805.66 8033.88 ± 4294.99 0.758
MET (week) 1544.57 ± 720.09 1677.63 ± 296.44 0.396
Note: Continuous variables are expressed as mean ± standard deviation or median with interquartile range; categorical variables are expressed as total number (%). *All pairwise time-point comparisons were significant. Abbreviations: Body Mass Index (BMI), Alanine Aminotransferase (ALT), Aspartate Aminotransferase (AST), Total Alkaline Phosphatase (Total ALP), 25-Hydroxy Vitamin D (25OH-Vitamin D), Bone-specific Alkaline Phosphatase (bALP), Parathyroid Hormone (PTH), Tumor Necrosis Factor-alpha (TNF α), Procollagen Type III N-terminal Propeptide (P3NP), C-terminal Telopeptide of Type I Collagen (CTX), Procollagen Type I N-terminal Propeptide (P1NP) (µg/L), Cumulative Illness Rating Scale (CIRS), EuroQoL-5Dimension (EuroQoL-5D), Visual Analogue Scale (VAS), Short Physical Performance Battery (SPPB), Handgrip Strength Examination (HGSE), Appendicular Skeletal Muscle Mass (ASMM), International Physical Activity Questionnaire (IPAQ); Metabolic Equivalent of Task (MET).
Table 3. Between-group comparison after 6 months of laboratory parameters, and functional outcomes in the general population, divided by type of water.
Parameters J66 Water
(M ± SD)
SG9 Water
(M ± SD)
Mean
Difference
95% CI p-value
Magnesium (mEq/L) 2.064 ± 0.183 2.242 ± 0.837 -0.022 [-0.093, 0.049] 0.541
Phosphate (mg/dL) 3.612 ± 0.448 3.604 ± 0.481 -0.013 [-0.110, 0.084] 0.787
Calcium (mg/dL) 9.455 ± 0.381 9.100 ± 1.987 -0.017 [-0.080, 0.046] 0.582
Total ALP (U/L) 76.94 ± 25.98 75.04 ± 17.26 -2.625 [-16.798, 11.548] 0.709
25OH-Vitamin D (ng/mL) 28.64 ± 9.99 26.64 ± 9.48 -1.208 [-6.343, 3.927] 0.637
bALP (%) 10.46 ± 4.42 9.83 ± 3.60 -0.663 [-2.849, 1.523] 0.538
PTH (pg/mL) 36.88 ± 13.68 34.05 ± 12.83 -1.625 [-9.432, 6.182] 0.672
Urinary Magnesium (mEq/24h) 11.05 ± 4.22 10.76 ± 3.33 0.282 [9.694, 12.397] 0.786
Urinary Phosphate (mg/24h) 756.61 ± 295.95 679.79 ± 278.29 76.814 [655.893, 857.319] 0.326
Urinary Calcium (mg/24h) 176.03 ± 83.94 242.25 ± 100.07 -66.220 [144.227, 207.789] 0.009
TNF-alfa 1.82 ± 3.24 39.37 ± 163.09 -0.088 [-0.591, 0.415] 0.720
P3NP 10.75 ± 6.80 9.60 ± 5.67 -0.013 [-0.073, 0.047] 0.667
Sclerostin 65.41 ± 54.79 66.85 ± 52.95 -0.016 [-0.085, 0.053] 0.641
Leptin 15.84 ± 13.26 19.22 ± 20.88 -0.081 [-0.398, 0.236] 0.610
CTX 0.292 ± 0.186 0.274 ± 0.242 -0.007 [-0.117, 0.103] 0.899
Irisin 198.72 ± 168.20 160.18 ± 119.30 -0.006 [-0.047, 0.035] 0.770
P1NP 296.40 ± 163.22 313.65 ± 205.81 -0.008 [-0.078, 0.062] 0.812
EuroQoL-5D Index 0.936 ± 0.110 0.935 ± 0.103 0.001 [0.898, 0.973] 0.992
EuroQoL-5D (VAS) 74.85 ± 13.43 67.50 ± 16.49 7.348 [69.690, 80.007] 0.069
SPPB Total Score 10 (3-12) 9 (5-12) 0.622 [-.591, 1.833] 0.552
SPPB Balance 4 (1-4) 4 (1-4) 0.356 [-0.207, 0.919] 0.211
SPPB Gait Speed 3 (1-4) 3 (1-4) 0.181 [-0.349, 0.712] 0.495
SPPB Sit-to-Stand 3 (0-4) 3 (0-4) 0.000 [-0.589, 0.589] 1.000
Handgrip Strength (kg) 24.59 ± 7.56 25.47 ± 9.82 -0.885 [-5.498, 3.728] 0.555
Gait speed (m/s) 0.805 ± 0.225 0.733 ± 0.266 0.072 [-0.059, 0.203] 0.224
ASMM (kg)/h2 (m) 6.85 ± 1.05 7.16 ± 1.17 -0.570 [-0.908, 0.277]
0.292
IPAQ 3977.67 ± 4491.88 3935.29 ± 3408.62 -153.399 [8.668, 10.241]
0.833
MET (total) 12247.79 ± 2345.71 12021.04 ± 3102.27 -133.28 [-1218.462, 1671.955]
0.794
MET (week) 1791.61 ± 328.38 1870.38 ± 282.70 -78.76 [-245.486, 87.948]
0.252
Notes: Continuous variables are expressed as mean ± standard deviation or median with interquartile range; categorical variables are expressed as total number (%). Abbreviations: Body Mass Index (BMI), Alanine Aminotransferase (ALT), Aspartate Aminotransferase (AST), Total Alkaline Phosphatase (Total ALP), 25-Hydroxy Vitamin D (25OH-Vitamin D), Bone-specific Alkaline Phosphatase (bALP), Parathyroid Hormone (PTH), Tumor Necrosis Factor-alpha (TNF α), Procollagen Type III N-terminal Propeptide (P3NP), C-terminal Telopeptide of Type I Collagen (CTX), Procollagen Type I N-terminal Propeptide (P1NP) (µg/L), Cumulative Illness Rating Scale (CIRS), EuroQoL-5Dimension (EuroQoL-5D), Visual Analogue Scale (VAS), Short Physical Performance Battery (SPPB), Handgrip Strength Examination (HGSE), Appendicular Skeletal Muscle Mass (ASMM), International Physical Activity Questionnaire (IPAQ), Metabolic Equivalent of Task (MET). In bold are reported statistically significant results.
Table 4. Between-group comparison after 12 months of laboratory parameters, and functional outcomes in the general population, divided by type of water.
Parameters J66 Water
(M ± SD)
SG9 Water
(M ± SD)
Mean
Difference
95% CI p-value
Magnesium (mEq/L) 2.07 ± 0.13 2.07 ± 0.16 0.010 [-0.068, 0.088] 0.797
Phosphate (mg/dL) 3.48 ± 0.42 3.58 ± 0.58 -0.117 [3.316, 3.801] 0.374
Calcium (mg/dL) 9.12 ± 0.27 9.10 ± 0.33 0.080 [8.960, 9.253] 0.293
Total ALP (U/L) 68.42 ± 21.68 69.03 ± 16.67 -0.333 [61.173, 75.960] 0.948
25OH-Vitamin D (ng/mL) 36.68 ± 11.55 36.08 ± 10.60 1.793 [31.948, 41.759] 0.529
bALP (%) 9.98 ± 3.58 10.12 ± 3.50 -0.183 [8.614, 11.490] 0.848
PTH (pg/mL) 32.78 ± 11.57 29.44 ± 11.84 4.383 [24.985, 37.772] 0.136
Urinary Magnesium (mEq/24h) 9.03 ± 4.79 11.90 ± 5.93 -3.077 [7.054, 14.163] 0.035
Urinary Phosphate (mg/24h) 599.15 ± 288.58 611.03 ± 228.96 -19.866 [490.909, 707.091] 0.776
Urinary Calcium (mEq/24h) 160.82 ± 134.83 231.39 ± 113.46 -66.500 [118.866, 279.566] 0.050
TNF-alfa 4.15 ± 3.26 18.77 ± 76.35 -15.137 [-16.488, 40.070] 0.305
P3NP 7.25 ± 2.75 7.31 ± 2.72 0.030 [6.142, 8.001] 0.963
Sclerostin 84.81 ± 36.44 92.51 ± 46.28 -9.100 [68.622, 109.445] 0.420
Leptin 14.05 ± 11.10 16.86 ± 17.37 -1.079 [9.372, 21.081] 0.775
CTX 0.371 ± 0.205 0.322 ± 0.209 0.042 [0.242, 0.434] 0.439
Irisin 53.41 ± 36.48 52.44 ± 26.24 1.680 [42.168, 67.666] 0.842
P1NP 402.09 ± 223.45 385.39 ± 201.99 4.700 [307.675, 470.225] 0.933
EuroQoL-5D Index 0.91 ± 0.11 0.95 ± 0.09 -0.037 [0.877, 0.987] 0.155
EuroQoL-5D (VAS) 70.45 ± 15.33 69.09 ± 13.78 1.833 [63.684, 76.150] 0.627
SPPB Total Score 10 (6-12) 9 (6-12) .171 -0.71 to 1.32 0.539
SPPB Balance 4 (1-4) 4 (1-4) 0.000 [3.577, 4.023] 1.000
SPPB Gait Speed 3 (1-4) 3 (1-4) 0.133 [2.676, 3.457] 0.562
SPPB Sit-to-Stand 3 (0-4) 3 (0-4) 0.066 [2.253, 3.147] 0.821
Handgrip Strength (kg) 22.28 ± 7.18 23.85 ± 8.98 -2.001 [-6.326, 2.324] 0.358
Gait speed (m/s) 0.94 ± 0.30 0.85 ± 0.21 0.072 [-.036, .236] 0.146
ASMM (kg)/h2 (m) 6.80 ± 0.99 7.79 ± 1.49 -.890 [-1.499, -.281] 0.005
IPAQ 3568.100 ± 4595.32 21966.267 ± 98552.99 -18398.167 [-23161.187, 48696.183] 0.334
MET (total) 11920.18 ± 2503.44 12824.36 ± 2470.98 -620.333
[-1847.544, 606.878] 0.316
MET (week) 1800.15 ± 389.12 1870.70 ± 343.38 -44.833 [-228.576, 138.910] 0.627
Notes: Continuous variables are expressed as mean ± standard deviation or median with interquartile range; categorical variables are expressed as total number (%). Abbreviations: Body Mass Index (BMI), Alanine Aminotransferase (ALT), Aspartate Aminotransferase (AST), Total Alkaline Phosphatase (Total ALP), 25-Hydroxy Vitamin D (25OH-Vitamin D), Bone-specific Alkaline Phosphatase (bALP), Parathyroid Hormone (PTH), Tumor Necrosis Factor-alpha (TNF α), Procollagen Type III N-terminal Propeptide (P3NP), C-terminal Telopeptide of Type I Collagen (CTX), Procollagen Type I N-terminal Propeptide (P1NP) (µg/L), Cumulative Illness Rating Scale (CIRS), EuroQoL-5Dimension (EuroQoL-5D), Visual Analogue Scale (VAS), Short Physical Performance Battery (SPPB), Handgrip Strength Examination (HGSE), Appendicular Skeletal Muscle Mass (ASMM), International Physical Activity Questionnaire (IPAQ), Metabolic Equivalent of Task (MET). In bold statistically significant results are reported.
Table 5. Between-group comparison after 6 months of general characteristics, laboratory parameters, and functional scales in the osteosarcopenic population, divided by type of water.
Parameters J66 Water (n=12)
(M ± SD)
SG9 Water (n=8)
(M ± SD)
Mean
Difference
95% CI p-value
Phosphate (mg/dL) 3.47 ± 0.12 3.80 ± 0.81 -0.25 [-1.24 ; 0.74] 0.569
Calcium (mg/dL) 9.33 ± 0.06 9.36 ± 0.34 0.17 [-0.40 ; 0.73] 0.515
Total ALP (U/L) 86.00 ± 31.77 83.40 ± 22.72 -1.40 [-40.60 ; 37.80] 0.935
25OH-Vitamin D (ng/mL) 29.50 ± 4.33 27.98 ± 13.17 1.12 [-15.11 ; 17.35] 0.875
bALP (%) 14.50 ± 5.76 10.64 ± 4.59 1.99 [-6.34 ; 10.31] 0.591
PTH (pg/mL) 28.43 ± 8.43 28.30 ± 9.38 2.50 [-11.71 ; 16.71] 0.690
Urinary Magnesium (mEq/24h) 11.87 ± 3.19 9.84 ± 3.42 1.01 [-4.33 ; 6.35] 0.668
Urinary Phosphate (mg/24h) 760.33 ± 99.75 677.00 ± 233.77 8.25 [-323.48 ; 339.98] 0.955
Urinary Calcium (mg/24h) 241.33 ± 96.60 226.00 ± 109.44 -4.00 [-163.82 ; 155.82] 0.954
TNF-alfa 2.09 ± 2.36 162.19 ± 356.56 -160.63 [-588.17 ; 266.92] 0.404
P3NP 7.43 ± 2.16 8.76 ± 2.38 -0.24 [-4.31 ; 3.84] 0.895
Sclerostin 58.40 ± 46.91 96.36 ± 82.41 -41.71 [-148.51 ; 65.09] 0.386
Leptin 12.58 ± 5.18 15.06 ± 16.24 -4.32 [-24.65 ; 16.01] 0.631
CTX 0.34 ± 0.04 0.34 ± 0.44 0.03 [-0.51 ; 0.56] 0.905
Irisin 101.00 ± 101.06 139.18 ± 99.62 -18.93 [-171.28 ; 133.42] 0.777
P1NP 436.15 ± 160.12 342.91 ± 369.59 41.62 [-434.12 ; 517.35] 0.842
EuroQoL-5D Index 0.827 ± 0.000 0.937 ± 0.116 -0.07 [-0.23 ; 0.10] 0.370
EuroQoL-5D (VAS) 80.00 ± 0.00 60.00 ± 15.81 20.00 [1.04 ; 38.96] 0.041
SPPB Total Score 8 (3-10) 8 (6-11) -1.25 [-5.77 ; 3.27] 0.534
SPPB Balance 3 (1-4) 3.5 (1-4) -0.25 [-2.39 ; 1.89] 0.790
SPPB Gait Speed 3 (1-3) 3 (1-4) -0.55 [-2.40 ; 1.30] 0.505
SPPB Sit-to-Stand 1 (1-3) 2 (0-4) -0.45 [-2.30 ; 1.40] 0.584
Handgrip Strength (kg) 14.08 ± 1.95 18.80 ± 6.06 -4.57 [-12.03 ; 2.89] 0.190
Gait speed (m/s) 0.787 ± 0.30 0.818 ± 0.17 -0.16 [-0.58 ; 0.26] 0.397
ASMM (kg)/h2 (m) 6.04 ± 0.56 6.93 ± 0.34 -0.88 [-1.51 ; -0.26] 0.012
IPAQ 2324.063 ± 1396.6592 3301.364
± 4300.8436
-915.13 [-8102.27; 6272.02] 0.772
MET (total) 10806.33 ± 2307.93 9729.80 ± 4996.79 1042.45 [-5260.97; 7345.87] 0.707
MET (week) 1583.67 ± 331.54 1746.00 ± 178.16 -161.75 [-514.82; 191.32] 0.315
Notes: Continuous variables are expressed as mean ± standard deviation or median with interquartile range; categorical variables are expressed as total number (%). *All pairwise time-point comparisons were significant. Abbreviations: Body Mass Index (BMI), Alanine Aminotransferase (ALT), Aspartate Aminotransferase (AST), Total Alkaline Phosphatase (Total ALP), 25-Hydroxy Vitamin D (25OH-Vitamin D), Bone-specific Alkaline Phosphatase (bALP), Parathyroid Hormone (PTH), Tumor Necrosis Factor-alpha (TNF α), Procollagen Type III N-terminal Propeptide (P3NP), C-terminal Telopeptide of Type I Collagen (CTX), Procollagen Type I N-terminal Propeptide (P1NP) (µg/L), Cumulative Illness Rating Scale (CIRS), EuroQoL-5Dimension (EuroQoL-5D), Visual Analogue Scale (VAS), Short Physical Performance Battery (SPPB), Handgrip Strength Examination (HGSE), Appendicular Skeletal Muscle Mass (ASMM), International Physical Activity Questionnaire (IPAQ), Metabolic Equivalent of Task (MET). In bold statistically significant results are reported.
Table 6. Between-group comparison after 12 months of general characteristics, laboratory parameters, and functional scales in the osteosarcopenic population, divided by type of water.
Parameters J66 Water
(M ± SD)
SG9 Water
(M ± SD)
Mean
Difference
95% CI p-value
Phosphate (mg/dL) 3.42 ± 0.46 3.62 ± 0.66
-0.197 [-0.996, 0.602] 0.588
Calcium (mg/dL) 9.00 ± 0.19 8.88 ± 0.27 0.080 [-0.160, 0.320] 0.510
Total ALP (U/L) 70.40 ± 13.98 74.33 ± 13.23 -0.333 [-8.215, 7.548] 0.931
25OH-Vitamin D
(ng/mL)
46.34 ± 12.67 34.38 ± 11.95 1.793 [-3.841, 7.427] 0.529
bALP (%) 10.32 ± 1.32 10.38 ± 3.21 -0.183 [-2.215, 1.849] 0.848
PTH (pg/mL) 30.90 ± 14.25 29.88 ± 10.40 4.383 [-1.428, 10.194] 0.136
Urinary Magnesium
(mEq/24h)
7.38 ± 3.31 11.82 ± 8.31 -3.077 [-5.943, -0.211] 0.035*
Urinary Phosphate
(mg/24h)
385.20 ± 182.19 603.67 ± 156.71 -19.866 [-169.313, 129.581] 0.776
Urinary Calcium
(mg/24h)
85.80 ± 69.76 218.83 ± 125.65 -66.500 [-133.267, 0.267] 0.050*
TNF-alfa 3.30 ± 1.4 77.76 ± 178.45 -15.137 [-41.313, 11.039] 0.305
P3NP 5.97 ± 1.48 8.80 ± 1.99 0.030 [-1.146, 1.206] 0.963
Sclerostin 76.80 ± 29.25 112.98 ± 92.45 -9.100 [-31.413, 13.213] 0.420
Leptin 10.49 ± 5.95 15.11 ± 8.98 -1.079 [-8.987, 6.829] 0.775
CTX 0.41 ± 0.19 0.35 ± 0.21 0.042 [-0.064, 0.148] 0.439
Irisin 35.84 ± 13.75 48.47 ± 23.18 1.680 [-15.986, 19.346] 0.842
P1NP 365.60 ± 164.66 465.83 ± 310.48 4.700 [-71.373, 80.773] 0.933
EuroQoL-5D Index 0.85 ± 0.84 0.94 ± 0.09 -0.037 [-0.088, 0.014] 0.155
EuroQoL-5D (VAS) 76.00 ± 8.94 65.00 ± 12.25
1.833 [-5.410, 9.076] 0.627
SPPB Total Score 8 (6-11) 9 (7-12) 0.622 [-1.310, 2.554] 0.539
SPPB Balance 4 (1-4) 4 (3-4) 0.000 [-0.303, 0.303] 1.000
SPPB Gait Speed 3 (1-4) 3 (2-4) 0.133 [-0.325, 0.591] 0.562
SPPB Sit-to-Stand 2 (1-3) 2 (0-4) 0.066 [-0.497, 0.629] 0.821
Handgrip Strength (kg) 17.3 ± 9.86 18.74 ± 6.49 -1.567 [-4.978, 1.844] 0.358
Gait speed (m/s) 0.78 ± 0.24 0.79 ± 0.15
0.072 [-0.026, 0.170] 0.146
ASMM (kg)/h2 (m) 6.39 ± 0.627 7.55 ± 0.69 -0.988 [-1.682, -0.294] 0.005
IPAQ 2425.00 ± 1537.425 1165.00 ± 612.88 1260.000 [-277.113, 2797.113] 0.097
MET (total) 10426.0000
± 2383.29709
12027.50 ± 1810.45
-904.183 [-2692.106, 883.740] 0.316
MET (week) 1511.2000
± 356.49923
1774.33 ± 276.51
-70.550 [-346.106, 205.006] 0.627
Notes: Continuous variables are expressed as mean ± standard deviation or median with interquartile range; categorical variables are expressed as total number (%). *All pairwise time-point comparisons were significant. Abbreviations: Body Mass Index (BMI), Alanine Aminotransferase (ALT), Aspartate Aminotransferase (AST), Total Alkaline Phosphatase (Total ALP), 25-Hydroxy Vitamin D (25OH-Vitamin D), Bone-specific Alkaline Phosphatase (bALP), Parathyroid Hormone (PTH), Tumor Necrosis Factor-alpha (TNF α), Procollagen Type III N-terminal Propeptide (P3NP), C-terminal Telopeptide of Type I Collagen (CTX), Procollagen Type I N-terminal Propeptide (P1NP) (µg/L), Cumulative Illness Rating Scale (CIRS), EuroQoL-5Dimension (EuroQoL-5D), Visual Analogue Scale (VAS), Short Physical Performance Battery (SPPB), Handgrip Strength Examination (HGSE), Appendicular Skeletal Muscle Mass (ASMM), International Physical Activity Questionnaire (IPAQ), Metabolic Equivalent of Task (MET). In bold statistically significant results are reported.
Disclaimer/Publisher’s Note: The statements, opinions and data contained in all publications are solely those of the individual author(s) and contributor(s) and not of MDPI and/or the editor(s). MDPI and/or the editor(s) disclaim responsibility for any injury to people or property resulting from any ideas, methods, instructions or products referred to in the content.
Copyright: This open access article is published under a Creative Commons CC BY 4.0 license, which permit the free download, distribution, and reuse, provided that the author and preprint are cited in any reuse.
Prerpints.org logo

Preprints.org is a free preprint server supported by MDPI in Basel, Switzerland.

Subscribe

Disclaimer

Terms of Use

Privacy Policy

Privacy Settings

© 2026 MDPI (Basel, Switzerland) unless otherwise stated