
Submitted:
30 December 2025
Posted:
31 December 2025
You are already at the latest version
Abstract
This study presents a fundamental validation of an AI-based impact analysis framework for wooden structures, aiming to support efficient and automated engineering judgment in seismic design. Focusing on a single-story residential building, the proposed method quantitatively evaluates the influence of individual seismic elements and their spatial lo-cations on structural response. Numerical time-history analyses were conducted using a detailed three-dimensional nonlinear model, and parametric variations of stiffness and strength were systematically generated using an orthogonal array. Machine learning models were then trained to capture the relationship between these parameters and seis-mic responses, and explainable artificial intelligence (XAI) techniques were applied to in-terpret parameter influence.
The results demonstrated that wall elements oriented parallel to the target inter-story drift consistently exhibited dominant influence, which is consistent with structural engineer-ing knowledge. In addition, model comparison revealed that linear regression achieved high accuracy in the elastic response range, while Gradient Boosting outperformed other models under strong excitation conditions involving plastic behavior. This difference re-flects the transition from approximately linear to highly nonlinear structural response. These findings suggest that a hybrid modeling strategy combining interpretable linear models and flexible nonlinear models is effective for impact analysis.
Overall, this fundamental study demonstrates that the proposed AI-based framework provides a transparent, rational, and time-efficient tool for seismic performance evalua-tion of wooden structures, bridging data-driven analysis and practical engineering deci-sion-making.
Keywords:
wooden structure
; seismic performance
; AI-based impact analysis
; machine learning
1. Introduction
In recent years, achieving both sustainability and disaster resilience has become a critical challenge in the architectural and structural engineering fields. In Japan, approximately 60% of newly constructed residential buildings are wooden houses [1], making the assurance of sufficient safety against external forces such as earthquakes and climate change a pressing issue. At the same time, wood is a renewable material that has attracted significant attention for its potential to reduce environmental impacts over the building life cycle. Previous studies have quantitatively demonstrated the environmental advantages of wooden buildings, particularly in terms of life-cycle environmental loads [2]. Seismic performance is governed by numerous parameters related to material properties, geometric characteristics, boundary conditions and seismic input, and many shaking table tests had been conducted to clarify the seismic performance [3]. In practical engineering, the relative influence of these parameters is often anticipated qualitatively based on engineering judgment or physical reasoning. Such intuition-driven assessments have long played an important role in seismic design and evaluation.
However, as structural models become increasingly complex—incorporating nonlinear material behavior, detailed component-level modeling, and spatially varying properties—the number of parameters grows rapidly. Under these conditions, it becomes difficult to quantitatively evaluate how individual parameters influence structural response, particularly at specific locations or for individual seismic elements [3]. Conventional sensitivity analysis methods often require simplified models or linear assumptions, limiting their applicability to realistic wooden structures.
In recent years, machine-learning-based models have been introduced into structural engineering to capture complex nonlinear relationships between input parameters and seismic response [4,5,6,7,8]. Although these models achieve high predictive accuracy, they are frequently criticized for their lack of interpretability, which hinders their use in safety-critical decision-making [9]. This “black-box” nature remains a major obstacle to their acceptance in practical structural design. To address this issue, XAI techniques have been increasingly explored as a means of quantifying parameter influence in complex models [10]. Previous studies applying XAI to structural design to reveal parameter importance [11,12].
This study presents a fundamental investigation into an AI-based impact analysis method for wooden structures, with a focus on the efficient and automated support of engineering judgment. The proposed approach quantitatively evaluates the contribution of individual structural elements at specific locations within a single-story residential building. By integrating numerical simulation, machine learning, and explainable AI, the framework enables the automatic extraction and visualization of parameter influence, which would otherwise require extensive manual interpretation by experienced engineers.
The proposed method explicitly quantifies how each seismic element and its spatial location affect structural response, thereby overcoming both the black-box nature of conventional AI-based approaches and the inefficiency of traditional trial-and-error or expert-dependent assessments. Instead of relying solely on subjective judgment, the framework provides a systematic and reproducible means of identifying critical elements and locations, significantly reducing the time and effort required for engineering decision-making. By enabling automated, quantitative, location-specific, and element-level impact assessment, the proposed framework supports efficient and rational engineering interpretation beyond conventional global sensitivity measures. The method facilitates transparent, explainable, and time-efficient seismic design processes, contributing to more robust and accountable structural decision-making in wooden structures.
2. AI-Based Impact Analysis Method
AI has attracted considerable attention as a powerful tool for supporting designers’ decision-making in both architectural design and structural design. In this study, AI-based impact analysis method was suggested. This chapter first outlines the overall framework of the proposed method, followed by the definitions of design variables and objective functions.
2.1. General Framework and Workflow
Figure 1 indicates the outline of suggested method. First, the target building is defined, and the areas for the element is specified. For the seismic elements within this area, the backbone curves are parameterized, and their stiffness and strength are assumed to vary within a range of ±20%. Next, combinations of these parameters are systematically determined using an orthogonal array, allowing comprehensive and efficient sampling of the parameter space. By employing this design of experiments approach, the number of required structural analyses can be significantly reduced while maintaining sufficient coverage of the interactions among parameters. Structural analyses are then performed for each parameter set, and the resulting response data—such as story drift, base shear, or energy dissipation—are collected. These data are subsequently used to train a machine learning model that captures the nonlinear relationship between the variations in the backbone curves of individual seismic elements and the global seismic response of the building. When necessary, the trained model is further interpreted using SHAP, which provides a quantitative and transparent measure of the contribution of each parameter to the predicted seismic performance as used in [13,14].
Through this procedure, the proposed method enables quantitative evaluation of how the stiffness and capacity of each seismic element at each location influence the seismic performance. The significance of this approach lies in its ability to bridge structural modeling and data-driven analysis, offering interpretable insights that support rational decision-making in seismic design, retrofit planning, and prioritization of structural elements, which are difficult to achieve using conventional manual work or sensitivity analysis.
2.2. Outline of Numerical Analysis
To analyze responses of the wooden structures, the “wallstat”[15] was used. The time-response analysis conducted in the “wallstat” was based on three-dimensional nonlinear time-history response analysis, as adopted from the extended distinct element method (EDEM) [16]. In the “wallstat”, the analysis model is composed of two primary components, beam-column elements and nonlinear lateral-load-resisting shear wall elements. Figure 2 shows the outline of the analytical model. The beams and columns were modeled as beam-column elements having an elastoplastic rotational spring at the end of the element. According to JAS, Young’s modulus was set to 9.5 kN / mm2 for the 120 mm × 120 mm column, the other members were set to 10.5 kN / mm2, and the bending strength was set to 50 N/mm2 in consideration of actual performance. Each joint is modeled as an elastoplastic tensile compressional spring. Hysteretic characteristics of the tensile and compressional springs are set as one side elastic and one side slip types, respectively.
The shear resistance of the wall and brace were modelled as shown in Figure 2(b) and (c), with bracing substituted by truss elements for the walls and two truss elements for the fascia walls with separate load-deformation relationships on the tensile and compressive sides. Each spring acts only in the compression and tension directions. The joints were modelled with rotational springs, compressional and tensile springs (rigid against shear), as shown in Figure 2(d). The skeletal curves were defined based on the results of flexural and tensile tests of the joints.
Figure 4 shows the skeleton curve of the walls and braces, and the skeleton curves of the tensile and rotational springs to reproduce the performance of HD25kN. The resilience characteristics of the walls and braces are the bilinear + slip skeleton curve (Figure 5), which is used as a simple modelling method for walls of wooden houses, while the tensile and rotational springs are defined as slip-type history characteristics.
Numerical integration was performed using the average integration method with a step of every 10-5 seconds. Viscous damping was set to 2% with instantaneous stiffness proportional to the instantaneous stiffness, and zero damping was set when the instantaneous stiffness was negative.
Figure 6 summarizes the input ground motion. The input wave was the Japan Meteorological Agency (JMA) Kobe wave observed in the Osaka-Kobe Earthquake of 1995; this type of wave is often used to represent an extremely severe earthquake. The maximum acceleration of the 1995 JMA Kobe wave was 0.87G and 100% of this was used. To compare this, to confirm the elastic behavior, 20% of the wave was also used.
Figure 6 presents the analysis results of Shear force versus Inter-story drift. From Figure 6(a)–(d), the elastic behaviors were confirmed. On the other hand, from Figure 6 (e), The hysteresis loops clearly indicate the occurrence of plastic deformation. These results are used as the reference state for the subsequent parametric study. As shown in Figure 1, the target parameters are varied within a range of ±20% from this reference condition. Accordingly, the analytical responses obtained in the parametric analyses are expected to fall within the range bounded by the elastic and plastic behaviors observed in Figure 6.
2.3. Input and Output Variables
The target area are shown in Figure 7 and parameters summarized in Table 1 represent the seismic performance characteristics of individual structural elements distributed across the building. These parameters are defined to capture the spatial variability of stiffness and strength contributions from different types of seismic elements. Parameters J1 to J8 correspond to joint elements equipped with hold-down connectors (HD25 kN), assigned to Areas 1 through 8, respectively. These parameters primarily represent the axial stiffness and tensile capacity of the joints, which play a critical role in resisting uplift forces and maintaining the integrity of the load path during seismic loading. Parameters W1 to W8 denote plywood shear walls located in Areas 1 through 8. These variables represent the lateral stiffness and shear strength of the walls, which are essential for resisting horizontal seismic forces and controlling story drift. Parameters F1 and F2 represent the in-plane stiffness of the floor diaphragms at the second-story floor and the roof level, respectively. By treating these parameters as target variables in the analysis, the proposed framework enables systematic evaluation of how local variations in joint, wall, and floor performance affect the overall seismic behavior of the structure.
In this study, orthogonal array (OA) in the quality engineering was applied to conduct the time history response analysis as seen in past study [13]. OAs are balanced to ensure that all levels of all factors are considered equally. Therefore, the factors can be evaluated independently, despite the fractionality of the design. The orthogonal array, which is to examine the effects of 18 seventeen-level factors and called L289, were adopted. In L289, to clarify all effects of 18 seventeen-level factors, 289 combinations are planned. The correction factors were set as 17 levels, equally spaced from minimum 0.80 to maximum 1.20 as correction factor, to multiply the reference characteristics as shown in Figure 4. By multiplying these values, characteristics will be varied within a range of ±20%. If we try to conduct all combinations, 1.41 × 10²² (= 1718) cases are simulated. Using combination of an OA, 289 cases are needed. Then, the analyses were conducted.
In addition, the objective variables were defined as the maximum inter-story drift in each story and each loading direction, resulting in four target responses for evaluation.
2.4. Outline of Machine Learning
In this study, 80% of the total dataset was used for model training, while the remaining 20% was reserved for validation. To capture both linear and nonlinear relationships between the input variables and the target structural responses, four representative regression models were employed: Linear Regression, Random Forest, Gradient Boosting, and Light Gradient Boosting Machine (LightGBM). These models differ in their learning mechanisms, underlying assumptions, and levels of interpretability, enabling a comprehensive comparison of predictive accuracy and explanatory capability.
2.4.1. Gradient Boosting
Gradient Boosting [17] is an ensemble learning technique that constructs decision trees sequentially, with each new tree trained to correct the residual errors of the preceding ensemble. Model optimization is achieved by minimizing a specified loss function through gradient descent in function space. By iteratively emphasizing samples that are difficult to predict, Gradient Boosting can achieve high predictive accuracy and strong modeling flexibility. However, its performance is sensitive to hyperparameter selection, and the computational cost may increase for large datasets.
2.4.2. Light Gradient Boosting Machine (LightGBM)
LightGBM [18] is an optimized implementation of gradient boosting decision trees, designed to efficiently handle large-scale and high-dimensional datasets. Unlike conventional level-wise tree growth, LightGBM adopts a leaf-wise growth strategy, which allows faster convergence and improved predictive performance. In addition, it employs histogram-based feature discretization and memory-efficient algorithms, significantly reducing training time. These characteristics make LightGBM particularly suitable for complex engineering datasets that require both computational efficiency and high accuracy.
2.4.3. Linear Regression
Linear Regression [19] is a classical statistical learning method that models the target variable as a linear combination of input features. Model parameters are estimated by minimizing the residual sum of squares under the assumption of linearity between predictors and response. Owing to its simplicity and transparency, Linear Regression is used as a baseline model in this study. Although its predictive capability is limited when strong nonlinearities or complex interactions are present, it provides high interpretability and allows direct assessment of the influence of individual input variables.
2.4.4. Random Forest
Random Forest [20] is an ensemble learning method consisting of multiple decision trees constructed using bootstrap sampling and random feature selection. Each tree is trained independently, and the final prediction is obtained by averaging the outputs of all trees. This approach effectively reduces overfitting and enhances generalization performance. Random Forest is well suited for capturing nonlinear relationships and feature interactions without requiring explicit model formulation. Furthermore, it provides intrinsic measures of feature importance, which are valuable for model interpretation.
Overall, the selected models span a spectrum from simple and highly interpretable linear approaches to advanced nonlinear ensemble methods. This combination enables systematic evaluation of prediction accuracy, robustness, and interpretability, and provides insights into the relative effectiveness of different machine learning strategies for structural and engineering-related regression problems.
Figure 8 presents the loss curves for the training and validation datasets, indicating that no overfitting occurred during the learning process. For iterative ensemble models, loss convergence behavior was visualized to assess training stability. Specifically, for LightGBM, the root mean square error (RMSE) trajectories for both training and validation datasets were plotted, while for Gradient Boosting, the validation RMSE was tracked across boosting iterations.
3. Results
In this chapter, the contribution of each structural element in each area is quantified and discussed based on feature importance.
3.1. Prediction Accuracy and Feature Importances
Figure 9 presents graphs of true and predicted values with RMSE values, and the feature importances for the maximum first-story inter-story drift under the 20% excitation condition. Among the examined models, Linear Regression exhibited the smallest prediction error. This result is considered to be attributable to the elastic nature of the deformation, which allows the response to be well approximated by linear relationships between the input parameters and the target response.
From feature importances, for the LightGBM model, which achieved the highest predictive accuracy, W3, W4, and W1 were identified as the most influential factors. Although the ranking of importance differed among the other models, the same set of parameters was consistently highlighted as influential.
W1 and W3 contain the largest number of seismic shear walls acting in the X direction, and therefore this result can be regarded as reasonable results from a structural engineering perspective. W4 also includes a few number of walls oriented in the X direction, making its contribution expected; however, the fact that its influence was quantitatively identified demonstrates the effectiveness of the proposed approach.
Figure 10 presents the results for the maximum first-story inter-story drift in the X direction under the 100% excitation. In this case, Gradient Boosting achieved the highest predictive accuracy, which differs from the results obtained under the 20% excitation. This difference is considered to be attributable to the increased nonlinearity of the structural response, making linear interpolation less effective.
The most influential parameters were identified as W1, W3, and W4, and this result was consistent across all examined machine learning models. Notably, this set of influential parameters is identical to that obtained under the 20% excitation condition. In wooden residential buildings, shear deformation of walls is generally the dominant deformation mechanism, and therefore these results can be regarded as reasonable from a structural engineering perspective.
Figure 11 presents the results for the maximum first-story inter-story drift in the Y direction under the 100% excitation. Among the examined models, Linear Regression achieved the highest predictive accuracy, exhibiting the smallest prediction error. Similar to the results obtained under the 20% excitation condition, this outcome is considered to be attributable to the elastic nature of the deformation, which allows the response to be effectively approximated by linear relationships. The second-best performance was achieved by LightGBM. According to the feature importances, W2 was identified as the most influential parameter, and this result was consistent across all models. Although variations were observed in the ranking of the lower-order parameters, W1, W4, and F2 were commonly identified as influential factors among the models.
Based on feature importances, this method enables the automatic identification of structural components and their locations that significantly influence seismic performance, without the need for prior engineering judgment.
3.2. SHAP Results
First, to use SHAP [21], 289 analysis cases were learned by machine learning method Light GradientBoosting, which showed high accuracy in first-story inter-story drift in 100 % excitation. SHAP is often used as XAI, which is proposed to solve the long criticized black-box issue of ML models. SHAP is a collection of explainers based on a game theory approach that estimates Shapley values from an absolute average of the feature contributions over several simulations. Since the original ML model is complex, this approach uses additive feature importance measures based on a linear explanation model that is a linear combination of binary variables expressed by Equation (1).
where is the original model and is the original input feature. The explanation model uses as a simplified input feature and links it with a mapping function , while local methods attempt to guarantee that whenever . The value is the Shapley value which is expressed by Equation (2).
When three desirable properties (local accuracy, missingness, and consistency) are satisfied. |z' | is the number of non-zero entries in z', and all z' vectors are a subset of x'. In this study, python library “SHAP” published in github was used [21].
Figure 12 shows the outline of SHAP results for Maximum Inter-story drift of X direction in 1st story in JMA KOBE 100%. From the summary plot, it can be confirmed that W1, W3, and W4 are the parameters with the greatest influence on the structural response. Although this result is consistent with that shown in Figure 10, the present analysis can be regarded as a quantitative decomposition of parameter influence. Furthermore, Figures (b) and (c) provide insight into the individual contribution of each parameter, enabling a more detailed evaluation of their respective impact. Figures (b) and (c) show that as the correction factor increases, the SHAP value decreases, indicating a reduction in inter-story drift. Although this trend is consistent with engineering expectations, in more complex analytical models the relationship may not necessarily follow this intuitive behavior. The present results therefore demonstrate that the proposed method can automatically and quantitatively identify such relationships, even in highly complex structural systems.
4. Conclusions
This study presented a fundamental validation into an AI-based impact analysis framework for wooden structures, focusing on the quantitative and automated evaluation of parameter influence at the level of individual seismic elements and their spatial locations. By integrating numerical simulation, machine learning, and explainable artificial intelligence (XAI), the proposed method overcomes the black-box nature of conventional AI approaches and enables explicit engineering interpretation of complex structural behavior.
The results demonstrated that the proposed framework can successfully identify dominant parameters, such as walls palarell to target inter-story drift, and quantitatively decompose their contributions to seismic response. While these findings are consistent with conventional engineering intuition, the AI-based analysis provided additional value by enabling element-wise and location-specific interpretation that cannot be obtained from traditional response plots or global sensitivity analyses alone. The SHAP-based visualization clarified not only the relative importance of parameters but also the direction and magnitude of their influence on inter-story drift.
And in elastic range, linear regression showed high accuracy. On the other hand, in plastic range such as 100 % excitation of JMA KOBE, gradientBoosting showed high accuracy. This difference can be attributed to the underlying structural response characteristics in each regime. These results suggest that combining interpretable linear models in the elastic range with more flexible nonlinear models in the plastic range provides an efficient and rational approach for seismic response analysis. This hybrid modeling perspective is particularly valuable for impact analysis and engineering decision-making, as it balances predictive accuracy, interpretability, and computational efficiency across different levels of structural nonlinearity.
Furthermore, the analysis confirmed that increasing correction factors generally led to reduced SHAP values and smaller inter-story drifts, reflecting expected structural behavior. Importantly, the framework demonstrated its ability to automatically and quantitatively reveal such relationships, even in complex analytical models where intuitive assumptions may not always hold. This capability highlights the potential of the proposed method to support efficient and objective engineering judgment without relying solely on expert experience or manual trial-and-error processes.
In summary, this study verified the feasibility of an AI-based impact analysis approach for wooden structures as a transparent and rational tool for seismic performance evaluation. The proposed framework provides a foundation for future developments, including AI-assisted structural design, performance-based seismic assessment, and systematic validation of empirical design knowledge. As a fundamental study, the present work demonstrates the potential of AI to bridge the gap between data-driven analysis and practical engineering decision-making in wooden structural design.
Supplementary Materials
The following supporting information can be downloaded at the website of this paper posted on Preprints.org.
Author Contributions
T.N.; methodology, investigation, writing—review and editing. All authors have read and agreed to the published version of the manuscript.” Please turn to the CRediT taxonomy for the term explanation. Authorship must be limited to those who have contributed substantially to the work reported.
Funding
This research received no external funding” or “This research was funded by JSPS KAKENHI Grant Number 25K23510.
Institutional Review Board Statement
Not applicable.
Informed Consent Statement
Not applicable.
Data Availability Statement
Some or all data, models, or code that support the findings of this study are available from the corresponding author upon reasonable request.
Acknowledgments
Not applicable.
Conflicts of Interest
The authors declare no conflicts of interest.
References
- Lawlor, S. (2025). Japan Housing Starts Report – June 2025. Canada Wood Group. Wooden housing accounted for approximately 60 % of new residential housing starts in Japan in 2025.
- Win, L. S. Y., Isoda, H., Nakagawa, T., and Shinohara, M. 2025b. “Comparative Analysis of CO₂ Emissions During Construction of Japanese Wooden Buildings by Construction Method.”, Summaries of Technical Papers of Annual Meeting, Architectural Institute of Japan (Kyushu), pp. 2343–2344, Tokyo. (in Japanese).
- Architectural Institute of Japan (AIJ). 2003 “Report on the Hanshin-Awaji Earthquake Disaster”, Compendium of Earthquake Disaster including Stochastics Description (in Japanese), general issues vol.1.
- Zdeněk K. (2024). Global Sensitivity Analysis of Structural Reliability Using Cliff Delta, Institute of Structural Mechanics, Faculty of Civil Engineering, Brno University of Technology, 602 00 Brno, Czech Republic, Mathematics, 12(13), 2129; [CrossRef]
- Oh BK, Kim J. Optimal architecture of a convolutional neural network to estimate structural responses for safety evaluation of the structures. Measurement 2021; 177. [CrossRef]
- Lee SC, Park SK, Lee BH. Development of the approximate analytical model for the stub-girder system using neural networks. Comput Struct 2001;79:1013–25. [CrossRef]
- Kang MC, Yoo DY, Gupta R. Machine learning-based prediction for compressive and flexural strengths of steel fiber-reinforced concrete. Constr Build Mater 2021; 266. [CrossRef]
- Finale Doshi-Velez, Been Kim (2017). Towards A Rigorous Science of Interpretable Machine Learning.
- Wang Y, Liu ZQ, Zhang M. Prediction of mechanical behavior of concrete filled steel tube structure using artificial neural network. Appl Mech Mater 2013; 368–370:1095–8. [CrossRef]
- Namba, T. 2025. “A review on artificial intelligence application for Wooden structure.” Artif. Intell. Data Sci., 6 (3), 624–631, Tokyo. (in Japanese) . [CrossRef]
- Sujith Mangalathu, Seong-Hoon Hwang, Jong-Su Jeon. (2023) “Failure mode and effects analysis of RC members based on machine-learning-base Shapley Additive exPlanations (SHAP) approach”, Engineering Structures 219 (2020) 110927. [CrossRef]
- Malaga-Chuquitaype, E. J. C., and Chawgien, K. (2023). Interpretable machine learning models for the estimation of seismic drifts in CLT buildings, Journal of Building Engineering, 70 (2023), 106365, 2023. [CrossRef]
- Tokikatsu NAMBA, Takafumi NAKAGAWA, Yuji KADO, Hiroshi ISODA, Atsuo TAKINO. 2024. “Parameter Identification Method using Quality Engineering and Interpretable Machine Learning for Full-Scale Shaking Table Tests of Wooden Houses”, Transactions of the Japan Society for Computational Engineering and Science, 2024, 20240008. [CrossRef]
- Namba, T. and Inoue, R. 2025. “Fundamental study for Multi-Purpose Optimal Design of wooden buildings using interpretable AI.” Artif. Intell. Data Sci., [Manuscript submitted for publication], Tokyo. (in Japanese).
- wallstat ver.4.3.11 [Computer Software]. Research Institute for Sustainable Humanosphere, Kyoto University, Kyoto, Japan.
- Meguro, K., and M. Hakuno. 1991. “Simulation of Structural Collapse due to Earthquakes Using Extended Distinct Element Method”, Summaries of Technical Papers of Annual Meeting. Tokyo: Architectural Press Institute of Japan, 763–764.
- Friedman, J. H. (2001). Greedy function approximation: A gradient boosting machine. Annals of Statistics, 29(5), 1189–1232. [CrossRef]
- Ke, G., Meng, Q., Finley, T., Wang, T., Chen, W., Ma, W., Ye, Q., & Liu, T.-Y. (2017). LightGBM: A highly efficient gradient boosting decision tree. In Proceedings of the 31st International Conference on Neural Information Processing Systems (NeurIPS 2017) (pp. 3146–3154).
- Montgomery, D. C., Peck, E. A., & Vining, G. G. (2012). Introduction to linear regression analysis (5th ed.). Hoboken, NJ: Wiley.
- Breiman, L. (2001). Random forests. Machine Learning, 45(1), 5–32. [CrossRef]
- S.M. Lundberg, S.-I. Lee, A unified approach to interpreting model predictions, Adv. Neural Inf. Process. Syst. 30 (2017).
Figure 1.
Outline of AI-based impact analysis approach.
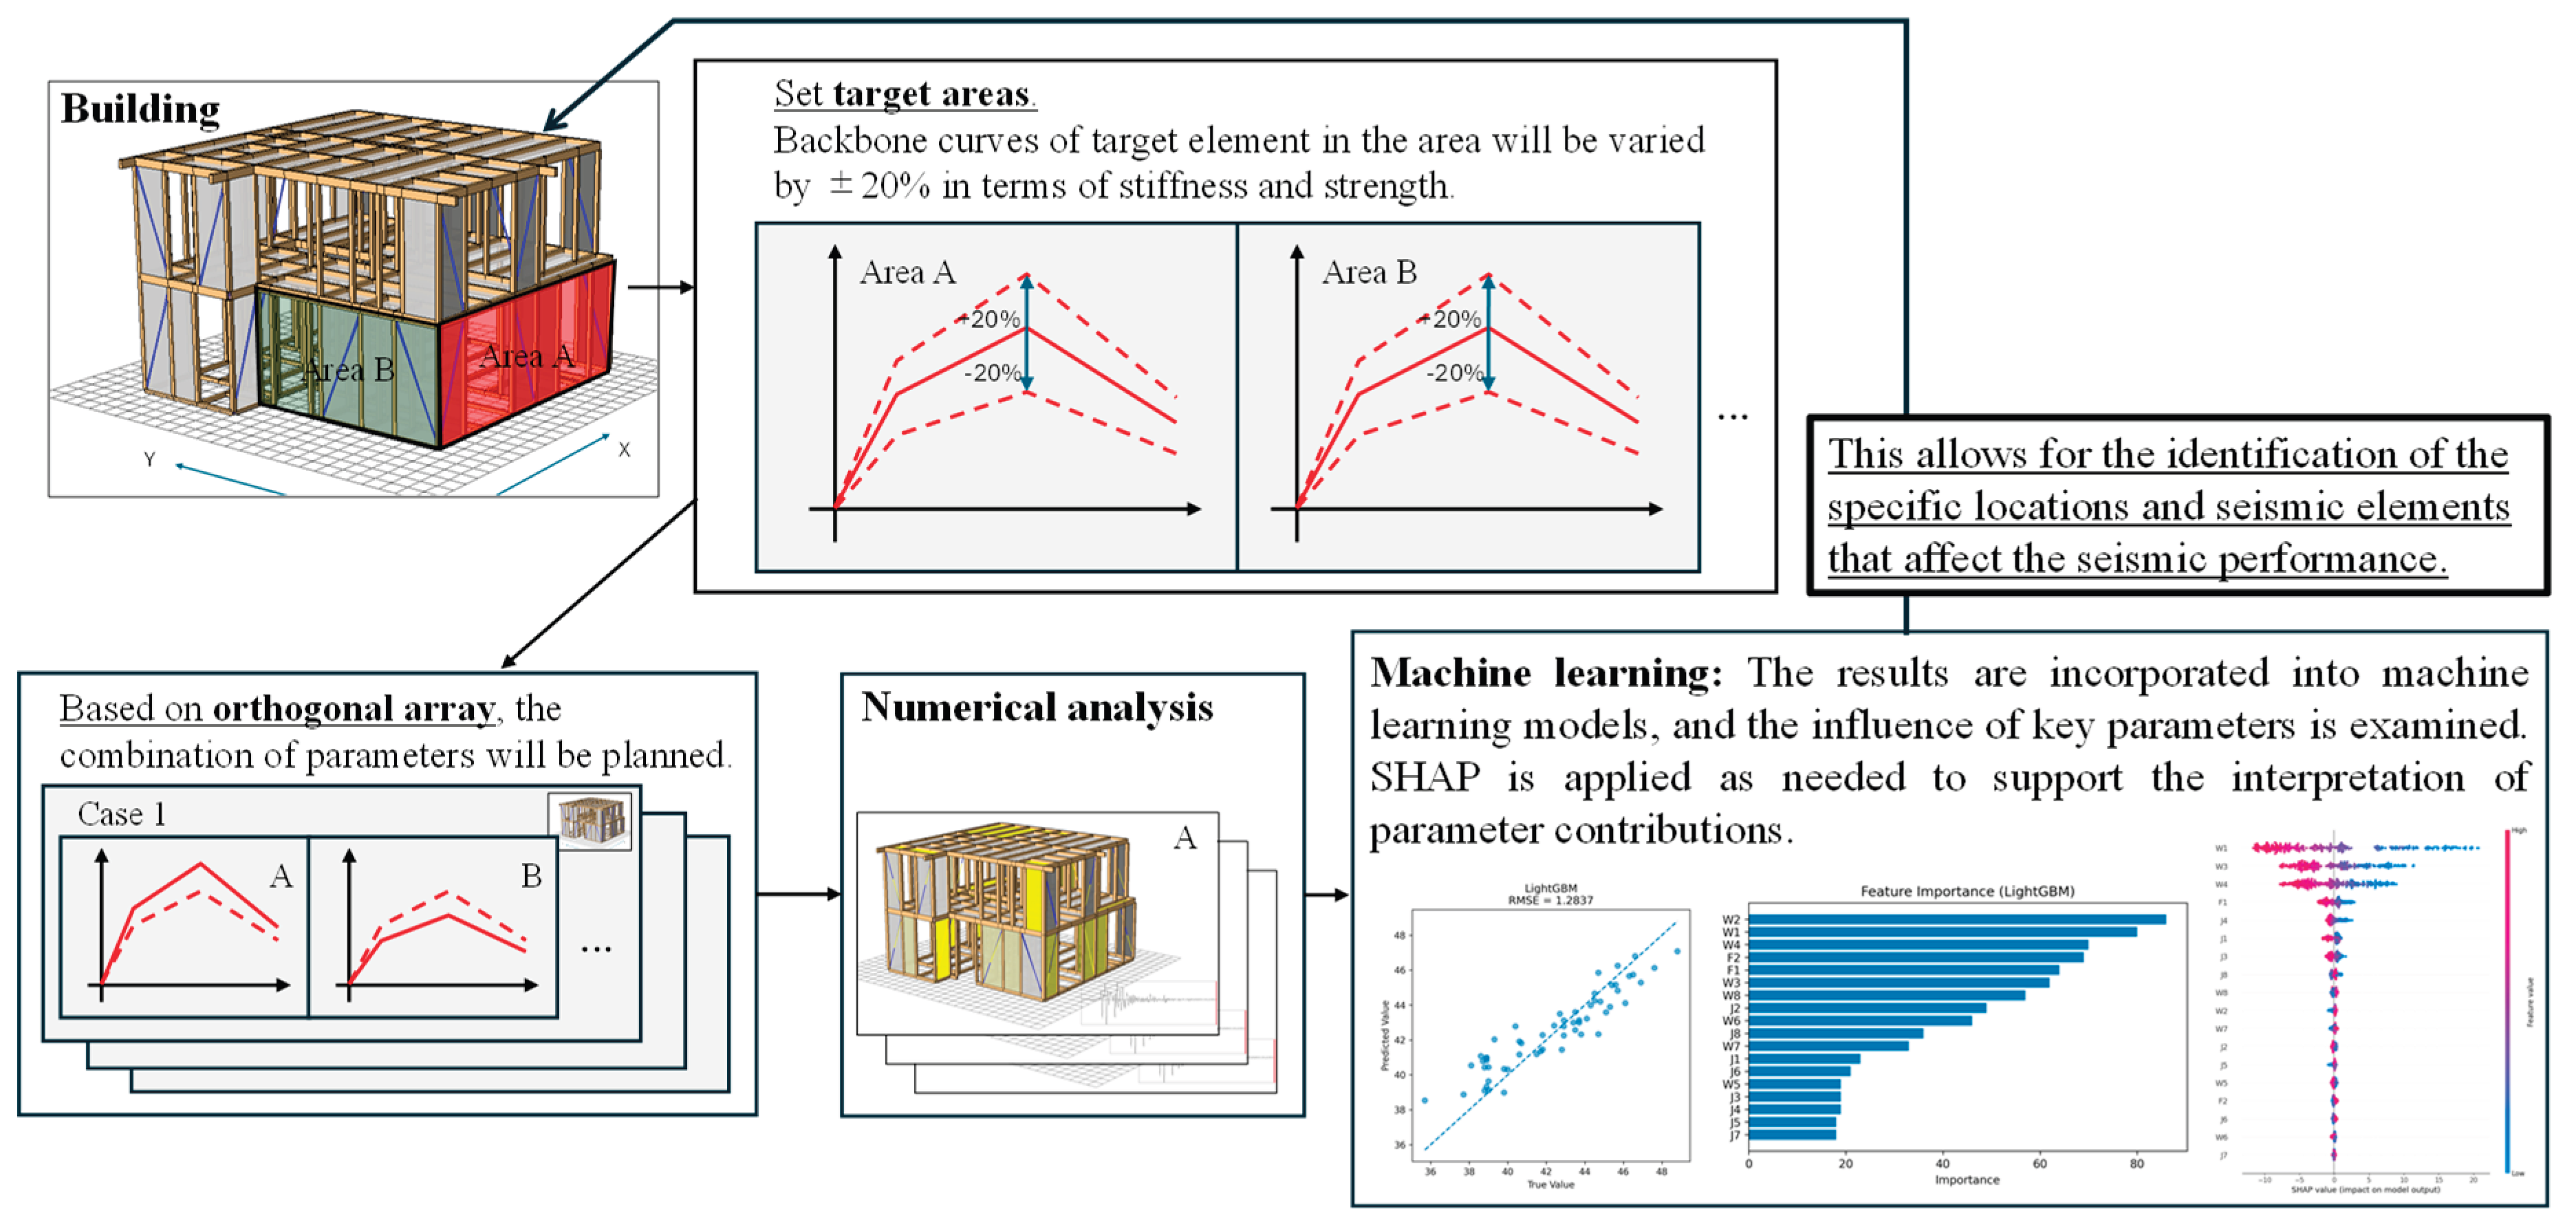
Figure 2.
Outline of analysis model: (a) Overview; (b) Wall; (c) Brace; (d) Joint.
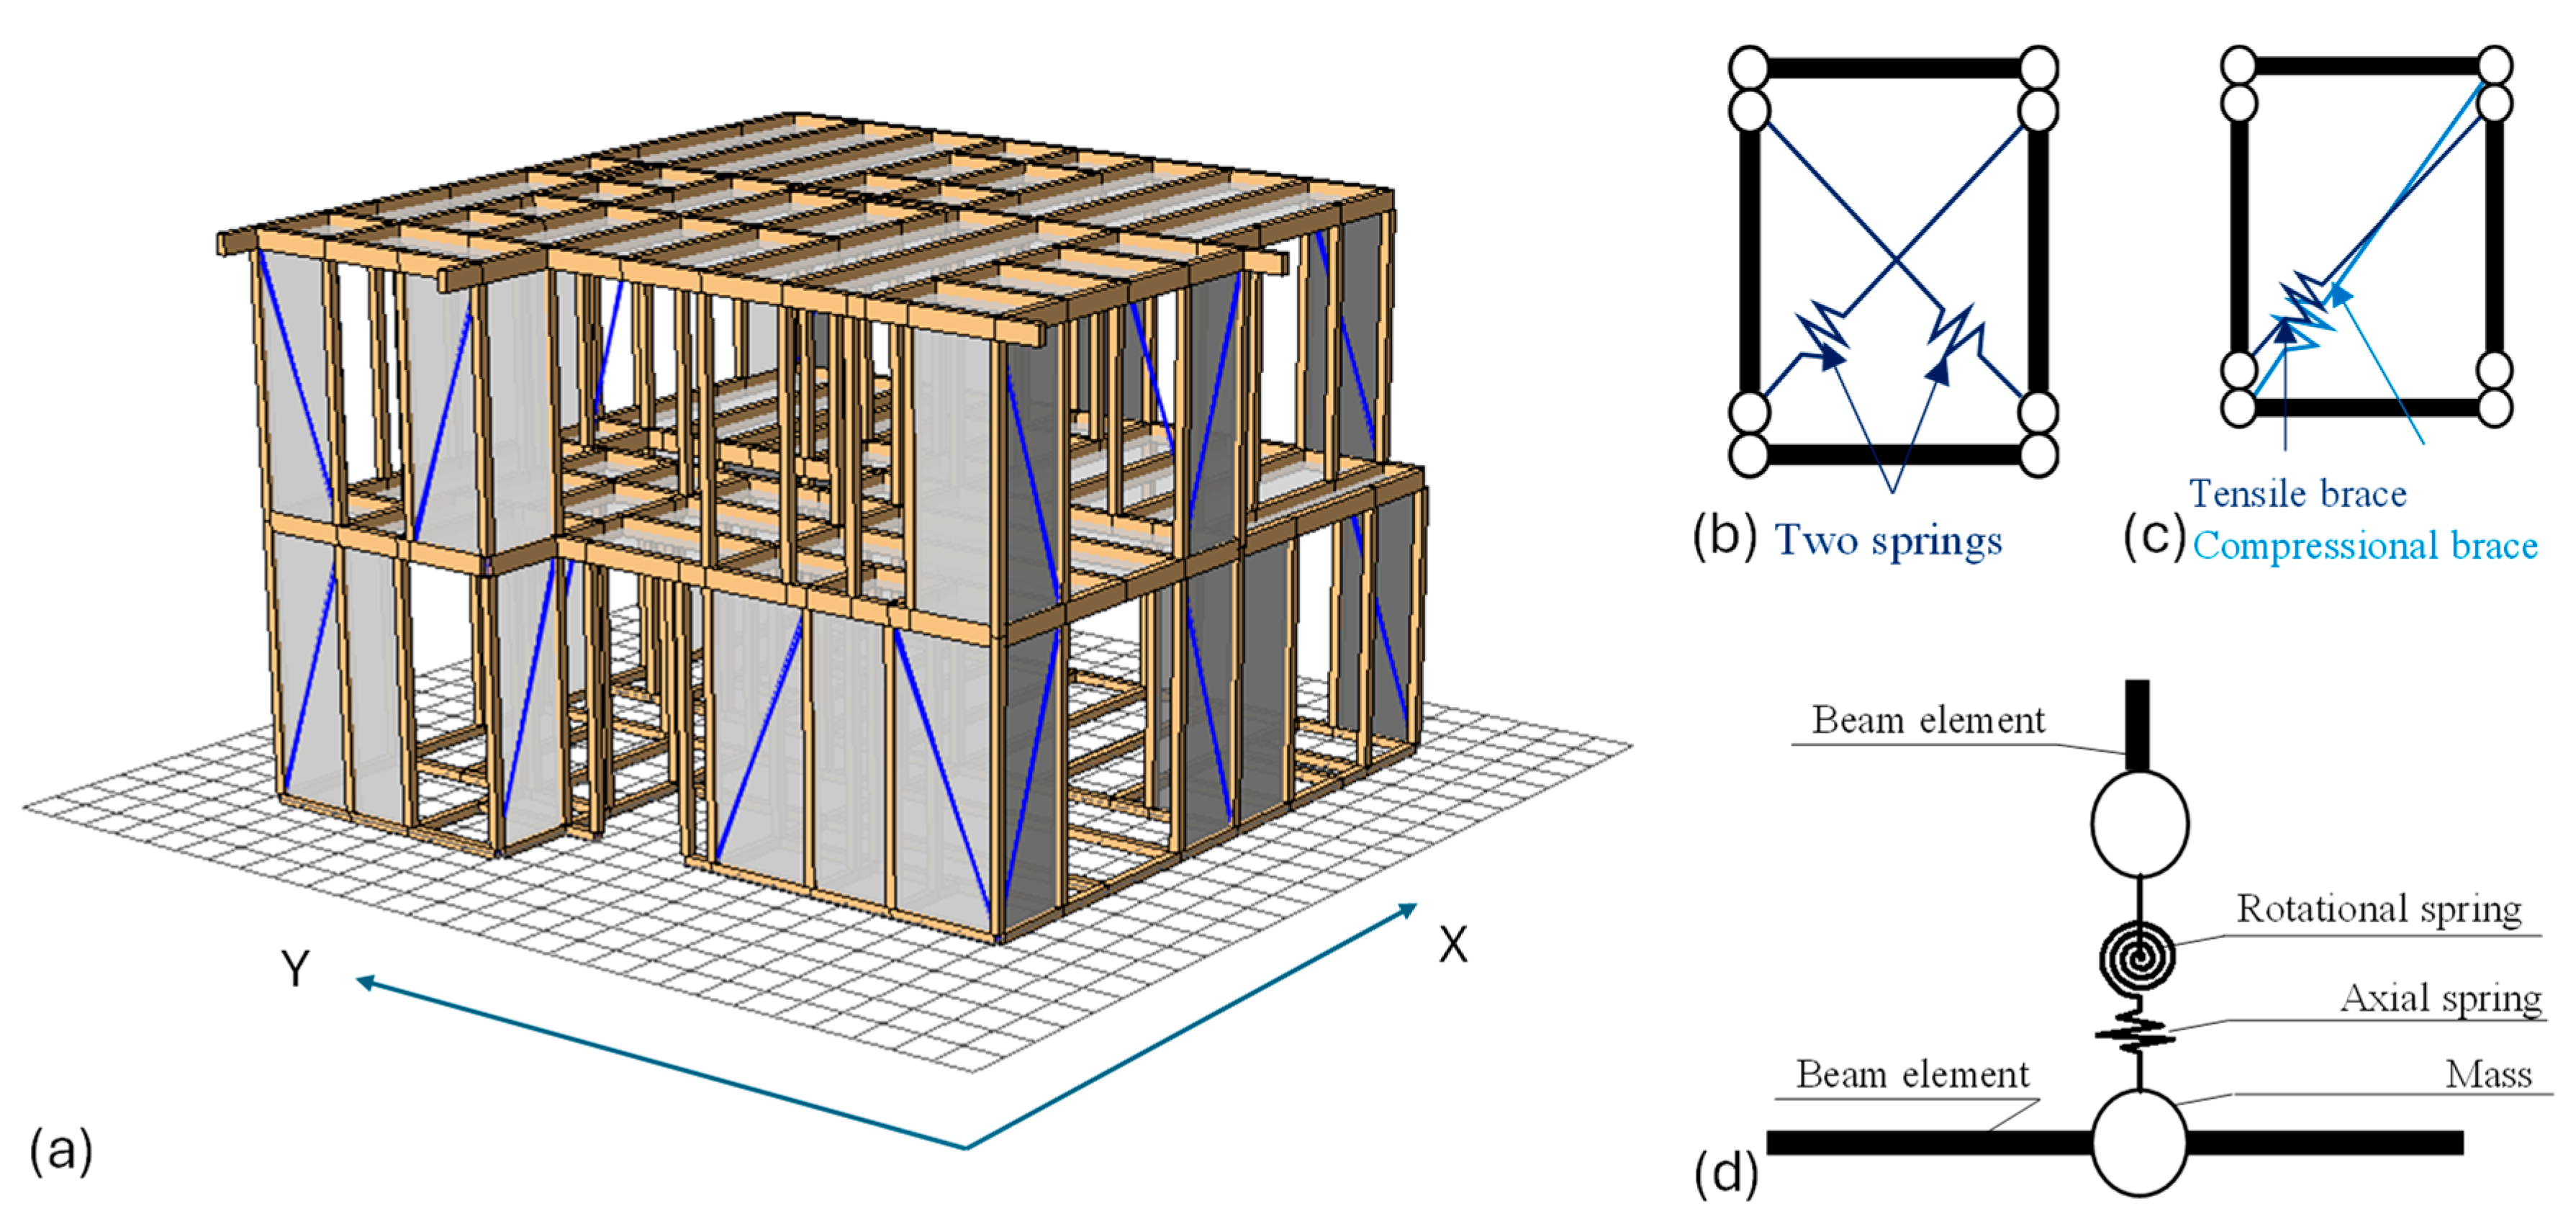
Figure 4.
Backbone curves of springs in analysis model: (a) Wall; (b) Tensile Spring; (c) Rotational Spring for joint.
Figure 4.
Backbone curves of springs in analysis model: (a) Wall; (b) Tensile Spring; (c) Rotational Spring for joint.
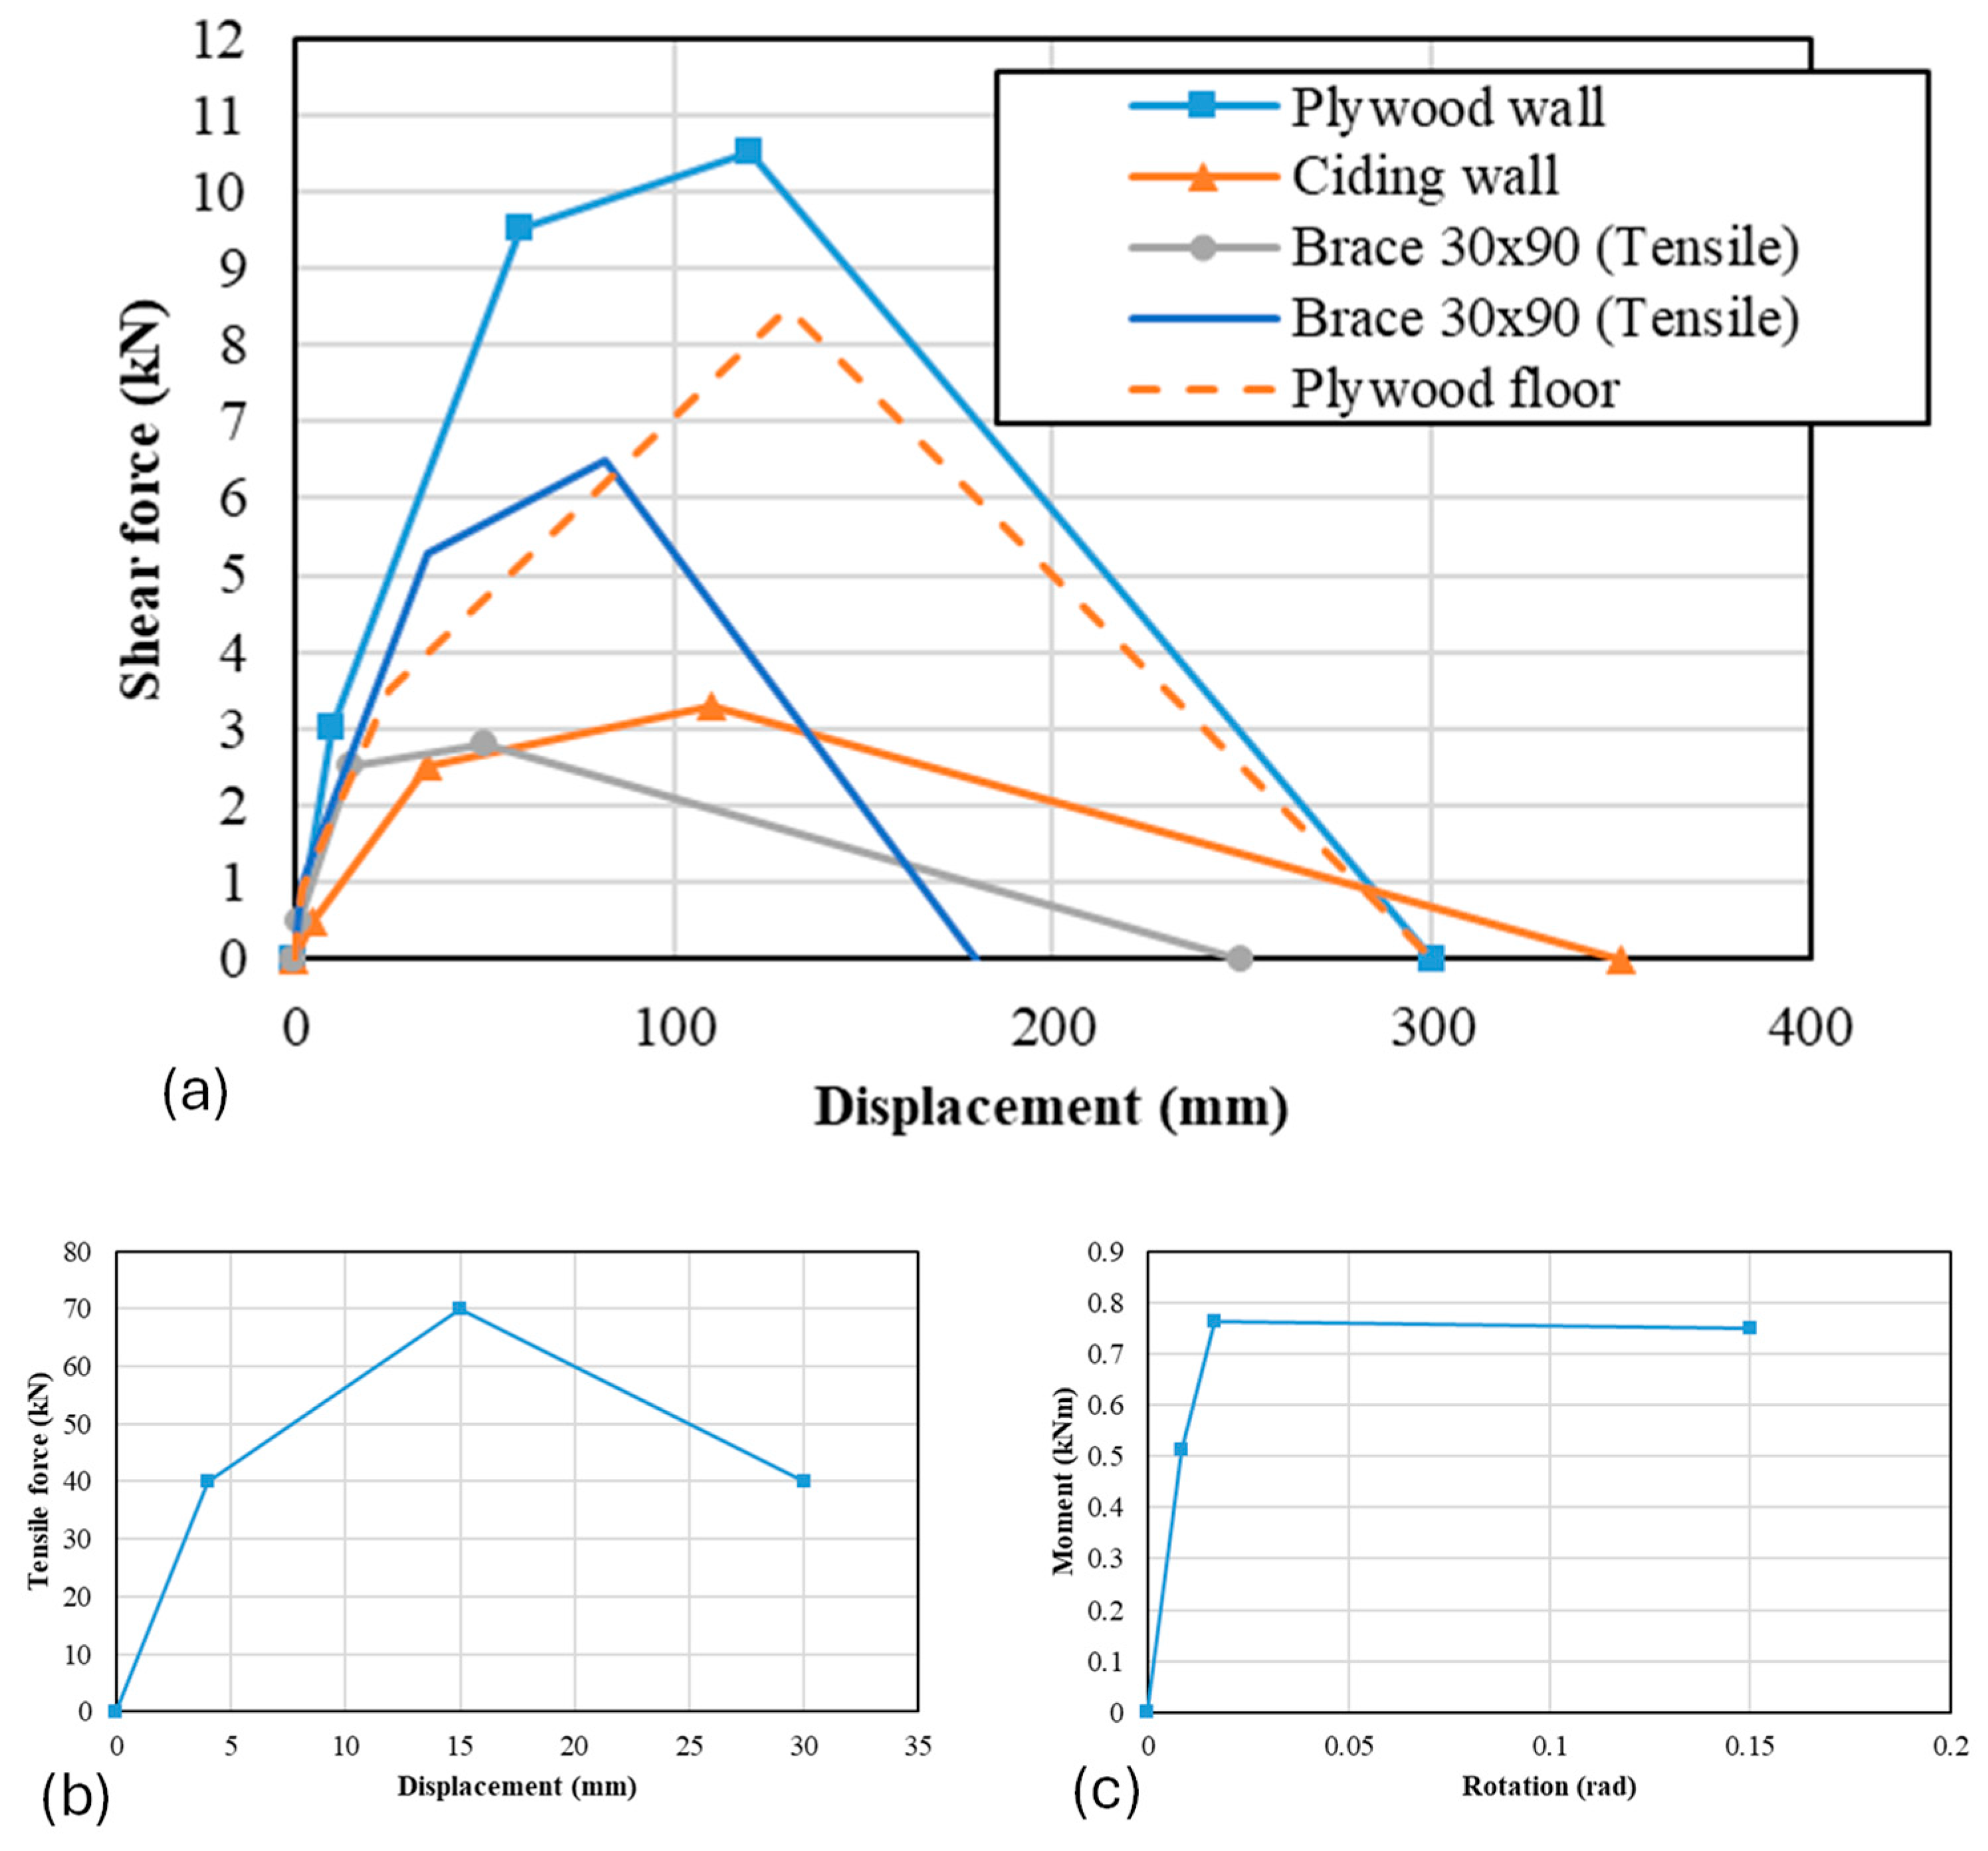
Figure 5.
Hysteresis rule of the wall and brace.
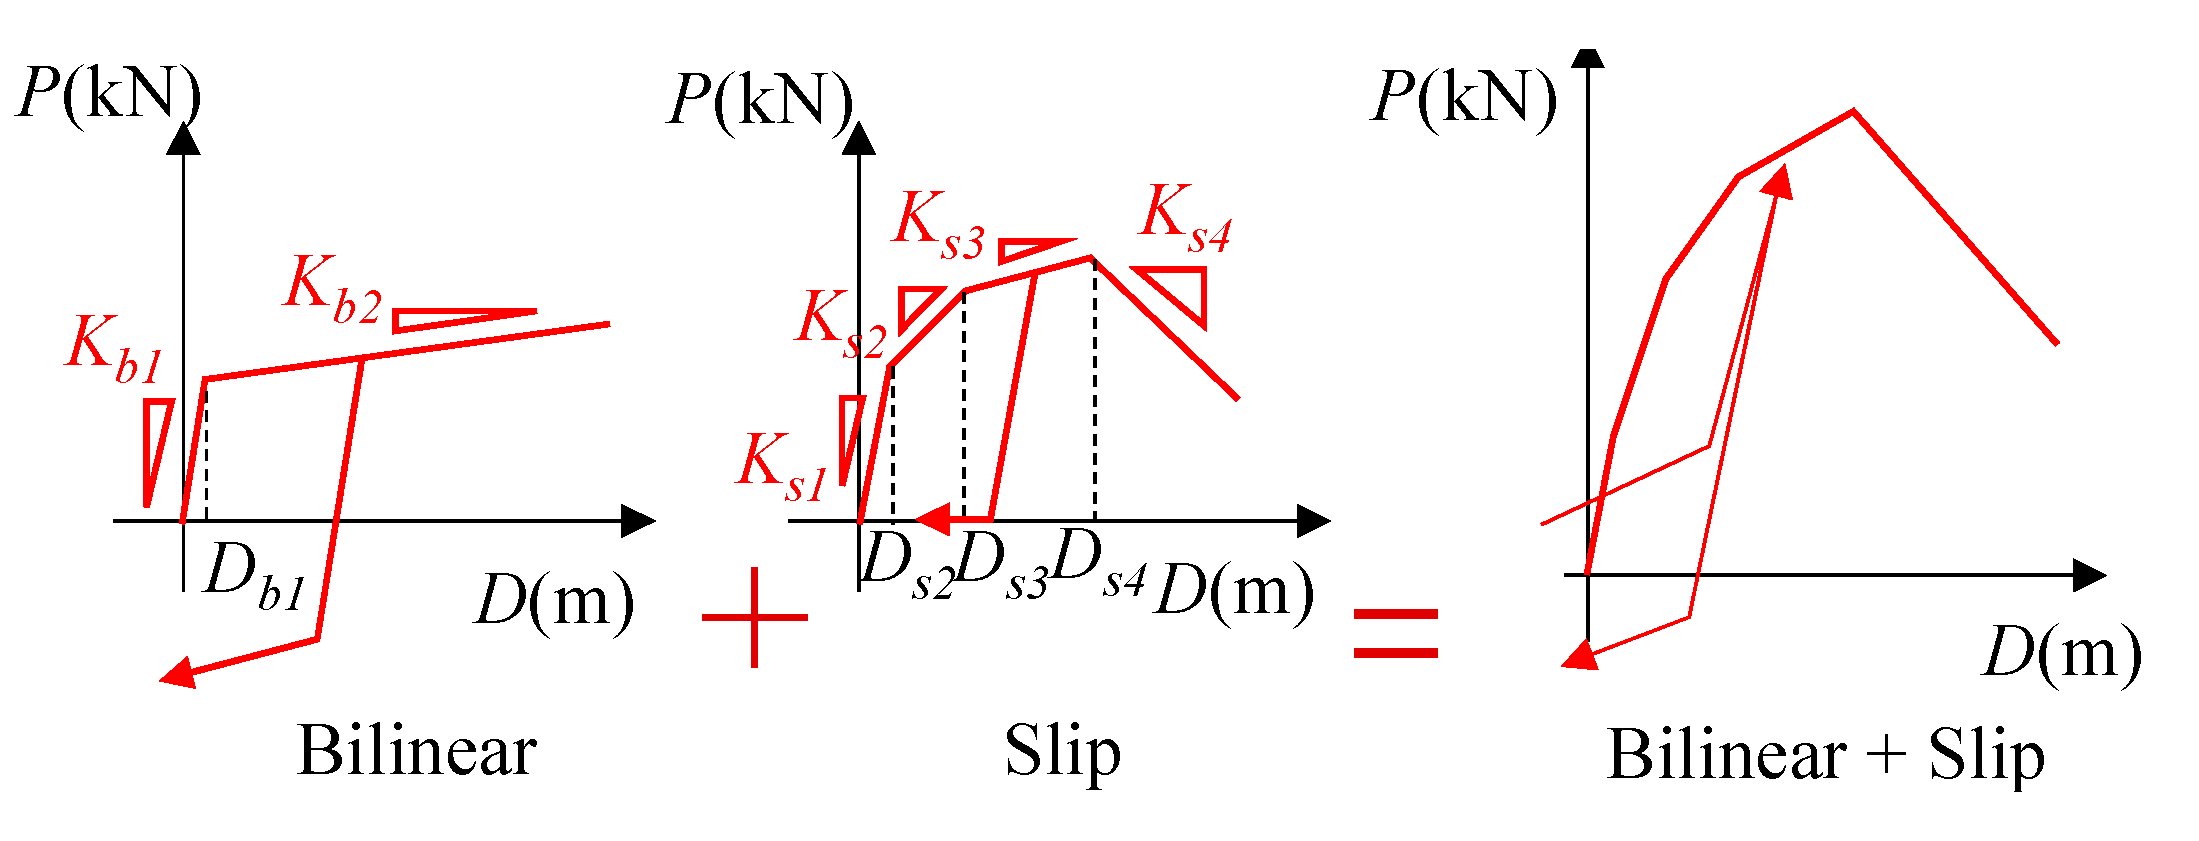
Figure 6.
Outline of input waves: (a) Sa-Sd curve; (b) time history curve of acceleration of JMA KOBE EW component; (c) time history curve of acceleration of JMA KOBE NS component;.
Figure 6.
Outline of input waves: (a) Sa-Sd curve; (b) time history curve of acceleration of JMA KOBE EW component; (c) time history curve of acceleration of JMA KOBE NS component;.
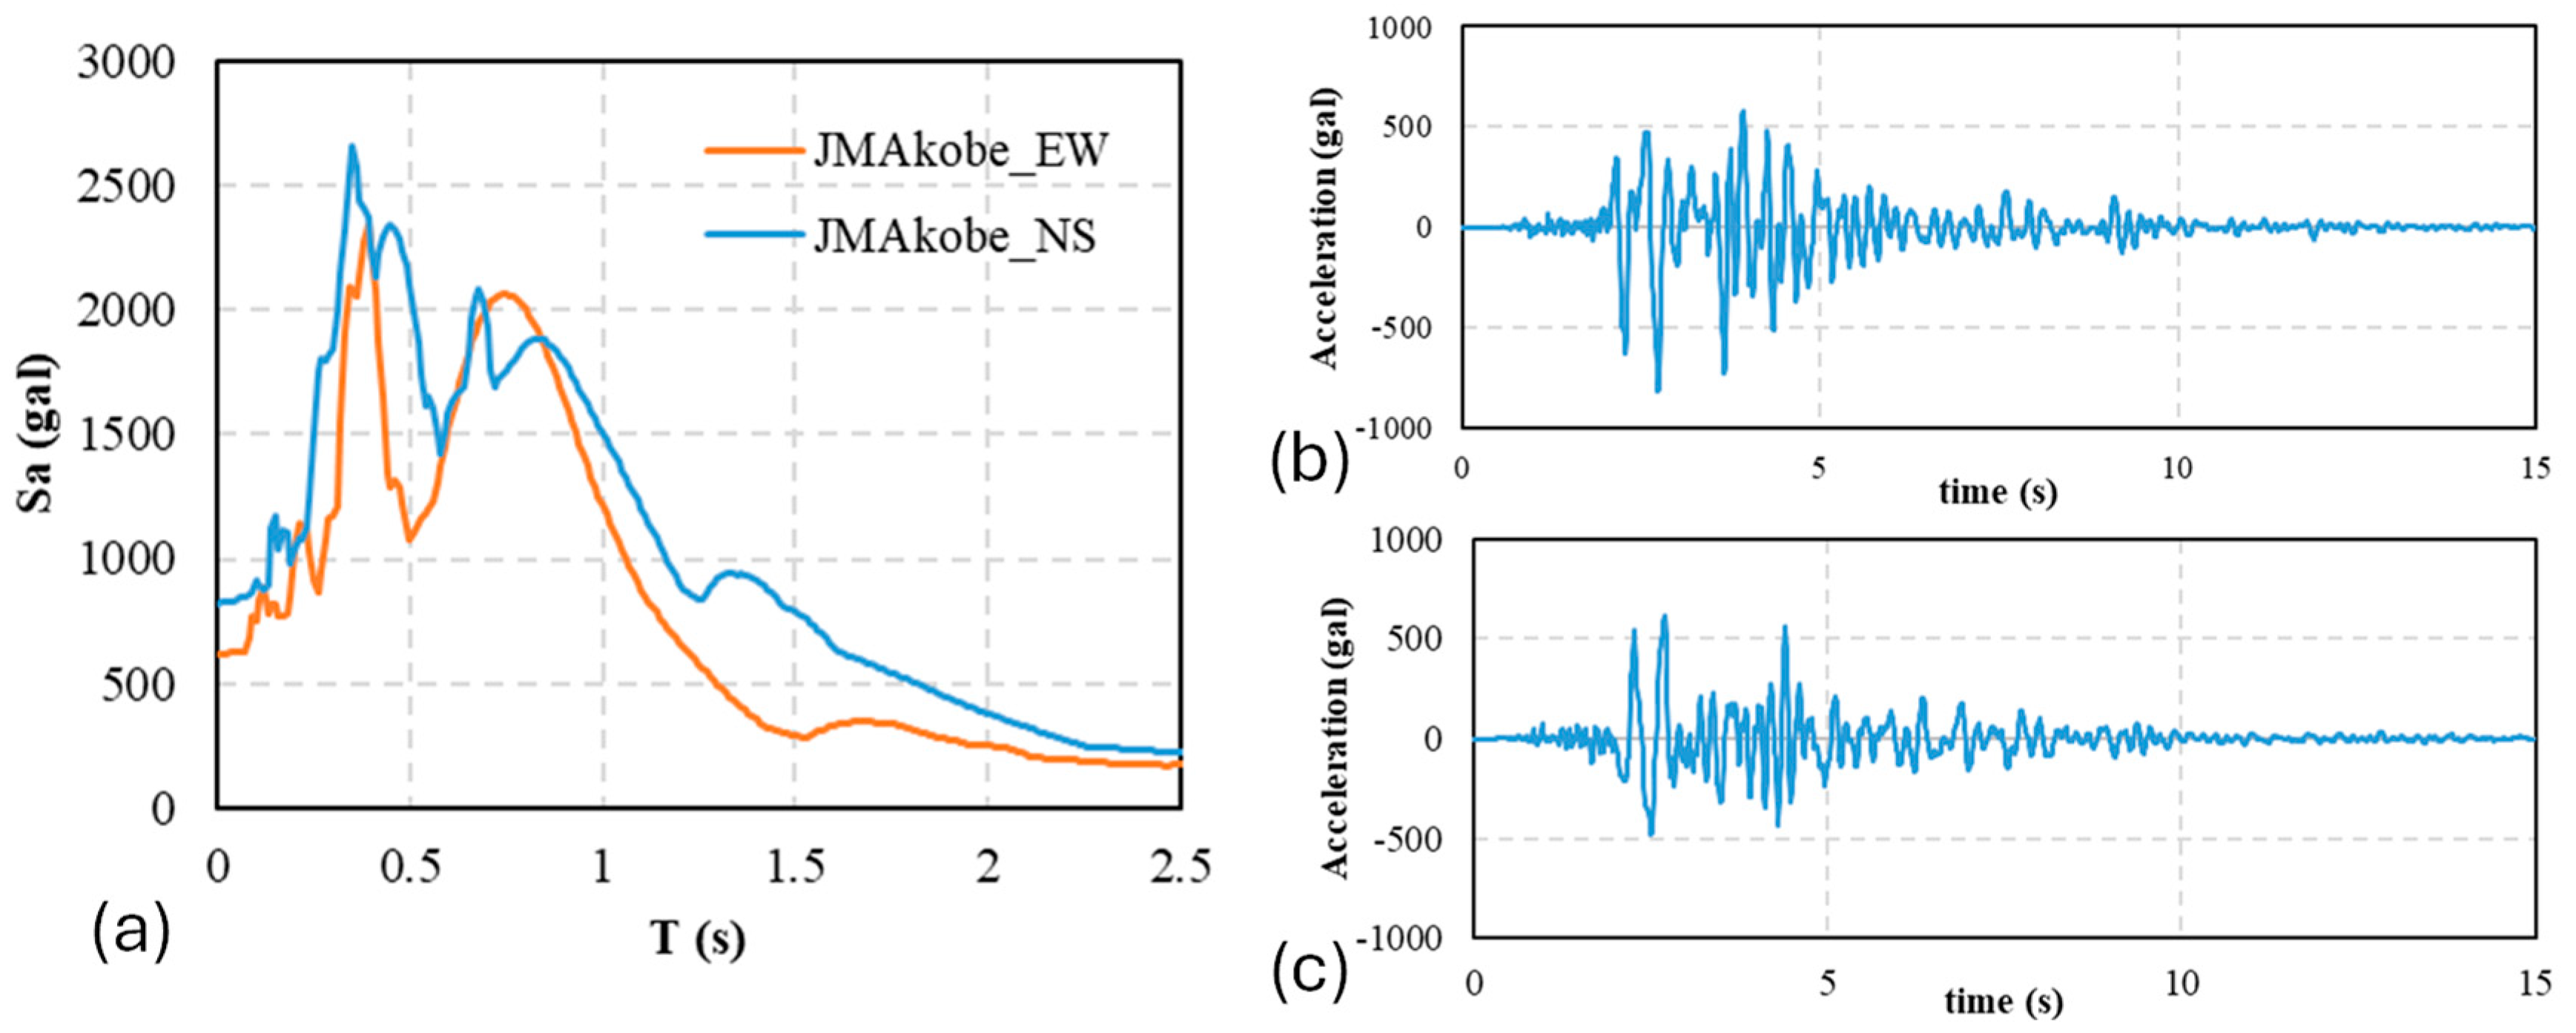
Figure 6.
Shear force versus Inter-story drift : 20% of JMA KOBE wave (a) first story in X; (b) first story in Y; (c) second story in X; (d) second story in Y; 100% of JMA KOBE wave (e) first story in X; (f) first story in Y; (g) second story in X; (h) second story in Y.
Figure 6.
Shear force versus Inter-story drift : 20% of JMA KOBE wave (a) first story in X; (b) first story in Y; (c) second story in X; (d) second story in Y; 100% of JMA KOBE wave (e) first story in X; (f) first story in Y; (g) second story in X; (h) second story in Y.
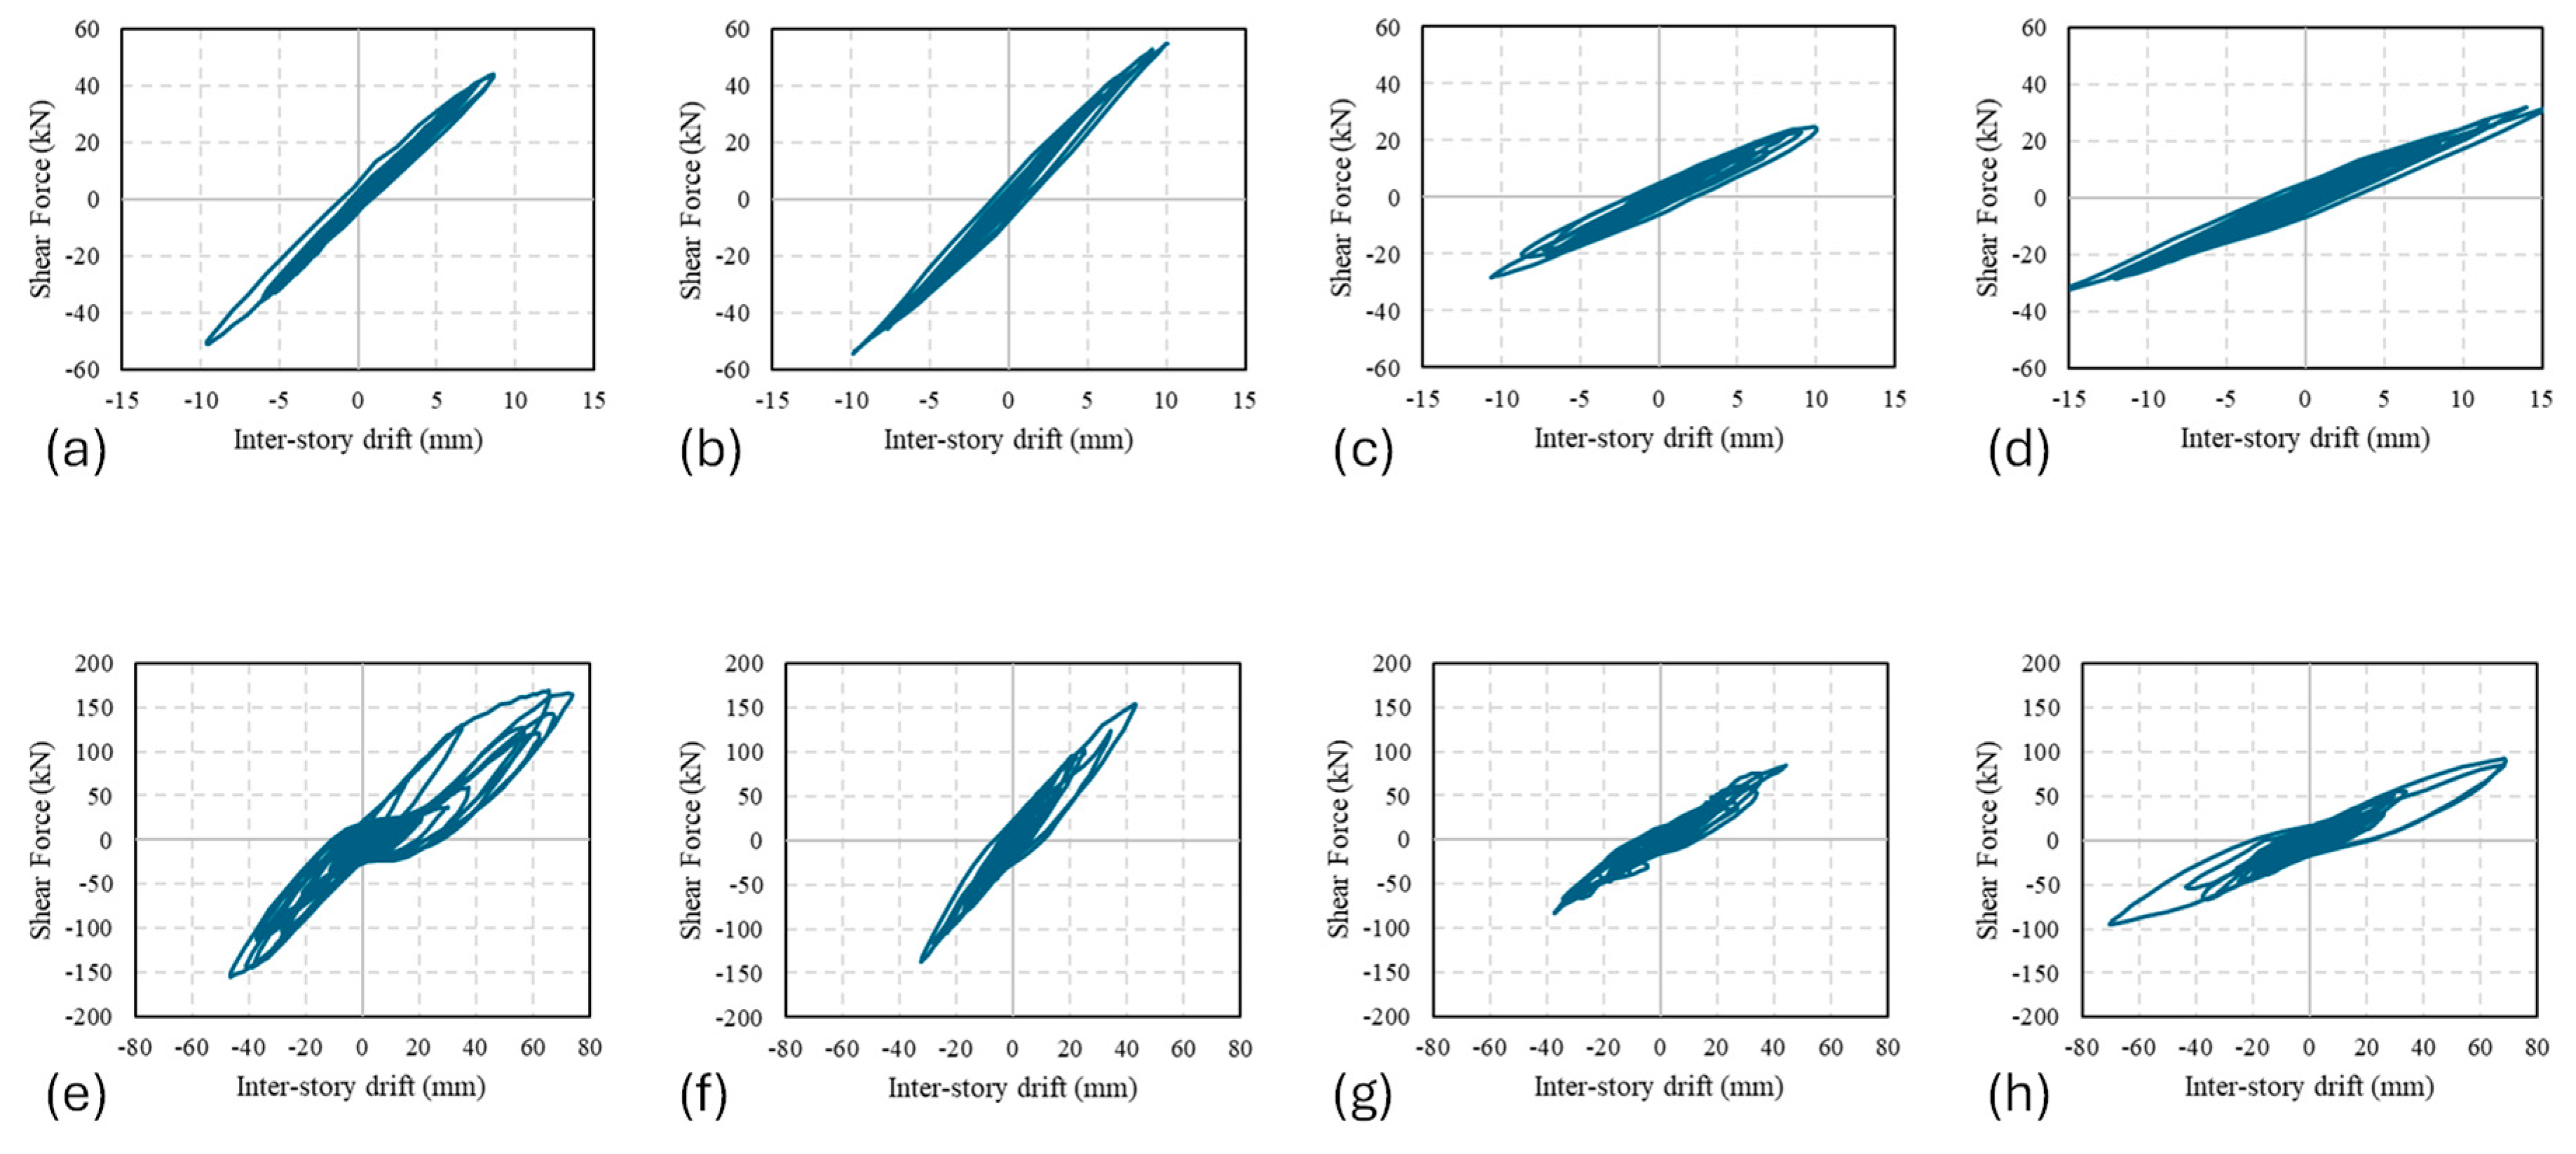
Figure 7.
Plan views and target areas: (a) First story; (b) second story.
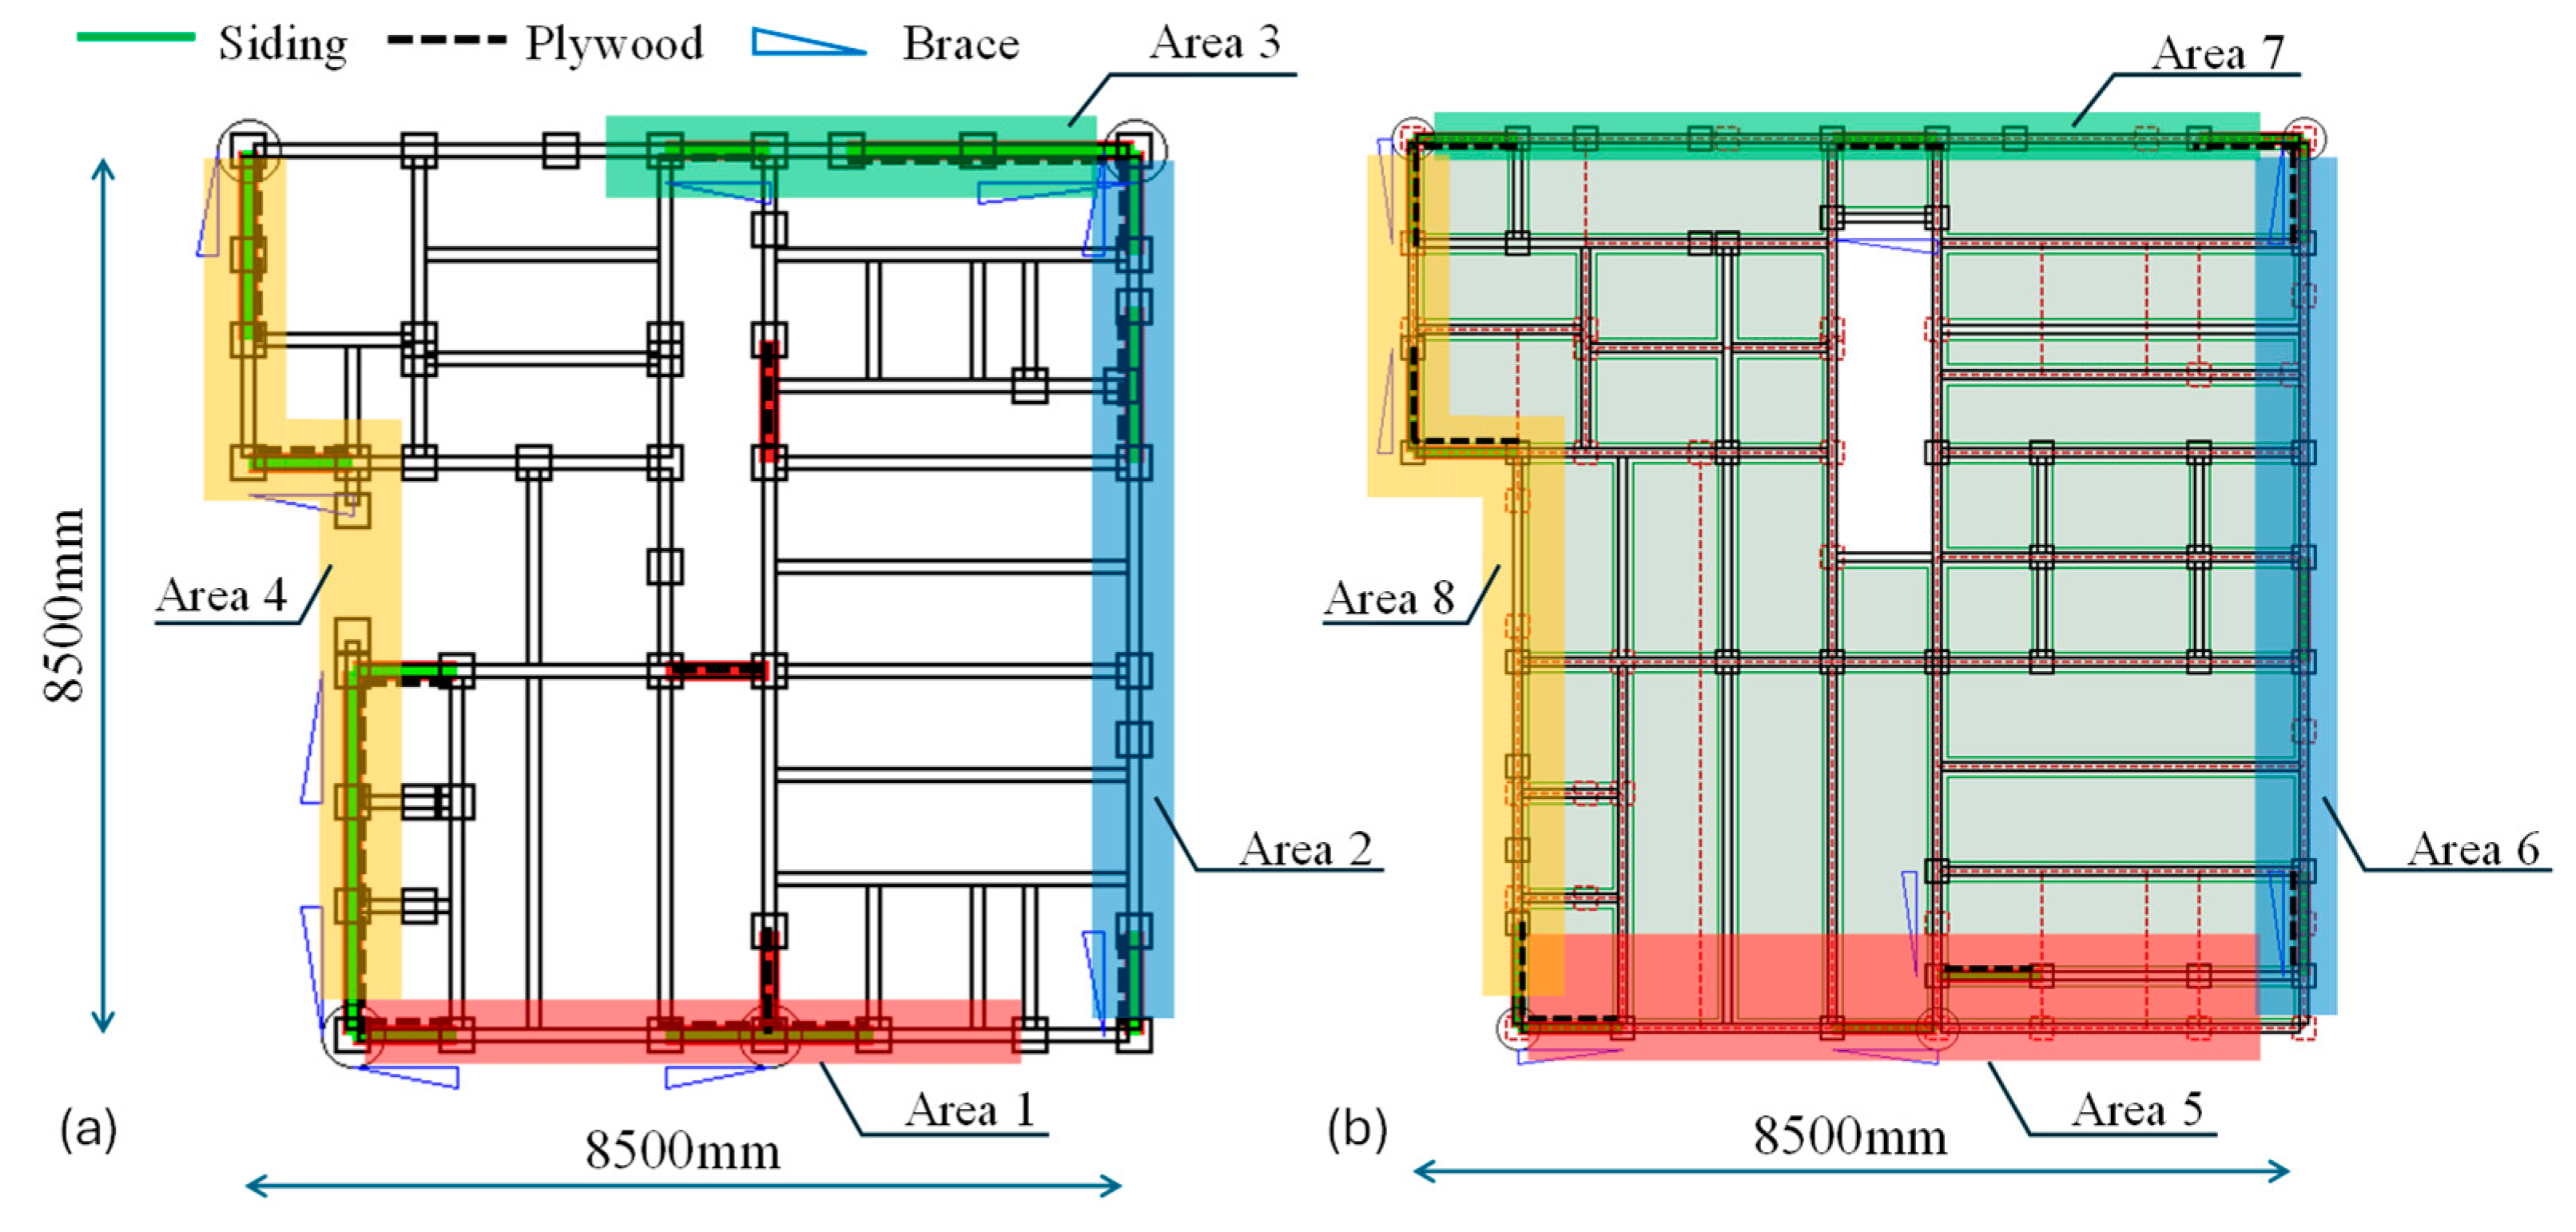
Figure 8.
Model loss curves; (a) GradientBoosting; (b) LightGBM.
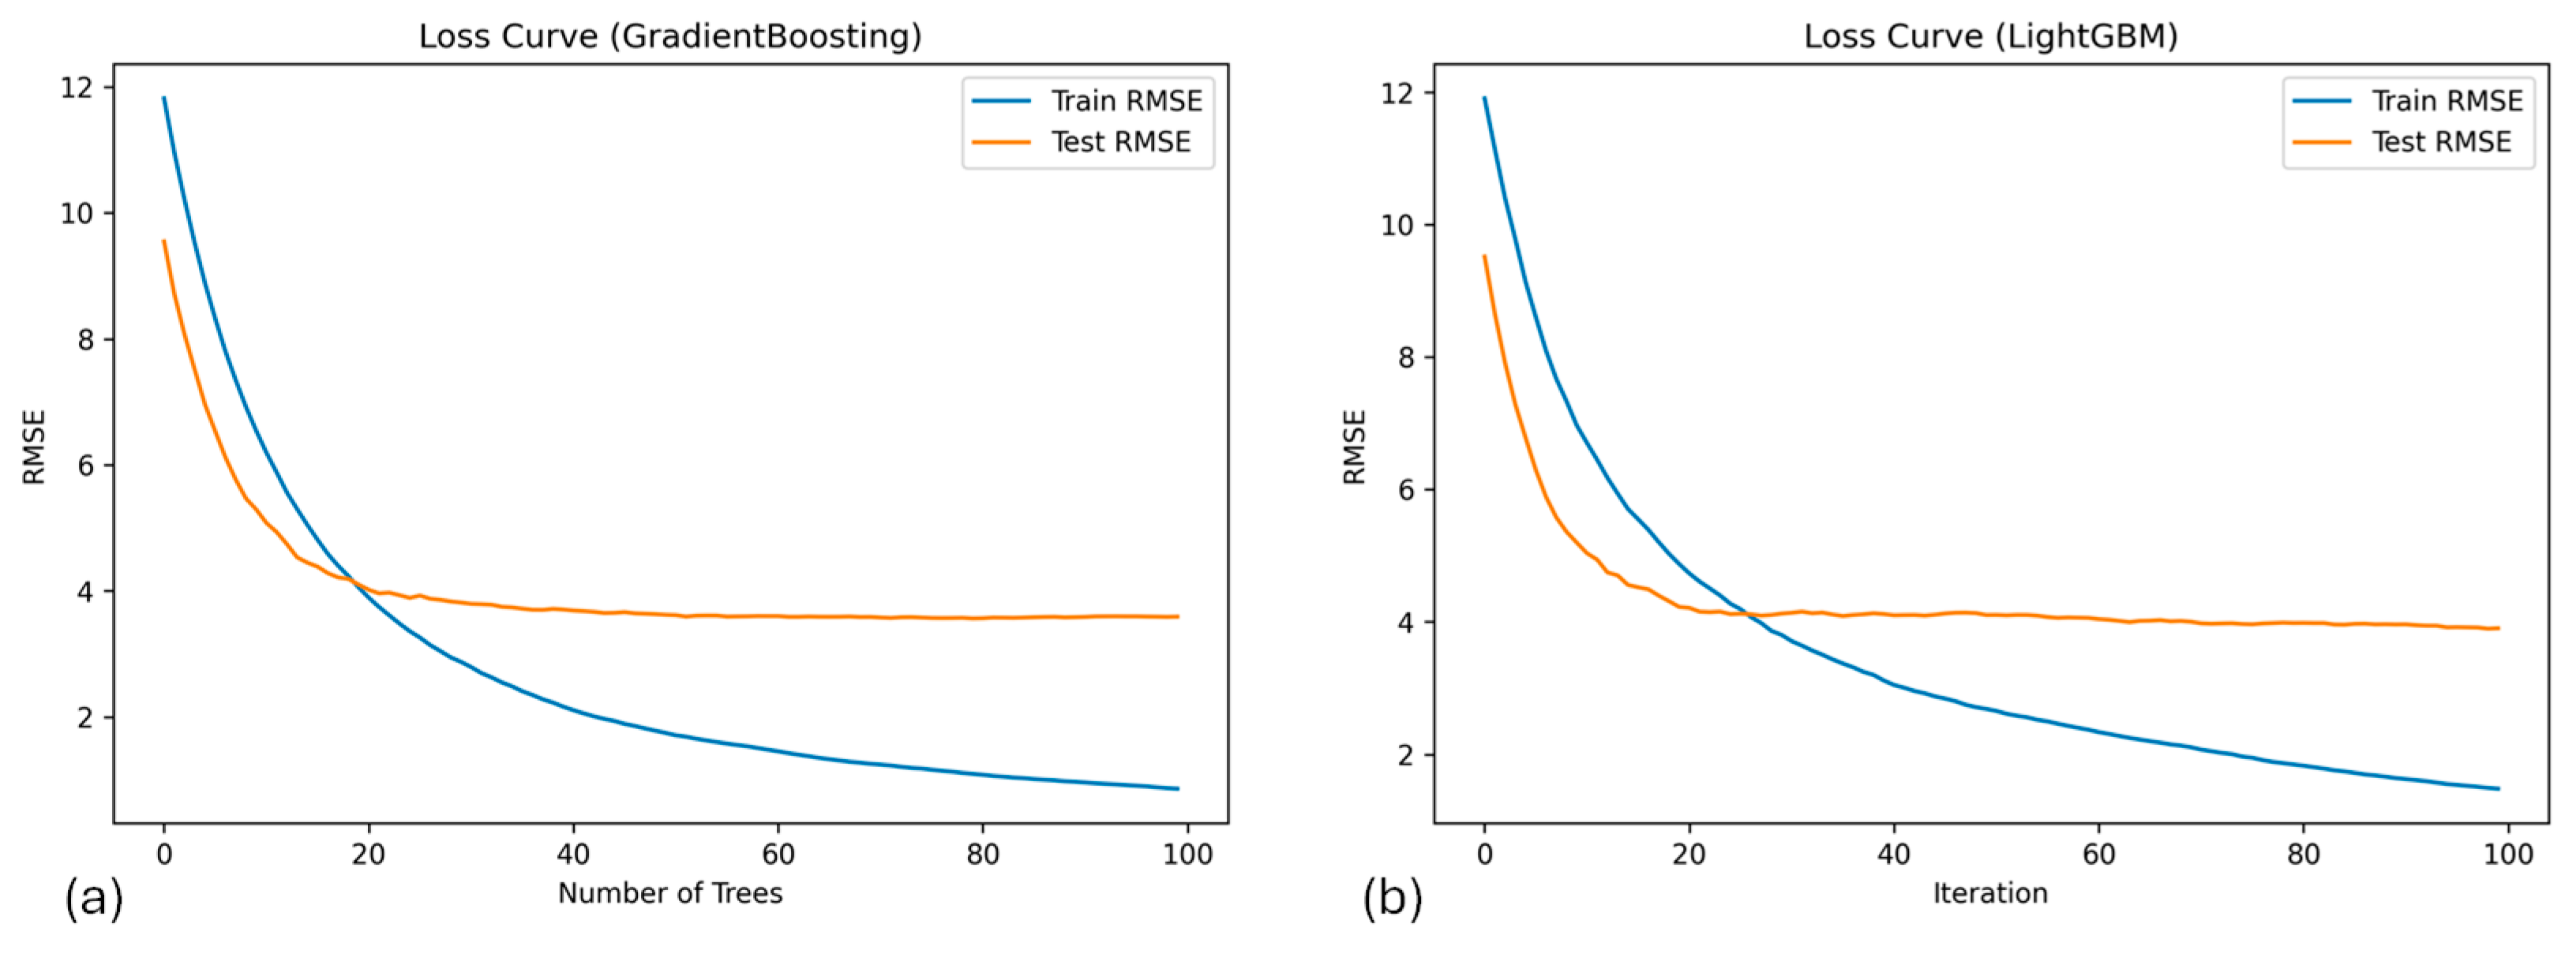
Figure 9.
True and predicted values and Feature Importances (Maximum Inter-story drift of X direction in 1st story in JMA KOBE 20%): True and predicted values based on (a) GradientBoosting; (b) LightGBM; (c)LinearRegrassion; (d) RandomForest; Feature Importances based on (e) GradientBoosting; (f) LightGBM; (g)LinearRegrassion; (h) RandomForest.
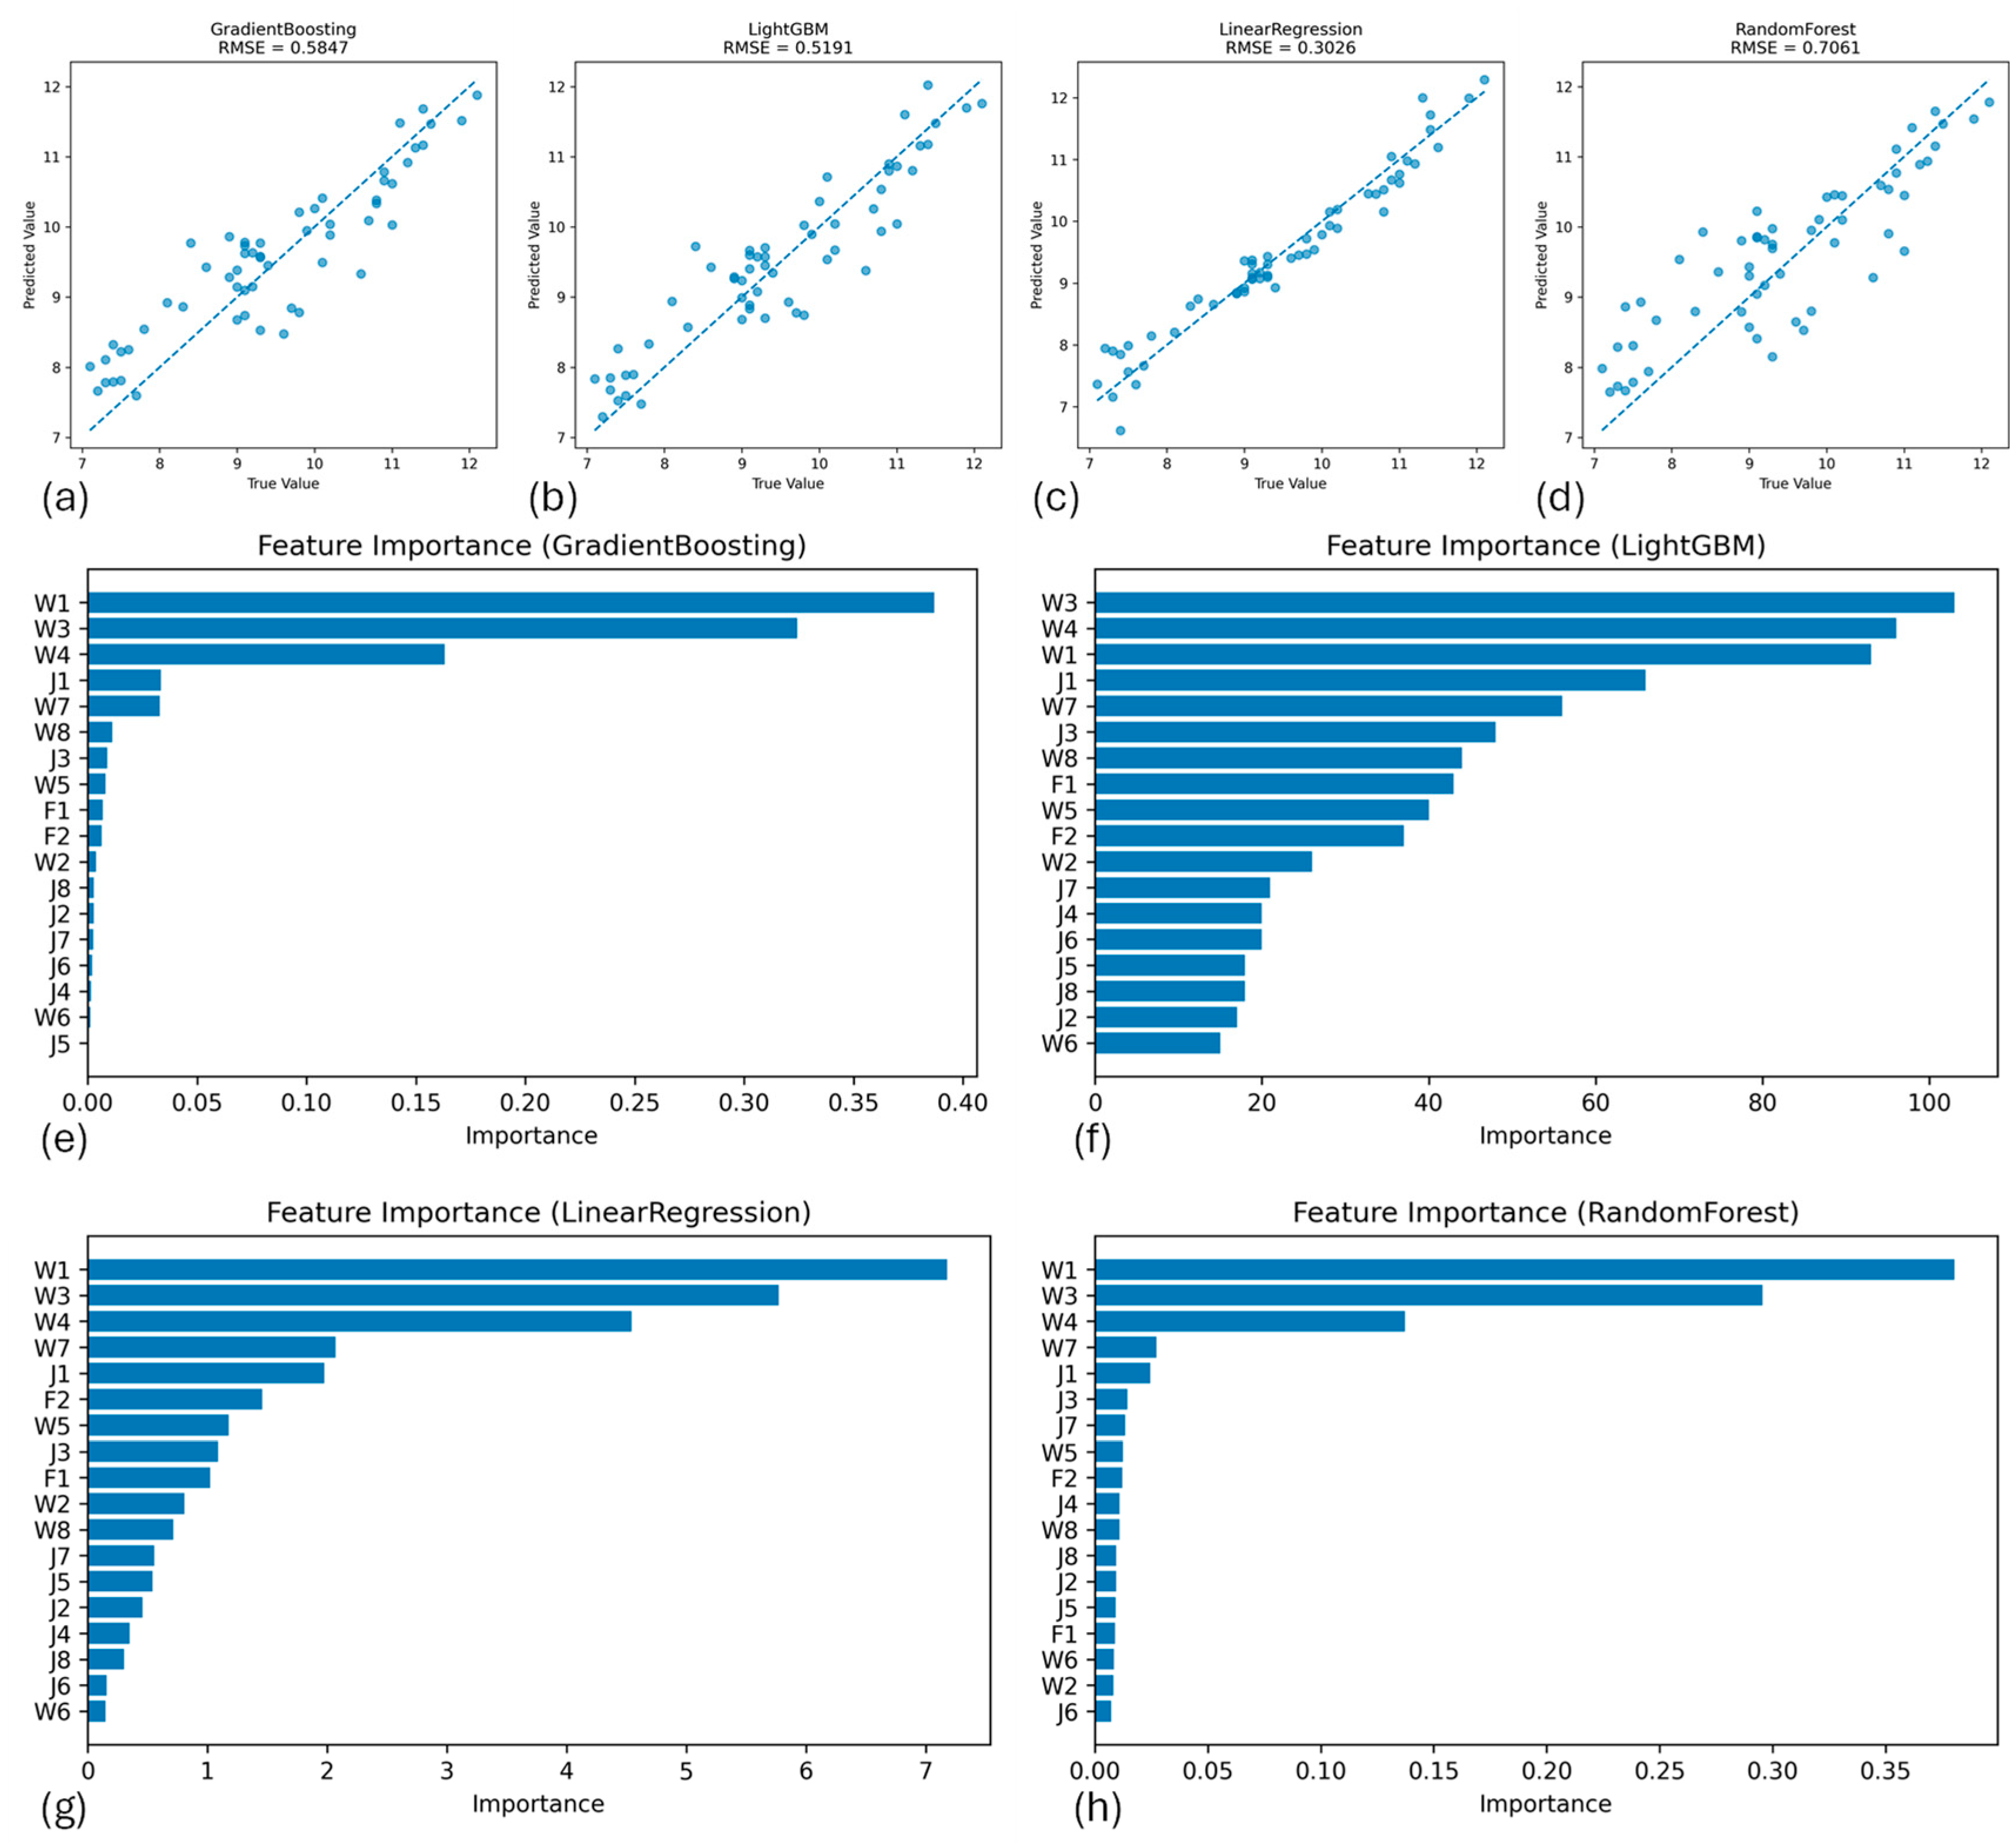
Figure 10.
Feature Importances (Maximum Inter-story drift of X direction in 1st story in JMA KOBE 100%): True and predicted values based on (a) GradientBoosting; (b) LightGBM; (c)LinearRegrassion; (d) RandomForest; Feature Importances based on (e) GradientBoosting; (f) LightGBM; (g)LinearRegrassion; (h) RandomForest.
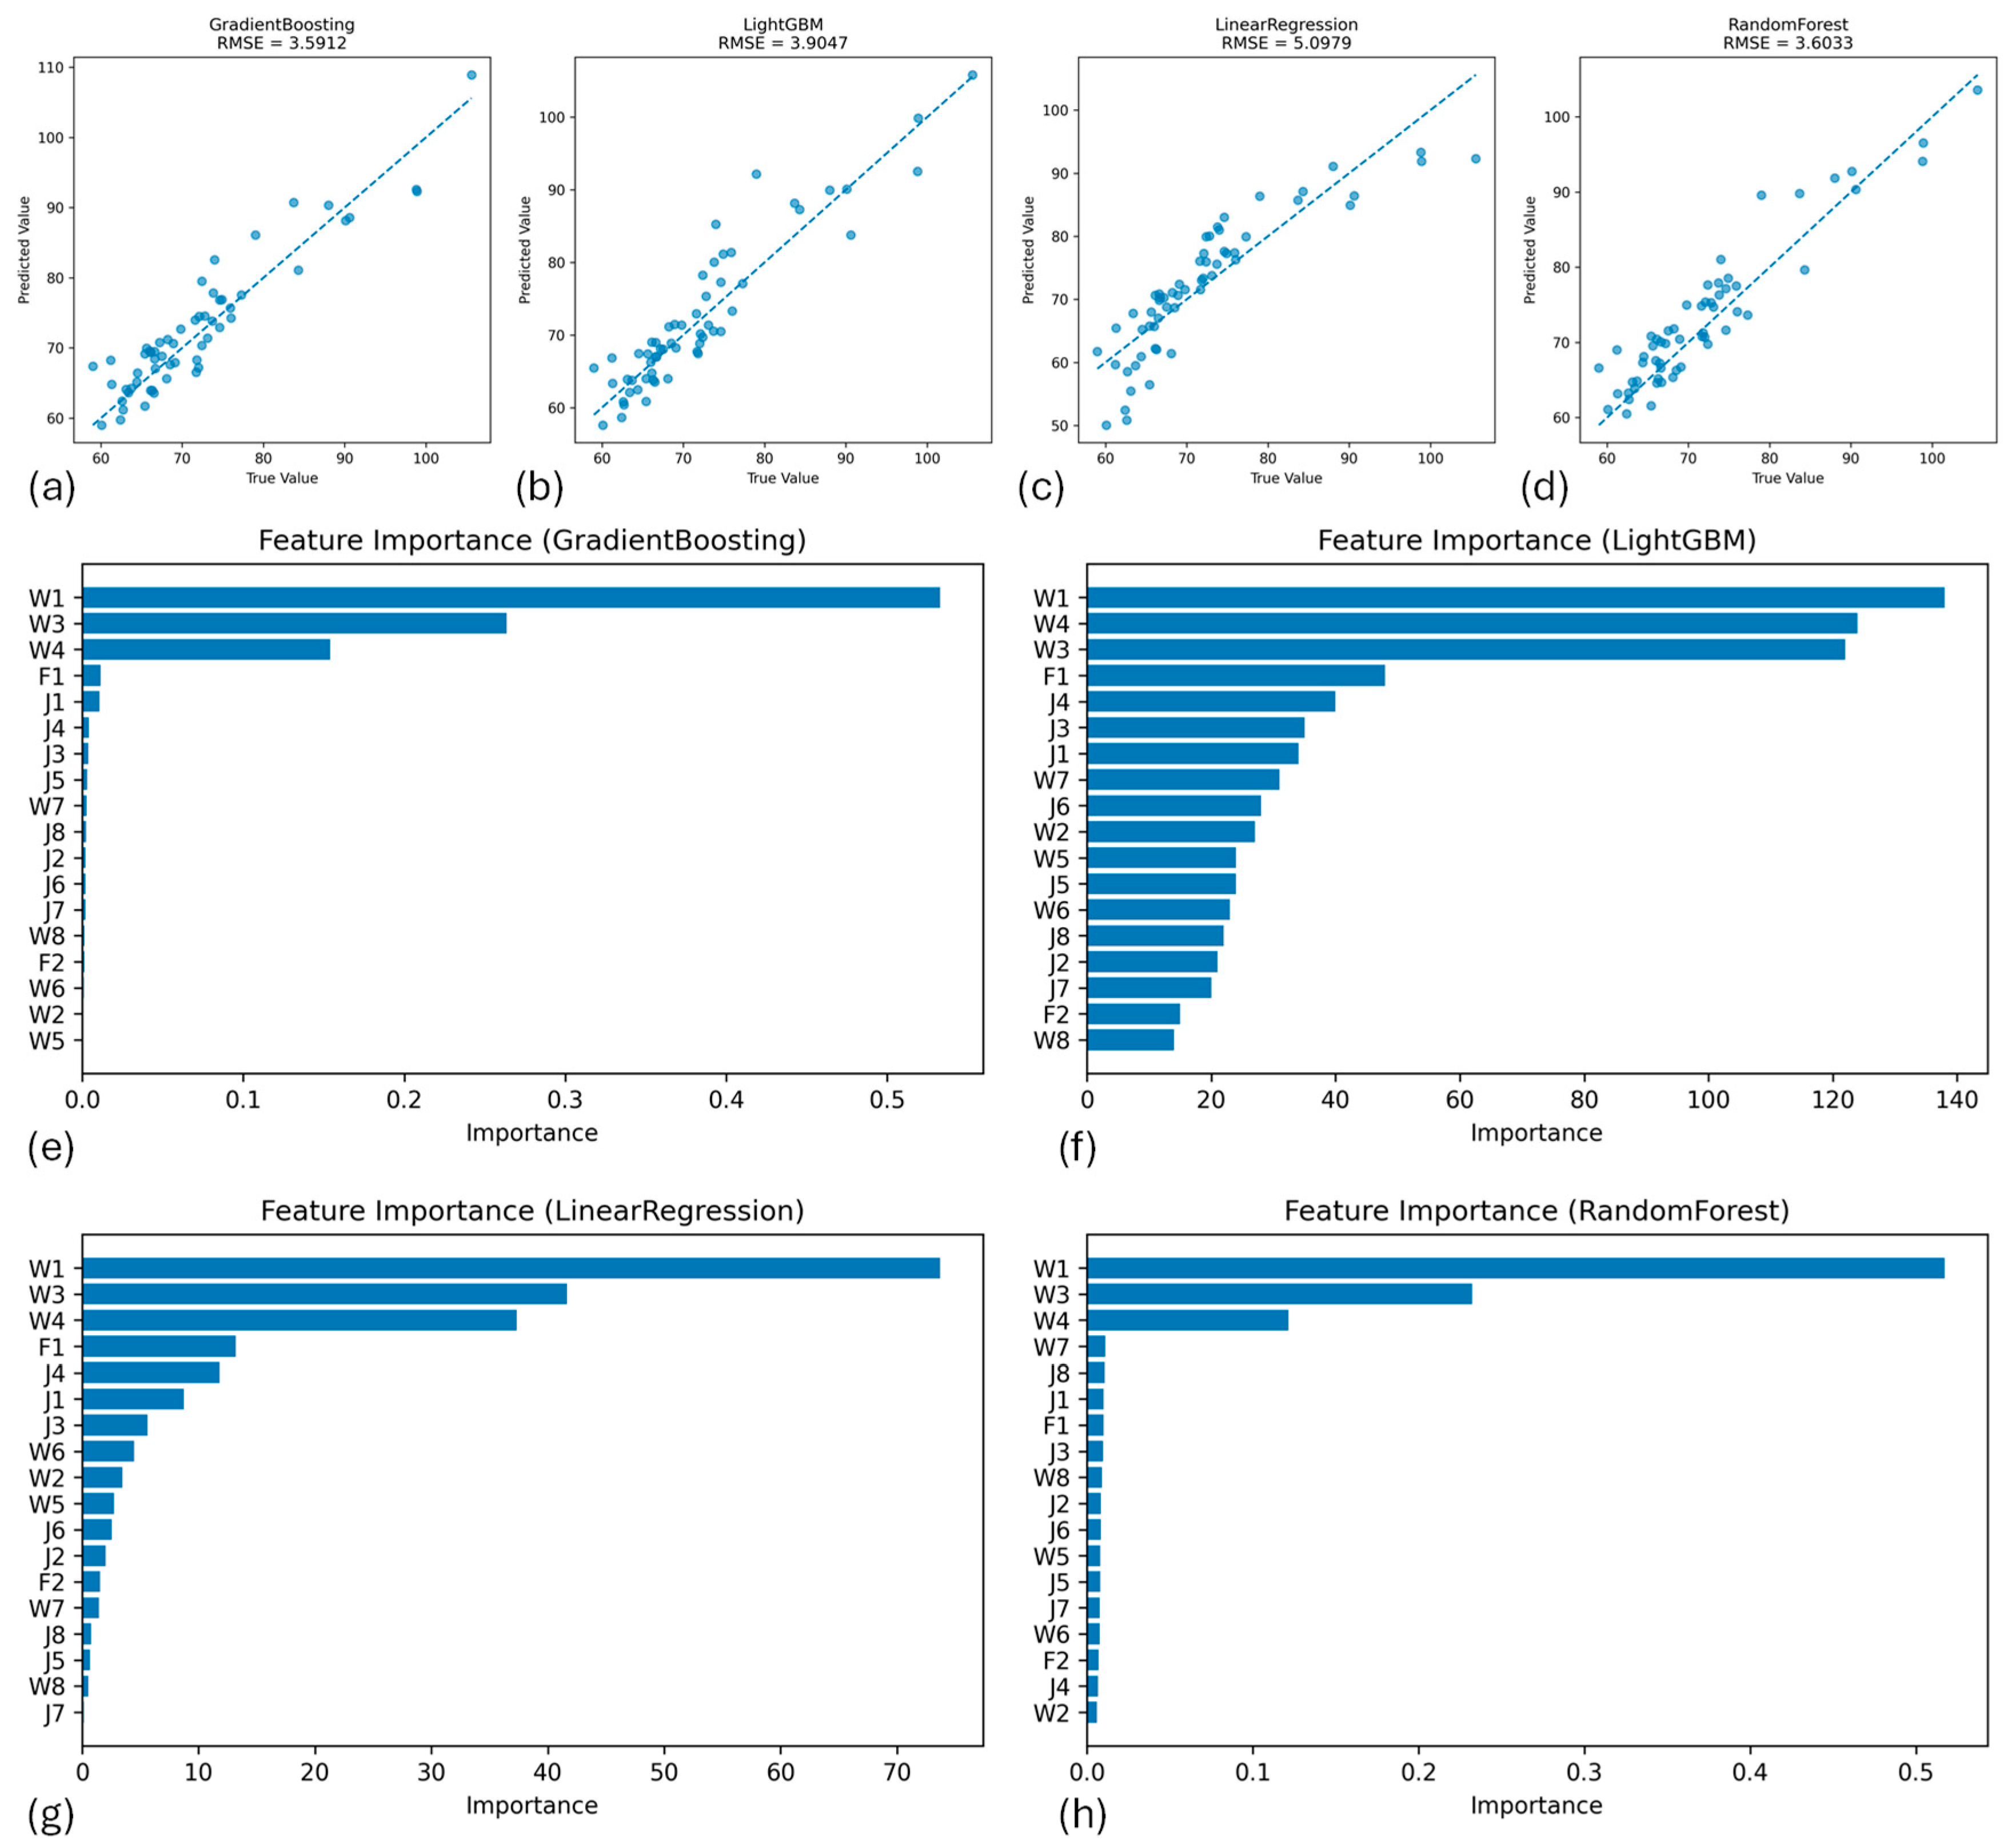
Figure 11.
Feature Importances (Maximum Inter-story drift of Y direction in 1st story in JMA KOBE 100%): True and predicted values based on (a) GradientBoosting; (b) LightGBM; (c)LinearRegrassion; (d) RandomForest; Feature Importances based on (e) GradientBoosting; (f) LightGBM; (g)LinearRegrassion; (h) RandomForest.
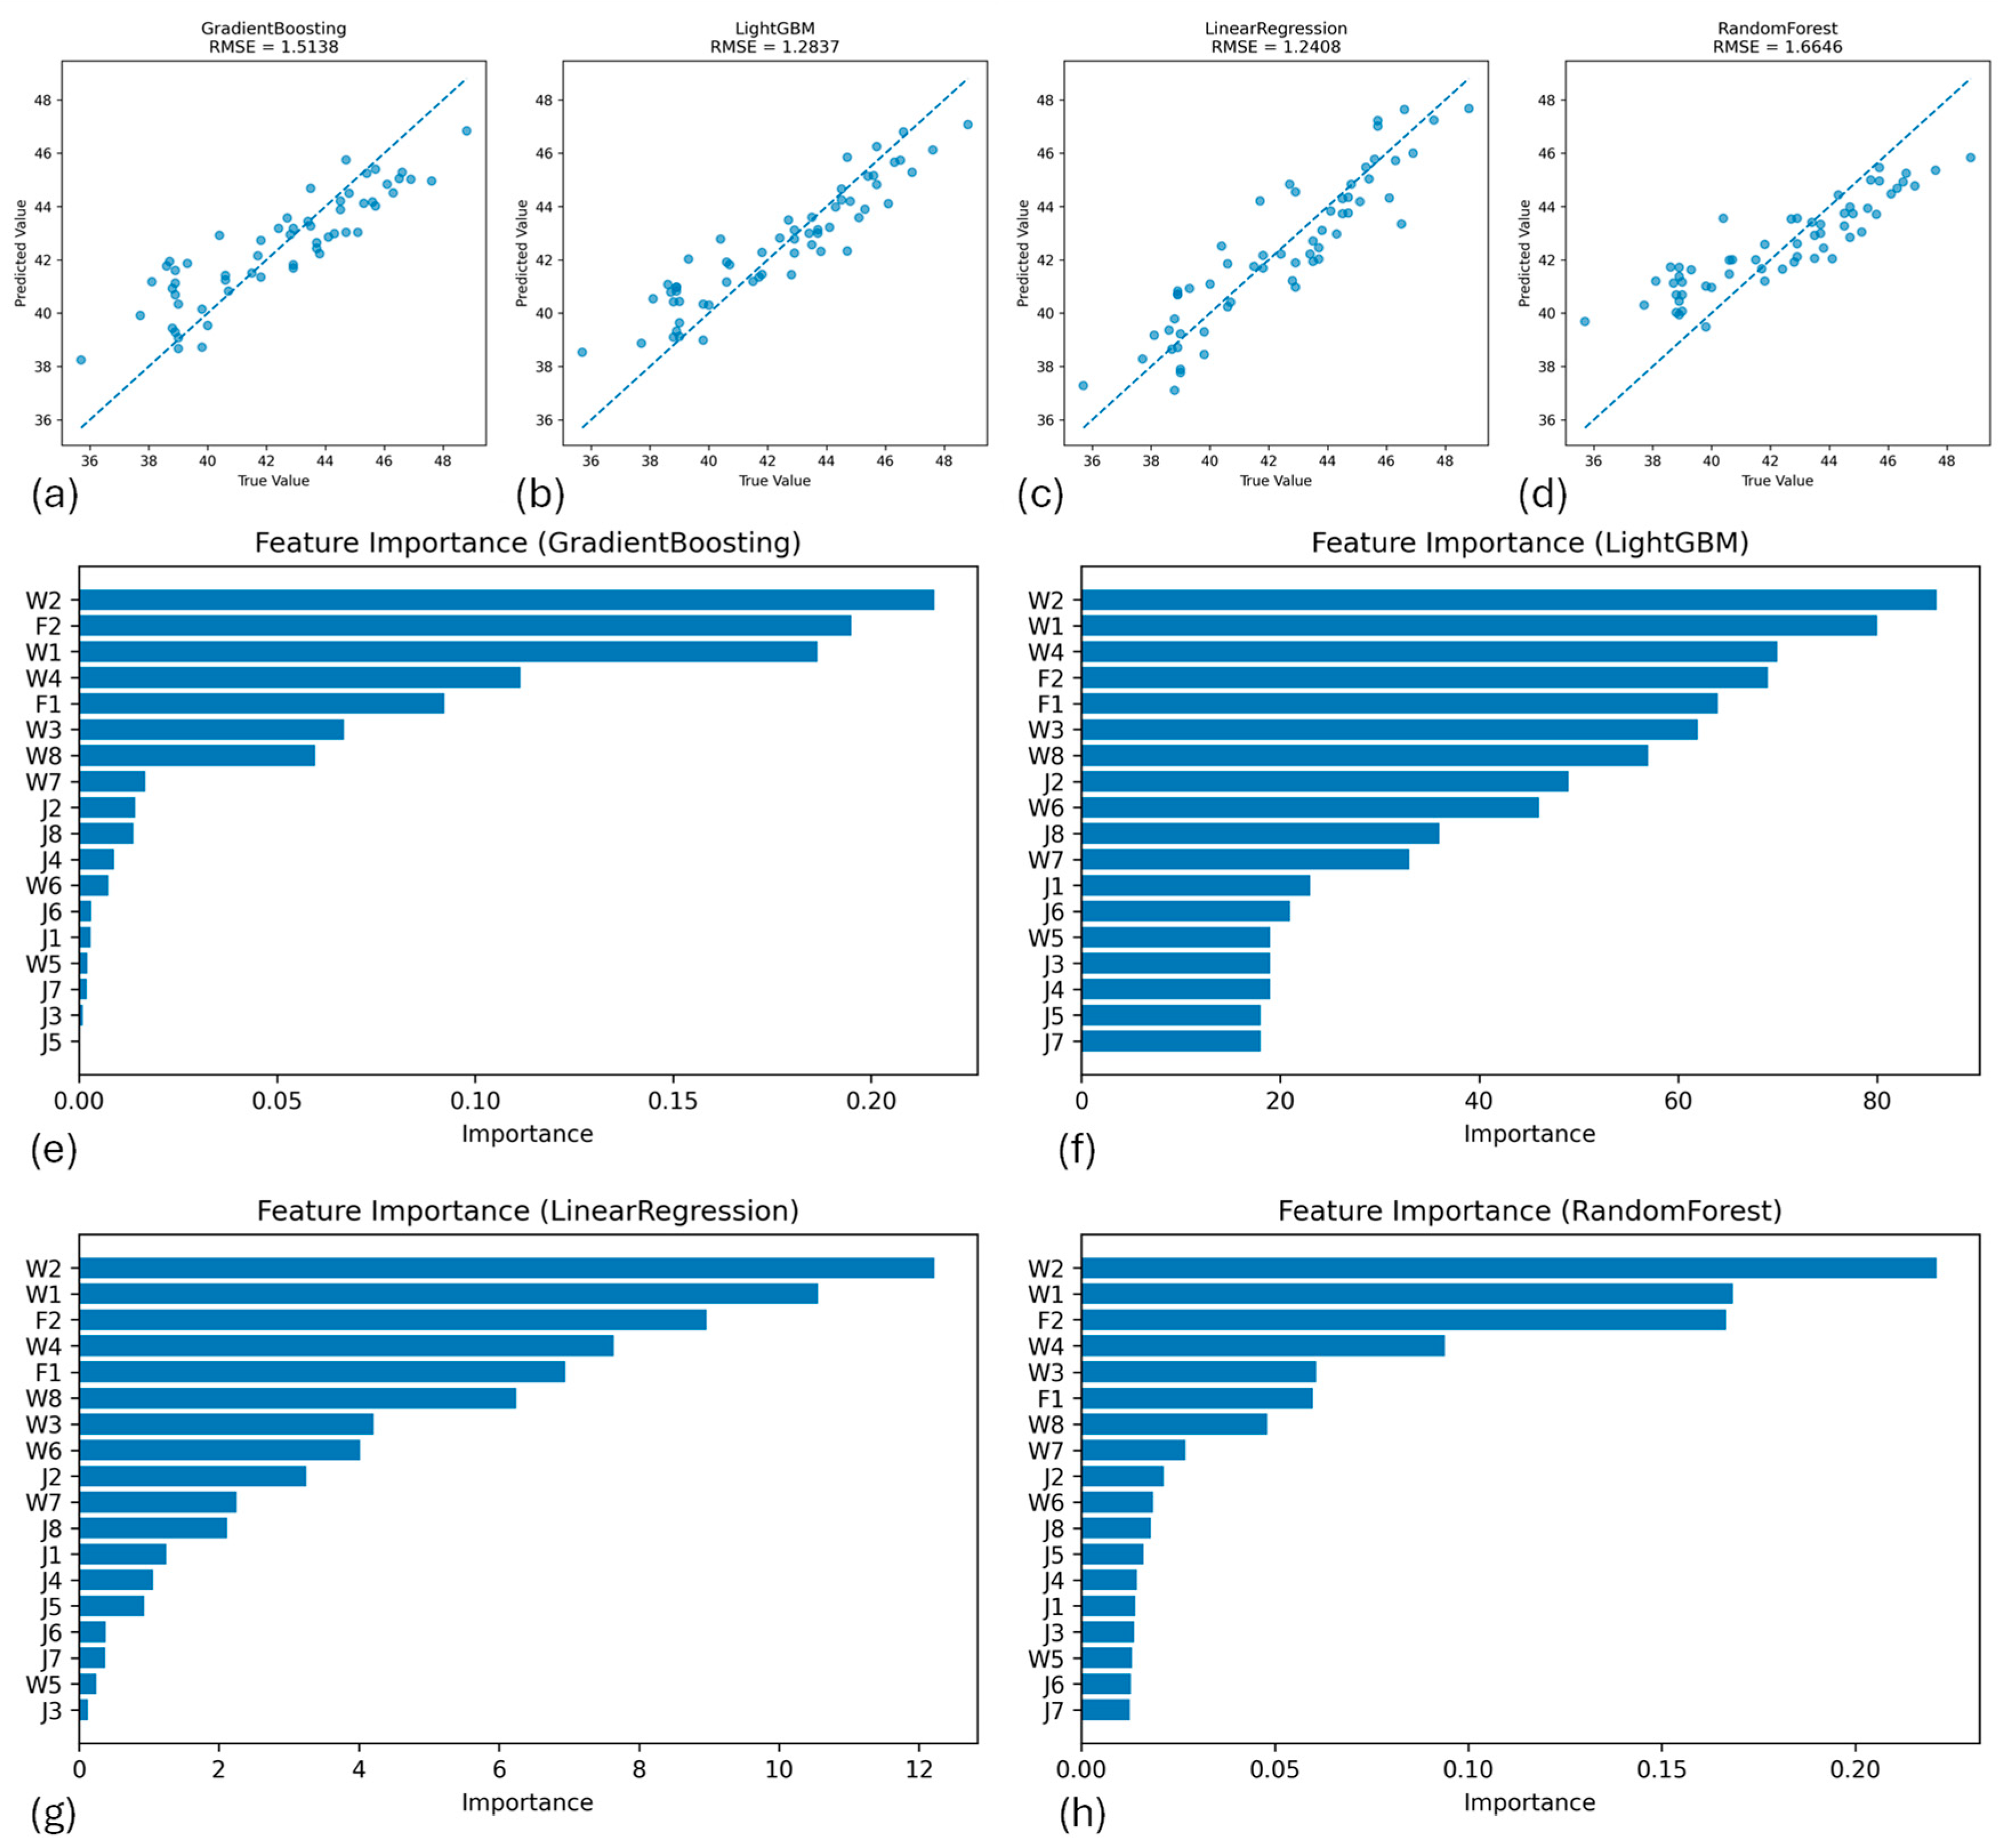
Figure 12.
SHAP values for Maximum Inter-story drift of X direction in 1st story in JMA KOBE 100%; (a) Summary plot, (b) dependency plot of W1 (Plywood walls in area 1); (c) dependency plot of W3 (Plywood walls in area 3).
Figure 12.
SHAP values for Maximum Inter-story drift of X direction in 1st story in JMA KOBE 100%; (a) Summary plot, (b) dependency plot of W1 (Plywood walls in area 1); (c) dependency plot of W3 (Plywood walls in area 3).
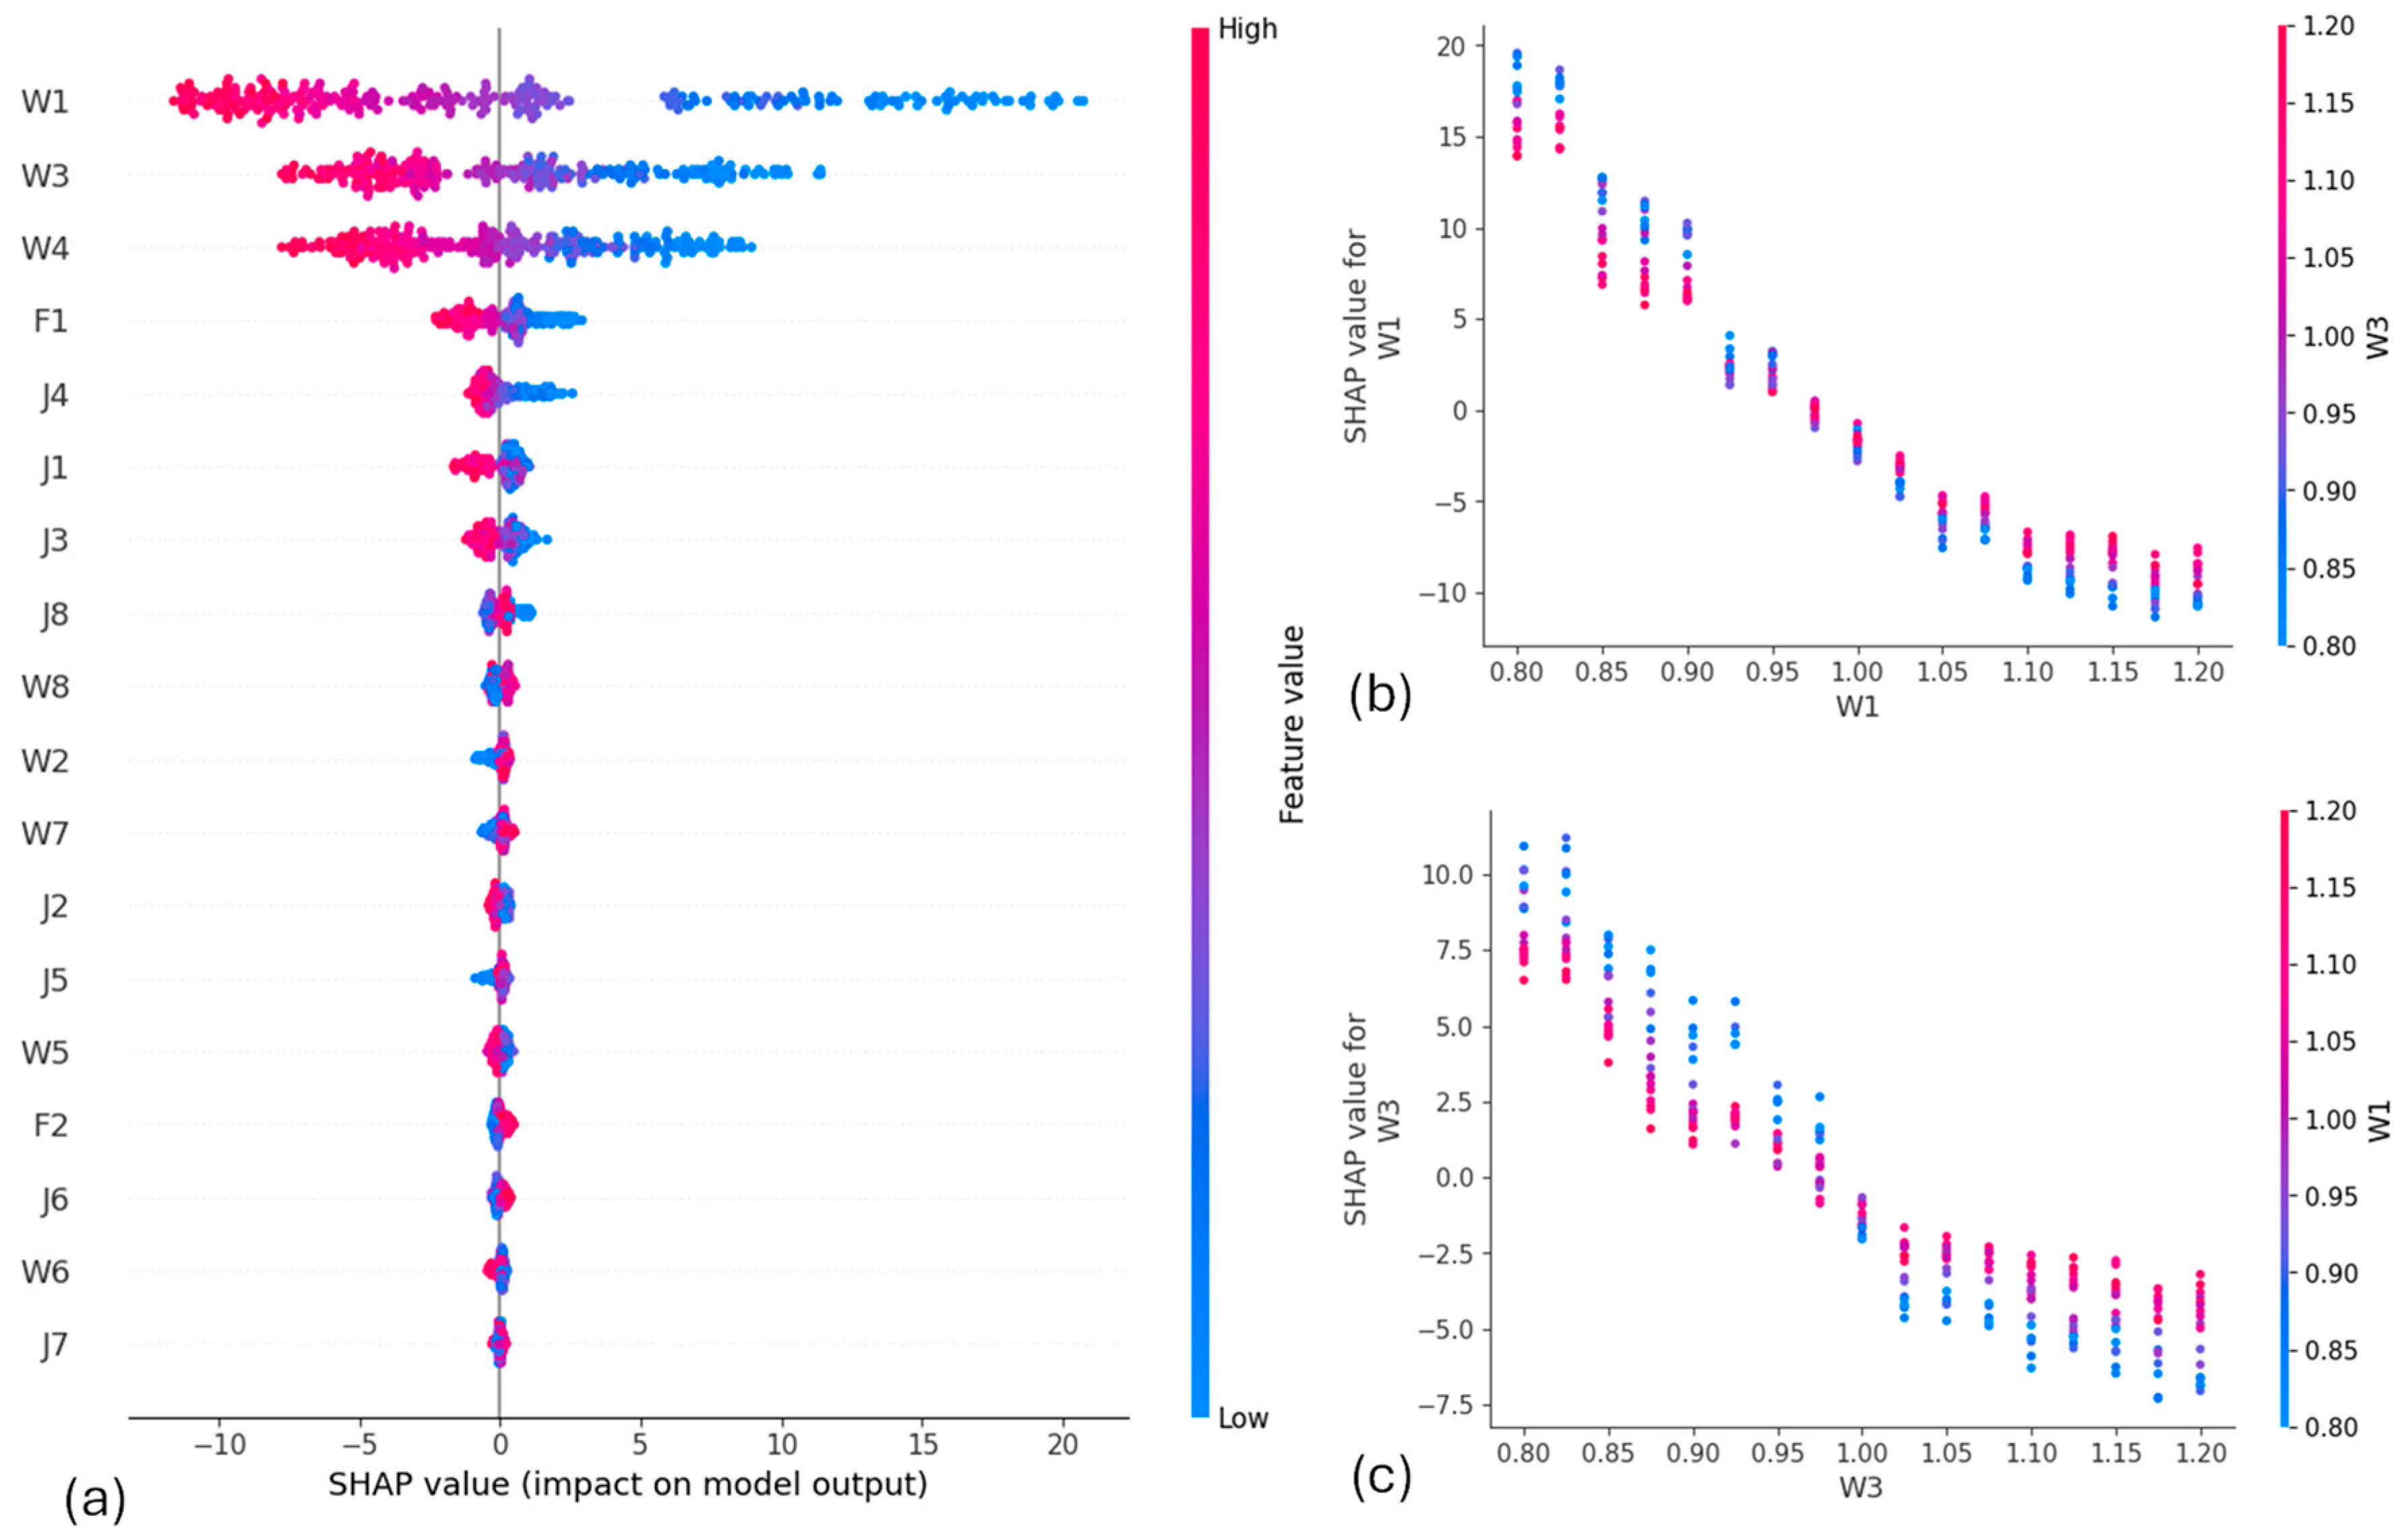

Table 1.
Input variables.
| Name | Outline | |
| 1 | J1 | Joints (HD25kN) in area 1 |
| 2 | J2 | Joints (HD25kN) in area 2 |
| 3 | J3 | Joints (HD25kN) in area 3 |
| 4 | J4 | Joints (HD25kN) in area 4 |
| 5 | J5 | Joints (HD25kN) in area 5 |
| 6 | J6 | Joints (HD25kN) in area 6 |
| 7 | J7 | Joints (HD25kN) in area 7 |
| 8 | J8 | Joints (HD25kN) in area 8 |
| 9 | W1 | Walls (plywood wall) in area 1 |
| 10 | W2 | Walls (plywood wall) in area 2 |
| 11 | W3 | Walls (plywood wall) in area 3 |
| 12 | W4 | Walls (plywood wall) in area 4 |
| 13 | W5 | Walls (plywood wall) in area 5 |
| 14 | W6 | Walls (plywood wall) in area 6 |
| 15 | W7 | Walls (plywood wall) in area 7 |
| 16 | W8 | Walls (plywood wall) in area 8 |
| 17 | F1 | Floors in second story floor |
| 18 | F2 | Floors in roof story |
Disclaimer/Publisher’s Note: The statements, opinions and data contained in all publications are solely those of the individual author(s) and contributor(s) and not of MDPI and/or the editor(s). MDPI and/or the editor(s) disclaim responsibility for any injury to people or property resulting from any ideas, methods, instructions or products referred to in the content. |
© 2026 by the author. Licensee MDPI, Basel, Switzerland. This article is an open access article distributed under the terms and conditions of the Creative Commons Attribution (CC BY) license.
Copyright: This open access article is published under a Creative Commons CC BY 4.0 license, which permit the free download, distribution, and reuse, provided that the author and preprint are cited in any reuse.


