
Submitted:
23 October 2025
Posted:
24 October 2025
You are already at the latest version
Abstract
Urban infrastructure in seismic zones demands efficient and scalable tools for damage prediction. This study introduces an attention-integrated Progressive Transfer Learning (PTL) framework for seismic vulnerability assessment (SVA) of reinforced concrete (RC) frame buildings. Traditional simulation-based vulnerability models are computationally expensive and dataset-specific, limiting their adaptability. To address this, we leverage a pre-trained artificial neural network (ANN) model based on nonlinear static pushover analysis (NSPA) and Monte Carlo simulations for a 4-story RC frame, and extend its applicability to 2-, 8-, and 12-story configurations via PTL. An attention mechanism is incorporated to prioritize critical features, enhancing interpretability and classification accuracy. The model achieves 95.64% accuracy across five damage categories and an R² of 0.98 for regression-based damage index predictions. Comparative evaluation against classical and deep learning models demonstrates superior generalization and computa-tional efficiency. The proposed framework reduces retraining needs, adapts across ty-pologies, and maintains high predictive fidelity, making it a practical AI solution for structural risk evaluation in seismically active regions.
Keywords:
reinforced concrete frame
; seismic vulnerability assessment
; progressive transfer learning
; attention mechanism
; capacity spectrum method
; structural damage prediction
; nonlinear static pushover analysis
1. Introduction
Earthquakes remain one of the most unpredictable natural disasters, with their intensity and impact on structures heavily influenced by factors such as soil type and fault distance. Historically, researchers have endeavored to predict the behavior of structures under seismic loads, beginning with Kendy’s pioneering work in 1980 on the lateral behavior of nuclear power plants [1]. Over the decades, studies have expanded to assess the seismic vulnerability and fragility of individual and grouped building structures, particularly in the wake of catastrophic events like the Bhuj, Tarkey, and Nepal earthquakes. These disasters have underscored the need for accurate prediction models to mitigate the loss of life and infrastructure. In response, funding agencies such as FEMA [2] and ATC [3] have increasingly focused on reducing uncertainties, such as epistemic uncertainty, in structural behavior predictions. Open application programming integration advancements in structural software like CSI, Dlubal, and MIDAS, have enabled more precise modelling of material behavior. However, the true leap forward has come with the integration of artificial intelligence (AI) and machine learning (ML) algorithms. These models, particularly ANNs, are now capable of processing vast datasets, identifying patterns, and adapting to new data through techniques, i.e., transfer learning and fine-tuning.
Traditional ML models often struggle with performance where extensive task-specific datasets are required, or data acquisition is costly or limited. Additionally, the ability of traditional models to generalize across varying structural scales and environmental conditions remains constrained, therefore limiting their practical applicability in real-world [4,5,6]. Leveraging knowledge from pre-trained models on similar tasks on new domain-specific tasks, Transfer Learning (TL) has emerged as a powerful approach to enhance performance, generalization and adaptability [7,8]. The combination of advanced structural software and ML techniques represents a significant step forward in SVA.
TL is increasingly recognized for its ability to adapt pre-trained models in cases where task-specific labeled datasets are scarce [9]. TL exploits the ability of retaining learnt generic feature representations which can be then fine-tuned for a specific target domain. By using pre-trained models to transfer knowledge, TL accelerates the training without requirement of extensive target-domain data. Studies by Abdi et al. (2021)[10] and Dogan et al. (2023)[11], utilizing multi-feature fusion and deep transfer learning respectively, signify efficacy of TL in damage detection in tackling complex structural damage patterns and insufficient domain-specific data. Similarly, Xu et al. (2022)[12] and Jena et al. (2023)[13] demonstrated transfer learning for time-history prediction in structural systems and earthquake risk assessment. Further by leveraging pretrained model’s domain-invariant features, Lin et al. (2022)[14] illustrated how TL frameworks can improve the task of damage detection.
The integration of attention mechanisms with TL frameworks enriches the model’s capability to focus on salient features present in complex data. In structural damage assessment, attention mechanisms allow models to prioritize critical regions. As demonstrated by Jena et al. (2023)[13] and Lin et al. (2022)[14], this approach is propitious while dealing with heterogeneous data sources or identifying subtle damage patterns. Moreover, attention layers effectively capture intricate feature relationships, such as inter-story drift and stress distribution, which are essential for accurate damage predictions in taller structures [4,5]. TL frameworks, when integrated with attention mechanisms, improve model’s interpretability and robustness with high-dimensional and temporally dependent data. In context of structural damage prediction, several gaps persist despite these advancements in the ML techniques. Existing works primarily focus on adapting pre-trained models in a single transfer step, which may lead to challenges such as catastrophic Interference (CI). CI is a phenomenon where the fine-tuned model loses its ability to generalize from source domain knowledge to target domain. Moreover, other traditional methods used for the assessment assume homogeneity between the source and target datasets, which may fail with real-world scenarios where domain shifts are prevalent.
To address these limitations, a promising alternative is offered through PTL, a specialized subset of TL [15,16,17]. PTL provides a novel way where knowledge transfer is done from simpler tasks or structures to more complex ones. To adapt task-specific features, model’s general representation is fine-tuned incrementally. This gradual adaptation ensures effective generalization across diverse target datasets and mitigates the CI. PTL works well in scenarios where data availability is limited or when datasets are highly specialized. This reduces the need for extensive labeled datasets without compromising performance.
The precise and dependable forecasting of structural damage relies on two essential types of uncertainty: epistemic and aleatoric [18,19,20,21]. The uncertainties are shaped by factors including the accuracy of structural models, comprehensive structural specifications, and the accessibility of historical earthquake ground-motion data. The challenges of uncertainty quantification are particularly pronounced in areas such as India, where there is substantial variation across various parameters [22,23,24]. The complexity of this issue is particularly evident in RC structures, where the spatial variability in material properties, such as differences in concrete strength, rebar distribution, and bond conditions, makes it challenging to develop accurate and reliable predictions of structural performance under seismic loads.
This study focuses on implementing PTL to extend the capabilities of an existing ANN model that currently predicts structural damage for 4-story RC frame buildings designed according to Indian seismic standards [23]. The primary objective is to scale up this model to accurately assess seismic vulnerability across a wider range of building heights, specifically 2-story, 8-story, and 12-story RC buildings frame, while maintaining fixed bay width and number of bays across all building configurations. The study employs both classification-based models to categorize damage levels (No-damage, Slight, Moderate, Severe, and Complete) and regression-based models to provide continuous damage index predictions. By leveraging the hierarchical structure of PTL integrated with attention mechanisms, the research aims to establish a methodology where knowledge from the pre-trained 4-story building model is progressively transferred and adapted to buildings of varying heights. This approach addresses the limitations of conventional TL methods by minimizing CI while efficiently utilizing the limited available data for different building configurations. The study particularly emphasizes the application of these enhanced models in the Indian regions, where material heterogeneity and regional seismic disparities present unique challenges for accurate structural damage prediction.
2. Proposed PTL-Based SVA Approach
Figure 1 shows the proposed PTL framework, incorporating an attention mechanism to forecast structural damage levels in buildings of different heights (2-story, 4-story, 8-story, and 12-story) that adhere to Indian Standards. This section offers an in-depth examination of the data preprocessing pipeline, model architecture, design rationale, training methodology, fine-tuning strategy, and hyperparameter optimization.
The PTL framework systematically modifies an ANN model that has been trained on a foundational dataset (such as a 4-story RC frame) to forecast damage levels across various building configurations. This organized modification facilitates effective knowledge exchange while preserving predictive precision. The fundamental elements of the base model consist of:
- An input layer alongside a bottleneck layer designed for effective feature extraction.
- Incorporating dropout layers and attention mechanisms to enhance generalization and focus on task-specific learning.
- A specialized output layer designed for predicting structural damage.
The model is subjected to a methodical enhancement procedure, which includes strategic freezing and unfreezing of layers to create tailored models for various building categories. This approach utilizes a structured hierarchy of grandparents, parents, and child elements, enabling the model to effectively generalize seismic damage evaluations while preserving essential knowledge.
The PTL framework facilitates effective transfer learning through layer-wise selective training, keeping the early layers frozen to preserve essential knowledge while allowing the higher layers to gradually adjust to new tasks. The latent space, located following the bottleneck layer, acts as a common feature representation, enabling smooth knowledge transfer among various building types. The process of adaptation is carried out in a systematic manner:
- Initial Layers (Frozen) to secure essential representations, guaranteeing the preservation of knowledge.
- Latent Space (Partially Unfrozen) are progressively adjusting to heightened complexity through the selective unlocking of layers.
- Output layers designed for specific tasks (Completely Trainable) are customized for predicting structural damage in new types of RC frame.
Attention-based inter-task dependencies improve knowledge sharing across tasks, enhancing model adaptability, effectively maintaining relevant structural interactions while accommodating new features. Modifications tailored to specific tasks take place at the output layer, enabling accurate predictions for novel structural configurations. In the process of transitioning between tasks, the freezing-unfreezing mechanism plays a crucial role in facilitating fine-tuning while preventing CI, a prevalent challenge in TL where the acquisition of new information can interfere with previously established knowledge. The attention mechanism enhances latent space representations, allowing for adjustments based on specific task features while preserving previously acquired knowledge. This organized enhancement guarantees that every new assignment highlights solely the most pertinent characteristics while maintaining essential structural patterns. The present study maintains consistent bay width and number of bays, while altering the story height. To broaden the model’s capabilities to include more architectural features, certain higher latent space layers can be strategically unfrozen, facilitating a dynamic adjustment to increasingly intricate structures. The bottleneck layer modifies its compression ratio to adapt to increased variability in structural configurations.
In the context of extensive feature expansions, the implementation of batch normalization serves to reweight domain-specific features, ensuring stability during the fine-tuning process. This avoids redundant updates and guarantees that only relevant layers are trained according to the task’s complexity. In cases where the model needs additional scalability, one can implement a hierarchical attention-based freezing strategy that focuses on feature-level adaptations while allowing for dynamic adjustments in the upper layers. The PTL framework, in the present study, incorporating attention mechanisms, facilitates effective TL for predicting seismic damage by preserving critical knowledge, avoiding CI, and flexibly adjusting to new structural characteristics.
3. Data Collection and PTL-Based Model
This section outlines the generation of a SVA dataset for 2-, 4-, 8-, and 12-story RC frame buildings using a probabilistic SVA methodology, as proposed by Gondaliya et al. (2022) [24]. In a subsequent study, Gondaliya et al. (2024) [23] developed a ML model trained on the probabilistic outputs of a 4-story RC frame structure designed in accordance with Indian seismic codes. To further enhance the assessment, the capacity Spectrum-based method is employed to derive seismic fragility curves, enabling a robust evaluation of the structural vulnerability of the selected RC building configurations.
3.1. Mathematical Modelling of RC Building Frames
The structural configurations and reinforcement detailing for the selected RC buildings, which include 2-, 4-, 8-, and 12-story special moment-resisting frames, are depicted in Figure 2 and summarized in Table 1. The model is based on M25 grade concrete, Fe500 grade reinforcement bars, and a modulus of elasticity of 200 GPa. A Monte Carlo simulation approach is utilized to address uncertainties in material strength properties, employing established probabilistic techniques to assess variability in mechanical properties. Material property limits were established utilizing a 95% confidence interval in accordance with IS 456 (2000) [25] guidelines, reflecting the intrinsic variability in the characteristics of concrete and steel sample dataset listed in Appendix A. Parameters, including the modulus of elasticity of concrete, were obtained through established empirical relationships, specifically Ec = 5000 ensuring consistency across simulations. The model incorporated the influence of infill wall mass, distributed uniformly across each floor level. To evaluate seismic fragility, a representative frame from each building type was chosen to establish damage state thresholds and produce corresponding fragility curves. The structural dimensions and load combinations adhered to the Indian design standards IS 875: Part-I & Part-II (1987), IS 1893: Part-I (2016), and IS 13920 (2016) [26,27,28,29]. The model incorporated slabs, internal walls, and external masonry walls with thicknesses of 125 mm, 115 mm, and 230 mm, respectively. Superimposed loads of 3 kN/m2 for occupied floors and 0.75 kN/m2 for roof levels were implemented to represent realistic usage scenarios.
3.2. Capacity Spectrum-Based Method (CSM)
The CSM, as outlined in the HAZUS-MH MR5 guidelines, is employed to evaluate structural capacity and derive fragility curves that account for both epistemic and aleatoric uncertainties [30,31]. Widely adopted in performance-based seismic assessment, CSM offers a robust approach to estimate the expected lateral deformation of RC building structures [32,33,34]. Gondaliya et al. (2023) [35] reviewed several SVA methodologies to derive the seismic fragility curves for the RC frame buildings. In the current study, the NSPA is performed using a gravity load combination of dead load (DL) plus 0.25 times the live load (LL), with lateral forces applied incrementally. The potential formation of plastic hinges is evaluated using the empirical relation by Equation (1):
where L is the member length, fy is the yield strength of reinforcement (MPa), and db is the diameter of the longitudinal reinforcement (mm). For this study, plastic hinge locations are estimated to form at half the plastic hinge length from the structural member ends, aligning with expected flexural behavior patterns. The pushover curve is transformed into a capacity spectrum using SAP2000 [36], following ATC-40 guidelines. The intersection points of the demand spectrum and capacity curve, termed the performance point, is determined via the equivalent linearization method (Procedure-A), reflecting the structure’s expected seismic response under a specific ground motion level. The fragility curves express the conditional probability of exceeding a particular damage state DSk at a given spectral displacement (Sd), modeled using a lognormal distribution by Equation (2).
Sd,ds represents the mean spectral displacement at which a building reaches a specified damage state threshold. βk denotes the standard deviation of the natural logarithm of spectral displacement corresponding to the kth damage state, and Φ is the cumulative distribution function (CDF) of the standard normal distribution. Figure 3 shows the derived seismic fragility curves of the 8-story RC frame building with probabilistic SVA methodology. The statistical parameters used to generate these fragility curves, including uncertainty (β values) and corresponding damage state deformation limits, are summarized in Table 2.
Lp = 0.08 L + 0.022 fy × db
The most probable damage state is quantified using Equation (3). The weighted mean damage index, denoted as DSm , serves as a single representative metric to indicate the expected damage condition of the building. This index corresponds to the discrete damage states and damage thresholds are outlined in Table 3. The discrete probability pk[N, d] quantifies the likelihood that a structure subjected to seismic demand d, and characterized by structural parameters N, will experience the kth level of damage, categorized as: No-damage (k = 0), Slight (k = 1), Moderate (k = 2), Severe (k = 3), or Complete (k = 4).
3.3. Transfer Learning-Based ML Model for SVA
The transfer learning framework utilizes an attention mechanism and begins with training on a 4-story dataset. The dataset is divided into 80% for training and 20% for validation, allowing the model to learn robust feature representations. Following this, the pretrained model is fine-tuned using 2-story, 8-story, and 12-story datasets to evaluate its ability to generalize across different structural configurations. To address potential domain shift and ensure proper feature alignment across datasets, MinMax normalization is applied. The entire process is organized into the following main parts:
- Data Processing
- Base Model
- Progressive transfer learning
- Attention mechanism
- Hyperparameter Optimization and Fine-Tuning
3.3.1. Data Preprocessing
Several preprocessing steps are applied on dataset to ensure efficiency and stability of model. Preprocessing involves categorical encoding and feature scaling to ensure consistent and normalized data. For computational suitability, qualitative variables are converted into numerical representations using categorical encoding. For effective optimization and model stability, Standard Scaling is applied to normalize all numeric features to have a mean of 0 and a standard deviation of 1. Scaling parameters are calculated from the training set to prevent data leakage and then applied to the validation sets.
3.3.2. Base Model
Based on ANN, the architecture is designed for structural health prediction across different building configurations. The base model utilizes a fully connected ANN with 128 neurons in the input layer. This design choice stems from the need to efficiently capture high-dimensional input features. The architecture of models starts with an Input layer- configured to accept multi-dimensional input features. A feature vector , with d number of features, is fed to input layer. Dense layers with 128 and 64 neurons are used as hidden layers. Hidden layers have dense layers with ReLU activation function. The ReLU activation function is applied to introduce non-linearity and ensure effective learning of intermediate representations. For a given hidden layer h with weight matrix W and bias b, output of each dense layer is given by Equation (4). ReLU is a piecewise function over intervals of domain that allows the output directly if input is positive else sets output to zero. This function is given by Equation (5), where z is input to neuron.
Dense with 128 neuron layer is designed to extract high-dimensional feature interactions that balance model complexity and generalization. This layer is followed by dropout layer with probability p to prevent overfitting. For any layer h, this dropout operation is given by Equation (6), where ⊙ is Hadamard product and M is Bernoulli (1 – p) as dropout mask.
This layer is followed by dropout to prevent overfitting. A dense layer with 64 neurons combined with a dropout forms a bottleneck layer that condenses task-specific features and retains critical information while reducing redundancy. Finally, the output layer is configured to classify structural damage into four categories: Complete, Severe, Moderate, and Slight. The output layer uses SoftMax activation function for probabilistic output given by Equation (7). P(yi = k | xi) denotes probability of input that belong to class k. Wk and bk is weight of vector and bias corresponding to class k. The term performs summation over all possible classes that normalize probability ensuring total one. K is a set of classes: k ∈ {Complete, Severe, Moderate, Slight}. For the model to perform regression task for severity prediction, linear activation is used by modifying the final dense layer as per Equation (8). Wout and bout are weight and bias of the output layer.
The base model contains approximately 20,000 trainable parameters. This architecture strikes a balance between computational efficiency and model complexity. With these modular components, this model allows seamless integration of progressive transfer learning.
h(l)=ReLU(W(l) h(l−1) + b(l))
ReLU(z) = max(0, z)
Hdrop(l)=M ⊙ h(l)
y = Wout⋅h+bout
3.3.3. Progressive Transfer Learning (PTL)
The PTL approach is adapted to improve performance across multi-story building datasets by progressively transferring learned representations. Progressive Transfer Learning Framework fine-tunes the model incrementally to ensure smooth knowledge transfer from source to target domain. The base model is pretrained on a comprehensive 4-story building damage dataset to capture generic feature representations as per Equation (9). L is a loss function (Sparse Categorical Cross-Entropy). This loss function L(y, y’) is defined as per Equation (10). y is a true label, y’ is predicted probability for class i, and C is total number of classes. For the case in regression task, this loss function is replaced with Mean Squared Error (MSE) given by Equation (11), where N is number of observations in dataset. The initial layers which capture fundamental features remain frozen by Equation (12). Deeper layers are fine tuned for the new task by Equation (13). This unfreezing of layers is done progressively using an annealing function (AF) controlling layer l given by Equation (14). Lo is the initially frozen layer count. σ is sigmoid function for smooth transitions. τ is temperature parameter that controls the unfreezing rate. Annealing function starts with high temperature (explore solution space) and gradually reduces it to refine solution. Temperature determines how probabilities are distributed and controls randomness or exploration. Higher Temperature produces more uniform probabilities.
Starting with the deeper layers, fine tuning is done gradually, unfreezing earlier layers. Layer Freezing ensures the core knowledge to be preserved while allowing incremental adaptation. This hierarchy in learning gradually refines the feature extraction avoiding drastic changes to the model’s underlying knowledge. During this stage, the attention mechanism is refined to optimize the importance assigned to key features of the new dataset. The dense layer of 64 neurons with dropout acts as a new classification head to adapt the model to the new damage classification task.
θtrainable= arg minθ L(f(x;θtrainable,θfrozen),y)
3.3.4. Attention Mechanism
Following hidden layers, an attention mechanism is integrated to dynamically weigh the importance of input features. The task of this layer is to enhance the interpretability and robustness of the model. For the given extracted feature hextracted attention score Aattention is calculated as per Equations (15) and (16).
Ei = vT tanh(Wa hextracted + ba)
Aattention determines the importance of features. Wa and ba are learnable parameters. Output features from the frozen layer are used as input to the attention mechanism. The attention mechanism operates on these extracted features and assigns higher weights to critical input. This higher weight ensures relevant structural attributes to receive more focus. This in turn, refines the features dynamically, reduces redundant information and improves feature extraction quality, improving adaptability to more complex datasets. Refined feature representation hatt is given by Equation (17). The output of the attention layer is then fed into the newly added classification head. The last dense layer with 64 neurons and ReLU is adapted as new classification head.
3.3.5. Hyperparameter Optimization and Fine-Tuning
To optimize performance, the learning rate is selected as 0.001 with a decay factor of 0.1 every 10 epochs as defined in Equation (18). To balance efficiency and prevent overfitting, a batch size of 32 and a dropout rate of 0.2 are used. The multi-head attention mechanism consists of 8 heads to capture diverse feature relationships. Experiments are conducted with Adam, RMSprop, and SGD optimizers to determine the best optimization strategy. RMSprop (Root Mean Square Propagation) adjusts learning rates based on recent gradients to stabilize training. Stochastic Gradient Descent (SGD) updates weights using individual samples to reduce computational cost requiring careful tuning of learning rate. To ensure adaptive learning, Adam optimizer is used, given by Equation (19). θt denotes current model parameters at time t, θt+1 denotes model parameters at next time stamp, η is learning rate and is a small constant added to the denominator to prevent division by zero. Adaptive Moment Estimation (Adam optimizer) maintains a separate learning rate for each parameter. This optimizer uses estimates of the first and second moments of the gradients and computes individual adaptive learning rates for various existing parameters. mt and vt are first and second moment estimates. Biased First Moment Estimate (mt) is an exponentially weighted moving average of the gradients defined by Equation (20). gt is the gradient of the loss function at time step t. β1 controls how much past gradients influence the current step. Biased Second Moment Estimate (vt) is the exponentially weighted moving average of squared gradients with β2 that controls how much past squared gradients influence the update by Equation (21). Fine tuning used a smaller learning rate of 0.0001. Attention-enhanced classification head has a rate of 0.3. Base model is trained on 50 epochs and the PTL fine-tuning process is conducted for 20 epochs. For multi-class classification, Sparse Categorical Cross-Entropy loss is used.
The proposed architecture uses discussed ANN as base model. For the complex task of predicting data for multi-story buildings, sequential learning via fine tuning is enabled to implement progressive transfer learning combined with attention mechanisms. The approach begins with a base ANN model that contains an input layer of 128 neurons to process high dimensional interaction among input data. This enables them to capture complex relationships between features and capability to learn intricate patterns. For feature compression and refined task specific features, a bottleneck layer with 64 neurons has been included. The integration of the bottleneck layer with dropout avoids overfitting and regularizes the network, therefore enabling generalized and efficient learning. Attention is incorporated by prioritizing critical features (e.g., material, load distribution) to enhance performance on task-specific features. To emphasize load distribution of taller buildings in higher layers, attention weights shift based on story complexity. Initially this model is trained on 4-story data, saving its learned embeddings and weights.
ηt=η0⋅0.1⌊t/10⌋ (η0 = 0.001)
mt = β1 mt−1 + (1−β1) gt
vt = β2 vt−1 + (1−β2) gt2
The total loss incorporates loss terms for both the base model and the progressively transferred knowledge model and attention. For base model loss Lbase, Sparse Categorical Cross-Entropy loss is used for multiclass classification, and it is replaced by MSE in severity score. Progressive transfer loss is given as Equation (22). α controls the knowledge retention. Attention regularization is given by Equation (23). This ensures the stability of attention weights. A’attention is the mean attention weight across samples. Finally, the total loss function is given by Equation (24), λ1, λ2, and λ3 are balancing hyperparameters.
Latt = ||Aattention - A′attention||
The gradient-based adaptation is provided via attention dynamically learns to weigh structural features. This step ensures that highly relevant features receive stronger updates while redundant information receive less. The gradient-based update for attention is given as Equation (25)
The implementation of the PTL framework with attention mechanisms was carried out using a suite of Python-based libraries. Data preprocessing and transformation were performed using Pandas for data handling, NumPy for numerical computations, and Scikit-learn for scaling (StandardScaler), label encoding (LabelEncoder), and dataset partitioning. Neural network models were developed using TensorFlow and Keras, leveraging both Sequential and Functional APIs to construct flexible architectures. Core components such as Dense layers, Dropout (for regularization), BatchNormalization (for training stability), and MultiHeadAttention (for feature prioritization) were integrated into the model. KerasTuner was employed for automated hyperparameter optimization, while Lambda layers ensured compatibility between custom input-output transformations and attention mechanisms. For performance evaluation, Scikit-learn’s metrics—Mean Squared Error (MSE), R2 score, classification report, and confusion matrix—were used to assess regression and classification outcomes. Finally, Principal Component Analysis (PCA) was applied to visualize class-wise separability in reduced dimensions, and Matplotlib and Seaborn supported the generation of performance plots and visual analytics. The algorithmic breakdown of the purposed present approach can be formulated as follows:
| Algorithm 1: Structural Damage Prediction using Progressive Transfer Learning and Attention Mechanism |
Input:
|
4. Results and Discussion
The proposed PTL framework, combined with attention mechanisms, was evaluated for its effectiveness in predicting the seismic damage of RC frame buildings with varying heights (2-, 4-, 8-, and 12-story). The model was initially trained on a 4-story dataset using a SVA approach, incorporating Monte-Carlo simulation, NSPA, and the CSM, the model was subsequently fine-tuned for other building configurations through transfer learning.
Figure 4a presents the training, validation, and fine-tuning loss trends. The training loss (blue) rapidly decreases and stabilizes, while the validation loss (orange) remains consistently lower, indicating that the model generalizes well without overfitting. The flat and low fine-tuning loss curve (green) reflects successful adaptation to new structural configurations, suggesting minimal additional learning was required. The regression phase of the model, aimed at predicting the damaged index, demonstrated high precision. As shown in Table 4, the PTL model achieved a MSE of 0.0002 and an R2 value of 0.98, indicating highly accurate predictions with near-complete variance capture. This is visually confirmed by Figure 4b, where predicted and actual values show near-perfect correlation, validating the model’s robustness.
Subsequently, the continuous damage index was discretized into five ordinal categories—No-damage, Slight, Moderate, Severe, and Complete—via label encoding, transforming the regression output into a classification problem. Table 5 summarizes the precision, recall, and F1-scores, while Figure 5 illustrates the confusion matrix reflecting the classification performance across various damage categories. Our new PTL-based model demonstrates strong performance in correctly identifying “Complete” damage cases, with 20,620 instances accurately classified. Similarly, the “No-damage” category shows high accuracy with 4,523 correct classifications. The model also performs reasonably well for “Slight” damage (2,419 correct classifications), “Moderate” damage (1,674 correct classifications), and “Severe” damage (1,670 correct classifications). However, several misclassification patterns are evident. Notably, 76 instances of “Complete” damage were incorrectly classified as “No-damage,” which could have significant implications in disaster response scenarios where complete structural failures might be overlooked. The model also misclassified 114 “Moderate” damage cases as “Severe” and 104 as “Slight,” indicating difficulties in distinguishing between adjacent damage severity levels. For “Severe” damage, the model incorrectly classified 155 instances as “Complete” and 95 as “Moderate,” suggesting a tendency to either overestimate or underestimate damage in borderline cases. Similarly, 209 “Slight” damage cases were misclassified as “No-damage,” and 91 as “Moderate,” revealing challenges in detecting minimal structural damage. Precision was highest for the “Complete” category (0.993), vital for post-earthquake interventions where accurate identification of total collapse is critical. However, the “Moderate” (0.900) and “Severe” (0.899) categories exhibited lower precision, reflecting occasional mislabeling. Recall followed a similar trend: “Complete” and “No-damage” achieved 0.996 and 0.989, respectively, while “Severe” had the lowest recall at 0.871, indicating some under-detection of significant damage. F1-scores ranged from 0.885 (“Severe”) to 0.994 (“Complete”), providing a balanced view of classification reliability. The macro-averaged precision, recall, and F1-score were all 0.945, indicating excellent overall performance. The implications of misclassifications between certain categories (e.g., “Severe” classified as “Moderate”) warrant careful consideration in the context of practical applications, where such errors might influence resource allocation and response planning in post-disaster scenarios.
Figure 6 demonstrates the correlation between actual and predicted damage classes, indicating minor discrepancies, especially within the “Slight” and “Moderate” categories. While Figure 7 presents a PCA-based 2D projection that explains the classification behavior of the proposed model. Reducing the high-dimensional feature space to two principal components effectively visualizes class separability. In the plot, blue dots represent correctly classified samples, whereas red “X” marks indicate misclassifications. The “Complete” damage category constitutes a distinct and closely clustered region, thereby affirming high model accuracy and feature separability. The “Slight” damage class exhibits a greater density of misclassifications, presumably resulting from overlapping features with adjacent classes. Instances of “moderate” damage are notably more dispersed, particularly around the central low-variance area, underscoring the difficulty in identifying subtle inter-class distinctions. The “Severe” category demonstrates a lower rate of misclassifications and maintains clearer boundaries, suggesting improved feature representation. Simultaneously, the “No-damage” class exhibits significant overlap with low-damage states, indicating challenges in distinguishing it from early-stage damage patterns. PCA visualization indicates that the model successfully captures dominant decision boundaries.
To evaluate the relative effectiveness of the proposed model, a comparative analysis was conducted against a range of traditional and deep learning-based approaches, as summarized in Table 6. Classical ML algorithms—Random Forest (RF), Gradient Boosted Trees (GBT), and Support Vector Machine (SVM)—achieved classification accuracies of 70.82%, 75.18%, and 65.02%, respectively, indicating moderate performance in seismic damage classification. In contrast, deep learning models demonstrated substantial improvement, with a standard Convolutional Neural Network (CNN) achieving 85.11% accuracy. The application of basic TL to CNN further improved accuracy to 90.25%. The proposed PTL model, augmented with attention mechanisms, achieved the highest classification accuracy of 95.64%, underscoring its superior capacity to extract and generalize complex patterns from structural data.
Further, the influence of optimization algorithms on model performance was evaluated, as presented in Table 7. Among the tested optimizers—Adam, RMSprop, and SGD—Adam yielded the best performance across both classification and regression tasks. Specifically, it achieved the lowest MSE of 0.0002, the highest R2 score of 0.99, and the peak classification accuracy of 95.64%. RMSprop followed closely, delivering a classification accuracy of 93.12%, MSE of 0.0003, and a higher classification loss of 0.1725. In contrast, SGD demonstrated the least effective performance with a classification accuracy of 88.65%, a higher MSE of 0.0004, and a loss of 0.2201, indicating slower convergence and reduced learning efficiency.
The present study improves the precision of structural damage prediction and provides a scalable, adaptable method for evaluating various types of RC building frames. The findings validate that the proposed PTL framework, combined with attention mechanisms, provides a data-efficient and reliable method for predicting seismic damage, in accordance with Indian seismic design standards.
5. Conclusions
This study introduces a comprehensive and scalable methodology for assessing the seismic vulnerability of RC frame buildings, employing a PTL approach integrated with attention mechanisms. The study employed probabilistic techniques, including Monte Carlo simulation, the CSM, and NSPA, and various structural responses to various seismic hazard demands accounting for epistemic and aleatoric uncertainties. An initial ANN model developed for 4-story RC frames systematically refined to include 2-, 8-, and 12-story configurations, resulting in enhanced prediction accuracy and reduced computational demands. The incorporation of attention mechanisms enhanced both model interpretability and performance across diverse structural typologies. Based on the detailed analysis and observed model performance, the following are the key findings of the proposed PTL-based seismic damage prediction framework:
- The proposed PTL framework effectively generalizes learned features from the source model (4-story RC frame) to target domains (2-, 8-, and 12-story RC frames) without requiring extensive retraining.
- The classification model achieved 95.64% accuracy with strong F1-scores across all damage states, while the regression model reached an R2 of 0.98 with minimal MSE = 0.0002.
- Attention mechanisms improved the model’s focus on critical input features (e.g., stiffness, material strength, ductility), boosting performance and reducing misclassification.
- The model was able to distinguish between damage classes (No-damage to Complete) effectively, though minor confusion was observed in borderline cases explicitly moderate vs. severe damage state.
- Comparative evaluation confirmed the superiority of the PTL-based model over traditional ML techniques (e.g., RF, SVM) and basic TL approaches.
This study establishes a solid basis for broadening SVA to include a greater variety of structural configurations, surpassing the currently examined Indian code-compliant RC building frames characterized by fixed bay widths and uniform story heights. The proposed PTL framework features a modular and adaptable design, augmented by attention mechanisms, rendering it suitable for future applications that involve irregular plan geometries, vertical discontinuities, and alternative materials like masonry or steel. The framework can be enhanced by integrating real-world data from sensor-based monitoring, post-earthquake investigation, or region-specific ground motion records to improve predictive accuracy and field applicability. This approach shows potential for incorporating soil–structure interaction effects and adjusting to diverse seismic code requirements in various geographic areas. These directions present considerable potential for enhancing the model’s generalizability and impact, facilitating the development of a comprehensive, scalable solution for seismic risk assessment in complex urban environments.
Supplementary Materials
The following supporting information can be downloaded at the website of this paper posted on Preprints.org.
Author Contributions
Conceptualization, Kaushik M. Gondaliya and Konstantinos D. Tsavdaridis; Methodology, Kaushik M. Gondaliya; Software, Aanal Raval and Kaushik M. Gondaliya; Validation, Jignesh A. Amin and Komal Borisagar; Formal Analysis, Kaushik M. Gondaliya and Aanal Raval; Investigation, Kaushik M. Gondaliya; Resources, Jignesh A. Amin and Komal Borisagar; Data Curation, Aanal Raval; Writing—Original Draft Preparation, Kaushik M. Gondaliya; Writing—Review & Editing, Konstantinos D. Tsavdaridis, Jignesh A. Amin, and Komal Borisagar; Visualization, Aanal Raval; Supervision, Konstantinos D. Tsavdaridis and Jignesh A. Amin; Project Administration, Kaushik M. Gondaliya; Funding Acquisition, Kaushik M. Gondaliya. All authors have read and agreed to the published version of the manuscript.
Funding
This research received no external funding.
Data Availability Statement
The data, simulation codes and trained models that support the findings of this study are available from the corresponding authors upon reasonable request.
Acknowledgments
The authors acknowledge the Ministry of Education, Government of India, for its continued initiatives supporting academic research and institutional capacity development under which this work was conceptualized. The authors also thank the Gujarat Technological University – School of Engineering and Technology and the City, University of London, for providing research resources and collaborative facilities.
Generative AI Statement: During the preparation of this work, the authors used ChatGPT to improve language clarity and readability. After using this tool, the authors reviewed and edited the content as necessary and take full responsibility for the final text.
Conflicts of Interest
The authors declare no conflicts of interest.
Abbreviations
The following abbreviations are used in this manuscript:
| ANN | Artificial Neural Network |
| ADRS | Acceleration–Displacement Response Spectra |
| ATC | Applied Technology Council |
| CSM | Capacity Spectrum Method |
| CI | Catastrophic Interference |
| CM | Confusion Matrix |
| DL | Dead Load |
| DSm | Weighted Mean Damage Index |
| FEM | Finite Element Method |
| GBT | Gradient Boosting Trees |
| HAZUS | Hazards U.S. Multi-Hazard Methodology |
| LL | Live Load |
| MAE | Mean Absolute Error |
| ML | Machine Learning |
| MSA | Multiple Stripe Analysis |
| MSE | Mean Squared Error |
| NSPA | Nonlinear Static Pushover Analysis |
| OAPI | Open Application Programming Interface |
| PCA | Principal Component Analysis |
| PTL | Progressive Transfer Learning |
| ReLU | Rectified Linear Unit |
| RF | Random Forest |
| SCS | Structural Control Systems |
| SVA | Seismic Vulnerability Assessment |
| SVM | Support Vector Machine |
| TL | Transfer Learning |
Appendix A
Appendix A.1
Data collection is a crucial step in the implementation of a purposeful knowledge transfer approach to assess seismic vulnerability. In Table A1, a few sample datasets are presented, which will be utilized to train the progressive transfer learning (PTL) model.

Table A1.
Forty data points are shown randomly from Eight hundred ninety-three thousand, one hundred six data points.
Table A1.
Forty data points are shown randomly from Eight hundred ninety-three thousand, one hundred six data points.
|
Sr. No. |
Story | Material |
Structural type |
fy | fck | Ductility | Stiffness | Sd |
Damage state |
| 1 | 8 | RC | SMRF | 24.53 | 452.44 | 5.13 | 6029.91 | 59 | Moderate |
| 2 | 8 | RC | SMRF | 25.77 | 494.00 | 5.10 | 6033.48 | 59 | Moderate |
| 3 | 8 | RC | SMRF | 25.04 | 510.94 | 5.23 | 5992.86 | 59 | Moderate |
| 4 | 8 | RC | SMRF | 24.21 | 512.24 | 5.06 | 6005.80 | 59 | Moderate |
| 5 | 8 | RC | SMRF | 24.75 | 487.05 | 5.22 | 5934.82 | 59 | Moderate |
| 6 | 8 | RC | SMRF | 25.39 | 515.68 | 5.32 | 6070.54 | 59 | Moderate |
| 7 | 8 | RC | SMRF | 24.56 | 513.04 | 5.02 | 6147.77 | 59 | Moderate |
| 8 | 8 | RC | SMRF | 24.96 | 479.66 | 5.06 | 5959.38 | 59 | Moderate |
| 9 | 8 | RC | SMRF | 24.94 | 509.66 | 5.05 | 6091.52 | 59 | Moderate |
| 10 | 8 | RC | SMRF | 22.73 | 511.29 | 5.23 | 5895.54 | 59 | Moderate |
| 11 | 8 | RC | SMRF | 26.05 | 507.04 | 5.15 | 6232.59 | 59 | Moderate |
| 12 | 8 | RC | SMRF | 25.41 | 494.78 | 5.20 | 5994.64 | 59 | Moderate |
| 13 | 8 | RC | SMRF | 23.92 | 463.92 | 5.08 | 6022.77 | 59 | Moderate |
| 14 | 8 | RC | SMRF | 23.94 | 491.37 | 5.26 | 5991.52 | 59 | Moderate |
| 15 | 2 | RC | SMRF | 24.51 | 477.44 | 5.33 | 5979.02 | 75 | Severe |
| 16 | 2 | RC | SMRF | 24.31 | 469.85 | 5.33 | 5913.39 | 75 | Severe |
| 17 | 2 | RC | SMRF | 25.02 | 523.37 | 5.09 | 5937.50 | 75 | Severe |
| 18 | 2 | RC | SMRF | 25.16 | 496.55 | 5.27 | 5985.71 | 75 | Severe |
| 19 | 12 | RC | SMRF | 25.11 | 507.52 | 5.00 | 6161.61 | 128 | Complete |
| 20 | 12 | RC | SMRF | 24.38 | 517.14 | 4.99 | 5942.41 | 128 | Complete |
| 21 | 12 | RC | SMRF | 25.33 | 524.54 | 5.03 | 5920.09 | 128 | Complete |
| 22 | 8 | RC | SMRF | 24.67 | 504.15 | 5.07 | 6073.66 | 28 | Slight |
| 23 | 8 | RC | SMRF | 24.92 | 477.09 | 5.14 | 6014.29 | 28 | Slight |
| 24 | 8 | RC | SMRF | 24.68 | 516.32 | 5.07 | 6225.00 | 28 | Slight |
| 25 | 8 | RC | SMRF | 24.10 | 490.70 | 5.14 | 6020.09 | 28 | Slight |
| 26 | 8 | RC | SMRF | 25.81 | 491.24 | 5.07 | 6105.80 | 28 | Slight |
| 27 | 8 | RC | SMRF | 25.38 | 487.27 | 5.25 | 6084.82 | 28 | Slight |
| 28 | 8 | RC | SMRF | 25.58 | 500.08 | 5.01 | 6297.77 | 28 | Slight |
| 29 | 8 | RC | SMRF | 25.25 | 491.25 | 5.04 | 6205.80 | 28 | Slight |
| 30 | 8 | RC | SMRF | 25.26 | 489.74 | 5.13 | 6175.89 | 28 | Slight |
| 31 | 8 | RC | SMRF | 25.89 | 549.48 | 4.93 | 6222.77 | 28 | Slight |
| 32 | 8 | RC | SMRF | 24.14 | 477.44 | 5.33 | 5979.02 | 28 | Slight |
| 33 | 8 | RC | SMRF | 24.31 | 469.85 | 5.33 | 5913.39 | 28 | Slight |
| 34 | 8 | RC | SMRF | 25.02 | 523.37 | 5.09 | 5937.50 | 28 | Slight |
| 35 | 2 | RC | SMRF | 24.90 | 489.12 | 4.98 | 6037.05 | 8 | No-damage |
| 36 | 2 | RC | SMRF | 25.21 | 490.92 | 5.13 | 6159.82 | 8 | No-damage |
| 37 | 2 | RC | SMRF | 24.48 | 520.70 | 5.10 | 6233.93 | 8 | No-damage |
| 38 | 2 | RC | SMRF | 25.08 | 505.25 | 5.77 | 5949.55 | 8 | No-damage |
| 39 | 2 | RC | SMRF | 25.76 | 511.70 | 5.25 | 5832.14 | 8 | No-damage |
| 40 | 2 | RC | SMRF | 24.99 | 496.73 | 5.00 | 6026.34 | 8 | No-damage |
References
- Kennedy, R.P.; Cornell, C.A.; Campbell, R.D.; Kaplan, S.; Perla, H.F. Probabilistic Seismic Safety Study of an Existing Nuclear Power Plant. Nuclear Engineering and Design 1980, 59, 315–338. [Google Scholar] [CrossRef]
- Federal Emergency Management Agency (FEMA) and National Institute of Building Sciences (NIBS) HAZUS-MH MR5: Advanced Engineering Building Module — Technical and User’s Manual; Federal Emergency Management Agency: Washington, DC, 2003.
- Applied Technology Council (ATC). Seismic Evaluation and Retrofit of Concrete Buildings (Vols. 1 & 2); Applied Technology Council: Redwood City, CA, 1996. [Google Scholar]
- Gao, Y.; Mosalam, K.M. Deep Transfer Learning for Image-Based Structural Damage Recognition. Computer aided Civil Eng 2018, 33, 748–768. [Google Scholar] [CrossRef]
- Ogunjinmi, P.D.; Park, S.-S.; Kim, B.; Lee, D.-E. Rapid Post-Earthquake Structural Damage Assessment Using Convolutional Neural Networks and Transfer Learning. Sensors 2022, 22, 3471. [Google Scholar] [CrossRef] [PubMed]
- Avci, O.; Abdeljaber, O.; Kiranyaz, S.; Hussein, M.; Gabbouj, M.; Inman, D.J. A Review of Vibration-Based Damage Detection in Civil Structures: From Traditional Methods to Machine Learning and Deep Learning Applications. Mechanical Systems and Signal Processing 2021, 147, 107077. [Google Scholar] [CrossRef]
- Liuzzi, M.; Aravena Pelizari, P.; Geiß, C.; Masi, A.; Tramutoli, V.; Taubenböck, H. A Transferable Remote Sensing Approach to Classify Building Structural Types for Seismic Risk Analyses: The Case of Val d’Agri Area (Italy). Bull Earthquake Eng 2019, 17, 4825–4853. [Google Scholar] [CrossRef]
- Vaswani, A.; Shazeer, N.; Parmar, N.; Uszkoreit, J.; Jones, L.; Gomez, A.N.; Kaiser, L.; Polosukhin, I. Attention Is All You Need 2023.
- Vinet, L.; Zhedanov, A. A ‘Missing’ Family of Classical Orthogonal Polynomials. J. Phys. A: Math. Theor. 2011, 44, 085201. [Google Scholar] [CrossRef]
- Abdi, G.; Jabari, S. A Multi-Feature Fusion Using Deep Transfer Learning for Earthquake Building Damage Detection. Canadian Journal of Remote Sensing 2021, 47, 337–352. [Google Scholar] [CrossRef]
- Dogan, G.; Hakan Arslan, M.; Ilki, A. Detection of Damages Caused by Earthquake and Reinforcement Corrosion in RC Buildings with Deep Transfer Learning. Engineering Structures 2023, 279, 115629. [Google Scholar] [CrossRef]
- Xu, Y.; Lu, X.; Fei, Y.; Huang, Y. Iterative Self-Transfer Learning: A General Methodology for Response Time-History Prediction Based on Small Dataset. Journal of Computational Design and Engineering 2022, 9, 2089–2102. [Google Scholar] [CrossRef]
- Jena, R.; Shanableh, A.; Al-Ruzouq, R.; Pradhan, B.; Gibril, M.B.A.; Ghorbanzadeh, O.; Atzberger, C.; Khalil, M.A.; Mittal, H.; Ghamisi, P. An Integration of Deep Learning and Transfer Learning for Earthquake-Risk Assessment in the Eurasian Region. Remote Sensing 2023, 15, 3759. [Google Scholar] [CrossRef]
- Lin, Q.; Ci, T.; Wang, L.; Mondal, S.K.; Yin, H.; Wang, Y. Transfer Learning for Improving Seismic Building Damage Assessment. Remote Sensing 2022, 14, 201. [Google Scholar] [CrossRef]
- Yu, Z.; Shen, D.; Jin, Z.; Huang, J.; Cai, D.; Hua, X.-S. Progressive Transfer Learning 2019.
- Iman, M.; Miller, J.A.; Rasheed, K.; Branch, R.M.; Arabnia, H.R. EXPANSE: A Deep Continual / Progressive Learning System for Deep Transfer Learning. 2022. [CrossRef]
- Chen, Y.; Sun, Z.; Zhang, R.; Yao, L.; Wu, G. Attention Mechanism Based Neural Networks for Structural Post-Earthquake Damage State Prediction and Rapid Fragility Analysis. Computers & Structures 2023, 281, 107038. [Google Scholar] [CrossRef]
- Bulleit, W.M. Uncertainty in Structural Engineering. Pract. Period. Struct. Des. Constr. 2008, 13, 24–30. [Google Scholar] [CrossRef]
- Dolšek, M. Simplified Method for Seismic Risk Assessment of Buildings with Consideration of Aleatory and Epistemic Uncertainty. Structure and Infrastructure Engineering 2011, 1–15. [Google Scholar] [CrossRef]
- Nafeh, A.M.B.; O’Reilly, G.J. FRAGILITY FUNCTION UNCERTAINTY QUANTIFICATION IN INFILLED RC FRAME BUILDINGS.; Athens, Greece, 2023; pp. 2168–2181.
- Franchin, P.; Pinto, P.E.; Rajeev, P. Confidence Factor? Journal of Earthquake Engineering 2010, 14, 989–1007. [Google Scholar] [CrossRef]
- Crowley, H.; Bommer, J.J.; Pinho, R.; Bird, J. The Impact of Epistemic Uncertainty on an Earthquake Loss Model. Earthq Engng Struct Dyn 2005, 34, 1653–1685. [Google Scholar] [CrossRef]
- Gondaliya, K.M.; Vasanwala, S.A.; Desai, A.K.; Amin, J.A.; Bhaiya, V. Machine Learning-Based Approach for Assessing the Seismic Vulnerability of Reinforced Concrete Frame Buildings. Journal of Building Engineering 2024, 97, 110785. [Google Scholar] [CrossRef]
- Gondaliya, K.; Bhaiya, V.; Vasanwala, S.; Desai, A. Probabilistic Seismic Vulnerability of Indian Code-Compliant RC Frame. Pract. Period. Struct. Des. Constr. 2022, 27, 04022028. [Google Scholar] [CrossRef]
- Standards (BIS), B. of I. IS 456: Plain and Reinforced Concrete – Code of Practice; Bureau of Indian Standards: New Delhi, India, 2000. [Google Scholar]
- Bureau of Indian Standards (BIS) IS 875 (Part 1): Design Loads (Other than Earthquake) for Buildings and Structures – Dead Loads; Bureau of Indian Standards: New Delhi, India, 1987.
- Standards (BIS), B. of I. IS 875 (Part 2): Design Loads (Other Than Earthquake) for Buildings and Structures – Imposed Loads; Bureau of Indian Standards: New Delhi, India, 1987. [Google Scholar]
- Standards (BIS), B. of I. IS 1893 (Part 1): Criteria for Earthquake Resistant Design of Structures – General Provisions and Buildings; Bureau of Indian Standards: New Delhi, India, 2016. [Google Scholar]
- Standards (BIS), B. of I. IS 13920: Ductile Detailing of Reinforced Concrete Structures Subjected to Seismic Forces – Code of Practice; Bureau of Indian Standards: New Delhi, India, 2016. [Google Scholar]
- Barbat, A.H.; Pujades, L.G.; Lantada, N. Performance of Buildings under Earthquakes in Barcelona, Spain. Computer-aided Civil Eng 2006, 21, 573–593. [Google Scholar] [CrossRef]
- Barbat, A.H.; Carreño, M.L.; Pujades, L.G.; Lantada, N.; Cardona, O.D.; Marulanda, M.C. Seismic Vulnerability and Risk Evaluation Methods for Urban Areas. A Review with Application to a Pilot Area. Structure and Infrastructure Engineering 2010, 6, 17–38. [Google Scholar] [CrossRef]
- Choudhury, T.; Kaushik, H.B. Seismic Fragility of Open Ground Storey RC Frames with Wall Openings for Vulnerability Assessment. Engineering Structures 2018, 155, 345–357. [Google Scholar] [CrossRef]
- Vargas Alzate, Y.F.; Pujades Beneit, L.G.; Barbat, A.H.; Hurtado Gomez, J.E.; Diaz Alvarado, S.A.; Hidalgo Leiva, D.A. Probabilistic Seismic Damage Assessment of Reinforced Concrete Buildings Considering Directionality Effects. Structure and Infrastructure Engineering 2018, 14, 817–829. [Google Scholar] [CrossRef]
- Pujades, L.G.; Barbat, A.H.; González-Drigo, R.; Avila, J.; Lagomarsino, S. Seismic Performance of a Block of Buildings Representative of the Typical Construction in the Eixample District in Barcelona (Spain). Bull Earthquake Eng 2012, 10, 331–349. [Google Scholar] [CrossRef]
- Gondaliya, K.; Amin, J.; Bhaiya, V.; Vasanwala, S.; Desai, A. Generating Seismic Fragility Curves of RC Frame Building Using NSPA and IDA. Asian J Civ Eng 2023, 24, 523–538. [Google Scholar] [CrossRef]
- SAP2000: Structural Analysis Program – Advanced Static and Dynamic Finite Element Analysis of Structures 2011.
Figure 1.
Architecture of the proposed Progressive Transfer Learning (PTL) framework with attention mechanism for seismic damage prediction of RC frames.
Figure 1.
Architecture of the proposed Progressive Transfer Learning (PTL) framework with attention mechanism for seismic damage prediction of RC frames.
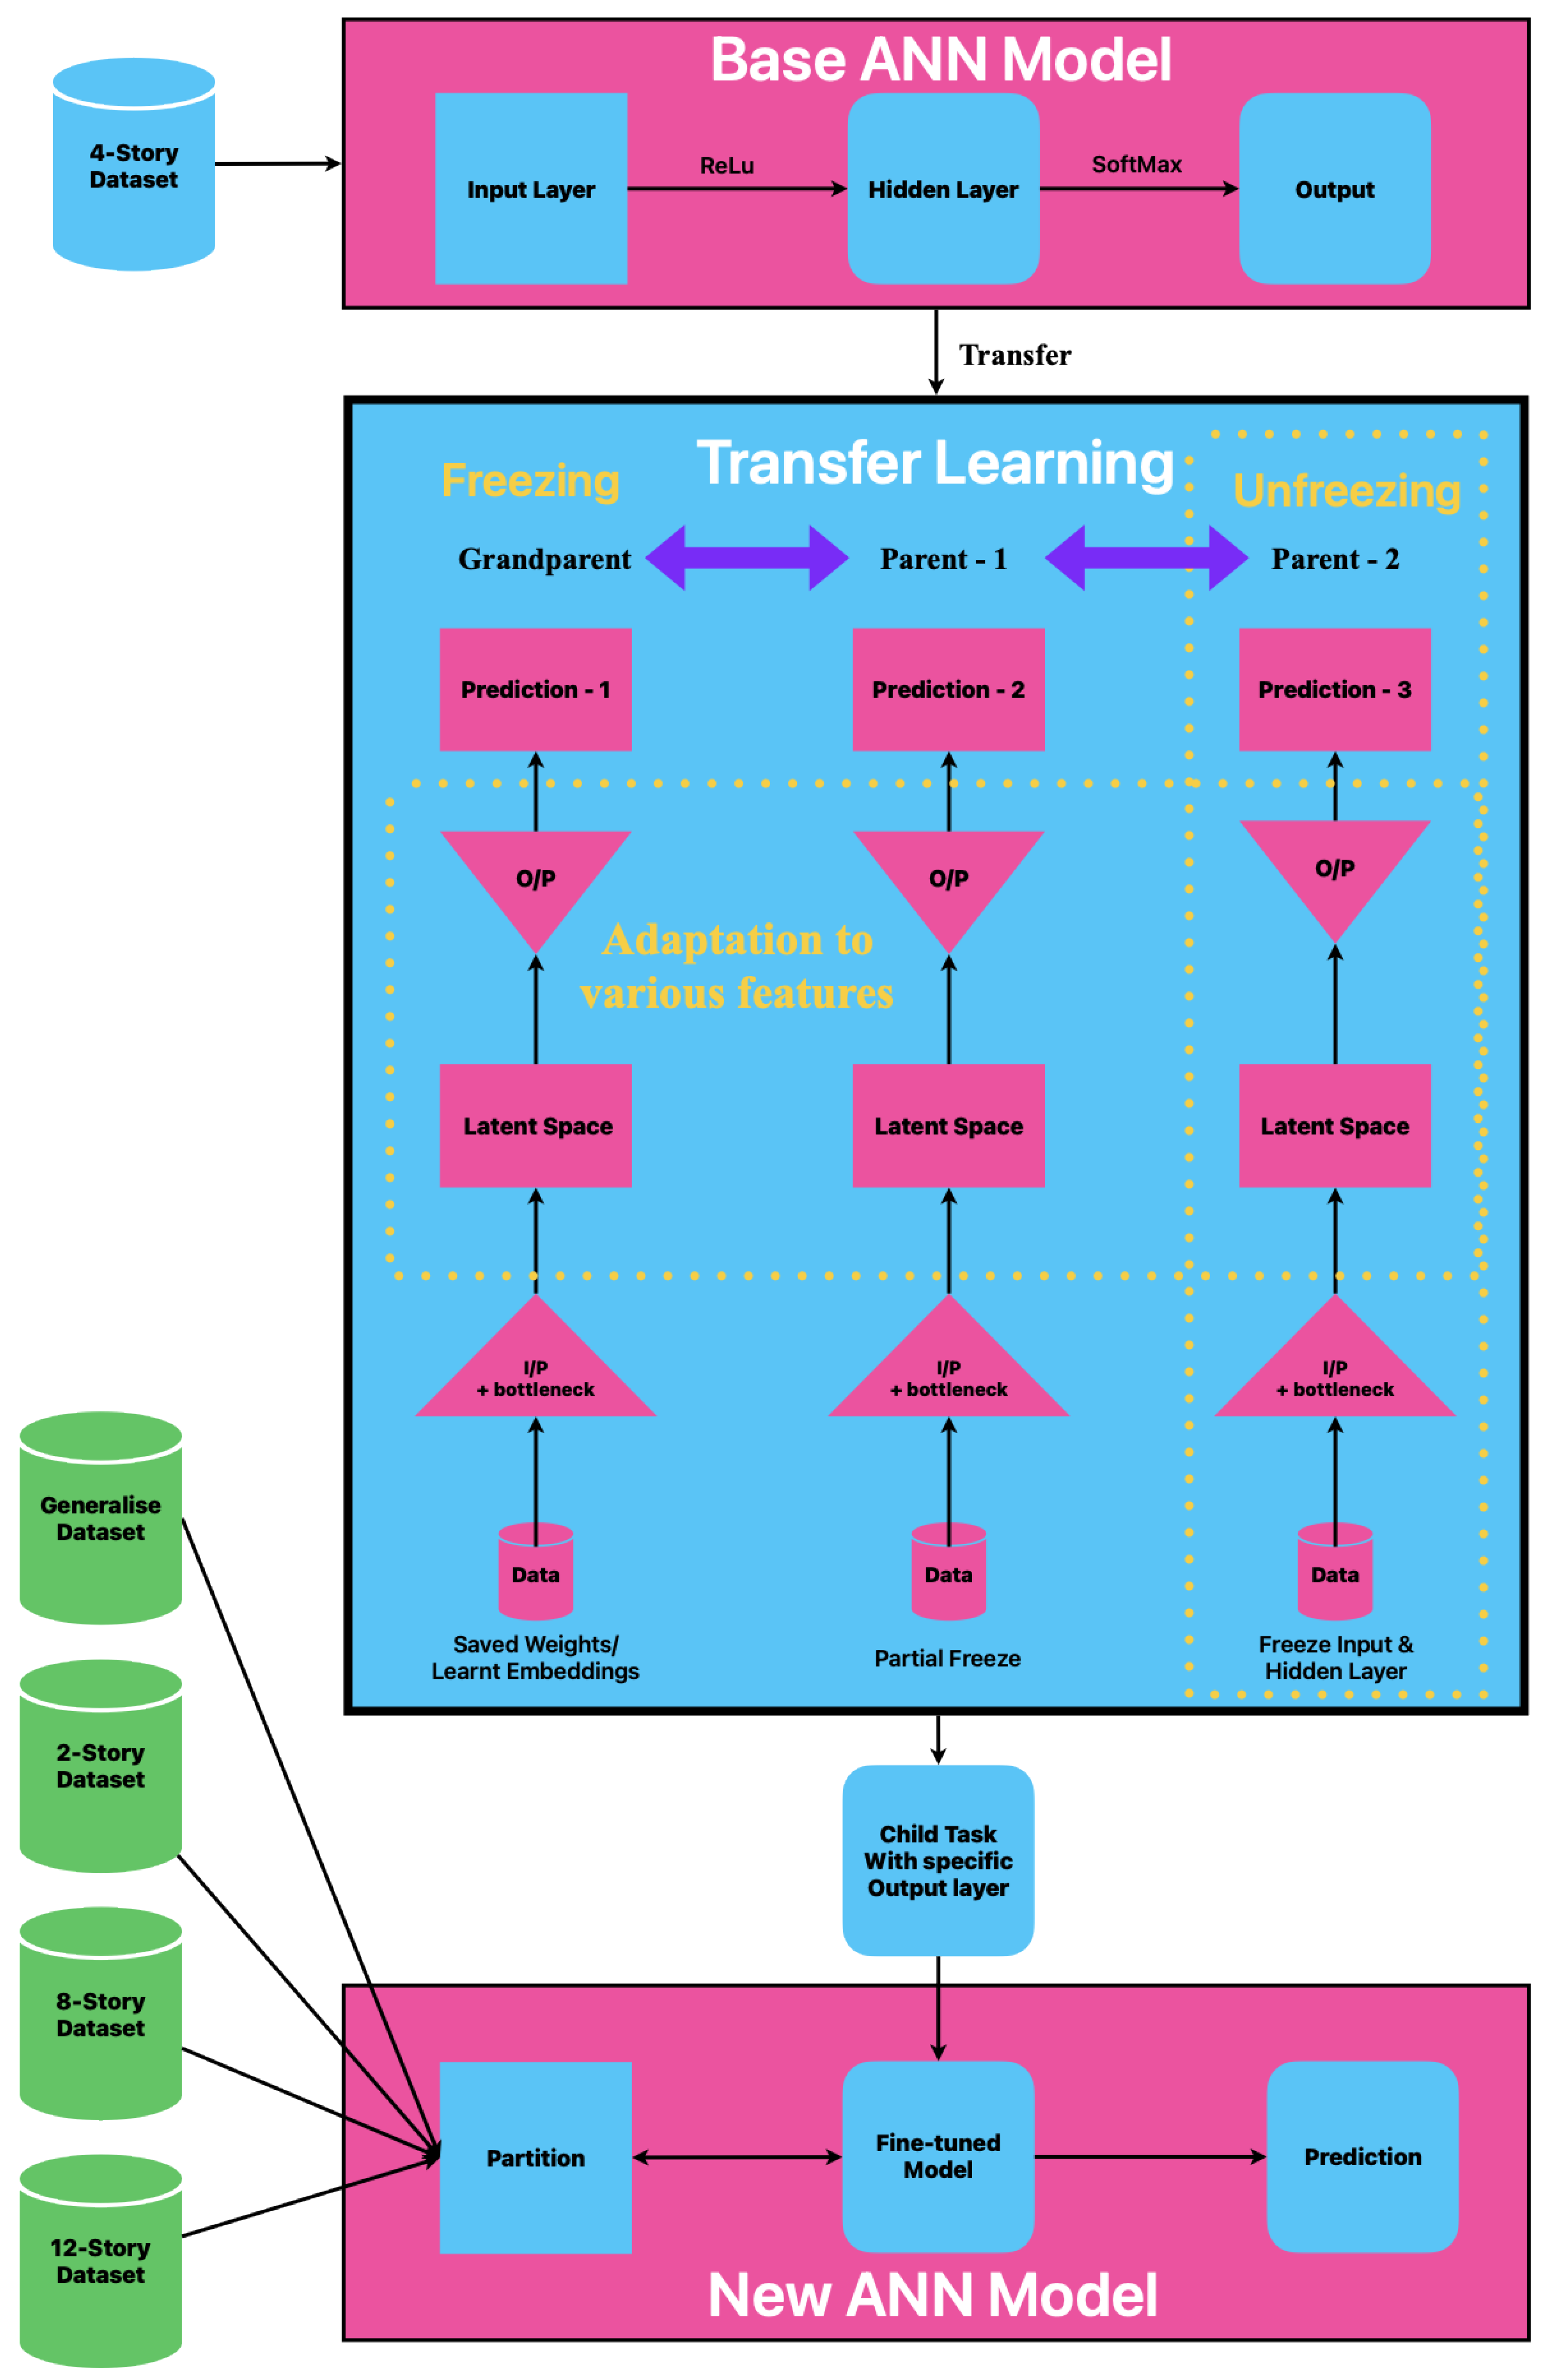
Figure 2.
Plan and elevation of the selected RC frame buildings.
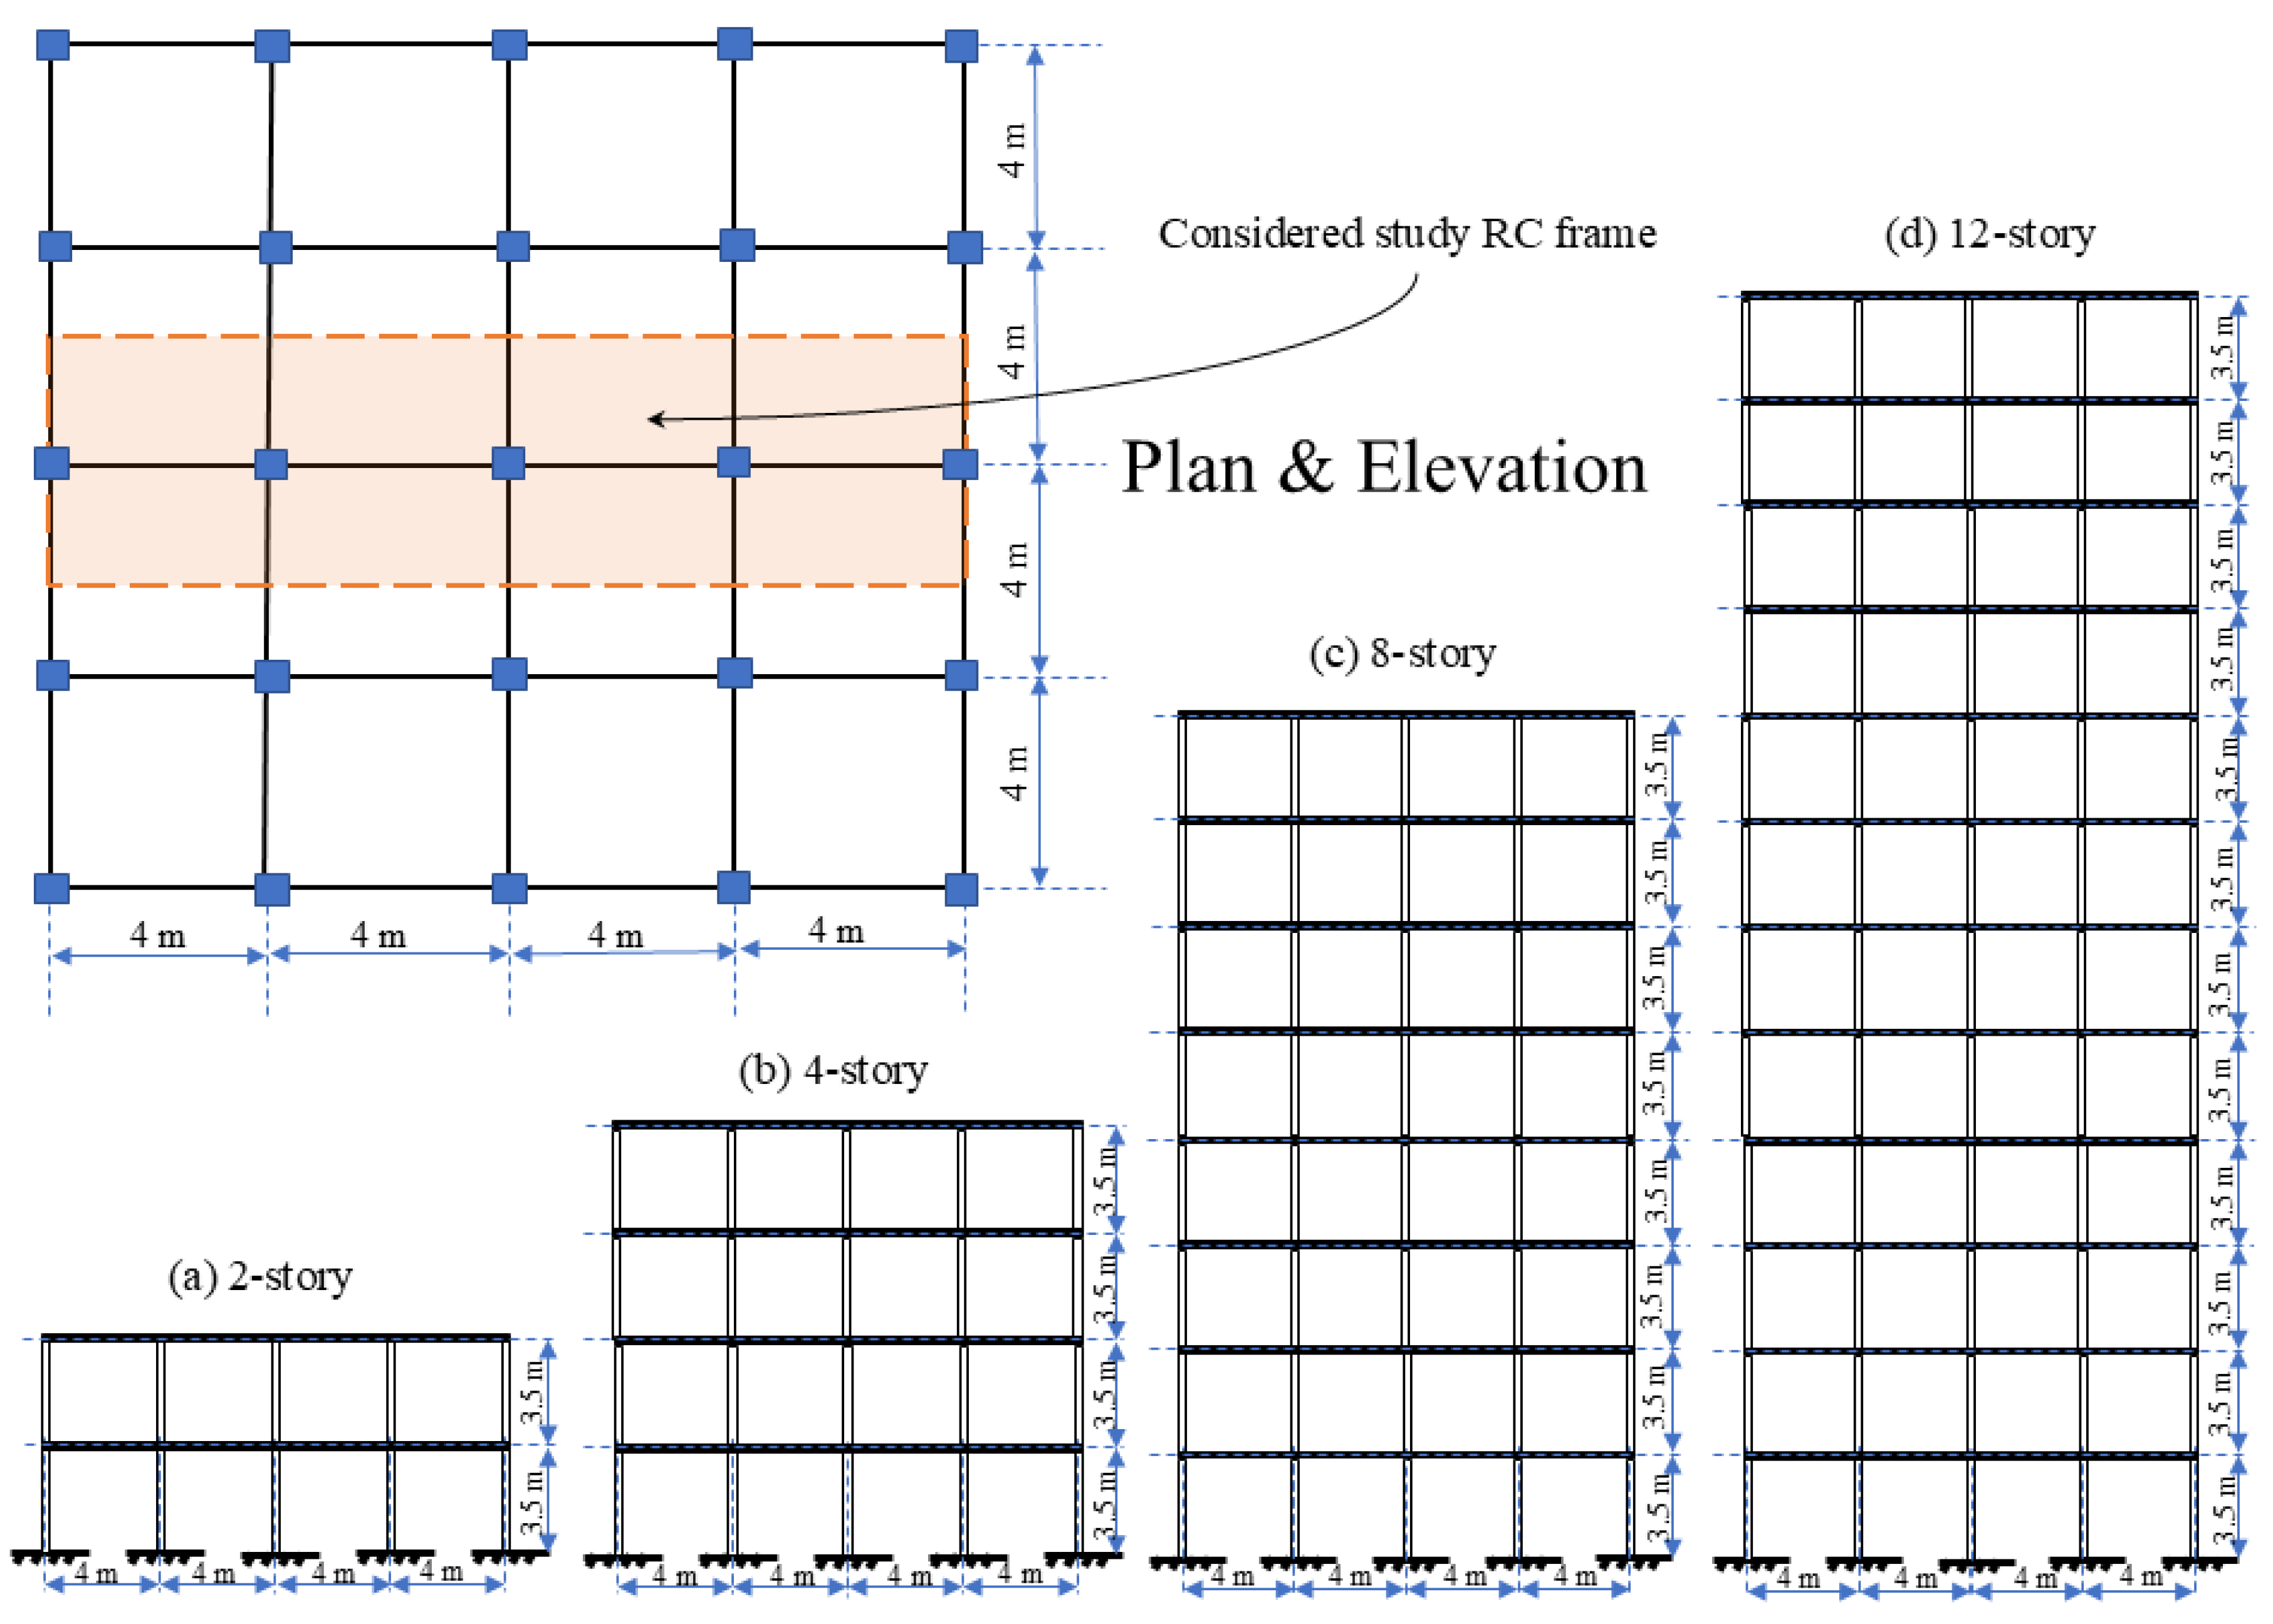
Figure 3.
Seismic fragility curves are derived from various damage states for the 8-story RC frame building.
Figure 3.
Seismic fragility curves are derived from various damage states for the 8-story RC frame building.
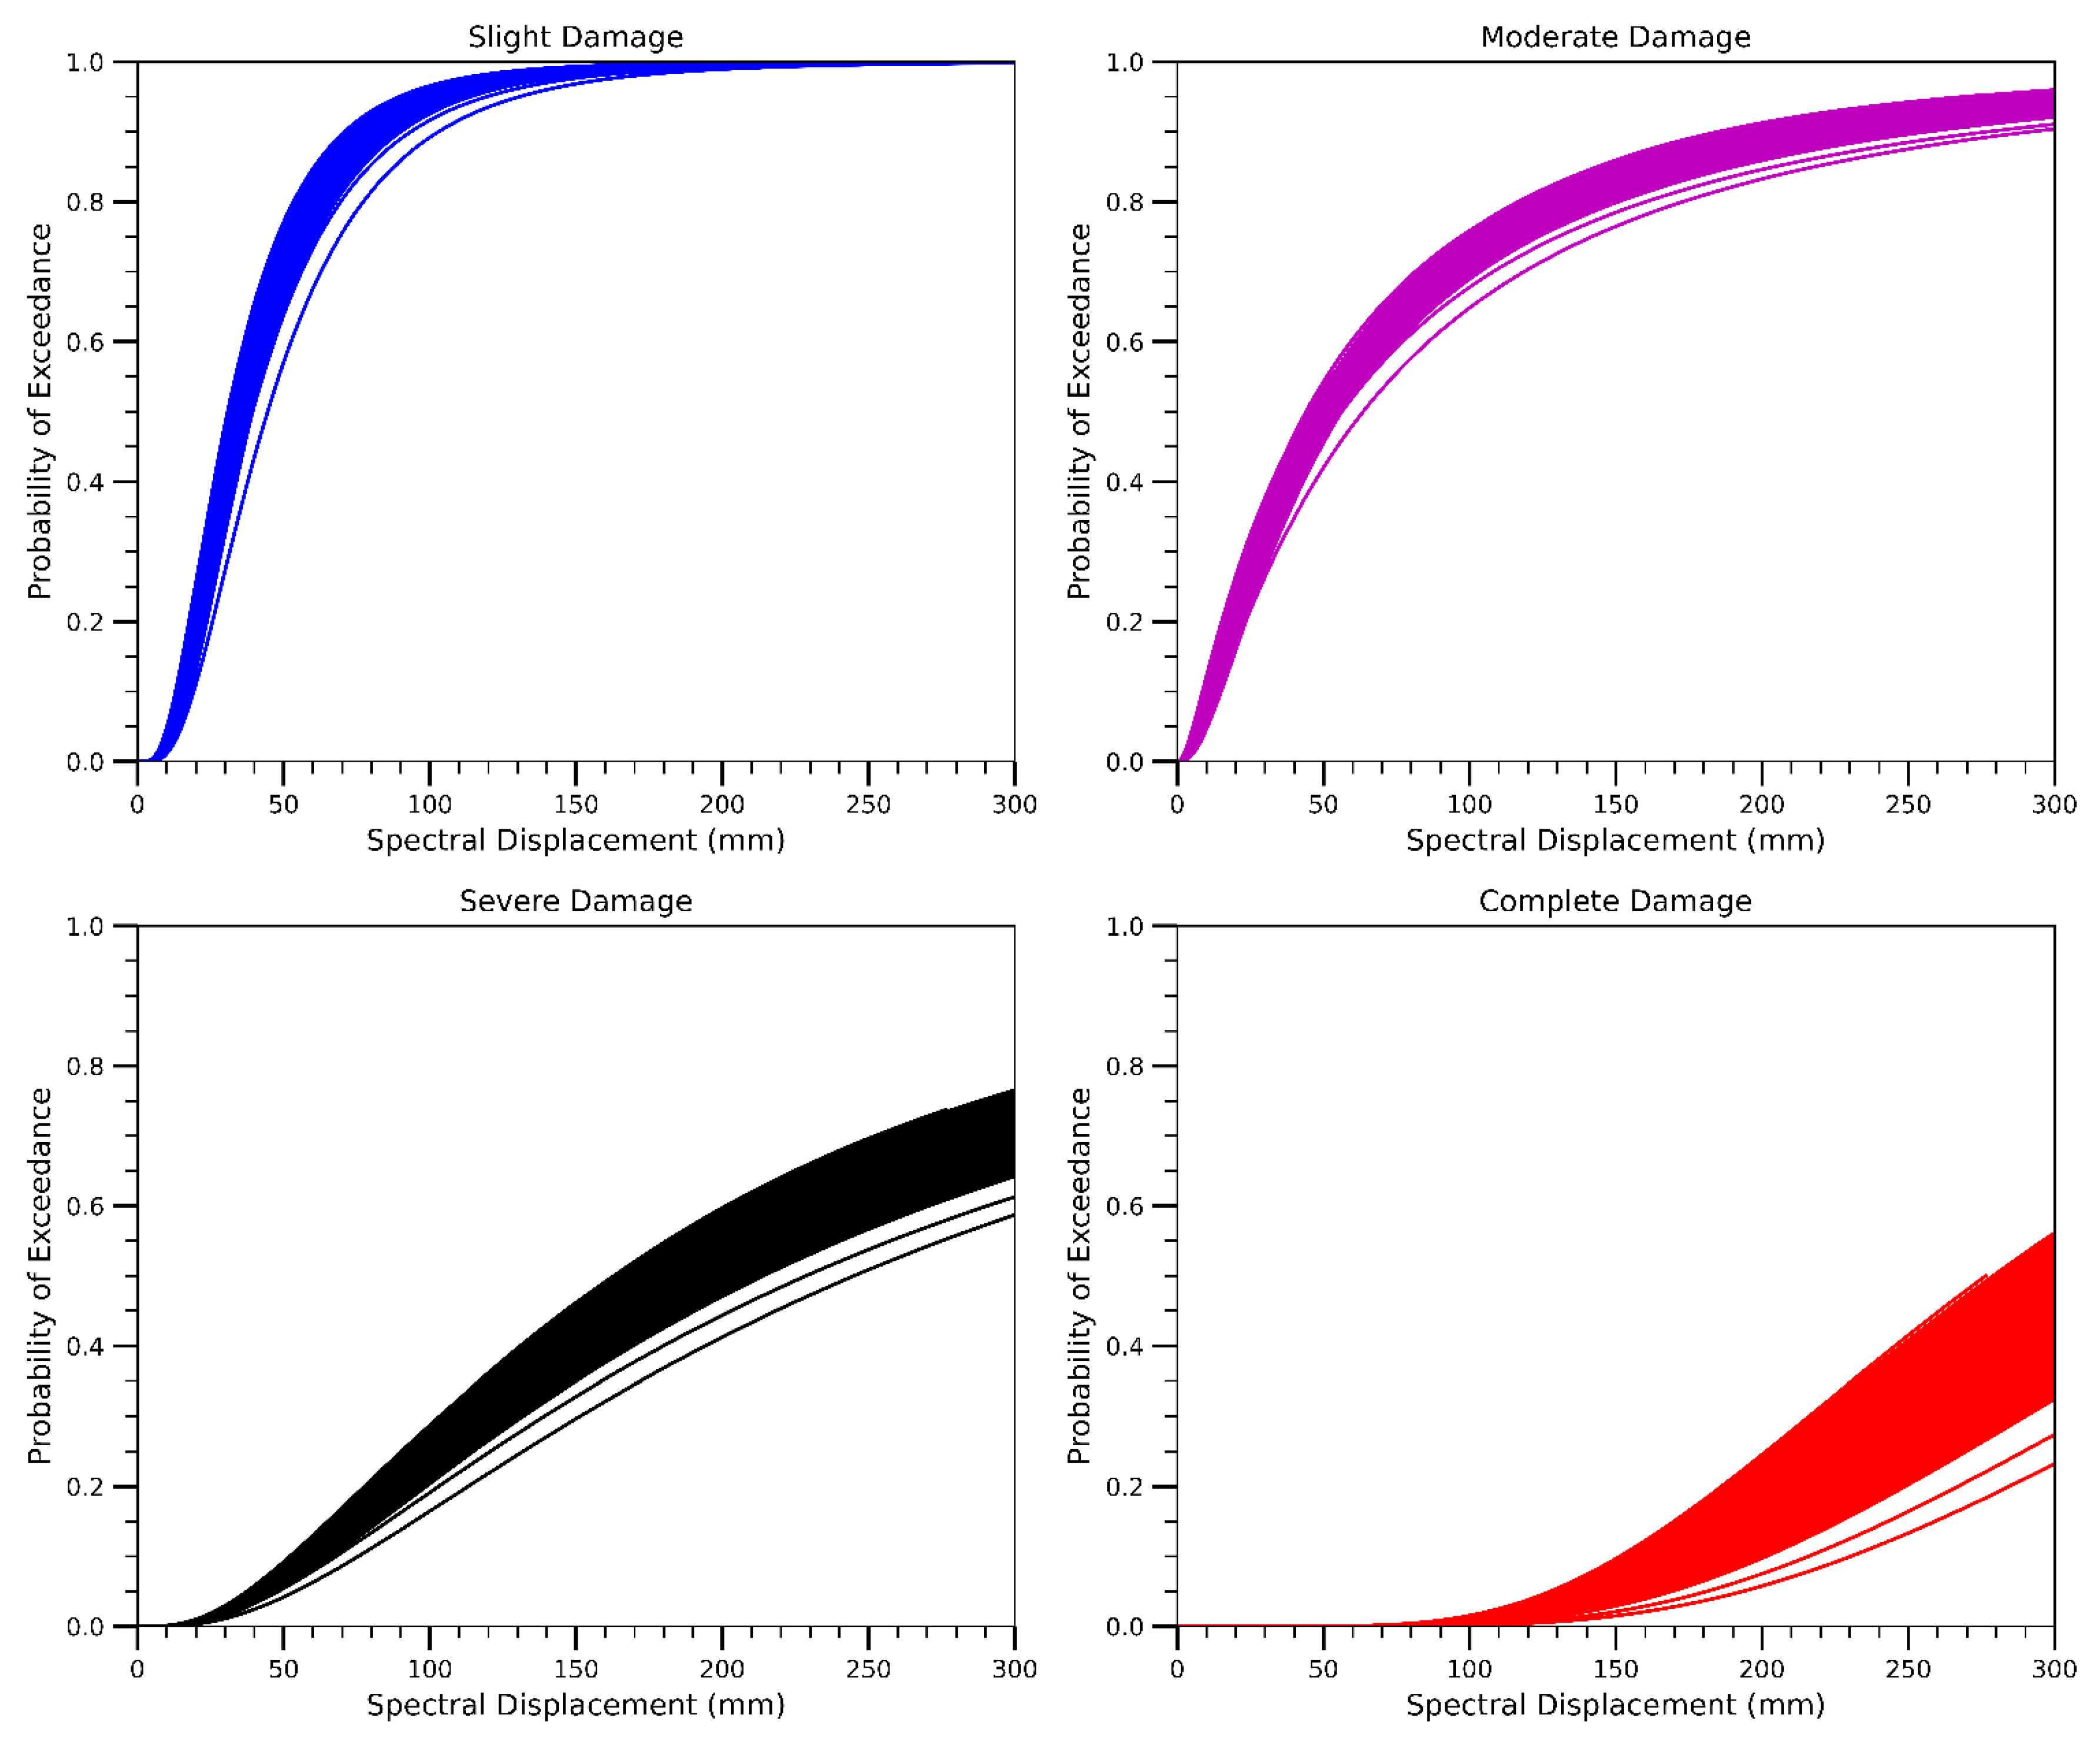
Figure 4.
(a) Training, validation, and fine-tuning loss curves; (b) Predicted vs. actual damage index from regression model.
Figure 4.
(a) Training, validation, and fine-tuning loss curves; (b) Predicted vs. actual damage index from regression model.
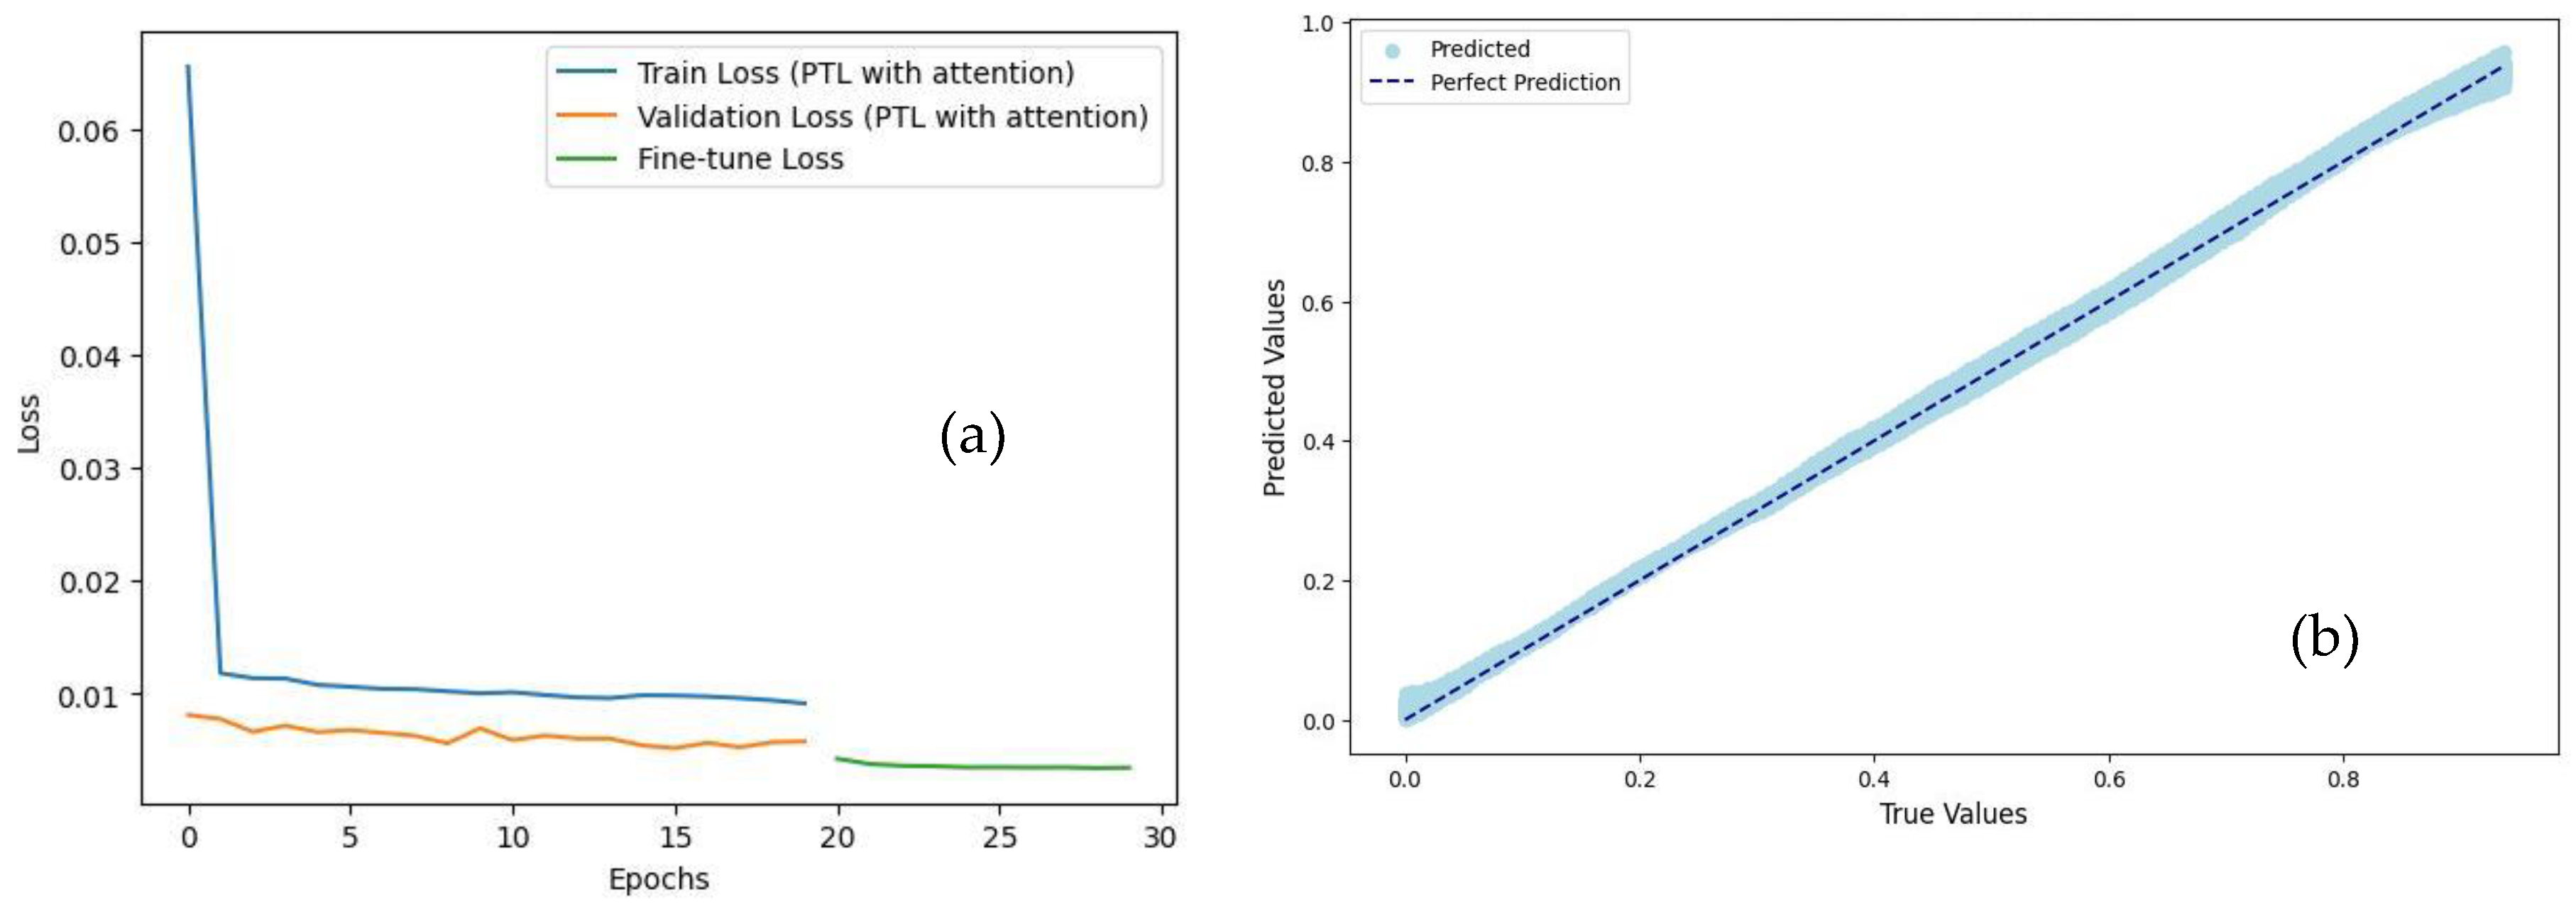
Figure 5.
Confusion matrix shows the classification performance of the PTL model across five structural damage categories.
Figure 5.
Confusion matrix shows the classification performance of the PTL model across five structural damage categories.
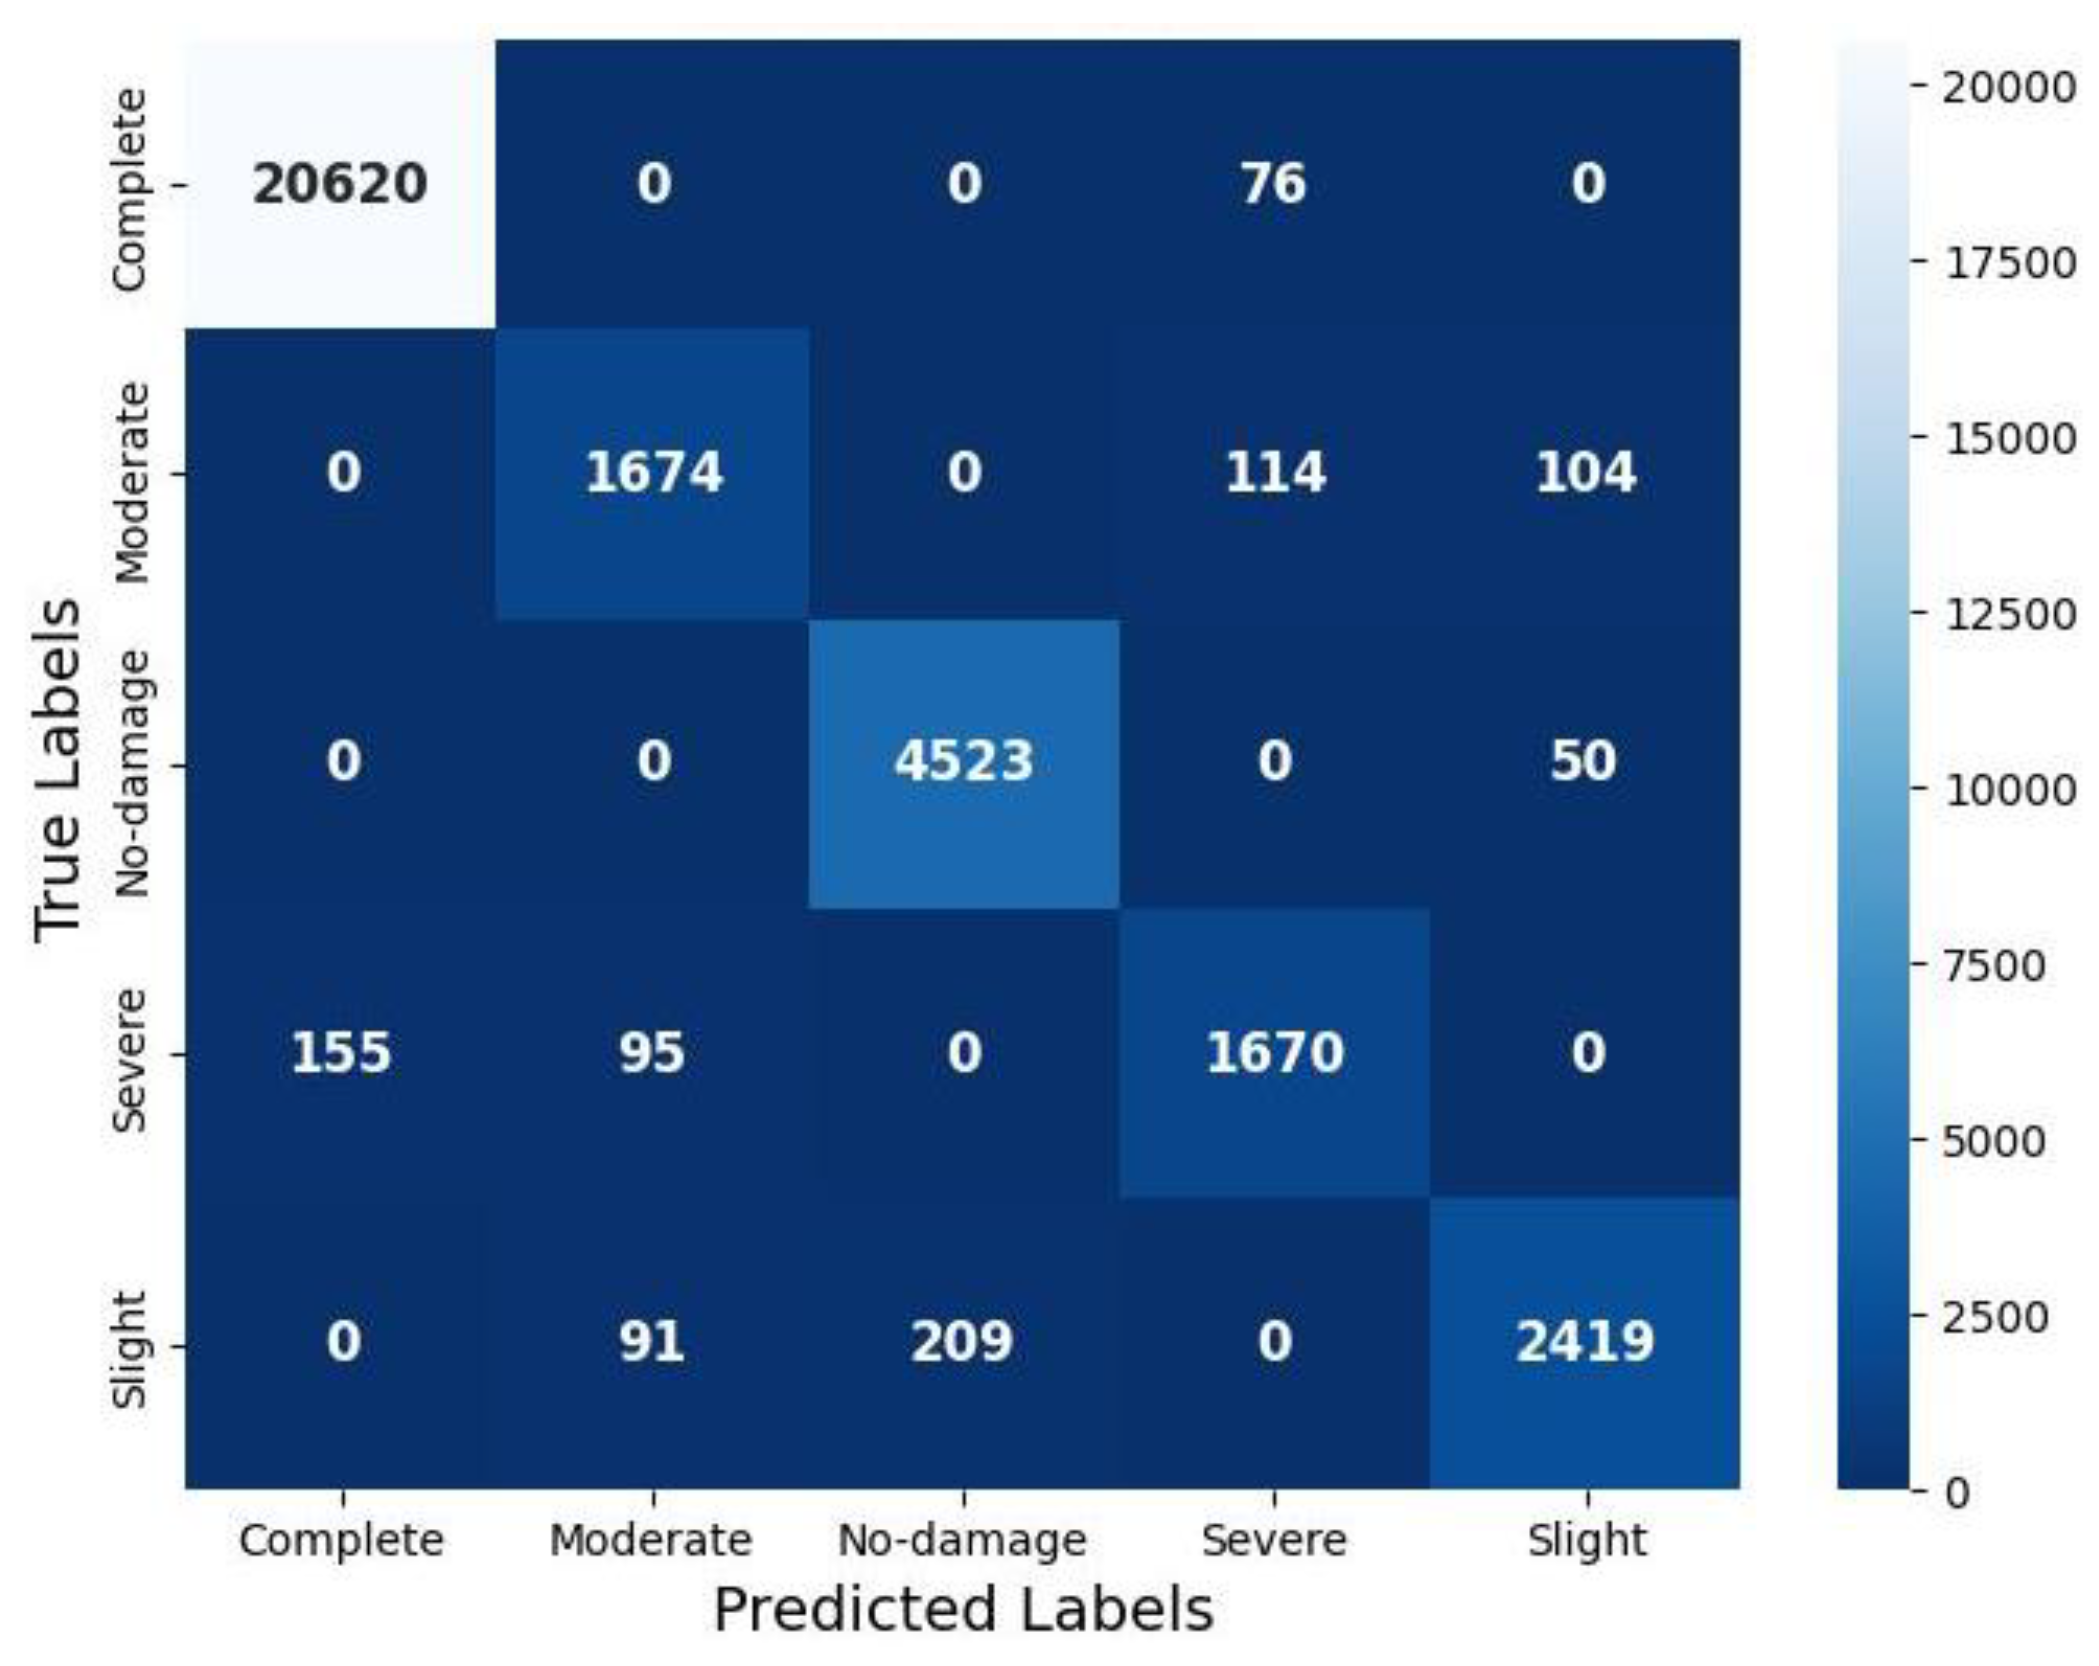
Figure 6.
Comparison between actual and predicted class distribution of structural damage states using PTL classifier.
Figure 6.
Comparison between actual and predicted class distribution of structural damage states using PTL classifier.
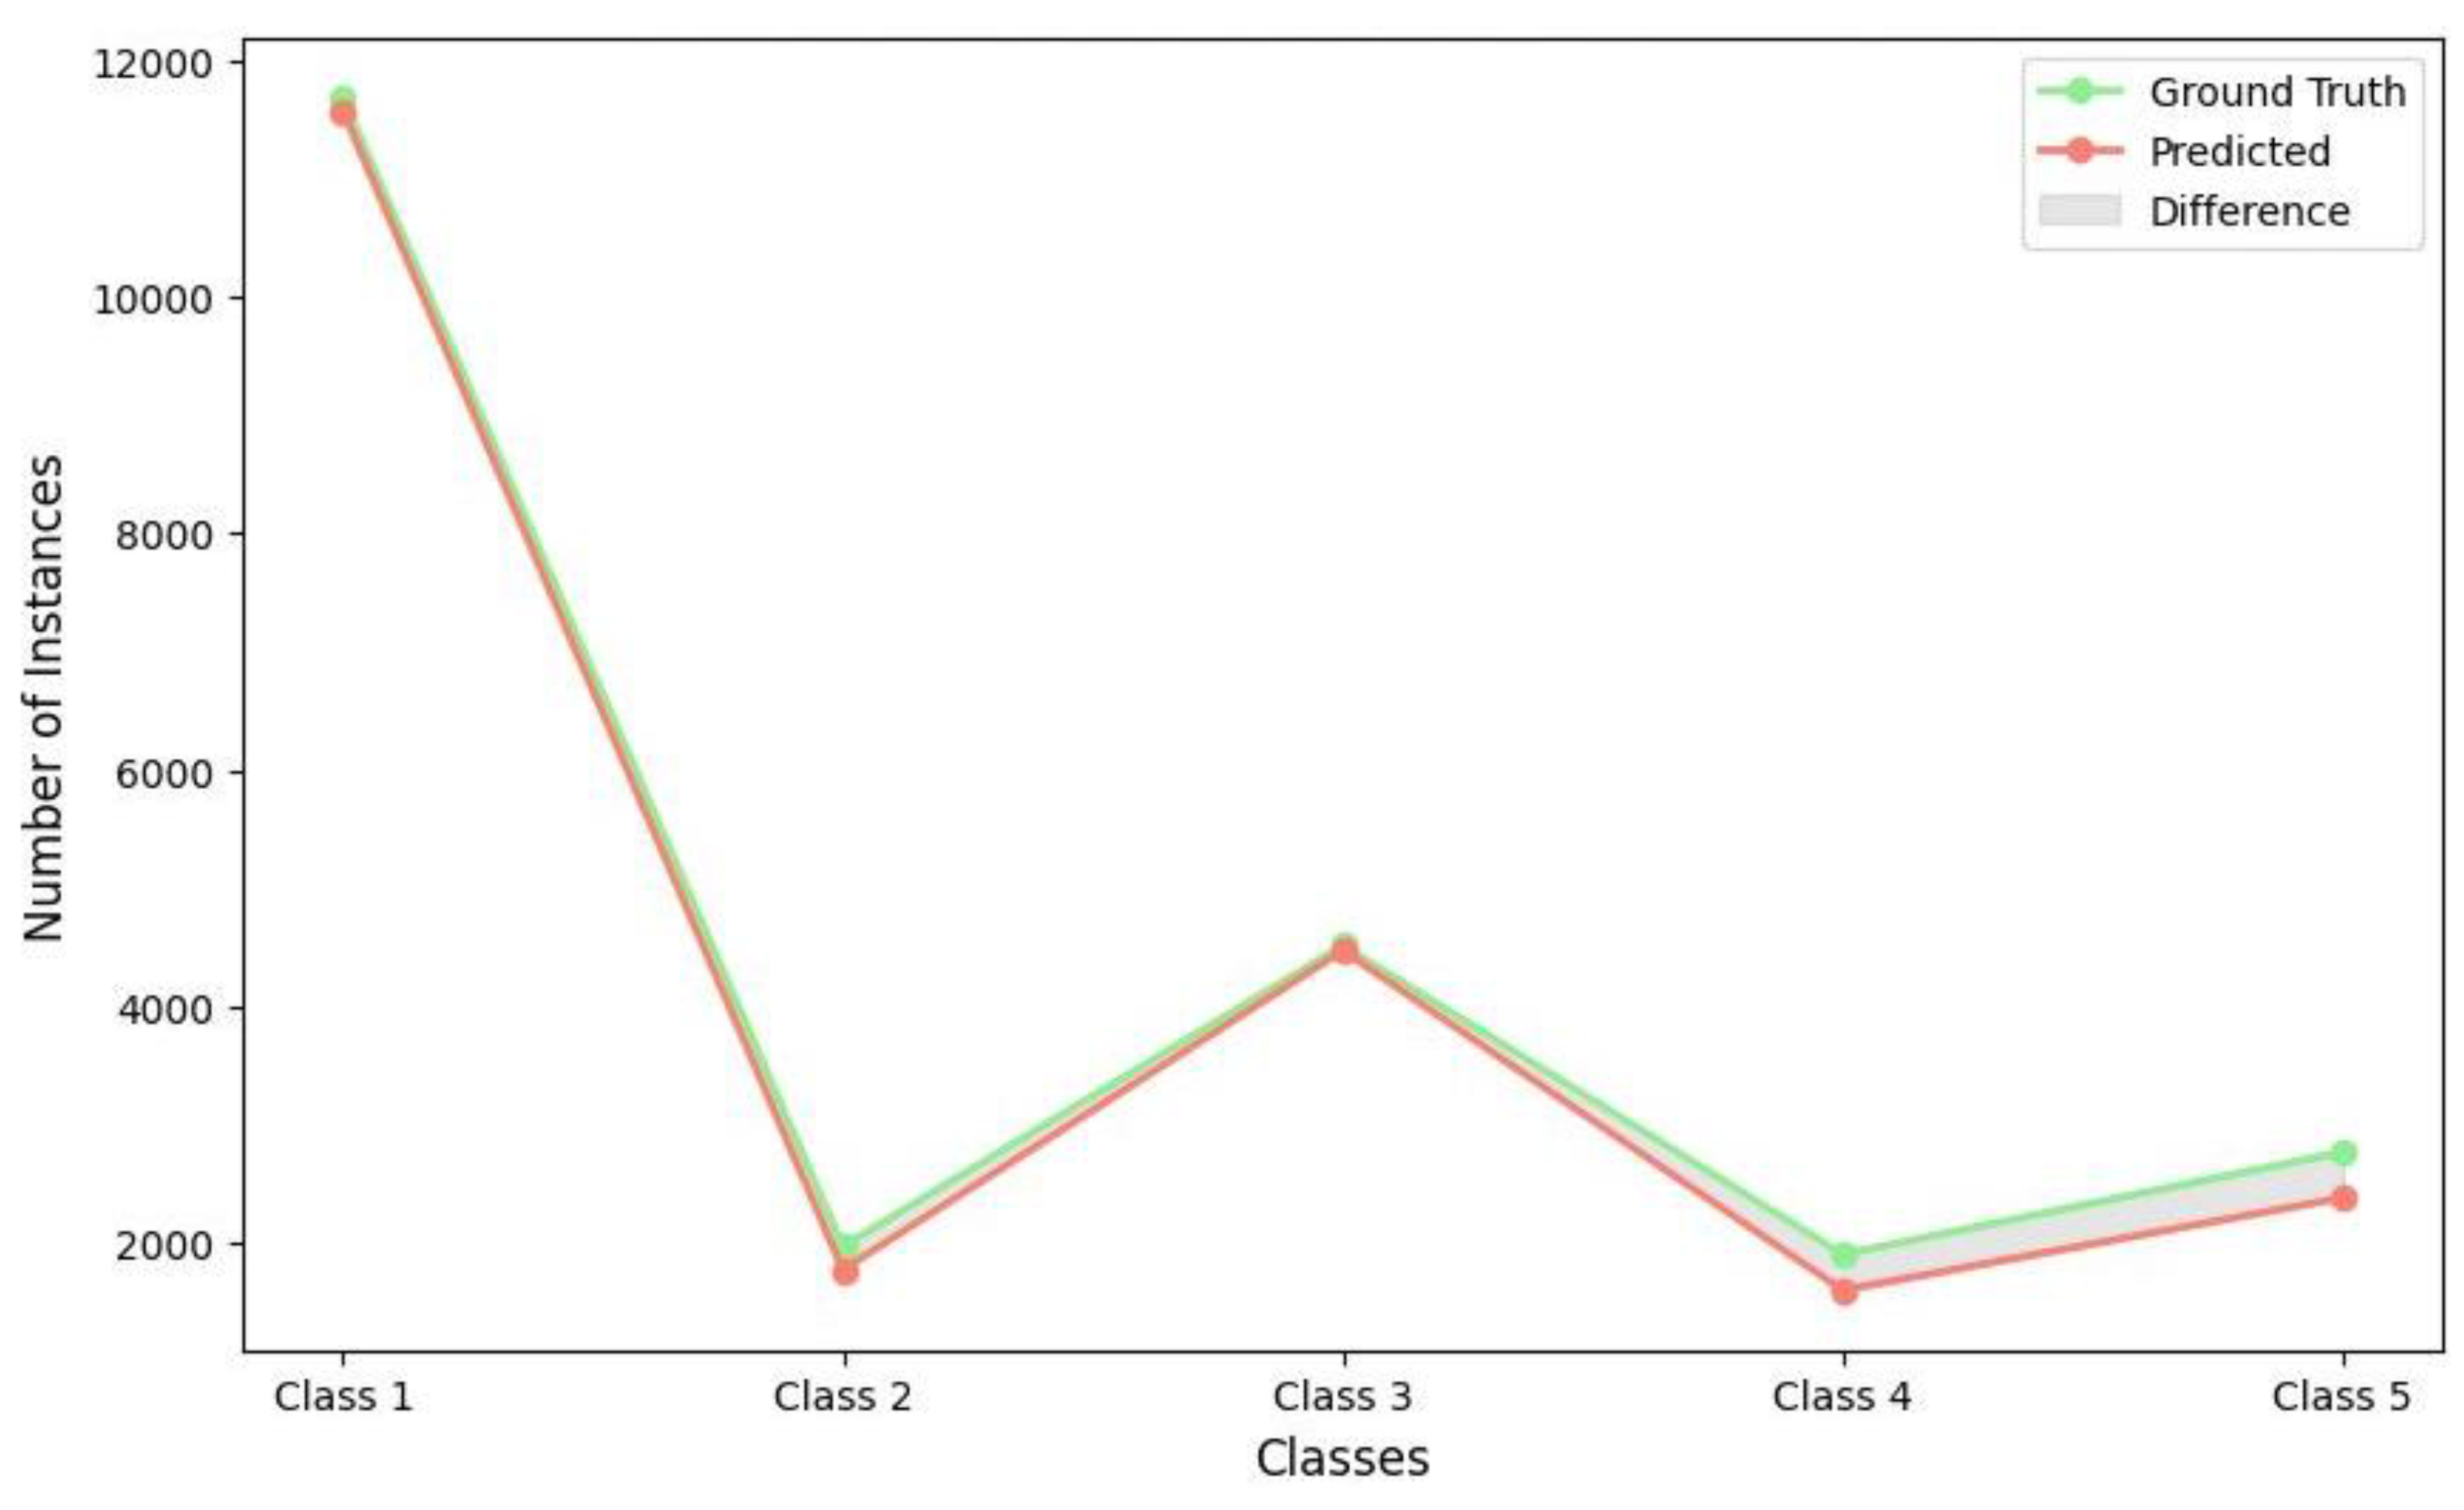
Figure 7.
Principal Component Analysis (PCA) plot for visualizing corrects and incorrect classifications of damage states.
Figure 7.
Principal Component Analysis (PCA) plot for visualizing corrects and incorrect classifications of damage states.
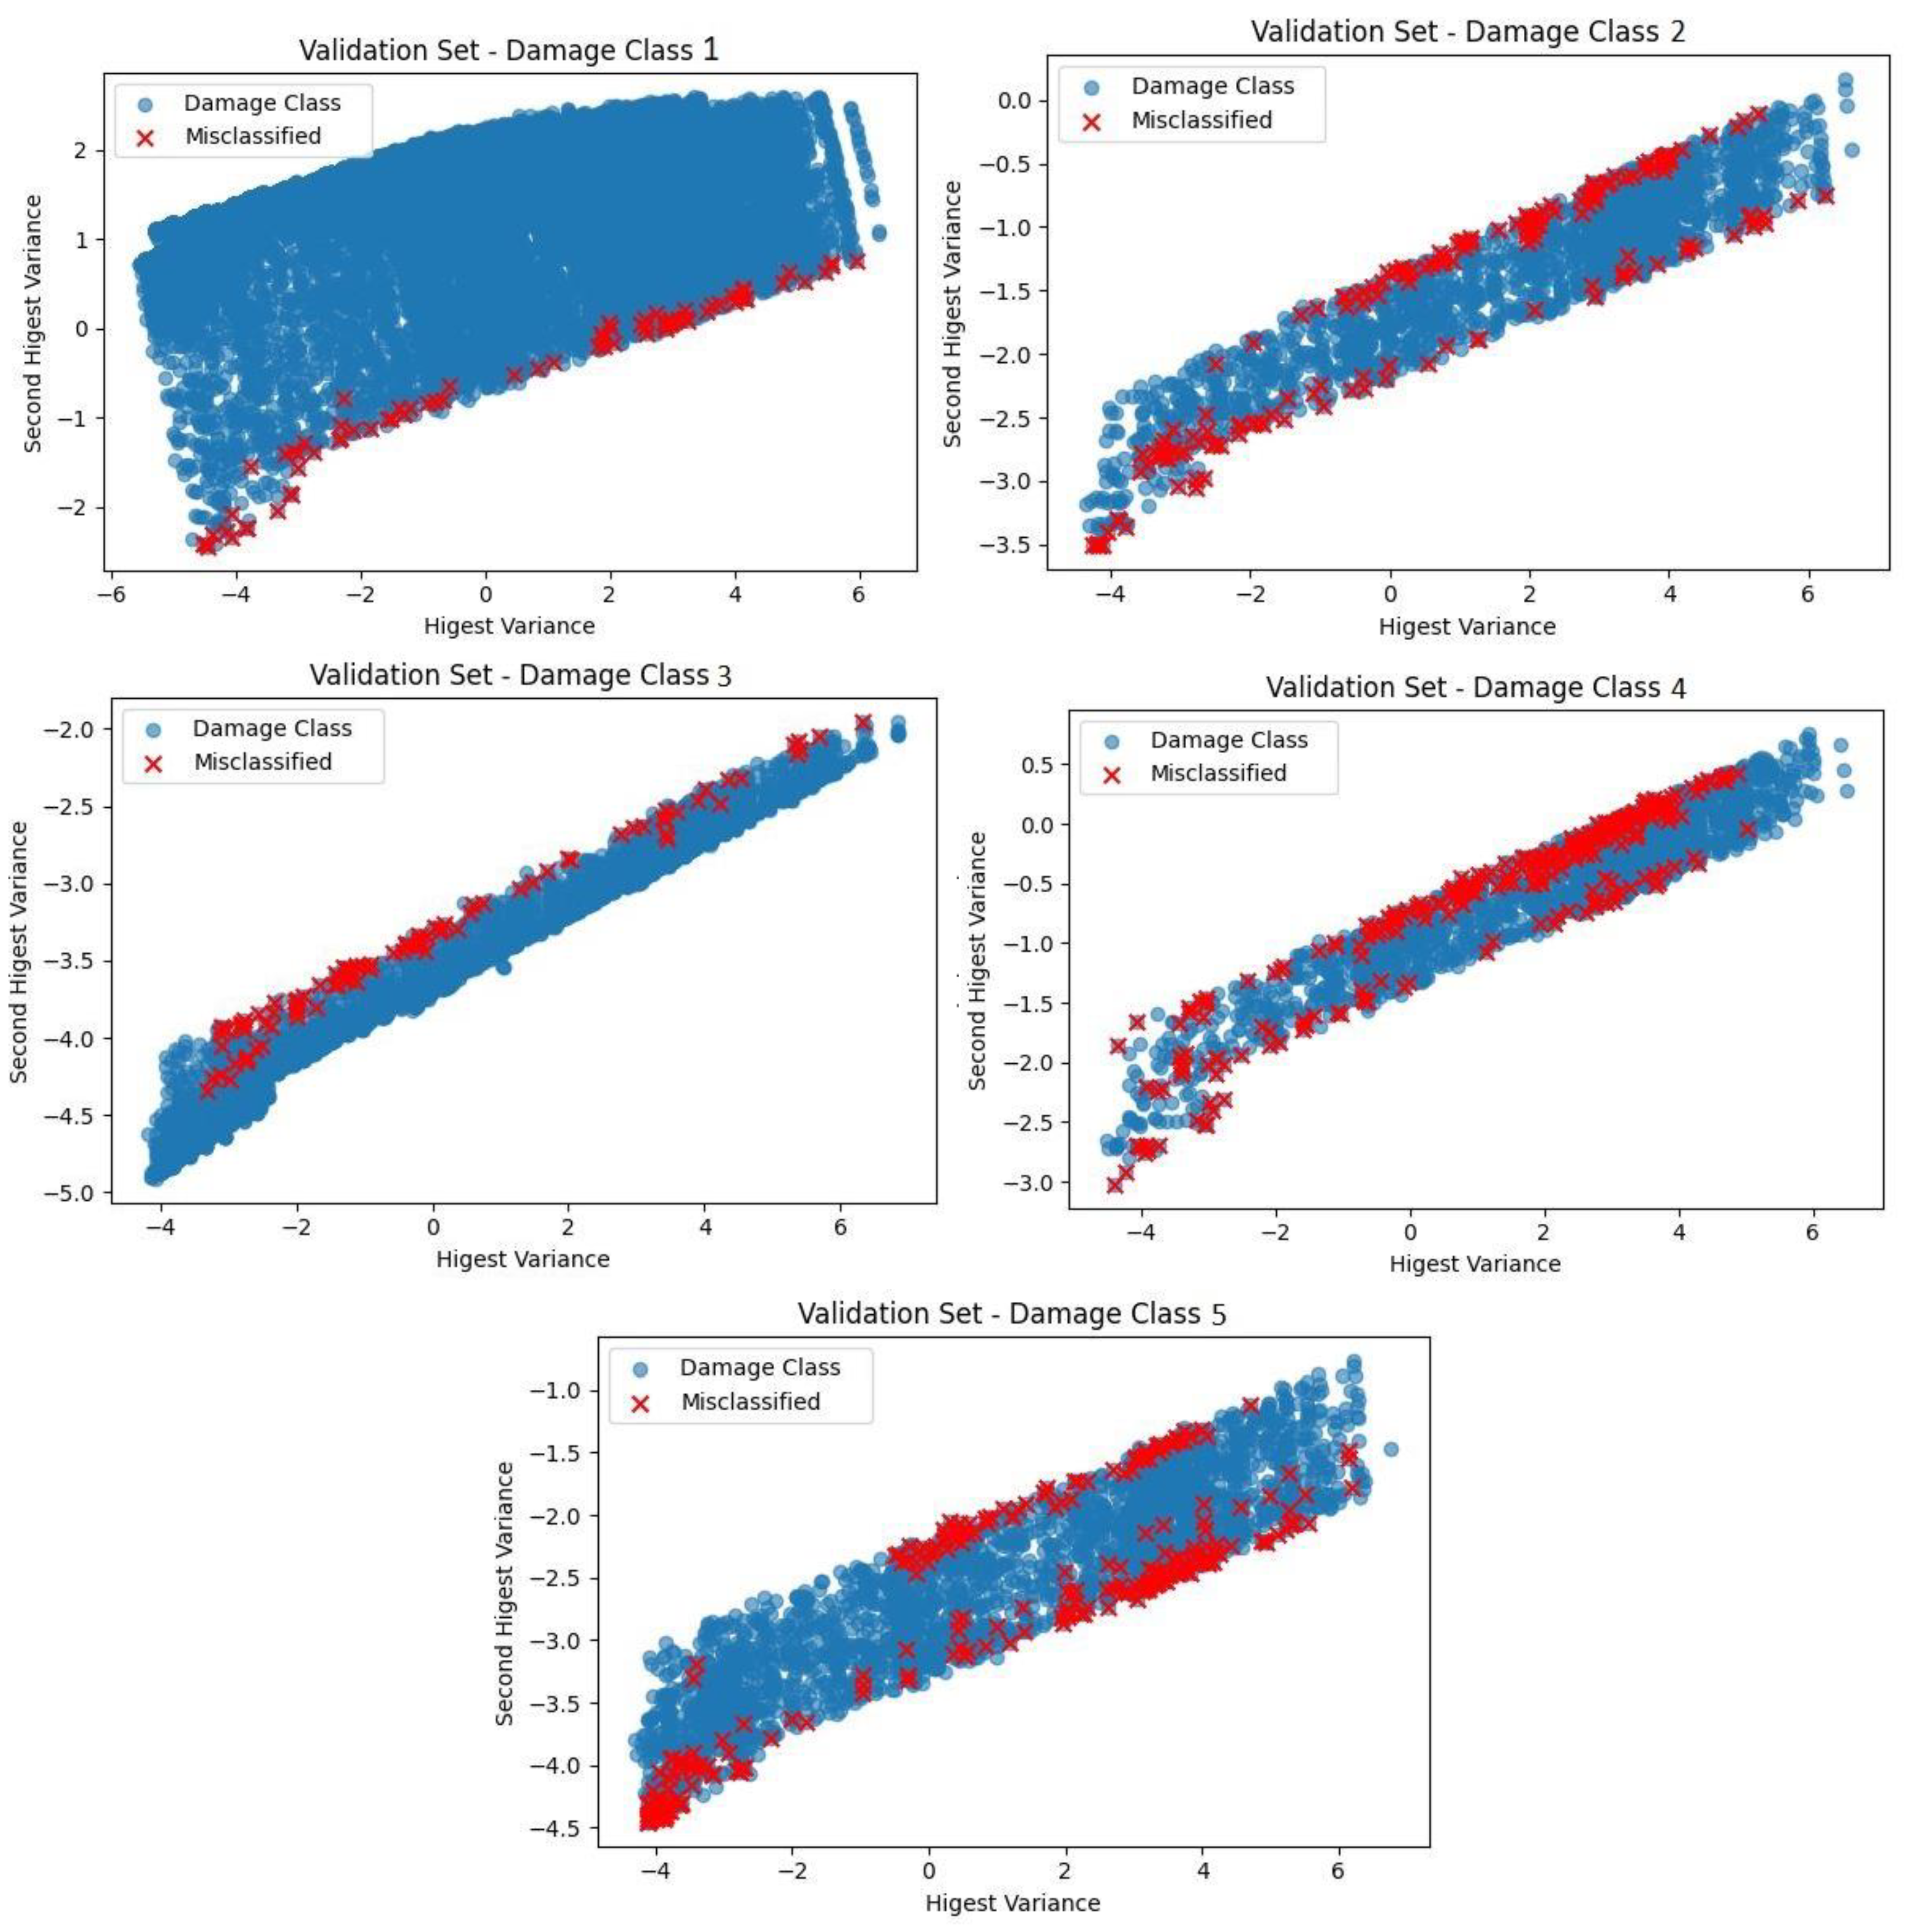
Table 1.
Rebar detailing of the selected RC frame buildings in the present study.
| Frame | Member | Floor |
Width (mm) |
Depth (mm) |
Effective section* |
| 2-Storey | Beams | 1 | 230 | 400 | 6-12 Φ (top) + 2-12 Φ (bottom) |
| Columns | 1 | 300 | 300 | 8-16 Φ | |
| Beams | 2 | 230 | 400 | 3-16 Φ (top) + 2-12 Φ (bottom) | |
| Columns | 2 | 300 | 300 | 4-16 Φ + 4-12 Φ | |
| 4-Storey | Beams | 1-2 | 230 | 450 | 4-16 Φ (top) + 2-16 Φ (bottom) |
| Columns | 1-2 | 350 | 350 | 12-20 Φ | |
| Beams | 3-4 | 230 | 400 | 4-16 Φ (top) + 2-16 Φ (bottom) | |
| Columns | 3-4 | 300 | 300 | 12-16 Φ | |
| 8-Storey | Beams | 1-4 | 300 | 450 | 2-20 Φ + 1-16 Φ (top) + 2-20 Φ (bottom) |
| Columns | 1-4 | 500 | 500 | 4-25 Φ + 8-20 Φ | |
| Beams | 5-8 | 250 | 450 | 4-16 Φ (top) + 2-16 Φ (bottom) | |
| Columns | 5-8 | 350 | 350 | 12-25 Φ | |
| 12-Storey | Beams | 1-4 | 300 | 550 | 2-20 Φ (top) + 2-16 Φ (bottom) |
| Columns | 1-4 | 550 | 550 | 4-25 Φ + 8-20 Φ | |
| Beams | 5-8 | 250 | 500 | 3-20 Φ (top) + 2-16 Φ (bottom) | |
| Columns | 5-8 | 450 | 450 | 4-25 Φ + 8-20 Φ | |
| Beams | 9-12 | 250 | 450 | 3-16 Φ (top) + 2-16 Φ (bottom) | |
| Columns | 9-12 | 400 | 400 | 8-16 Φ |
*Φ represented the diameter of the rebar. Rebar is uniformly distributed in the column.
Table 2.
Statical parameters of the collected simulation data for selected RC frame buildings.
| Parameters | Mean | STD | Min | Max |
| β1 (Slight) | 0.65 | 0.020 | 0.59 | 0.69 |
| β2 (Moderate) | 1.17 | 0.050 | 1.01 | 1.28 |
| β3 (Severe) | 0.91 | 0.030 | 0.82 | 0.97 |
| β4 (Complete) | 0.48 | 0.001 | 0.47 | 0.48 |
| Slight Damage State (mm) | 35.64 | 1.28 | 30.87 | 44.53 |
| Moderate Damage State (mm) | 50.92 | 1.82 | 44.10 | 63.62 |
| Severe Damage State (mm) | 192.42 | 9.63 | 162.98 | 245.09 |
| Complete Damage State (mm) | 333.92 | 18.52 | 276.51 | 426.56 |
Table 3.
More likely damage states, corresponding mean damage index and damage threshold intervals.
| Mean damage index intervals | More likely damage state | Damage threshold |
| 0.0-0.5 | No-damage | - |
| 0.5-1.5 | Slight | |
| 1.5-2.5 | Moderate | |
| 2.5-3.5 | Severe | |
| 3.5-4.0 | Complete |
Table 4.
Comparative evaluation of ML models with Mean Squared Error (MSE) and R2 Score performance metrics Regression model.
Table 4.
Comparative evaluation of ML models with Mean Squared Error (MSE) and R2 Score performance metrics Regression model.
| Model | Mean Squared Error (MSE) | R2 Score |
| Progressive TL with Attention | 0.002 | 0.98 |
| Traditional Deep Learning | 0.005 | 0.92 |
| Basic Transfer Learning | 0.002 | 0.94 |
| Random Forest Regression | 0.010 | 0.89 |
| Gradient Boosting | 0.007 | 0.91 |
| Linear Regression | 0.050 | 0.75 |
Table 5.
Precision, recall, and F1-score metrics derived from the confusion matrix for each damage category.
Table 5.
Precision, recall, and F1-score metrics derived from the confusion matrix for each damage category.
| Structural Damage | Precision | Recall | F1-score |
| Class 1 - Complete | 0.98 | 0.99 | 0.99 |
| Class 2 - Severe | 0.89 | 0.90 | 0.89 |
| Class 3 - No-damage | 0.94 | 0.99 | 0.97 |
| Class 4 - Moderate | 0.89 | 0.84 | 0.86 |
| Class 5 - Slight | 0.95 | 0.86 | 0.90 |
Table 6.
Comparative analysis of different ML models on given dataset in terms of accuracy (%) for a given classification task of identifying the structural damage.
Table 6.
Comparative analysis of different ML models on given dataset in terms of accuracy (%) for a given classification task of identifying the structural damage.
| Model | Accuracy (%) of classification |
| RF | 70.82 |
| GBT | 75.18 |
| SVM | 65.02 |
| CNN | 85.11 |
| CNN with basic TL | 90.25 |
| Progressive TL with attention | 95.64 |
Table 7.
Adam, RMSprop and SGD optimizers performance to predict the output as Structural damage (Classification-based) and damage index (Regression-based).
Table 7.
Adam, RMSprop and SGD optimizers performance to predict the output as Structural damage (Classification-based) and damage index (Regression-based).
| Optimizer | Classification Accuracy (%) | Loss (Sparse Categorical Cross-Entropy: classification based) | Regression (R2) | Loss (MSE-regression based) |
| Adam | 95.64 | 0.1353 | 0.997 | 0.0002 |
| RMSprop | 93.12 | 0.1725 | 0.992 | 0.0003 |
| SGD | 88.65 | 0.2201 | 0.985 | 0.0004 |
Disclaimer/Publisher’s Note: The statements, opinions and data contained in all publications are solely those of the individual author(s) and contributor(s) and not of MDPI and/or the editor(s). MDPI and/or the editor(s) disclaim responsibility for any injury to people or property resulting from any ideas, methods, instructions or products referred to in the content. |
© 2025 by the authors. Licensee MDPI, Basel, Switzerland. This article is an open access article distributed under the terms and conditions of the Creative Commons Attribution (CC BY) license (http://creativecommons.org/licenses/by/4.0/).
Copyright: This open access article is published under a Creative Commons CC BY 4.0 license, which permit the free download, distribution, and reuse, provided that the author and preprint are cited in any reuse.


