
Submitted:
29 December 2025
Posted:
30 December 2025
You are already at the latest version
Abstract
Background: Electrocardiography (ECG) represents an important noninvasive screening tool for heart disease in preparticipation screening of competitive athletes. However, interpretation of pediatric ECG based on age-specific reference values remains challenging, due to considerable variation among studies, influenced by population characteristics and documentation methodology. The variability of normal values in key pediatric ECG features regarding left ventricular hypertrophy (LVH), QTc prolongation and pre-excitation detection seem to have a significant impact in the efficacy of pediatric ECG as a preparticipation screening tool. Aims and scope of the study: This review aims to compare contemporary pediatric ECG reference ranges for key ECG features relevant to LVH, QTc, PR and QRS duration and highlight physiological and methodological sources of observed variability. Methods: A review of current literature was conducted using common biomedical databases for studies reporting certain quantitative ECG reference values in healthy children from infancy through adolescence regarding the above selected key features. Reported values were summarized descriptively, with emphasis on developmental trends and methodological differences among studies af-fecting ECG values. Results: Across 16 pediatric studies, ECG parameters demonstrated consistent age-dependent developmental patterns, despite variability in absolute values. R-wave amplitudes in left precordial leads increased from infancy through early childhood and remained stable in older children, whereas S-wave amplitudes in right precordial leads showed greater variation between studies. PR intervals and QRS du-ration increased progressively with age across all datasets, while QTc values remained relatively stable throughout childhood and adolescence, with minimal sex-related dif-ferences. Variability in reported reference ranges was most pronounced for ampli-tude-based- compared to interval duration parameters, and was influenced by differ-ences in population characteristics, ECG acquisition techniques, and measurement methodology. Conclusions: This review summarizes contemporary ECG reference data in healthy children for the early detection of LVH, pre-excitation and QT prolongation, which are the main objectives of ECG screening in young athletes.
Keywords:
electrocardiogram
; pediatric
; left ventricular hypertrophy
; amplitudes
; waveforms
; normal values
1. Introduction
Preparticipation cardiac screening refers to the early detection of potentially life threatening conditions, associated with sudden cardiac death in athletes and children, where coronary artery disease is virtually almost absent [1]. Early detection of cardiomyopathies (such as hypertrophic cardiomyopathy-HCM) and arrhythmogenic heart diseases, including Long QT (LQT) syndrome and pre-excitation syndromes such as Wolff-Parkinson-White (WPW), represent primary targets of preparticipation screening. ECG has become an integral screening tool in preparticipation screening in young asymptomatic competitive athletes in Europe, due to its established efficacy to detect left ventricular hypertrophy (LVH) through the use of appropriate amplitude criteria [2]. The detection of LQT and WPW is relatively straightforward, relying on automated ECG interval measurements by modern ECG interpretation software [3,4]. However, interpretation of pediatric ECG based on age-specific reference values remains challenging, due to considerable variation among studies, influenced by population characteristics and documentation methodology [5]. The variability of normal values in key pediatric ECG features regarding left ventricular hypertrophy (LVH), QTc prolongation and pre-excitation detection can have a significant impact on the efficacy of pediatric ECG as a preparticipation screening tool for the detection of HCM, LQT and WPW syndrome respectively [4,6,7]. Traditionally, ECG amplitude- criteria have been used to detect LVH in children. Thus, LVH hypertrophy is characterized by increased positive (R) amplitudes of QRS complex in left precordial leads (V5, V6) and increased negative (S) amplitudes of QRS complex in right precordial leads (V1,V2) [8,9]. Pre-excitation is characterized by a short PR duration accompanied by QRS prolongation, due to the superimposition of the electric current (delta wave) characterizing the fast electric impulse transmission from the atria to the ventricles (orthodromic transmission) through an accessory pathway [10]. Age-related normal values of minimum PR and maximum QRS duration are of critical significance for the appropriate detection of pre-excitation, potentially associated with re-entry tachycardias or fast ventricular transmission of atrial tachycardias [11]. The documentation of prolonged QTc is a primary screening target of preparticipation screening, as Long QT syndrome represents one of the most common channelopathies, inherited cardiac diseases associated with a very high risk of sudden cardiac death in young athletes [12]. It can manifest as sudden cardiac death already in infancy in affected families [13].
Interpretation of ECG in pediatric populations is complicated by rapid anatomical and developmental maturation. ECG parameters change substantially from infancy through adolescence, with changes in amplitude criteria related with LVH and age specific changes in PR, QRS and QT duration, affecting the appropriate detection of LQT and WPW in pediatrics. As children grow, their cardiac size, thoracic geometry, body composition and autonomic tone evolve, influencing ECG voltages and morphology [14]. Normal developmental progression includes declining heart rate, increasing QRS duration, and alterations in S, R or T-wave amplitudes representing the transition from right- to left-ventricular predominance [15]. Classic reference datasets, including those by Davignon et al. [14], and Rijnbeek et al. [6], remain widely used but lack contemporary demographic diversity. More recent research work highlights ethnic ECG variabilities and supports the need for updated, population-representative reference values [5,7]. Another challenge in pediatric ECG interpretation concerns heart-rate correction of the QT interval (QTc), since the commonly used Bazett formula overcorrects the QT at high pediatric heart rates, leading to potential overdiagnosis of QT prolongation. Alternative formulas or demographic corrections have been reported showing better performance [16].
Multiple methodological forms of heterogeneity among studies (manual or automated measurements, ECG filter and sampling rates, QT correction formulas) complicate between-study comparisons and the development of standardized pediatric normative ranges. Consequently, there is a need in refining age, gender-, and race-specific ECG values and improving QTc adjustment formulas [17]. Given these challenges, accurate, validated, pediatric ECG criteria are needed, as initial screening tools, and as part of a multimodal frame, for early diagnosis of LVH, WPW and LQT syndrome, which are key targets of preparticipation screening in young athletes. The present narrative review seeks to consolidate available reference data for the main ECG parameters in healthy children, with particular emphasis on quantitative ECG indices relevant to these key targets of preparticipation screening.
2. Materials and Methods
2.1. Study Design
This narrative review synthesizes existing literature reporting normal ECG values in healthy children from infancy through adolescence, emphasizing on indices relevant to LVH, WPW and LQT detection. Developmental trends, methodological approaches, and reported reference values across contemporary pediatric studies were summarized and compared. Selection was guided by breadth of coverage and methodological approaches across studies.
2.2. Search Strategy and Sources
A comprehensive search of the literature was performed using major biomedical databases including PubMed/MEDLINE, EMBASE, and Web of Science. The search was not restricted by publication year for inclusion. Search terms combined the following keywords: electrocardiography, normal values, pediatric, children, infants, adolescents, left ventricular hypertrophy, LVH criteria, and ECG amplitudes. Reference lists of included papers were also examined to identify additional eligible publications.
2.3. Eligibility Criteria
Studies were included if they met the following criteria: a) Reported normal ECG measurements derived from healthy children (infants to ≤ 16 years), b) Provided quantitative data for LVH-, LQT, and/or WPW-related ECG indices (e.g., indices based on Sokolow-Lyon criteria, age-adjusted amplitude standards and interval durations), c) Used 12-lead ECGs recorded according to contemporary standard ECG methods, and d) Enrolled pediatric participants, free from congenital heart disease, hypertension, or systemic conditions known to affect cardiac size or affect conduction (although commonly assessed these conditions through physical evaluation). Studies were excluded if their sample consisted of children with cardiac or systemic disease, lacked quantitative ECG values, or used unconventional lead placement and non-standard ECG recording techniques.
2.4. Data Extraction and Synthesis
For each eligible study, the following information was recorded: sample size, age distribution, ECG acquisition techniques, normative values for precordial lead amplitudes for R and S waves by age groups; QRS duration, QTc measurements and PR reference intervals. Attention was given to methodological differences affecting ECG voltages, such as equipment calibration, filter settings, and population ethnicity.Due to heterogeneity in study design, population, and reporting methodologies, formal meta-analysis was not performed. Instead, findings were synthesized descriptively, focusing on age-related developmental trends and pediatric ECG reference values, and methodological differences between studies. Values were summarized descriptively, both for studies reporting medians with interquartile ranges or means with standard deviations. Depending on the study, upper reference values are reported using either z-scores (98th or 99.5th percentile) or IQR- based cutoffs for the 98th percentile. For cross-study comparisons, descriptive averages were illustrated to provide an overview of central tendencies. These values are presented for comparative purposes only and should not be interpreted as pooled normative reference standards. All graphical displays and summary tables were generated using the statistical software SPSS (version 30), to visualize developmental trends and interstudy variability, rather than to report statistical significance.
3. Results
3.1. Included Studies
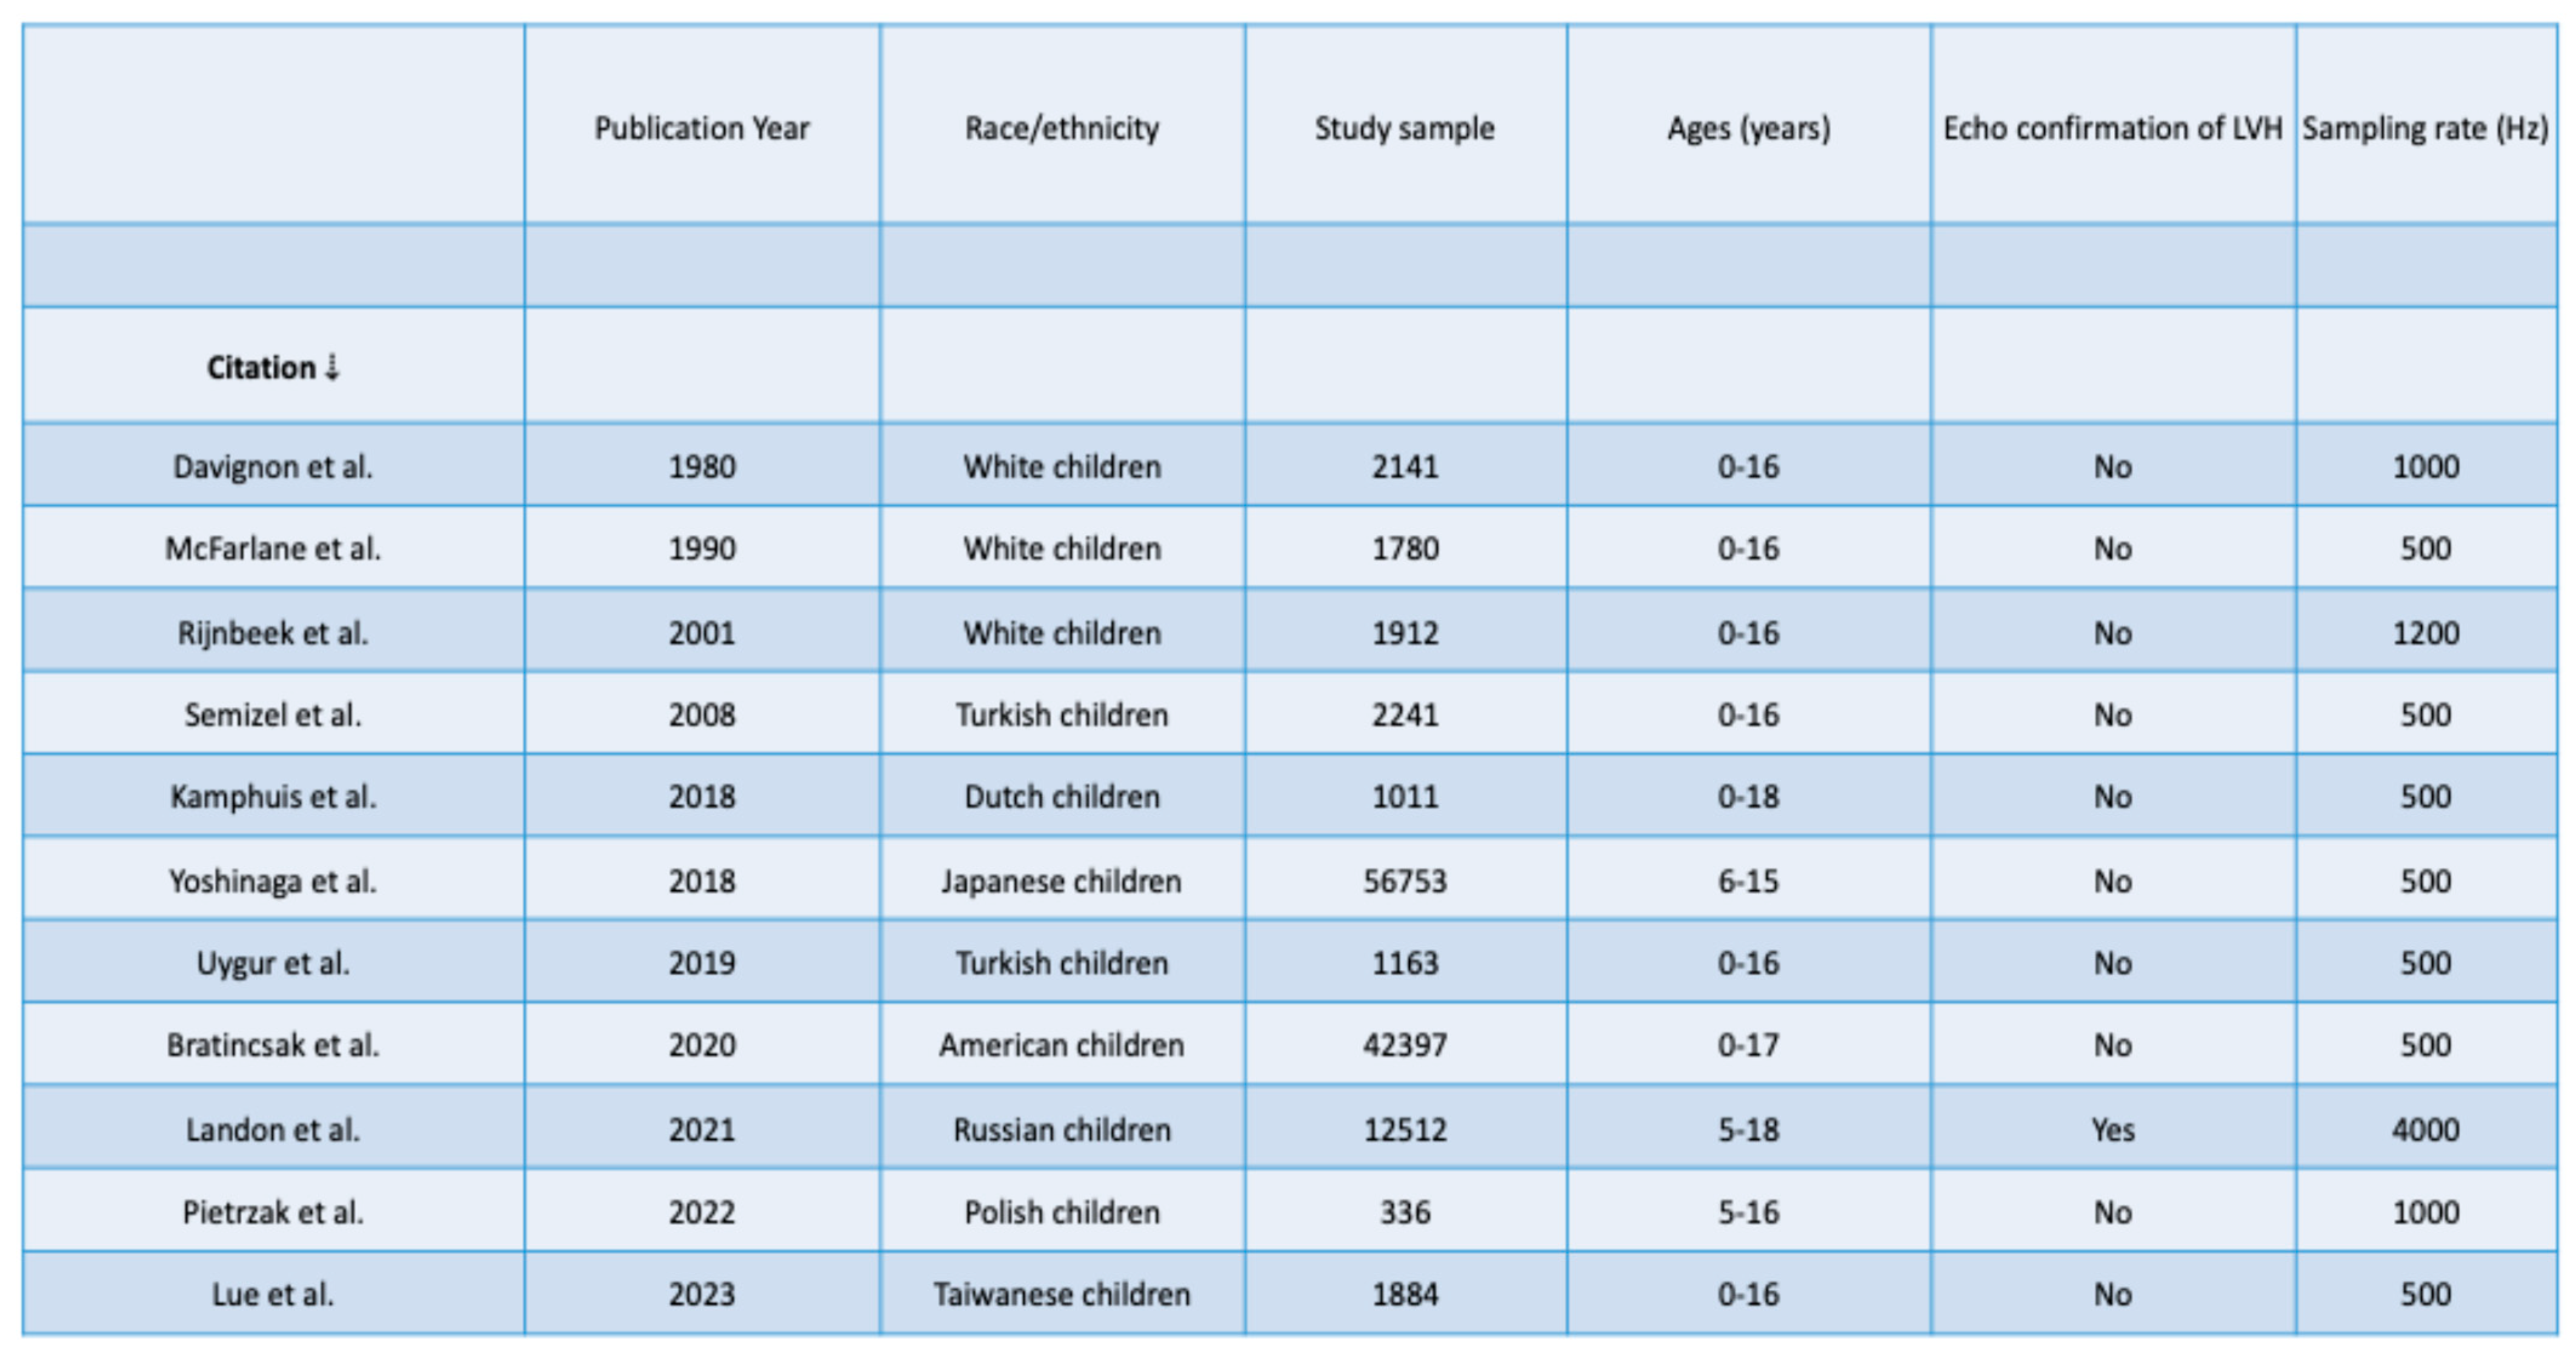
A total of 11 studies providing normative data were included. Table A summarizes the critical determinants of the resulting normative data, such as year of publication, demographic data of the reference populations, age distribution, methods used to exclude underlying heart disease, and ECG sampling rate.

3.2. LVH Hypertrophy Criteria
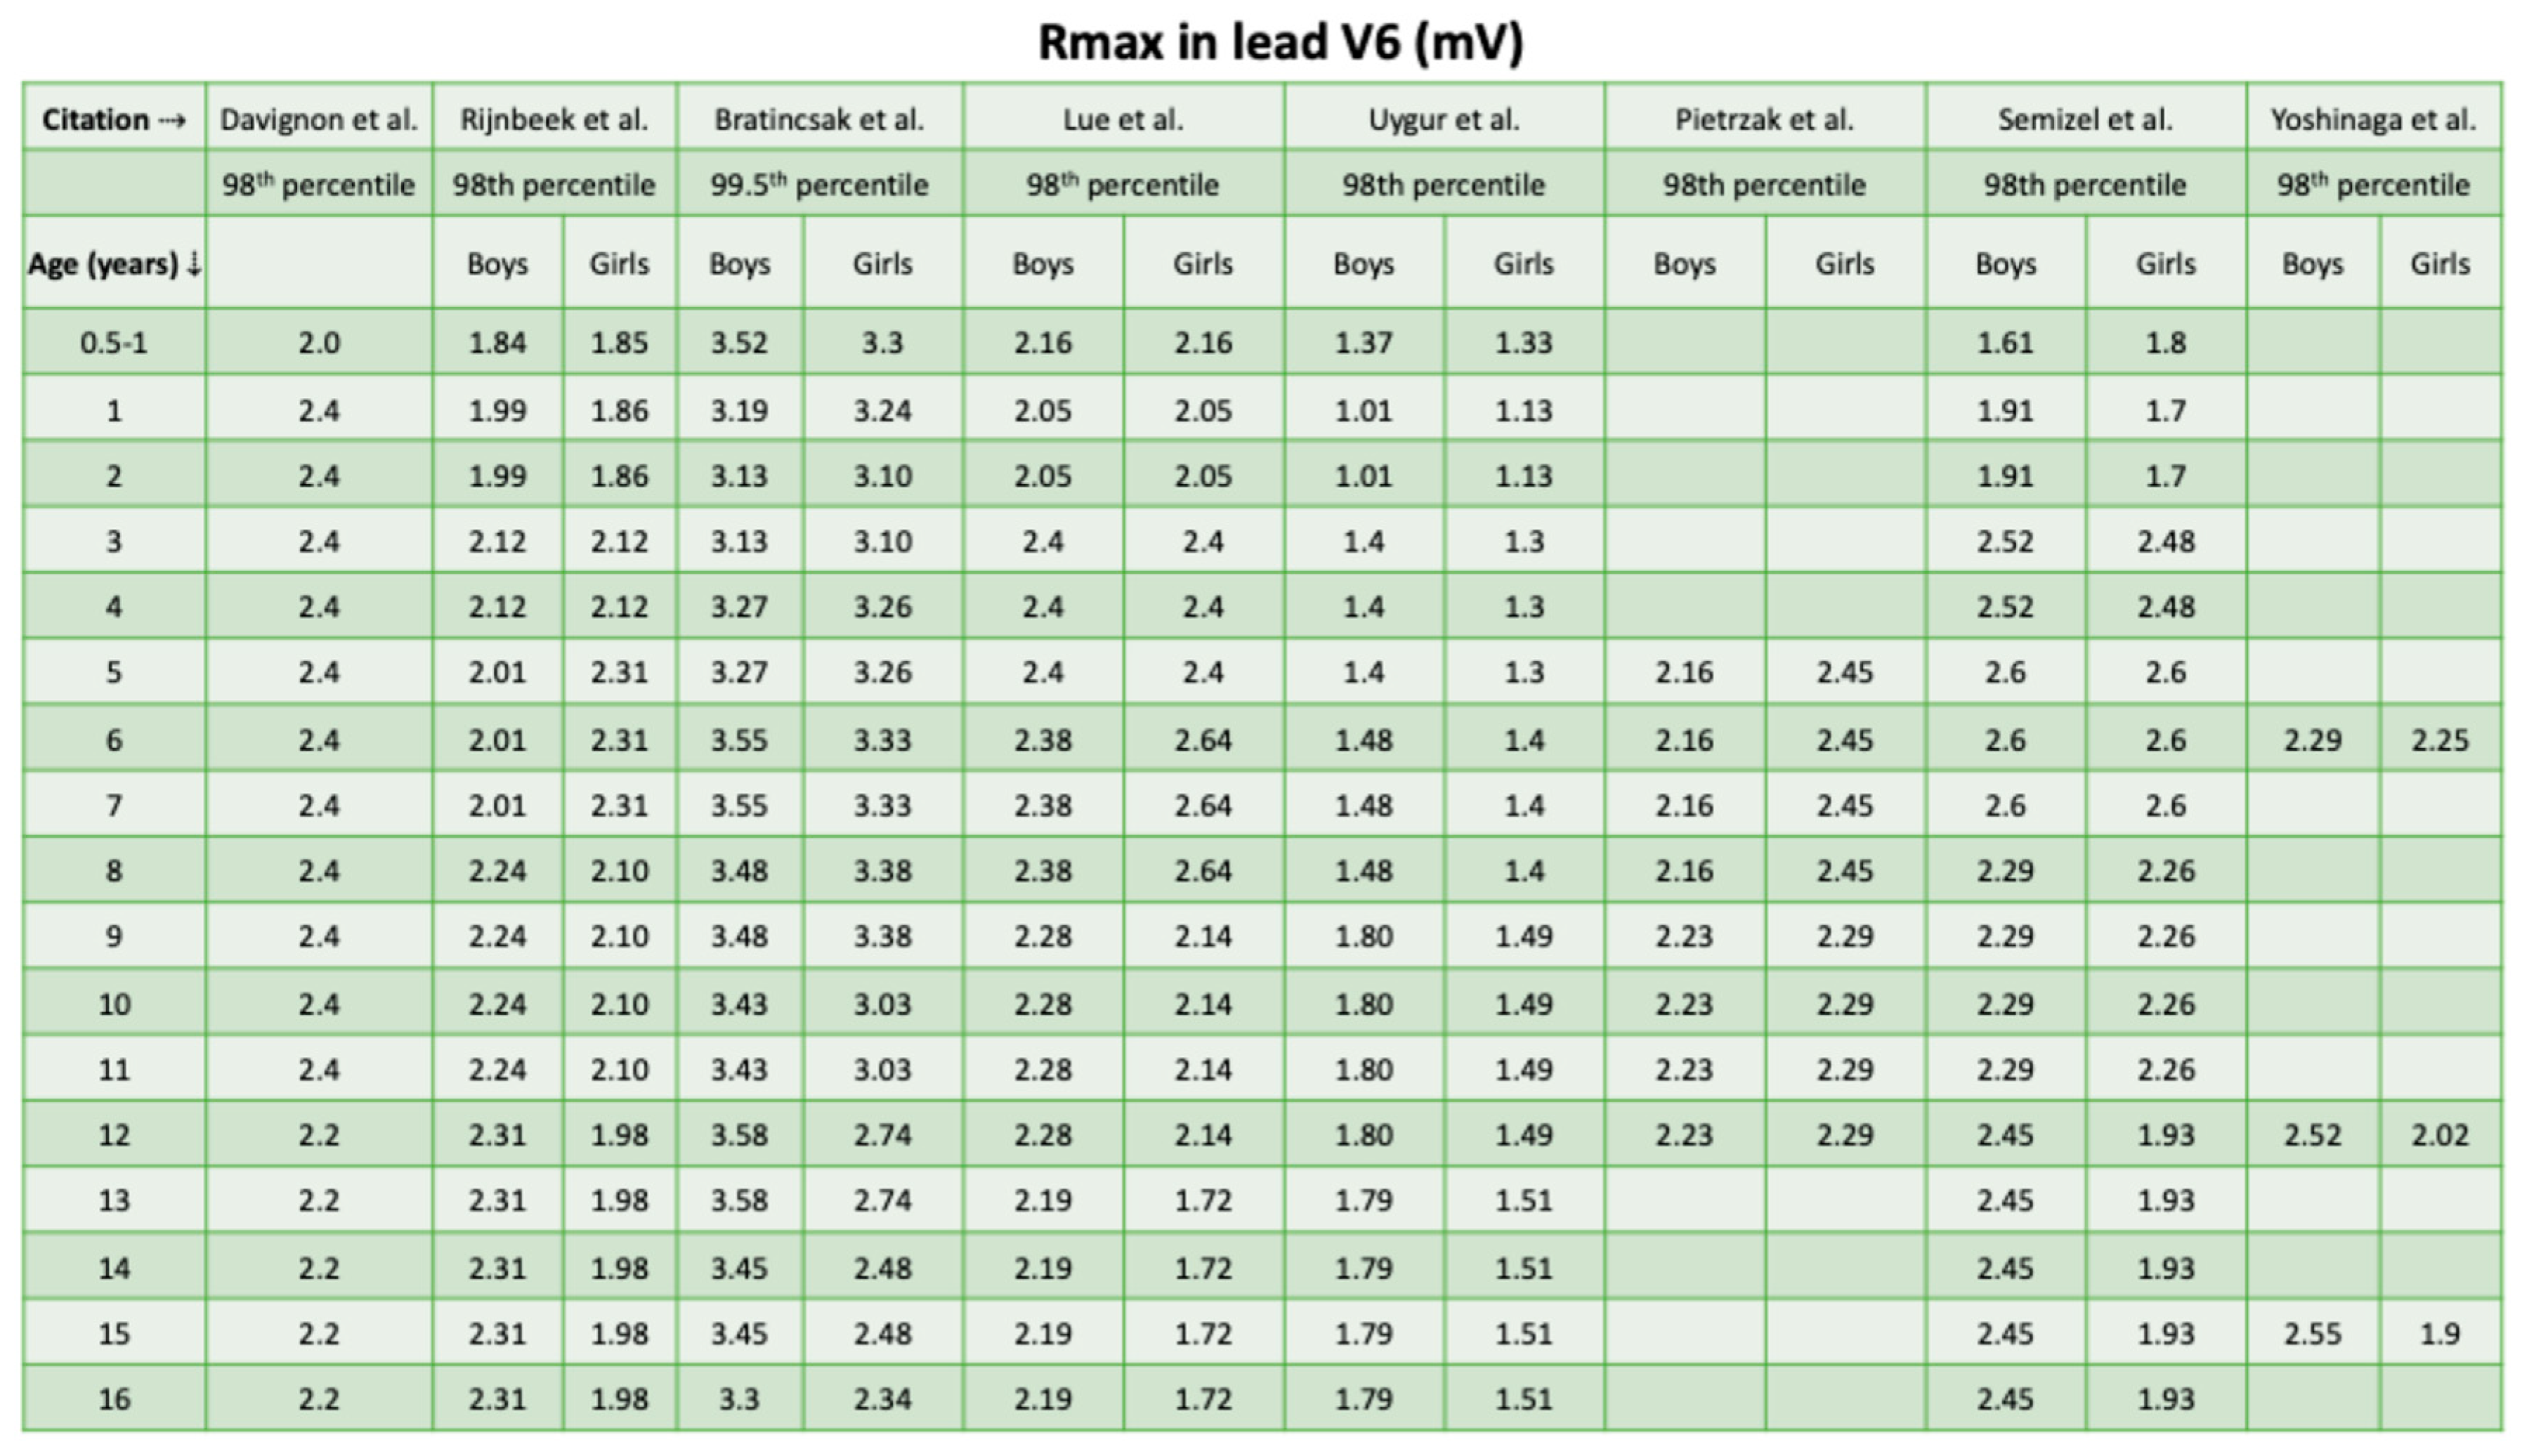
As the detection of LVH as a primary target of preparticipation screening is based on detection of amplitude values exceeding the upper limit of normal, the following tables summarize the upper normal limits reported in all available studies. Across the reviewed studies, R-wave amplitudes in lead V6 demonstrated a clear age-related pattern, characterized by interstudy differences in absolute amplitude values, which were more pronounced than sex-related differences (Table 1 and Figure 1). In infancy (0.5-1year), reported median or mean R-wave amplitudes ranged from 0.5 to 1.6 mV in both boys and girls, depending on the study and measurement approach. By early childhood, values increased modestly and typically clustered between 1.1 and 1.5. From approximately 3-7 years of age onward, most studies reported relatively stable amplitudes, commonly ranging between 1.3 and 1.8 mV in boys and 1.3 and 1.7mV in girls. In older children (8-12 years), amplitudes remained in a similar range for most studies. In adolescence (13-16 years), no substantial further increase in R-wave amplitude was observed.
Table 1.
Cross-study comparison of pediatric upper reference values of R-wave amplitude in lead V6.
 |
|---|
Reported upper reference values are presented as mean + 2 SD (parametric data) or IQR-based cut-off (non-parametric data), which correspond to different distribution percentiles (98th or 99.5th) depending on the original study [6,7,14,17,19,21,22,24]. Values are shown for descriptive comparison only and should not be interpreted as pooled normative reference standards.
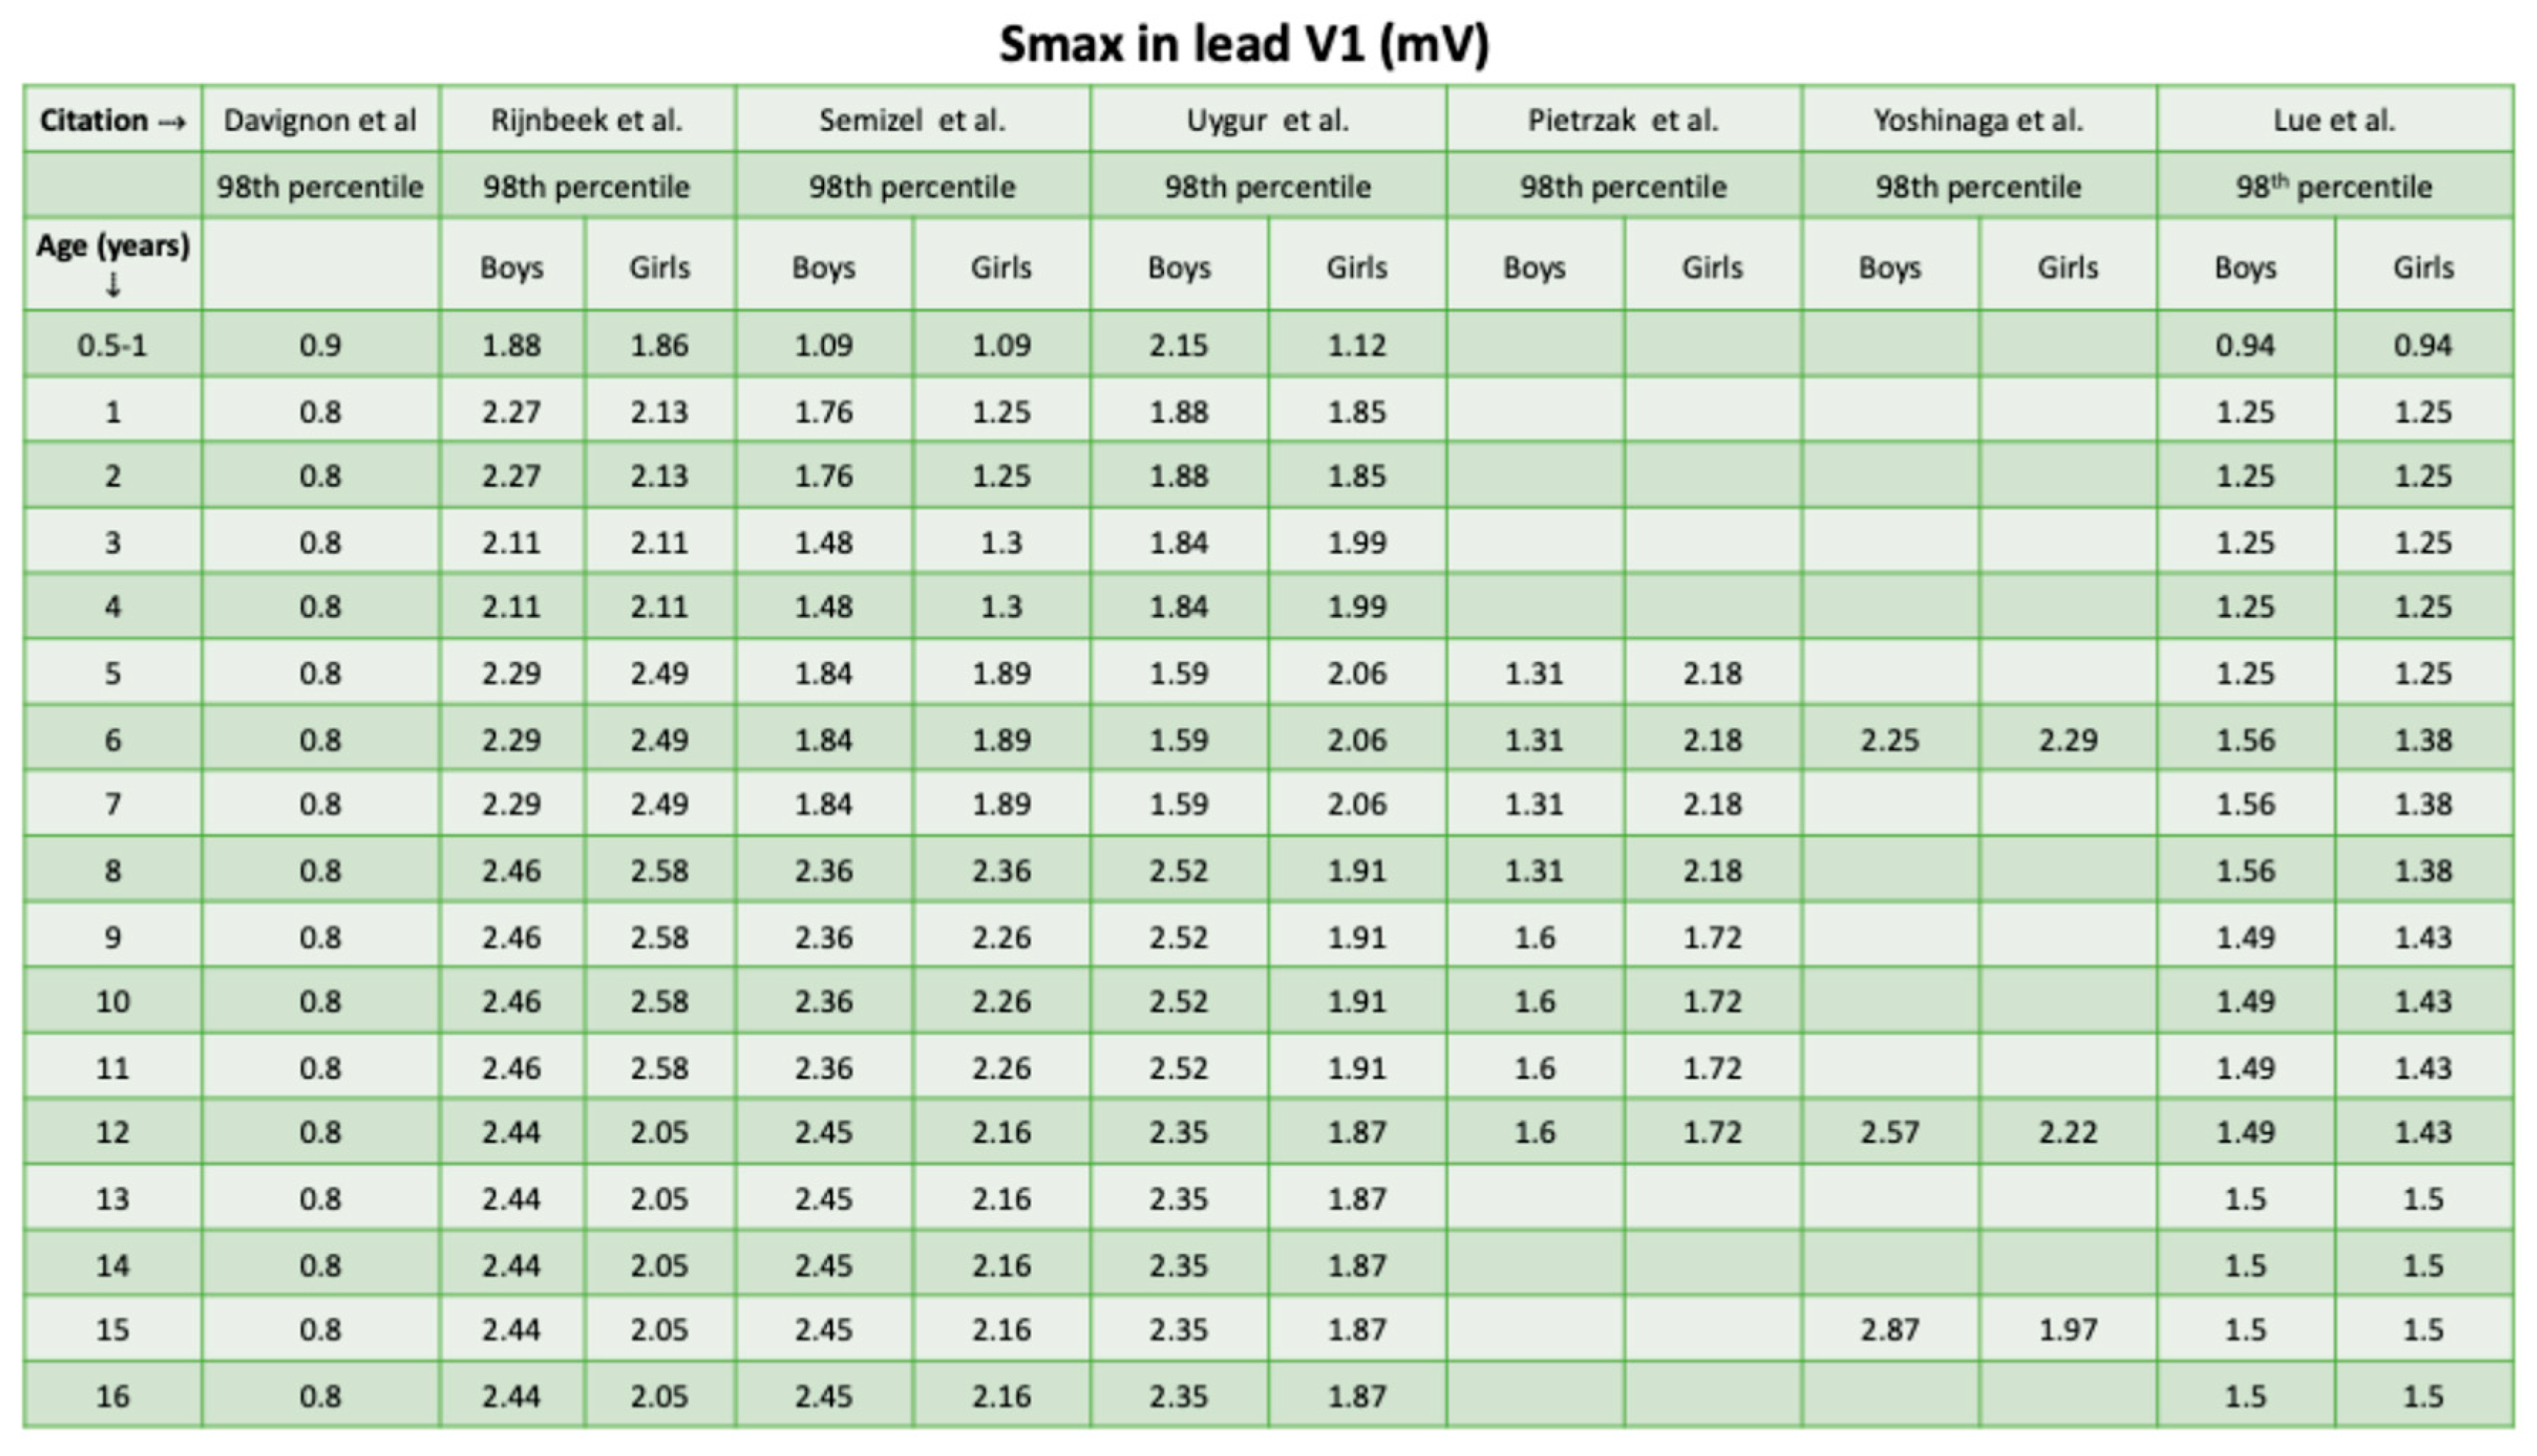
S-wave amplitudes exhibited greater interstudy variability than R-wave amplitudes, reflecting differences in ECG acquisition techniques, correction formulas and population characteristics. Despite this dispersion in absolute values, a broadly consistent developmental pattern was observed across studies (Table 2 and Figure 2). S-wave amplitude increased during infancy and early childhood, reaching a plateau by mid-childhood, and remaining relatively stable through adolescence. Sex-related differences were minimal and inconsistently reported, with no uniform directional trend across age groups.
Table 2.
Cross-study comparison of pediatric upper reference values of S-wave amplitude in V1.
 |
|---|
3.3. Pre-Excitation Detection in Pediatric ECG
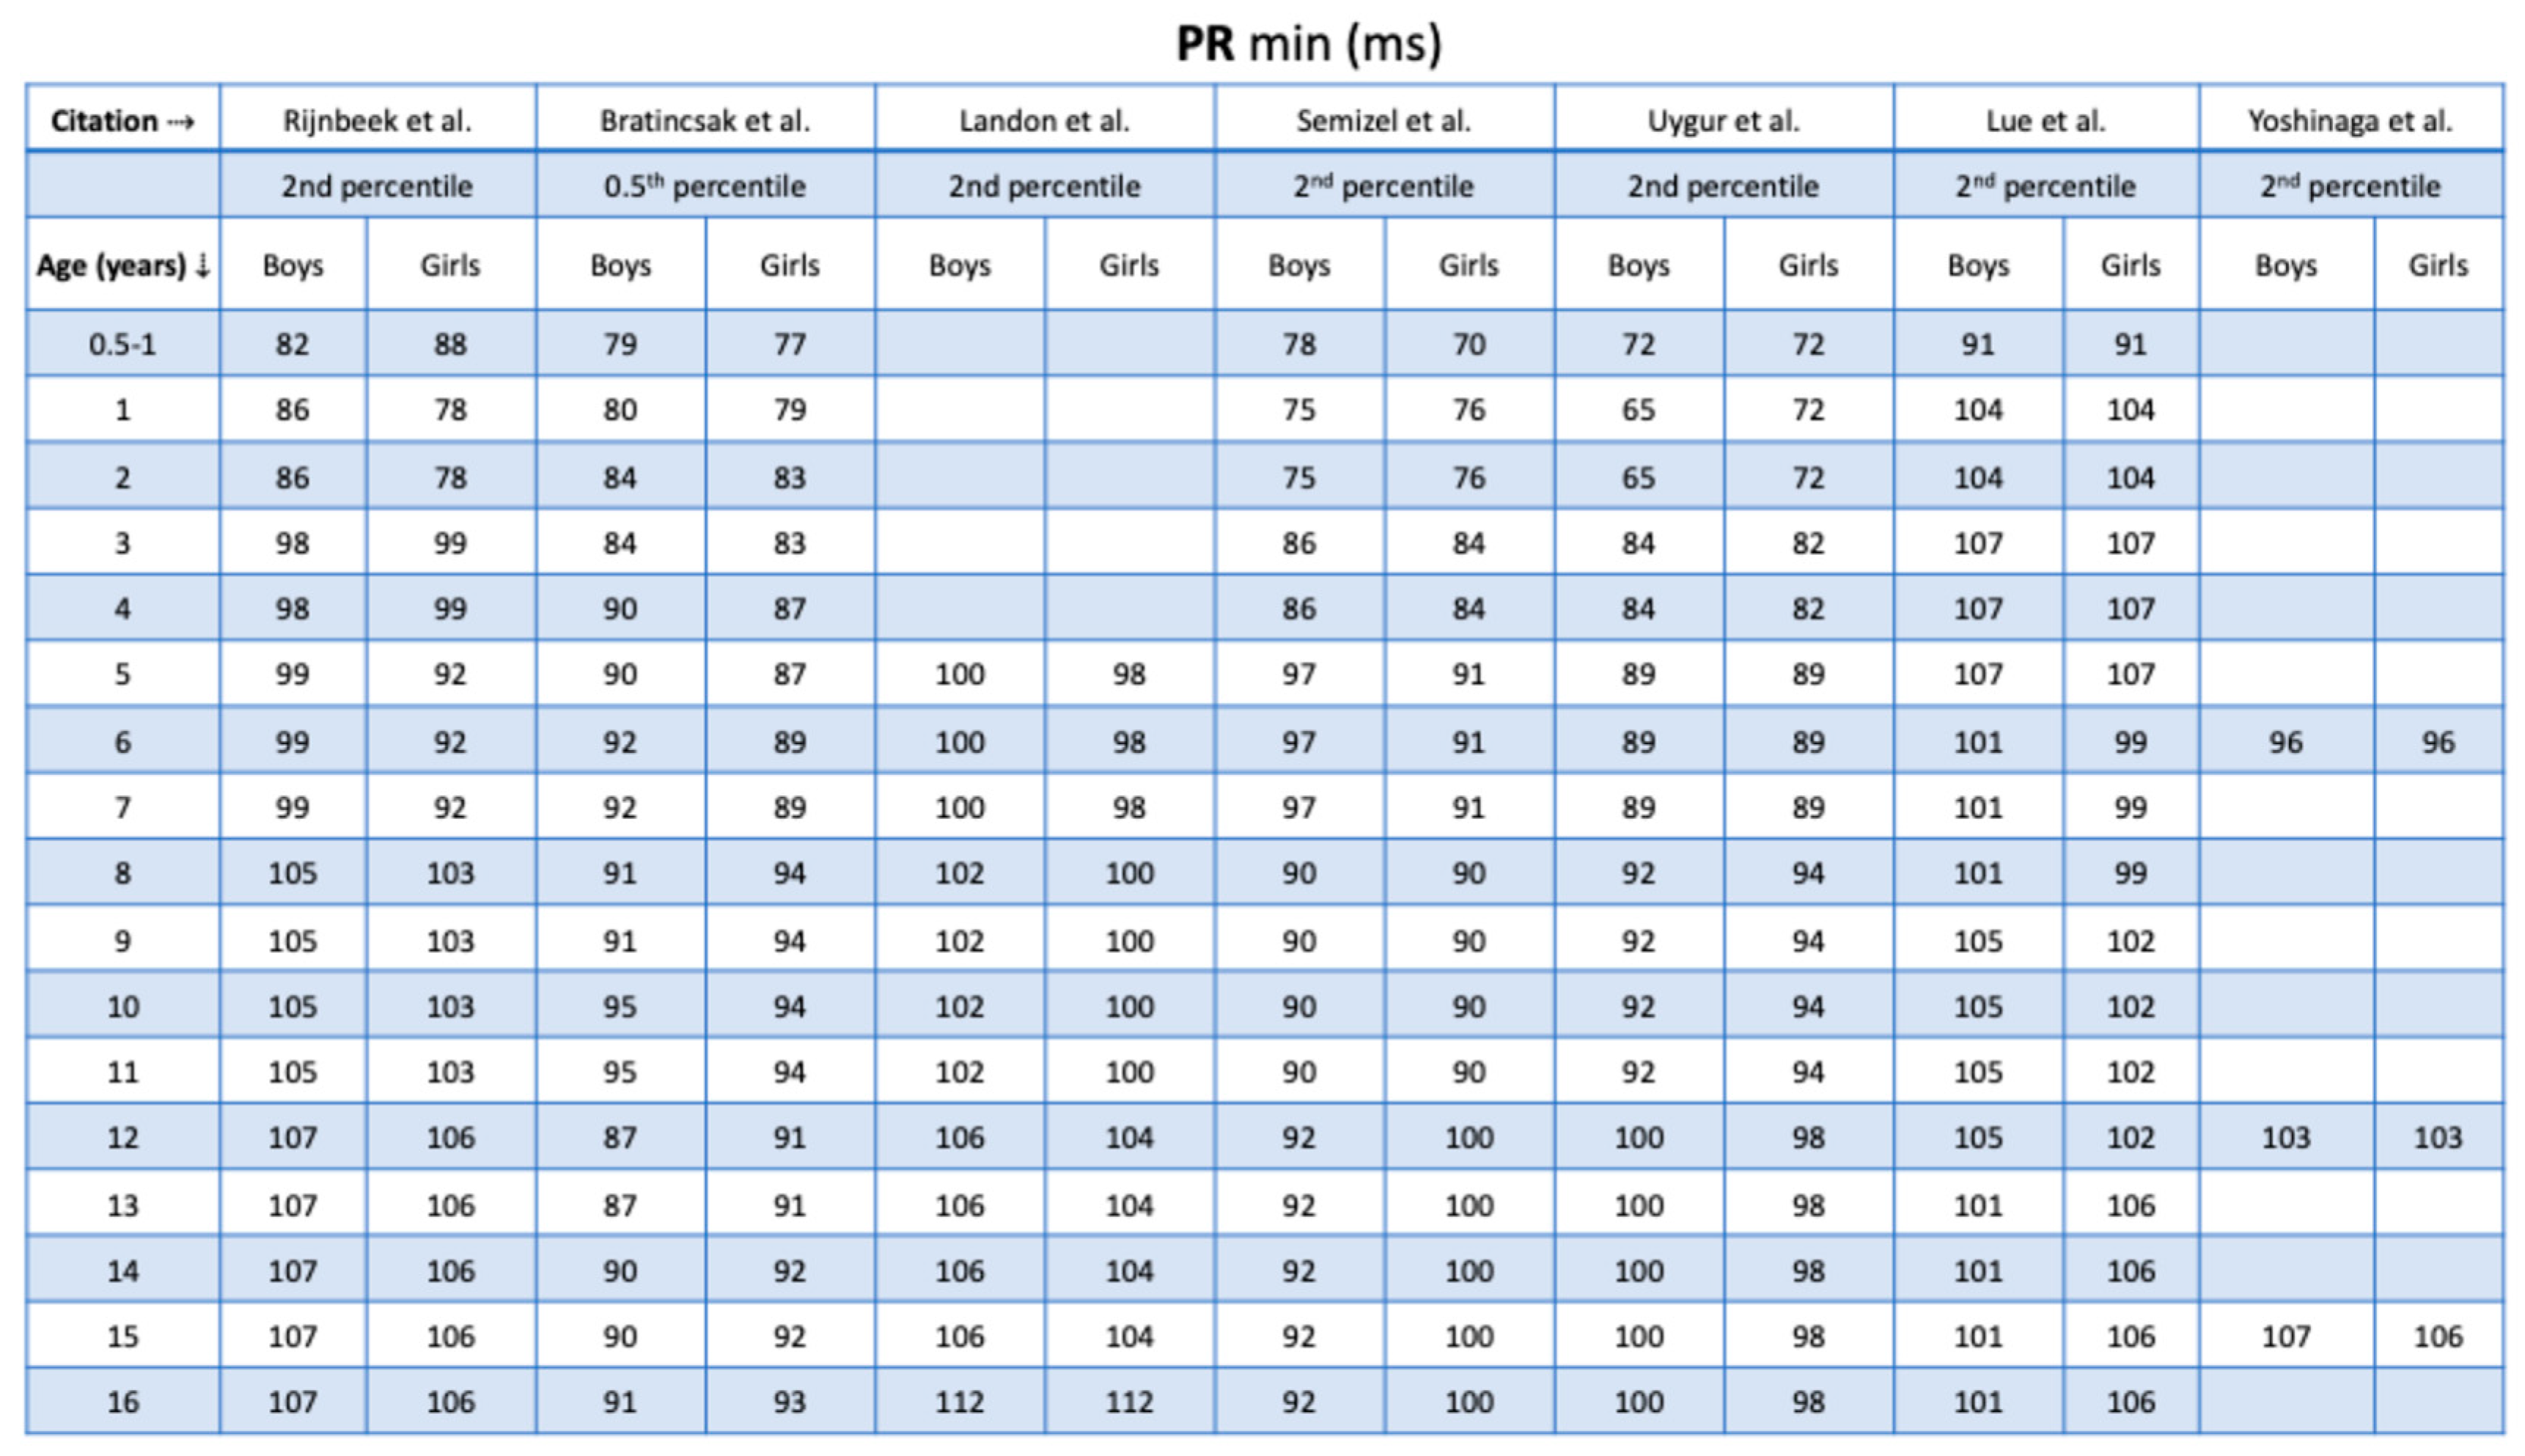
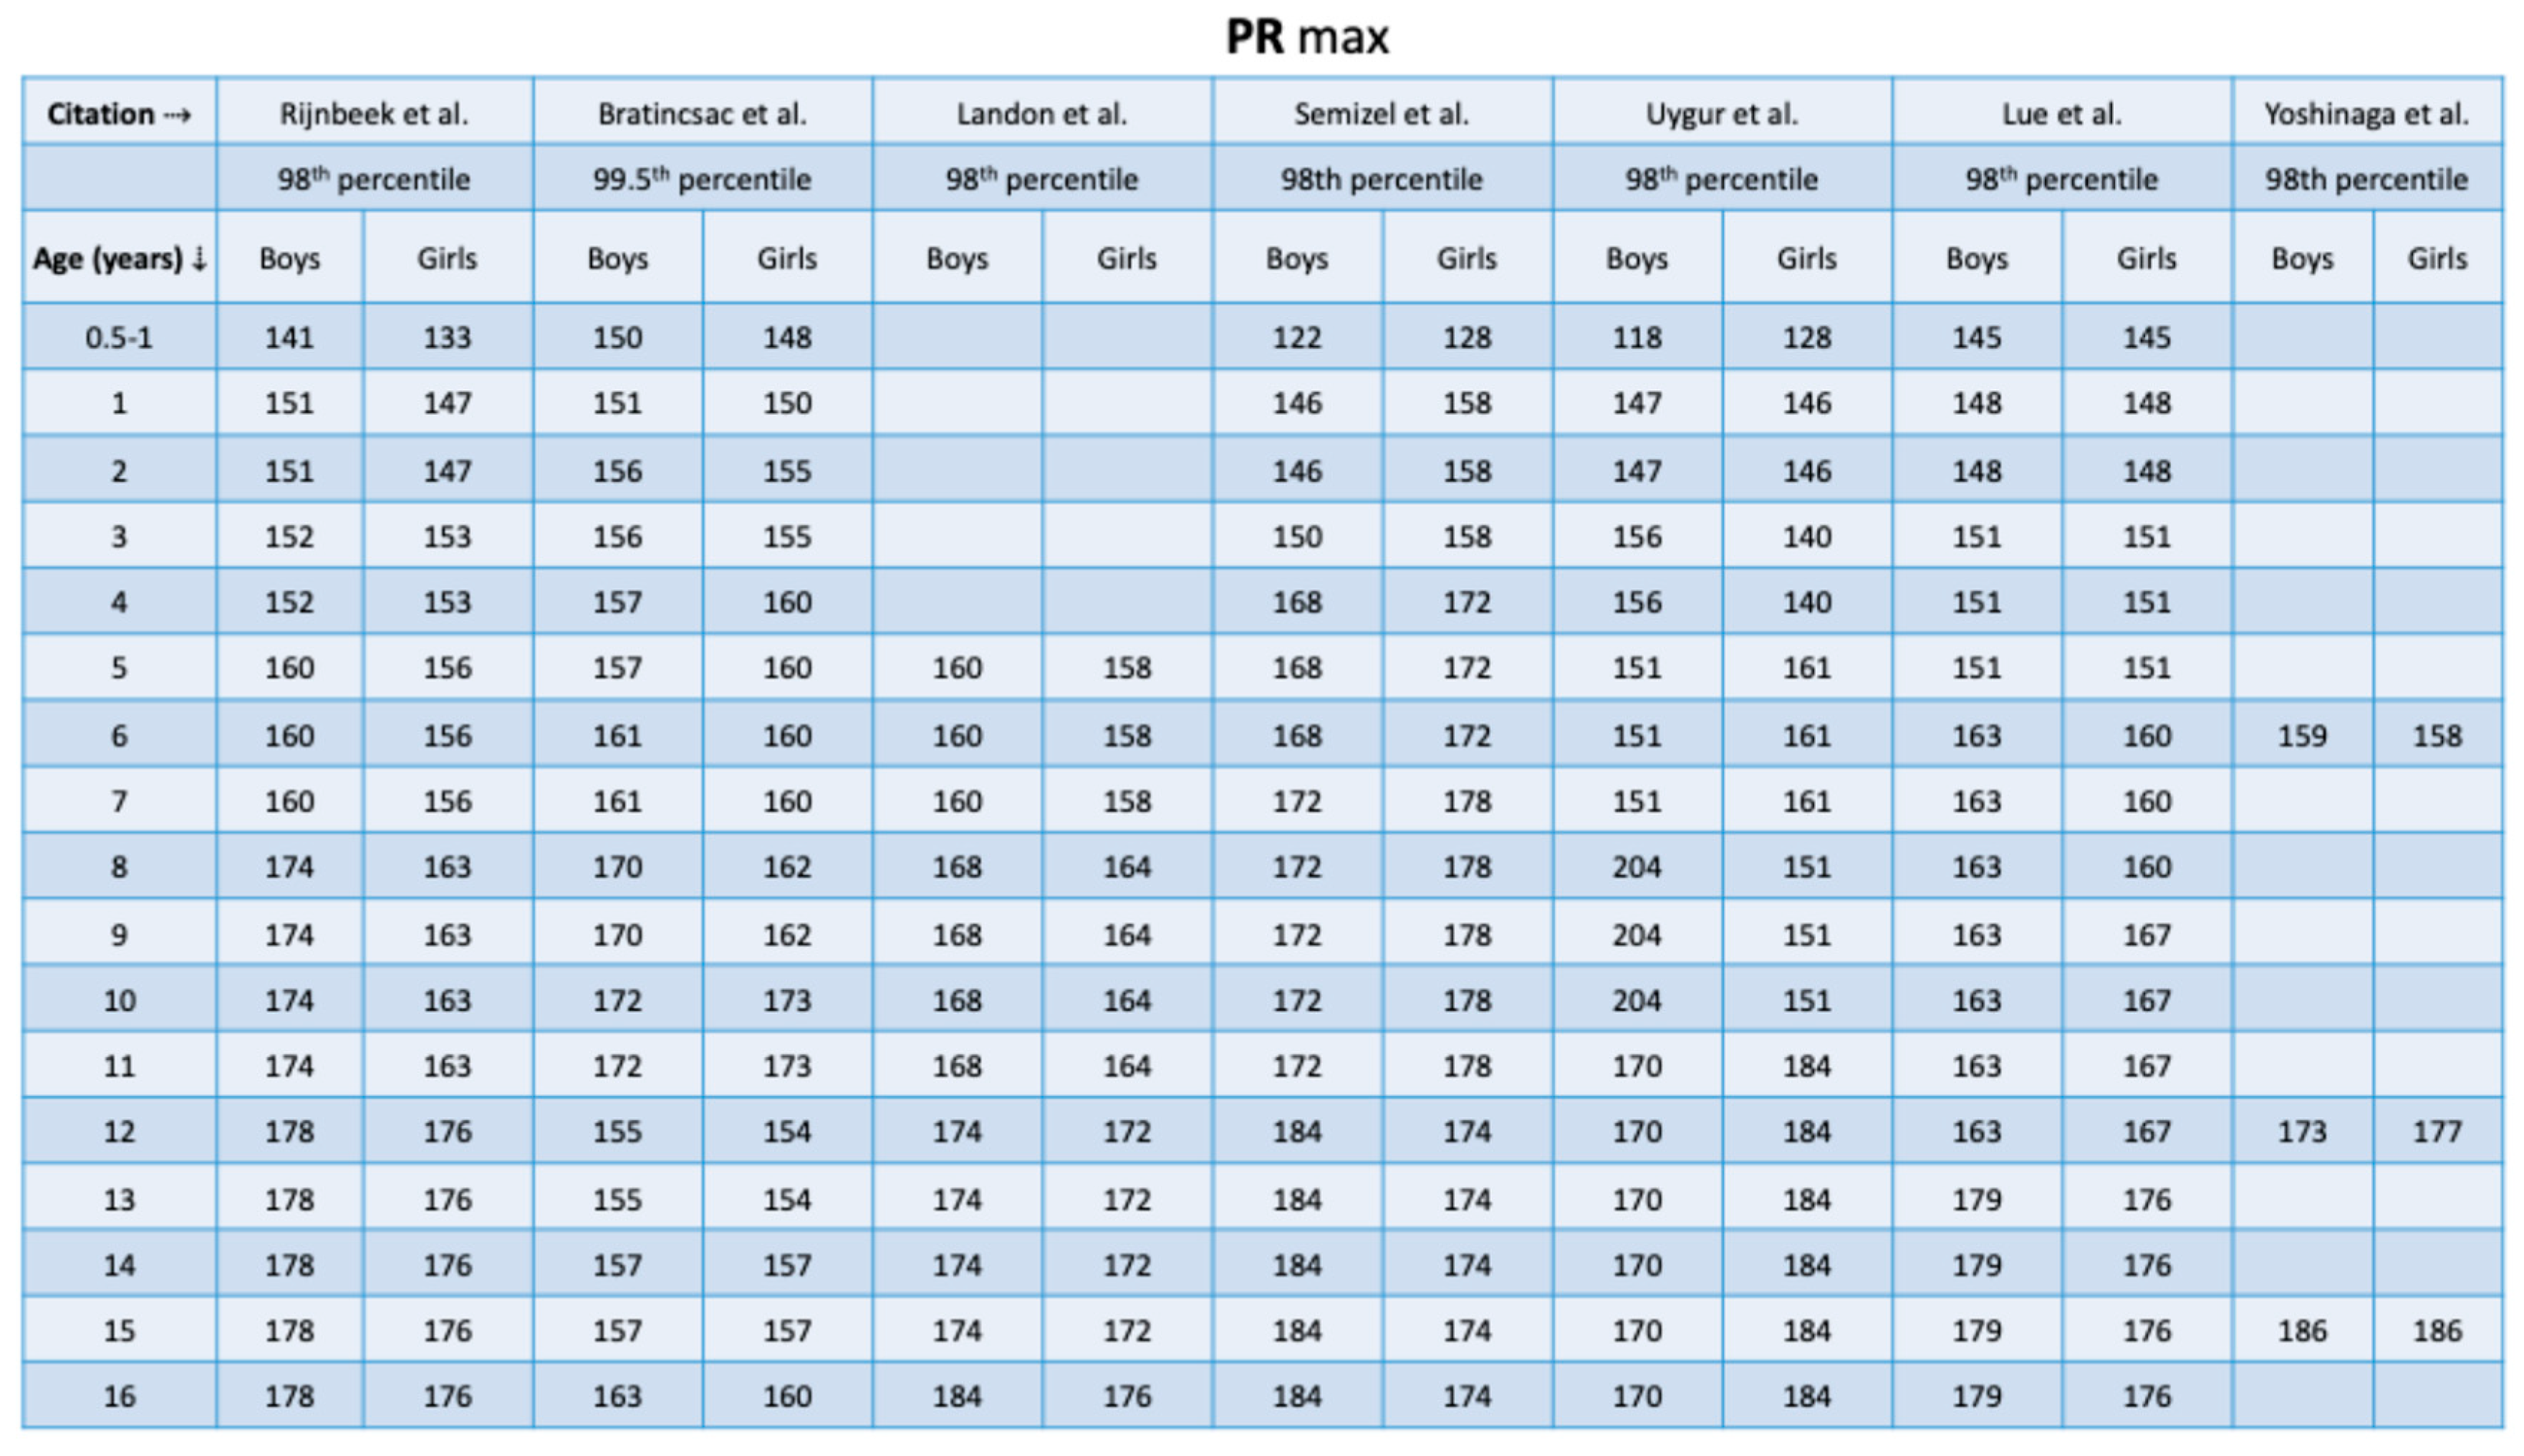
Across all included studies, both minimum and maximum PR interval values demonstrated a gradual, age-dependent increase from infancy through adolescence. The overall developmental trajectory for minimum (Table 3) and maximum PR intervals (Table 4) was consistent across cohorts. Absolute PR interval ranges differed modestly between studies, but age-related trends were uniform. Sex-related differences in PR interval duration were minimal and generally within only a few milliseconds, with most studies reporting overlapping ranges for boys and girls across all age groups.
Table 3.
Comparative Lower Reference Values of the PR intervals in Children and Adolescents.
 |
|---|
Table 4.
Comparative Upper Reference Values of the PR intervals in Children and Adolescents.
 |
|---|
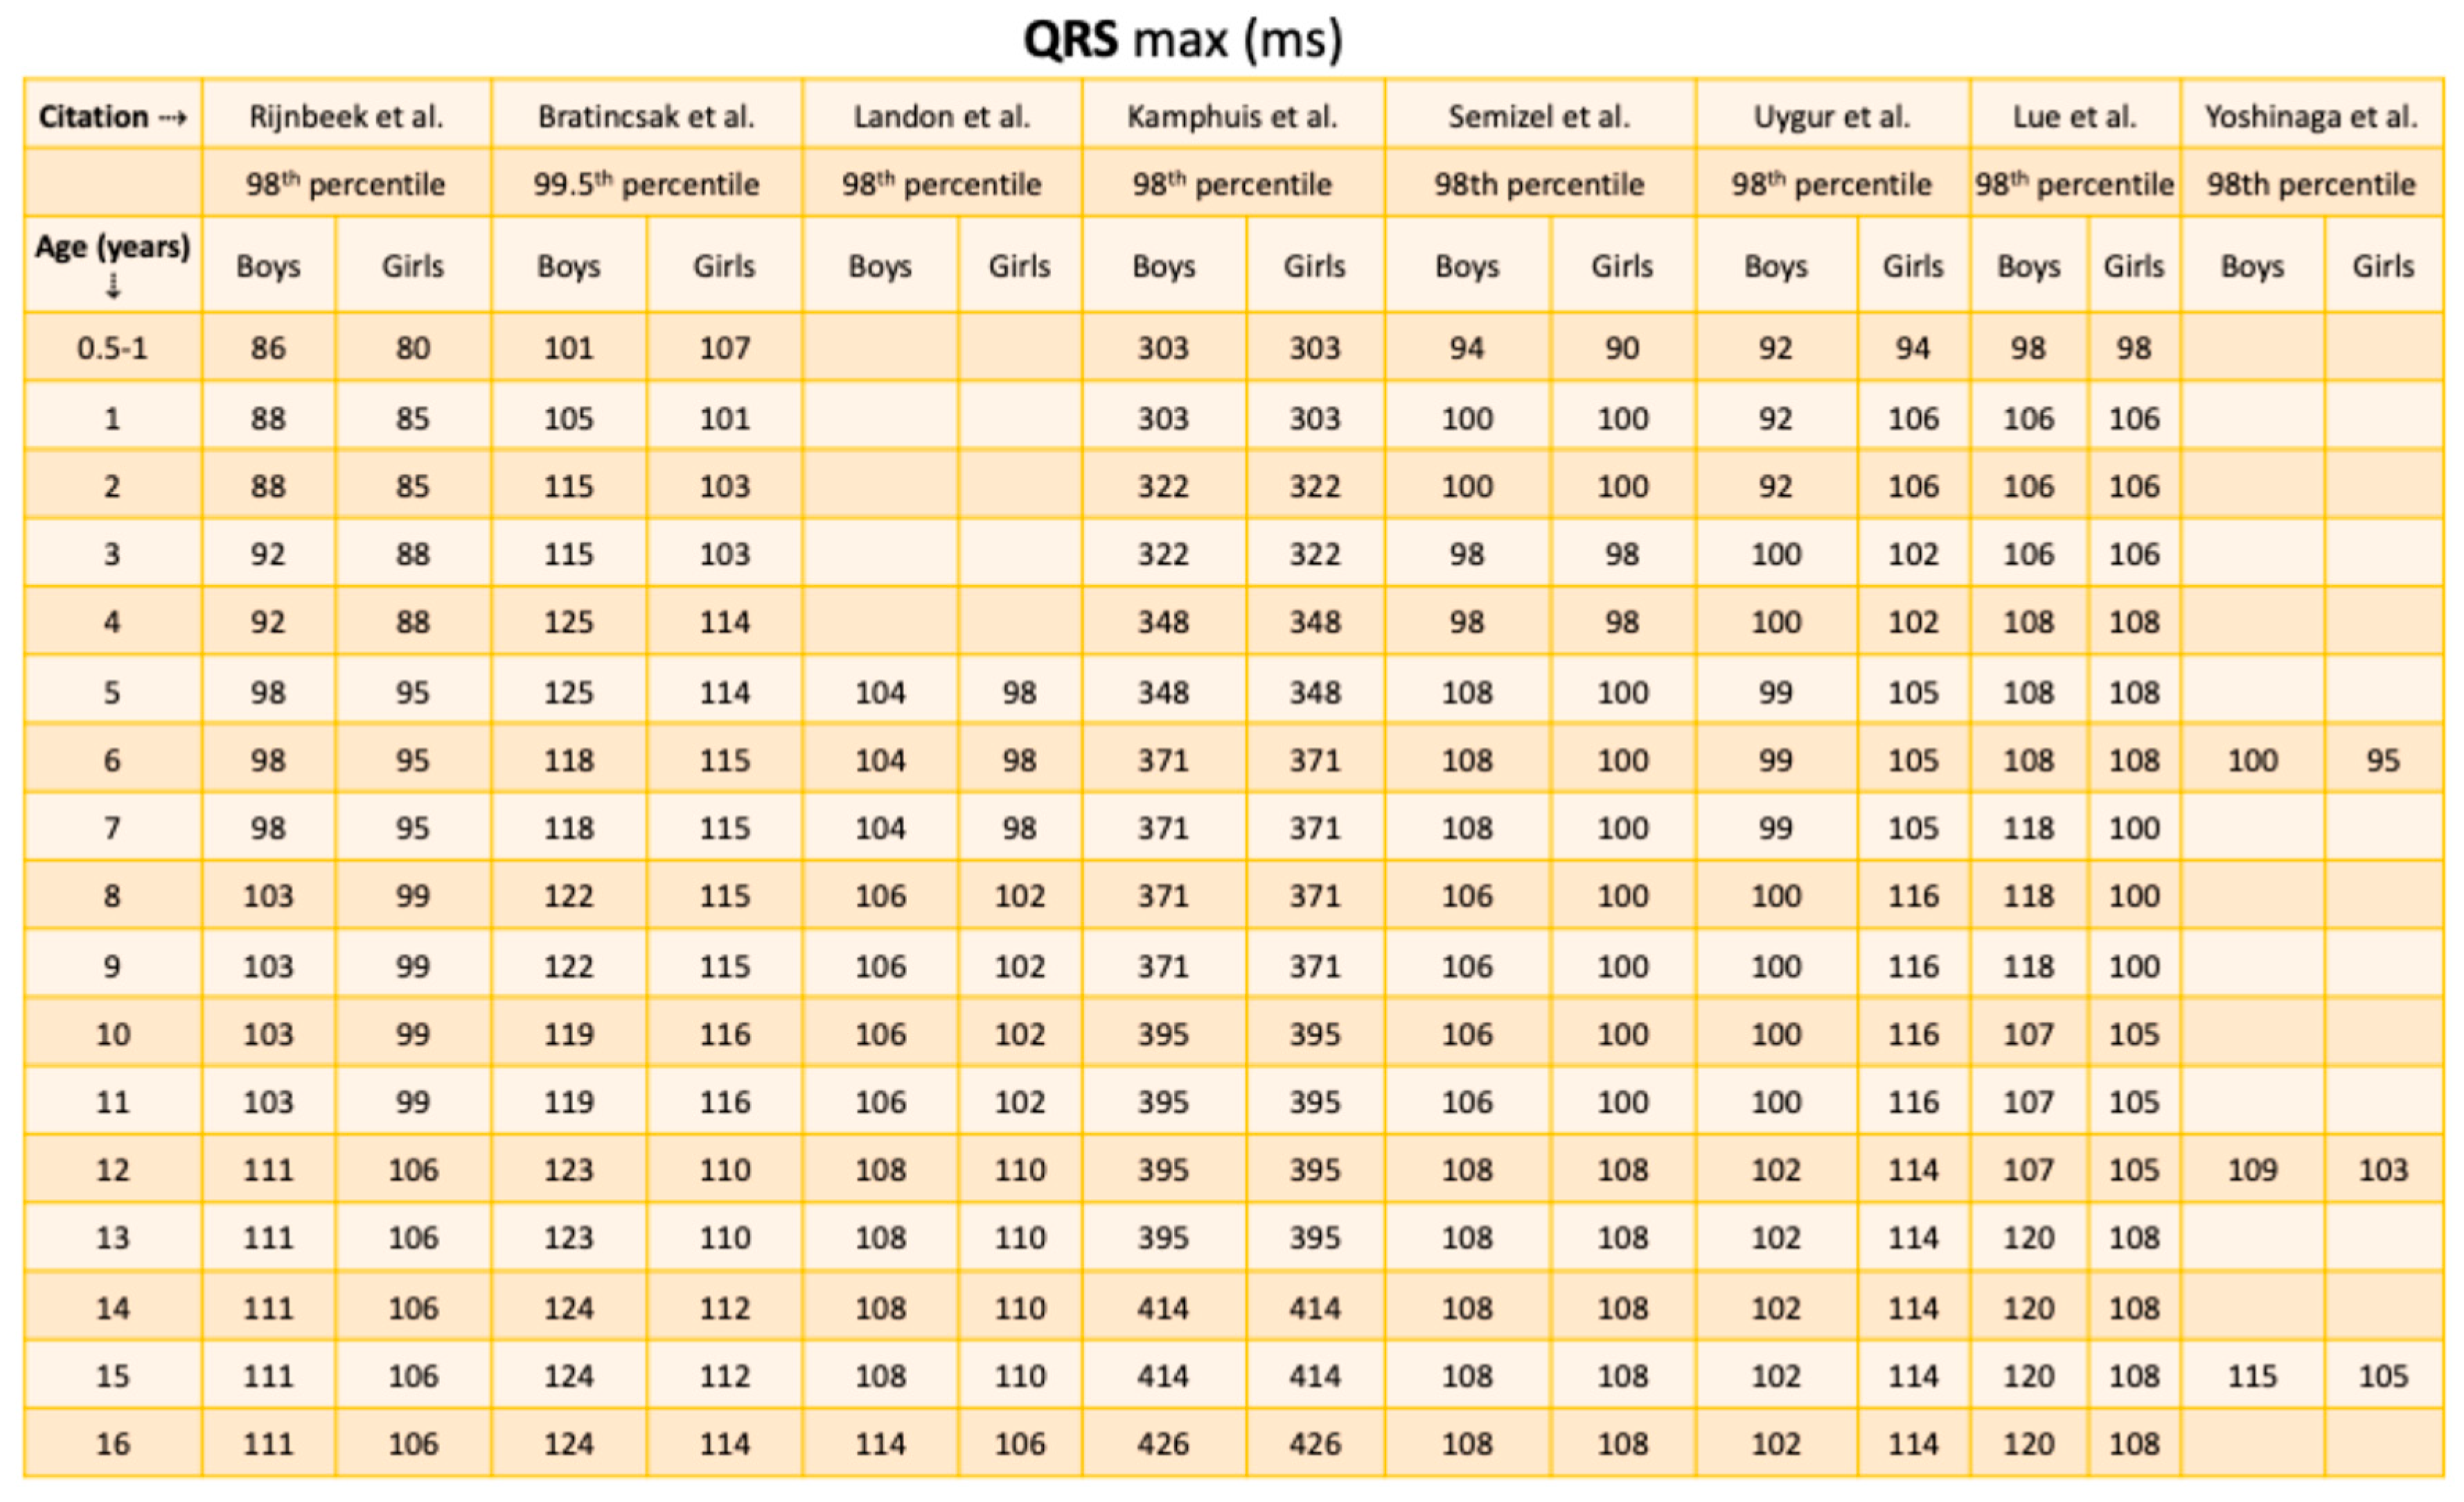
The reported upper limits of QRS duration increased progressively with age across all studies. Compared with other ECG intervals, QRS duration demonstrated greater interstudy variability, particularly between studies reporting means with standard deviations and those reporting medians with interquartile ranges. Sex-related differences were generally minimal in early childhood but became more apparent in adolescence in some cohorts, though absolute differences remained modest (Table 5). Variability in reported values was influenced by differences in ECG acquisition methods, signal filtering, and population characteristics.
Table 5.
Upper reference values of QRS duration in Boys and Girls: Summary of Studies.
 |
|---|
3.4. LQT Detection in Pediatric ECG
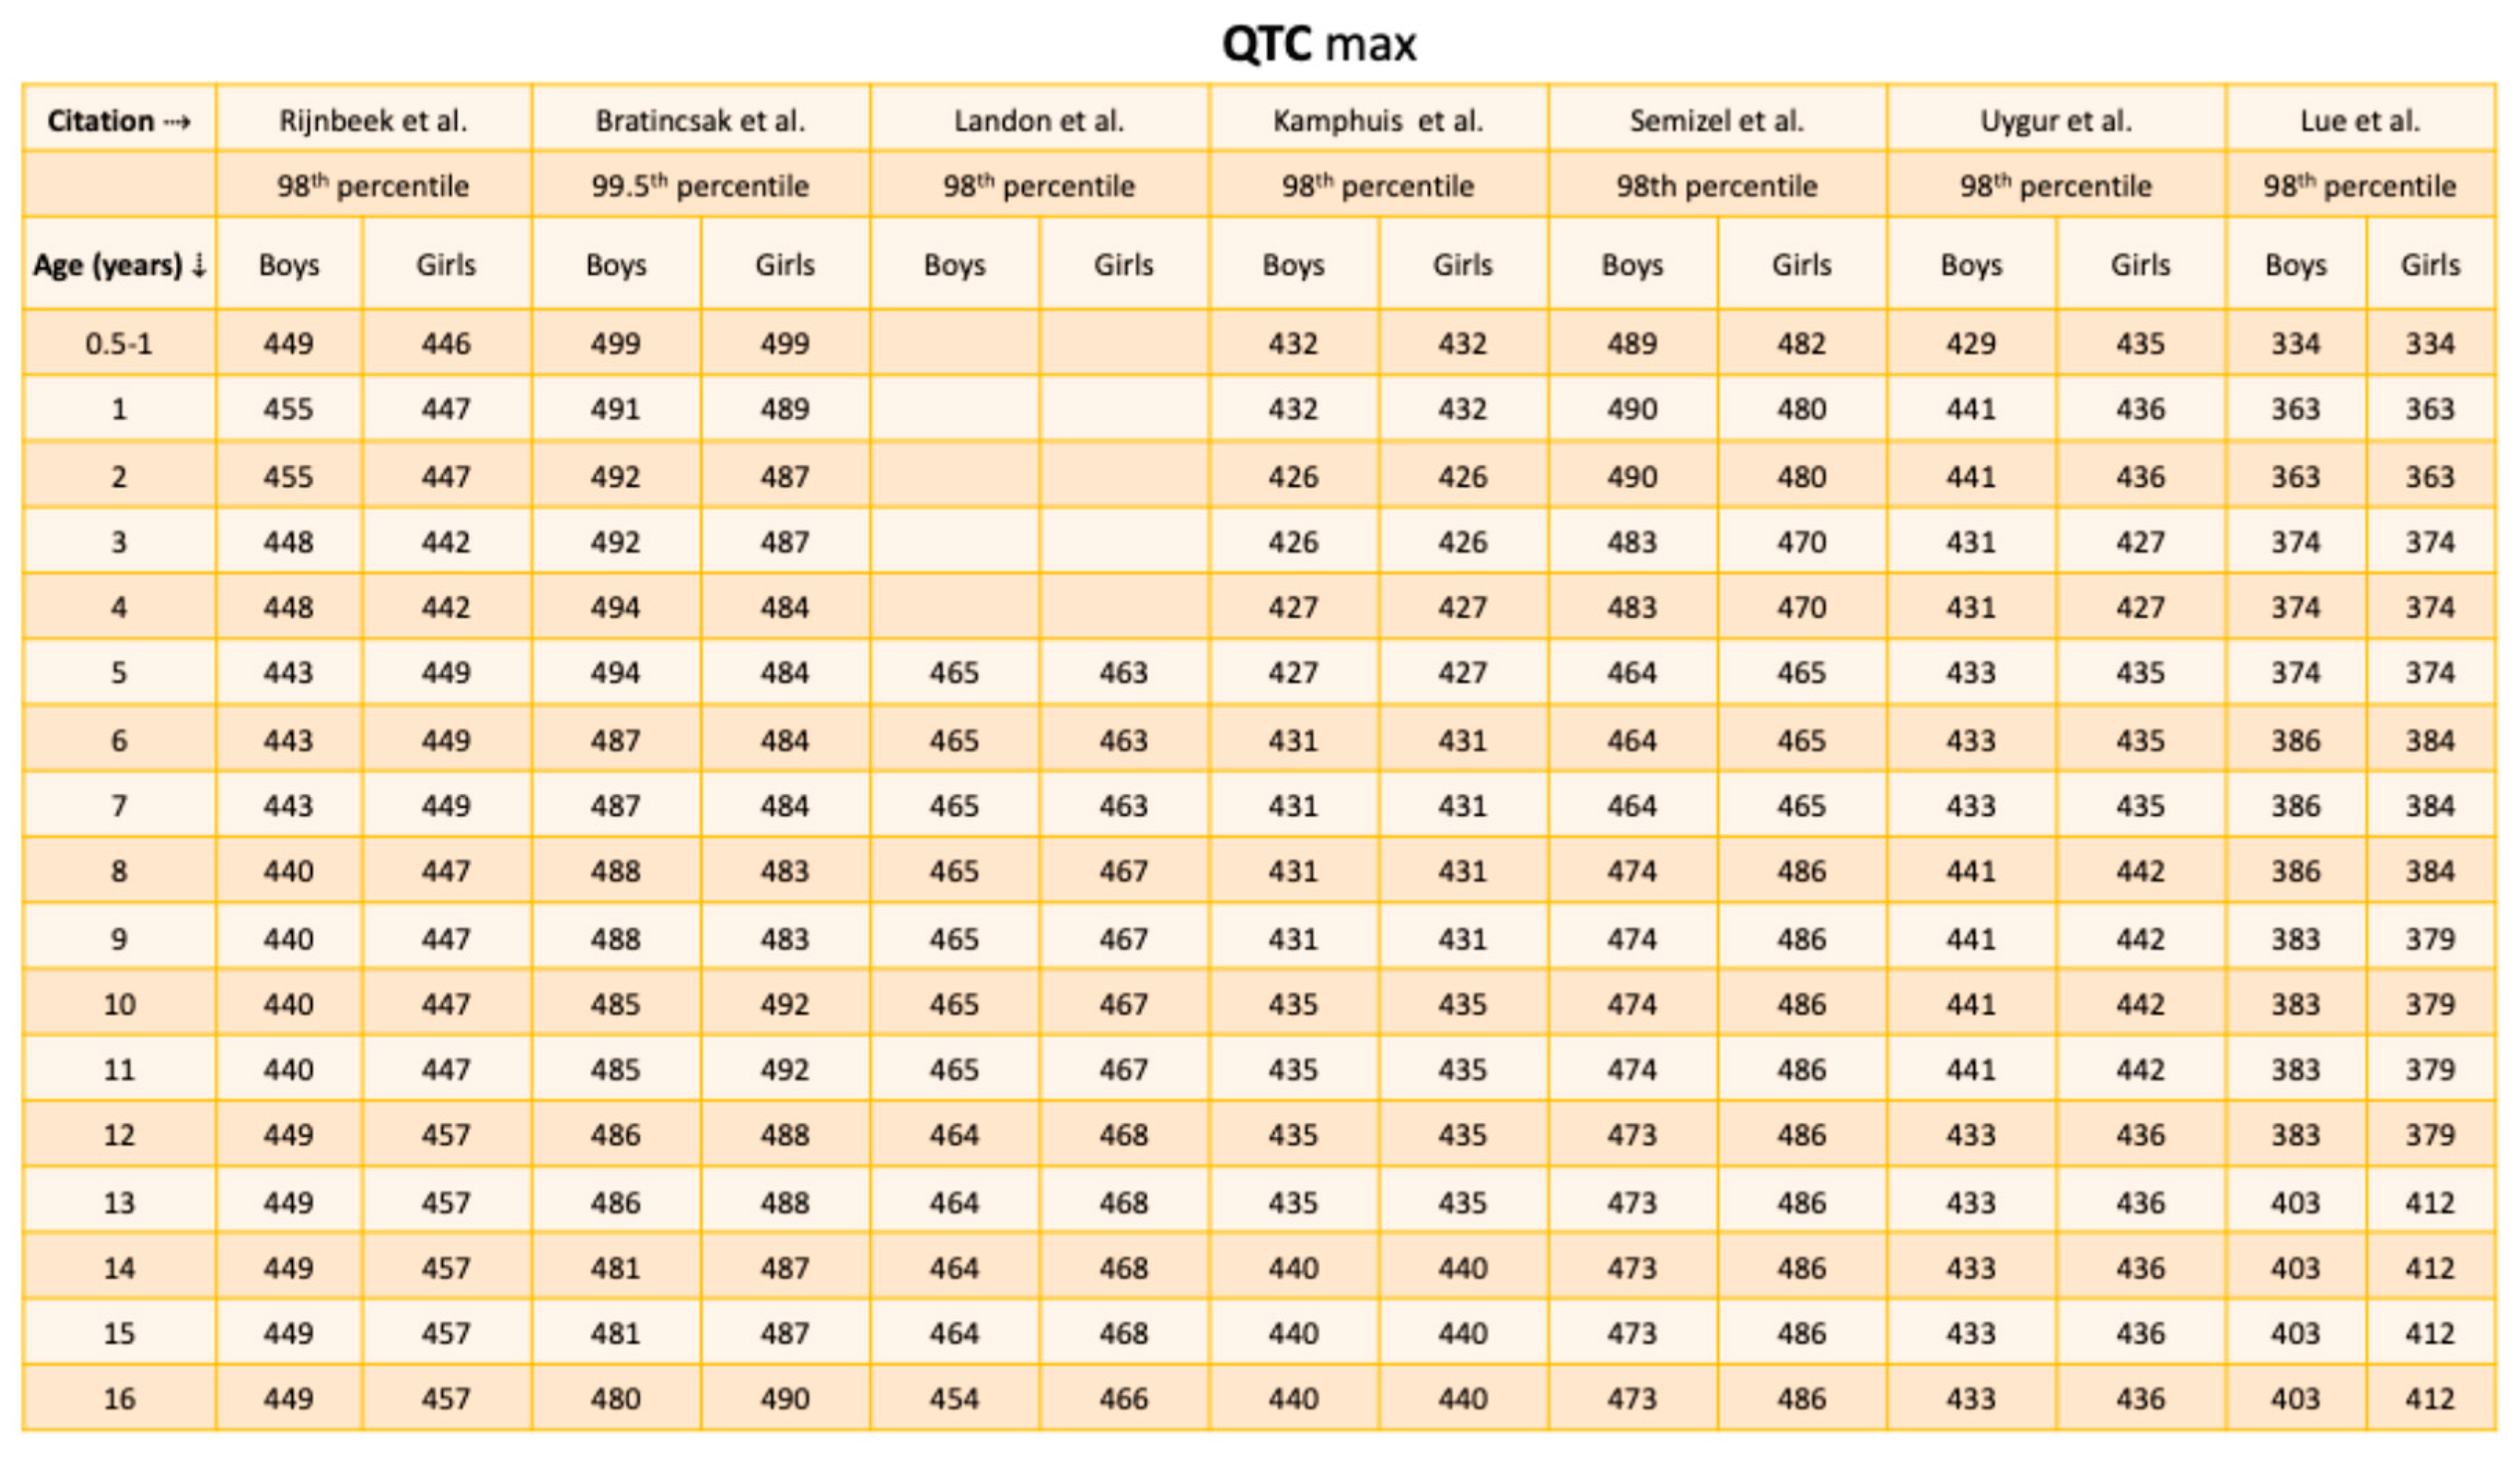
QTc highest values demonstrated relatively narrow ranges across age groups and studies, compared with amplitude-based ECG parameters. Overall, QTc values remained relatively stable from infancy through adolescence, with no marked age-dependent increase (Table 6). Despite differences in methodology, the overall range of values was between 430 and 495 ms across all age groups and studies. Sex-related differences were minimal in early childhood, with some studies reporting slightly longer QTc values in girls during later childhood and adolescence, although these differences were not consistently observed across cohorts.
Table 6.
Pediatric QTc upper reference values by age and sex from multiple studies.
 |
|---|
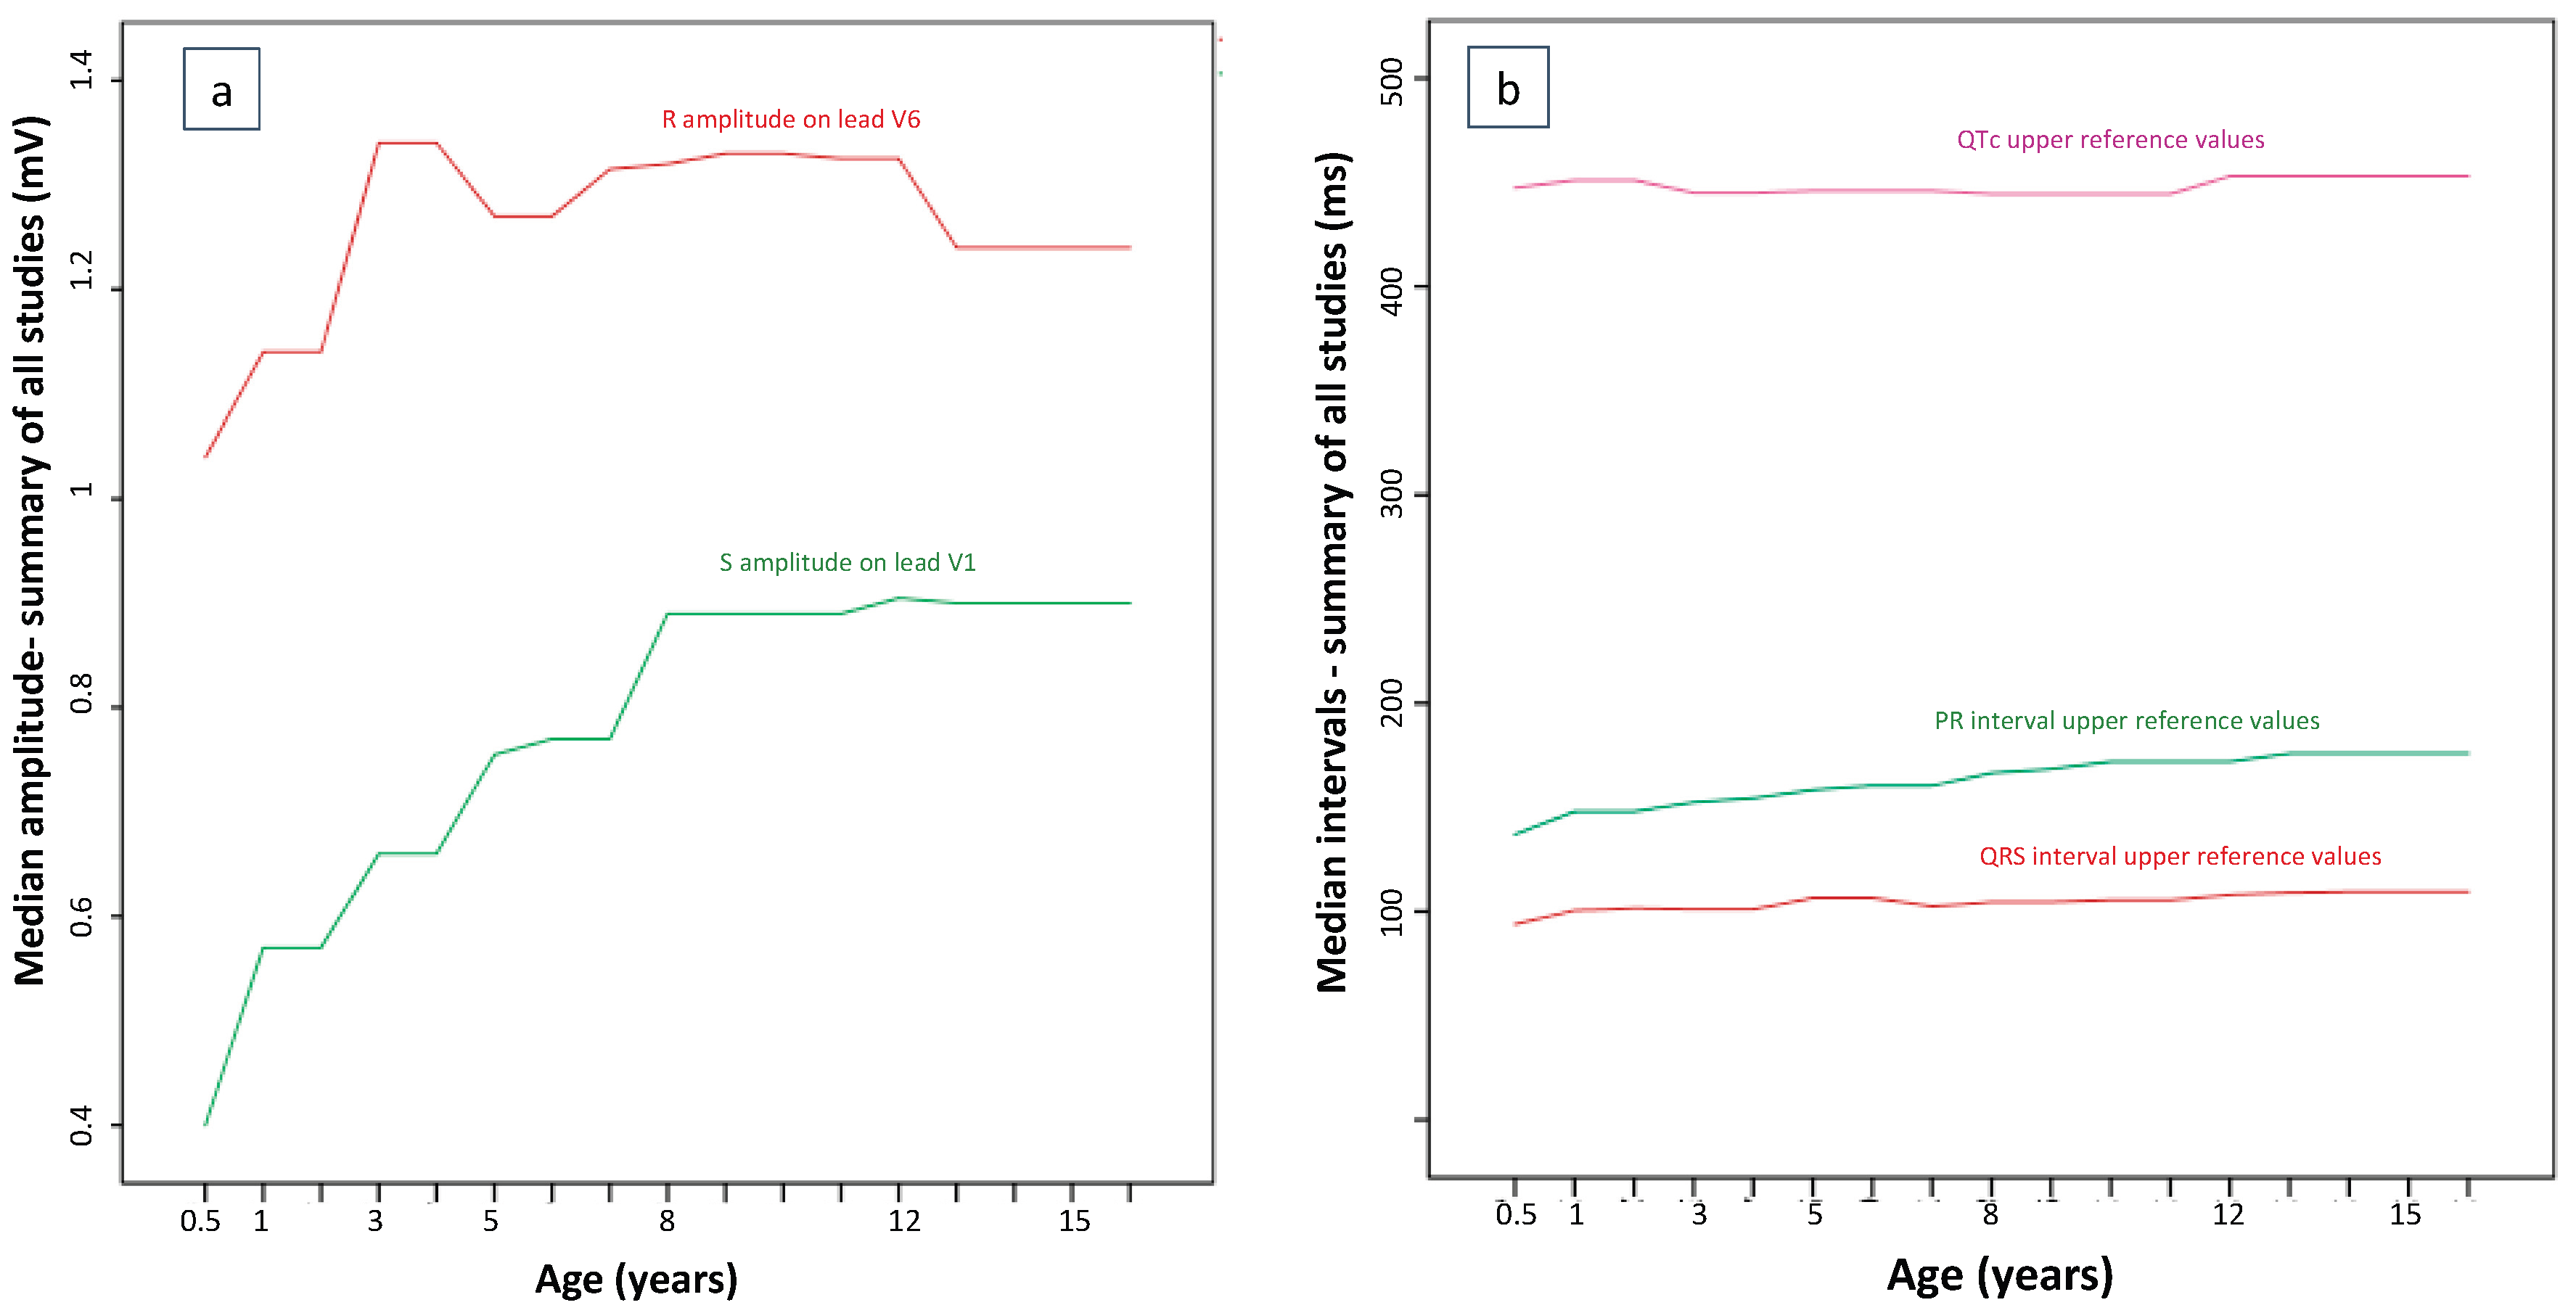
For a rough visualization of developmental trends, age-specific ECG parameters were summarized using the median of reported central tendency measures across all included studies (Figure 3).
4. Discussion
This narrative review summarizes contemporary studies reporting normative ECG values in healthy pediatric populations. It highlights the parameters most used and the complexity of assessing left ventricular hypertrophy (LVH) in children using electrocardiographic criteria. By comparing reference values across various studies and methodologies, this review illustrates both the developmental trends of ECG parameters and the substantial variability that complicates clinical interpretation. Historically, normative pediatric ECG values were derived from a few landmark studies, which have probable limitations (sampling rates and demographic differences) that might affect generalizability to current multi-ethnic pediatric populations. More recent studies are based on digital technologies and larger sample sizes to improve measurement consistency and update reference ranges [5].
A consistent finding across studies is the important influence of physiological maturation on pediatric ECG parameters. Infants typically show higher precordial amplitudes due to relatively right-dominant circulation, thinner chest walls, and different myocardial properties [25]. As children grow, ECG parameters change with growth, chest-wall configuration, autonomic tone, and the transition from right to left- ventricular dominance [15,26,27]. These developmental changes affect QRS waves, axis orientation and precordial lead amplitudes, making the creation of fixed amplitude cut-offs across all pediatric ages a difficult task [28]. Sex-related differences were generally small during prepubertal years and became clearer in adolescence, probably reflecting hormonal secretion and autonomic nervous system activity alterations. Moreover, this observation in puberty seems to concern repolarization parameters rather than QRS amplitudes [29,30].
Despite differences in study design, measurement techniques, and populations, all ECG parameters showed certain age-dependent trends across studies. However, despite similar developmental patterns, ECG values vary considerably across studies. Amplitude-based parameters (R- and S-wave amplitudes) showed greater variability and seem to be prone to methodological differences, whereas variability was less important for duration intervals, such as QRS and PR, which might prove more reliable in pediatric ECG interpretation, although PR and QTc interval differences have been reported as significant [5,6,31,32]. QTc values showed relatively narrow ranges across age groups, even though formulas like Bazett may lead to overcorrection at higher heart rates. Several studies support the concurrent use of different correction methods [33,34]. Variability in ECG acquisition and methodological factors, including electrode placement, filtering, sampling rates, calibration, and manual versus automated measurement likely affect measured voltages and contribute to differences in reported normal values [32,35]. Population characteristics, such as ethnicity, body habitus, and athletic status also influence ECG amplitudes, creating systematic differences between studies. Older reference standards were derived from homogeneous populations and analog ECG systems with broader technical variability, whereas more recent studies use digital ECGs and include various populations, providing more standardized outputs [5,36]. As a result, older normative values may not fully align with contemporary data [35], but they are still frequently used in clinical guidelines.
Based on current literature, there are well-described age-related trends for amplitudes in precordial leads. This is reflected in ECG by relatively smaller R-waves and deeper S-waves in left precordial leads in early infancy compared to school age and adolescence [15]. The CHILDHEART study suggests alternative indices (e.g., R in lead I and V6) or age thresholds to perform better than traditional adult Sokolow-Lyon criteria [37]. The present review demonstrates that despite differences in reported R-wave amplitude in lead V6, the developmental trend is remarkably consistent across recent pediatric studies. All studies show increasing amplitudes during early childhood, followed by stabilization from mid-childhood through adolescence. The variability across studies may reflect population-level differences, variations in ECG equipment and calibration, electrode placement, or body habitus [38,39,40,41].
Developmental trends have also been reported with regard to QRS and QTc duration. In standard pediatric ECG interpretation studies, the upper limit of “normal” QRS duration is shorter in infants and increases with age [6,14,19]. A recent dataset of Japanese healthy children reported QRS means that increase with age, e.g., for 6-year-olds mean QRS was ~ 85ms (upper ~ 100ms), and for 15-year-olds mean QRS was ~ 99ms [21]. A recent study of 1,531 healthy children/adolescents (0–17 years) determined QTc distribution. The authors reported that a small percentage exceeded standard QTc thresholds (e.g., > 440, 460, 480ms), while the main sex differences were reported in adolescence, with girls having longer QTc than boys (mean ~ 454.1±15.2 ms vs ~ 438.3±8.4ms respectively, p < 0.05) [42]. Another recent study reported that QTc varied by sex and race in older age groups [5].
A recent report indicated that ECG might be a statistically acceptable mass screening test for detecting LVH, LQT and WPW syndrome in children [43]. However, although ECG is widely accessible, its diagnostic performance for detecting LVH in children, even when interpreted with age-adapted criteria, seems to be limited due to age-dependent physiological changes, technical recording variables, and interindividual variability [21]. This complicates the use of universal cut-offs for LVH. A large institutional study covering 4637 children reported a high ECG sensitivity (>90%) but low specificity (43%) for LVH, whereas only a low proportion (17%) of LVH diagnoses were confirmed by echocardiography [9]. Another study in healthy children found weak correlations between ECG-based parameters for LVH and echocardiographic measurements of left ventricular mass and volume [44]. Classical LVH indices were originally derived from a few cohorts (e.g. the values of Davignon [14]) or adult populations (e.g. the Sokolow-Lyon criteria) and often overestimate LVH in children [45,46]. Amplitude-based criteria can be particularly misleading in thin or athletic children, who may have high precordial voltages in the absence of increased left ventricular mass [47]. On the other hand, children with obesity or certain ethnic populations may demonstrate attenuated voltages and mask true LVH [48]. These findings highlight the limitations of using ECG alone to diagnose LVH in children [44]. A combination of amplitude and non-amplitude ECG measures, adjusted for age and body size, might improve diagnostic performance [8]. The typical ECG findings for diagnosing WPW in children, such as a short PR interval, delta wave and wide QRS complex, also pose a similar challenge, due to developmental variability in cardiac anatomy, often necessitating additional electrophysiological confirmation [49]. Finally, a recent study demonstrated that, although a single resting ECG QTc might be important for initial detection, repeated ECGs or Holter monitoring appear to be better predictors of LQT syndrome [50].
The present narrative review does not engage any meta-analytic methodologies. Differences in study design and ECG methodology limit direct quantitative comparison across studies. Therefore, the descriptive representations only show general trends and should not be interpreted as definitive normative reference values. Instead, they illustrate the developmental trends and the extent of variability between studies, leading to qualitative conclusions. These findings support the need for harmonized contemporary pediatric ECG reference ranges. More recent research emphasizes that ethnicity, body habitus, and athletic state influence amplitude parameters. This highlights the need for population-specific normal values and revision of international standards.
Overall, the present study highlights the heterogeneity of the available data and the differences among prior reports. Because the analysis is descriptive, this review does not propose new normative values but provides a structured foundation for future meta-analytic efforts and the development of standardized pediatric ECG charts. Normative ECG data should be age-, sex- and body-size- specific, and ideally derived from contemporary, well-characterized methodologies. The findings also highlight the need for updated, standardized, multicenter and multiethnic pediatric ECG reference datasets using uniform ECG acquisition protocols, and for LVH indices that reflect pediatric physiology. Priority should be given in the establishment of normal ECG values specifically related to the detection of hypertrophic cardiomyopathy [51], LQT syndrome [52] and WPW syndrome, when ECG is applied as a preparticipation screening tool in children participating in sports, or for large scale screening of school age children [53]. Future studies may engage machine learning tools [54], or computational models integrating amplitude parameters and waveform morphology, along with clinical and imaging covariates to improve ECG diagnostic performance. Inclusion of automated ECG analysis into electronic health records with decision support tools can greatly enhance the effort of screening for heart disease in pediatrics [55].
Conclusions
This review highlights the limited diagnostic performance of ECG amplitude criteria for detecting true LVH, WPW and LQT syndrome, main targets of preparticipation screening in pediatric populations. Given these limitations, a modern review of pediatric ECG normal values should: (1) synthesize classic references, and describe their methodological limits; (2) present and compare newer percentile charts and large populations; (3) highlight the impact of QT correction methods and ECG acquisition parameters; (4) provide clinical recommendations, and 5) prioritize the creation of large, digital ECG studies and contemporary validation of normative values. The present review summarizes age specific values related to LVH, WPW and LQT syndrome detection, based on available literature, with the aim of assisting correct ECG interpretation when applied as a screening tool in young children participating in sports, and facilitating early detection of life-threatening conditions.
Author Contributions
“Conceptualization, I.G.; methodology, M.M and I.G.; validation, formal anlysis, investigation, and data curation, M.M and I.G.; writing—original draft preparation, M.M.; writing—review and editing, I.G.; visualization and supervision, I.G.; project administration, M.M. and I.G. All authors have read and agreed to the published version of the manuscript.
Funding
This research received no external funding.
Institutional Review Board Statement
Not applicable.
Informed Consent Statement
Not applicable.
Data Availability Statement
No new data were created.
Acknowledgments
The authors have reviewed and edited the output and take full responsibility for the content of this publication.
Conflicts of Interest
The authors declare no conflicts of interest.
Abbreviations
The following abbreviations are used in this manuscript:
| ECG | Electrocardiography |
| LVH | Left Ventricular Hypertrophy |
| LQT | Long QT syndrome |
| WPW | Wolff-Parkinson-White Syndrome |
| mV | millivolts |
| ms | milliseconds |
References
- Maron, BJ; Thompson, PD; Puffer, JC; McGrew, CA; Strong, WB; Douglas, PS; et al. Cardiovascular preparticipation screening of competitive athletes. A statement for health professionals from the Sudden Death Committee (clinical cardiology) and Congenital Cardiac Defects Committee (cardiovascular disease in the young), American Heart Association. Circulation 1996, 94, 850–856. [Google Scholar] [CrossRef] [PubMed]
- Pelliccia, A; Di Paolo, FM; Corrado, D; Buccolieri, C; Quattrini, FM; Pisicchio, C; et al. Evidence for efficacy of the Italian national pre-participation screening programme for identification of hypertrophic cardiomyopathy in competitive athletes. Eur Heart J 2006, 27, 2196–2200. [Google Scholar] [CrossRef]
- Corrado, D; Pelliccia, A; Bjørnstad, HH; Vanhees, L; Biffi, A; Borjesson, M; et al. Cardiovascular pre-participation screening of young competitive athletes for prevention of sudden death: proposal for a common European protocol. Consensus Statement of the Study Group of Sport Cardiology of the Working Group of Cardiac Rehabilitation and Exercise Physiology and the Working Group of Myocardial and Pericardial Diseases of the European Society of Cardiology. Eur Heart J 2005, 26, 516–524. [Google Scholar] [CrossRef]
- Gregg, RE; Zhou, SH; Dubin, AM. Automated detection of ventricular pre-excitation in pediatric 12-lead ECG. J Electrocardiol 2016, 49, 37–41. [Google Scholar] [CrossRef]
- Saarel, EV; Granger, S; Kaltman, JR; Minich, LL; Tristani-Firouzi, M; Kim, JJ; et al. Electrocardiograms in Healthy North American Children in the Digital Age. Circ Arrhythm Electrophysiol 2018, 11, e005808. [Google Scholar] [CrossRef] [PubMed]
- Rijnbeek, PR; Witsenburg, M; Schrama, E; Hess, J; Kors, JA. New normal limits for the paediatric electrocardiogram. Eur Heart J 2001, 22, 702–711. [Google Scholar] [CrossRef]
- Bratincsák, A; Kimata, C; Limm-Chan, BN; Vincent, KP; Williams, MR; Perry, JC. Electrocardiogram Standards for Children and Young Adults Using Z-Scores. Circ Arrhythm Electrophysiol 2020, 13, e008253. [Google Scholar] [CrossRef]
- Woroniecki, RP; Kahnauth, A; Panesar, LE; Supe-Markovina, K. Left Ventricular Hypertrophy in Pediatric Hypertension: A Mini Review. Front Pediatr 2017, 5, 101. [Google Scholar] [CrossRef]
- Tague, L; Wiggs, J; Li, Q; McCarter, R; Sherwin, E; Weinberg, J; et al. Comparison of Left Ventricular Hypertrophy by Electrocardiography and Echocardiography in Children Using Analytics Tool. Pediatr Cardiol 2018, 39, 1378–1388. [Google Scholar] [CrossRef]
- Moore, GP; Munter, DW. Wolff-Parkinson-White syndrome: illustrative case and brief review. J Emerg Med 1989, 7, 47–54. [Google Scholar] [CrossRef] [PubMed]
- Centurión, OA; Shimizu, A; Isomoto, S; Konoe, A. Mechanisms for the genesis of paroxysmal atrial fibrillation in the Wolff Parkinson-White syndrome: intrinsic atrial muscle vulnerability vs. electrophysiological properties of the accessory pathway. Europace 2008, 10, 294–302. [Google Scholar] [CrossRef] [PubMed]
- Katyal, A; Li, COY; Franciosi, S; Sanatani, S. The safety of sports in children with inherited arrhythmia substrates. Front Pediatr 2023, 11, 1151286. [Google Scholar] [CrossRef]
- Galić, E; Bešlić, P; Kilić, P; Planinić, Z; Pašalić, A; Galić, I; et al. CONGENITAL LONG QT SYNDROME: A SYSTEMATIC REVIEW. Acta Clin Croat 2021, 60, 739–748. [Google Scholar] [CrossRef] [PubMed]
- Davignon, A; Rautaharju, P; Boisselle, E; Soumis, F; Mégélas, M; Choquette, A. Normal ECG standards for infants and children. Pediatr Cardiol 1980, 1, 123–131. [Google Scholar] [CrossRef]
- Dickinson, DF. The normal ECG in childhood and adolescence. Heart 2005, 91, 1626–1630. [Google Scholar] [CrossRef]
- Andršová, I; Hnatkova, K; Helánová, K; Šišáková, M; Novotný, T; Kala, P; et al. Problems with Bazett QTc correction in paediatric screening of prolonged QTc interval. BMC Pediatrics 2020, 20, 558. [Google Scholar] [CrossRef]
- Lue, H-C; Wu, M-H; Wang, J-K; Lin, M-T; Lu, C-W; Chiu, S-N; et al. Normal ECG standards and percentile charts for infants, children and adolescents. Pediatr Neonatol 2023, 64, 256–273. [Google Scholar] [CrossRef]
- Macfarlane, PW; Coleman, EN; Pomphrey, EO; McLaughlin, S; Houston, A; Aitchison, T. Normal limits of the high-fidelity pediatric ECG. Preliminary observations. J Electrocardiol 1989, 22, 162–168. [Google Scholar] [CrossRef]
- Semizel, E; Oztürk, B; Bostan, OM; Cil, E; Ediz, B. The effect of age and gender on the electrocardiogram in children. Cardiol Young 2008, 18, 26–40. [Google Scholar] [CrossRef] [PubMed]
- Kamphuis, VP; Blom, NA; van Zwet, EW; Man, S; Ten Harkel, ADJ; Maan, AC; et al. Normal values of the ventricular gradient and QRS-T angle, derived from the pediatric electrocardiogram. J Electrocardiol 2018, 51, 490–495. [Google Scholar] [CrossRef]
- Yoshinaga, M; Iwamoto, M; Horigome, H; Sumitomo, N; Ushinohama, H; Izumida, N; et al. Standard Values and Characteristics of Electrocardiographic Findings in Children and Adolescents. Circ J 2018, 82, 831–839. [Google Scholar] [CrossRef]
- Uygur, Ö; Aydoğdu, A. Normal electrocardiogram values of healthy children. Turk Pediatri Ars 2019, 54, 93–104. [Google Scholar] [CrossRef]
- Landon, G; Denjoy, I; Clero, E; Silenok, A; Kurnosova, I; Butsenin, A; et al. Reference values of electrographic and cardiac ultrasound parameters in Russian healthy children and adolescents. Sci Rep 2021, 11, 2916. [Google Scholar] [CrossRef]
- Pietrzak, R; Gąsior, JS; Książczyk, T; Tomik, A; Werner, B. Electrocardiograms in school-aged healthy Polish children - an observational study. Kardiol Pol 2022, 80, 1211–1216. [Google Scholar] [CrossRef]
- Brockmeier, K; Nazal, R; Sreeram, N. The electrocardiogram of the neonate and infant. J Electrocardiol 2016, 49, 814–816. [Google Scholar] [CrossRef] [PubMed]
- Joyce, JJ; Qi, N; Chang, R-K; Ferns, SJ; Baylen, BG. Right and Left Ventricular Mass Development in Early Infancy: Correlation of Electrocardiographic Changes with Echocardiographic Measurements. J Electrocardiol 2023, 81, 101–105. [Google Scholar] [CrossRef]
- Harteveld, LM; Nederend, I; Ten Harkel, ADJ; Schutte, NM; de Rooij, SR; Vrijkotte, TGM; et al. Maturation of the Cardiac Autonomic Nervous System Activity in Children and Adolescents. J Am Heart Assoc 2021, 10, e017405. [Google Scholar] [CrossRef] [PubMed]
- Chan, TC; Sharieff, GQ; Brady, WJ. Electrocardiographic manifestations: pediatric ECG. J Emerg Med 2008, 35, 421–430. [Google Scholar] [CrossRef]
- Kittnar, O. Sex Related Differences in Electrocardiography. Physiol Res 2023, 72, S127–S135. [Google Scholar] [CrossRef] [PubMed]
- Carbone, V; Guarnaccia, F; Carbone, G; Zito, GB; Oliviero, U; Soreca, S; et al. Gender differences in the 12-lead electrocardiogram: clinical implications and prospects. Journal of Sex- and Gender-Specific Medicine 2020, 6, 126–141. [Google Scholar]
- De Bie, J; Diemberger, I; Mason, JW. Comparison of PR, QRS, and QT interval measurements by seven ECG interpretation programs. Journal of Electrocardiology 2020, 63, 75–82. [Google Scholar] [CrossRef]
- Angeli, F; Verdecchia, P; Angeli, E; Poeta, F; Sardone, M; Bentivoglio, M; et al. Day-to-day variability of electrocardiographic diagnosis of left ventricular hypertrophy in hypertensive patients. Influence of electrode placement. J Cardiovasc Med (Hagerstown) 2006, 7, 812–816. [Google Scholar] [CrossRef] [PubMed]
- Mahendran, S; Gupta, I; Davis, J; Davis, AJ; Orchard, JW; Orchard, JJ. Comparison of methods for correcting QT interval in athletes and young people: A systematic review. Clin Cardiol 2023, 46, 1106–1115. [Google Scholar] [CrossRef] [PubMed]
- Phan, DQ; Silka, MJ; Lan, Y-T; Chang, R-KR. Comparison of formulas for calculation of the corrected QT interval in infants and young children. J Pediatr 2015, 166, 960–964.e1-2. [Google Scholar] [CrossRef] [PubMed]
- Kligfield, P; Gettes, LS; Bailey, JJ; Childers, R; Deal, BJ; Hancock, EW; et al. Recommendations for the standardization and interpretation of the electrocardiogram: part I: the electrocardiogram and its technology a scientific statement from the American Heart Association Electrocardiography and Arrhythmias Committee, Council on Clinical Cardiology; the American College of Cardiology Foundation; and the Heart Rhythm Society endorsed by the International Society for Computerized Electrocardiology. J Am Coll Cardiol 2007, 49, 1109–1127. [Google Scholar] [CrossRef]
- Mason, JW; Ramseth, DJ; Chanter, DO; Moon, TE; Goodman, DB; Mendzelevski, B. Electrocardiographic reference ranges derived from 79,743 ambulatory subjects. J Electrocardiol 2007, 40, 228–234. [Google Scholar] [CrossRef]
- de Alencar, JN; Monteiro, JAM; Furtado, JT; Sacre, RC; Guerra, CB; Knoblauch, WS; et al. ECG criteria for diagnosing left chambers disease in Pediatrics: The CHILDHEART study. J Electrocardiol 2025, 92, 154087. [Google Scholar] [CrossRef]
- Gregory, P; Lodge, S; Kilner, T; Paget, S. Accuracy of ECG chest electrode placements by paramedics: an observational study. Br Paramed J 2019, 4, 51–52. [Google Scholar] [CrossRef]
- Kayyali, M; Mincholé, A; Qian, S; Young, A; Ugurlu, D; Fairweather, E; et al. Anatomical-electrical coupling of cardiac axes: Definitions and population variability for advancing personalised ECG interpretation. PLoS Comput Biol 2025, 21, e1013161. [Google Scholar] [CrossRef]
- Sanjo, K; Hebiguchi, K; Tang, C; Rashed, EA; Kodera, S; Togo, H; et al. Sensitivity of Electrocardiogram on Electrode-Pair Locations for Wearable Devices: Computational Analysis of Amplitude and Waveform Distortion. Biosensors (Basel) 2024, 14, 153. [Google Scholar] [CrossRef]
- Boggess, B; Kindschi, K; Friedman, E; Boggess, S; Berkoff, D. Electrocardiogram Lead Placement Accuracy and Its Implications on Universal Screening in Athletes. Cureus n.d., 17, e88076. [Google Scholar] [CrossRef]
- Makarov, LM; Kisileva, II; Dolgikh, VV; Bimbaev, AB-Z; Bairova, TA; Drozdova, AI. Assesment of Parameters of QT Interval in Children and Adolescents. Kardiologiia 2006, 46, 37–41. [Google Scholar] [PubMed]
- Rodday, AM; Triedman, JK; Alexander, ME; Cohen, JT; Ip, S; Newburger, JW; et al. Electrocardiogram Screening for Disorders That Cause Sudden Cardiac Death in Asymptomatic Children: A Meta-analysis. Pediatrics 2012, 129, e999–e1010. [Google Scholar] [CrossRef]
- Alexander, ME; Gongwer, R; Trachtenberg, FL; Minich, LL; Triedman, JK; Kaltman, JR; et al. Limited Relationship Between Echocardiographic Measures and Electrocardiographic Markers of Left Ventricular Size in Healthy Children. Pediatr Cardiol 2024, 45, 1055–1063. [Google Scholar] [CrossRef] [PubMed]
- Rivenes, SM; Colan, SD; Easley, KA; Kaplan, S; Jenkins, KJ; Khan, MN; et al. Usefulness of the pediatric electrocardiogram in detecting left ventricular hypertrophy: results from the Prospective Pediatric Pulmonary and Cardiovascular Complications of Vertically Transmitted HIV Infection (P2C2 HIV) multicenter study. Am Heart J 2003, 145, 716–723. [Google Scholar] [CrossRef]
- Di Gioia, G; Creta, A; Campanale, CM; Fittipaldi, M; Giorgino, R; Quintarelli, F; et al. ECG is an inefficient screening-tool for left ventricular hypertrophy in normotensive African children population. PeerJ 2016, 4, e2439. [Google Scholar] [CrossRef]
- Czosek, RJ; Cnota, JF; Knilans, TK; Pratt, J; Guerrier, K; Anderson, JB. Relationship between echocardiographic LV mass and ECG based left ventricular voltages in an adolescent population: related or random? Pacing Clin Electrophysiol 2014, 37, 1133–1140. [Google Scholar] [CrossRef]
- Snelder, SM; van de Poll, SWE; de Groot – de Laat, LE; Kardys, I; Zijlstra, F; van Dalen, BM. Optimized electrocardiographic criteria for the detection of left ventricular hypertrophy in obesity patients. Clin Cardiol 2020, 43, 483–490. [Google Scholar] [CrossRef]
- Khalaph, M; Trajkovska, N; Didenko, M; Braun, M; Imnadze, G; Akkaya, E; et al. A novel ECG algorithm for accurate localization of manifest accessory pathways in both children and adults: SMART-WPW. Heart Rhythm 2025, 22, e738–e745. [Google Scholar] [CrossRef]
- Yoshinaga, M; Ninomiya, Y; Tanaka, Y; Fukuyama, M; Kato, K; Ohno, S; et al. Holter Electrocardiographic Approach to Predicting Outcomes of Pediatric Patients With Long QT Syndrome. Circ J 2024, 88, 1176–1184. [Google Scholar] [CrossRef] [PubMed]
- Bagkaki, A; Parthenakis, F; Chlouverakis, G; Anastasakis, A; Papagiannis, I; Galanakis, E; et al. Epidemiology of Pediatric Cardiomyopathy in a Mediterranean Population. Children (Basel) 2024, 11, 732. [Google Scholar] [CrossRef] [PubMed]
- Bagkaki, A; Tsoutsinos, A; Hatzidaki, E; Tzatzarakis, M; Parthenakis, F; Germanakis, I. Mexiletine Treatment for Neonatal LQT3 Syndrome: Case Report and Literature Review. Front Pediatr 2021, 9, 674041. [Google Scholar] [CrossRef] [PubMed]
- Bagkaki, A; Parthenakis, F; Chlouverakis, G; Galanakis, E; Germanakis, I. Cardiovascular Disease Screening in Primary School Children. Children (Basel) 2024, 12, 38. [Google Scholar] [CrossRef]
- Bozkurt, B; Germanakis, I; Stylianou, Y. A study of time-frequency features for CNN-based automatic heart sound classification for pathology detection. Comput Biol Med 2018, 100, 132–143. [Google Scholar] [CrossRef]
- Chatzakis, I; Vassilakis, K; Lionis, C; Germanakis, I. Electronic health record with computerized decision support tools for the purposes of a pediatric cardiovascular heart disease screening program in Crete. Comput Methods Programs Biomed 2018, 159, 159–166. [Google Scholar] [CrossRef] [PubMed]
Figure 1.
R-wave amplitude (mV) in lead V6 across reference studies [6,7,17,19,21,22,24]. Each plotted chart illustrates the reported distribution for each corresponding study. Lower values represent mean or median, while upper values represent the reported upper reference values. a) Boys are displayed in the left, and b) girls in the right panel. Methodological differences may contribute to interstudy variability.
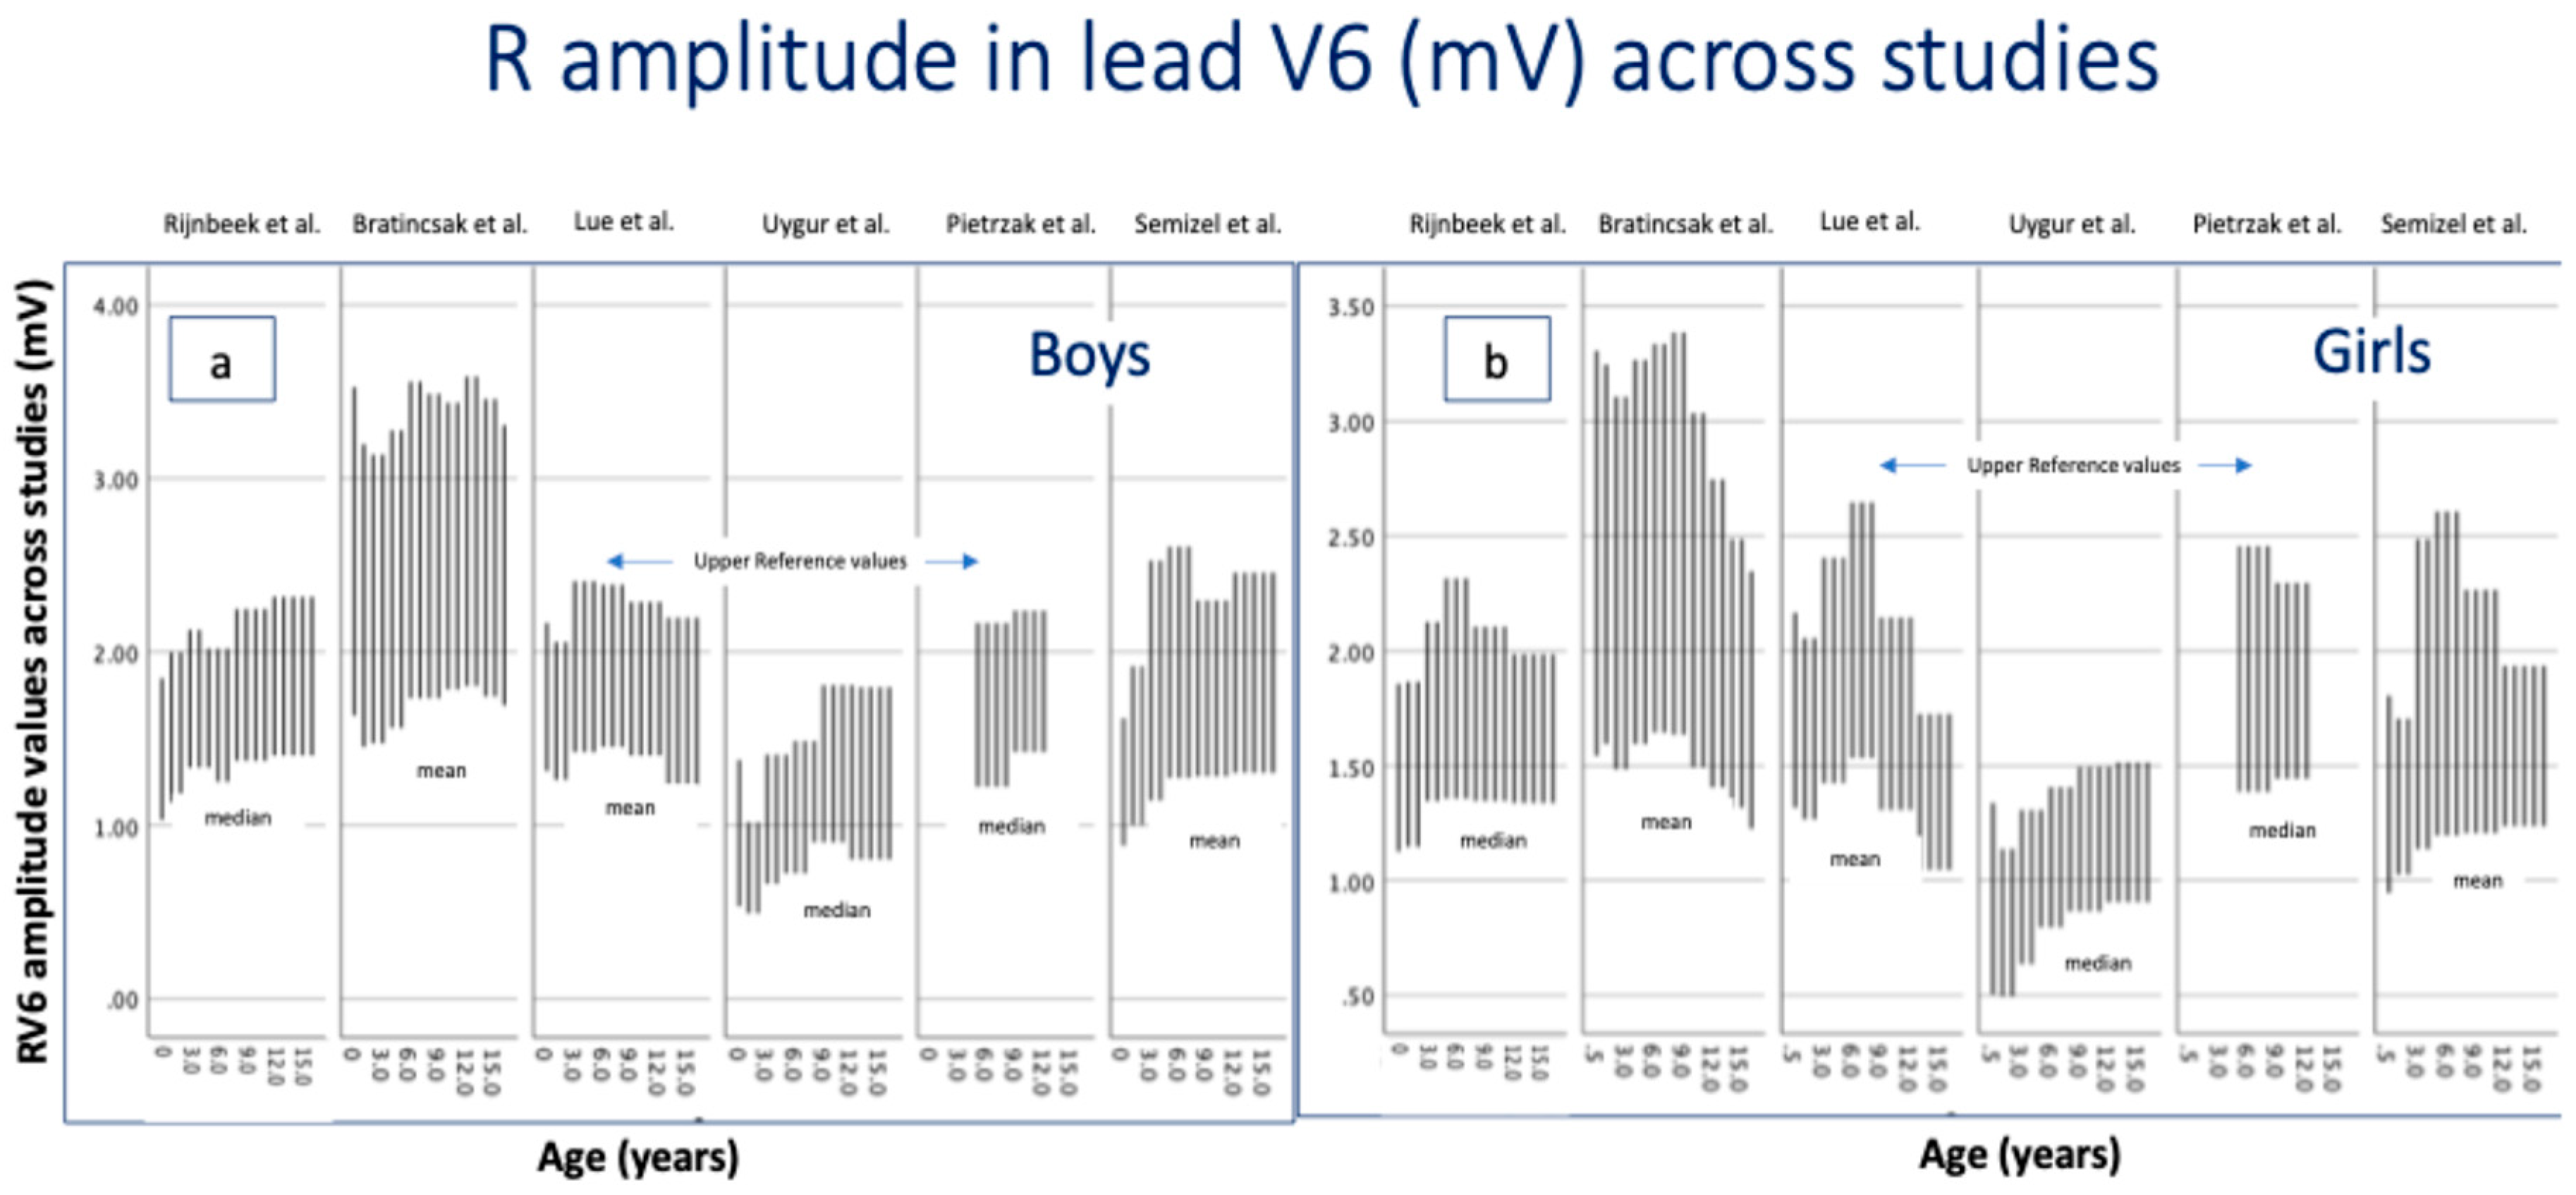
Figure 2.
S-wave amplitude (mV) in lead V6 across reference studies [6,19,22,24]. Each plotted chart illustrates the reported distribution for each corresponding study. Lower values represent mean or median, while upper values represent the reported upper reference values. a) Boys are displayed in the left, and b) girls in the right panel. Methodological differences may contribute to interstudy variability.
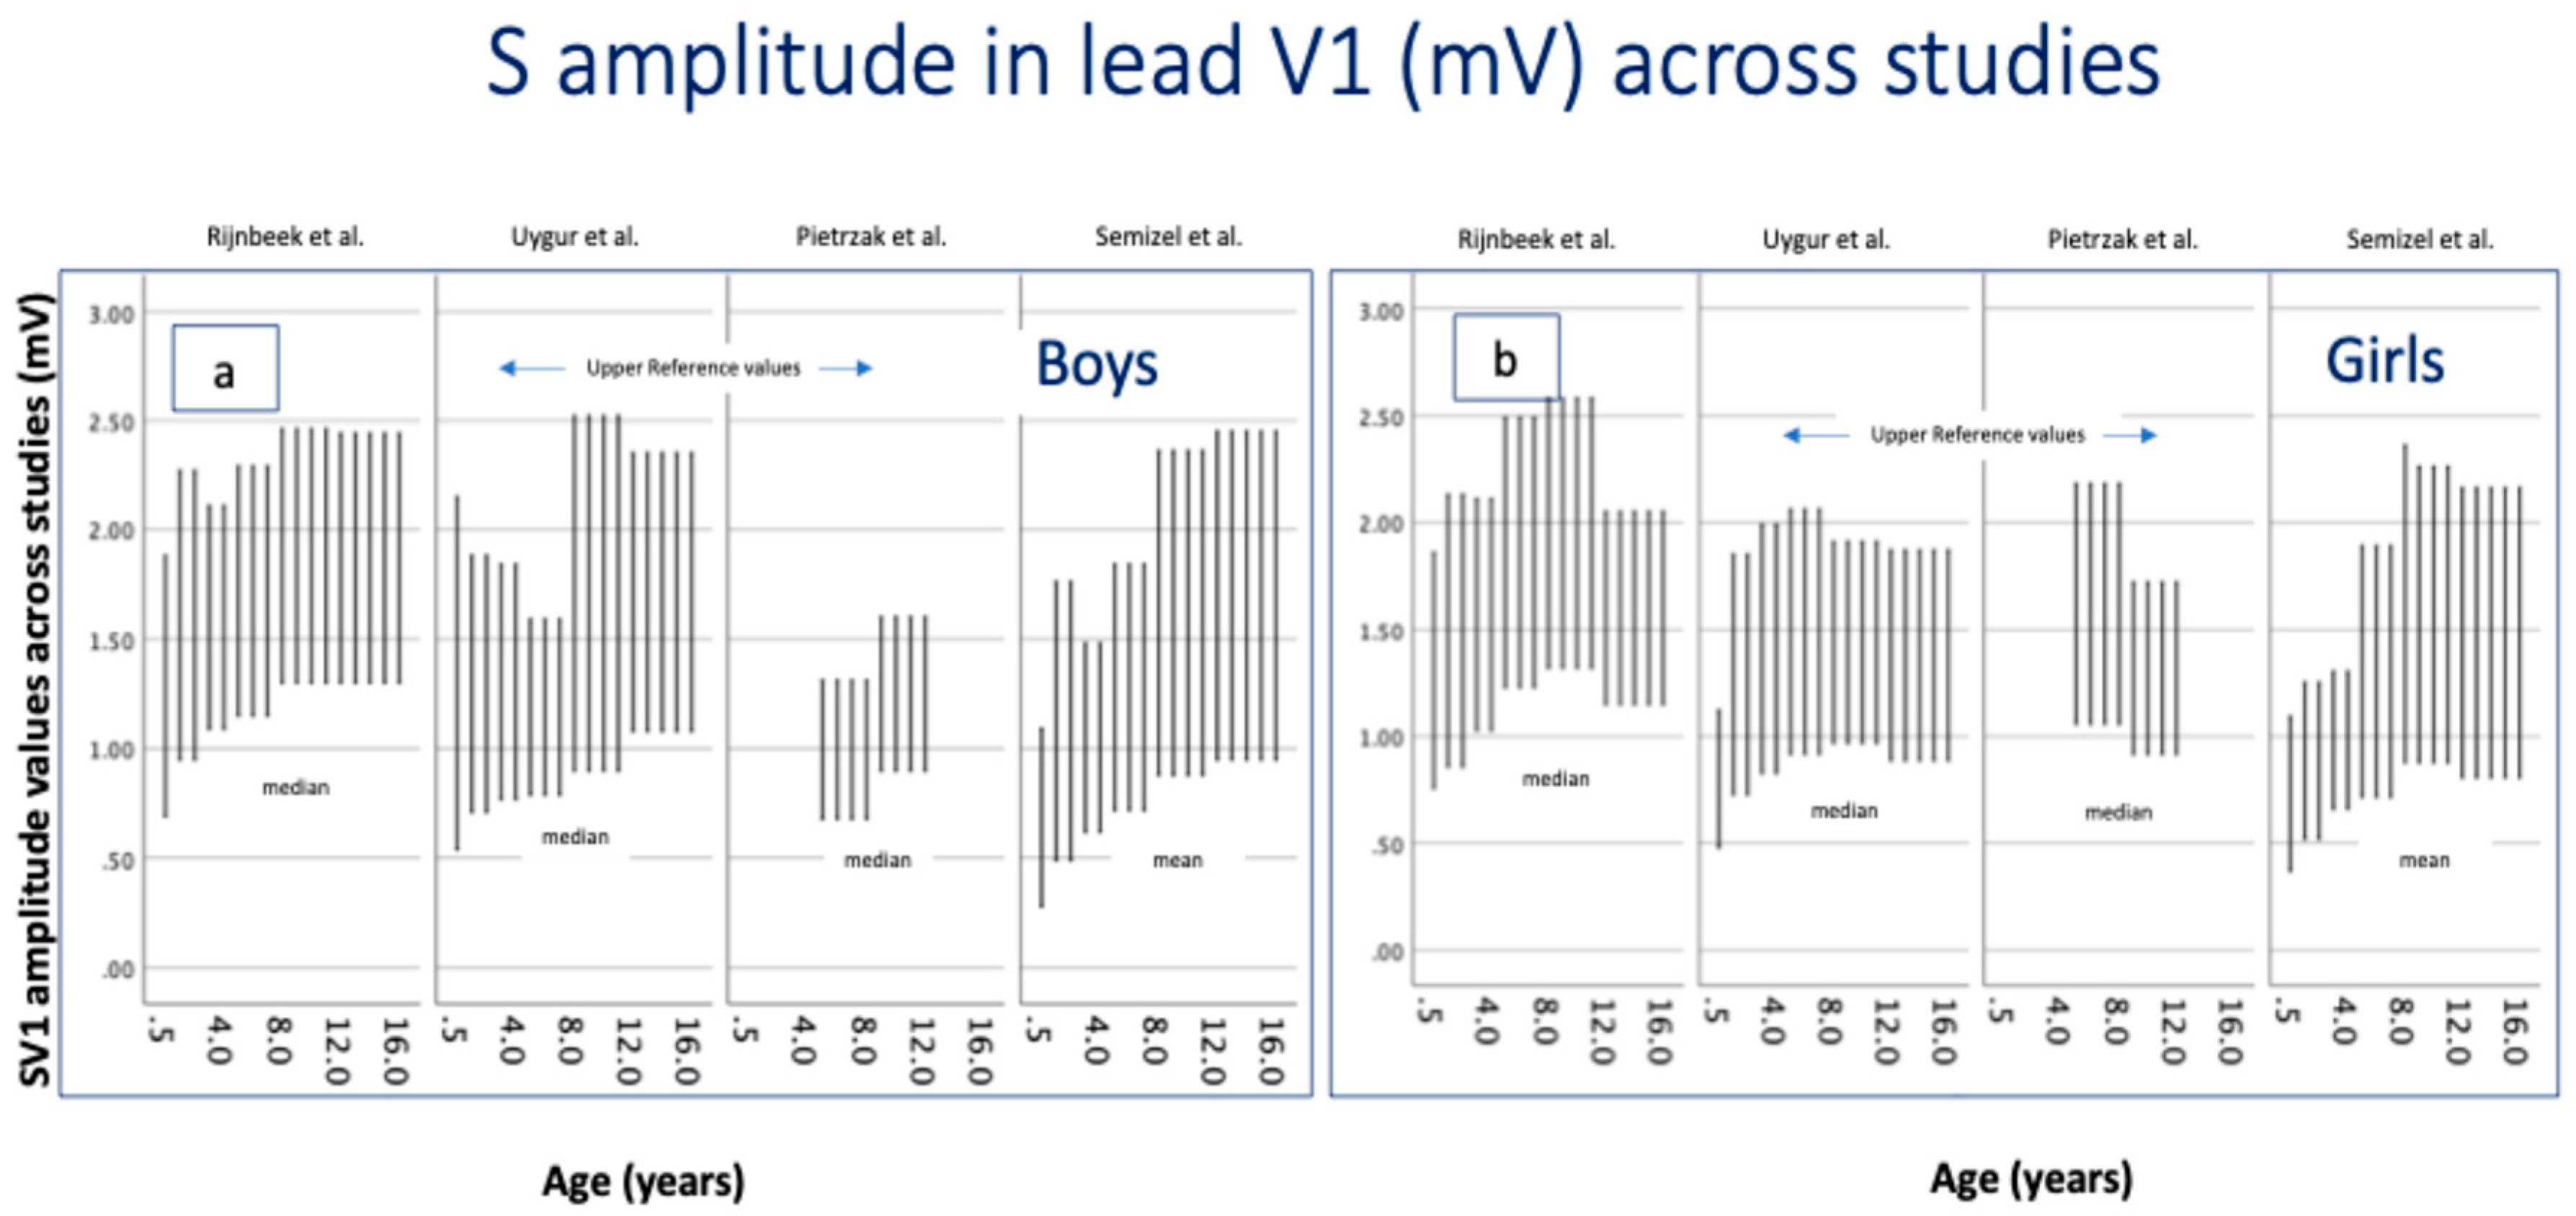
Figure 3.
Developmental trends of a) median pediatric ECG R-wave- (Lead V6) and S-wave-amplitude (Lead V1), and b) median upper reference values of PR, QRS and QTc intervals calculated across studies. For visualization of developmental trends, age-specific ECG parameters were summarized using the median of reported central tendency measures across all included studies. This representation is for descriptive comparison only and does not represent pooled normative reference standards.
Disclaimer/Publisher’s Note: The statements, opinions and data contained in all publications are solely those of the individual author(s) and contributor(s) and not of MDPI and/or the editor(s). MDPI and/or the editor(s) disclaim responsibility for any injury to people or property resulting from any ideas, methods, instructions or products referred to in the content. |
© 2025 by the authors. Licensee MDPI, Basel, Switzerland. This article is an open access article distributed under the terms and conditions of the Creative Commons Attribution (CC BY) license (http://creativecommons.org/licenses/by/4.0/).
Copyright: This open access article is published under a Creative Commons CC BY 4.0 license, which permit the free download, distribution, and reuse, provided that the author and preprint are cited in any reuse.


