1. Introduction
Multiple myeloma (MM) is a malignant disease of the blood system, characterized by uncontrolled proliferation in the bone marrow of a clone of B-lymphocyte precursors that retain the ability to differentiate into plasma cells and, in most cases, produce pathological monoclonal immunoglobulins or their fragments – paraproteins [
1]. MM is one of the most common malignant hematological diseases in adults, with an incidence of up to 10-15% among hemoblastoses. According to the Global Burden of Disease study, 148,760 new cases of MM were registered worldwide in 2021, and the global incidence rate was 1.48 (1.31-1.62) per 100,000 people [
2]. In 1990, the incidence worldwide was 0.55 (0.52-0.59) per 100,000 people, thus the increase in incidence over 30 years is 167%. Mortality increased from 0.47 (0.44-0.51) to 1.16 (1.03-1.28) per 100,000 people, respectively, while its increase was 145%.Despite significant treatment success, disease progression cannot be prevented in most patients. MM remains a frequently recurring condition with a high mortality rate.
Little is known about the etiology of MM. However, most studies suggest a significant role for genetic factors in the pathogenesis of this oncopathology [
3]. For first-degree relatives of a patient with MM, the risk of its occurrence doubles [
4]. The development of MM begins in the lymph node with an initiating event that occurs during genetic recombination in a B cell when the secreted antibody class changes. The initiating event is often represented by a translocation or chromosome duplication. In either case, such genetic abnormalities lead to the formation of monoclonal plasma cells, which then invade the bone marrow and slowly proliferate there [
5].
Another factor playing a key role in the pathogenesis of MM is the tumor microenvironment [
6,
7]. Following the migration of tumor plasma cells into the bone marrow, a specific pro-tumor niche is formed, which maintains conditions conducive to the proliferation of the malignant clone. One of the key conditions supporting tumor growth is the provision of an immunosuppressive microenvironment, which allows the tumor to evade the immune system. The tumor niche is formed by the tumor’s cellular compartment, comprised of osteoclasts, mesenchymal stem cells, and myeloid progenitor cells (MDSCs). All these cells support immunosuppression directly at the tumor site.
Other cell types that play a key role in MM progression are immune cells, including conventional T cells, NK cells, NKT cells, and antigen-presenting cells (APCs) [
8]. Normally, all of these cells are crucial components of antitumor immunity, participating in the recognition and presentation of tumor antigens, as well as the subsequent elimination of the malignant clone. It is important to emphasize that successful tumor cell elimination largely depends on the state of APCs and effector cells. Thus, during the tumor process, immunological suppression develops, which facilitates tumor growth. Impaired T-cell function in MM may be one of the causes of immune surveillance failure [
9,
10]. MM is characterized not only by depletion of CD8+ cytotoxic cells (CD8+ cells express PD-1, CTLA-4, and CD160), but also by other T-cell defects, such as a decrease in CD4+ and CD8+ cells, as well as an altered CD4/CD8 ratio.
NKT cells are a minor subset of lymphocytes that recognize lipid antigens in the context of the CD1d family of molecules, making them an important component of the immune system [
11]. NKT cells play a key role in the pathogenesis of MM, as myeloma cells have been shown to express CD1d and are sensitive to NKT cell lysis [
12]. Stimulation of NK and dendritic cell activity has also been described as one of their functions in MM. In addition, clinical progression of MM was associated with functional changes in the NKT cell pool, in particular with the loss of interferon (IFN)-γ secretion function, which is involved in the processes of cellular immune response [
13].
Also, patients with MM have functional disorders of NK cells associated with a decrease in the expression of a number of activating receptors such as NKG2D and an increase in the expression of immune checkpoint molecules TIM3, TIGIT, ICOS PD-1 [
14,
15].
Thus, the pathogenesis of MM involves not only cells directly comprising the tumor microenvironment but also immunocompetent cells, both those infiltrating the tumor and those performing immune surveillance in the periphery. Suppression of immune surveillance in MM is largely mediated by a specific immunosuppressive phenotype of immune cells that arises during chronic cell-tumor contact. This phenotype includes increased expression of immune checkpoint molecules such as PD-1, CTLA-4, TIM3, TIGIT, VISTA, and others [
16].
Immune checkpoints are currently attracting significant interest as a target for the development of modern cancer targeted therapies. Since 2011, the FDA has approved seven immune checkpoint inhibitors for clinical use, including one CTLA-4 blocker (ipilimumab), three PD-1 blockers (nivolumab, pembrolizumab, and cemiplimab), and three PD-L1 blockers (atezolizumab, avevelumab, and durvalumab). Several of these have been used in clinical trials or approved for use in patients with MM [
16].However, clinical trials for the treatment of MM often fail due to excessive immune toxicity of checkpoint inhibitors or their lack of efficacy, which leads to disease relapse [
17]. Such problems are often associated with nonspecific activation of the immune system, as well as the presence of other potent suppressor molecules. This prompts interest in further identifying new targets that could lead to sustained clinical benefits in cancer therapy.
Non-classical HLA molecules may be promising candidates for the role of a new target for inhibition of immune checkpoints in MM. HLA-E molecule is known to be overexpressed on tumor cells in MM [
18]. High expression of HLA-G is observed in cancer patients with a poor prognosis [
19], and in the context of MM, it was noted that the transfer of HLA-G from tumor cells to T cells via trogocytosis was associated with poor clinical outcome in patients [
20]. Recent clinical trials (NCT02643550) have shown promise for the therapeutic use of antibodies (Monalizumab) to the HLA-E receptor, the NKG2A protein, in head and neck squamous cell carcinoma and non-small cell lung cancer, highlighting the potential for targeting the HLA-E/NKG2A axis in other cancer types. The potential use of non-classical HLA molecules as a new target in the treatment of MM requires further study of their expression in this disease.
Non-classical HLA molecules are characterized by limited polymorphism and structural conservation; the least polymorphic is HLA-E, represented by two alleles [
21]. HLA-E exhibits ubiquitous mRNA expression in the body, but surface protein expression is limited to certain cell types, with the highest level on peripheral blood mononuclear cells, as well as in lymphoid organs, lungs and kidneys [
22]. This molecule was first described as a ligand for the inhibitory receptor CD94/NKG2A, while it has a six-fold lower affinity for the activating receptor CD94/NKG2C of NK cells [
23].The key function of the HLA-E molecule is to bind conserved peptides derived from the signal sequences of classical MHC class I molecules and subsequently recognize these complexes by NK cell receptors. However, the role of the HLA-E molecule depends on the nonameric peptides it presents, as this determines the molecule’s greater affinity for activating or inhibitory receptors. Thus, the presentation of the leading HLA-G peptide VMAPRTLFL by the HLA-E molecule on MM tumor cells plays a key role in the suppression of NK- and CD8+-dependent cytotoxic response through interaction with the inhibitory receptor NKG2A, for which this peptide is the most potent natural ligand [
24].Increased HLA-E has been reported in breast cancer, non-small cell lung cancer, renal cell carcinoma, and colorectal cancer. Moreover, increased HLA-E on tumor cells often positively correlated with the expression of the inhibitory receptor NKG2A on tumor-infiltrating CD8
+ T cells. Thus, up to 50% of CD8+ lymphocytes expressed NKG2A/CD94 [
25,
26]. Expression of the HLA-E molecule on plasma cells in multiple myeloma is significantly increased compared to normal cells. It is important to note that high expression of this molecule is associated with a clinically aggressive course of the disease, including late stages of the disease and an unfavorable cytogenetic profile [
18].
The HLA-G molecule has more polymorphisms compared to HLA-E; currently, 88 alleles and 26 types of proteins are known [
27]. This molecule is normally presented in the body on placental trophoblast cells, hematopoietic cells and thymic epithelial cells, as well as on a minor population of thymic CD3
+ HLA-G
+ T cells in the peripheral blood [
28,
29,
30,
31]. HLA-G is involved in maintaining peripheral immune tolerance; antigen-presenting cells expressing HLA-G induce the differentiation of CD4+ T cells into regulatory T suppressor cells that block the functions of cytotoxic T lymphocytes [
32,
33]. Increased HLA-G expression by tumors may be clinically important in different types of cancer, as was observed, for example, in gastric cancer. The presence of HLA-G was observed in tumor tissue (25.5% of patients), which correlated with worse patient survival (p<0.0001) [
34]. Also, HLA-G expression on tumor cells was reliably detected in various malignant neoplasms of the hematopoietic system, with the highest frequency in acute myeloid leukemia (AML), acute lymphoblastic leukemia (ALL) and B-cell chronic lymphocytic leukemia (B-CLL) [
35]. Thus, exceeding the threshold of 23% HLA-G-positive B cells in patients with B-CLL correlated with worsening survival rates. The obtained data indicate that the emergence of surface expression of HLA-G on tumor cells may be one of the key mechanisms ensuring tumor evasion from immune surveillance in B-CLL [
36]. In the case of MM, it was noted that immunosuppression occurred through the emergence of regulatory CD8+HLA-G+ cells, which acquired their phenotype by trogocytosis of the membrane form of the HLA-G molecule from APCs and tumor cells [
37].
While non-classical HLA-G and HLA-E molecules play an important role in maintaining peripheral tolerance and inducing anergy in immunocompetent cells, the classical MHC class II molecule HLA-DR performs a fundamentally different function in the body. The primary function of HLA-DR is to present foreign peptide antigens to the immune system in order to activate CD4+ T-cell immunity and regulate the overall immune response. The HLA-DR molecule is constitutively expressed on antigen-presenting cells (APCs) (macrophages, B cells, and dendritic cells) [
38]. Increased amounts of HLA-DR on the cell surface often occur in response to stimulation, and therefore HLA-DR is also a marker of immune stimulation. The involvement of the HLA-DR molecule in the pathogenesis of MM is associated with its antigen-presenting function. Thus, a decrease in MHC class II expression on APCs leads to a disruption in the presentation of tumor antigens with subsequent disruption of CD4+ T-helper activation [
39]. Moreover, monocytes with low HLA-DR expression have been described as having an anti-inflammatory phenotype. CD14+HLA-DR
lo/neg play a role in undermining effective antitumor responses, and their levels in patients’ blood are inversely correlated with favorable treatment outcomes [
40]. The increase in the number of activated T cells expressing HLA-DR described in MM does not apparently lead to an adequate antitumor response [
41], since a significant proportion of CD8+HLA-DR+ cells in MM also expressed the myelomonocytic-derived marker OKM1, indicating their suppressor phenotype CD8+ OKM1+ [
42].
Numerous studies confirm that increased expression of non-classical HLA-G and HLA-E molecules on tumor cells is associated with the progression of cancer [
19,
43]. As an important component of the tumor microenvironment, these molecules ensure tumor evasion from the immune response. Through interaction with inhibitory receptors of immunocompetent cells, HLA-G and HLA-E can induce a state of local immune anergy. Despite existing data on the role of HLA-E and HLA-G expression on tumor cells, much less is known about their role in immune cell expression in MM. However, we hypothesize that an increased proportion of cells expressing HLA-E and HLA-G molecules among conventional lymphocytes and monocytes may influence their dysfunction in the pathogenesis of MM. Therefore, in our study, we aimed to determine changes in the ratio of the main populations of immune cells, including monocytes and lymphocytes expressing HLA-E and HLA-G, in patients with multiple myeloma compared to healthy donors.
2. Materials and Methods
The study involved patients with MM (n = 14; mean age 59.7±1.9 years) undergoing treatment at the Federal State Budgetary Scientific Institution “Research Institute of Fundamental and Clinical Immunology”. Inclusion criteria for the study: male and female patients diagnosed with multiple myeloma aged 18 to 75 years, whose disease corresponded to clinical stage II or III according to the Durie-Salmon system, and the presence of partial remission at the time of inclusion in the study. The control group consisted of conditionally healthy donors (n = 12; mean age 43.5±4.11 years) after signing a voluntary informed consent. Inclusion criteria for participants in the control group: healthy male and female donors aged 18 to 75 years, with no history of autoimmune diseases, oncological pathologies, as well as chronic or recurrent viral infections.
Blood samples were collected after signing informed consent. The relative content of cell populations (CD4+, CD4+HLA E+, CD4+HLA-G+, CD4+HLA- DR+, CD8+, CD8+HLA-E+, CD8+HLA-G+, CD8+HLA- DR+, B cells, NK, NKT cells, CD14+, CD14+HLA-E+, CD14+HLA-G+, CD14+HLA-DR+) was analyzed by flow cytometry using a panel of monoclonal antibodies: anti-CD19 (APC), anti-CD4 (APC/ Cy7), anti-CD45 (PE/Cy7), anti-CD14 (PerCP), anti-CD3 (FITC) + anti-CD16/56 (PE), anti-CD8a (PE/ Cy7), anti-HLA-G (PE), anti-HLA-E (PerCP/Cy5.5), anti-HLA-DR (APC) (BioLegend, USA). Cells were incubated with antibodies in the dark at room temperature for 20 minutes and then washed with phosphate-buffered saline (PBS) supplemented with 0.5% fetal bovine serum (FCS, Hyclone, USA). Data were recorded on a LongCyte™ flow cytometer (model C3140, Challenbio, China) and analyzed using ModelFlower software. Statistical processing was performed in GraphPad Prism 10.4.1 (USA) using the Mann–Whitney test. Results are presented as median with interquartile range (25th–75th percentiles). The level of statistical significance was set at p < 0.05.
3. Results
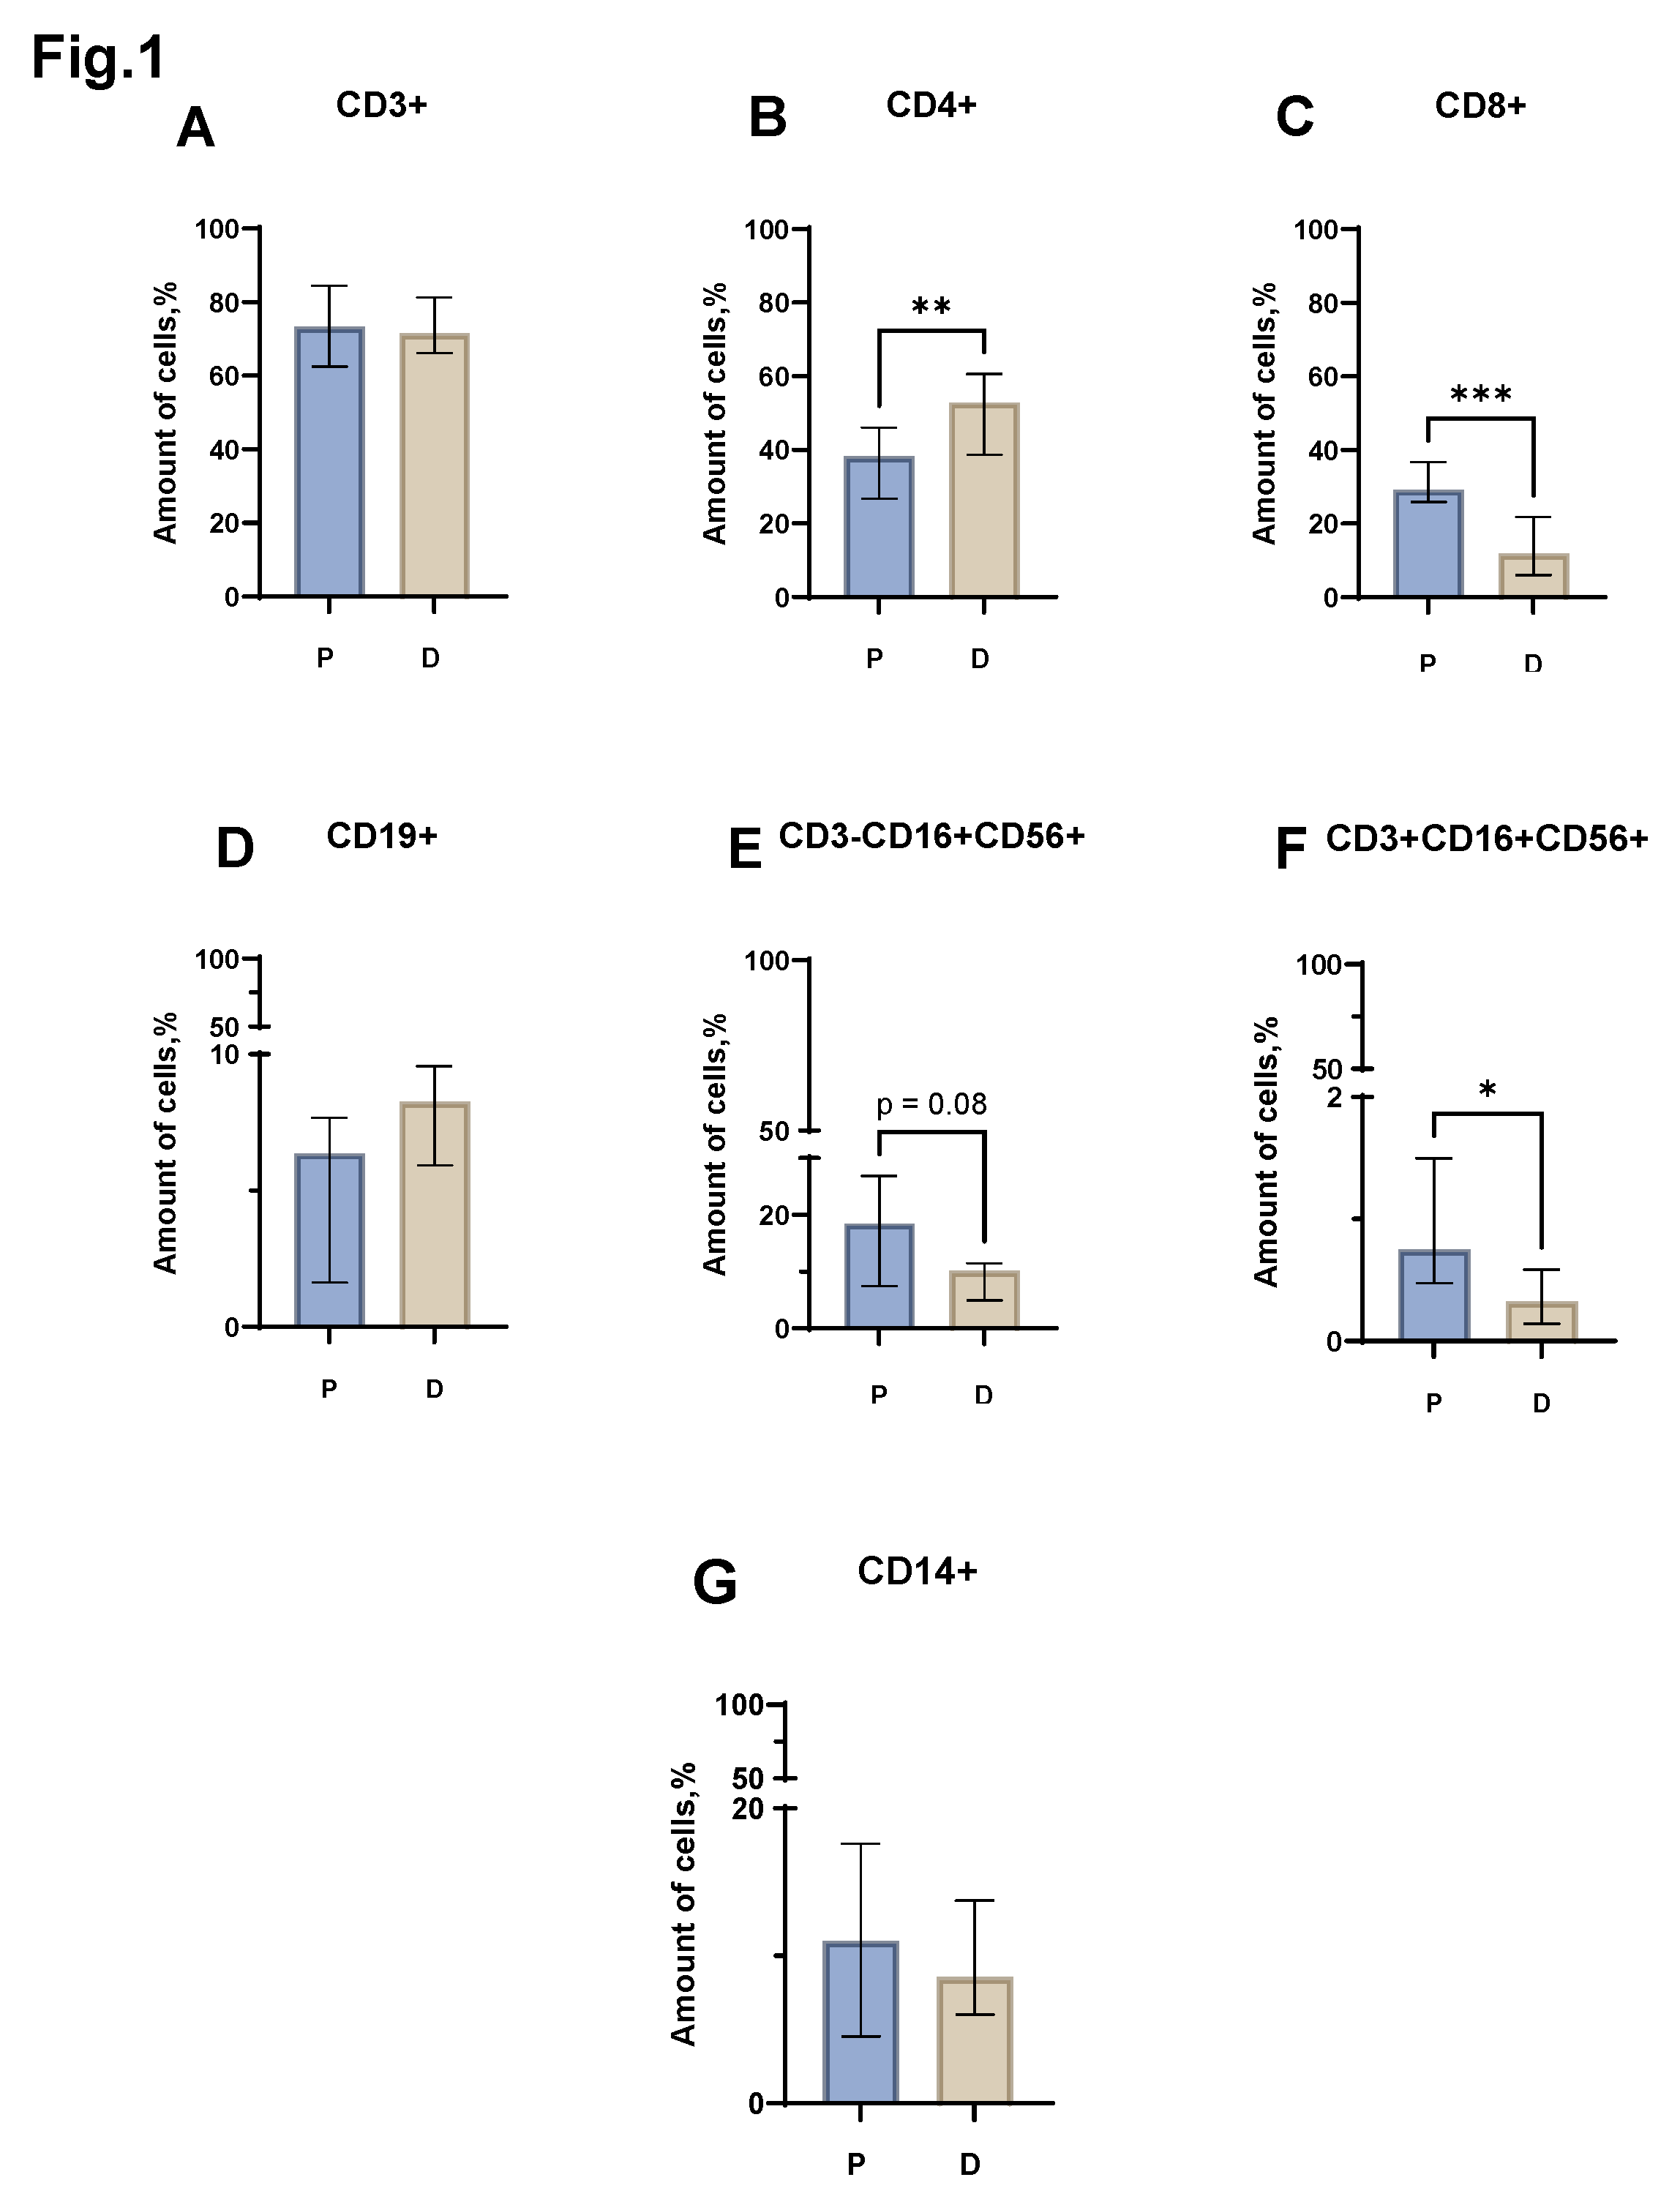
Evaluation of the relative level of the total lymphocyte pool (CD3+) (
Figure 1 A) did not reveal statistically significant differences between the group of patients with MM and the control group of healthy donors. However, the relative number of conventional lymphocytes in patients and donors was different. Thus, in MM, a significant decrease in the proportion of CD4+ cells was noted (
Figure 1 B) (median value equal to 38.20% (26.68 - 46.06) in patients vs 52.88% (38.63 - 60.62) in donors). The proportion of CD8+ lymphocytes, in turn, also increased in patients with MM (
Figure 1 C) (median value equal to 29.18% (25.88- 36.73) in patients vs 11.87% (6.03 - 21.83) in donors). When assessing the proportion of NKT (CD3+CD16+CD56+) cells, a reliable difference was obtained between the group of patients with MM and conditionally healthy donors. In MM, an increase in NKT cells was observed (
Figure 1 F) (median value equal to 0.75% (0.47 - 1.50) in patients vs 0.32% (0.14 - 0.58) in donors). When assessing the relative number of B-lymphocytes (CD19+), monocytes (CD14+) and NK cells (CD3+CD16+CD56+), statistically significant differences were not obtained (
Figure 1 D, E, G).
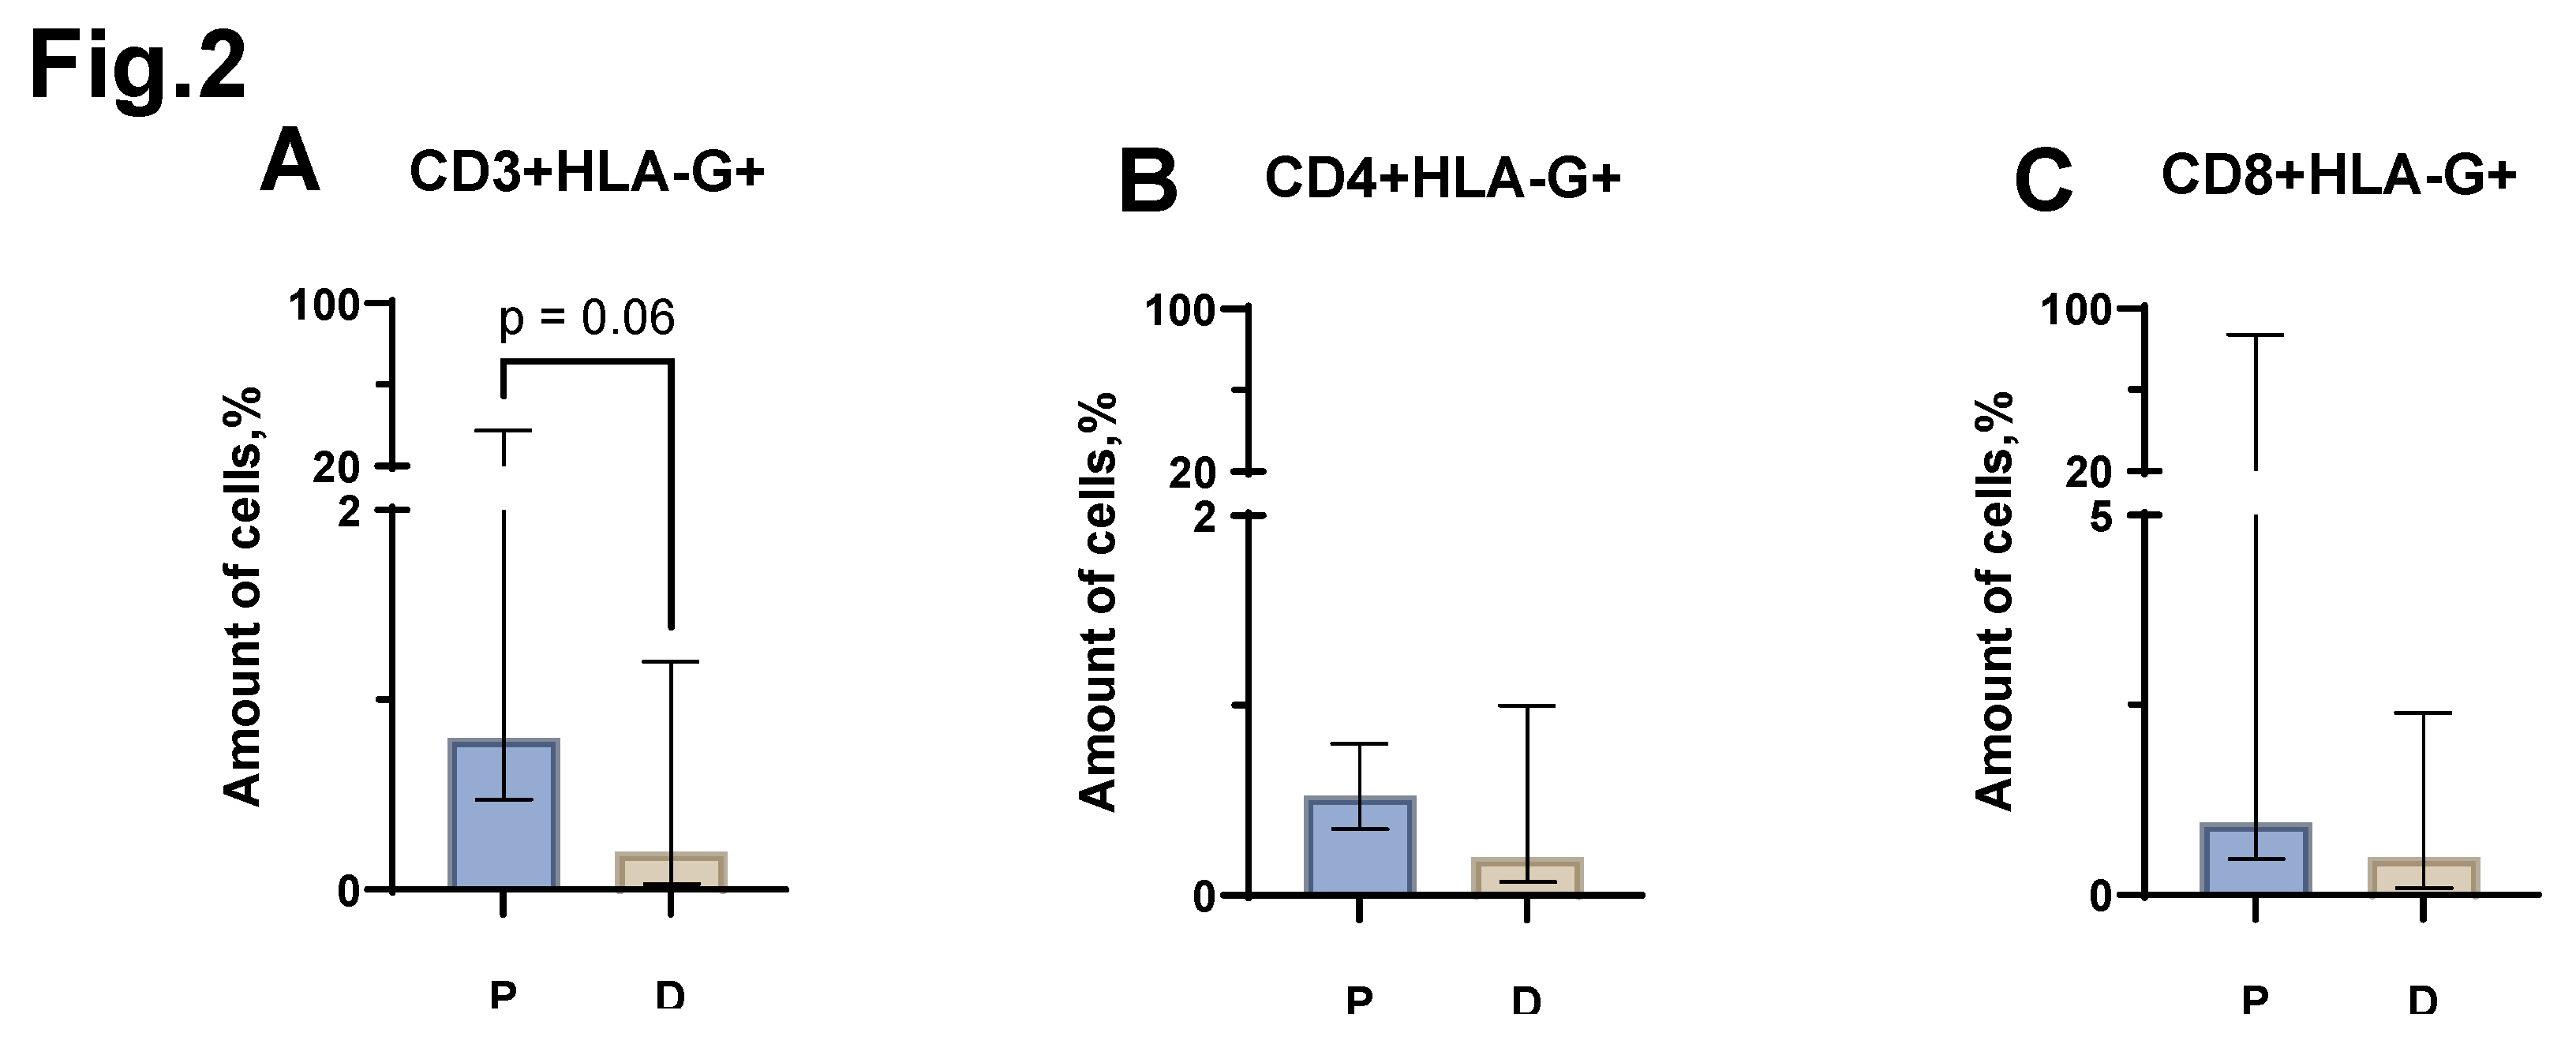
When assessing the proportion of CD3+HLA-G+ cells between the groups of patients with MM and healthy individuals, a trend (p=0.6) was found towards an increase in the proportion of CD3+HLA-G+ in MM (median value equal to 0.8% (0.47-37.50) in patients vs 0.2% (0.03-1.20) in donors) (
Figure 2 A). In the case of CD4+HLA-G+, CD8+HLA-G+ cell populations, no statistically significant differences were observed between patients with MM and donors (
Figure 2 B, C).
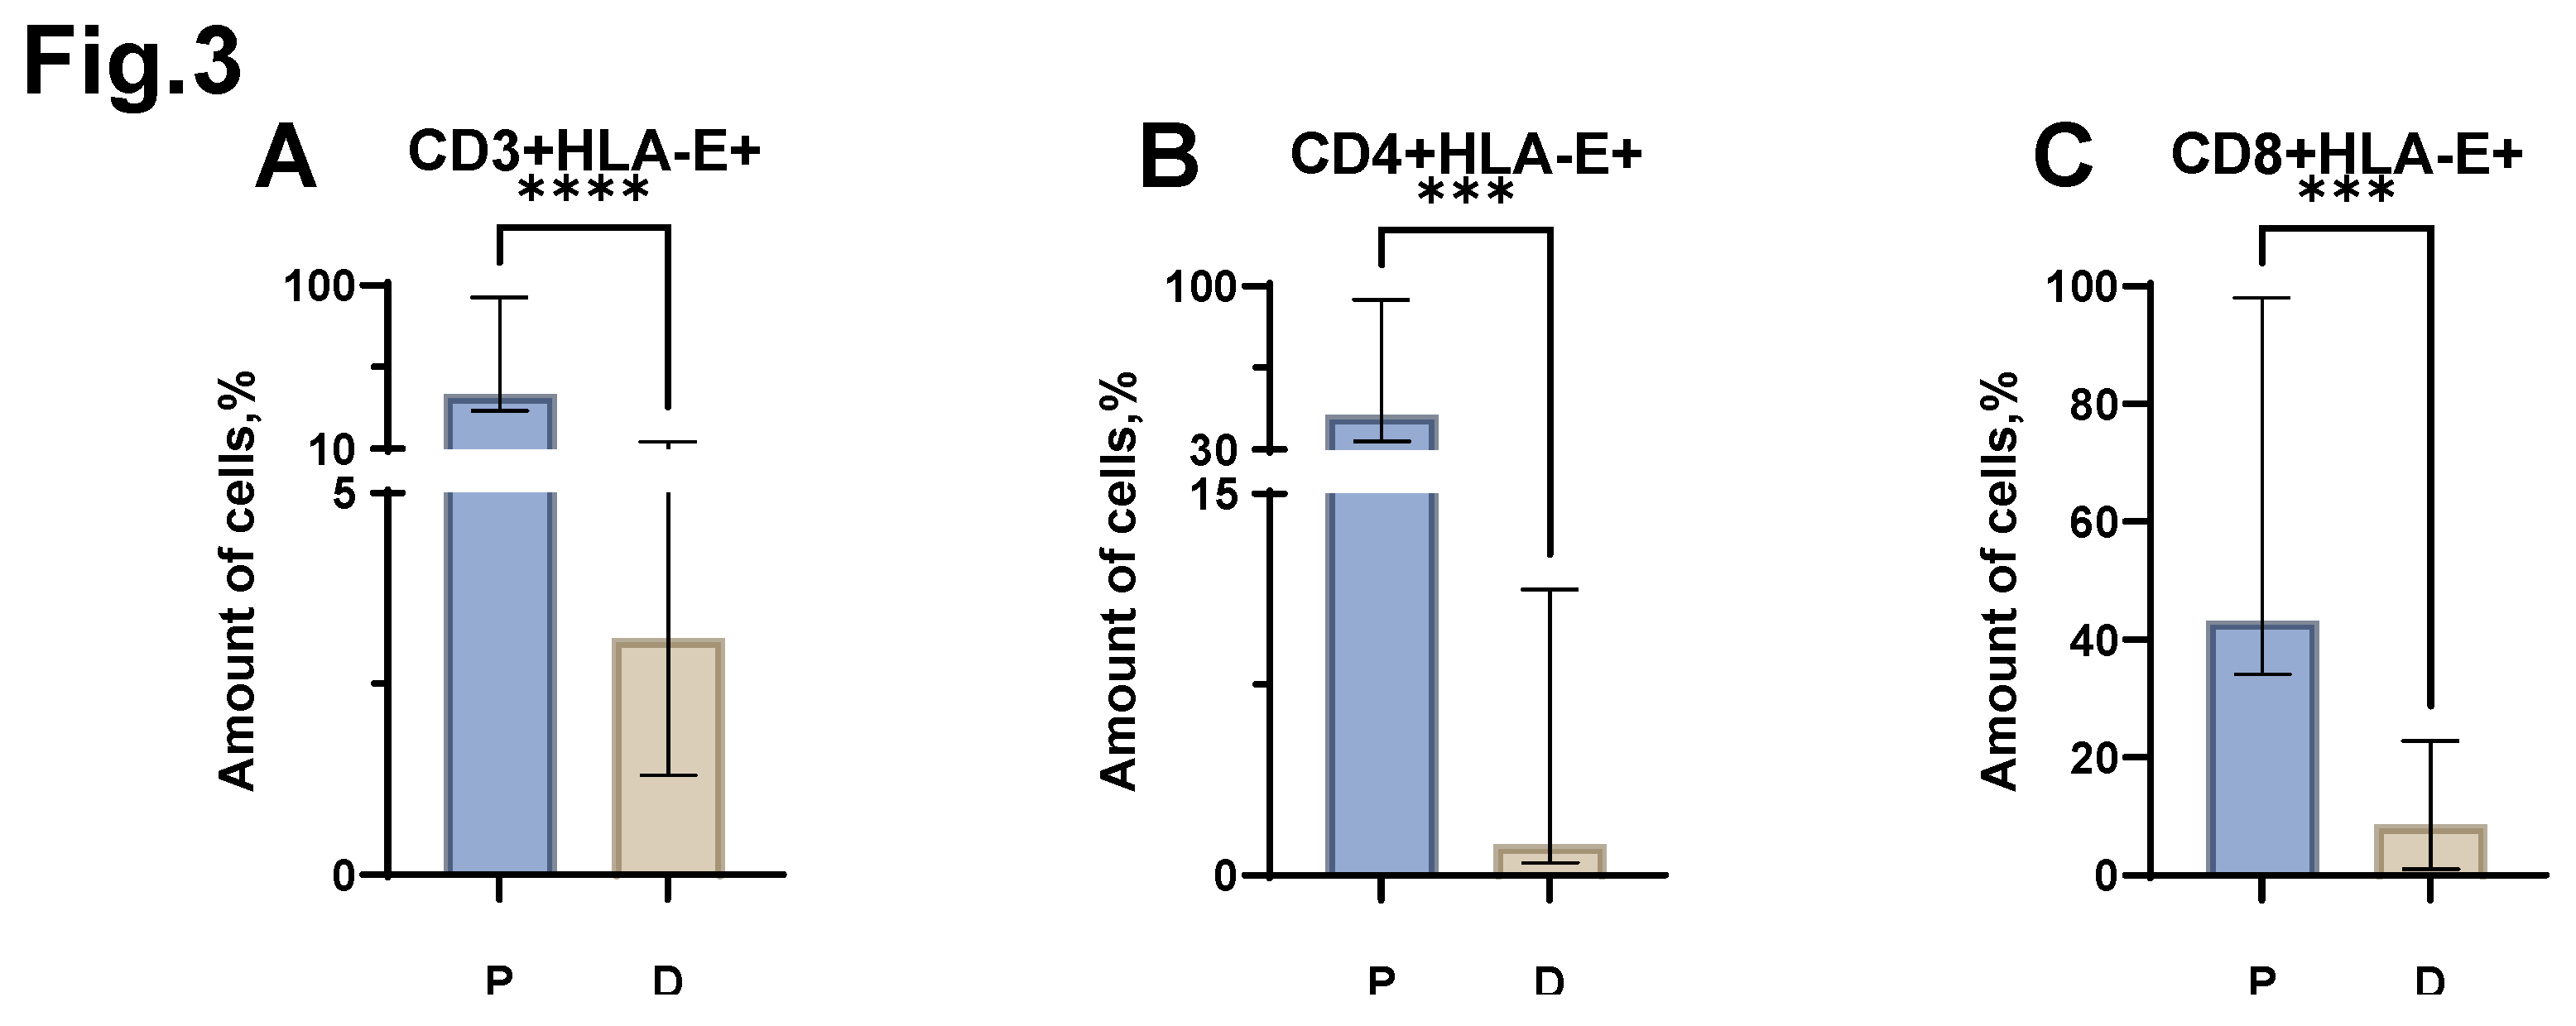
Next, we assessed the relative number of T lymphocytes carrying HLA-E on their surface. An increase in the proportion of CD3+HLA-E+ cells was found in patients with MM (
Figure 3 A) (median value of 40.1% (30.88-93.50) in patients vs. 3.1% (1.30-14.00) in donors). An increase in the proportion of CD4+HLA-E+ was also shown in MM (
Figure 3 B) (median value of 44.9% (33.38-94.25) in patients vs. 1.2% (0.50-11.25) in donors). In the analysis of the proportion of CD8+HLA-E+ cells, an increase was also shown in MM (
Figure 3 C) (median value equal to 43.2% (34.15-98.00) in patients vs 8.6% (1.00-22.75) in donors).
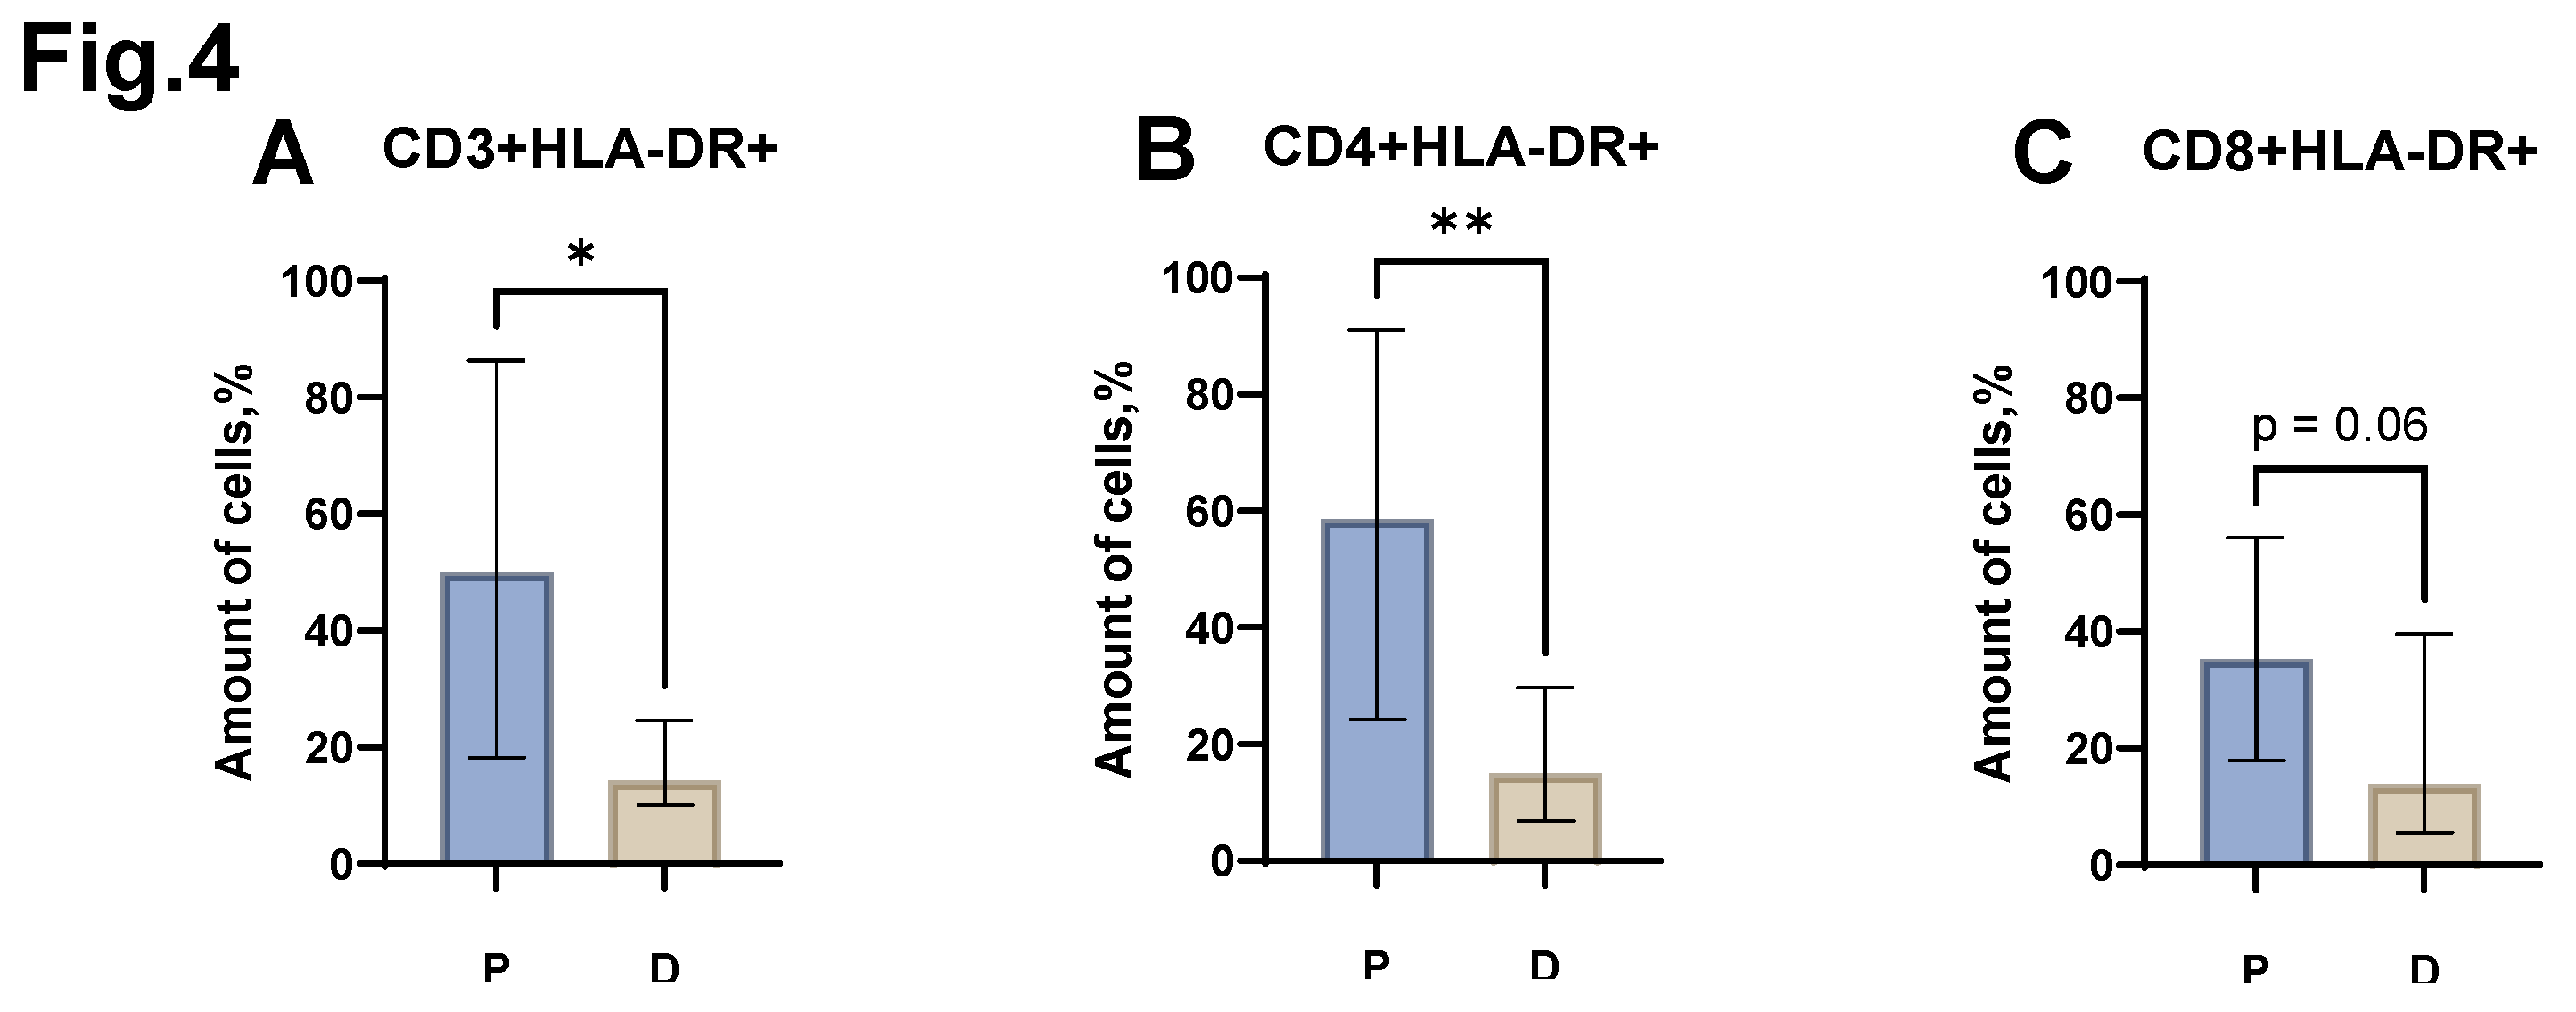
Analysis of the relative level of CD3+HLA-DR+, CD4+HLA-DR+ cells (
Figure 4 A, B) revealed the presence of statistically significant differences between the group of patients with MM and the control group of healthy donors. Thus, an increase in the proportion of CD3+HLA-DR+ was shown in MM (median value equal to 50.0% (18.23- 86.25) in patients vs. 14.3% (10.00- 24.65) in donors). The relative number of CD4+HLA-DR+ also increased in patients with MM (median value equal to 58.6% (24.30- 91.00) in patients vs. 15.0% (6.80-29.70) in donors). A trend (p=0.06) was also obtained in statistical analysis of the proportion of CD8+HLA-DR+ cells (
Figure 4 C) between the group of patients with MM and the control group. At the same time, an increase in the proportion of CD8+HLA-DR+ was observed in MM (median value equal to 35.3% (17.88-56.00) in patients vs. 13.8% (5.50-39.50) in donors).
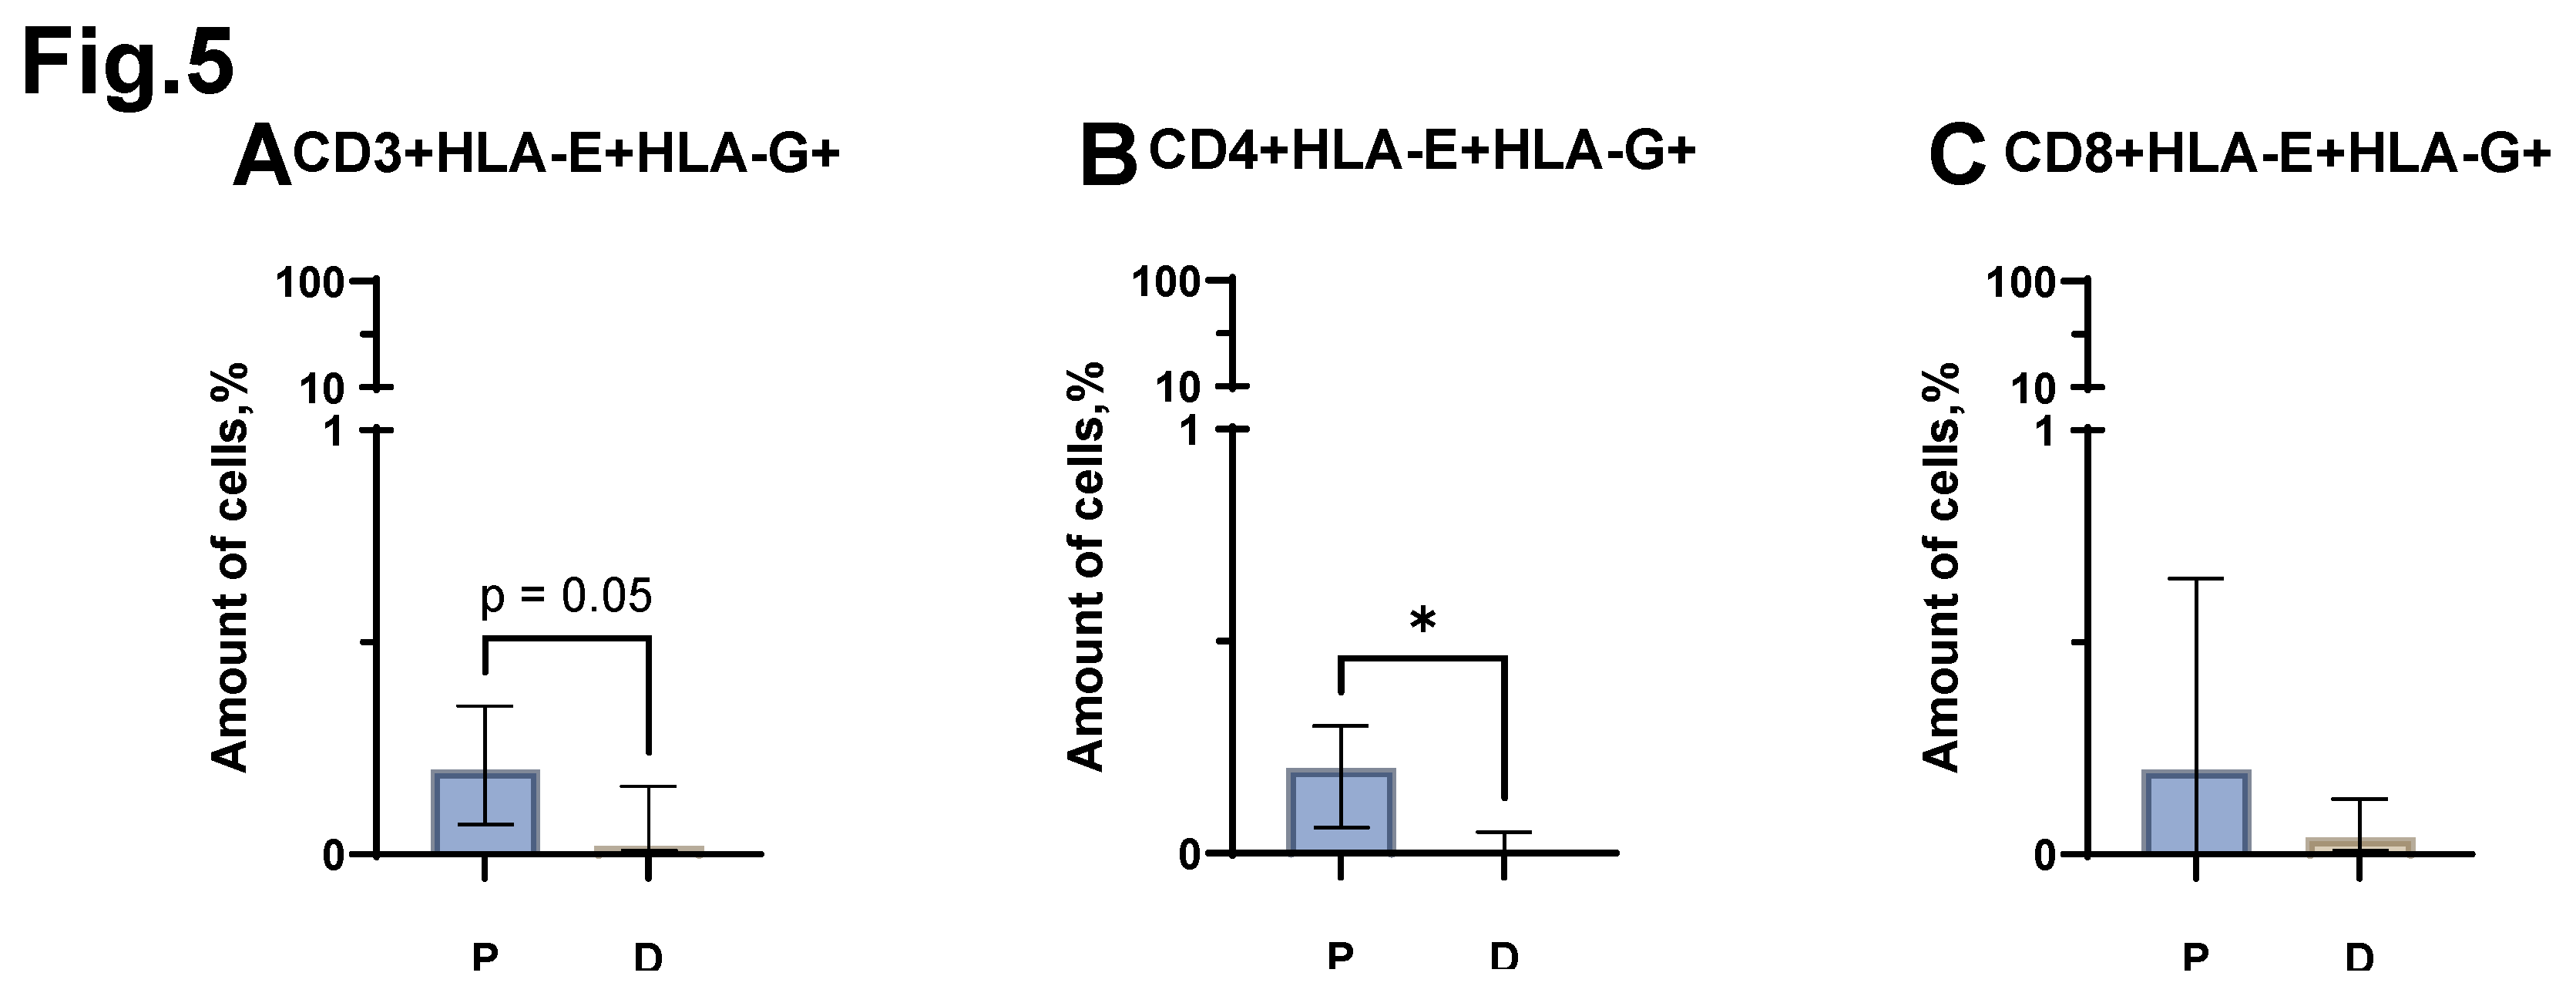
A statistically significant difference was obtained when comparing the proportion of CD4+HLA-E+HLA-G+ cells between the groups of patients with MM and conditionally healthy donors. MM has a higher relative number of CD4+HLA-E+HLA-G+ (
Figure 5 B) (median value equal to 0.2% (0.06-0.30) in patients vs. 0.0% (0.00-0.05) in donors). At the same time, statistical comparison of the proportion of the entire CD3+HLA-E+HLA-G+ pool showed a result at the trend level (p=0.05). Thus, in patients with MM, the proportion of CD3+HLA-E+HLA-G+ cells increases (
Figure 5 A) (median value equal to 0.2% (0.07-0.35) in patients vs. 0.02% (0.01-0.16) in donors). Evaluation of the relative level of CD8+HLA-E+HLA-G+ cells (
Figure 5 C) did not reveal statistically significant differences between the group of patients with MM and the control group of healthy donors.
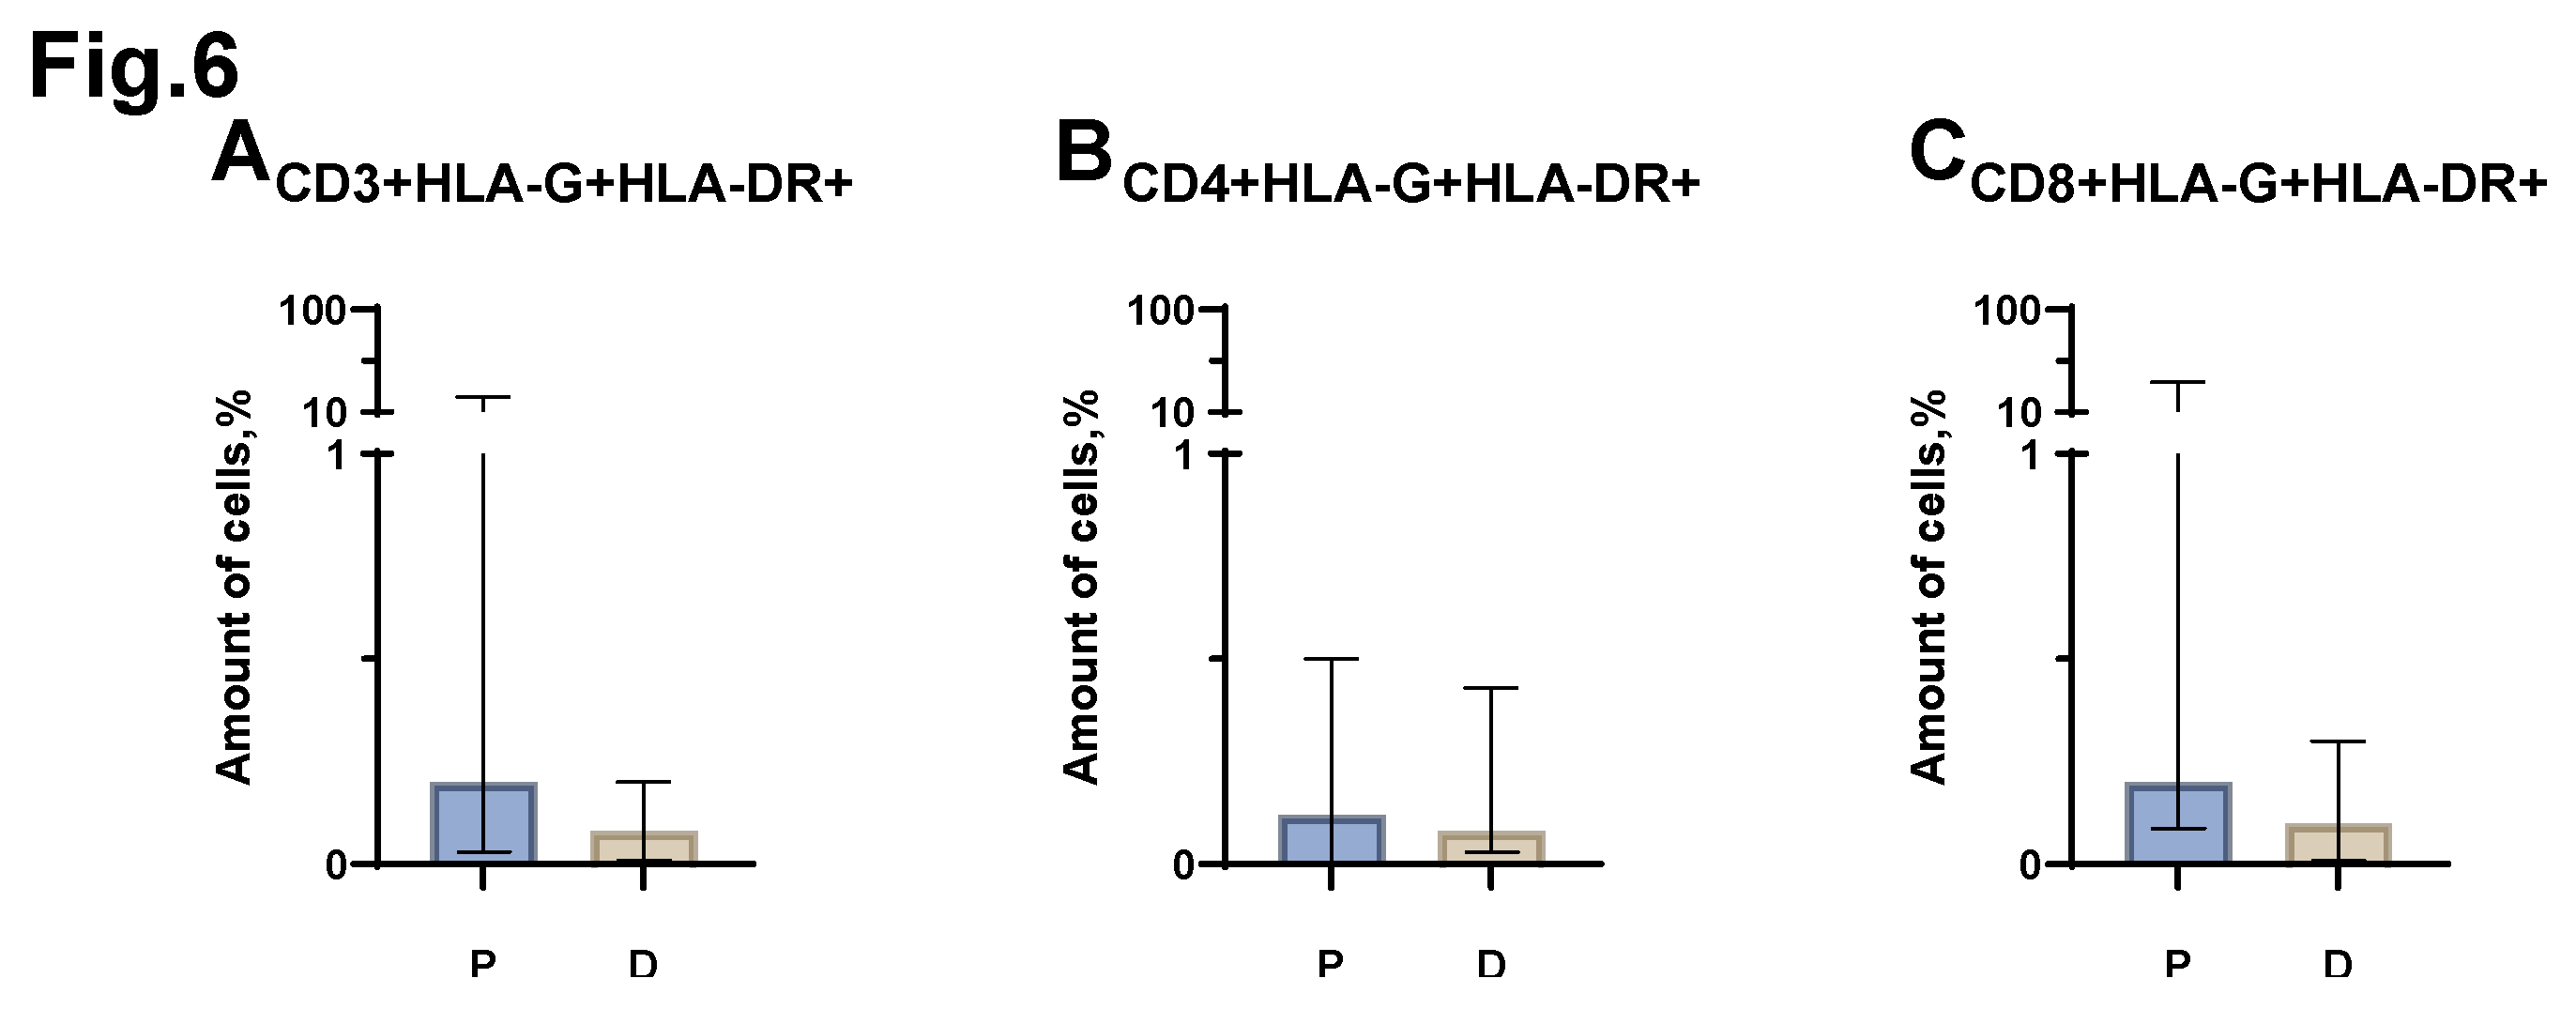
Statistical analysis of the comparison of the relative number of CD3+HLA-G+HLA-DR+, CD3+HLA-G+HLA-DR+, CD3+HLA-G+HLA-DR+ cells (
Figure 6 A, B, C), carried out between the groups of patients with MM and conditionally healthy donors, did not reveal any significant differences.
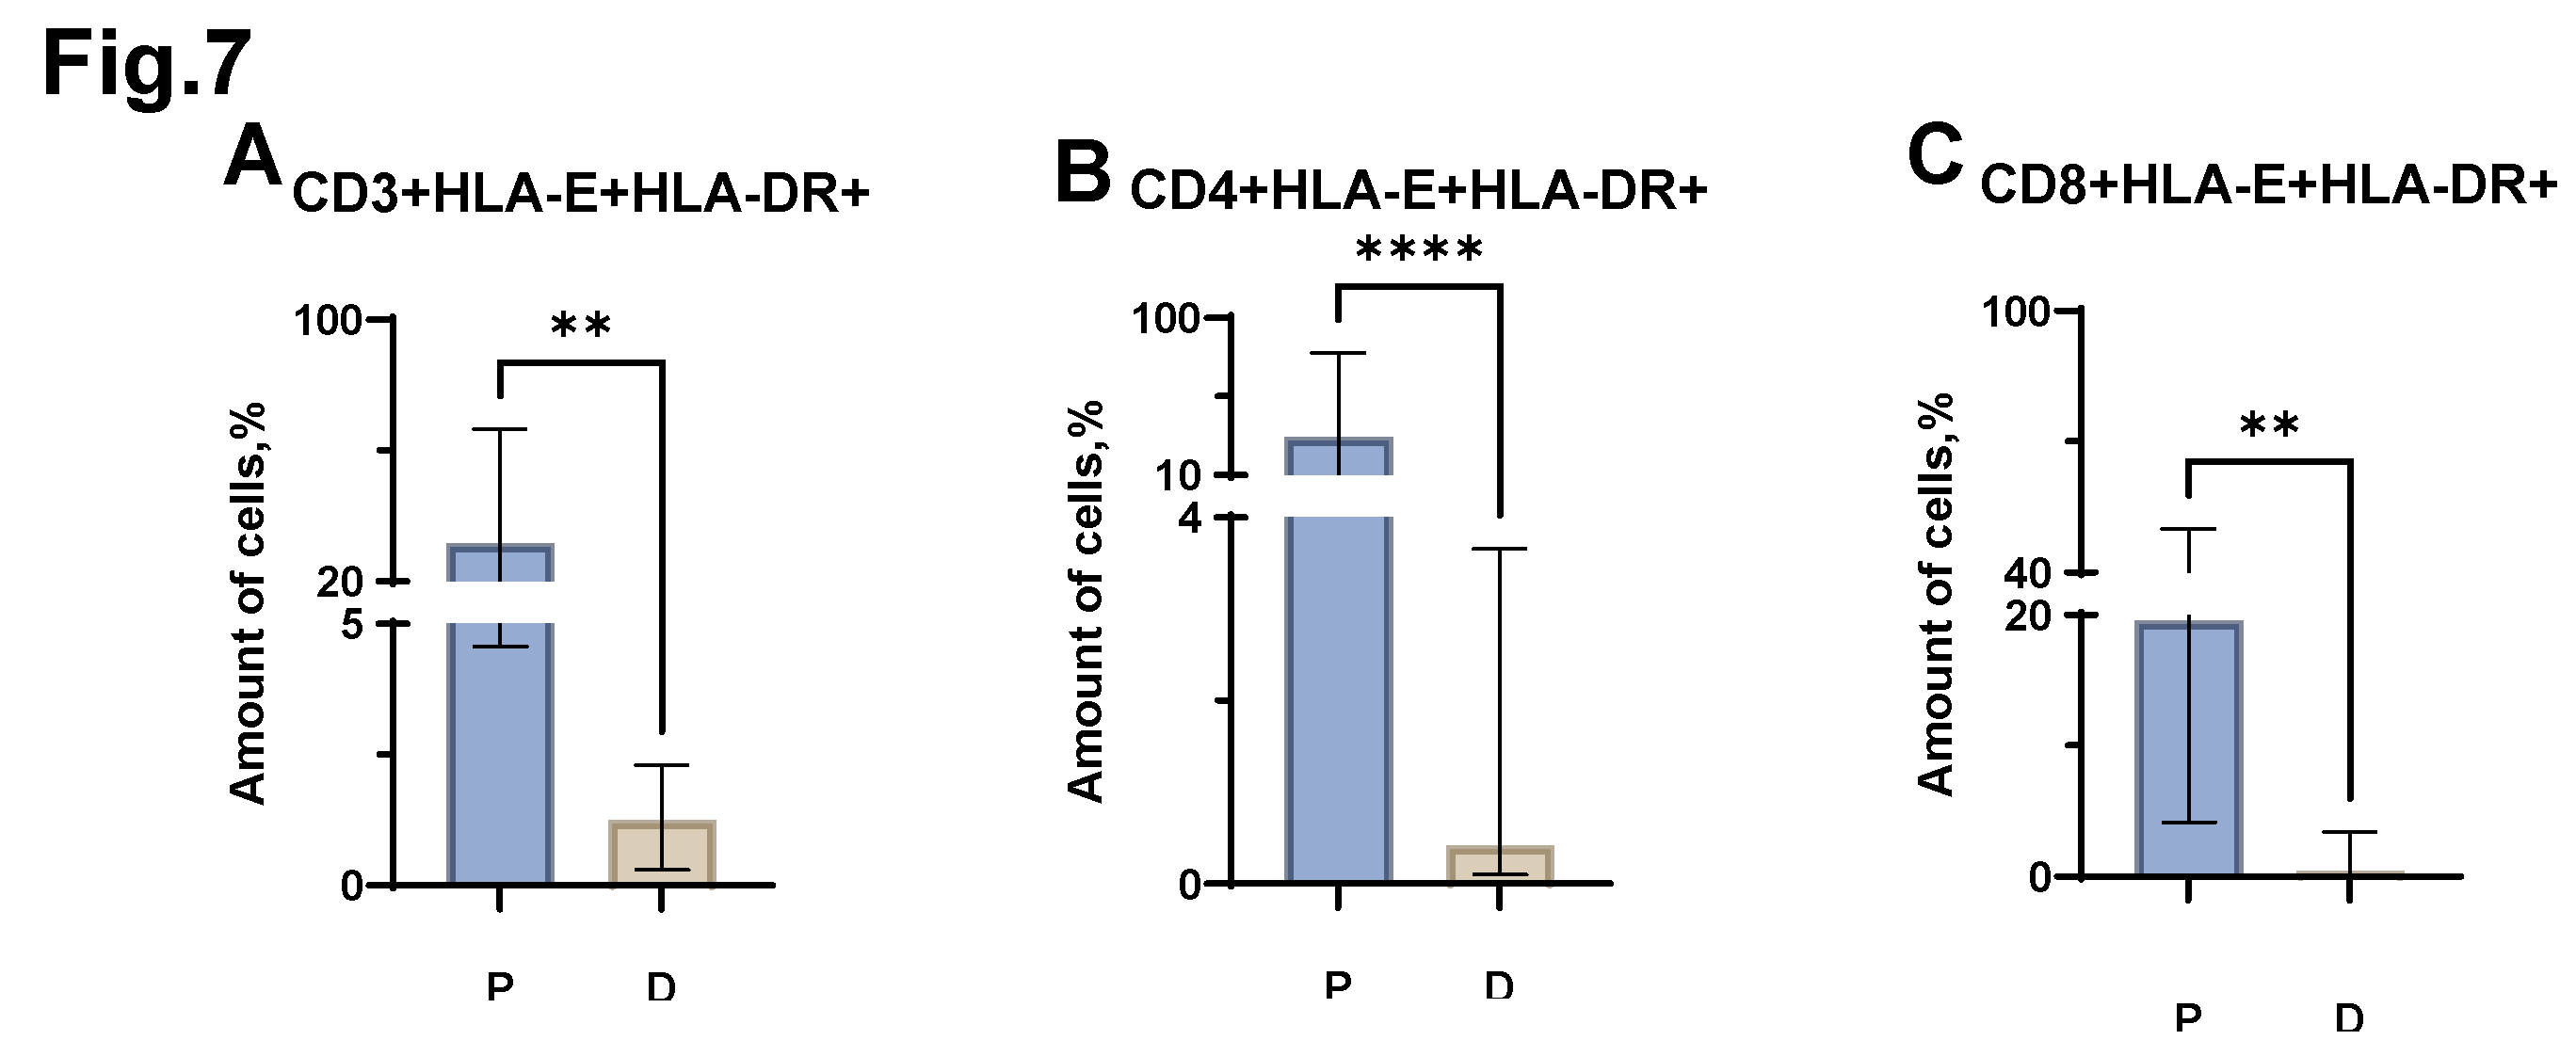
Significant differences were revealed when comparing the proportion of CD3+HLA-E+HLA-DR+, CD4+HLA-E+HLA-DR+, CD8+HLA-E+HLA-DR+ cells (
Figure 7 A, B, C) in MM and in healthy individuals. Thus, in MM, there is an increase in the proportion of both CD3+HLA-E+HLA-DR+ cells (median value equal to 31.7% (4.57-66.45) in patients vs. 1.2% (0.30-2.30) in donors), and CD4+HLA-E+HLA-DR+ (median value equal to 31.9% (8.57-79.76) in patients vs. 0.4% (0.10-3.66) in donors) and CD8+HLA-E+HLA-DR+ cells (median value equal to 19.6% (4.17-50.00) in patients vs. 0.4% (0.08-3.39) in donors).
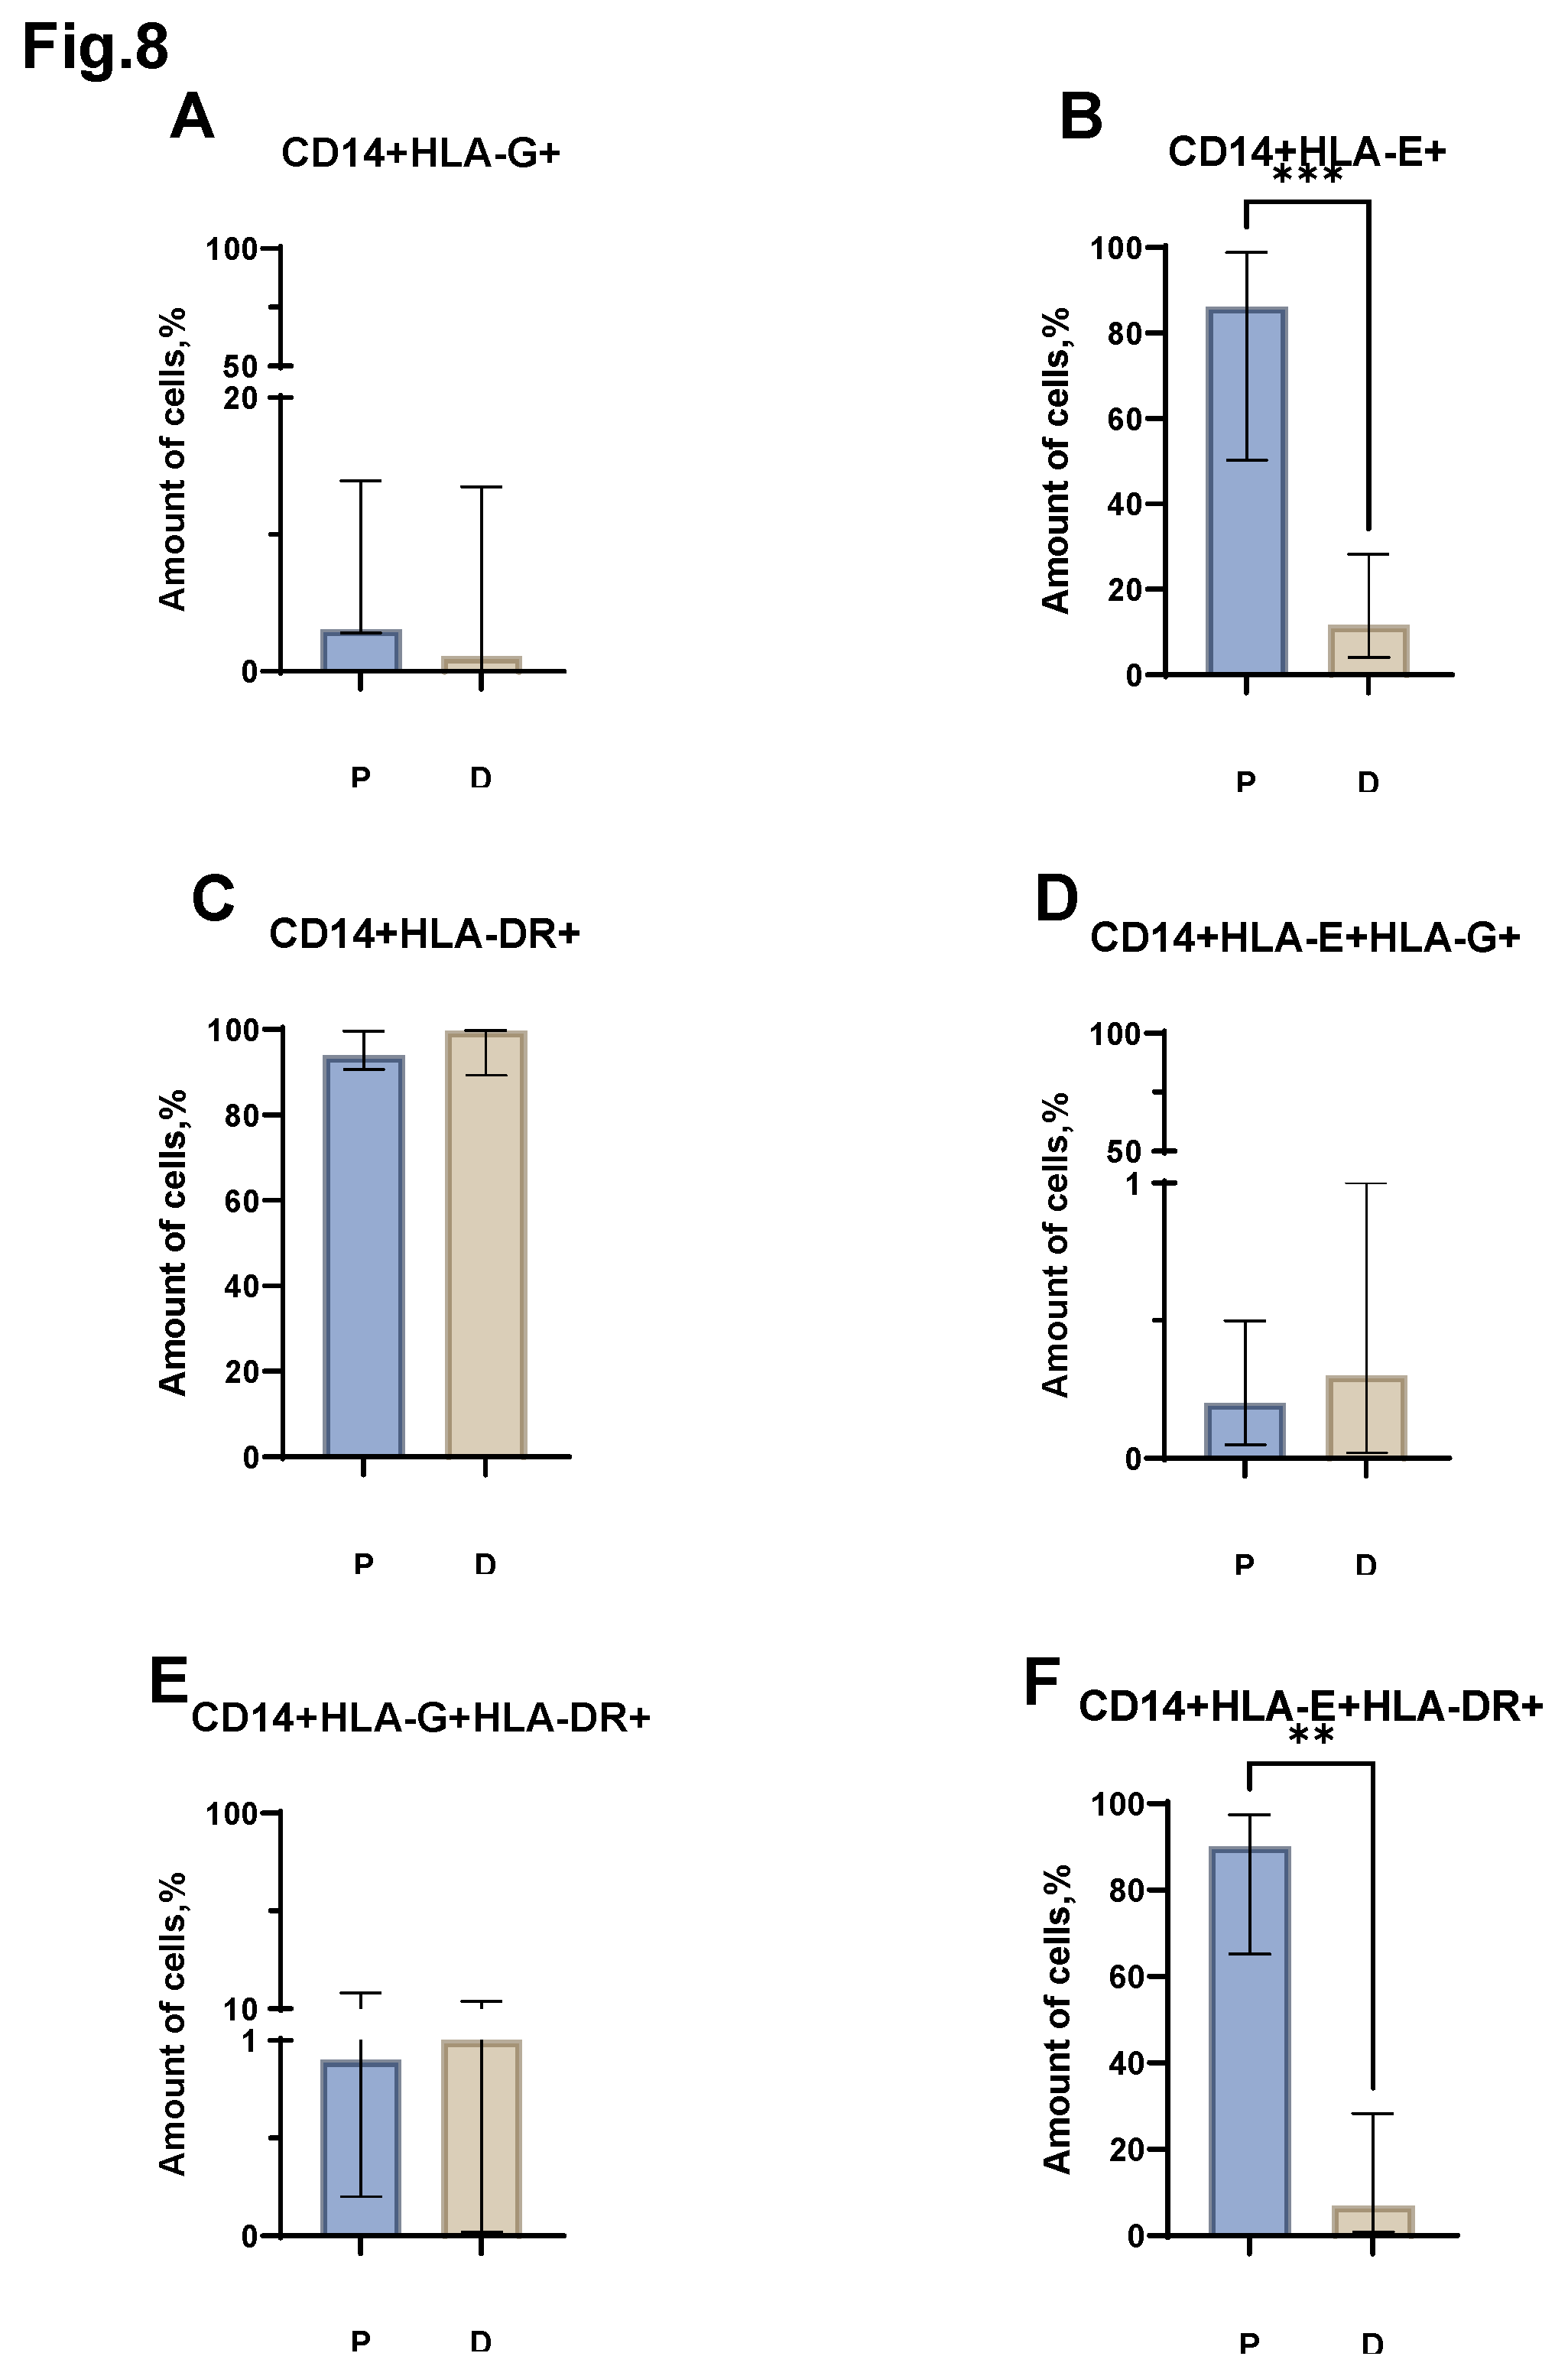
Next, we assessed the relative number of monocytes carrying major histocompatibility complex molecules on their surface (
Figure 8). Differences were obtained in the proportion of CD14+HLA-E+, CD14+HLA-E+HLA-DR+ (
Figure 8 B, F) cells in the group of patients with MM and the group of healthy donors. Thus, the relative number of CD14+HLA-E+ increased in patients with MM (median value equal to 86.2% (50.25-98.84) in patients vs. 11.6% (4.10-28.25) in donors). While the proportion of CD14+ HLA-E+HLA-DR+ cells increased in MM (median value equal to 1.30% (65.23-97.48) in patients vs. 6.9% (0.87-28.25) in donors). Moreover, the analysis of the proportion of CD14+HLA-G+, CD14+HLA-E+, CD14+HLA-DR+, CD14+HLA-E+HLA-G+, CD14+HLA-G+HLA-DR+ cells (
Figure 8 A, C, D, E) between the groups of patients with MM and donors did not reveal any statistically significant differences.
4. Discussion
In the course of the study, we identified and demonstrated changes in the quantitative composition and phenotypic characteristics occurring with subpopulations of immune cells in MM. We discovered a decrease in the proportion of CD4+ T cells, which are an essential support for the CD8+ T cell response. At the same time, both CD8+ and CD4+ cells were in a state of activation, as judged by the increase in the proportion of HLA-DR+ CD4+ and CD8+ cells. One study also noted a significant decrease in CD4+ T cells in a cohort of 170 untreated patients with MM [
44]. Interestingly, other studies have noted a change in the ratio of CD4+ to CD8+ cells, which affected both peripheral blood lymphocytes and those isolated from bone marrow. In this case, an increase in the proportion of CD4+ and CD8+ cells expressing HLA-DR was also noted [
45,
46]. Thus, despite the increase in CD8+ cells in MM, one can assume a disturbance of their functional activity, as evidenced by their acquisition of the exhaustion phenotype. Moreover, another frequently registered change in MM, which has been noted in studies, is a decrease in the proportion of B-lymphocytes associated with the presence of circulating neoplastic cells observed during disease relapse. Such deletion of B-lymphocytes is probably associated with the disruption of normal bone marrow hematopoiesis in MM [
47]. Since the patients in our sample were in partial remission at study inclusion, this explains why we did not detect a significant decrease in the proportion of B cells. Similarly, a number of researchers provide data on monocytes with reduced or absent HLA-DR expression in cancer, suggesting that the tumor process involves a deficiency in antigen presentation [
48]. However, our study did not reveal a significant decrease in CD14+HLA-DR+ in MM.
Similar to our study, the study by T. Dekojová et al. did not reveal a significant difference in the NK cell percentage analysis between MM patients and the donor group. However, their study did note an increase in the immature CD16-56+ NK cell subpopulation. They also noted a decrease in the activating receptor NKG2D on CD16+ NK cells [
49]. However, we have shown an increase in the proportion of NKT cells in MM, which may indicate their functionally significant role in the disease, since other studies have noted a decrease in NKT cells in refractory MM, as well as in relapsed disease [
50].
We have shown an increase in the proportion of HLA-G+ lymphocytes in MM. Interestingly, despite the absence of statistically significant differences between the groups of patients with MM and donors in the CD8+ cell population, the relative number of CD8+HLA-G+ cells in some patients reached 90% of all CD8+. Other studies devoted to this topic have shown that activated T lymphocytes are able to receive membrane forms of HLA-G from APCs and tumor cells by trogocytosis. Moreover, T cell populations reach their maximum trogocytic capacity only in the late stages of activation. By changing their phenotype, CD8+HLA-G+ cells begin to implement a regulatory function [
51]. Thus, it can be speculated that an increased proportion of CD8+HLA-G+ cells derived from CD8+HLA-DR+ cells may be an indicator of a worse prognosis. However, this hypothesis requires further study with a comparison of patient clinical data.
The most interesting result of our study was the detection of an increased proportion of HLA-E+HLA-DR+ cells among T lymphocytes and monocytes in MM. Although increased HLA-E expression on tumor cells in MM has been reported previously [
52], we have shown a significant increase in the proportion of CD3+ lymphocytes, including CD4+ and CD8+, as well as an increase in the proportion of CD14+ (monocytes) co-expressing HLA-E and HLA-DR molecules in the peripheral blood of patients with MM. The exact cause of such an increase in HLA-E expression on immunocompetent cells in MM has not yet been precisely established. It’s possible that, as with the appearance of the HLA-G+ molecule on activated lymphocytes, trogocytosis mechanisms are at work here. In any case, it can be hypothesized that in this way, the pool of dysfunctional cells that arises in MM avoids the pro-apoptotic signal, thereby maintaining the remaining anti-tumor cells in a state of anergy, which leads to incomplete elimination of the tumor clone and, subsequently, relapse.
Figure 1.
Relative number of major immune cell subsets in peripheral blood of patients with MM (P) and conventionally healthy donors (D) assessed by flow cytometry. Results represent the percentage of CD3+ (Pic. A), CD4+ (Pic. B), CD8+ (Pic. C), CD19+ (Pic. D), CD3-CD16+CD56+ (Pic. E) and CD3+CD16+CD56+ (Pic. F) lymphocytes from the total lymphocyte count. Results represent the percentage of CD14+ (Pic. G) leukocytes from the total leukocyte count, *p < 0.5, ** p < 0.01, *** p < 0.001. Mann-Whitney test; Data are presented as median with interquartile range (25th–75th percentiles).
Figure 2.
Relative number of HLA-G+ CD3+ T-lymphocyte populations obtained from the peripheral blood of patients with MM (P) and conditionally healthy donors (D) and assessed by flow cytometry. The CD3+ HLA-G+ result (Fig. A) reflects the percentage of the total CD3+ lymphocytes. The CD4+ HLA-G+ result (Fig. B) reflects the percentage of the total CD4+ lymphocytes. The CD8+ HLA-G+ result (Fig. C) reflects the percentage of the total CD8+ lymphocytes. Mann-Whitney test; Data are presented as median with interquartile range (25th–75th percentiles).
Figure 3.
Relative numbers of HLA-E+ CD3+ T-lymphocyte populations obtained from the peripheral blood of patients with MM (P) and conventionally healthy donors (D) and assessed by flow cytometry. The CD3+ HLA-E+ result (Fig. A) reflects the percentage of the total CD3+ lymphocytes. The CD4+ HLA-E+ result (Fig. B) reflects the percentage of the total CD4+ lymphocytes. The CD8+ HLA-E+ result (Fig. C) reflects the percentage of the total CD8+ lymphocytes. *** p <0.001, **** p <0.0001. Mann-Whitney test; Data are presented as median with interquartile range (25th–75th percentiles).
Figure 4.
Relative numbers of HLA-DR+ CD3+ T-lymphocyte populations obtained from the peripheral blood of patients with MM (P) and conventionally healthy donors (D) and assessed by flow cytometry. The CD3+HLA-DR+ result (Fig. A) reflects the percentage of the total CD3+ lymphocytes. The CD4+HLA-DR+ result (Fig. B) reflects the percentage of the total CD4+ lymphocytes. The CD8+HLA-DR+ result (Fig. C) reflects the percentage of the total CD8+ lymphocytes. *p < 0.5, ** p < 0.01. Mann-Whitney test; Data are presented as median with interquartile range (25th–75th percentiles).
Figure 5.
Relative number of HLA-E+HLA-G+ expressed T-lymphocytes, obtained from the peripheral blood of patients with MM (P) and conditionally healthy donors (D) and assessed by flow cytometry. The CD3+HLA-E+HLA-G+ result (Fig. A) reflects the percentage of the total number of CD3+ lymphocytes. The CD4+HLA-E+HLA-G+ result (Fig. B) reflects the percentage of the total number of CD4+ lymphocytes. The CD8+ HLA-E+HLA-G+ result (Fig. C) reflects the percentage of the total number of CD8+ lymphocytes. *p < 0.5. Mann-Whitney test; Data are presented as median with interquartile range (25th–75th percentiles).
Figure 6.
Relative number of HLA-G+HLA-DR+ T-lymphocytes obtained from the peripheral blood of patients with MM (P) and conditionally healthy donors (D) and assessed by flow cytometry. The CD3+HLA-G+HLA-DR+ result (Fig A) reflects the percentage of the total number of CD3+ lymphocytes. The CD4+HLA-G+HLA-DR+ result (Fig. B) reflects the percentage of the total number of CD4+ lymphocytes. The CD8+HLA-G+HLA-DR+ result (Fig. C) reflects the percentage of the total number of CD8+ lymphocytes. Mann-Whitney test; Data are presented as median with interquartile range (25th–75th percentiles).
Figure 7.
Relative numbers of HLA-E+HLA-DR+ T-lymphocyte populations obtained from the peripheral blood of patients with MM (P) and conditionally healthy donors (D) and assessed by flow cytometry. The CD3+HLA-G+HLA-DR+ result (Fig. A) reflects the percentage of the total number of CD3+ lymphocytes. The CD4+HLA-E+HLA-DR+ result (Fig B) reflects the percentage of the total number of CD4+ lymphocytes. The CD8+HLA-E+HLA-DR+ result (Fig. C) reflects the percentage of the total number of CD8+ lymphocytes. ** p <0.01, **** p <0.0001. Mann-Whitney test; Data are presented as median with interquartile range (25th–75th percentiles).
Figure 8.
Relative amounts of HLA-G+, HLA-E+, HLA-DR+, HLA-E+HLA-G+, HLA-G+HLA-DR+, HLA-E+HLA-DR+ monocyte populations in the peripheral blood of patients with MM (P) and conditionally healthy donors (D) and assessed using flow cytometry. The CD14+HLA-G+ result (Pic. A) reflects the percentage of the total number of CD14+ monocytes. The CD14+HLA-E+ result (Pic. B) reflects the percentage of the total number of CD14+ monocytes. The CD14+HLA-DR + result (Pic. C) reflects the percentage of the total number of CD14+ monocytes. The CD14+HLA-E+HLA-G+ result (Pic. D) reflects the percentage of the total number of CD14+ monocytes. The CD14+ HLA-G+HLA-DR+ result (Pic. E) reflects the percentage of the total number of CD14+ monocytes. The CD14+ HLA-E+HLA-DR+ result (Pic. F) reflects the percentage of the total number of CD14+ monocytes. ** p < 0.01, **** p < 0.0001, Mann-Whitney test; Data are presented as median with interquartile range (25th–75th percentiles).