
Submitted:
21 August 2024
Posted:
21 August 2024
You are already at the latest version
Abstract
Advanced chronic lymphocytic leukemia (CLL) is accompanied by increased circulating regula-tory T cells (Tregs) and increased susceptibility to severe infections, which were also shown to en-tail a striking induction of FOXP3 expression in Tregs. As homeostasis of the most suppressive CD45RA-FOXP3high activated Treg (aTreg) subset differs, it is critical to analyse homeostatic sig-naling in Treg subsets. Therefore, in this study, by using conventional and imaging flow cytome-try, we monitored STAT5 signaling/phosphorylation (pSTAT5) and investigated Treg subsets in relation to the Binet stage, the total tumor mass score (TTM) and disease course during follow-up of 37 patients with CLL. aTreg percentage was significantly increased among CD4+ T cells from patients with advanced disease and significantly correlated with the TTM. A subgroup of patients with higher aTreg percentages among CD4+FOXP3+ T cells at the start of therapy was character-ized by more frequent episodes of severe infections during follow-up, suggesting that aTreg frac-tion could represent a possible marker of severe disease course with infectious complications. Augmented homeostatic STAT5 signaling could support aTreg expansion, as higher pSTAT5 lev-els were significantly corelated with increased aTreg frequency among CD4+FOXP3+ T cells during follow-up of patients on therapy as well as following SARS-CoV-2 antigen-specific stimulation in vitro.
Keywords:
Chronic lymphocytic leukemia (CLL)
; Signal Transduction
; Cytokines
; T Cells
1. Introduction
Chronic lymphocytic leukemia (CLL), characterized by the accumulation of monoclonal B lymphocytes in bone marrow, lymphoid organs, and peripheral blood, is the most common form of leukemia in the western countries [1]. CLL cells are dependent on the microenvironment and the progression of CLL is associated with the modification of diverse immune cell populations to create a niche appropriate for the proliferation and survival of leukemic B cells [2]. Patients with CLL have a higher risk of both more severe coronavirus disease (COVID-19) and higher mortality [3,4]. They are more susceptible to infections, which are also the most common cause of death in these patients [5]. The immunosuppressive CLL microenvironment, which supports disease progression and contributes to CLL escape from immune surveillance, is thought also to significantly destabilize the whole immune response of a CLL patient [6]. Impairments in the regulation of the immune system that occur in CLL patients at an early stage and are exacerbated during disease progression, are also responsible for the poor response of these patients to infections with various pathogens [5,7,8]. Clonal change in B lymphocytes in CLL has a strong effect not only on susceptibility to infections, but also on the humoral-antibody response to vaccines [9]. Adequate humoral immune response requires helper T cells (CD4+ T lymphocytes), which play an essential role in recruiting and activating B lymphocytes, which are responsible for antibody production. CD4+ T lymphocyte responses to viral spike protein have been shown to correlate with anti-SARS-CoV-2 IgG and IgA antibody titers [10].
A special subpopulation of CD4+ T lymphocytes are regulatory T lymphocytes (Treg), which express the characteristic transcription factor FOXP3 and show in vitro suppression [11,12]. Tregs constitute an essential mechanism of peripheral T cell tolerance. This was first demonstrated in Treg-depleted animal models, which develop diffuse autoimmunity [13].
Tregs were found to play a major role also in the development of an immunosuppressive tumor microenvironment in patients with various cancers before [14] and to comprise of functionally distinct subpopulations [15]. As shown in a recent study, signaling responsiveness to cytokines only in a specific - activated (aTreg) subset in peripheral blood, reflects intratumoral immunosuppressive potential and predicts future relapse [16].
The results of several studies indicate an increased proportion of total Treg cells in CLL patients compared to healthy controls and association with disease course [17,18,19,20]. However, the importance of different Treg subpopulations and their cytokine signaling in disease progression or response to treatment has not been definitively determined to date. In addition, in CLL patients, signaling responses to cytokines were studied mostly in clonal B cells, but not in CD4+ T cell subsets [21,22]. Through their intracellular signaling pathways that originate from surface receptors, primarily through STAT5 proteins (Signal Transducers and Activator of Transcription 5), homeostatic cytokines, such as IL-2 and IL-7, act on both Treg and other - FOXP3 negative / conventional CD4+ T cells (Tcon). Once activated, STAT proteins are phosphorylated at specific tyrosine residues and translocate to the nucleus, where they control multiple gene programs that regulate also their proliferation [23]. Recent studies have demonstrated that Treg are subject to distinct homeostatic STAT5 signaling controls than Tcon subsets [24,25]. However, little is known of the nature of STAT5 signaling dysfunctions in CD4+ T-cell subsets and their possible role in perturbed Treg/Tcon homeostasis, disease progression and susceptibility to infections in patients with CLL.
The aim of our study was to investigate if the Treg subsets and STAT5 phosphorylation (pSTAT5) are altered in CD4+ T-cells in blood of patients with CLL and whether the changes in circulating Treg subsets are related to STAT5 signaling imbalances, to the Binet stage, the estimate of the size of tumor mass and to disease course during the long-term follow-up. By using phospho-specific flow cytometry, our analysis was designed to monitor pSTAT5 also during in vitro SARS-CoV-2 antigen-specific stimulation and to directly compare STAT5 activation in Tcon and activated Treg subsets in each patient.
2. Materials and Methods
2.1. Study Population
Fifty-six untreated consecutive patients meeting the diagnostic criteria for CLL [26] were enrolled into the single-centre, prospective cohort study.
Thirty-seven out of 56 patients with the start of therapy at enrollment (disease activity according to international workshop on CLL - iwCLL criteria [26]) were followed up to 500 days. Demographic, clinical and laboratory data at the time of follow-up study entry are presented in Table 1. Therapy during follow-up is described in Table 2. During the follow-up an episode of Grade ≥3 infection was defined as in Common Terminology Criteria for Adverse Events (CTCAE) Version 5.0.
Blood samples were also taken from twenty healthy controls with a mean age of 60.3 years (minimum 51.4 and maximum 82.7 years) who had no history of allergies, acute infections, autoimmune disorders, or immunosuppressive medicines.
The SARS-CoV-2 Ag-specific pSTAT5 response was, in addition to two patients included in the follow up study, examined in 10 CLL patients (independent of their stage of the disease), which all received two doses of the BNT162b2 mRNA COVID-19 vaccination from 26 to 28 months ago. Within a few months, a couple of them had also recovered from a recent SARS-CoV-2 infection.
Supplementary Table S1 displays pertinent clinical and demographic information for the recruited patients that were not included in the follow-up study.
Blood samples were also taken from 12 healthy laboratory staff members for the SARS-CoV-2 antigen-specific pSTAT5 assay 26 to 32 months after the second dose of the BNT162b2 mRNA COVID-19 vaccine, or after they had recovered from SARS-CoV-2 infection.
2.2. Preparation of Whole Blood Samples for Analysis of STAT5 Phosphorylation
EDTA anticoagulated whole blood was used to prepare samples for flow cytometry investigation of basal and cytokine-induced STAT5 phosphorylation ex vivo. Generally, 100 µL of sample was either left untreated or treated with 100 ng/mL IL-2 (Peprotech, Rocky Hill, NJ, USA) for 15 minutes at 37 °C in a water bath. The sample was placed in a round-bottom polystyrene test tube (Falcon® 5 mL).
Whole blood samples were fixed for 10 minutes using 2 mL of BD Phosflow Lyse/Fix Buffer (BD Biosciences, San Jose, CA, USA) to stop phosphorylation. After centrifuging the samples at 300 x g for 7 minutes, the cells were permeabilized by letting them sit on ice in 1 mL of diluted BD Perm Buffer III (BD Biosciences) for half an hour.
2.3. Flow Cytometry Analysis after Staining with Antibodies Specific to T-Cell Subsets and Phosphorylated STAT5 Tyrosine
Following permeabilization, the samples were centrifuged for five minutes at 300 x g, and then they were repeatedly washed with two millilitres of phosphate-buffered saline (PBS). Subsequently, the cells were stained for 30 minutes in 100 µL of stain buffer (PBS/2% FBS) using the following antibodies: anti-CD45-PerCP (5 μL, clone 2D1), BV786 (1 μL, clone HI30) or APC-Cy7 (5 μL, clone 2D1), anti-CD3-FITC (10 μL, clone UCHT1), BV650 (3 μL, clone SK7), or PerCP (20 μL, clone SK7), as well as antibodies that recognize particular phosphorylated STAT5 tyrosine: pSTAT5 (Y694)-Alexa647 (10 μL, clone 47) or PE (10 μL, clone 47) (all BD Biosciences). Antibodies specific to T cell subsets were used to simultaneously stain cells at room temperature for multiparametric immunophenotyping assays. These antibodies included anti-CD25-PE (10 μL, clone 2A3), BV421 (3 μL, clone 2A3) or APC (5 μL, clone 2A3), anti-CD4-PECy7 (5 μL, clone SK3) or BV750 (2 μL, clone SK3), anti-FOXP3-Alexa 488 (10 μL, clone 259D/C7) or PE (10 μL, clone 259D/C7) (all BD Biosciences), anti-Ki67 PE (10 μL, clone B56) or BV650 (3 μL, clone B56) and CD45RA PE-Cy7 (0,5 μL, HI100) or APC (5 μL, clone HI100). Finally, cells were washed with 2 mL of stain buffer and acquisition was performed on LSR II or FACSymphony A3 Flow Cytometer (Beckton Dickinson, Franklin Lakes, NJ, USA). Subsequent analysis, including the measurement of the median fluorescence intensity (MFI) of the pSTAT5-specific signal, was performed using FACSDiva software (Becton Dickinson) and FlowJo (TreeStar, Ashland, OR, USA, now part of BD Biosciences)
The "fluorescence-minus-one plus isotype" (FMO+I) control was used to set the gate for CD25+ and Ki-67+ cells. The same antibodies were used for staining as in the full stain, with the exception of the anti-CD25 and anti-Ki-67 antibodies, which were replaced with an isotype control antibody labelled with the same fluorochorome.
2.4. Flow Cytometric Analysis of pSTAT5 in Treg Subsets after Whole Blood Stimulation with SARS-CoV2-Specific Antigens
Using heparinized antigen tubes from the QuantiFERON SARS-CoV-2 kit (Qiagen, Hilden, Germany), we assessed STAT5 signaling responses to whole blood antigen-specific stimulation. CD4+ epitopes from the spike protein's S1 subunit are present in the SARS-CoV-2 Ag1 tube, and CD4+ and CD8+ epitopes from the spike protein's S1 and S2 subunits are present in the SARS-CoV-2 Ag2 tube.
After being taken straight into the test collecting tubes, whole blood samples were agitated and allowed to incubate for 16–24 hours.
Before centrifugation and preparation for STAT5 signaling analysis, whole-blood aliquots (120 μL) were taken from Nil (negative control) and the two Ag tubes (60 μL each, mixed together) of the QuantiFERON SARS-CoV-2 kit. As described above for analysis of basal and cytokine-induced STAT5 phosphorylation ex vivo, fixing the samples with 2 mL of BD Phosflow Lyse/Fix Buffer (BD Biosciences, San Jose, CA, USA) for 10 minutes stopped the phosphorylation process. After that, samples were centrifuged at 300 x g for 7 min and incubated for 30 min in 1 mL of ice-cold BD Perm Buffer III (BD Biosciences) to permeabilize the cells. Following permeabilization, the samples were centrifuged for five minutes at 300 x g, and repeatedly washed with two millilitres of PBS. The cells were then stained with the following combination of anti-human fluorescent monoclonal antibodies (all from Becton Dickinson, San Jose, CA, USA) for 30 minutes at room temperature in 100 µL of stain buffer (PBS/2% FBS): anti-pSTAT5-Alexa647, FOXP3 FITC, CD4 BV750, CD45RA PE-Cy7 (3 μL, HI100), CD25 BV421, and CD3 BV786 (2 μL, clone UCHT1). The FACSymhony A3 flow cytometer was used to analyse the cells, and FlowJo software (Tree Star) and FacsDiva software (Becton Dickinson, San Jose, CA, USA) were utilized for data analysis.
2.5. Imaging Flow Cytometry Analysis
After preparing and staining whole blood samples in the manner previously mentioned for CD3, FOXP3, CD4, and pSTAT5, 20 ng/mL 7-AAD (BD Biosciences) was used as a counterstain. Using the ImageStreamX imaging flow cytometer (Amnis, Seattle, WA, USA), image files of each sample were acquired, and IDEAS software (Amnis) was used for analysis, as previously described [29]. Gating on 7-AAD-positive events with high nuclear aspect ratios (minor to major axis ratio, a measure of circularity) and high nuclear contrast (as determined by the Gradient Max feature) allowed for the identification of in-focus single cells. FOXP3+ cells were gated among lymphocytes (low side scatter/low area cells). The Similarity score, which quantifies the/ correlation of pixel values of the nuclear and pSTAT5 images on a per-cell basis, allowed for the assessment of the nuclear localization of pSTAT5 within these cells [30]. The two images will be similar and have large positive values of the Similarity score if pSTAT5 is nuclear. In contrast, the images of nucleus and pSTAT5 will be anti-similar and have negative values of Similarity score if pSTAT5 is cytoplasmic. If events with positive values of Similarity score >1 were gated to calculate the proportion of cells characterised by nuclear-localized pSTAT5 in the FOXP3-expressing population, they also showed visually evident nuclear distributions of the transcription factor.
2.6. Statistical Analysis
GraphPad Prism version 10 for Windows (GraphPad Software, San Diego, CA, USA) was used to conduct statistical analysis. The Wilcoxon matched-pairs signed rank test was used for within-group comparisons, while the Mann-Whitney test was employed for between-group comparisons. The Spearman correlation coefficient was computed to investigate potential correlations between variables. P values were deemed significant if they were less than 0.05. The Kaplan-Meier survival method was used to analyze disease course/infectious complications in the follow-up period, and a Log-rank test was used to determine significance between groups. When comparing outcomes and related clinical factors between subgroups, the Fisher's exact test or the non-parametric Mann-Whitney test were used for analysis. Where necessary, the Bonferroni correction for multiple testing was implemented to account to account for multiple testing.
3. Results
3.1. The Increase in Activated Treg Subset in Peripheral Blood from CLL Patients with Untreated Advanced Disease Correlates with Total Tumor Mass (TTM) Scoring
First, FOXP3 expressing CD4+ T cells were analyzed by flow cytometry in whole blood samples from patients with CLL and healthy controls (HC). Percentage of FOXP3+ cells among CD4+ T cells was significantly higher in patients with CLL (Figure 1A).
Next, Treg analysis was performed also by using the strategy introduced by Miyara et al. [15] allowing functional delineation of FOXP3 high expressing CD45RA-FOXP3hi activated Treg (aTreg) subset and the two FOXP3 low expressing subsets: CD45RA+FOXP3lo resting Treg (rTreg), and CD45RA-FOXP3lo (non-Treg) subset (Figure 1B).
The frequency of all FOXP3+ subsets among CD4+ T cells was significantly increased in untreated CLL patients compared to HC (Figure 1C).
As Treg suppressive function is linked to high surface expression levels of IL-2Ralpha (CD25) [31], percentages of CD25 expressing cells were compared between the subsets of FOXP3+ cells from patients with CLL. When compared to rTreg and nonTreg subset, significantly higher percentages of CD25+ cells were found among aTregs (Supplementary Figure S1A), which were shown before to be the most suppressive Treg subset among FOXP3+ cells [15,32].
According to the stage of illness, patients with CLL are categorized into one of three groups, A–C, by the Binet classification [26]. Those with untreated stage C disease did not exhibit elevated values of rTreg, nonTreg subset, or all FOXP3+ cells among CD4+ T cells compared to the stage A patient population when we examined the proportion of all FOXP3+ cells and their subsets among CD4+ T cells in patients at different stages of disease. However, we found significantly increased proportion of aTreg subset (Figure 1D).
As these results showed an expansion of FOXP3+ cells in CLL patients, with a skewing to the aTreg subset in advanced disease, the frequencies of the populations analysed were correlated also with lymphocyte count. The percentage of aTreg subset, defined as either CD45RA-FOXP3hi or CD45RA-CD25hi CD127lo/- cells (Supplementary Figure S1B) among CD4+ T cells was significantly positively correlated with lymphocyte count (Figure 1E), suggesting that this specific subset is associated with malignant B cell burden in patients with CLL.
In order to assess the tumour mass within all major body compartments, we used the total tumor mass scoring system (TTM) in our patients with CLL [28]. TTM is the sum of: (1) the square root of the number of peripheral blood lymphocytes per nL, (2) the diameter of the largest palpable lymph node in centimetres, and (3) the enlargement of the spleen below left costal margin in centimetres.
aTreg subset, again defined as either CD45RA-FOXP3hi or CD45RA-CD25higCD127lo/-cells, was significantly positively correlated with the TTM score (Figure 1F). There was a significant positive correlation between the TTM score and percentage of this subset, but not all FOXP3+ cells among CD4+ T cells.
3.2. Increased Proportions of aTregs among FOXP3+CD4+ T Cells are Associated with Their Augmented STAT5 Signaling Responses following Whole Blood SARS-CoV-2 Antigen-Specific Stimulation
While work over the past 30 years has clearly documented an important role for homeostatic cytokine/IL-2 induced STAT5 signaling in shaping the development of Tregs, recent research indicates that IL-2 dependent STAT5 signaling is critical also for their suppressive function [24]. Since the translocation of STAT5 homodimers to the nucleus follows cytokine-dependent activation/phosphorylation of STAT5 [23], we also employed imaging flow cytometry to investigate nuclear/cytoplasmic localization pSTAT5. After stimulation with recombinant human IL-2 for 15 minutes, predominant nuclear localization of pSTAT5 was found fin FOXP3 expressing cells (Figure 2A). Nuclear localization of pSTAT5, measured using the similarity score, was higher in both FOXP3 high and FOXP3 low expressing cells compared to FOXP3 negative cells, gated as shown in Supplementary Figure S2.
Compared to FOXP3 negative Tcons, whole blood FOXP3+ Tregs were shown to display higher levels of IL-2-dependent signaling before [25]. As IL-2 is produced also during antigen-specific activation of Tcons, pSTAT5 levels in CD25+FOXP3+ Tregs and Tcons were analyzed following SARS-CoV-2 antigen-specific stimulation of lymphocytes in our previous study [33]. In the current investigation, the combination of two antigen peptides specific to SARS-CoV-2 (SARS-CoV-2 Ag1 and Ag2) from the QuantiFERON SARS-CoV-2 kit was used to examine the pSTAT5 response of specific (rTreg and aTreg) Treg subsets. Such antigen-induced pSTAT5 levels were analyzed in whole blood samples from HC who had recovered from SARS-CoV-2 infection or had received the BNT162b2 mRNA COVID-19 vaccination. Furthermore, we employed this technique to examine pSTAT5 levels in rTreg and aTreg subsets from twelve CLL patients who received two doses of the BNT162b2 mRNA COVID-19 vaccination, some of them had also recovered from a recent SARS-CoV-2 infection.
Significantly higher pSTAT5 levels in the aTreg (Figure 2B) and rTreg subset (Supplementary Figure S3A) were seen after stimulation with the SARS-CoV-2 specific spike peptide mix (+Ag) in comparison to negative control (Nil) samples from HC and CLL patients. However, when the pSTAT5 MFI fold change (pSTAT5 MFI in the stimulated tube divided by pSTAT5 MFI in the control tube) was used to measure STAT5 signaling responses [34], it was significantly higher in aTregs than in rTregs, from both HC as well as patients with CLL (Figure 2C). In addition, percentages of aTreg (Figure 2D), but not rTreg (Supplementary Figure S3B) subset among FOXP3+CD4+ T-cells was significantly increased following stimulation with the SARS-CoV-2 specific spike peptide mix (+Ag) compared to negative control (Nil). Moreover, a significant correlation between aTreg STAT5 signaling responses (pSTAT5 MFI fold change) and fold change increase in aTreg percentage, was found (Figure 2E).
These results indicate that aTreg-specific pSTAT5 responses, which are higher than in rTreg subset, are associated also with expansion of aTreg subset among FOXP3+CD4+ T cells following whole blood SARS-CoV-2 antigen-specific stimulation.
3.3. aTreg Subset, Disease Course and STAT5 Signaling during Follow-up
As increase in Treg proportions with increased FOXP3 levels was associated with poor outcomes also in SARS-CoV-2 infections [35], we investigated whether CLL patients with higher aTreg percentages among FOXP3+CD4+ T cells at the start of follow-up would experience a more severe disease course with infectious complications requiring hospitalization using the approach described before [36,37].
The CLL cohort, composed of 37 patients with mostly stage C disease before the start of treatment at enrollment and with subgroups defined based on aTreg percentages (Table 1) was followed up to 500 days. We found that 58% CLL patients in group2, with higher aTreg frequencies (≥26%) experienced grade ≥3 infections by 365 days after enrollment, compared to only 6% of patients in group1 with lower aTreg frequencies (Figure 3A). The patients in the former group had more grade ≥3 infections per year of follow-up than patients with lower aTreg frequencies: grade ≥3 infection rate normalized to duration of follow-up at day 500 (mean grade ≥3 infection rate 0.70 per year vs. 0.04 per year, p=0.001). In addition, none of the patients in group1 with lower aTreg frequencies and 5 patients in group2, characterized by higher aTreg frequencies before the start of therapy, were hospitalized due to severe COVID-19 disease during follow-up (Figure 3B).
No significant association with type of therapy (Table 2), other clinical or laboratory parameters were seen (Table 1).
When aTreg percentages and CD4 counts were examined in sequential samples from patients on therapy, after initial decrease, percentage of aTreg among FOXP3+CD4+ T cells from some patients from both groups even increased in the follow up samples. In contrast, with exception of one patient in each group, CD4 counts in follow-up samples from patients in both groups were lower than before therapy (Figure 3C and D).
There was a significant negative correlation between CD4 counts and aTreg frequencies in samples from treated patients during follow-up (Figure 3E), but not in samples from CLL patients with advanced disease at the start of therapy.
To examine the role of homeostatic cytokines in aTreg expansion, we investigated basal phosphorylation of STAT5 (pSTAT5) in CD4+ T cells in blood samples from some treated CLL patients during follow-up. We found a significant correlation between percentage of aTreg among FOXP3+CD4+ T cells and pSTAT5 MFI in CD4+T cells (Figure 3F), suggesting that homeostatic STAT5 signaling could be responsible for increased aTreg frequencies in patients during therapy.
3.4. Higher Basal STAT5 Phosphorylation Levels in CD4 T Cells from Patients with CLL Treated with Chemo-Immunotherapy
Basal CD4+ T cell pSTAT5 levels in whole blood samples from CLL patients receiving therapy at the time of analysis were also compared to untreated CLL patients and HC. pSTAT5 MFI in CD4+T cells (Figure 4A), gated as shown on Figure 4B, was not significantly increased when all samples from treated CLL patients were compared to HC and patients not receiving any form of therapy. However, basal pSTAT5 levels were significantly higher when the samples from patients treated with chemoimmunotherapy (CIT) were compared to samples from patients receiving Bruton Tyrosine Kinase Inhibitor (BTKi) therapy (Figure 4C), CLL patients not receiving therapy (p=0.04) and HC (p=0.02).
3.5. Relationship between STAT5 Phosphorylation and Ki-67 Expressing CD4 T Cell Subsets
To assess the relationship between turnover-homeostasis of aTreg and FOXP3- Tcon CD4+ T cell subsets and STAT5 phosphorylation, the expression of Ki-67 was determined as an indicator of proliferation [38] in peripheral blood aTreg subset and FOXP3- Tcon.
Percentage of Ki-67 expressing - proliferating cells among CD4+ T cells of both aTreg subset (Figure 4D) and Tcon (Supplementary Figure S4A) were significantly increased in peripheral blood from CLL patients not receiving therapy and treated CLL patients compared to HC. Ki-67 expressing aTreg and Tcon were also significantly increased in treated patients compared to CLL patients not receiving therapy (Figure 4D).
Moreover, consistent with CD4+ T cell pSTAT5 levels, CLL patients treated with CIT displayed also higher levels of Ki-67 expressing aTreg (Figure 4E) and Tcon (Supplementary Figure S4B) compared to patients treated with BTKi.
To determine if basal STAT5 activation is involved in turnover of Tcon and aTreg subset from CLL patients treated with BTKi or CIT, we examined the relationship between the levels of Tcon / aTreg Ki-67 expressing subset and pSTAT5. Consistent with the crucial role of STAT5 signaling in the proliferation of Tcon, CD4+ T cell pSTAT5 MFI was significantly positively correlated with percentage of Ki-67+ Tcon among CD4+ T cells in peripheral blood from treated patients with CLL (Supplementary Figure S4C). On the other hand, significant correlation between proliferating aTreg subset (percentage of Ki-67+ aTreg among CD4+ T cells) and CD4 T-cell pSTAT5 MFI was also found (Figure 4F).
Together, our results suggested that augmented basal STAT5 signaling, found in patients treated with CIT, which was positively related to Ki-67 expression, may confer proliferative advantage to Tcon, and could also be involved in the increase in proliferating aTreg subset.
3.6. Differences in Basal STAT5 Phosphorylation between aTreg and Conventional T-Cells
We next compared basal STAT5 phosphorylation levels in both aTreg and Tcon subsets from HC, patients with CLL not receiving therapy and in samples from patients treated with BTKi or CIT. When compared to both HC and untreated patients, pSTAT5 levels were higher, but not significantly different in both subsets from treated patients with CLL. However, aTreg displayed significantly higher pSTAT5 levels compared to Tcon in samples from treated, but not untreated CLL patients or HC (Figure 4G).
Therefore, due to the critical role of STAT5 signaling in Treg development, significantly higher levels of basal pSTAT5 in the aTreg subset relative to FOXP3− Tcon cells, found in treated patients with advanced CLL, could be responsible for the perturbed homeostasis between the aTreg and Tcon subset of CD4+ T cells.
While patents on CIT had significantly higher levels of pSTAT5 in both subsets compared to CLL patients treated with BTKi, Tcon levels of pSTAT5 were more significantly different between the two groups of treated patients (Figure 4H).
4. Discussion
Recent results obtained in the Em-TCL1 mouse model of CLL provide the evidence that specific subset of Tregs may be essential for leukemia progression in immunocompetent mice and can be efficiently targeted to block CLL progression. This Treg subset contributed indirectly to the proliferation of the CLL clone, by suppressing the proliferation of effector T cells which in turn suppress CLL cells [39].
Human CD4+FOXP3+ T cells contain cytokine-secreting nonsuppressive T cells that display low expression of FOXP3, in the so called non-Treg fraction [15]. It is therefore critical to analyze suppressive subpopulations, such as rTreg and aTreg and not only total FOXP3+CD4+ T cells, when investigating their potential role in immune suppression.
Earlier studies, performed on peripheral blood samples from patients with CLL described elevated total Treg levels, which also correlated with worse prognostic factors and advanced disease stage [17,18,19,20].
Consistent with results of recent studies, which analyzed also FOXP3 expression [40,41], we found significant increase in percentage of all FOXP3+ cells among CD4+ T cells from patients with CLL.
However, the percentage of specific – activated Treg subset of FOXP3+ cells, characterised also by highest levels of CD25 expression, was significantly increased in advanced Binet C stage of disease and associated with malignant B cell burden in our patients with CLL.
Moreover, aTreg subset, defined as either CD45RA-FOXP3hi or CD45RA-CD25hiCD127lo/- cells, was in our patients significantly positively correlated with TTM - indicator of the tumor mass within all major body compartments. As aTreg cells are thought to be the main effectors of suppression among human FOXP3+ Treg subsets [15], their expansion in patients with advanced CLL could support tumor immune evasion by suppressing antitumor T-cell responses. Cytotoxic T lymphocyte-associated protein 4 (CTLA-4) expression in aTreg cells, but not in rTreg cells [15], suggests that aTregs are involved in critical contact dependent suppression, as Treg cell-specific CTLA-4 deficiency impairs Treg cell suppressive function not only in vitro but also in vivo in mice [42]. In addition, increased CD4+CD25+FOXP3+CTLA-4+ Tregs occurring alongside leukemia development were described in the Eμ-TCL1 transgenic mouse model of CLL [43].
On the other hand, recent study uncovered a key role for cytokine production by CLL cells in in enhancing Treg suppressive capacity by upregulating FOXP3 expression [44].
Changes in the cytokine environment and imbalances between effector CD4+ T cell subsets (e.g. Th17) and FOXP3+ Treg have been the subject of research in CLL patients [45,46]. However, there were only few attempts to define altered Treg homeostasis based on the newer classifications of FOXP3+ Treg subpopulations using multicolor flow cytometry or mass cytometry in patients with CLL [47,48]. In addition, to our knowledge, there has been no report on homeostatic cytokine STAT5 signaling in Treg subsets in patients with CLL.
As activation of the STAT5 transcription factor downstream of the Interleukin-2 receptor (IL-2R) induces expression of FOXP3, a critical step in the differentiation of Treg [49], we analyzed STAT5 signaling/nuclear translocation also by using multispectral imaging cytometry. We could show, that after IL-2 stimmulation nuclear localization of pSTAT5, measured using the Similarity score, was higher in both FOXP3 high and FOXP3 low expressing cells compared to FOXP3 negative cells.
Using conventional flow cytometry and anti-pSTAT5 antibodies it was shown before that FOXP3+ Treg in whole blood from healthy donors differ from FOXP3- Tcon in terms of their higher capacity to phosphorylate STAT5 protein in response to IL-2 stimulation [25].
However, we found that STAT5 signaling responses after SARS-CoV-2 antigen-specific stimulation, measured as the pSTAT5 MFI fold change, were significantly different even among Treg subsets. They were higher in aTregs than in rTregs, from both HC as well as patients with CLL. In addition, frequency of aTreg, but not rTreg subset among CD4+FOXP3+ T cells was increased following such whole blood SARS-CoV-2 antigen-specific stimulation. Together with the significant correlation between pSTAT5 and frequency of aTreg, our findings indicate that aTreg-specific pSTAT5 responses, which are higher than in rTreg subset, are associated also with expansion of aTreg subset among FOXP3+CD4+ T cells following whole blood SARS-CoV-2 antigen-specific stimulation.
The early release of homeostatic cytokine IL-2 in response to antigen is followed by IL-2-dependent STAT5 phosphorylation, which was shown to occur primarily in FOXP3+ Tregs within hours of T-cell priming in mouse model in vivo. As the first responders to IL-2, Treg cells also multiplied and showed increased suppressive capacity [50].
Tregs were shown to influence the magnitude and severity of acute and chronic infections through suppression of pathogen-specific Tcon and CD8+ cytotoxic T cells. Accordingly, clearance of microbial pathogens is promoted by depletion of Treg populations [51]. Of note, elevated Treg levels in CLL patients correlated with decreased T cell responses not only against tumor, but also microbial antigens in functional assays [52].
Consistent with that, disease course of a subgroup of our CLL patients with higher aTreg percentages at the start of therapy was characterized by more frequent episodes of severe infections during follow-up. Five patients from the latter group experienced also severe COVID-19, which was shown in a recent study to entail a striking induction of FOXP3 expression in Tregs [35]. In the same study CD45RA, which marks naïve-resting Tregs, was also reduced in patients with severe. In addition, the so-called Severe COVID19 Treg Signature was associated with changes in several transcription factors previously associated with differential gene expression in activated Tregs, including downregulation of BACH2 (BTB Domain, and CNC Homolog) [35,53].
Recent data demonstrated that BACH2 downregulation in normal lymphocytes increases age-related resistance to apoptosis and these alterations were even more pronounced in T and B cells from CLL patients [54].
BACH2 binds to enhancers of genes involved in aTreg differentiation and represses their T cell receptor (TCR)-driven induction by competing with AP-1 (activating protein-1) factors for DNA binding [55]. Therefore, BACH2 could be involved also in perturbed aTreg homeostasis found in our patients with CLL. In addition, low expression of this transcription factor was recently shown to predict adverse outcome in patients with CLL [56]. In our patients, higher aTreg percentages among FOXP3+CD4+ T cells at the start of therapy were associated with disease course characterized by more frequent serious infections during follow-up of our patients with CLL.
However, significant correlation, found in our treated patients between follow-up pSTAT5 levels and aTreg, but not rTreg frequency, mirrors results of in vitro SARS-CoV2 Ag-specific activation, where increase in pSTAT5 levels was associated with expansion of aTreg, but not rTreg subset, despite the letter also showing increased pSTAT5 levels.
Therefore, STAT5 signaling, implicated in both FOXP3 expression [49] as well as maintenance of Treg suppressive function (24) may be even more important in homeostasis of the most suppressive-aTreg subset of CD4+ T cells.
Although CD4 counts in follow-up samples from most of our patients were lower than before therapy, percentage of aTreg among FOXP3+CD4+ T cells increased in the follow up samples even in some patients, characterized by already high aTreg frequencies at the start of follow up. In addition, lower CD4 T cell counts in follow-up samples from CLL patients were associated (significantly negatively correlated) with higher follow-up aTreg frequencies. As there was also a significant correlation between percentage of aTreg among FOXP3+CD4+ T cells and pSTAT5 levels in CD4+ T cells from individual patients during follow-up, homeostatic STAT5 signaling, associated with lower CD4 counts could be responsible for increased frequencies of aTreg during therapy.
The reduced CD4 counts in patients with CLL after frontline fludarabine, cyclophosphamide and rituximab (FCR) therapy were not associated with the risk of infections. In this study, according to authors suggestion, the CD4+ T-cells mostly consisted of regulatory Tregs [57]. The impact of CIT on total Tregs was shown in another recent study, where the relative number of Tregs remained higher than in controls because other CD4+ T cells numbers decreased more significantly [58]. Increased regulatory T-cell to CD4 ratio after FCR was observed. Although higher percentage of total Treg among CD4+ T cells after 6 months of FCR therapy correlated negatively with infections, the relative contribution of individual Treg subsets was less clear, as activated Tregs were defined only by expression of HLADR [59].
In our study, increased CD4+ T cell STAT5 phosphorylation was found only in patients on CIT, but not untreated patients, compared to HC. Basal pSTAT5 levels were also significantly higher in patients treated with CIT than in patients on BTKi therapy, suggesting that homeostatic cytokine STAT5 signaling is more increased in the former patient group.
Consistent with that, CLL patients treated with CIT displayed also significantly higher levels of Ki-67 expressing Tcon and aTreg subset compared to patients treated with BTKi. Further supporting the role of STAT5 activation in increased turnover of Tcon and aTreg from CLL patients on therapy, pSTAT5 levels in CD4+ T-cells were also significantly positively correlated with percentage of Ki-67+ Tcon as well as with percentage of Ki-67+ aTreg among CD4+ T cells. Therefore, our results suggested that while STAT5 signaling, which was more significantly correlated to Tcon Ki-67 expression, may confer proliferative advantage to conventional CD4+ T cells, STAT5 activation/phosphorylation could also be involved in increase of proliferating aTreg subset.
Although basal STAT5 signaling was significantly increased in both subsets of CD4+ T cells when patients treated with CIT were compared to patients on BTKi therapy, basal STAT5 phosphorylation levels were also significantly higher in aTreg compared to Tcon from treated patients with CLL. Such imbalanced homeostatic cytokine signaling could also confer survival advantages to aTreg over Tcon during therapy, as activation of STAT5 signaling pathway up-regulates anti-apoptotic protein Bcl-2 [60]. Indeed, T-cells with a tuned-up survival state as indicated by a high Bcl-2 content, enriched with Treg subsets, were described recently in patients with CLL [61].
5. Conclusions
Together, our findings indicate that specific – activated Treg subset is expanded in patients with advanced disease and increase in frequency of this subset among CD4+ T cells is associated with TTM indicator of the tumour mass within all major body compartments in patients before therapy. Increased aTreg fraction could represent a possible marker of more severe CLL disease, characterized by serious infectious complications, as disease course of a subgroup of our CLL patients with higher aTreg percentages among CD4+FOXP3+ T cells at the start of therapy was characterized by more frequent episodes of severe infections during follow-up. Augmented homeostatic STAT5 signaling could support aTreg expansion, as higher pSTAT5 levels were significantly corelated with increased aTreg percentages among CD4+FOXP3+ T cells following SARS-CoV-2 antigen-specific stimulation in vitro as well as during follow-up of patients on therapy. While basal phosphorylation of STAT5 was significantly increased in CD4+ T cells from patients on CIT and was positively correlated with both proliferating Tcon and aTreg subset, basal pSTAT5 levels were also significantly higher in aTreg compared to Tcon from treated patients with CLL. Therefore, dysbalanced STAT5 signaling may be involved in perturbed Tcon/aTreg homeostasis in CLL patients on therapy.
Supplementary Materials
The following supporting information can be downloaded at the website of this paper posted on Preprints.org. Figure S1A,B: percentage of CD25+ cells among gated FOXP3+CD4+ T cell subsets (CD45RA+ FOXP3lo rTreg, CD45RA−FOXP3hi aTreg, and CD45RA−FOXP3lo non-Treg) and gating hierarchy for identification of CD25+CD127lo/- Treg among CD4+ T cells and CD45RA-CD25hi aTreg among them; Figure S2: Ancestry gating for Figure 2A.; Figure S3A,B: Cumulative rTreg pSTAT5 levels (MFI) and rTreg percentages among FOXP3+CD4+ T cells in whole-blood aliquots withdrawn from negative control (Nil) and from the Ag tubes (+Ag) from healthy controls (n = 9, white bars) and patients with CLL (n = 12, gray bars); Figure S4A,B,C: (A) Percentage of Ki-67+ Tcon cells (%Ki-67+ Tcon) among CD4+ T cells from samples of untreated patients with CLL (CLL, n = 17), patients with CLL on CIT or therapy with BTKi (CLL+Th, n = 25) and HCs (n = 17). (B) Percentage of Ki-67+ Tcon cells among CD4+ T cells from samples of patients with CLL on CIT (n = 10) or therapy with BTKi (n = 15). (C) Correlation between percentage of Ki-67+ Tcon cells and basal pSTAT5 levels (MFI) in CD4+ T-cells from samples of patients with CLL on CIT or therapy with BTKi (n = 24). Supplementary Table S1. Characteristics of recruited patients with CLL, not included in the follow-up study.
Author Contributions
Conceptualization, Z.R., S.B. and A.G.; methodology, E.H. and A.G.; validation, Z.R., S.B. and A.G.; investigation, M.D.; resources, Z.R. and E.H.; writing—original draft preparation, Z.R., A.G., E.H., M.D., T.A. and S.B.; writing—review and editing Z.R., T.A., S.B., and A.G.; supervision, Z.R., S.B., and A.G. All authors have read and agreed to the published version of the manuscript.
Funding
This research was partially funded by Internal Research Program in University Clinical Centre Maribor IRP-2019/01-01.
Institutional Review Board Statement
The study was approved by the Ethics Committee of the University Medical Centre Maribor and the Slovenian National Medical Ethics Committee.
Informed Consent Statement
Informed consent was obtained from all subjects involved in the study.
Data Availability Statement
Datasets used in this article are available from corresponding author on reasonable request.
Conflicts of Interest
The authors declare no conflict of interest.
Abbreviations: 7-aminoactinomycin D, 7-AAD; APC, allophycocyanin; aTreg, CD45RA-FOXP3hi activated Treg cell; BD, Becton Dickinson; BTKi, Bruton Tyrosine Kinase Inhibitor; CIT, chemoimmunotherapy; FITC, Fluorescein Isothiocyanate; FOXP3, forkhead family transcription factor; HC, healthy controls; IL, Interleukin; MFI, Median Fluorescence Intensity; PCR, polymerase chain reaction; PE, phycoerythrin; PE-Cy7, phycoerythrin-cyanin7; Peridinin chlorophyll, PerCP; pSTAT5, phosphorylated STAT5; R, Receptor; rTreg, CD45RA+FOXP3lo resting Treg cell; SSC, side scatter; STAT, Signal Transducer and Activator of Transcription; Tcon, CD4+FOXP3-conventional T cell; TCR, T cell receptor; Treg, CD4+FOXP3+ regulatory T cell; TTM, total tumor mass;.
References
- Siegel, R.L.; Miller, K.D.; Wagle, N.S.; Jemal, A. Cancer statistics, 2023. CA Cancer J. Clin. 2023, 73, 17–48. [Google Scholar] [CrossRef] [PubMed]
- Dubois N, Crompot E, Meuleman N, Bron D, Lagneaux L, Stamatopoulos B. Importance of Crosstalk between Chronic lymphocytic leukemia cells and the Stromal Microenvironment: direct contact, soluble factors, and Extracellular vesicles. Front Oncol. 2020; 10, 1422. [CrossRef]
- Scarfò L, Chatzikonstantinou T, Rigolin GM, et al. COVID-19 severity and mortality in patients with chronic lymphocytic leukemia: a joint study by ERIC, the European Research Initiative on CLL, and CLL Campus. Leukemia, 2020; 34, 2354–2363. [CrossRef]
- Hospital P, Alliance CC, York N, Hospital P, Hospital B, Cornell W. Outcomes of COVID-19 in Patients with CLL: A Multicenter, International Experience. 2021.
- Hilal T, Gea-Banacloche JC, Leis JF. Chronic lymphocytic leukemia and infection risk in the era of targeted therapies: Linking mechanisms with infections. BloodRev. 2018; 32, 387–399. [CrossRef]
- Arruga F, Gyau BB, Iannello A, Vitale N, Vaisitti T, Deaglio S. Immune Response Dysfunction in Chronic lymphocytic leukemia: dissecting Molecular Mechanisms and Microenvironmental Conditions. Int J Mol Sci. 2020; 21, 1825. [CrossRef]
- Langerbeins P, Eichhorst B. Immune Dysfunction in Patients with Chronic Lymphocytic Leukemia and Challenges during COVID-19 Pandemic. Acta Haematol, 2021; 144, 508–518. [CrossRef]
- Teh BW, Tam CS, Handunnetti S, Worth LJ, Slavin MA. Infections in patients with chronic lymphocytic leukaemia: Mitigating risk in the era of targeted therapies. Blood Rev. 2018; 32, 499–507. [CrossRef]
- Parry H, McIlroy G, Bruton R, et al. Antibody responses after first and second Covid-19 vaccination in patients with chronic lymphocytic leukaemia. Blood Cancer J. 2021, 11(7), 136. [CrossRef]
- Benda M, Mutschlechner B, Ulmer H, et al. Serological SARS-CoV-2 antibody response, potential predictive markers and safety of BNT162b2 mRNA COVID-19 vaccine in haematological and oncological patients. Br J Haematol, 2021; 195, 523–531.
- Shevach, E. M. , Regulatory T cells in autoimmmunity. Annu. Rev.Immunol. 2000, 18, 423–449. [Google Scholar] [CrossRef] [PubMed]
- Rudensky, A.Y. Regulatory T cells and Foxp3. Immunol. Rev. 2011, 241, 260–268. [Google Scholar] [CrossRef] [PubMed]
- Sakaguchi, S. Naturally arising CD4+ regulatory t cells for immunologic self-tolerance and negative control of immune responses. Annu Rev Immunol. 2004; 22, 531–562. [Google Scholar] [CrossRef]
- Saleh R, Elkord E. FoxP3+ T regulatory cells in cancer: Prognostic biomarkers and therapeutic targets. Cancer Lett. 2020; 490, 174–185. [CrossRef]
- Miyara M, Yoshioka Y, Kitoh A, Shima T, Wing K, Niwa A, Parizot C, Taflin C, Heike T, Valeyre D, et al. Functional delineation and differentiation dynamics of human CD4+ T cells expressing the FoxP3 transcription factor. Immunity. 2009, 30, 899–911. [Google Scholar] [CrossRef]
- Wang L, Simons DL, Lu X, Tu TY, Solomon S, Wang R, Rosario A, Avalos C, Schmolze D, Yim J, Waisman J, Lee PP. Connecting blood and intratumoral Treg cell activity in predicting future relapse in breast cancer. Nat Immunol. 2019, 20(9), 1220–1230. [Google Scholar] [CrossRef]
- D’arena, G.; Laurenti, L.; Minervini, M.M.; Deaglio, S.; Bonello, L.; De Martino, L.; De Padua, L.; Savino, L.; Tarnani, M.; De Feo, V.; et al. Regulatory T-cell number is increased in chronic lymphocytic leukemia patients and correlates with progressive disease. Leuk. Res. 2011, 35, 363–368. [Google Scholar] [CrossRef]
- Mpakou, V.E.; Ioannidou, H.-D.; Konsta, E.; Vikentiou, M.; Spathis, A.; Kontsioti, F.; Kontos, C.K.; Velentzas, A.D.; Papageorgiou, S.; Vasilatou, D.; et al. Quantitative and qualitative analysis of regulatory T cells in B cell chronic lymphocytic leukemia. Leuk. Res. 2017, 60, 74–81. [Google Scholar] [CrossRef]
- D’Arena, G.; D’Auria, F.; Simeon, V.; Laurenti, L.; Deaglio, S.; Mansueto, G.; Del Principe, M.I.; Statuto, T.; Pietrantuono, G.; Guariglia, R.; et al. A shorter time to the first treatment may be predicted by the absolute number of regulatory T-cells in patients with Rai stage 0 chronic lymphocytic leukemia. Am. J. Hematol. 2012, 87, 628–663. [Google Scholar] [CrossRef]
- Weiss, L.; Melchardt, T.; Egle, A.; Grabmer, C.; Greil, R.; Tinhofer, I. Regulatory T cells predict the time to initial treatment in early stage chronic lymphocytic leukemia. Cancer. 2010, 117, 2163–2169. [Google Scholar] [CrossRef]
- Myhrvold IK, Cremaschi A, Hermansen JU, Tjønnfjord GE, Munthe LA, Taskén K, Skånland SS. Single cell profiling of phospho-protein levels in chronic lymphocytic leukemia. Oncotarget. 2018; 9, 9273–9284. [CrossRef]
- Blix ES, Irish JM, Husebekk A, Delabie J, Forfang L, Tierens AM, Myklebust JH, Kolstad A. Phospho-specific flow cytometry identifies aberrant signaling in indolent B-cell lymphoma. BMC Cancer. 2012, 12, 478. [Google Scholar] [CrossRef]
- Rochman, Y.; Spolski, R.; Leonard, W.J. New insights into the regulation of T cells by gamma(c) family cytokines. Nat. Rev. Immunol. 2009, 9, 480–490. [Google Scholar] [CrossRef] [PubMed]
- Mahmud, S.; Manlove, L.S.; Farrar, M.A. Interleukin-2 and STAT5 in regulatory T cell development and function. Jakstat. 2013, 2, e23154. [Google Scholar] [CrossRef] [PubMed]
- Dupont, G.; Demaret, J.; Venet, F.; Malergue, F.; Malcus, C.; Poitevin-Later, F.; Morel, J.; Monneret, G. Comparative dose-responses of recombinant human IL-2 and IL-7 on STAT5 phosphorylation in CD4+FOXP3− cells versus regulatory T cells: A whole blood perspective. Cytokine, 2014; 69, 146–149. [Google Scholar] [CrossRef]
- Hallek, M.; Cheson, B.D.; Catovsky, D.; Caligaris-Cappio, F.; Dighiero, G.; Döhner, H.; Hillmen, P.; Keating, M.; Montserrat, E.; Chiorazzi, N.; et al. iwCLL guidelines for diagnosis, indications for treatment, response assessment, and supportive management of CLL. Blood. 2018, 131, 2745–2760. [Google Scholar] [CrossRef] [PubMed]
- Binet, J.L.; Auquier, A.; Dighiero, G.; Chastang, C.; Piguet, H.; Goasguen, J.; Vaugier, G.; Potron, G.; Colona, P.; Oberling, F.; et al. A new prognostic classification of chronic lymphocytic leukemia derived from a multivariate survival analysis. Cancer. 1981, 48, 198–206. [Google Scholar] [CrossRef]
- Jaksić B, Vitale B. Total tumour mass score (TTM): a new parameter in chronic lymphocyte leukaemia. Br J Haematol. 1981; 49, 405–413. [CrossRef]
- Trapecar, M.; Goropevšek, A.; Gorenjak, M.; Gradisnik, L.; Rupnik, M.S. A Co-Culture Model of the Developing Small Intestine Offers New Insight in the Early Immunomodulation of Enterocytes and Macrophages by Lactobacillus spp. through STAT1 and NF-kB p65 Translocation. PLoS ONE. 2014; 9, e86297. [Google Scholar] [CrossRef]
- George, T.C.; Fanning, S.L.; Fitzgerald-Bocarsly, P.; Medeiros, R.B.; Highfill, S.; Shimizu, Y.; Hall, B.E.; Frost, K.; Basiji, D.; Ortyn, W.E.; et al. Quantitative measurement of nuclear translocation events using similarity analysis of multispectral cellular images obtained in flow. J. Immunol. Methods. 2006, 311, 117–129. [Google Scholar] [CrossRef] [PubMed]
- Baecher-Allan, C. , Brown, J. A., Freeman, G. J., Hafler, D. A. CD4+ CD25high regulatory cells in human peripheral blood. J. Immunol. 2001, 167, 1245–1253. [Google Scholar] [CrossRef] [PubMed]
- Sakaguchi, S. , Miyara, M., Costantino, C. M., Hafler, D. A. FOXP3+ regulatory T cells in the human immune system. Nat. Rev. Immunol. 2010, 10, 490–500. [Google Scholar] [CrossRef]
- Roškar Z, Dreisinger M, Tič P, Homšak E, Bevc S, Goropevšek A. New Flow Cytometric Methods for Monitoring STAT5 Signaling Reveal Responses to SARS-CoV-2 Antigen-Specific Stimulation in FOXP3+ Regulatory T Cells also in Patients with Advanced Chronic Lymphocytic Leukemia. Biosensors (Basel). 2023; 13, 539.
- Krutzik, P.O.; Nolan, G.P. Intracellular phospho-protein staining techniques for flow cytometry: Monitoring single cell signaling events. Cytometry A. 2003, 55, 61–70. [Google Scholar] [CrossRef]
- Galván-Peña S, Leon J, Chowdhary K, Michelson DA, Vijaykumar B, Yang L, Magnuson AM, Chen F, Manickas-Hill Z, Piechocka-Trocha A, Worrall DP, Hall KE, Ghebremichael M, Walker BD, Li JZ, Yu XG; MGH COVID-19 Collection & Processing Team; Mathis D, Benoist C. Profound Treg perturbations correlate with COVID-19 severity. Proc Natl Acad Sci U S A. 2021; 118, e2111315118.36. [CrossRef]
- McKinney, E. F. , Lyons, P. A., Carr, E. J., Hollis, J. L., Jayne, D. R., Willcocks, L. C., Koukoulaki, M., Brazma, A., Jovanovic, V., Kemeny, D. M., Pollard, A. J., Macary, P. A., Chaudhry, A. N., Smith, K. G. A CD8+ T cell transcription signature predicts prognosis in autoimmune disease. Nat. Med. 2010, 16, 586–591. [Google Scholar] [CrossRef] [PubMed]
- Goropevšek, A.; Gorenjak, M.; Gradišnik, S.; Dai, K.; Holc, I.; Hojs, R.; Krajnc, I.; Pahor, A.; Avčin, T. STAT5 phosphorylation in CD4 T cells from patients with SLE is related to changes in their subsets and follow-up disease severity. J. Leukoc. Biol. 2017, 101, 1405–1418. [Google Scholar] [CrossRef]
- Gerdes, J. , Lemke, H., Baisch, H., Wacker, H. H., Schwab, U., Stein, H. Cell cycle analysis of a cell proliferation-associated human nuclear antigen defined by the monoclonal antibody Ki-67. J. Immunol. 1984, 133, 1710–1715. [Google Scholar] [CrossRef]
- Goral A, Firczuk M, Fidyt K, Sledz M, Simoncello F, Siudakowska K, Pagano G, Moussay E, Paggetti J, Nowakowska P, Gobessi S, Barankiewicz J, Salomon-Perzynski A, Benvenuti F, Efremov DG, Juszczynski P, Lech-Maranda E, Muchowicz A. A Specific CD44lo CD25lo Subpopulation of Regulatory T Cells Inhibits Anti-Leukemic Immune Response and Promotes the Progression in a Mouse Model of Chronic Lymphocytic Leukemia. Front Immunol. 2022; 28, 13:781364. [CrossRef]
- Piper KP, Karanth M, McLarnon A, Kalk E, Khan N, Murray J, Pratt G, Moss PA. Chronic lymphocytic leukaemia cells drive the global CD4+ T cell repertoire towards a regulatory phenotype and leads to the accumulation of CD4+ forkhead box P3+ T cells. Clin Exp Immunol. 2011; 166, 154–163. [CrossRef]
- Dasgupta A, Mahapatra M, Saxena R. Flow cytometric immunophenotyping of regulatory T cells in chronic lymphocytic leukemia: comparative assessment of various markers and use of novel antibody panel with CD127 as alternative to transcription factor FoxP3. Leuk Lymphoma, 2013; 54, 778–789. [CrossRef]
- Wing K, Onishi Y, Prieto-Martin P, Yamaguchi T, Miyara M, Fehervari Z, Nomura T, Sakaguchi S. CTLA-4 control over Foxp3+ regulatory T cell function. Science. 2008; 322, 271–275.
- Gorgun G, Ramsay AG, Holderried TA, Zahrieh D, Le Dieu R, Liu F, et al. E(mu)-TCL1 mice represent a model for immunotherapeutic reversal of chronic lymphocytic leukemia-induced T-cell dysfunction. Proc Natl Acad Sci U S A. 2009; 106, 6250–6255.
- Saulep-Easton D, Vincent FB, Quah PS, Wei A, Ting SB, Croce CM, et al. The BAFF receptor TACI controls IL-10 production by regulatory b cells and CLL b cells. Leukemia. 2016; 30, 163–172. [CrossRef]
- Allegra A, Musolino C, Tonacci A, Pioggia G, Casciaro M, Gangemi S. Clinico-Biological Implications of Modified Levels of Cytokines in Chronic Lymphocytic Leukemia: A Possible Therapeutic Role. Cancers (Basel). 2020; 12, 524. [CrossRef]
- Yousefi M, Movassaghpour AA, Shamsasenjan K, Ghalamfarsa G, Sadreddini S, Jadidi-Niaragh F, Hojjat-Farsangi M. The skewed balance between Tregs and Th17 in chronic lymphocytic leukemia. Future Oncol. 2015, 11(10), 1567–1582. [Google Scholar] [CrossRef] [PubMed]
- Biancotto A, Dagur PK, Fuchs JC, Wiestner A, Bagwell CB, McCoy JP Jr. Phenotypic complexity of T regulatory subsets in patients with B-chronic lymphocytic leukemia. Mod Pathol, 2012; 25, 246–259. [CrossRef]
- Gonder S, Fernandez Botana I, Wierz M, Pagano G, Gargiulo E, Cosma A, Moussay E, Paggetti J, Largeot A. Method for the Analysis of the Tumor Microenvironment by Mass Cytometry: Application to Chronic Lymphocytic Leukemia. Front Immunol. 2020; 20, 11:578176. [CrossRef]
- Dikiy S, Li J, Bai L, Jiang M, Janke L, Zong X, Hao X, Hoyos B, Wang ZM, Xu B, Fan Y, Rudensky AY, Feng Y. A distal Foxp3 enhancer enables interleukin-2 dependent thymic Treg cell lineage commitment for robust immune tolerance. Immunity. 2021; 54, 931–946.e11. [CrossRef]
- O'Gorman WE, Dooms H, Thorne SH, Kuswanto WF, Simonds EF, Krutzik PO, Nolan GP, Abbas AK. The initial phase of an immune response functions to activate regulatory T cells. J Immunol. 2009, 183(1), 332–339. [Google Scholar] [CrossRef] [PubMed]
- Boer MC, Joosten SA, Ottenhoff TH. Regulatory T-Cells at the Interface between Human Host and Pathogens in Infectious Diseases and Vaccination. Front Immunol. 2015; 6, 217. [CrossRef]
- Giannopoulos K, Schmitt M, Kowal M, Wlasiuk P, Bojarska-Junak A, Chen J, et al. Characterization of regulatory T cells in patients with b-cell chronic lymphocytic leukemia. Oncol Rep 2008, 20(3), 677–682.
- Trujillo-Ochoa JL, Kazemian M, Afzali B. The role of transcription factors in shaping regulatory T cell identity. Nat Rev Immunol. 2023, 23(12), 842–856. [Google Scholar] [CrossRef] [PubMed]
- Chi VLD, Garaud S, De Silva P, Thibaud V, Stamatopoulos B, Berehad M, Gu-Trantien C, Krayem M, Duvillier H, Lodewyckx JN, Willard-Gallo K, Sibille C, Bron D. Age-related changes in the BACH2 and PRDM1 genes in lymphocytes from healthy donors and chronic lymphocytic leukemia patients. BMC Cancer, 2019; 19, 81. [CrossRef]
- Grant FM, Yang J, Nasrallah R, Clarke J, Sadiyah F, Whiteside SK, Imianowski CJ, Kuo P, Vardaka P, Todorov T, Zandhuis N, Patrascan I, Tough DF, Kometani K, Eil R, Kurosaki T, Okkenhaug K, Roychoudhuri R. BACH2 drives quiescence and maintenance of resting Treg cells to promote homeostasis and cancer immunosuppression. J Exp Med. 2020, 217(9):e20190711. [CrossRef]
- Ciardullo C, Szoltysek K, Zhou P, Pietrowska M, Marczak L, Willmore E, Enshaei A, Walaszczyk A, Ho JY, Rand V, Marshall S, Hall AG, Harrison CJ, Soundararajan M, Eswaran J. Low BACH2 Expression Predicts Adverse Outcome in Chronic Lymphocytic Leukaemia. Cancers (Basel). 2021, 14(1), 23. [Google Scholar] [CrossRef]
- Gauthier M, Durrieu F, Martin E, Peres M, Vergez F, Filleron T, Obéric L, Bijou F, Quillet Mary A, Ysebaert L. Prognostic role of CD4 T-cell depletion after frontline fludarabine, cyclophosphamide and rituximab in chronic lymphocytic leukaemia. BMC Cancer. 2019; 19, 809. [CrossRef]
- Vodárek P, Écsiová D, Řezáčová V, Souček O, Šimkovič M, Vokurková D, Belada D, Žák P, Smolej L. A comprehensive assessment of lymphocyte subsets, their prognostic significance, and changes after first-line therapy administration in patients with chronic lymphocytic leukemia. Cancer Med. 2023; 12, 6956–6970.
- Papazoglou D, Wang XV, Shanafelt TD, Lesnick CE, Ioannou N, De Rossi G, Herter S, Bacac M, Klein C, Tallman MS, Kay NE, Ramsay AG. Ibrutinib-based therapy reinvigorates CD8+ T cells compared to chemoimmunotherapy: immune monitoring from the E1912 trial. Blood. 2024; 143, 57–63.
- Lord, J. D. , McIntosh, B. C., Greenberg, P. D., Nelson, B. H. The IL-2 receptor promotes lymphocyte proliferation and induction of the c-myc, bcl-2, and bcl-x genes through the trans-activation domain of Stat5. J. Immunol. 2000; 164, 2533–2541. [Google Scholar]
- Liu L, Cheng X, Yang H, Lian S, Jiang Y, Liang J, Chen X, Mo S, Shi Y, Zhao S, Li J, Jiang R, Yang DH, Wu Y. BCL-2 expression promotes immunosuppression in chronic lymphocytic leukemia by enhancing regulatory T cell differentiation and cytotoxic T cell exhaustion. Mol Cancer. 2022; 21, 59. [CrossRef]
Figure 1.
Increased frequency of activated Treg subset in peripheral blood from CLL patients with untreated advanced disease and correlation with total tumor mass (TTM) scoring.(A) Box-and-whisker plot shows the percentage of FOXP3+ cells among gated CD4+ T cells from patients with CLL (CLL, n = 54) and healthy controls (HC, n = 20). (B) FOXP3+ cells among gated CD4+ T cells were subdivided into 3 fractions based on CD45RA and the level of FOXP3 expression: I) CD45RA+ FOXP3lo rTreg, II) CD45RA−FOXP3hi aTreg, and III) CD45RA−FOXP3lo non-Treg subsets, as shown on representative dot plot. (C) Percentage of aTreg, non-Treg, and rTreg among CD4+ T cells from patients with CLL (n = 54) and HCs (n = 20). (D) Percentage of aTreg defined as CD45RA−FOXP3hi among CD4+ T cells from patients with CLL in Binet stage A (n = 17), patients with CLL in Binet stage B (n = 12) and patients with CLL in Binet stage C (n = 25). (E) Correlation between percentage of aTreg defined as either CD45RA−FOXP3hi (black symbols, n = 42) or CD45RA−CD25hi CD127lo/-(grey symbols, n = 28) and Lymphocyte counts (×106/L) from patients with CLL. (F) Correlation between percentage of aTreg defined as either CD45RA−FOXP3hi (black symbols, n = 42) or CD45RA−CD25hi CD127lo/- (grey symbols, n = 28) and TTM score in patients with CLL. rs, Spearman correlation coefficient; ****P < 0.0001.; ***P < 0.001; **P < 0.01; *P < 0.05.
Figure 2.
IL-2-induced pSTAT5/nuclear translocation in FOXP3+ cells, augmented aTreg STAT5 signaling responses and correlation with increased proportions of aTregs following SARS-CoV-2 antigen-specific stimulation. (A) Recombinant human IL-2 was used to activate leukocytes in whole blood from healthy donors for 15 minutes. Then, using imaging flow cytometry, the colocalization of pSTAT5 within the 7-AAD labeled nucleus was measured. Initially, lymphocytes were gated as low area/low SSC cells. FOXP3 high and FOXP3 low expressing, as well as FOXP3 negative subsets were gated as shown on the representative FOXP3 vs. pSTAT5 dot plot on Supplementary figure S2. Representative histograms of 7-AAD/pSTAT5 similarity scores in FOXP3 high (red) and FOXP3 low expressing (orange) cells as compared to FOXP3− cells (white). The sample cell pictures are displayed on the right. In FOXP3-expressing (blue) cells, pSTAT5 (green) is preferentially localized to the nucleus stained with 7-AAD (red). Cell brightfield pictures are also displayed. (B) Whole blood samples were obtained and stimulated or incubated for 16–24 hours in tubes from the Quantiferon SARS-CoV-2 kit. Blood aliquots were taken from the Ag tubes (+Ag) and the negative control (Nil) tubes, aTreg pSTAT5 levels (MFI) are shown on plot. Patients with CLL (n = 12) are contrasted with healthy controls (n = 9). The data are presented as mean + SD. (C) STAT5 signaling responses in rTreg and aTreg are compared using the pSTAT5 MFI fold change, which is calculated by dividing the pSTAT5 MFI in the stimulated tube by the pSTAT5 MFI in the control tube from healthy controls (n = 9) and patients with CLL (n = 12). (D) Cumulative aTreg percentages among FOXP3+CD4+ T cells in whole-blood aliquots withdrawn from negative control (Nil) and from the Ag tubes (+Ag). Healthy controls (n = 9) are compared to patients with CLL (n = 12). Data are expressed as mean with SD. (E) Correlation between aTreg STAT5 signaling responses, measured as the pSTAT5 MFI fold change (pSTAT5 MFI in stimulated tube divided by pSTAT5 MFI in control tube) and fold change in percentage of aTreg (percentage of aTreg among FOXP3+CD4+ T-cells in stimulated tube divided by percentage of aTreg among FOXP3+CD4+ T-cells in control tube) from healthy controls (n = 9) and patients with CLL (n = 12). rs, Spearman correlation coefficient; ***P < 0.001; **P < 0.01; *P < 0.05.
Figure 3.
Significantly different disease courses in subgropus of patients defined based on aTreg frequencies and correlation between aTreg, CD4 counts and STAT5 signaling during follow-up.(A) Survival curve (Kaplan-Meier plot) showing shorter time to first grade≥3 infection in the group 2 patients with CLL with higher aTreg percentages (≥26%) among CD4+FOXP3+ T cells at the start of follow-up. (B) Disease courses of 37 patients with CLL (y axis). The color of the dotted lines reflects subgroup designations. Increased flare frequency in group 2 (red dashed lines) when followed up to 500 d. (C and D) aTreg frequency (percentage of aTreg among FOXP3+CD4+ T cells) and CD4 counts in the group 1 of patients with CLL (black symbols) vs. the group 2 of patients with CLL (red symbols). (E) Correlation between percentage of aTreg among FOXP3+CD4+ T cells in samples from patients with CLL and their CD4 counts during follow-up (upper panel, n = 28). Correlation between percentage of aTreg among CD4+ FOXP3+ T cells in samples from patients with CLL and basal pSTAT5 levels (MFI) in their CD4+ T-cells during follow-up (lower panel, n = 25). rs, Spearman correlation coefficient; NS, not significant; *P < 0.05, **P = 0.001–0.01, ***P = 0.0001–0.001, ****P < 0.0001.
Figure 4.
Higher basal pSTAT5 levels in CD4 T-cells from patients with CLL treated with CIT, correlation with Ki-67+ aTreg and subset specific differences in basal STAT5 phosphorylation.(A) Box-and-whisker plot shows basal STAT5 phosphorylation (pSTAT5) levels (MFI) in CD4+ T cells from samples of untreated patients with CLL (CLL, n = 23), patients with CLL on CIT or therapy with BTKi (CLL+Th, n = 28) and HCs (n = 18). (B) Lymphocytes were gated as shown on CD45 vs. SSC density plot. CD4+ T cells were identified by first gating on lymphocytes and then on CD4+ cells. (C) pSTAT5 levels (MFI) in CD4+ T cells from samples of patients with CLL on CIT (CIT, n = 13) and therapy with BTKi (BTKi, n = 15) Representative histograms of pSTAT5 in gated CD4+ T-cells from sample of patient with CLL on CIT and patient with CLL on therapy with BTKi - Ibrutinib are shown left: basal, untreated cells are compared with cells stained with isotype control. (D) Percentage of Ki-67+ aTreg cells (%Ki-67+ aTreg) among CD4+ T-cells from samples of untreated patients with CLL (CLL, n = 17), patients with CLL on CIT or therapy with BTKi (CLL+Th, n = 25) and HCs (n = 17). (E) Percentage of Ki-67+ aTreg cells among CD4+ T cells from samples of patients with CLL on CIT (n = 10) or therapy with BTKi (n = 15). (F) Correlation between percentage of Ki-67+ aTreg cells and basal pSTAT5 levels (MFI) in CD4+ T cells from samples of patients with CLL on CIT or therapy with BTKi (n = 24) (G) Basal pSTAT5 levels (MFI) in aTreg subset (shown in gray) gated as shown on Figure 1B and FOXP3 negative Tcon (white) in samples from untreated patients with CLL (CLL, n = 21), patients with CLL on CIT or therapy with BTKi (CLL+Th, n = 24) and HCs (n = 17). (H) Basal pSTAT5 levels (MFI) in aTreg subset and FOXP3 negative Tcon in samples from patients with CLL on CIT (n = 11) or therapy with BTKi (n = 13). rs, Spearman correlation coefficient; ***P < 0.001; **P < 0.01; *P < 0.05.
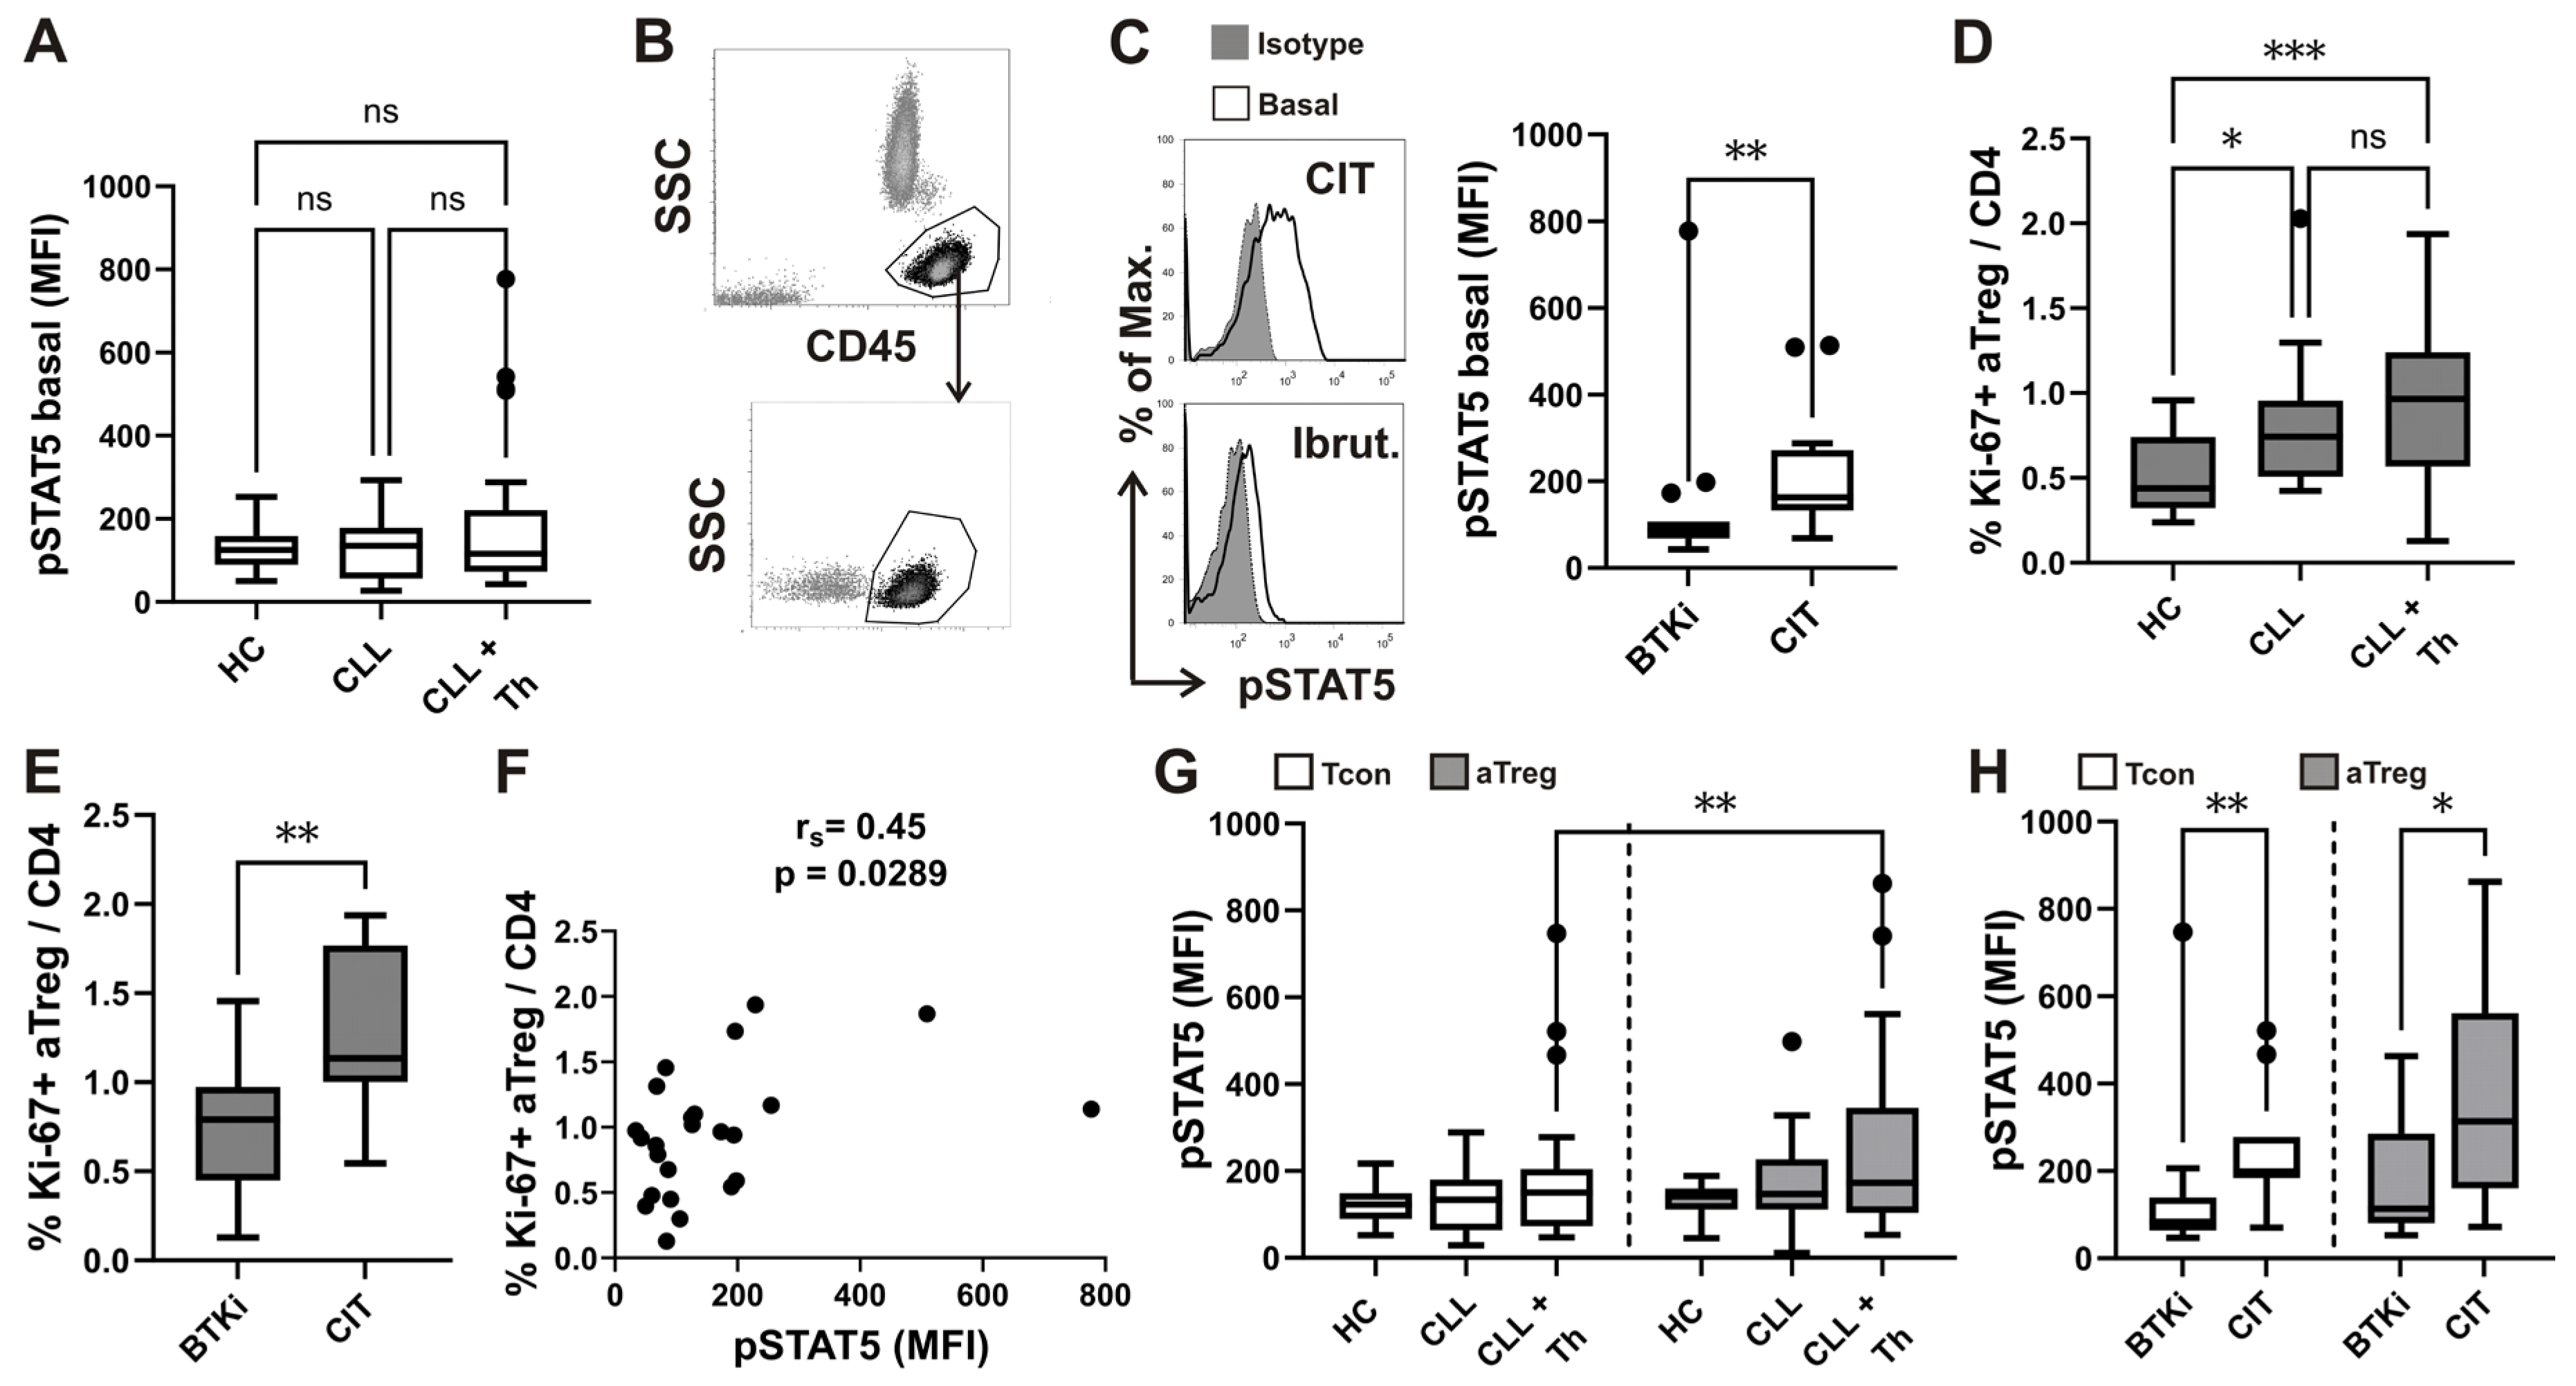

Table 1.
Demographic, clinical and laboratory data at the time of follow-up study entry.
| Parameter | Group1a | Group2a | P | Adjusted P |
|---|---|---|---|---|
| Cohort size | 18 | 19 | NA | NA |
| Age (y) | 68 (3) | 70 (2) | 0.93 | NS |
| Gender | 5F / 13 M | 8F / 11M | 0.49 | NS |
| Ethnicity | 19 Slovene | 19 Slovene | NA | NA |
| Binet stage C | 10 / 18 | 15 / 19 | 0.17 | NA |
| Disease duration (mo) | 49 (15) | 60 (11) | 0.32 | NS |
| Age at diagnosis (y) | 64 (3) | 65 (2) | 0.89 | NS |
| TTM score t0 | 16.4 (1.8) | 17.0 (1.7) | 0.81 | NS |
| TD score t0 | 0.77 (0.05) | 0.75 (0.04) | 0.69 | NS |
| LN t0 (cm) | 1.8 (0.4) | 3.1 (0.8) | 0.25 | NS |
| Spleen t0 (cm) | 1.7 (0.9) | 2.2 (1.1) | 0.60 | NS |
| Lymphocytes t0 (×109/L) | 170.8 (30.5) | 146.5 (19.2) | 0.68 | NS |
| Neutrophils t0 (×109/L) | 3.7 (0.6) | 3.7 (0.4) | 0.89 | NS |
| CD4 count t0 (×103/L) | 2129 (238) | 2445 (300) | 0.77 | NS |
| CD4% t0 (%) | 3.7 (1.6) | 2.1 (0.3) | 0.48 | NS |
| TP53 mutation | 4/18 | 1/19 | 0.18 | NS |
| Unmutated IGHV | 11/18 | 8/19 | 0.33 | NS |
| AIHA | 2/18 | 2/19 | >0.99 | NS |
| Preexisting CLL therapy | 7/18 | 5/19 | 0.49 | NS |
| Hgb t0 (g/L) | 104 (4) | 108 (7) | 0.96 | NS |
| Tr t0 (×109/L) | 158 (23) | 128 (12) | 0.43 | NS |
a P value refers to the comparison of group 1 (aTreg < 26% among CD4+FOXP3+ T-cells) vs. group 2 (aTreg ≥ 26% CD4+FOXP3+ T-cells); adjusted P, Bonferroni-adjusted P value; LN t0, diameter of largest palpable lymph node at time of enrollment; Spleen t0, palpable spleen below left costal margin node at time of enrollment; CD4%, percentage of CD4+ T cells among lymphocytes; AIHA, autoimmune haemolytic anaemia; F, female; M, male; NA, not applicable; NS, P> 0.05; Preexisting CLL therapy, any CIT or BTKI therapy of CLL before enrollment; Hgb t0, Hemoglobin concentration at time of enrollment; t0, at time zero enrollment.
Table 2.
Therapy during follow-up.
| Therapy | Combinations | Group1a | Group2a | P | Adjusted P | ||
|---|---|---|---|---|---|---|---|
| n/N | % | n/N | % | ||||
| CIT | All | 4/18 | 25 | 8/19 | 42 | 0.29 | NS |
| FCR | 0/18 | 0 | 4/19 | 21 | 0.10 | NS | |
| Chlorambucil + Rituximab | 2/18 | 11 | 4/19 | 21 | 0.66 | NS | |
| Chlorambucil + Obinutuzumab | 1/18 | 5 | 0/19 | 0 | 0.49 | NS | |
| Bendamustine + Rituximab | 1/18 | 5 | 0/19 | 0 | 0.49 | NS | |
| BTKi | All | 11/18 | 61 | 8/19 | 42 | 0.33 | NS |
| Ibrutinib | 5/18 | 28 | 6/19 | 32 | >0.99 | NS | |
| Acalabrutinib | 4/18 | 22 | 2/19 | 10 | 0.40 | NS | |
| Acalabrutinib + Obinutuzumab | 2/18 | 11 | 0/19 | 0 | 0.23 | NS | |
| Venetoclax | All combinations | 3/18 | 17 | 3/19 | 16 | >0.99 | NS |
| + Rituximab | 0/18 | 0 | 2/19 | 10 | 0.49 | NS | |
| + Obinutuzumab | 1/18 | 5 | 0/19 | 0 | >0.99 | NS | |
| + Bendamustine + Obinutuzumab | 2/18 | 11 | 1/19 | 5 | 0.60 | NS | |
a No. of patients/Whole group; P value refers to the comparison of group 1 (aTreg ≤ 26% of CD4+FOXP3+ T-cells) vs. group 2 (aTreg > 26% of CD4+FOXP3+ T-cells); adjusted P, Bonferroni adjusted P value; therapy given at start of and during follow-up; FCR, Fludarabine+Ciclophosphamide+Rituximab combination; NS, P > 0.05.
Disclaimer/Publisher’s Note: The statements, opinions and data contained in all publications are solely those of the individual author(s) and contributor(s) and not of MDPI and/or the editor(s). MDPI and/or the editor(s) disclaim responsibility for any injury to people or property resulting from any ideas, methods, instructions or products referred to in the content. |
© 2024 by the authors. Licensee MDPI, Basel, Switzerland. This article is an open access article distributed under the terms and conditions of the Creative Commons Attribution (CC BY) license (http://creativecommons.org/licenses/by/4.0/).
Copyright: This open access article is published under a Creative Commons CC BY 4.0 license, which permit the free download, distribution, and reuse, provided that the author and preprint are cited in any reuse.


