
Submitted:
30 May 2025
Posted:
04 June 2025
You are already at the latest version
Abstract
Currently, many attention is focus on the interactions between the leukemic and psoriatic cells showing immunosuppressive activity within the microenvironment. Our study assessed a collective mRNA expression pattern of crucial immuno-regulatory genes: BTLA, CD160, SPN, TIM-3, VISTA, TIGIT by qRT-PCR and perform a comparison in two different diseases, chronic lymphocytic leukemia (CLL) and psoriasis (Ps), referring to clinical characteristics. In Ps, all the studied gene expressions, except TIM-3, were higher than in HVs and all the studied gene expressions, except VISTA, were lower than in CLL. However, the expression of TIM-3, a checkpoint inhibitor, was higher in 0 stage of CLL and was lower in advanced stages of the disease, suggesting its possible diagnostic value. Expression of VISTA was higher in Ps than in HVs as well as CLL. Noteworthy, BTLA, CD160 and SPN was overexpressed in CLL and Ps compared to HVs, suggesting its involvement in immune suppression in both diseases. Significant correlations between gene expressions of SPN and BTLA, SPN and TIGIT, CD160 and TIM-3, were observed, indicating a potential shared regulatory mechanism for immune responses which suggests their bidirectional regulatory role on the functioning of immune system cells depending on the context of inflammatory or neoplastic conditions.
Keywords:
chronic lymphocytic leukemia (CLL)
; psoriasis (Ps)
; immunoregulatory check points
; BTLA
; CD160
; CD43(SPN)
; VISTA
; TIGIT
; TIM3
1. Introduction
The particular importance of the abnormal stimulation of the immune system are phenomena taking place in the tissues that constitute the external protective barriers of the human body, mainly in the skin. At the root of the inadequate immune response causing inflammation in psoriasis (Ps), as well as chronic lymphocytic leukemia (CLL), are disorders of the immune system, which are a consequence of the interplay between genetic conditions and the impact of environmental factors. Factors that contribute to cytokine production and T-lymphocyte stimulation by interacting with cells of the innate immune system are also involved in the pathogenesis of these diseases. Ongoing pathological processes reduce the tightness of the skin barrier, from which they facilitate the penetration of antigens and pathogens, which promotes further stimulation of the immune system [1]. CLL and Ps represent two distinct diseases, with CLL as a hematologic malignancy characterized by immune suppression, and Ps as an autoimmune disease with an excessive immune activation. Despite their different origin, both conditions share some common features of immune dysregulation.
In hematological malignancies, including CLL immune deregulations are very common. CLL is a highly frequent leukemia in adults living in Western countries and is characterized by a very heterogeneous clinical course. In CLL patients, both the symptoms of immunosuppression, manifesting by frequent infections, and the occurrence of autoimmunity leading to autoimmune cytopenias are due to qualitative as well as quantitative abnormalities of the immune cells. Very important are abnormal interactions between the leukemic cell clone and cells showing immunosuppressive activity within the microenvironment. Crucial impact in immunosuppression in terms of the escape of the immune system from immune surveillance is provided by the programmed death receptor 1 and its ligand (PD-1/PDL-1) signaling pathway. Important immunosuppressive exponents in CLL patients include T regulatory (Treg) and B regulatory (Breg) lymphocytes, as well as myeloid-derived suppressor cells (MDSC). The most significant disruption of the B-cell response is the commonly observed hypogammaglobulinemia. Immunosuppression is clinically manifested by an increased frequency of infections, as well as secondary cancers [2,3,4].
Whereas Ps is a chronic inflammatory disease of the skin and joints mediated by T lymphocytes [5]. Ps is a common disease, estimated to affect 0.1% of the population in East Asia to 1.5% in Western Europe, and its incidence is increasing in developing countries. In Ps, activated dendritic cells produce tumor necrosis factor (TNF) α, TNF-β, interleukin 2 (IL-2), interleukin 3 (IL-3), interleukin 22 (IL-22) and interleukin 26 (IL-26), contributing to the differentiation of T cells into Th1 and Th17. Components of the IL-23/Th17 axis interact with skin epithelial cells to initiate and sustain the inflammatory process in both diseases [6,7]. At least nine regions of Ps susceptibility risk have been identified based on genome-wide linkage analysis. Based on the genome-wide association studies (GWAS), several conclusions can be drawn about genetic factors in Ps. Most of the genes involved also have immune functions, highlighting the importance of the innate as well as acquired immune response [8]. In contrast, relatively few genes that encode skin-specific proteins have been linked to Ps. Related genes encode proteins that have roles in specific immune pathways and signaling pathways, specifically involving tumor necrosis factor-α (TNF-α) , nuclear factor κ-b (NF-κB), interferons and IL23/Th17 interleukins. In addition, endoplasmic reticulum aminopeptidase 1 (ERAP1), which encodes an aminopeptidase involved in MHC class I antigen processing, interacts synergistically with the HLA-Cw6 risk allele, providing another argument for the role of major histocompatibility (MHC) antigen and its presentation by human leukocyte antigen (HLA) C in Ps pathogenesis [9]. It is worth noting that the initiators of the development of a disease such as Ps are environmental factors in genetically predisposed individuals. These include infections, hormonal factors, stress, certain medications, alcohol consumption, smoking, and obesity, among others.
Many studies have confirmed the close link between cancers and autoimmune diseases, but the detailed mechanisms and pathophysiology have not been elucidated, which is an obstacle to disease prevention and treatment. It has been suggested that patients with Ps are at increased risk for cancer, and many risk factors for cancer development, including smoking and alcohol consumption, are associated with Ps. It has been proven that patients with Ps have an increased risk of developing both Hodgkin's lymphoma and non-Hodgkin lymphoma. This increase may be partly explained by the increased risk of cutaneous T-cell lymphoma (CTCL) in patients with Ps [10].
Currently, a lot of attention is paid to the interactions between the leukemic as well as psoriatic cells and cells showing immunosuppressive activity within the microenvironment. Thereby current study aimed to present a collective expression pattern of crucial immuno-regulatory genes including BTLA, CD160, SPN, TIM-3, VISTA and TIGIT on the mRNA level as well as perform a comparison in two different diseases, CLL and Ps, referring to recognized prognostic markers as well as clinical characteristics. Most of them are proved to show immune-regulatory function referring to T subpopulations. There are limited data on their pattern expression on B cells especially at the mRNA level.
2. Materials and Methods
The material was obtained from 85 psoriatic patients as well as 76 untreated CLL patients and 15 healthy volunteers (HVs). The psoriatic patients were hospitalized in the Department of Dermatology, Venereology, and Pediatric Dermatology at the Medical University of Lublin, Poland and had not received any anti-psoriatic treatment for at least 6 months prior to the recruitment into the study. The cohort consisted of 71 (83,5%) men and 14 (16,5%) women aged from 18 to 77 years (median age 47). Thirty patients (35,3%) had concomitant psoriatic arthritis. The severity of Ps was assessed with the use of Ps Area and Severity Index (PASI). The median value of the PASI was 12,1 (range from 1 to 49,4). The current study involved 74 (46 males, 28 females, median age 66) newly diagnosed and previously untreated CLL patients at Department of Hematology, St. John’s Cancer Centre, Lublin, Department of Hematology, Military Institute of Medicine, Warsaw, as well as Department of Hematooncology and Bone Marrow Transplantation, Lublin. The clinical characteristics of the CLL and Ps patients are shown in Table 1 as well as Table 2 particularly (Table1, Table 2).
Isolation of mononuclear cells and RNA
Peripheral blood mononuclear cells (PBMCs) from psoriatic patients, CLL patients and healthy volunteers were isolated by Ficoll density gradient centrifugation (Biochrom AG, Berlin, Germany) and cryopreserved at -80°C until the time of analysis. The viability of the PBMCs obtained was always >95%, as determined by Trypan blue staining. Viable cells were quantified in a Neubauer chamber (Zeiss, Oberkochen, Germany). Total RNA was isolated from the PBMCs using a QIAamp RNA Blood Mini Kit (Qiagen, Venlo, Netherlands) according to the manufacturer’s protocol. The quality and quantity of the obtained RNA were quantified spectrophotometrically (OD 260/280) using a BioSpec-nano (Shimadzu, Yoko, Japan).
Assessment of BTLA, CD160, SPN, TIM-3, VISTA and TIGIT mRNA expression
BTLA, CD160, SPN, TIM-3, VISTA and TIGIT mRNA expression was measured by quantitative real-time reverse transcription-polymerase chain reaction (qRT-PCR). Total RNA was reverse-transcribed to cDNA using a QuantiTect Reverse Transcription Kit (Qiagen). cDNA was used in a qRT-PCR to measure the mRNA expression of BTLA (Hs00699198_m1), CD160 (Hs01073987_m1), SPN (CD43; Hs01872322_s1), TIM-3 (HAVCR2; Hs00262170_m1), VISTA (C10orf54; Hs00735289_m1) and TIGIT (Hs00545087_m1) using the TaqMan Gene Expression Assay methodology, according to the manufacturer’s protocol (Applied Biosystems, Foster City, USA).
The glyceraldehyde-3-phosphate dehydrogenase (GAPDH) was used as a constitutively expressed housekeeping gene and negative controls contained water instead of cDNA to ensure the purity of all reagents. Th thermocycling program was set for 40 cycles of 15s at 95°C and 1 min at 60 C on the ABI Prism 7300 Sequence Detector (Applied Biosystems). The BTLA, CD160, SPN, TIM-3, VISTA and TIGIT mRNA expression were calculated using ΔΔCt methodology (), where ΔCt is the Ct value of the gene of interest (GOI) minus Ct value of GAPDH; ΔΔCt is the particular ΔCt value minus ΔCt value of the calibrator of an assay; calibrator is the sample with the highest ΔCt value.
Statistical Analyses
Statistical analyses were performed using GraphPad Prism 9 (La Jolla, CA, USA). All results are presented as median values with range. The Mann–Whitney U-test and Kruskal–Wallis test were used to evaluate the differences between the subgroups. The correlations of variables were computed with the Spearman rank correlation coefficient. Statistical significance was defined as a p-value of less than 0.05.
3. Results
3.1. Aberrant mRNA Expression of BTLA, CD160, SPN, TIM3, VISTA, TIGIT in CLL and Psoriatic Patients Compared to HVs
The expression of BTLA, CD160, SPN, TIM3, VISTA, TIGIT was confirmed in CLL and psoriatic patients.
BTLA expression was shown to be higher in CLL patients as well as Ps patients compared to HVs (1500 vs. 5.372, p<0.0001), (18.22 vs. 5.372, p<0.0001), respectively. Moreover BTLA expression was higher in CLL patients compared to psoriatic patients (1500 vs. 18.22, p<0.0001) (Figure 1a). Similarly, CD160 expression was observed to be higher in CLL patients as well as Ps patients compared to HVs (86.94 vs. 11.96, p<0.0001), (48.92 vs. 11.96 p<0.0001), respectively and CD160 expression was higher in CLL patients compared to Ps patients (86.94 vs. 48.92, p=0.0243) (Figure 1b). Additionally, SPN expression was higher in CLL patients as well as Ps patients compared HVs (1706 vs. 82.24 p<0.0001), (451.8 vs. 82.24 p<0.0001), respectively and SPN expression was higher in CLL patients compared to Ps patients (1706 vs. 451.8 p<0.0001) (Figure 1c).
TIM-3 expression was shown to be lower in Ps patients compared to HVs (0.02485 vs. 183.1, p<0.0001). TIM-3 expression was shown to be higher in CLL patients compared to Ps patients (226.9 vs. 0.02485, p<0.0001). There was no statistically significant difference in TIM-3 expression in CLL patients compared to HVs (226.9 vs. 183.1, p=0.7251) (Figure 1d).
VISTA expression was found to be higher in Ps patients compared to HVs (196.7 vs. 34.93, p<0.0001) and Ps patients compared to CLL patients (196.7 vs. 27.50, p<0.0001). There were no statistically significant differences in VISTA expression in CLL patients compared to HVs (27.50 vs. 34.93, p=0.1854) (Figure 1e).
TIGIT expression was shown to be higher in CLL patients compared to Ps patients (409.6 vs. 109.9 p<0.0001) as well as in CLL patients compared to HVs (409.6 vs. 19.41, p<0.0001) and in Ps patients compared to HVs (109.9 vs. 19.41, p<0.0001) (Figure 1f).
3.2. Correlations Between Expression of BTLA, CD160, SPN, TIM3, VISTA as Well as TIGIT in CLL
We showed statistically significant, positive correlations between expressions of the following pairs of genes including, SPN and CD160 (r=0.7822, p<0.0001), SPN and BTA (r=0.7960, p<0.0001), SPN and TIGIT (r=0.6800, p<0.0001), CD160 and TIM3 (r=0.6212, p<0.0001), BTLA and TIGT (r=0.6774, p<0.0001) as well as TIM3 and VISTA (r=0.6331, p<0.0001) in CLL (Figure 2a-f).
3.3. Correlations Between the Expression of BTLA, CD160, SPN, TIM3, VISTA as Well as TIGIT in Ps
We showed statistically significant, positive correlations between expressions of the following pairs of genes including, SPN and TIGT (r=0.8246, p<0.0001), SPN and TIM3 (r=0.672, p<0.0001), SPN and BTLA (r=0.7016, p<0.0001), SPN and CD160 (r=0.7183, p<0.0001), CD160 and TIM3 (r=0.6263, p<0.0001), CD160 and TIGIT (r=0.7576, p<0.0001) in Ps (Figure 3a-f).
3.4. Associations of the Expression of BTLA, CD160, SPN, TIM3, VISTA, TIGIT with Prognostic Parameters in CLL
To assess the clinical significance of the expression of BTLA, CD160, SPN, TIM3, VISTA, and TIGIT in CLL we analyzed associations of that expression with prognostic factors including: mutational status of the immunoglobulin heavy-chain variable-region (IGHV), MYD88, TP53, NOTCH1 and expression of zeta chain of T-cell receptor associated protein kinase 70 (ZAP-70), CD38 as well as lactate dehydrogenase (LDH) activity and β2microglobulin level. Moreover, we analyzed differences in those expressions with the clinical stage of CLL according to Rai stage. We observed a tendency to higher SPN expression in CD38+ group compared to CD38- (3864 vs. 1806, p=0.0602) (Figure 4a).
The differences in the TIM3 expression in referring to the stage of disease according to Rai classification were shown. Higher expression of TIM3 was observed in the CLL group with 0 stage compared to 3 and 4 stages (328,1 vs. 130.2, p=0.0186). Moreover, a tendency to higher expression of TIM3 was observed in CLL groups with 1 and 2 stages compared to 3 and 4 stages (278,8 vs. 130.2, p=0.0999) (Figure 4b).
We showed a tendency to lower TIGIT in MYD88mut group than MYD88wt group (514.2 vs. 98.18, p=0.0508) (Figure 4c). Higher expression of TIGIT was observed in CLL groups with 1 and 2 stage compared to 0 stage according to Rai classification (806.3 vs. 500.6, p=0.0263) as well as in CLL groups in 1,2,3,4 stage compared to 0 stage (647.4 vs. 500.6, p=0.0300) (Figure 4d).
3.5. Associations of the Expression of BTLA, CD160, SPN, TIM3, VISTA, TIGIT and Clinical Parameters in Ps
To assess clinical significance of the expression of BTLA, CD160, SPN, TIM3, VISTA, TIGIT in Ps we analyzed associations of those expression with prognostic factors including: gender, type of Ps, psoriatic arthritis activity, clinical course, age, duration and also PASI, WBC, neutrophils, lymphocytes, CRP and OB level. We showed a low, negative correlation between TIM3 expression with OB level (r=-0.2571, p=0.0175) (Figure 6a), and a low, negative correlation between TIM3 expression with lymphocytes level (r=-0.2194, p=0.0437) (Figure 6b).
Additionally we showed low, negative correlation between BTLA expression with OB level (r=-0.2328, p=0.0320) (Figure 6c), also low, negative correlation between BTLA expression with lymphocytes level (r=-0.1809, p=0.0976) (Figure 6d), and low, negative correlation between BTLA expression with age level (r=-0.2098, p=0.0540) (Figure 6e). In addition we observed a low, negative correlation between VISTA expression with OB level (r=-0.1798, p=0.0996) (Figure 6f), and low, negative correlation between SPN expression with OB level (r=-0.2281, p=0.0357) (Figure 6g).
A tendency to higher TIM3 expression with group without psoriatic arthritis compared to group with psoriatic arthritis (276.1 vs. 209.1 p=0.0652) (Figure 7a), and also higher BTLA expression in type I Ps group compared to type II Ps group were observed (24.19 vs. 15.70 p=0.0365) (Figure 7b). Additionally, we observed a tendency to lower VISTA expression with mild clinical course than with a severe clinical course (143.1 vs. 239.3 p=0.0511) (Figure 7c).
4. Discussion
In our research, we provided a collective screening of the immune-regulatory genes expression including, BTLA, CD160, SPN, TIM-3, VISTA and TIGIT on the mRNA level as well as comparison in two different diseases such as CLL and Ps. We referred the mRNA expression to recognized prognostic markers as well as clinical characteristics. We showed aberrant expression of the following genes in those two diseases.
BTLA expression was shown to be higher in CLL patients compared to Ps patients and higher in Ps and CLL patients compared to HVs. B and T lymphocyte attenuator (BTLA) is an inhibitory receptor which acts as a key factor in limiting inflammatory response. It is necessary to inhibit homeostatic expansion and activation of both the lymph node and skin of T cells. BTLA increases the expression of T regulatory cells, and it has a negative regulatory effect on Th17 and Th1 cell immune responses. In addition to inhibiting lymphocyte activation through TCR-mediated signal transduction and inhibiting cytokine (IL-2, IL-4 and IL-10) secretion, BTLA also crosslinks with herpes virus entry mediator (HVEM) on Treg cells, enabling its immunosuppressive effects. In addition, BTLA inhibits production of Immunoglobulins G (IgG) by suppressing IL-21 secretion by follicular helper T cells (Tfh) and plays an important role in immunomodulation in body fluids. Interestingly, BTLA inhibits the proliferation of T lymphocytes γδ and secretion of IL-17, TNF-α. So far, one paper has investigated BTLA expression in Ps. A study group of 25 patients, control group of 25 healthy people. It was shown that the expression of the BTLA gene was significantly lower in Ps [11]. The divergent research results in our study and in the study by Youseff R. et al. may result from the small control group and the study group, which in this case consisted of 25 people [11]. An increased expression of BTLA and its ligand HVEM has been shown in cancer and particularly in B-cell lymphoproliferations including CLL. In CLL, high expression of HVEM was also demonstrated, which may indicate that cells engage in BTLA/HVEM interaction to inhibit T cell responses and be engaged in immunosuppression of this population of immune cells. BTLA research has focused on T cells, and there is little research on its function in B cells [12]. Previous studies have shown that BTLA is a receptor that inhibits the B-cell receptor (BCR) signaling pathway that is crucial for B-cell activation. BTLA attenuates the strength of signaling by BCR by recruiting and phosphorylating the protein tyrosine kinase Syk and down-regulating B cell linker proteins, phospholipase E2 and NF-κB [13]. Ware et al. [14] suggested that HVEM/BTLA signaling can inhibit B-cell proliferation and CPG oligonuceotide-mediated cytokine secretion and increase stimulatory molecules on their surface; however, IL-8 and macrophage inflammatory protein 1β (MIP1β) secretion are not affected, indicating that BTLA may partially, but not completely, inhibit B-cell function. However, studies have also shown that BTLA expression in B cells is reduced in elderly patients, leading to a reduced response to the trivalent influenza vaccine and an inability to produce useful IgG antibodies and achieve effective vaccine responses. Thus, BTLA may play a bidirectional regulatory role in certain cases[15,16]. A drug that can selectively activate BTLA might achieve a long-term disease remission of immune-mediated inflammatory diseases. We observed no significant associations of mRNA expression of BTLA with known prognostic factors in CLL. Only a negative correlation between BTLA expression and the level of LDH was observed.
CD160 is a gene encoding a protein of the same name, which belongs to the family of immunoglobulin-like receptors that activate natural killer (NK) cells. As with other NK receptors, CD160 binds classical and non-classical major histocompatibility complex (MHC) class I antigens, including HLA-C and HLA-G. Binding of CD160 to HLA-C is a mechanism triggering NK cell-mediated cytotoxicity and cytokine production. CD160 acts as a receptor coactivator for CD4+CD16- T cells isolated from inflammatory lesions in the skin [17]. In our study, CD160 expression was observed to be higher in Ps patients compared to HVs. This may be related to the severe skin condition in our patients. Our publication is most likely the first to discuss CD160 expression in Ps patients. We showed higher mRNA expression of CD160 in CLL compared to Ps and HVs. However, no associations with clinical factors including prognostic markers are observed. In the literature, there is still limited data on the mRNA expression of CD160 in CLL. The other studies confirmed CD160 is expressed on the protein level on most NK cells as an immunoglobulin-like activating receptor. CD160 is expressed on some CD8+ T cells, but is not expressed on healthy B cells. In CLL, CD160 has been shown to mediate PI3K-dependent regulation of cell activation, positive regulation (upregulation) of Bcl-2 and Bcl-XL proteins. In addition, CD160 improved cell survival in vitro and cell secretion of cytokines. The limited expression of CD160 in the B cell line as a surface marker on CLL, but not on normal B cells, makes it an ideal marker used to detect minimal residual disease (MRD) in CLL. Signal transduction through CD160 mediates PI3K-dependent signals for cell survival and growth in CLL [2]. Protein expression of ligands for CD160 has been demonstrated both on leukemic cells and on other cells in the lymphoid microenvironment. These ligands include MHC class I molecules, CD1d and HLA-G. It appears that CD160 interactions with its ligands may play an important role in the pathophysiology of malignant B cells through autocrine, paracrine and/or stromal cell interactions, offering new targets for therapeutic strategies [18].
Sialophorin (SPN), otherwise known as superficial protein CD43, is encoded by SPN gene that is known to be expressed on the surface of T lymphocytes, natural killer (NK) cells, monocytes, granulocytes, and B lymphocytes and has been shown to be an important regulator of immune system cell function. CD43 is involved in the regulation of such cellular processes as cell proliferation and adhesion [19,20] In our study, we showed increased SPN mRNA expression levels in Ps patients compared to healthy volunteers. This may be due to the fact that the Ps in our study were active, all patients were without general treatment at the time of the study, and had severe Ps. Currently, there is no literature regarding the expression of SPN at the mRNA level in Ps. Recruitment of T cells to the skin is a central feature of many acute and chronic inflammatory skin conditions, including eczema, Ps, vitiligo, and alopecia areata. A subpopulation of memory effector T lymphocytes participates in the immune response in the skin, which can be identified by the presence of lymphocytes with positive expression of the antigen associated with cutaneous T lymphocytes CLA+ (cutaneous lymphocyte-associated antigen CLA[21]. It has been shown that CD43 is a ligand for P-selectin-1 (PSGL-1) present on CLA+ T cells[22]. In CLL, we observed higher expression of SPN (CD43) compared to HVs as well as compared to Ps. Assessment of protein expression at the CD43 protein level has been shown to enable differential diagnosis between CLL and other malignancies with proliferation of mature B lymphocytes [23,24]. Moreover, CD43 expression assessed by flow cytometry applicable to protocols for assessing minimal residual disease in CLL patients [24]. However, there are no reports regarding SPN expression at the mRNA level in CLL [25]. We observed a tendency to higher SPN expression in CD38+ group compared to CD38-. However, there were no associations with the other known prognostic factors.
Various inhibitory receptors, known as immune checkpoints, are involved in regulating T cells as well as NK cell activity. Most cancer cells use these molecules to evade the anti-tumor immune response. Deregulation of these receptors has been observed in various hematologic cancers. Among the inhibitory molecules, Tim-3 plays an important role in immune tolerance through negative regulation of pro-inflammatory signaling. Tim-3 is constitutively expressed on human NK cells and can be induced upon activation, ultimately delivering inhibitory signals through crosslinking. In chronic cases such as advanced melanoma, lung adenocarcinoma and chronic hepatitis B, it has been shown that prolonged Tim-3 expression can lead to a depleted/functional NK cell phenotype, which can be prevented by Tim-3 blockade [26]. Our study showed reduced TIM-3 levels in Ps patients compared to healthy volunteers. Tim-3 is a regulatory protein that has different effects depending on the context and may have a positive or negative impact on the immune response. It has been proven that Tim-3 expression is reduced in autoimmune diseases such as rheumatoid arthritis and Ps, which is confirmed by our research results [27]. Interestingly, our paper also provided higher expression of TIM-3 in CLL than Ps patients and no difference in TIM-3 expression in CLL patients than HVs. However, we showed higher expression of TIM3 in the CLL group with 0 stage compared to 3 and 4 stage according to Rai stage classification as well as a tendency to higher expression of TIM3 was observed in CLL groups with 1 and 2 stage compared to 3 and 4 stage that indicate higher expression of TIM-3 in earlier clinical stage of disease and suggest its possible diagnostic value in CLL. The other studies proved that immune cells, especially T cells of CLL patients show higher expression of various inhibitory receptors, such as Tim-3 as well as PD-1 and CTLA4, which constitute immune checkpoints eventually leading to T cell depletion. It was showed that in CLL patients with a more progressive type of disease have a higher percentage of PD-1-expressing T cells in the peripheral blood compared to healthy controls at the protein and mRNA levels. Moreover, it was shown that during CLL progression, significantly higher Tim-3 and PD-1 expression was observed on both CD8+ and CD4+ T cells, accompanied by significant functional defects in these cells [26]. Tim-3 expression was significantly higher in NK cells of CLL patients compared to healthy subjects. NK cells from CLL patients showed lower expression of the NKp30 activating receptor compared to controls. The expression pattern of Tim-3 on NK cells of CLL patients was correlated with negative prognostic factors, including low hemoglobin levels, high absolute lymphocyte counts and high serum C-reactive protein levels. Abnormalities in the regulation of Tim-3 and NKp30 receptor expression confirm the exhaustion state of NK cells in CLL [28,29,30,31]. Tim-3 expression on the protein level has been reported in other leukemias. Increased expression of Tim-3 has been reported on Th1 cells, Treg cells, CD8 + T cells and hematopoietic stem cells (HSCs) in on myelodysplastic syndrome (MDS). Moreover, several studies have demonstrated TIM-3 overexpression on leukemic stem cells (LSCs), and not on healthy HSCs in acute myeloid leukemia (AML). Overexpression of TIM-3 on exhausted CD4+ and CD8+ T cells and leukemic cells in patients with chronic lymphocytic leukemia (CML), acute lymphoblastic leukemia (ALL) and CLL might be a prognostic factor for poor therapeutic response and relapse in patients. Significantly, several TIM-3 inhibitors are being checked in clinical trials for leukemias, especially in MDS and AML [32].
Our analyses showed increased mRNA expression of VISTA and TIGIT in Ps patients compared to healthy volunteers. VISTA is expressed on both antigen-presenting cells (APCs) and T cells, and the protein inhibits T-cell activation through both extrinsic and intrinsic mechanisms. VISTA acts as a ligand when it is expressed on APCs, and engages a putative inhibitory receptor on the T cell that inhibits T cell proliferation and cytokine production. On the other hand, VISTA undergoing expression on T cells may engage the putative inhibitory receptor on T cells through T cell interaction or may act as a self-signaling receptor. Both mechanisms will contribute to T cell suppression [33]. Previous work has proven that the expression of VISTA and TIGIT may vary depending on the clinical context. The work of Li et al. showed that in an imiquimod (IMQ)-induced mouse model of Ps, Vsir-/- mice developed more severe psoriatic inflammation compared to WT mice. VISTA regulated IL-17 production by both γδ T cells and CD4+ Th17 cells. Expression of VISTA on dendritic cells inhibited IMQ-induced TLR7 signaling and IL-23 production [33]. The expression of VISTA and TIGIT can be compared to the action of the PD-1 protein. Each of these genes can act in a dual way. The lability of expression may be caused by many factors that are difficult to identify, for example the severity of the disease. The research conducted so far shows that the genes tested will not be useful as markers of inflammation [34]. Moreover, under inflammatory conditions, VISTA expression on different types of immune cells can be altered. Surface expression of VISTA on human CD14+ monocytes can be positively upregulated after stimulation of certain TLR receptors, such as TLR3 and TLR5, and the cytokines IL-10 and IFN-γ, as well as after HIV infection. At the transcriptional level, VISTA, as well as PD-L1 and PD-1, is a direct target for the tumor suppressor p53. Induced transcription occurs following forced expression of p53 or p53-induced genotoxic stress [33]. Our report showed higher expression of VISTA in Ps patients compared to CLL patients. No difference in VISTA expression in CLL patients than HVs. We observed no associations of VISTA expression with clinical characteristics. Only a low, negative correlation between VISTA expression and β2microglobulin level we provided. There are no more reports on the expression and role of VISTA in CLL. However, in acute myeloid leukemia (AML), VISTA is highly expressed on bone marrow-derived suppressor cells (MDSCs) in the peripheral blood of AML patients [35]. Both the percentage and intensity of VISTA expression on MDSCs are significantly higher in newly diagnosed AML than in healthy controls. Importantly, exclusion of VISTA by specific siRNA significantly reduced MDSC-dependent inhibition of CD8 T-cell activity in AML, suggesting a suppressive effect of VISTA on the anti-leukemic T-cell response. A strong positive association was observed between VISTA expression by MDSCs and PD-1 expression by T cells in AML.
TIGIT is an inhibitory receptor expressed on T, NK and NKT (Natural Killer-T) cells, involved in suppressing the immune response in various clinical conditions, including cancer. TIGIT shares structural and functional similarities with PD-1 and CTLA-4, respectively. The cytoplasmic tail contains a phosphorylation motif similar to the immunoglobulin tyrosine tail (ITT) and an ITIM domain through which TIGIT recruits SHIP1 phosphatase and inhibits activation of the NF-κB, phosphoinositide 3-kinase (PI3K) and mitogen-activated protein kinases (MAPK) pathways, similar to that described for PD-1.TIGIT binds to CD226/DNAM-1 (DNAX Accessory Molecule-1) so that they compete to bind to the same set of ligands, resulting in entry into opposite signaling pathways. The two molecules partially share an expression pattern, although CD226 is more widely expressed on immune cells, while TIGIT is absent on virgin T cells, but is expressed on activated and memory T cells, Treg cells, and on NK and NKT cells. In our study, we provided higher expression of TIGIT in CLL patients than Ps patients as well as higher expression of TIGIT in CLL patients than HVs. Additionally, higher expression of TIGIT in CLL groups with 1 and 2 stage compared to 0 stage according to Rai classification as well as in CLL groups in 1,2,3,4 stages compared to 0 stage was observed that might suggest the more important impact in more developed disease. However, we also showed a tendency to lower TIGIT in MYD88mut group than MYD88wt.The other studies showed that TIGIT expression is positively upregulated in the CD4+ T-cell compartment of CLL patients and is positively correlated with PD-1 expression in the same cells on the protein level. TIGIT+/CD4+ T lymphocytes constitute a higher proportion in high-risk CLL patients, as determined by advanced disease stage, unmutated IGHV genes or unfavorable cytogenetics. Functionally, TIGIT+/CD4+ T cells show an enhanced ability to maintain leukemic cell survival in co-cultures, and blocking TIGIT interactions with recombinant TIGIT-Fc molecules reduces PBL cell viability and interferes with the production of anti-apoptotic cytokines by CD4+ T cells. As with other immunomodulatory molecules, therapeutic antibodies targeting TIGIT have been developed and have recently begun clinical trials limited to solid2.
/metastatic tumors. No trials are currently underway for CLL [36].
Additionally, we provided statistically significant correlations between expressions of the following genes with the most statistical significance for pairs genes including, SPN and CD160, SPN and BTLA, SPN and TIGIT, CD160 and TIM3, BTLA and TIGT and TIM3 and VISTA in CLL, while SPN and TIGT, SPN and TIM3, SPN and BTLA, SPN and CD160, CD160 and TIM3, CD160 and TIGIT in Ps. Those correlation patterns of mRNA transcripts may suggest similar regulation in CLL and Ps patients. Moreover correlations between gene expressions of TIM3, BTLA, VISTA and SPN with OB might suggest their possible, negative immunoregulatory impact on nonspecific immune reactions.
To sum up, we have characterized the expressions of BTLA, CD160, SPN, TIM-3, VISTA and TIGIT in CLL and Ps compared to HVs. In Ps, all the studied gene expressions, except TIM-3, were higher than in HVs and all the studied gene expressions, except VISTA, were lower than in CLL. However, the expression of TIM-3, a checkpoint inhibitor, was higher in 0 stage of CLL and it was lower in more advanced stages of the disease, suggesting its possible diagnostic value in CLL. Moreover, expression of VISTA was higher in Ps than in HVs as well as CLL. Of particular note, BTLA, CD160, SPN and TIGIT was overexpressed in CLL and Ps compared to HVs, suggesting its involvement in immune suppression in both diseases. Significant correlations between gene expressions of SPN and BTLA, SPN and TIGIT, CD160 and TIM-3, were observed, indicating a potential shared regulatory mechanism for immune responses in both diseases which suggests their bidirectional regulatory role on the functioning of immune system cells depending on the context of inflammatory or neoplastic diseases.
Due to the substantial role of the studied genes in modulating immune response, they may appear to be a new target of therapeutic strategies.
5. Conclusions
Overall, the findings highlight disease-specific patterns of immune checkpoint molecule expression and suggest that the deregulation of immune inhibitory pathways could be crucial in both CLL and Ps pathophysiology. Although Ps is a classical autoimmune disease characterized by excessive immune activation, and CLL is a hematological malignancy marked by immune suppression and escape, interestingly, we observed some overlapping patterns of immune checkpoint dysregulation. This points to a broader dysfunction of immune regulation in both conditions. Notably, CLL might be accompanied by autoimmune phenomena such as autoimmune hemolytic anemia or immune thrombocytopenia, suggesting that elements of autoimmune dysbalance exist even in the context of malignancy. These similarities may reflect common underlying mechanisms of immune exhaustion, dysregulated T-cell responses, or chronic immune stimulation. Furthermore, the aberrant expression of BTLA, TIGIT, and TIM-3 in both diseases highlights potential therapeutic targets for restoring immune balance. It is tempting to speculate that targeting specific immune checkpoints might not only improve anti-tumor immunity in CLL but could also modulate autoimmunity-related manifestations observed in a subset of CLL patients. Future studies exploring the functional consequences of these molecular alterations are warranted to better understand their role in disease progression and therapeutic resistance.
Supplementary Materials
The following supporting information can be downloaded at: www.mdpi.com/xxx/s1, Table S1a Associations of the expression of BTLA, CD160, SPN, TIM3, VISTA, TIGIT with prognostic parameters in CLL., Table S1b. Correlations between expression of BTLA, CD160, SPN, TIM3, VISTA, TIGIT with prognostic parameters in CLL. Table S2a. Associations of the expression of BTLA, CD160, SPN, TIM3, VISTA, TIGIT and clinical parameters in Ps. Table S2b. Correlations between associations of the expression of BTLA, CD160, SPN, TIM3, VISTA, TIGIT and clinical parameters in Ps.
Author Contributions
“Conceptualization, K.G. and J.B.; methodology, K.S., G.S.; software, K.S., G.S.; validation, K.S., G.S. and K.G.; formal analysis, K.S., G.S., K.G,. J.B., A.W.F.,D.K. ; investigation, K.S., G.S.; resources, K.G., J.B.; data curation, K.S., G.S., J.B., A.W.F.; writing—K.S., A.W.F.; writing—review and editing, K.S., A.W.F., K.G., J.B.; visualization, K.S., G.S., A.W.F.; supervision, K.G., J.B.; project administration, G.S., K.S.; funding acquisition, K.G. All authors have read and agreed to the published version of the manuscript.”.
Funding
This research was funded by Medical University of Lublin, grant number DS462.
Institutional Review Board Statement
The study was conducted in accordance with the Declaration of Helsinki, and approved by the Ethics Committee of the Medical University of Lublin (approval number Ke-0254/35/2018).
Informed Consent Statement
Written informed consent was obtained from all subjects involved in the study.
Data Availability Statement
The data support the findings of our study are available on request from the corresponding author.
Conflicts of Interest
The authors declare no conflicts of interest.
References
- Strand, V.; Balsa, A.; Al-Saleh, J.; Barile-Fabris, L.; Horiuchi, T.; Takeuchi, T.; Lula, S.; Hawes, C.; Kola, B.; Marshall, L. Immunogenicity of Biologics in Chronic Inflammatory Diseases: A Systematic Review. BioDrugs 2017, 31, 299–316. [Google Scholar] [CrossRef] [PubMed]
- Forconi, F.; Moss, P. Perturbation of the Normal Immune System in Patients with CLL. Blood 2015, 126, 573–581. [Google Scholar] [CrossRef] [PubMed]
- Hamblin, A.D.; Hamblin, T.J. The Immunodeficiency of Chronic Lymphocytic Leukaemia. Br. Med. Bull. 2008, 87, 49–62. [Google Scholar] [CrossRef]
- Skórka, K.; Kot, M.; Knap, J.; Giannopoulos, K. Deregulation of the Immune System in Patients with Chronic Lymphocytic Leukemia. Postepy Hig. Med. Dosw. 2019, 73, 117–132. [Google Scholar] [CrossRef]
- Rendon, A.; Schäkel, K. Psoriasis Pathogenesis and Treatment. Int. J. Mol. Sci. 2019, 20. [Google Scholar] [CrossRef]
- Cottone, M.; Sapienza, C.; Macaluso, F.S.; Cannizzaro, M. Psoriasis and Inflammatory Bowel Disease. Dig. Dis. 2019, 37, 451–457. [Google Scholar] [CrossRef] [PubMed]
- Strand, V.; Balsa, A.; Al-Saleh, J.; Barile-Fabris, L.; Horiuchi, T.; Takeuchi, T.; Lula, S.; Hawes, C.; Kola, B.; Marshall, L. Immunogenicity of Biologics in Chronic Inflammatory Diseases: A Systematic Review. BioDrugs 2017, 31, 299–316. [Google Scholar] [CrossRef]
- Genetic Analysis of Psoriasis Consortium & the Wellcome Trust Case Control Consortium, 2; Strange, A.; Capon, F.; Spencer, C.C.A.; Knight, J.; Weale, M.E.; Allen, M.H.; Barton, A.; Band, G.; Bellenguez, C.; et al. A Genome-Wide Association Study Identifies New Psoriasis Susceptibility Loci and an Interaction between HLA-C and ERAP1. Nat. Genet. 2010, 42, 985–990. [Google Scholar] [CrossRef]
- Plenge, R. GWASs and the Age of Human as the Model Organism for Autoimmune Genetic Research. Genome Biol. 2010, 11, 212. [Google Scholar] [CrossRef]
- Vaengebjerg, S.; Skov, L.; Egeberg, A.; Loft, N.D. Prevalence, Incidence, and Risk of Cancer in Patients With Psoriasis and Psoriatic Arthritis: A Systematic Review and Meta-Analysis. JAMA dermatology 2020, 156, 421–429. [Google Scholar] [CrossRef]
- Youssef, R.M.; El-Ramly, A.Z.; Hussien, M.F.; Shoukry, N.M.; Amr, K. Expression of B and T Lymphocyte Attenuator, Retinoid-related Orphan Receptor Gamma-isoform-t and Interleukin 7 in Psoriasis Vulgaris. Australas. J. Dermatol. 2019, 60. [Google Scholar] [CrossRef] [PubMed]
- Bourque, J.; Hawiger, D. The BTLA–HVEM–CD5 Immunoregulatory Axis–An Instructive Mechanism Governing PTreg Cell Differentiation. Front. Immunol. 2019, 10. [Google Scholar] [CrossRef]
- Vendel, A.C.; Calemine-Fenaux, J.; Izrael-Tomasevic, A.; Chauhan, V.; Arnott, D.; Eaton, D.L. B and T Lymphocyte Attenuator Regulates B Cell Receptor Signaling by Targeting Syk and BLNK. J. Immunol. 2009, 182, 1509–1517. [Google Scholar] [CrossRef]
- Ware, C.F. Targeting Lymphocyte Activation through the Lymphotoxin and LIGHT Pathways. Immunol. Rev. 2008, 223, 186–201. [Google Scholar] [CrossRef] [PubMed]
- Karabon, L.; Andrzejczak, A.; Ciszak, L.; Tomkiewicz, A.; Szteblich, A.; Bojarska-Junak, A.; Roliński, J.; Wołowiec, D.; Wróbel, T.; Kosmaczewska, A. BTLA Expression in CLL: Epigenetic Regulation and Impact on CLL B Cell Proliferation and Ability to IL-4 Production. Cells 2021, 10, 3009. [Google Scholar] [CrossRef]
- Pasero, C.; Olive, D. Interfering with Coinhibitory Molecules: BTLA/HVEM as New Targets to Enhance Anti-Tumor Immunity. Immunol. Lett. 2013, 151, 71–75. [Google Scholar] [CrossRef] [PubMed]
- Abecassis, S.; Giustiniani, J.; Meyer, N.; Schiavon, V.; Ortonne, N.; Campillo, J.A.; Bagot, M.; Bensussan, A. Identification of a Novel CD160+CD4+ T-Lymphocyte Subset in the Skin: A Possible Role for CD160 in Skin Inflammation. J. Invest. Dermatol. 2007, 127, 1161–1166. [Google Scholar] [CrossRef]
- Farren, T.W.; Giustiniani, J.; Liu, F.-T.; Tsitsikas, D.A.; Macey, M.G.; Cavenagh, J.D.; Oakervee, H.E.; Taussig, D.; Newland, A.C.; Calaminici, M.; et al. Differential and Tumor-Specific Expression of CD160 in B-Cell Malignancies. Blood 2011, 118, 2174–2183. [Google Scholar] [CrossRef]
- Pallant, A.; Eskenazi, A.; Mattei, M.G.; Fournier, R.E.; Carlsson, S.R.; Fukuda, M.; Frelinger, J.G. Characterization of CDNAs Encoding Human Leukosialin and Localization of the Leukosialin Gene to Chromosome 16. Proc. Natl. Acad. Sci. 1989, 86, 1328–1332. [Google Scholar] [CrossRef]
- Shelley, C.S.; Remold-O’Donnell, E.; Davis, A.E.; Bruns, G.A.; Rosen, F.S.; Carroll, M.C.; Whitehead, A.S. Molecular Characterization of Sialophorin (CD43), the Lymphocyte Surface Sialoglycoprotein Defective in Wiskott-Aldrich Syndrome. Proc. Natl. Acad. Sci. 1989, 86, 2819–2823. [Google Scholar] [CrossRef]
- Hobbs, S.J.; Nolz, J.C. Regulation of T Cell Trafficking by Enzymatic Synthesis of O-Glycans. Front. Immunol. 2017, 8. [Google Scholar] [CrossRef] [PubMed]
- Ali, A.J.; Abuelela, A.F.; Merzaban, J.S. An Analysis of Trafficking Receptors Shows That CD44 and P-Selectin Glycoprotein Ligand-1 Collectively Control the Migration of Activated Human T-Cells. Front. Immunol. 2017, 8. [Google Scholar] [CrossRef] [PubMed]
- Falay, M.; Afacan Öztürk, B.; Güneş, K.; Kalpakçı, Y.; Dağdaş, S.; Ceran, F.; Özet, G. The Role of CD200 and CD43 Expression in Differential Diagnosis between Chronic Lymphocytic Leukemia and Mantle Cell Lymphoma. Turkish J. Hematol. 2018, 35, 94–98. [Google Scholar] [CrossRef]
- Sorigue, M.; Juncà, J.; Sarrate, E.; Grau, J. Expression of CD43 in Chronic Lymphoproliferative Leukemias. Cytom. Part B Clin. Cytom. 2018, 94, 136–142. [Google Scholar] [CrossRef] [PubMed]
- Jung, G.; Eisenmann, J.; Thiébault, S.; Hénon, P. Cell Surface CD43 Determination Improves Diagnostic Precision in Late B-cell Diseases. Br. J. Haematol. 2003, 120, 496–499. [Google Scholar] [CrossRef]
- Hadadi, L.; Hafezi, M.; Amirzargar, A.A.; Sharifian, R.A.; Abediankenari, S.; Asgarian-Omran, H. Dysregulated Expression of Tim-3 and NKp30 Receptors on NK Cells of Patients with Chronic Lymphocytic Leukemia. Oncol. Res. Treat. 2019, 42, 197–203. [Google Scholar] [CrossRef]
- Anderson, A.C.; Joller, N.; Kuchroo, V.K. Lag-3, Tim-3, and TIGIT: Co-Inhibitory Receptors with Specialized Functions in Immune Regulation. Immunity 2016, 44, 989–1004. [Google Scholar] [CrossRef] [PubMed]
- Brusa, D.; Serra, S.; Coscia, M.; Rossi, D.; D’Arena, G.; Laurenti, L.; Jaksic, O.; Fedele, G.; Inghirami, G.; Gaidano, G.; et al. The PD-1/PD-L1 Axis Contributes to T-Cell Dysfunction in Chronic Lymphocytic Leukemia. Haematologica 2013, 98, 953–963. [Google Scholar] [CrossRef]
- Gamaleldin, M.A.; Ghallab, O.M.; Nadwan, E.A.; Abo Elwafa, R.A. PD-1 and PD-L1 Gene Expressions and Their Association with Epstein-Barr Virus Infection in Chronic Lymphocytic Leukemia. Clin. Transl. Oncol. 2021, 23, 2309–2322. [Google Scholar] [CrossRef]
- Grzywnowicz, M.; Karczmarczyk, A.; Skorka, K.; Zajac, M.; Zaleska, J.; Chocholska, S.; Tomczak, W.; Giannopoulos, K. Expression of Programmed Death 1 Ligand in Different Compartments of Chronic Lymphocytic Leukemia. Acta Haematol. 2015, 134, 255–262. [Google Scholar] [CrossRef]
- Taghiloo, S.; Allahmoradi, E.; Ebadi, R.; Tehrani, M.; Hosseini-Khah, Z.; Janbabaei, G.; Shekarriz, R.; Asgarian-Omran, H. Upregulation of Galectin-9 and PD-L1 Immune Checkpoints Molecules in Patients with Chronic Lymphocytic Leukemia. Asian Pac. J. Cancer Prev. 2017, 18, 2269–2274. [Google Scholar] [CrossRef] [PubMed]
- Rezaei, M.; Tan, J.; Zeng, C.; Li, Y.; Ganjalikhani-Hakemi, M. TIM-3 in Leukemia; Immune Response and Beyond. Front. Oncol. 2021, 11, 753677. [Google Scholar] [CrossRef] [PubMed]
- Li, N.; Xu, W.; Yuan, Y.; Ayithan, N.; Imai, Y.; Wu, X.; Miller, H.; Olson, M.; Feng, Y.; Huang, Y.H.; et al. Immune-Checkpoint Protein VISTA Critically Regulates the IL-23/IL-17 Inflammatory Axis. Sci. Rep. 2017, 7, 1485. [Google Scholar] [CrossRef] [PubMed]
- Bartosińska, J.; Zakrzewska, E.; Król, A.; Raczkiewicz, D.; Purkot, J.; Majdan, M.; Krasowska, D.; Chodorowska, G.; Giannopoulos, K. Differential Expression of Programmed Death 1 (PD-1) on CD4+ and CD8+ T Cells in Rheumatoid Arthritis and Psoriatic Arthritis. Polish Arch. Intern. Med. 2017. [Google Scholar] [CrossRef]
- Wang, L.; Jia, B.; Claxton, D.F.; Ehmann, W.C.; Rybka, W.B.; Mineishi, S.; Naik, S.; Khawaja, M.R.; Sivik, J.; Han, J.; et al. VISTA Is Highly Expressed on MDSCs and Mediates an Inhibition of T Cell Response in Patients with AML. Oncoimmunology 2018, 7, e1469594. [Google Scholar] [CrossRef]
- Arruga, F.; Gyau, B.B.; Iannello, A.; Vitale, N.; Vaisitti, T.; Deaglio, S. Immune Response Dysfunction in Chronic Lymphocytic Leukemia: Dissecting Molecular Mechanisms and Microenvironmental Conditions. Int. J. Mol. Sci. 2020, 21, 1825. [Google Scholar] [CrossRef]
Figure 1.
The aberrant expression of BTLA, CD160, SPN, TIM3, VISTA, TIGIT in CLL and psoriatic patients compared to HVs. (a) Higher expression of BTLA in in CLL patients as well as Ps patients than HVs (1500 vs. 5.372, p<0.0001), (18.22 vs. 5.372, p<0.0001). Higher expression of BTLA in CLL patients than psoriatic patients (1500 vs. 18.22, p<0.0001) (b) Higher expression of CD160 in CLL patients than HVs (86.94 vs. 11.96, p<0.0001). Higher expression of CD160 in psoriatic patients than HVs (48.92 vs. 11.96, p<0.0001). Higher expression of CD160 in CLL than Ps patients (86.94 vs. 48.92, p=0.0243) (c) Higher expression of SPN in CLL patients than HVs (1706 vs. 82.24, p<0.0001), Higher expression of SPN in psoriatic patients than HVs (451.8 vs. 82.24, p<0.0001). Higher expression of SPN expression in CLL patients than Ps patients (1706 vs. 451.8, p<0.0001). (d) Lower expression of TIM-3 in Ps patients than HVs (0.02485 vs. 183.1, p<0.0001). Higher expression of TIM-3 in CLL than Ps patients (226.9 vs. 0.02485, p<0.0001). No difference in TIM-3 expression in CLL patients than HVs (226.9 vs. 183.1, p=0.7251). (e) Higher expression of VISTA in Ps patients than HVs (196.7 vs. 34.93, p<0.0001). Higher expression of VISTA in Ps patients compared to CLL patients (196.7 vs. 27.50, p<0.0001). No difference in VISTA expression in CLL patients than HVs (27.50 vs. 34.93, p=0.1854). (f) Higher expression of TIGIT in CLL patients than Ps patients (409.6 vs. 109.9, p<0.0001) Higher expression of TIGIT in CLL patients than HVs (409.6 vs. 19.41, p<0.0001). Higher expression of TIGIT in Ps patients than HVs (109.9 vs. 19.41, p<0.0001).
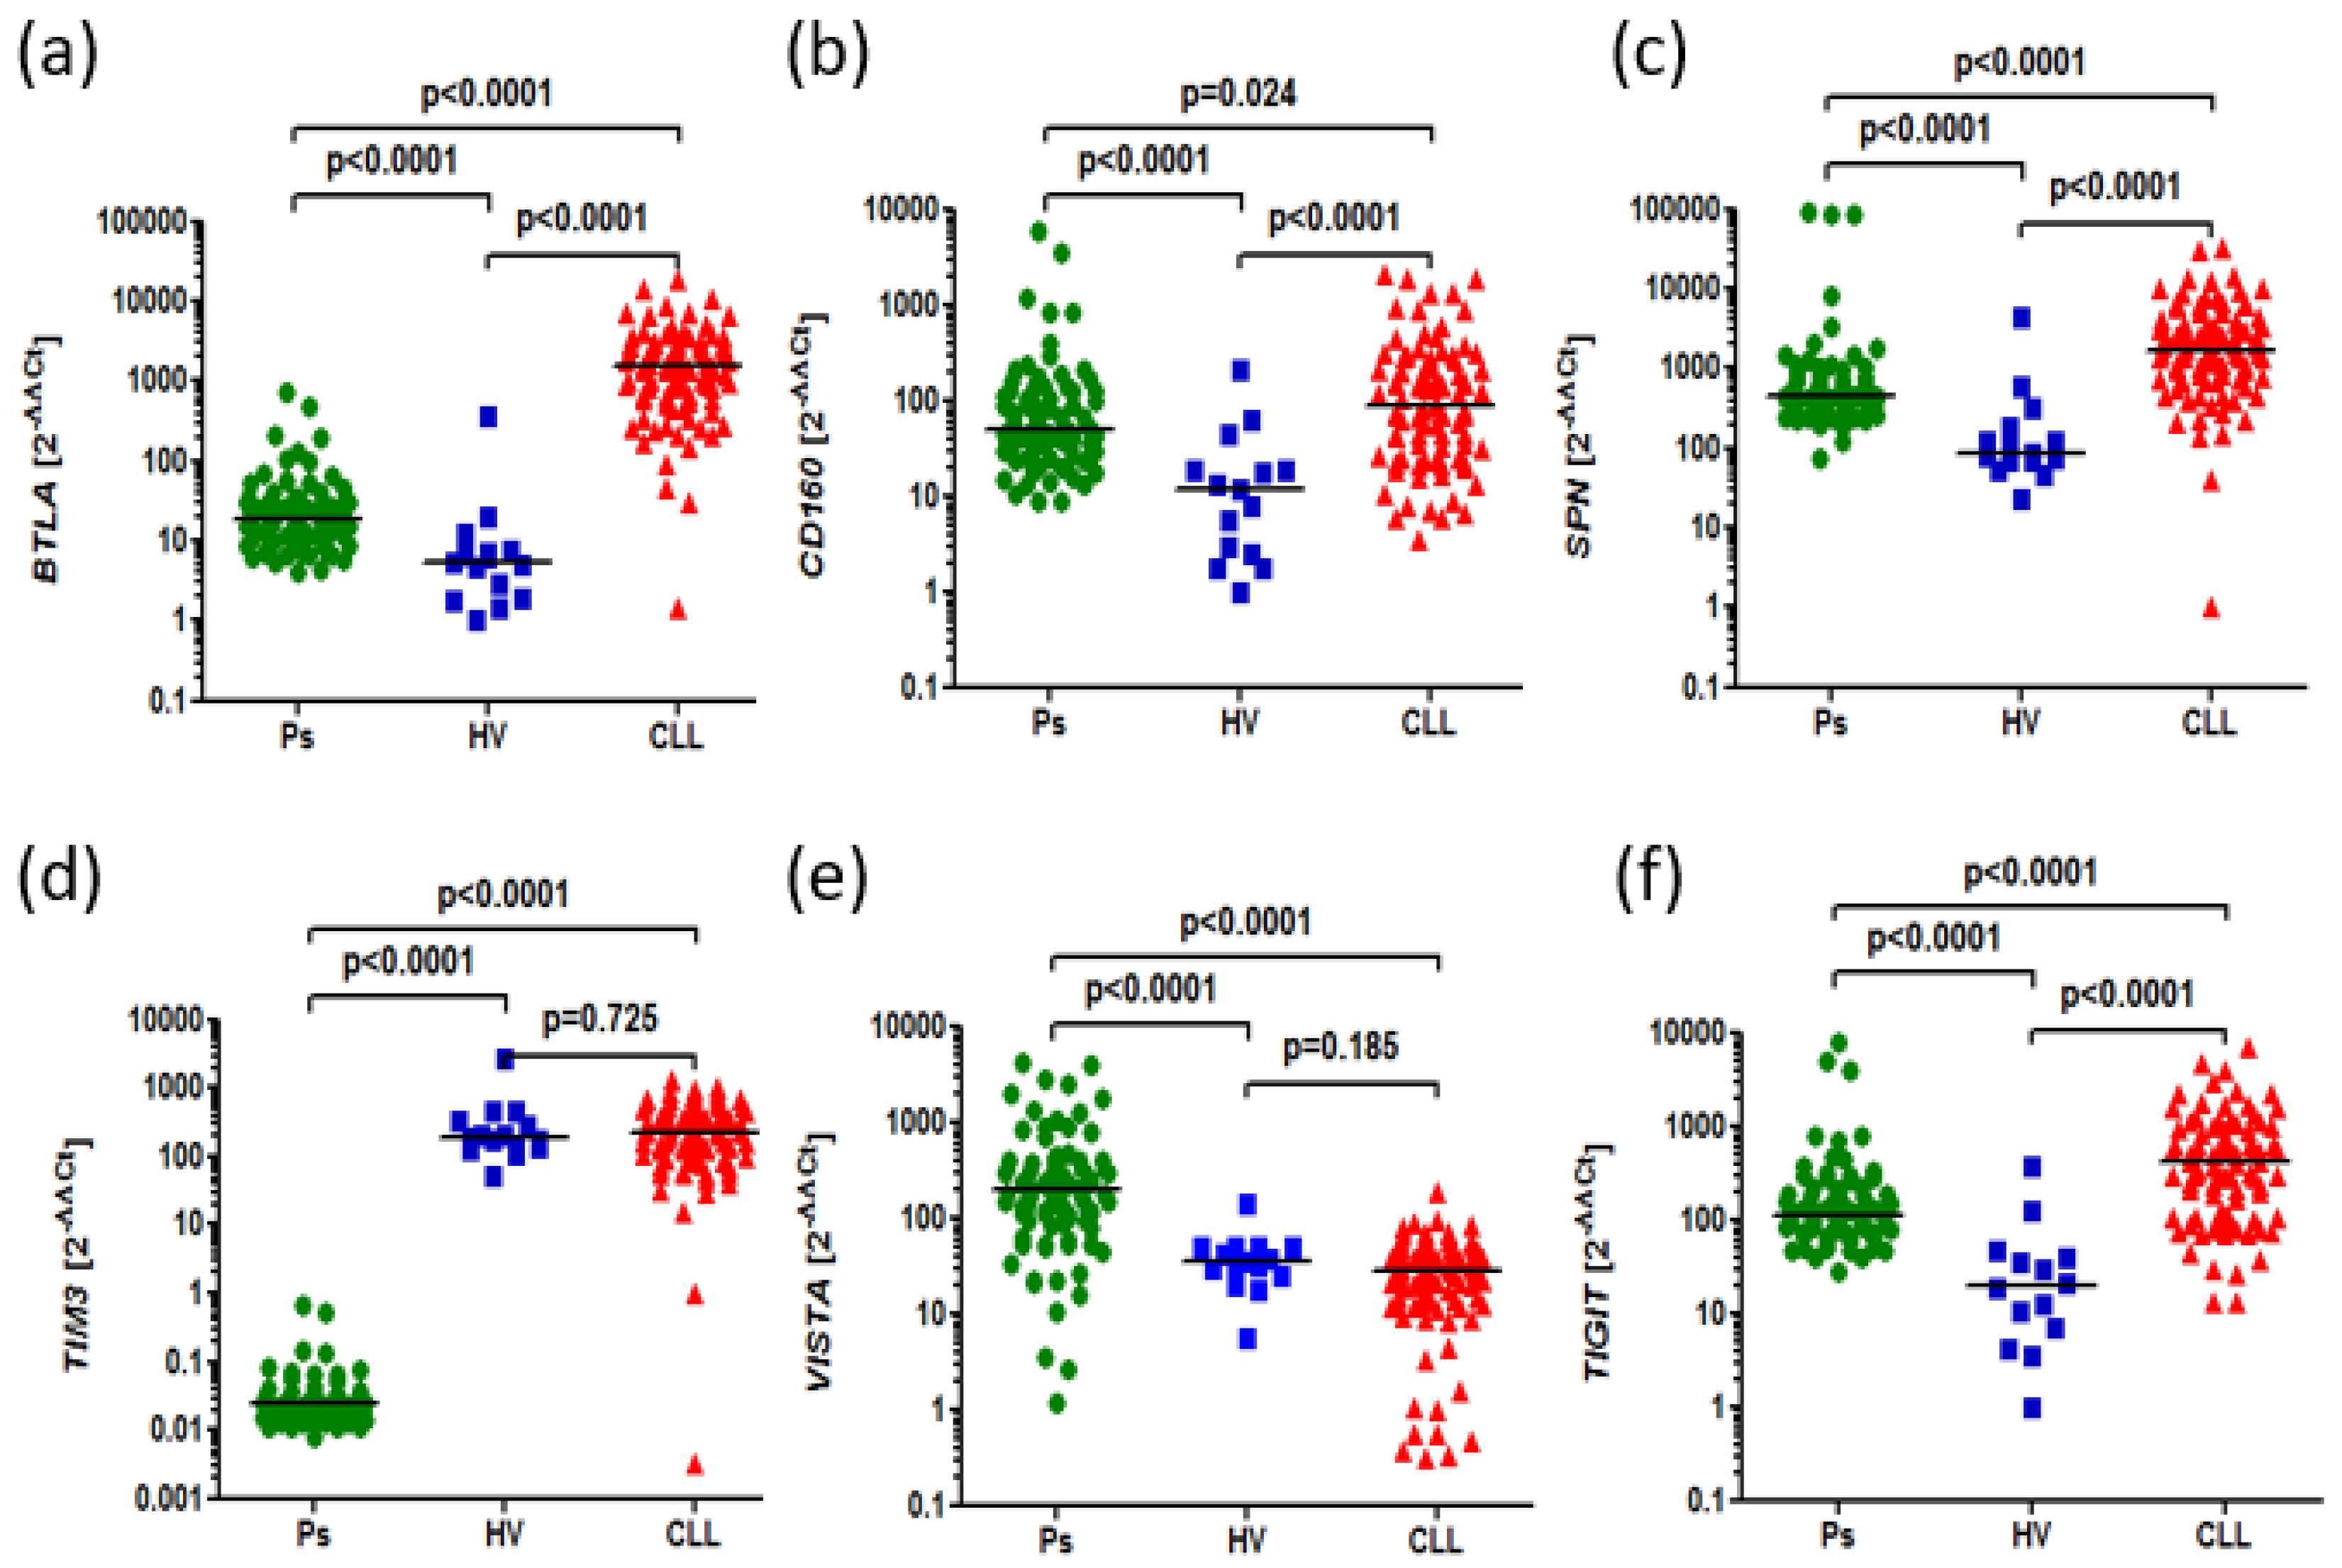
Figure 2.
Positive correlations between expression of BTLA, CD160, SPN, TIM3, VISTA, TIGIT in CLL. The results are presented as the log10 value of 2^-∆∆Ct with the regression line marked. (a) Strong correlation between the expressions of SPN and CD160 (r=0.7822, p<0.0001). (b) Strong correlation between the expressions of SPN and BTLA (r=0.7960, p<0.0001). (c) Moderate correlation between the expressions of SPN and TIGIT (r=0.6800, p<0.0001). (d) Moderate correlation between the expressions of CD160 and TIM3 (r=0.6212, p<0.0001). (e) Moderate correlation between the expressions of BTLA and TIGIT (r=0.6774, p<0.0001). (f) Moderate correlation between the expressions of TIM3 and VISTA (r=0.6331, p<0.0001).
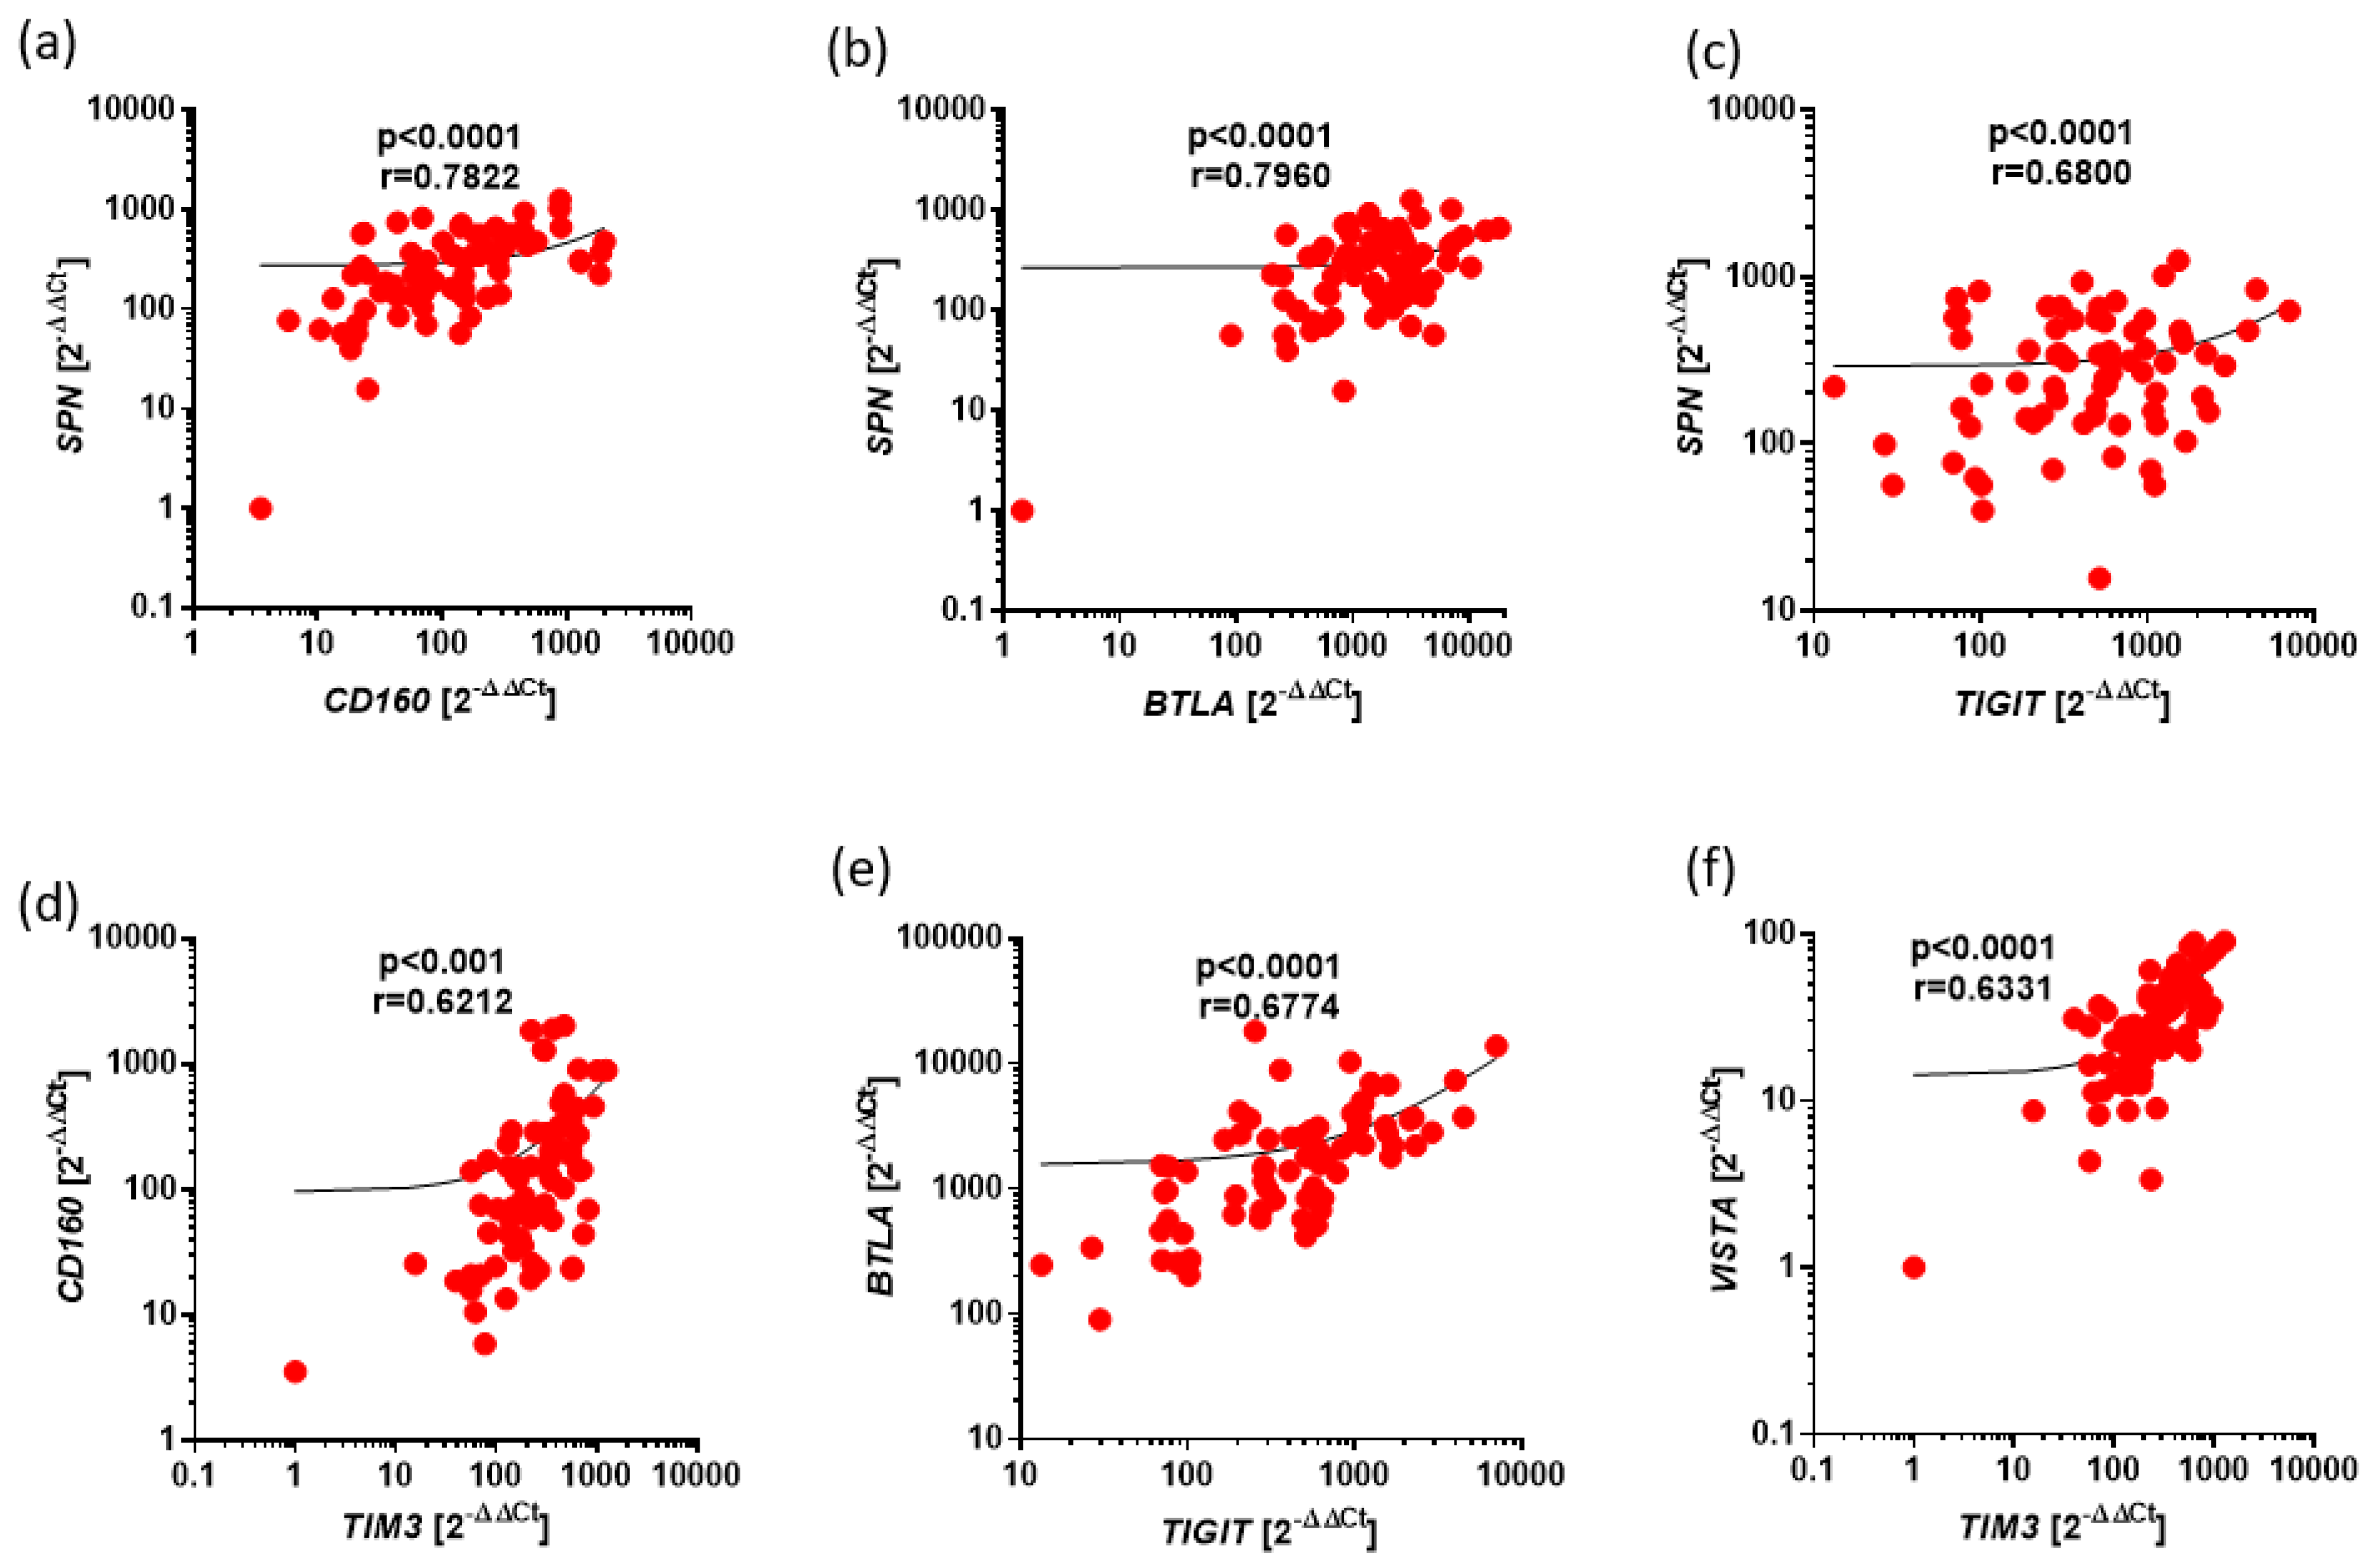
Figure 3.
Positive correlations between expression of BTLA, CD160, SPN, TIM3, VISTA, TIGIT in Ps. The results are presented as the log10 value of 2^-∆∆Ct with the regression line marked. (a) Strong correlation between the expressions of SPN and TIGIT (r=0.8246, p<0.0001). (b) Moderate correlation between the expressions of SPN and TIM3 (r=0.6572, p<0.0001). (c) Strong correlation between the expressions of SPN and BTLA (r=0.7016, p<0.0001). (d) Strong correlation between the expressions of SPN and CD160 (r=0.7183, p<0.0001). (e) Moderate correlation between the expressions of CD160 and TIM3 (r=0.6263, p<0.0001). (f) Strong correlation between the expressions of CD160 and TIGIT (r=0.7576, p<0.0001).
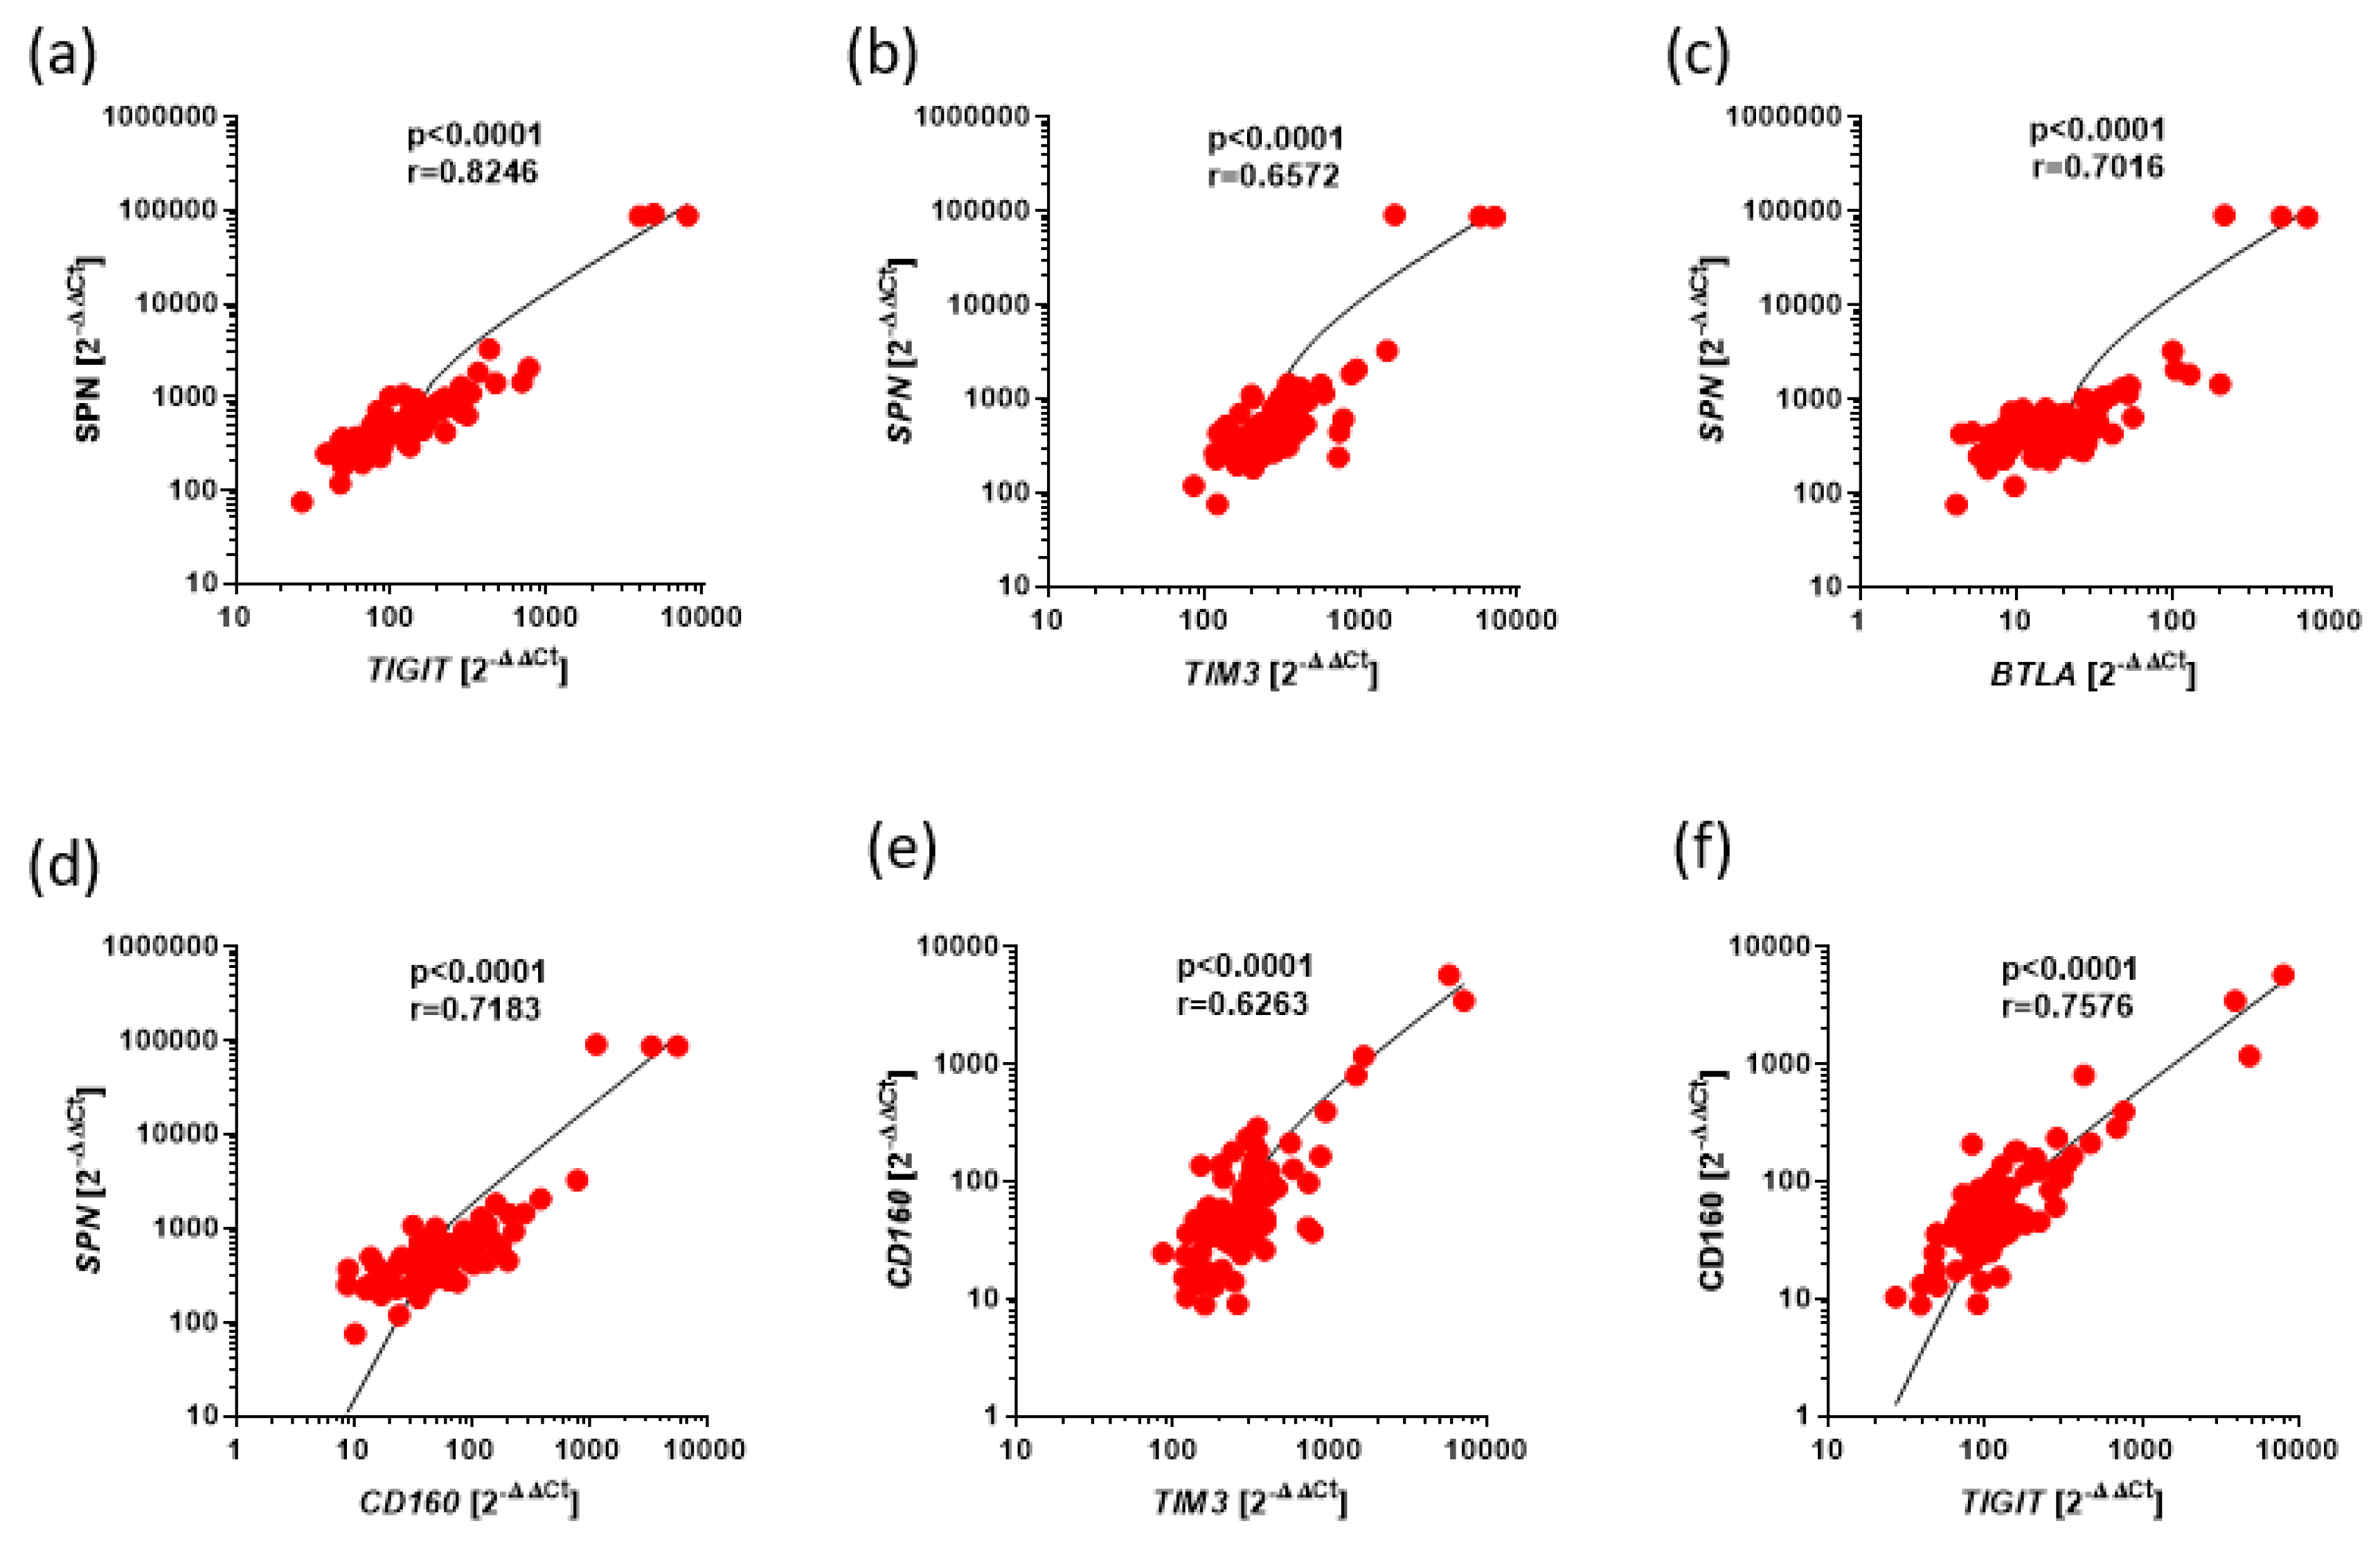
Figure 4.
Associations of the expression of SPN, TIM3, and TIGIT with prognostic parameters in CLL. (a) Tendency to higher SPN expression in CD38+ group compared to CD38- (3864 vs. 1806, p=0.0602). (b) Higher expression of TIM3 in the CLL group with 0 Rai stage compared to 3 and 4 stage (328.1 vs. 130.2, p=0.0186). Tendency to higher expression of TIM3 was observed in CLL groups with 1 and 2 stage compared to 3 and 4 stage (278.8 vs. 130.2, p=0.0999). (c) Tendency to lower TIGIT in MYD88mut group than MYD88wt group (514.2 vs. 98.18) (d) Higher expression of TIGIT in CLL groups with 1 and 2 stage compared to 0 stage according to Rai classification (806.3 vs. 500.6, p=0.0263) as well as in CLL groups in 1,2,3,4 stage compared to 0 stage (647.4 vs. 500.6, p=0.0300).
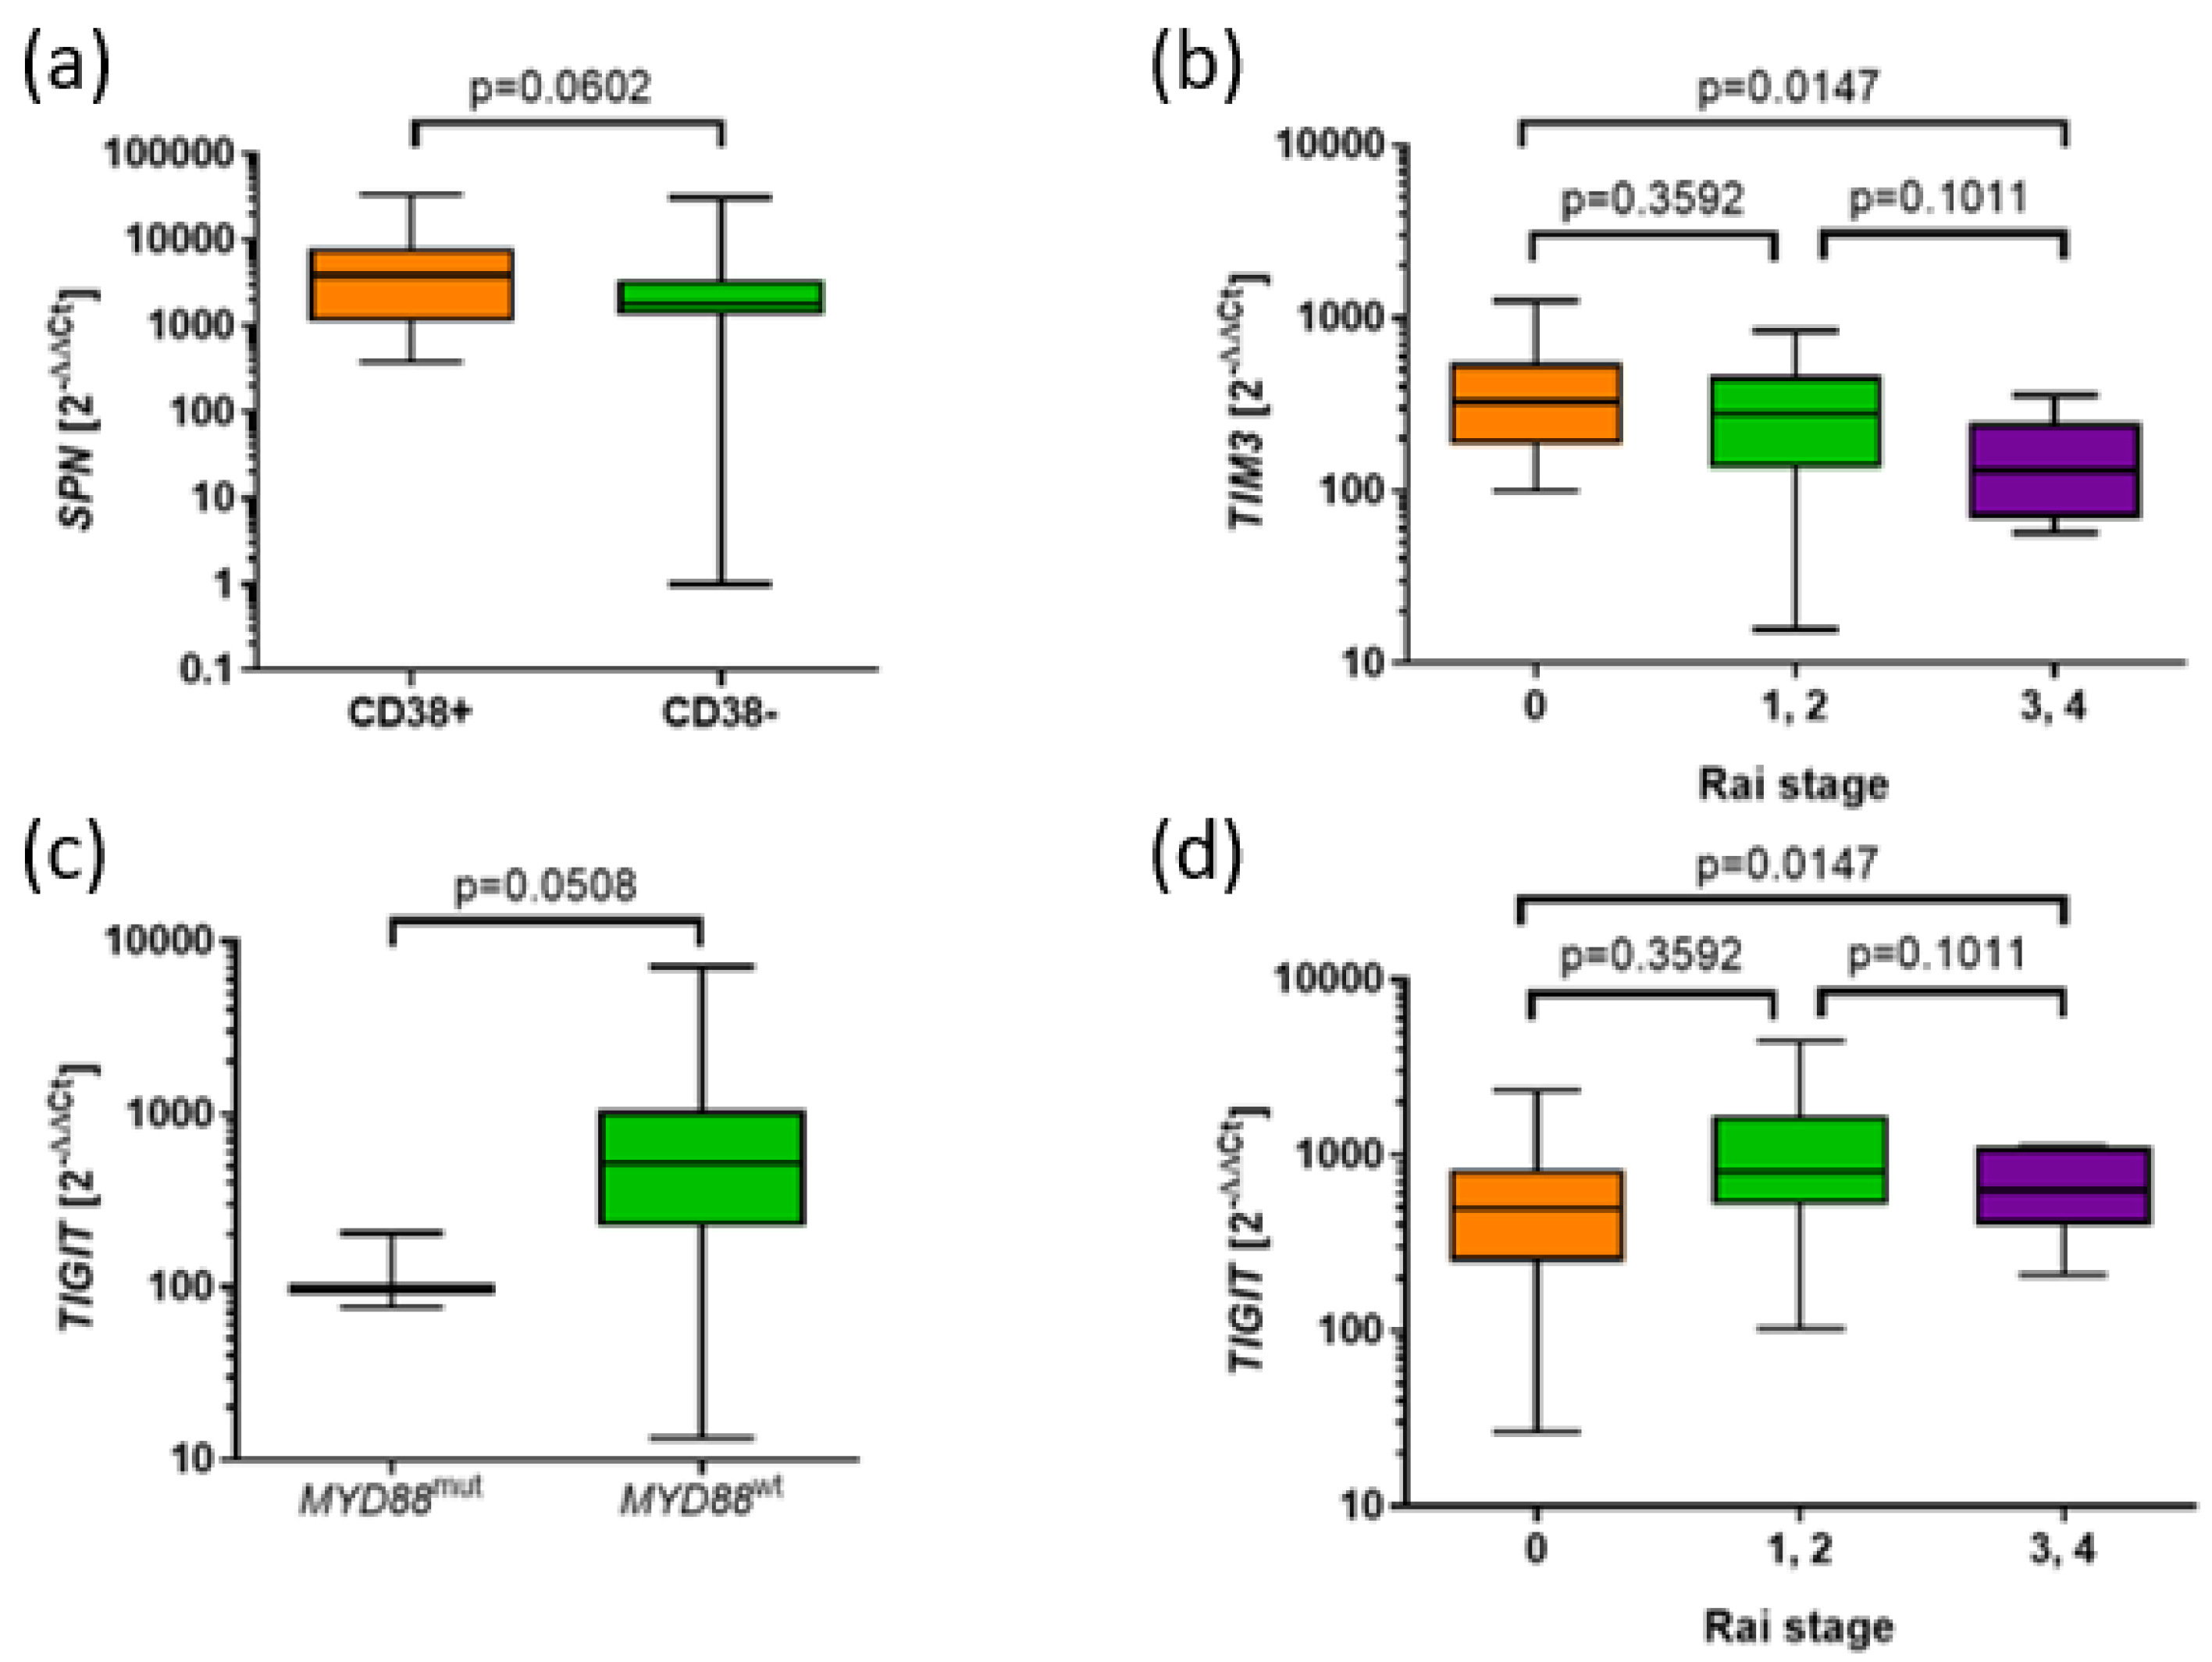
Figure 5.
Negative Correlations between expression of VISTA and BTLA and prognostic factors in CLL. The results are presented as the log10 value of 2^-∆∆Ct with the regression line marked. (a) Low, correlation between VISTA expression and β2microglobulin level (r=-0.2953, p=0.0232) (b) Low correlation between BTLA expression and level of LDH (r=-0.2939, p=0.0622).
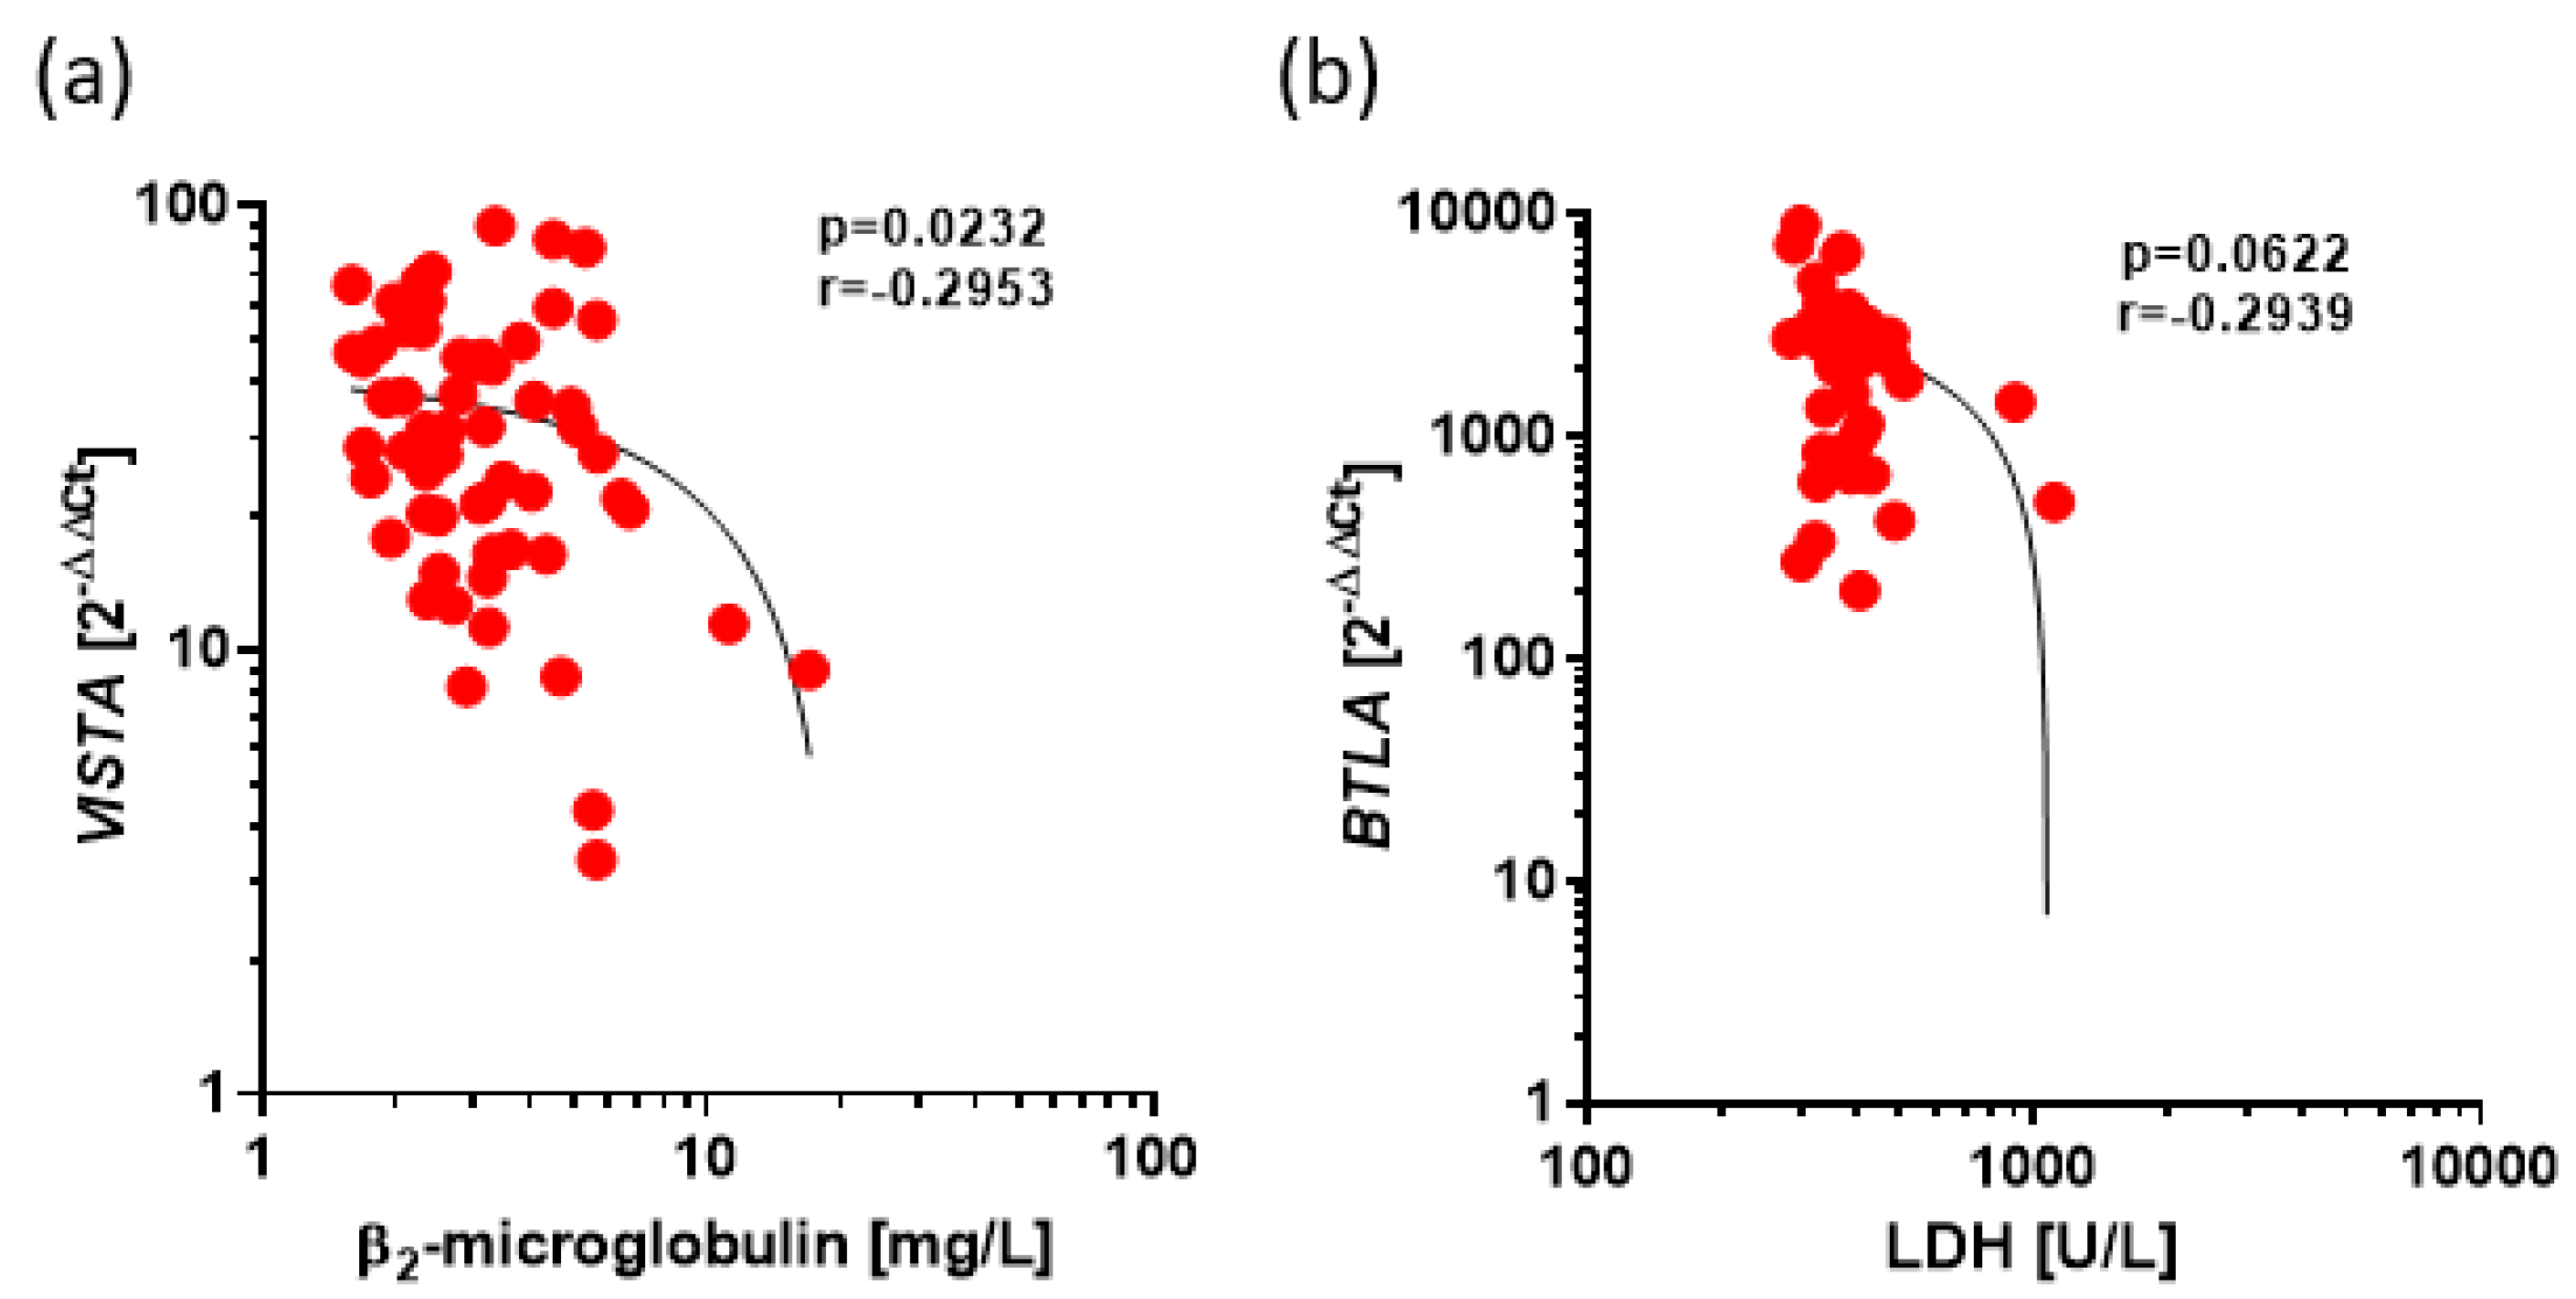
Figure 6.
Negative correlations between expression of BTLA, CD160, SPN, VISTA, TIM3, TIGIT and clinical parameters in Ps. The results are presented as the log10 value of 2^-∆∆Ct with the regression line marked. (a) Low correlation between TIM3 expression with OB level (r=-0.2571, p=0.0175). (b) Low correlation between TIM3 expression with leukocytes level (r=-0.2194, p=0.0437). (c) Low correlation between BTLA expression with OB level (r=-0.2328, p=0.0320). (d) Low correlation between BTLA expression with lymphocytes level (r=-0.1809, p=0.0976). (e) Low correlation between BTLA expression with age level (r=-0.2098, p=0.0540). (f) Low correlation between VISTA expression with OB level (r=-0.1798, p=0.0996). (g) Low correlation between SPN expression with OB level (r=-0.2281, p=0.0357).
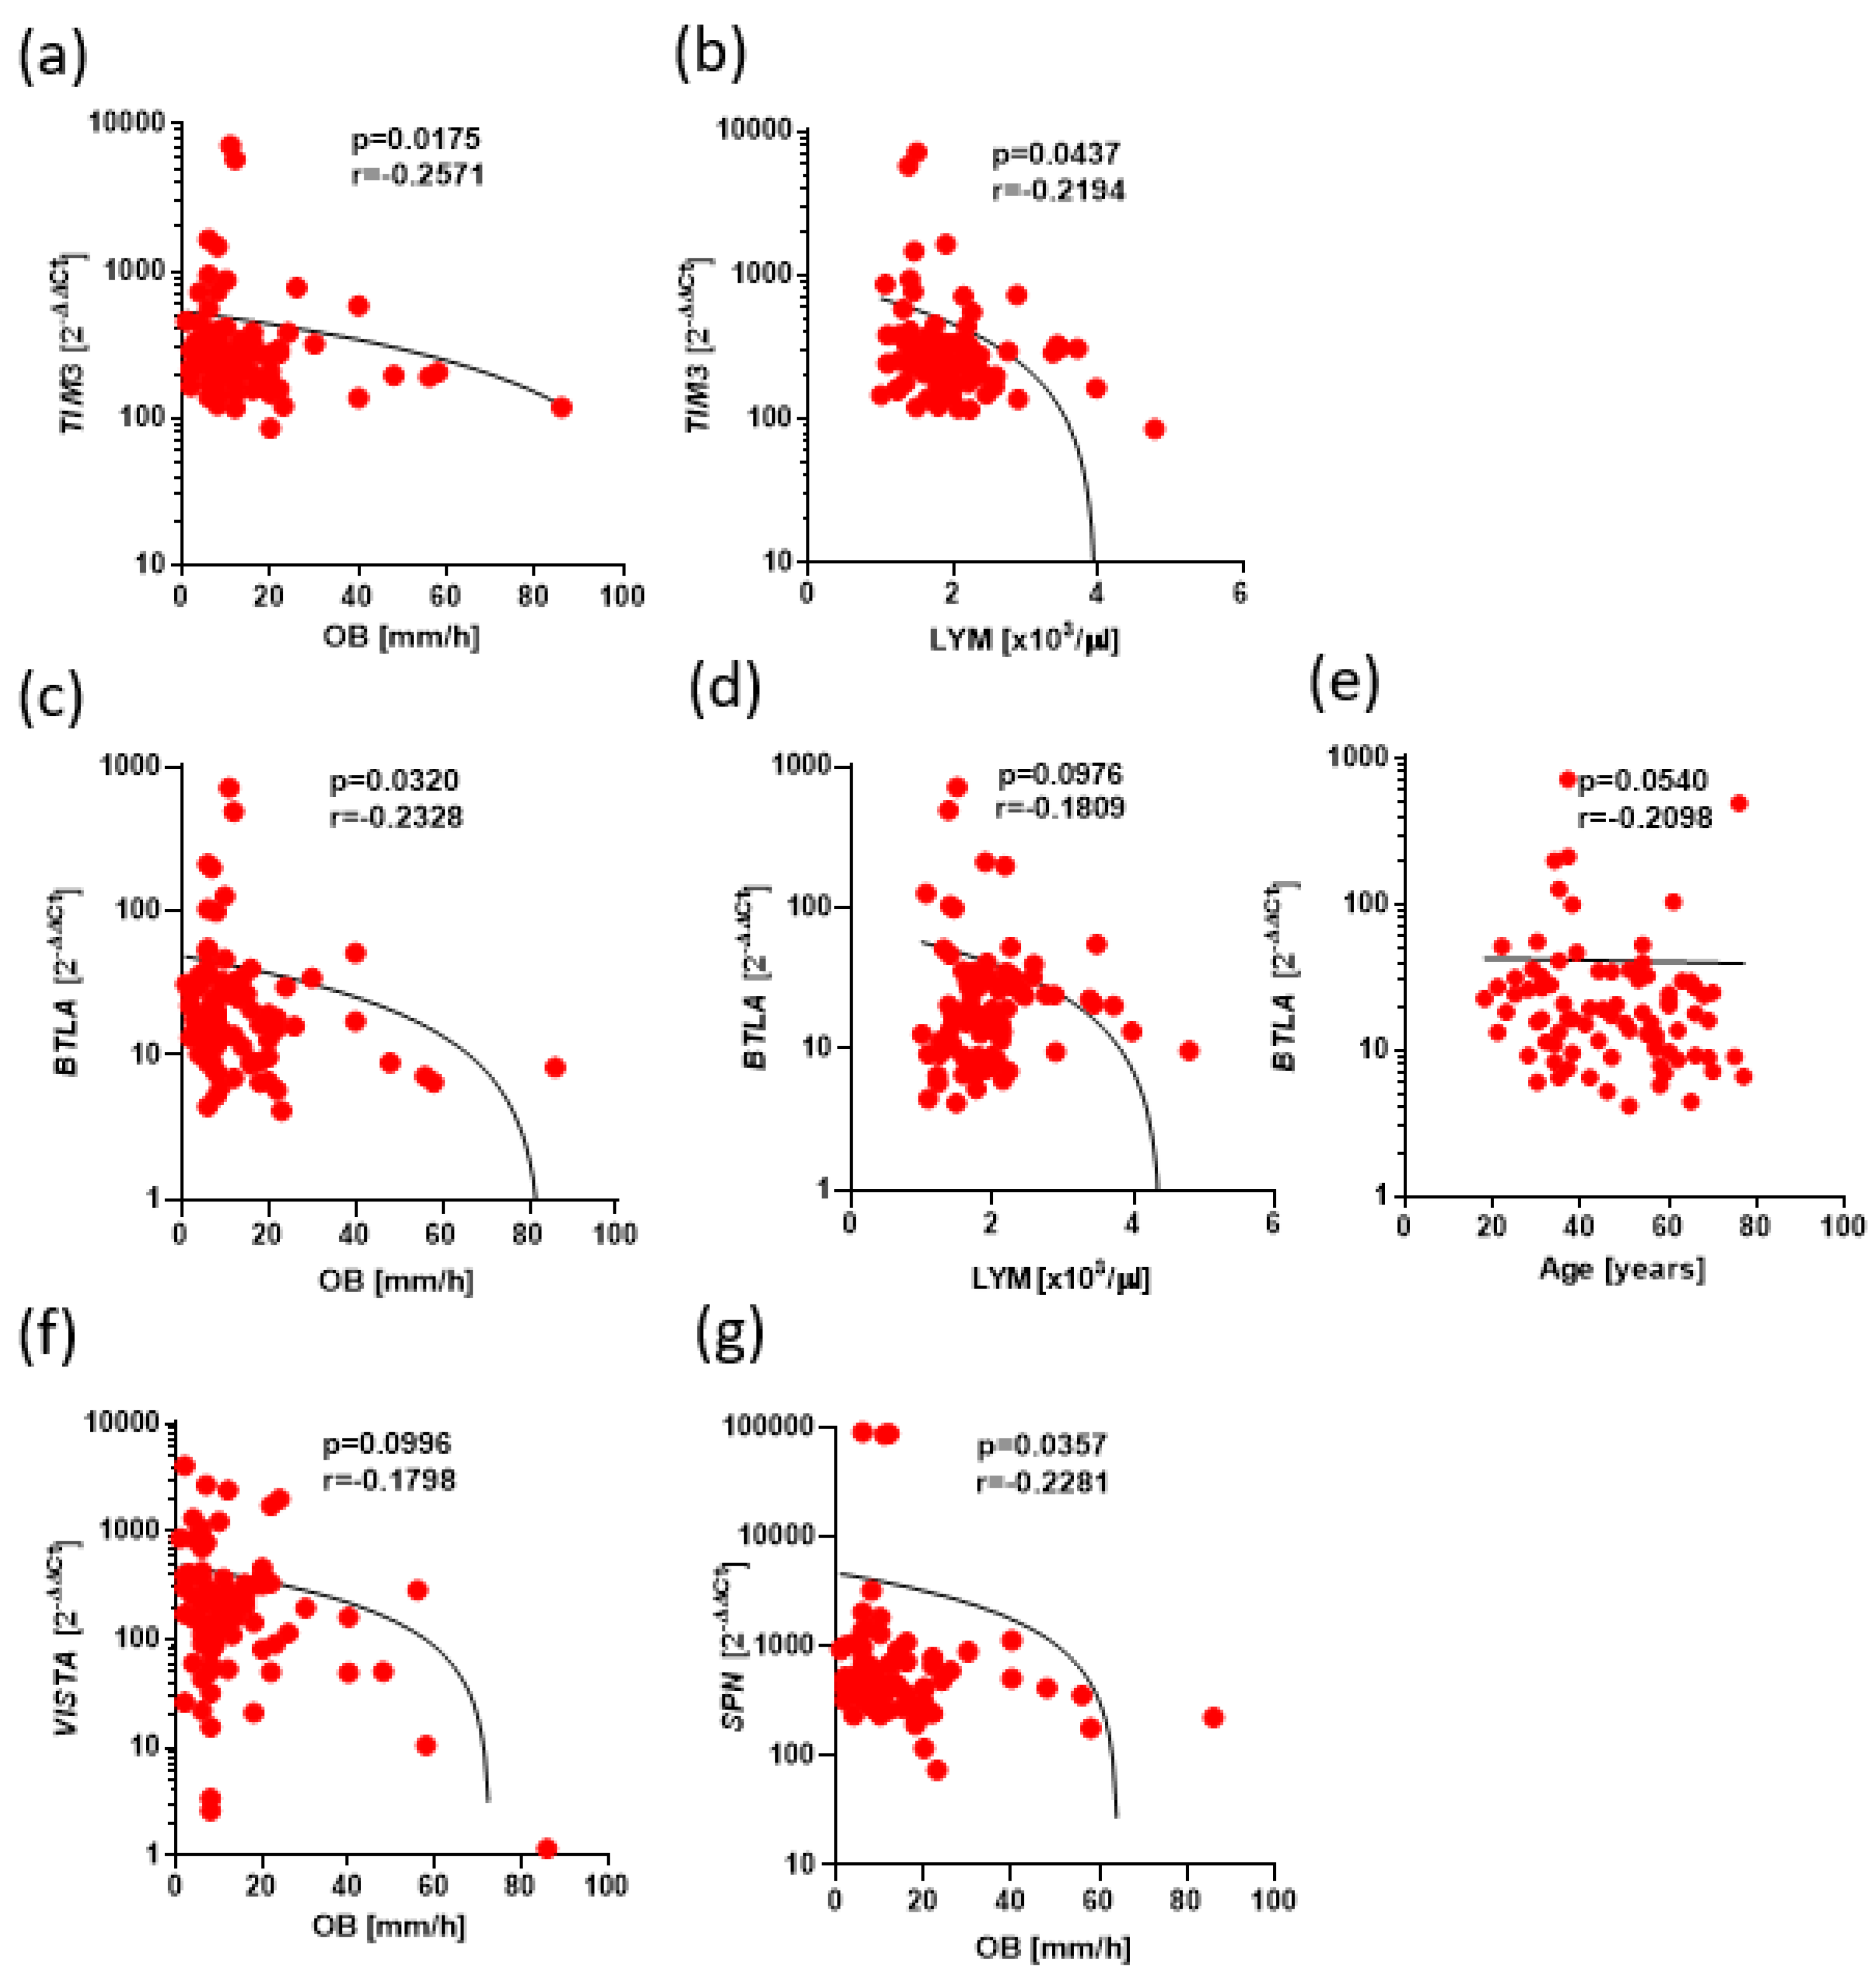
Figure 7.
The aberrant expressions of BTLA, CD160, SPN, TIM3, VISTA, TIGIT and clinical parameters in Ps. . The results are presented as the log10 value of 2^-∆∆Ct with the regression line marked. (a) Higher expression of TIM3 in the group without psoriatic arthritis compared to the group with psoriatic arthritis (276.1 vs. 209.1, p=0.0652). (b) Higher expression of BTLA in type I Ps group compared to type II Ps group (24.19 vs. 15.70 p=0,0365). (c) Lower expression of VISTA in mild clinical course than with severe clinical course (143.1 vs. 239.3, p=0.0511).
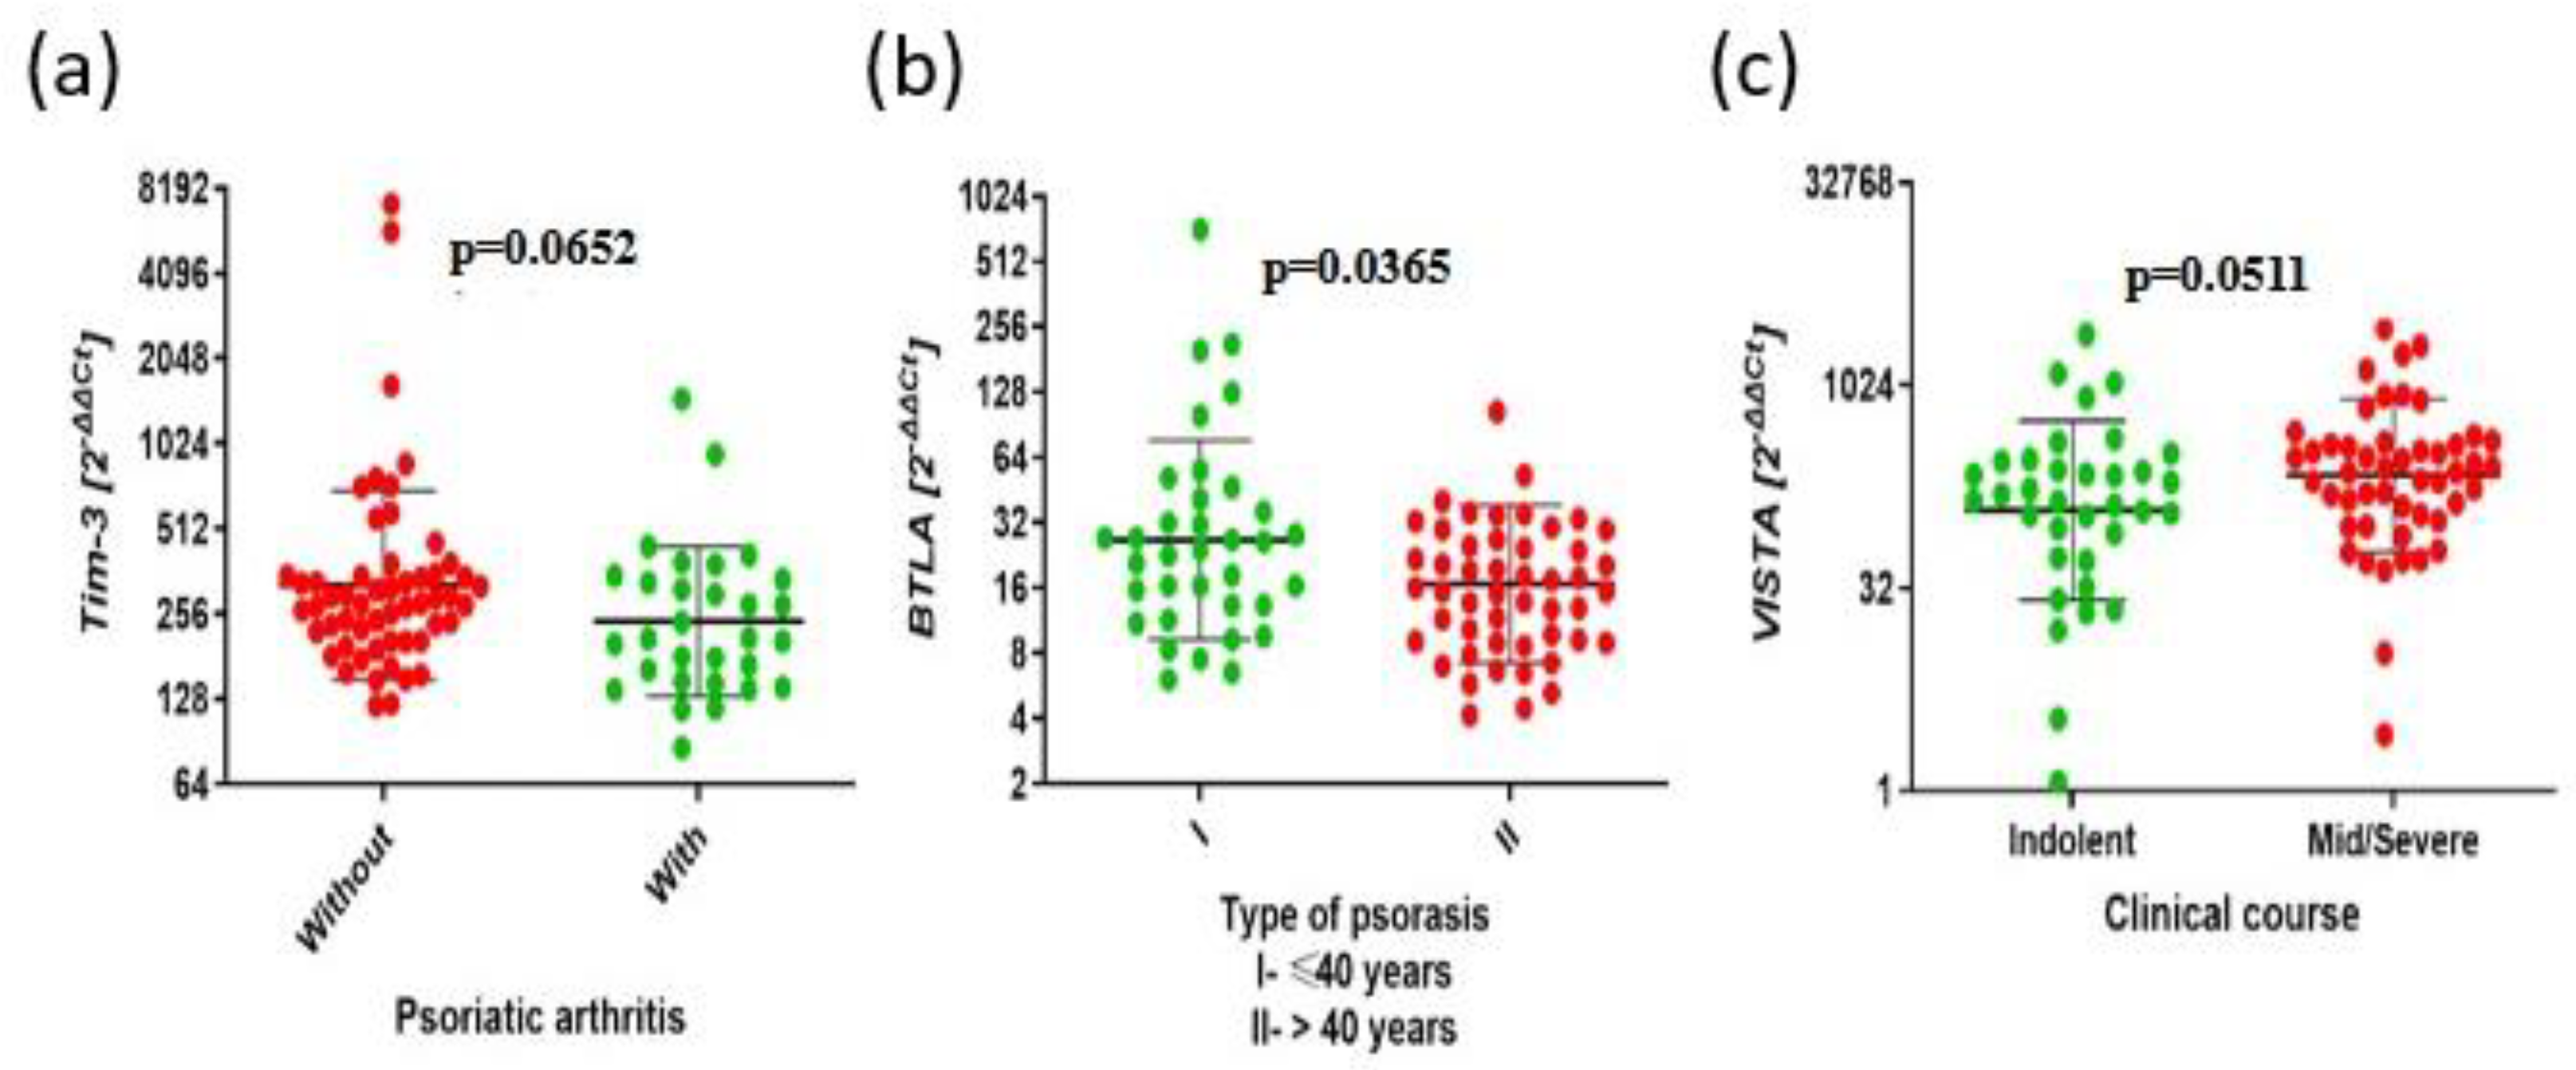

Table 1.
Clinical characteristics of CLL patients.
| Characteristic | CLL (n =74) |
| Sex | |
| Male | 46 |
| Female, n | 28 |
| Age (years) | |
| Median | 66 |
| Range | 48-84 |
| Rai Stage | |
| 0, n | 16 |
| I-II | 24 |
| III-IV | 5 |
| ZAP-70 (cut off 20%) | |
| Positive | 24 |
| Negative | 34 |
| NA | 16 |
| CD38 (cut off 30%) | |
| Positive | 22 |
| Negative | 38 |
| NA | 14 |
| IGHV | |
| Mutated | 32 |
| Unmutated | 39 |
| NA | 3 |
Shortcuts: IGHV- immunoglobulin heavy-chain variable-region, ZAP-70-zeta chain of T-cell receptor associated protein kinase 70.
Table 2.
Clinical characteristics of Ps patients.
| Characteristic | Ps (n=85) |
| Sex | |
| Male | 71 |
| Female | 14 |
| Age (years) | |
| Median | 47 |
| Range | 18-77 |
| Type | |
| I age≤40 | 35 |
| II age>40 | 50 |
| Articular Ps | |
| With | 30 |
| Without | 55 |
| Duration | |
| Median | 16 |
| Range | 55 |
| PASI | |
| Median | 12,1 |
| Range | 49,4 |
| Course | |
| Mild | 35 |
| Severe | 50 |
| WBC | |
| Median | 6,53 |
| Range | 3,54-13,42 |
| Neutrophils | |
| Median | 3,61 |
| Range | 1,4-10,96 |
| Lymphocytes | |
| Median | 1,83 |
| Range | 1-4,79 |
| CRP | |
| Median | 1,6 |
| Range | 0,8-57,3 |
| OB | |
| Median | 9 |
| Range | 1-86 |
Shortcuts: PASI - psoriasis area severity index, CRP - human C-reactive protein, WBC- white blood cells.
Table 3.
Correlations between genes expression in CLL.
| Pairs of genes | r | Statistical significance (p) |
| TIGIT and TIM3 | 0.2522 | 0.068 |
| TIM3 and BTLA | 0.4003 | <0.001 |
| CD160 and VISTA | 0.3861 | <0.001 |
| CD160 and BTLA | 0.5504 | <0.0001 |
| CD160 and SPN | 0.5821 | <0.0001 |
Table 4.
Correlations between genes expression in Ps.
| Pairs of genes | r | Statistical significance (p) |
| TIGIT and TIM3 | 0.5951 | <0.0001 |
| TIM3 and BTLA | 0.5312 | <0.0001 |
| TIGIT and BTLA | 0.6012 | <0.0001 |
| BTLA and CD160 | 0.4773 | <0.0001 |
Disclaimer/Publisher’s Note: The statements, opinions and data contained in all publications are solely those of the individual author(s) and contributor(s) and not of MDPI and/or the editor(s). MDPI and/or the editor(s) disclaim responsibility for any injury to people or property resulting from any ideas, methods, instructions or products referred to in the content. |
© 2025 by the authors. Licensee MDPI, Basel, Switzerland. This article is an open access article distributed under the terms and conditions of the Creative Commons Attribution (CC BY) license (http://creativecommons.org/licenses/by/4.0/).
Copyright: This open access article is published under a Creative Commons CC BY 4.0 license, which permit the free download, distribution, and reuse, provided that the author and preprint are cited in any reuse.


