Submitted:
29 December 2025
Posted:
30 December 2025
You are already at the latest version
Abstract
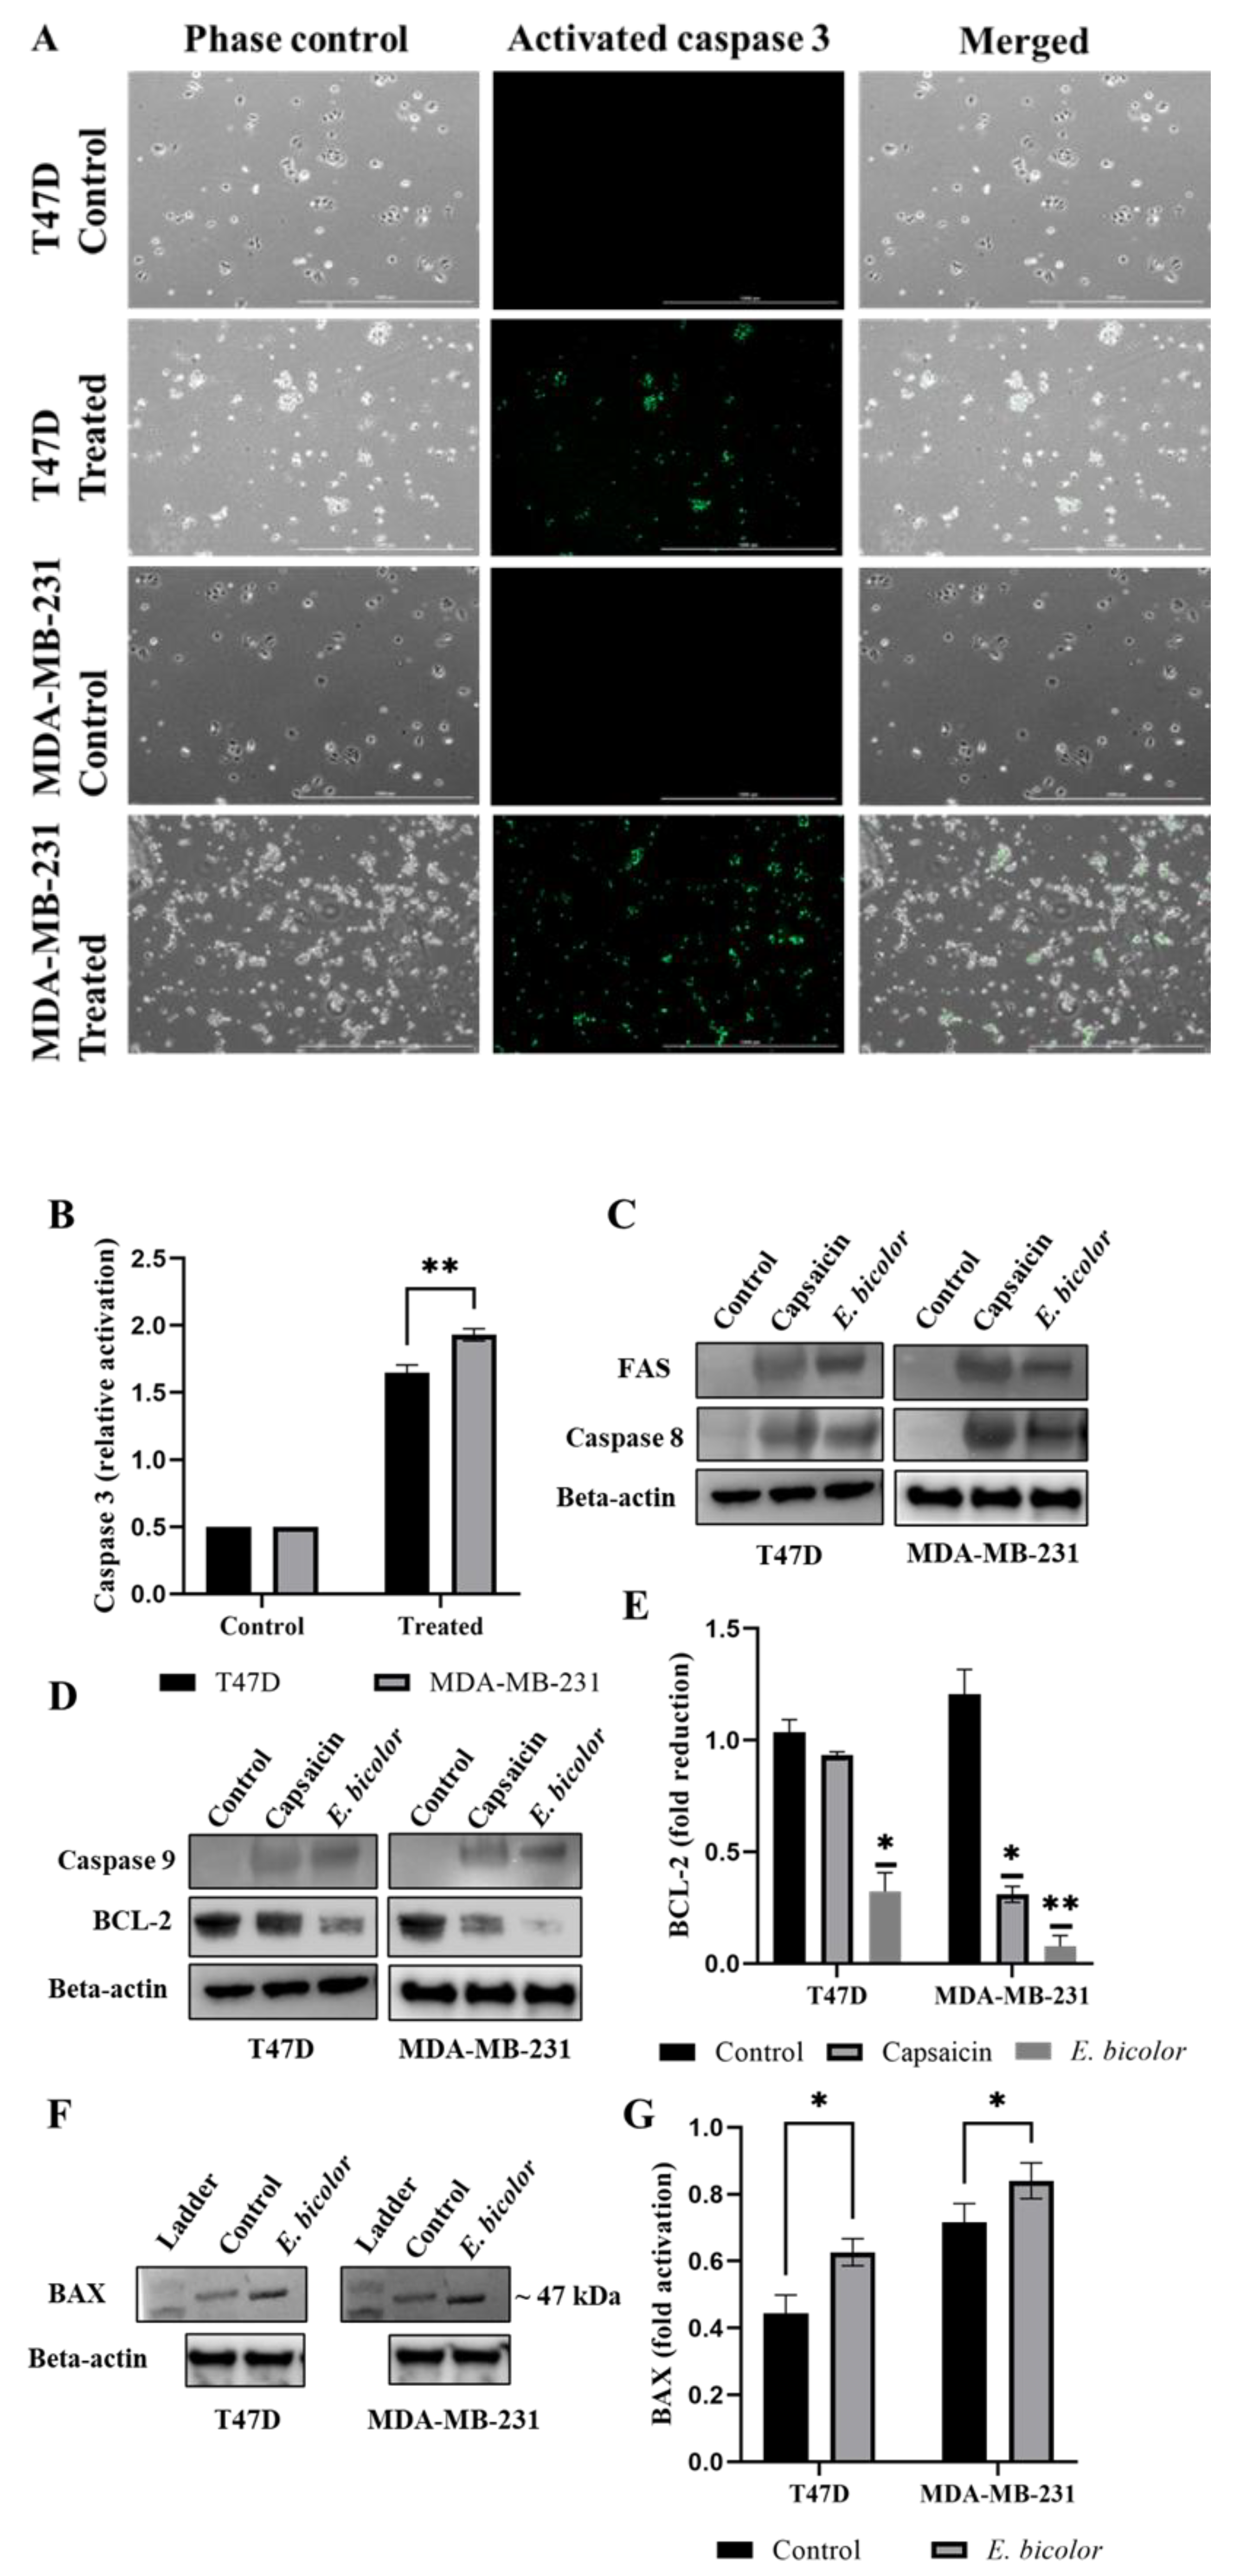
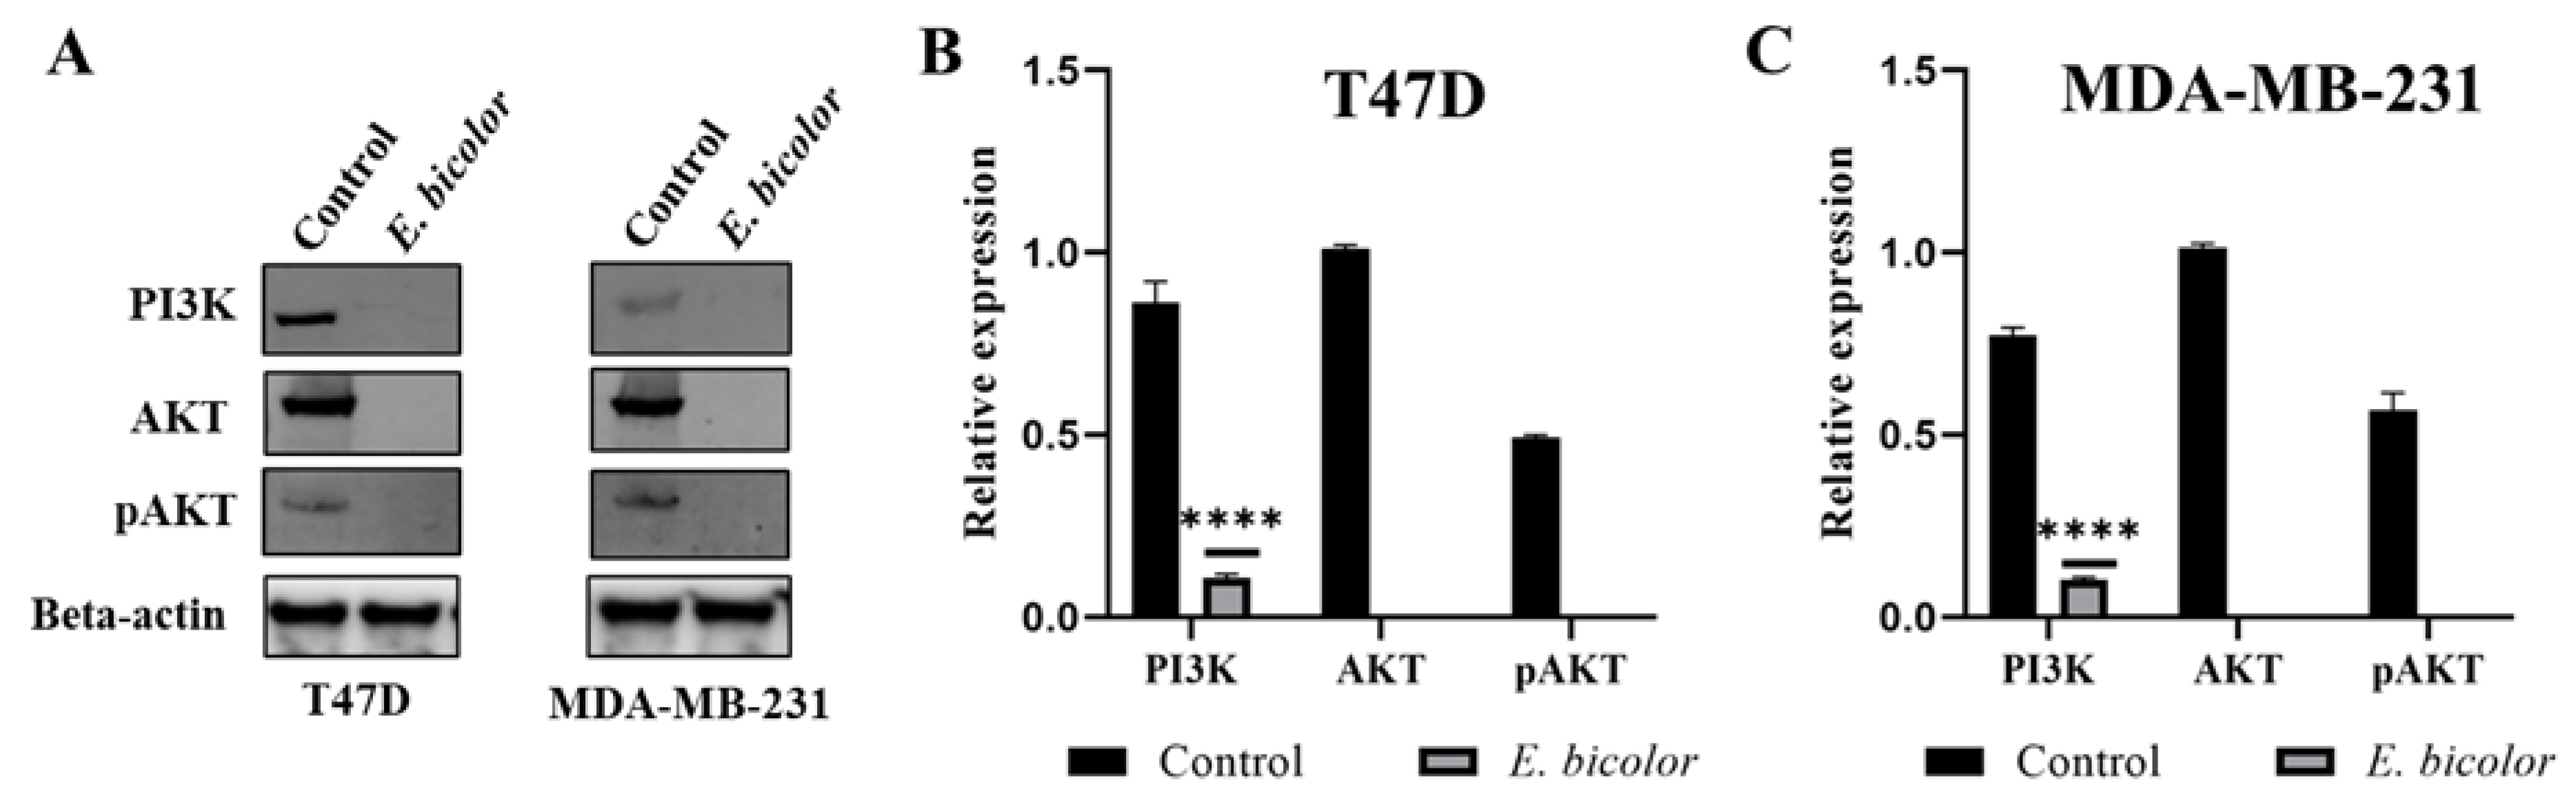
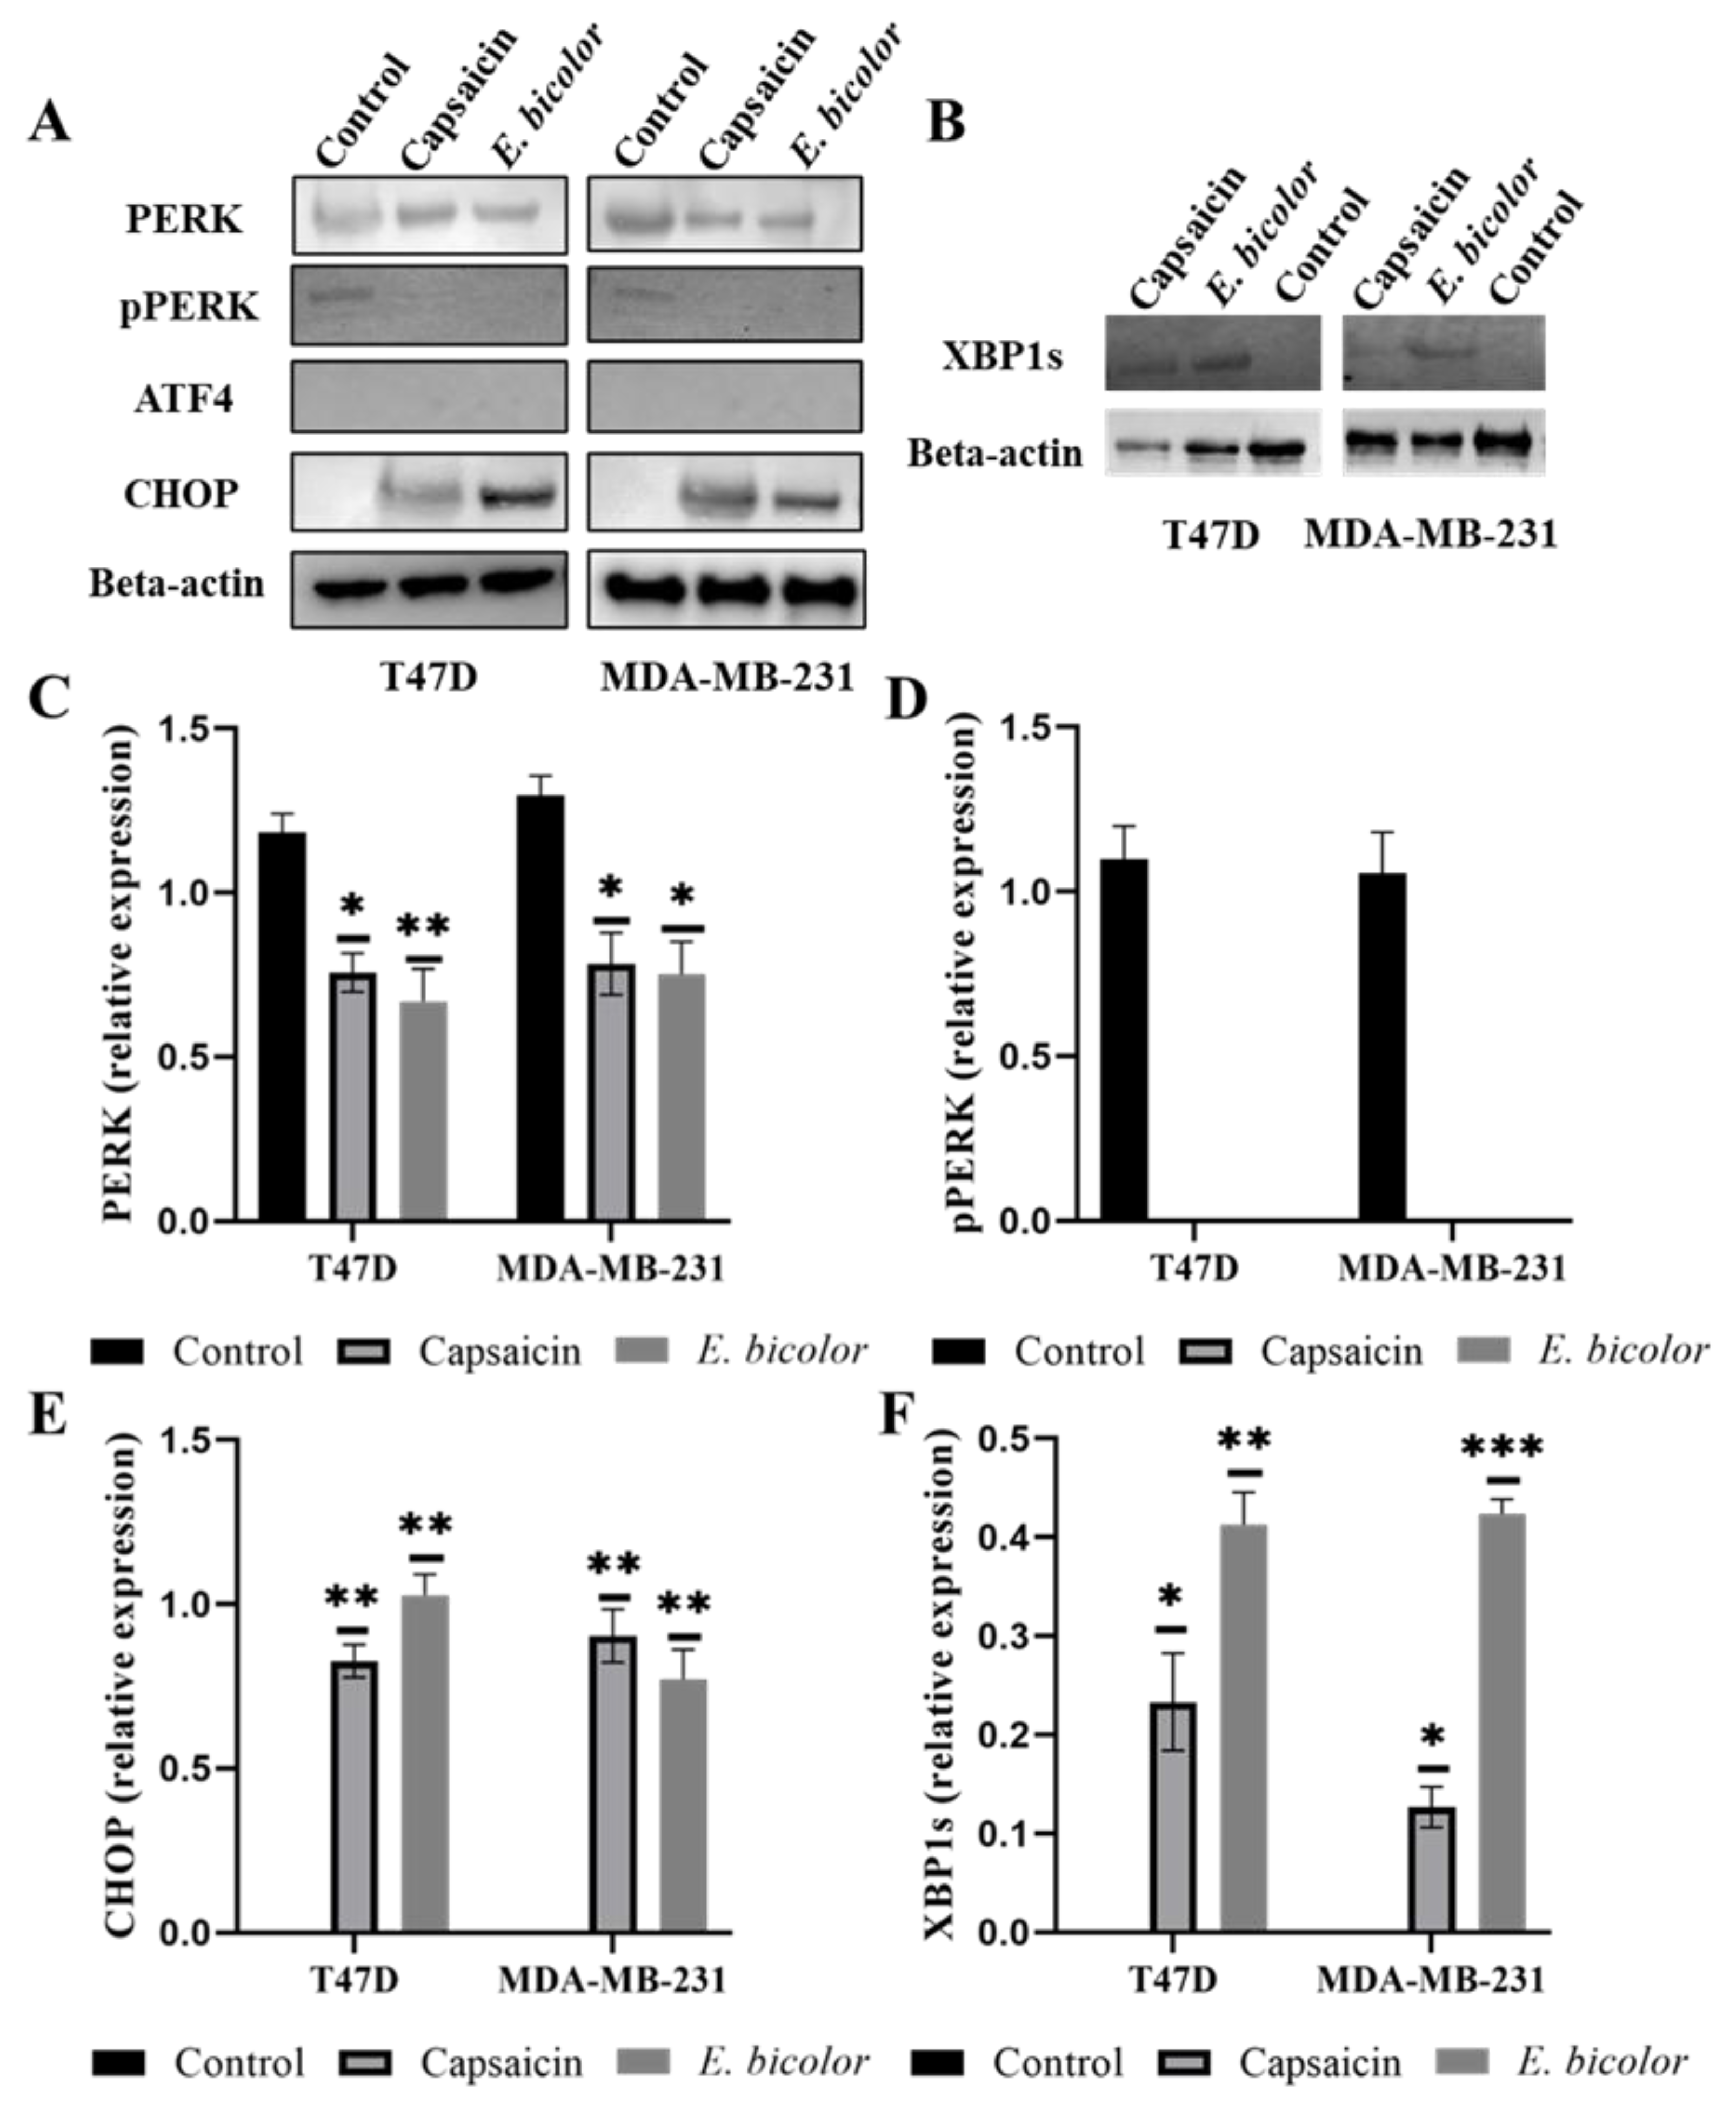
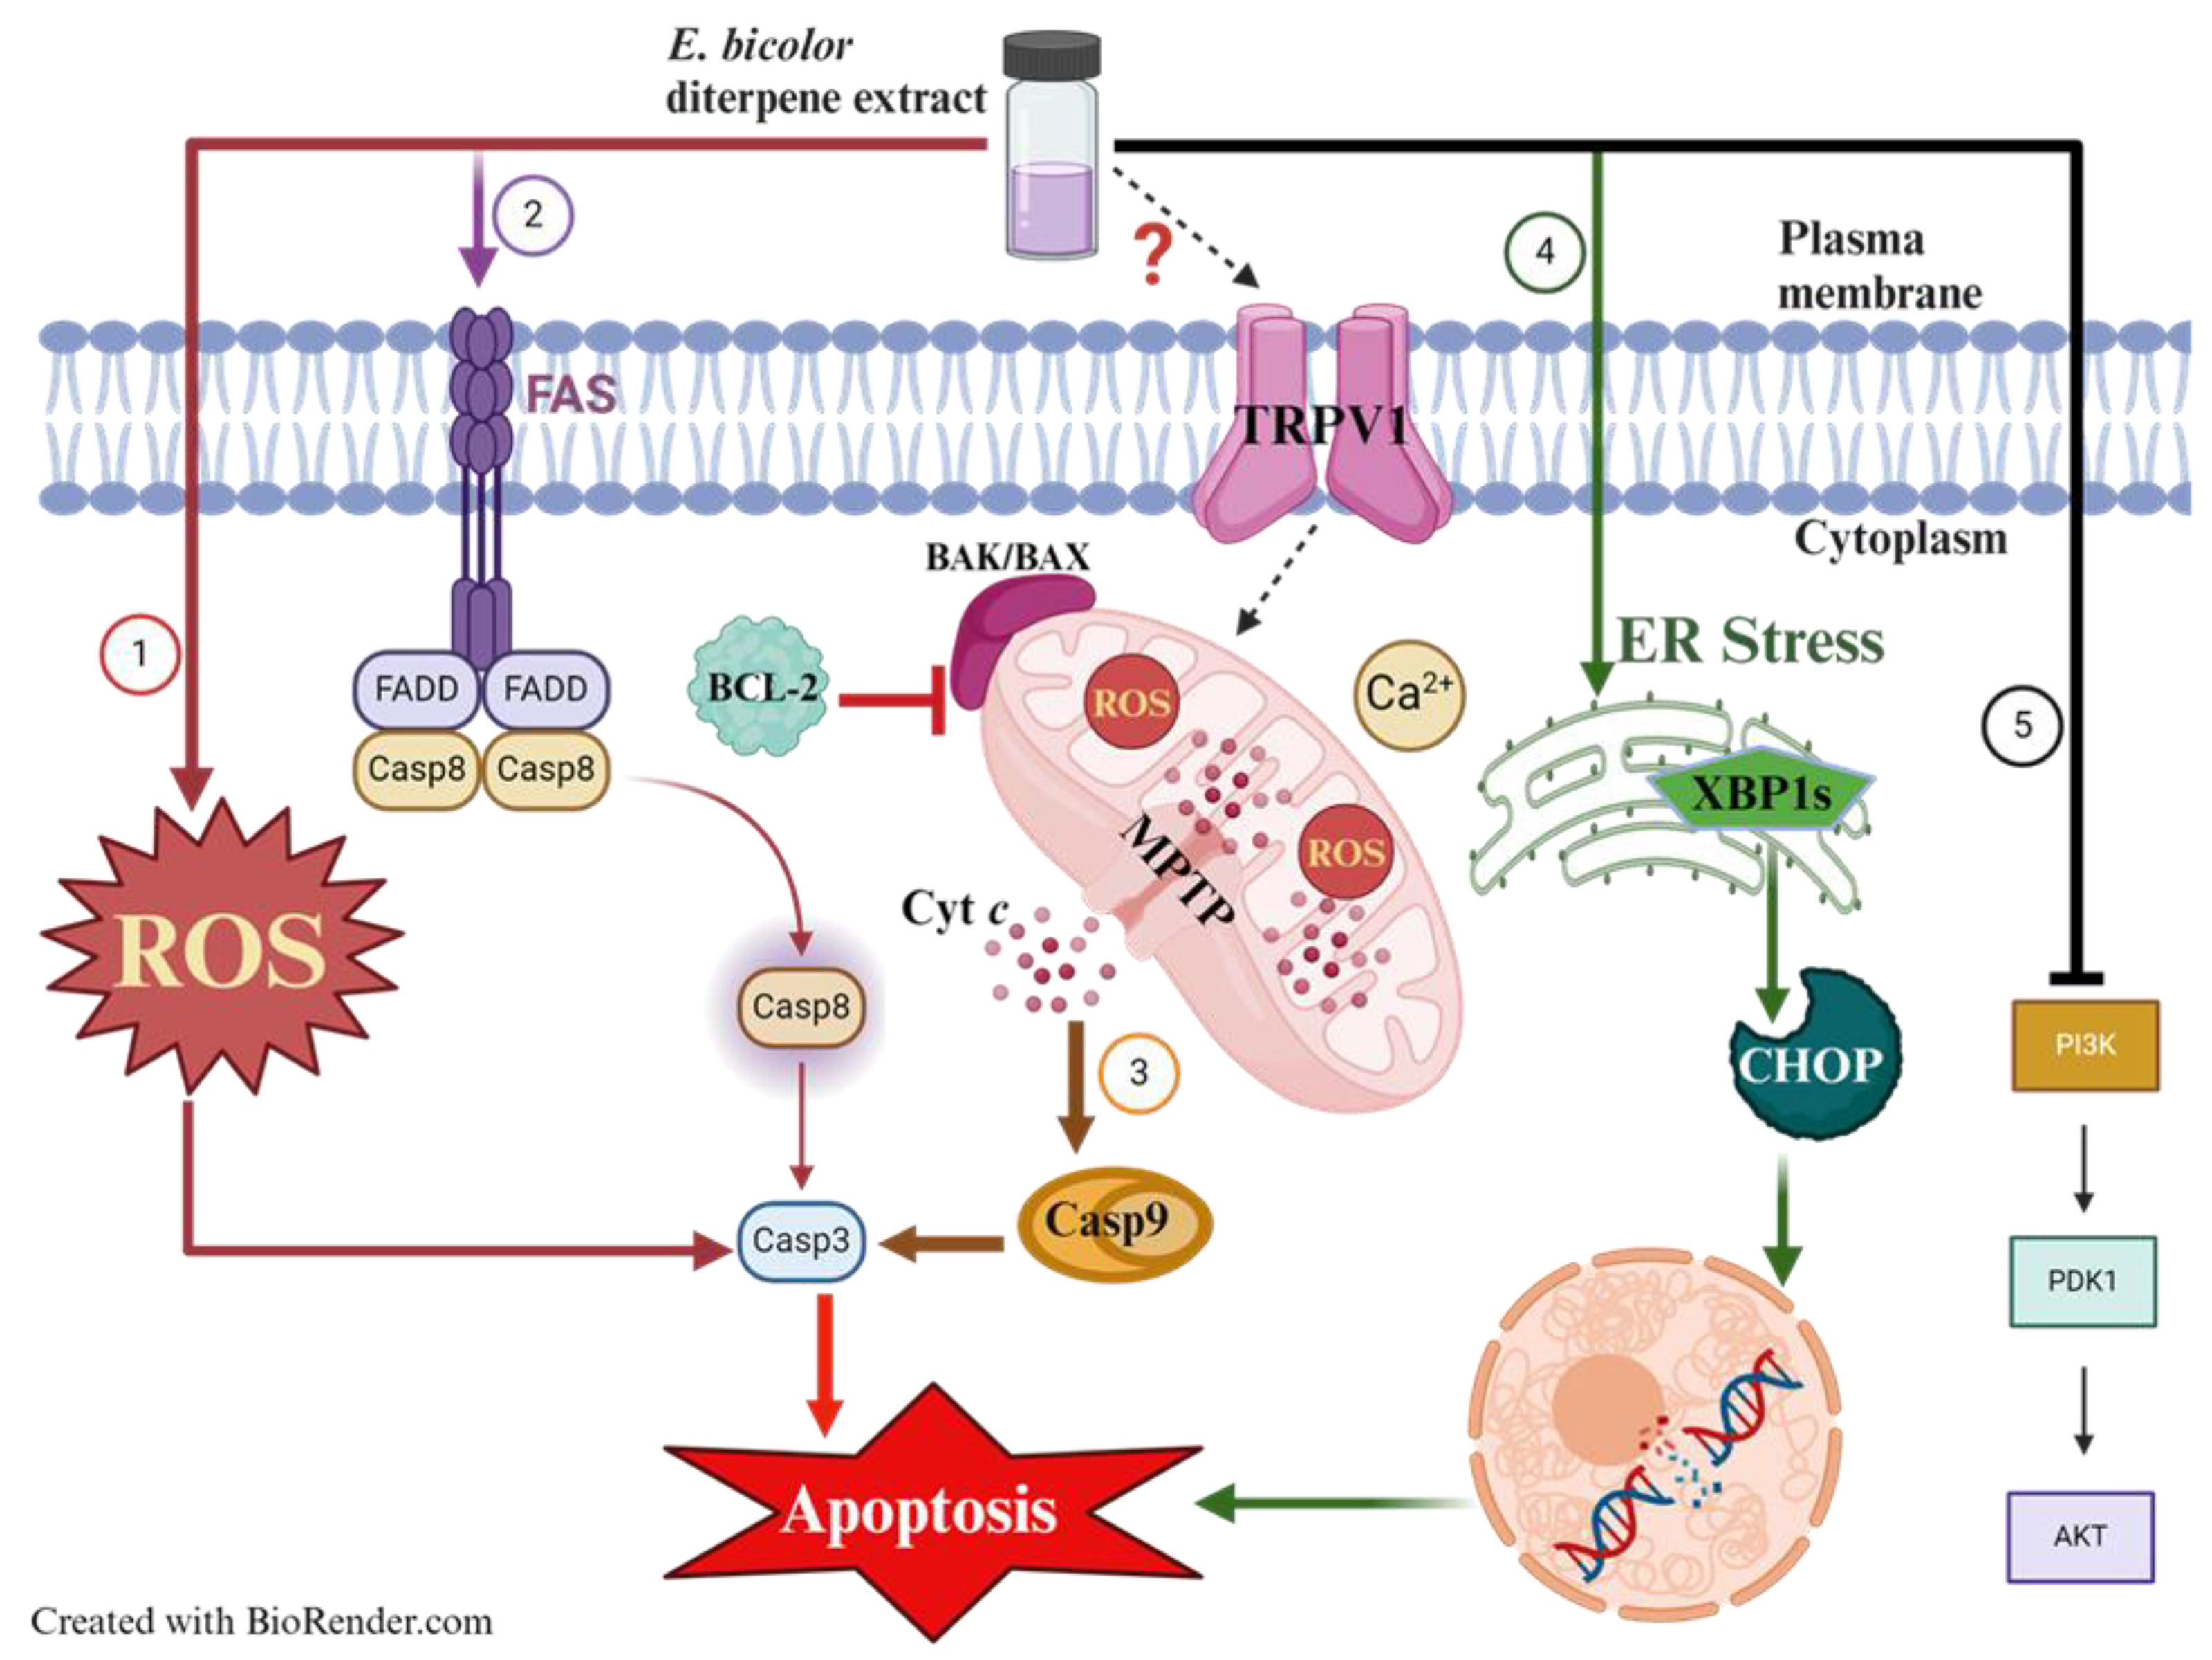
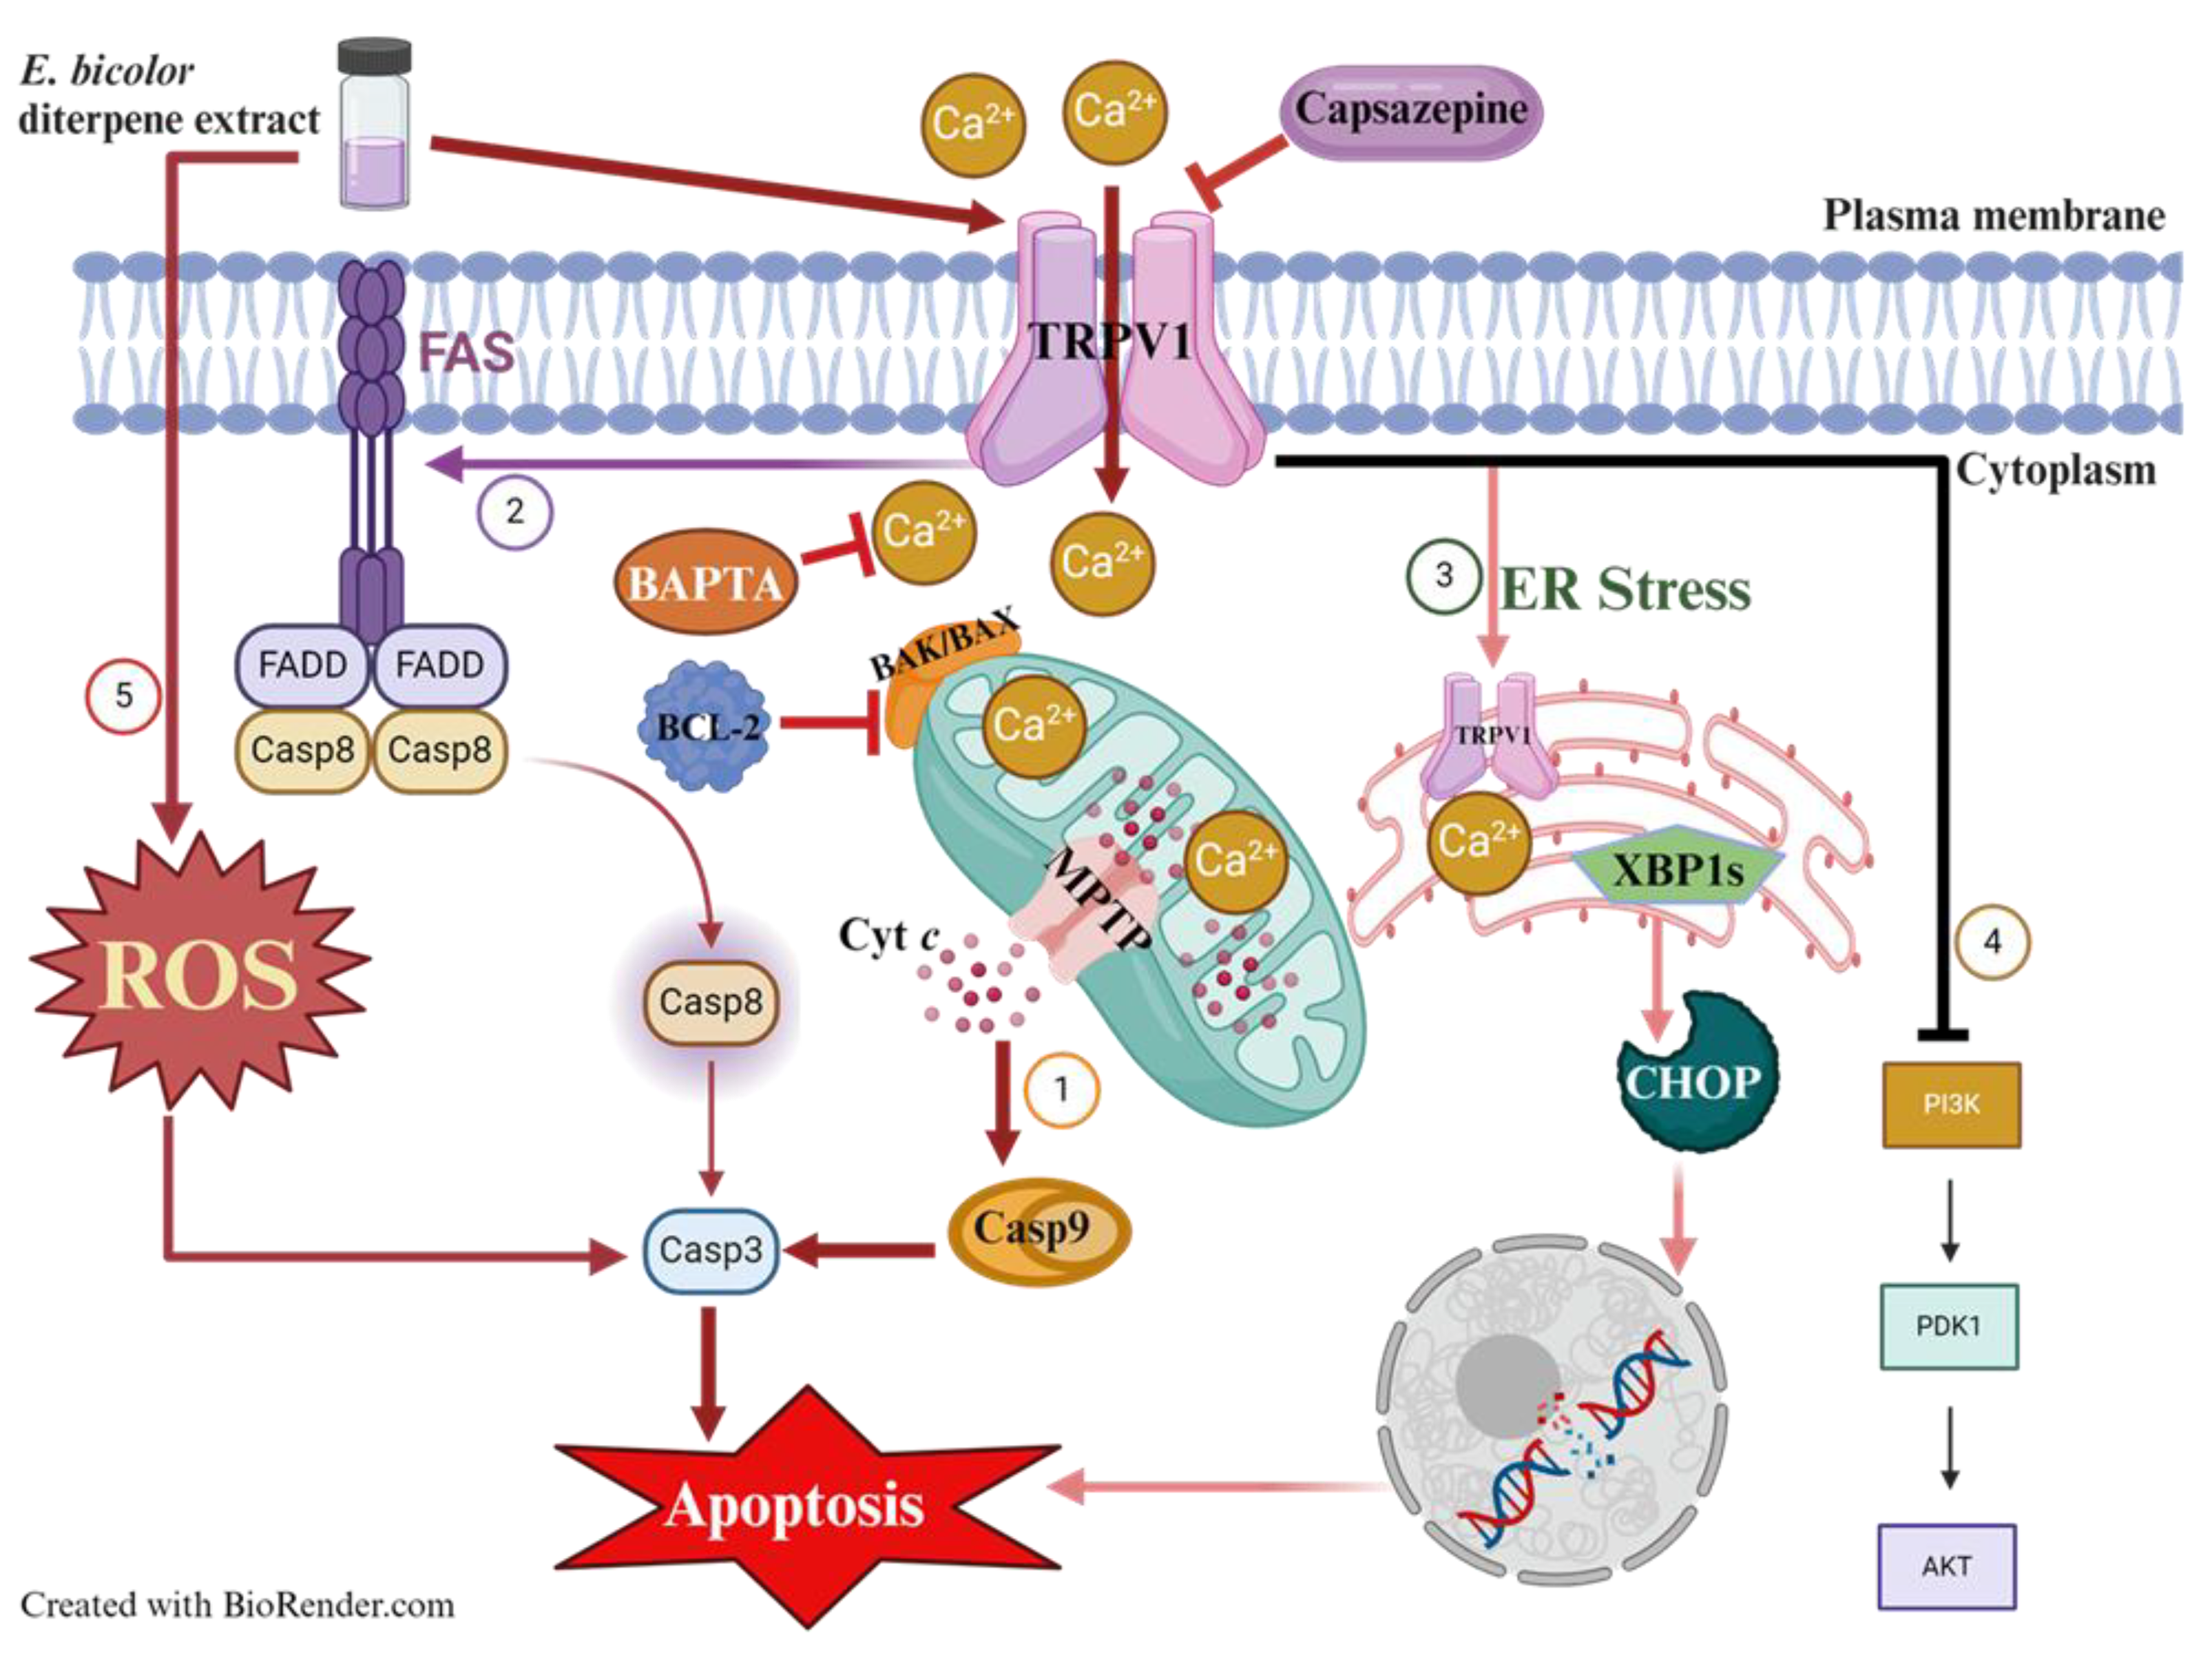
Breast cancer is a significant cause of death worldwide. Recent research has focused on identifying natural compounds for developing effective cancer treatments. Resiniferatoxin, a TRPV1 agonist, is a common diterpene in Euphorbia bicolor, a plant native to the southern United States that has not been studied before. We investigated the antiproliferative activities and mechanisms of action of E. bicolor diterpene extract in estrogen receptor-positive T47D and triple-negative MDA-MB-231 cell lines. The extract significantly reduced the viability of T47D and MDA-MB-231 cells in a dose-dependent manner. In MDA-MB-231 cells, the extract induced apoptosis via intracellular calcium overload, triggered by TRPV1 activation. This effect was diminished by the TRPV1 antagonist capsazepine and the calcium chelator BAPTA-AM. Intracellular calcium influx was confirmed through Fura-2 AM staining, revealing that E. bicolor phytochemicals activated TRPV1 in MDA-MB-231 cells. Treatment of T47D cells with E. bicolor diterpene extract resulted in apoptosis associated with ROS generation (10-fold higher in T47D cells than in MDA-MB-231 cells) and mitochondrial calcium overload. These effects were significantly blocked when cells were pretreated with NAC (N-acetyl-l-cysteine), a ROS inhibitor. Both cell lines initiated apoptosis through multiple mitochondrial and endoplasmic reticulum-stress-mediated apoptotic pathways, demonstrated by the expression of activated caspase 3, caspase 9, caspase 8, FAS, XBP1s, CHOP, overexpression of BAX proteins and reduction of BCL-2 levels. In addition, PI3K, AKT, and pAKT protein expressions were also reduced in both cell lines, indicating downregulation of PI3K/Akt signaling pathway. Phytochemicals in E. bicolor diterpene extract could become promising ingredients for developing breast cancer therapeutics.
Keywords:
1. Introduction
2. Results
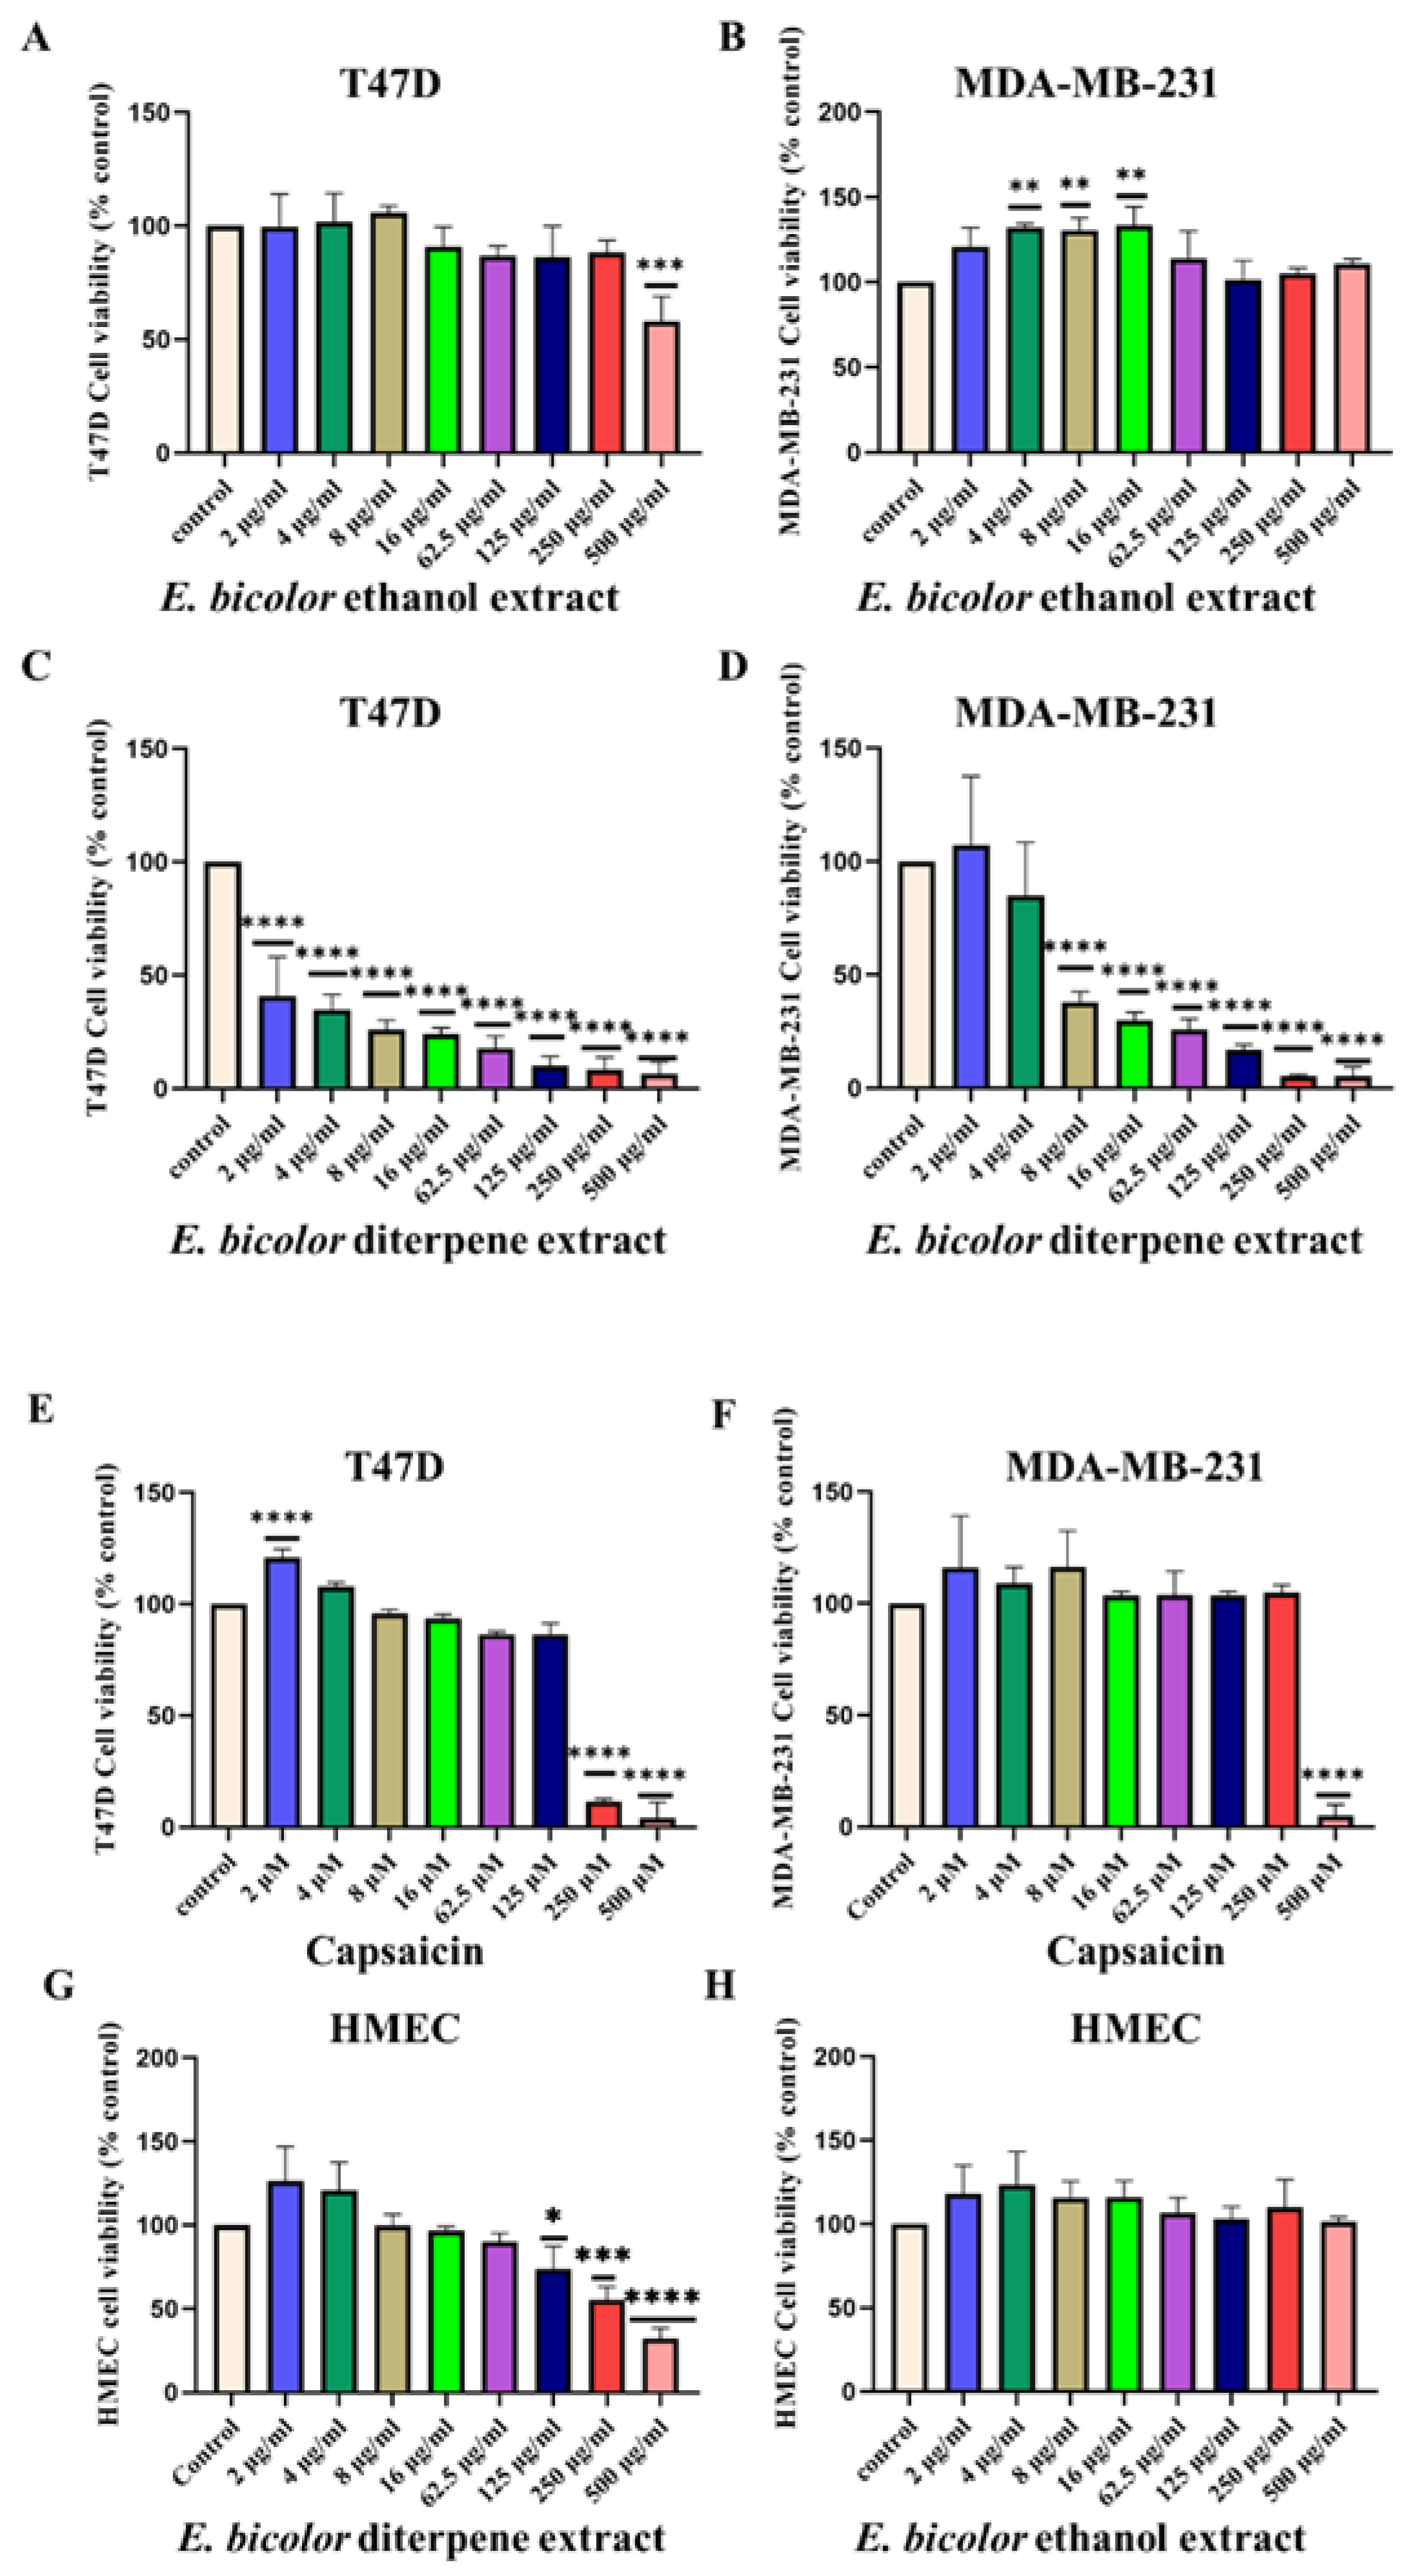
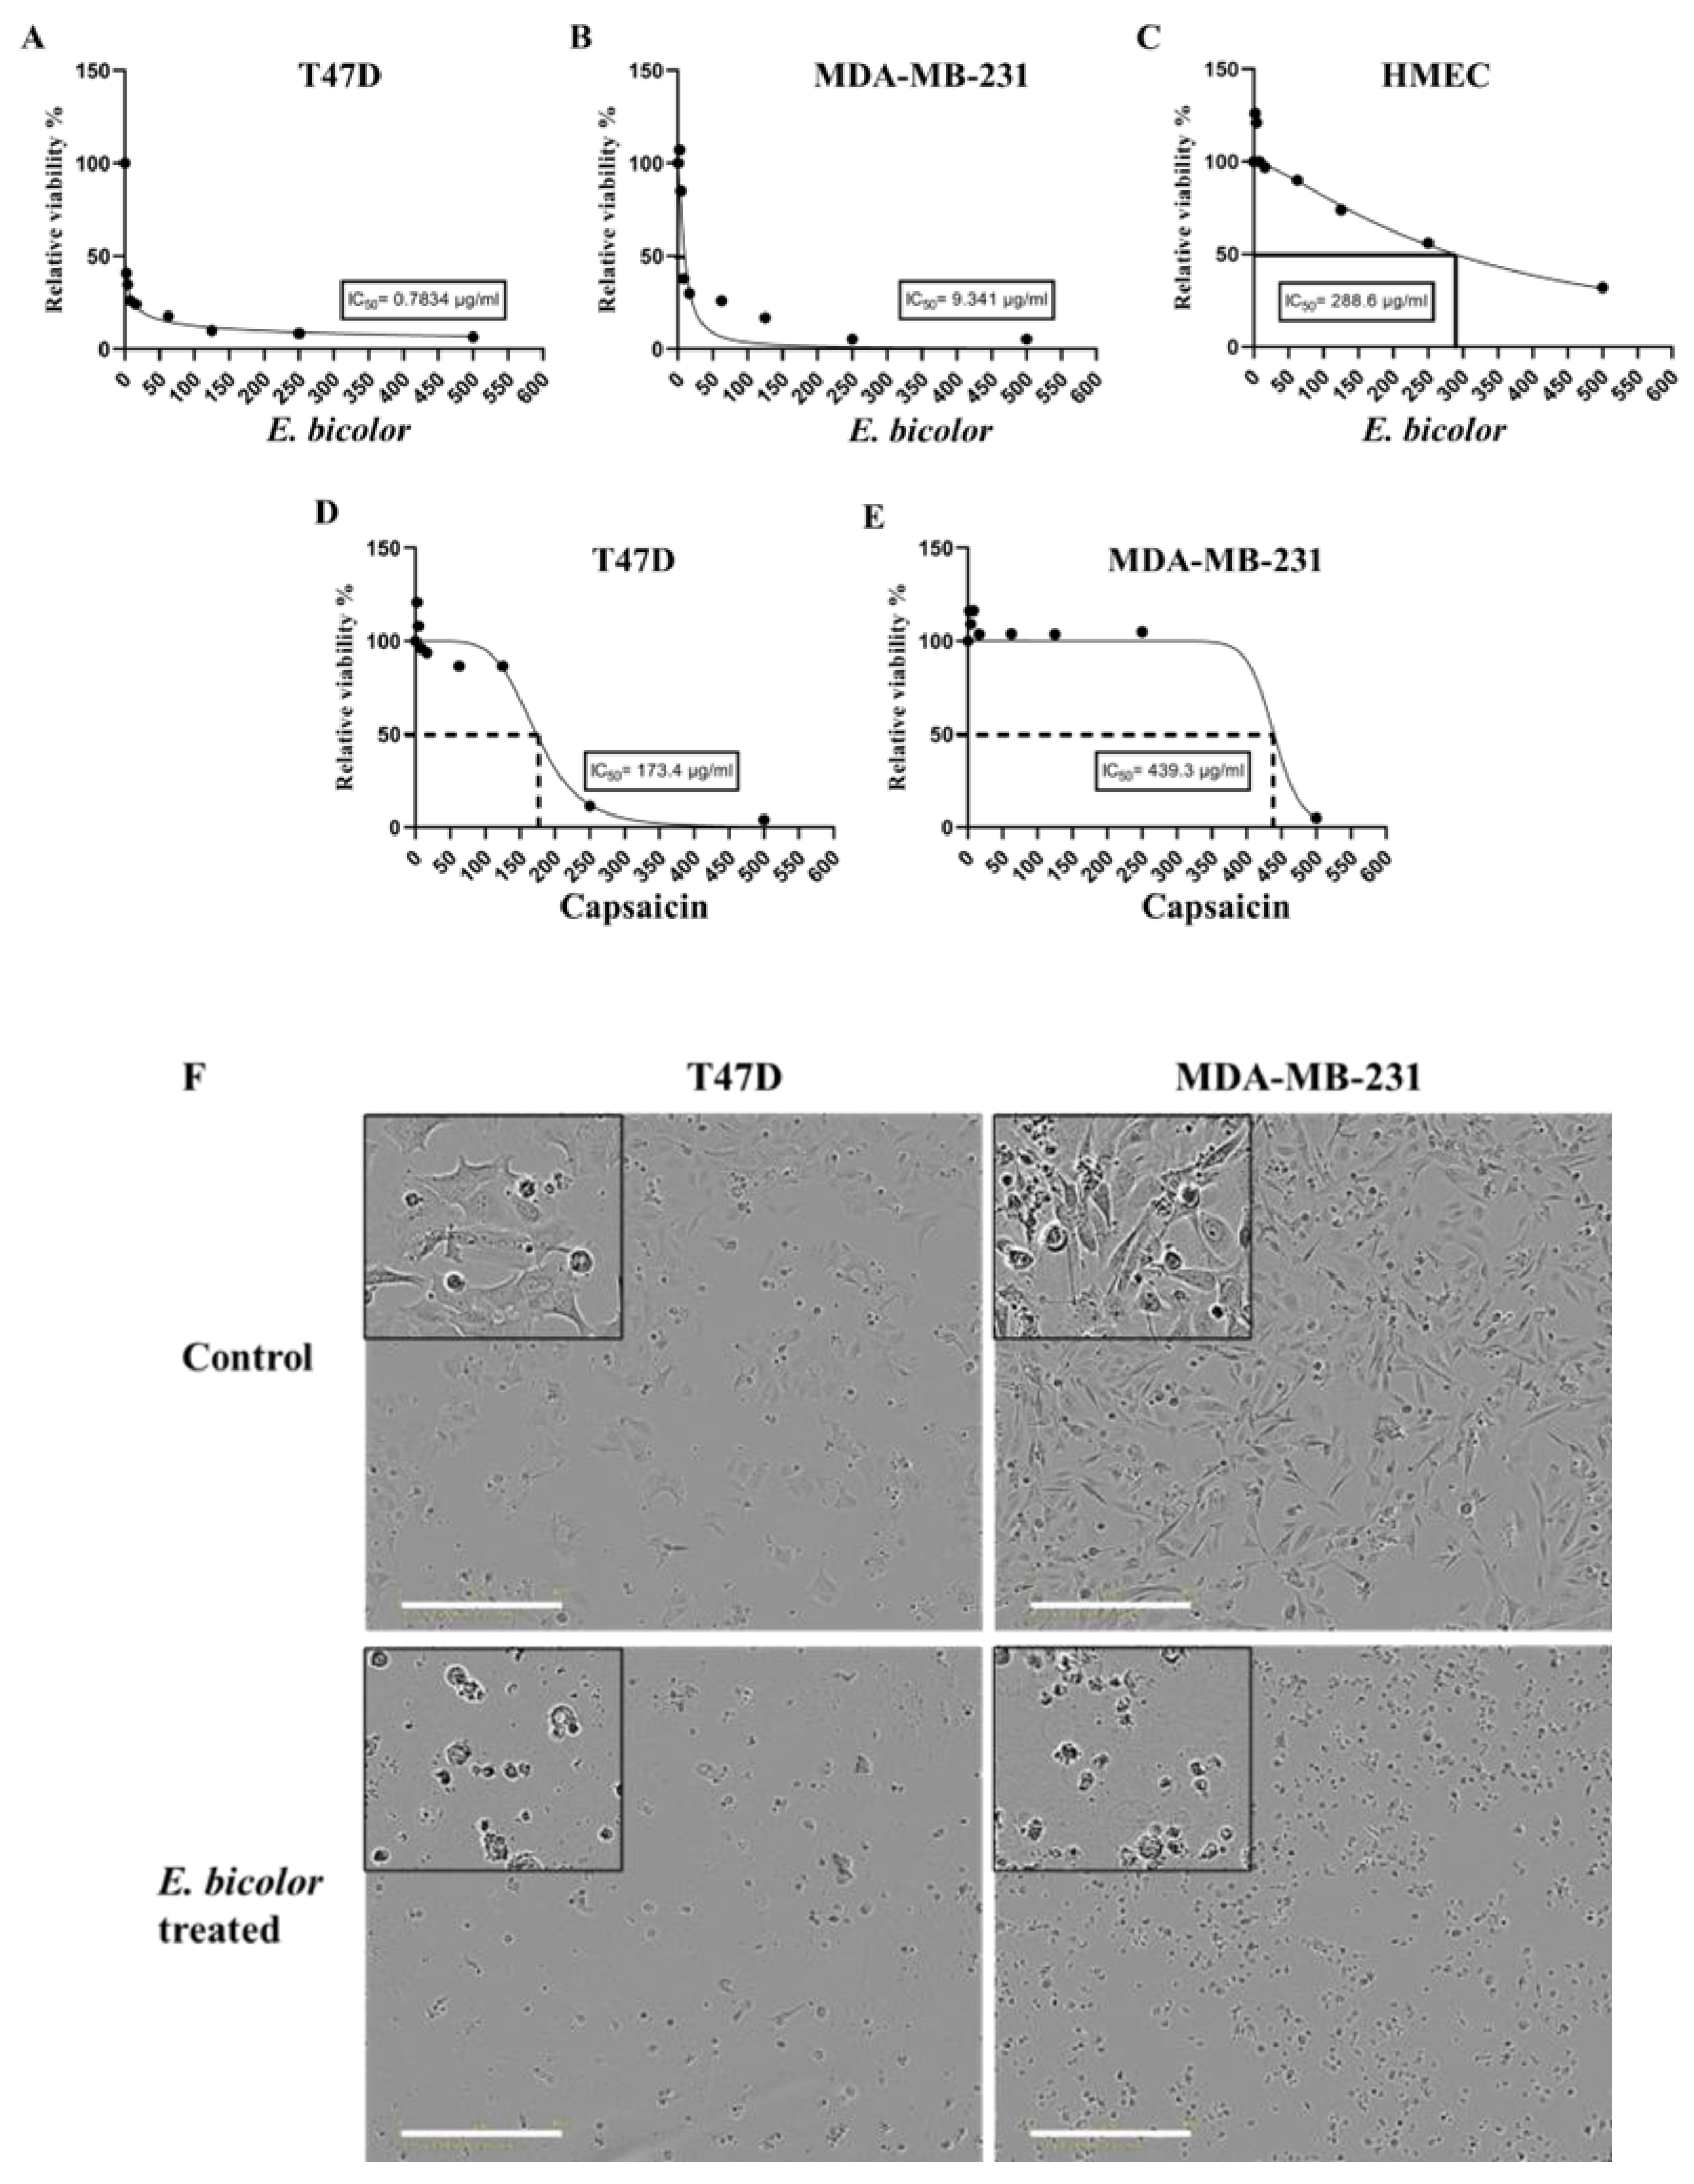
2.1. Antiproliferative Activity of E. bicolor Extracts in T47D and MDA-MB-231 Cells
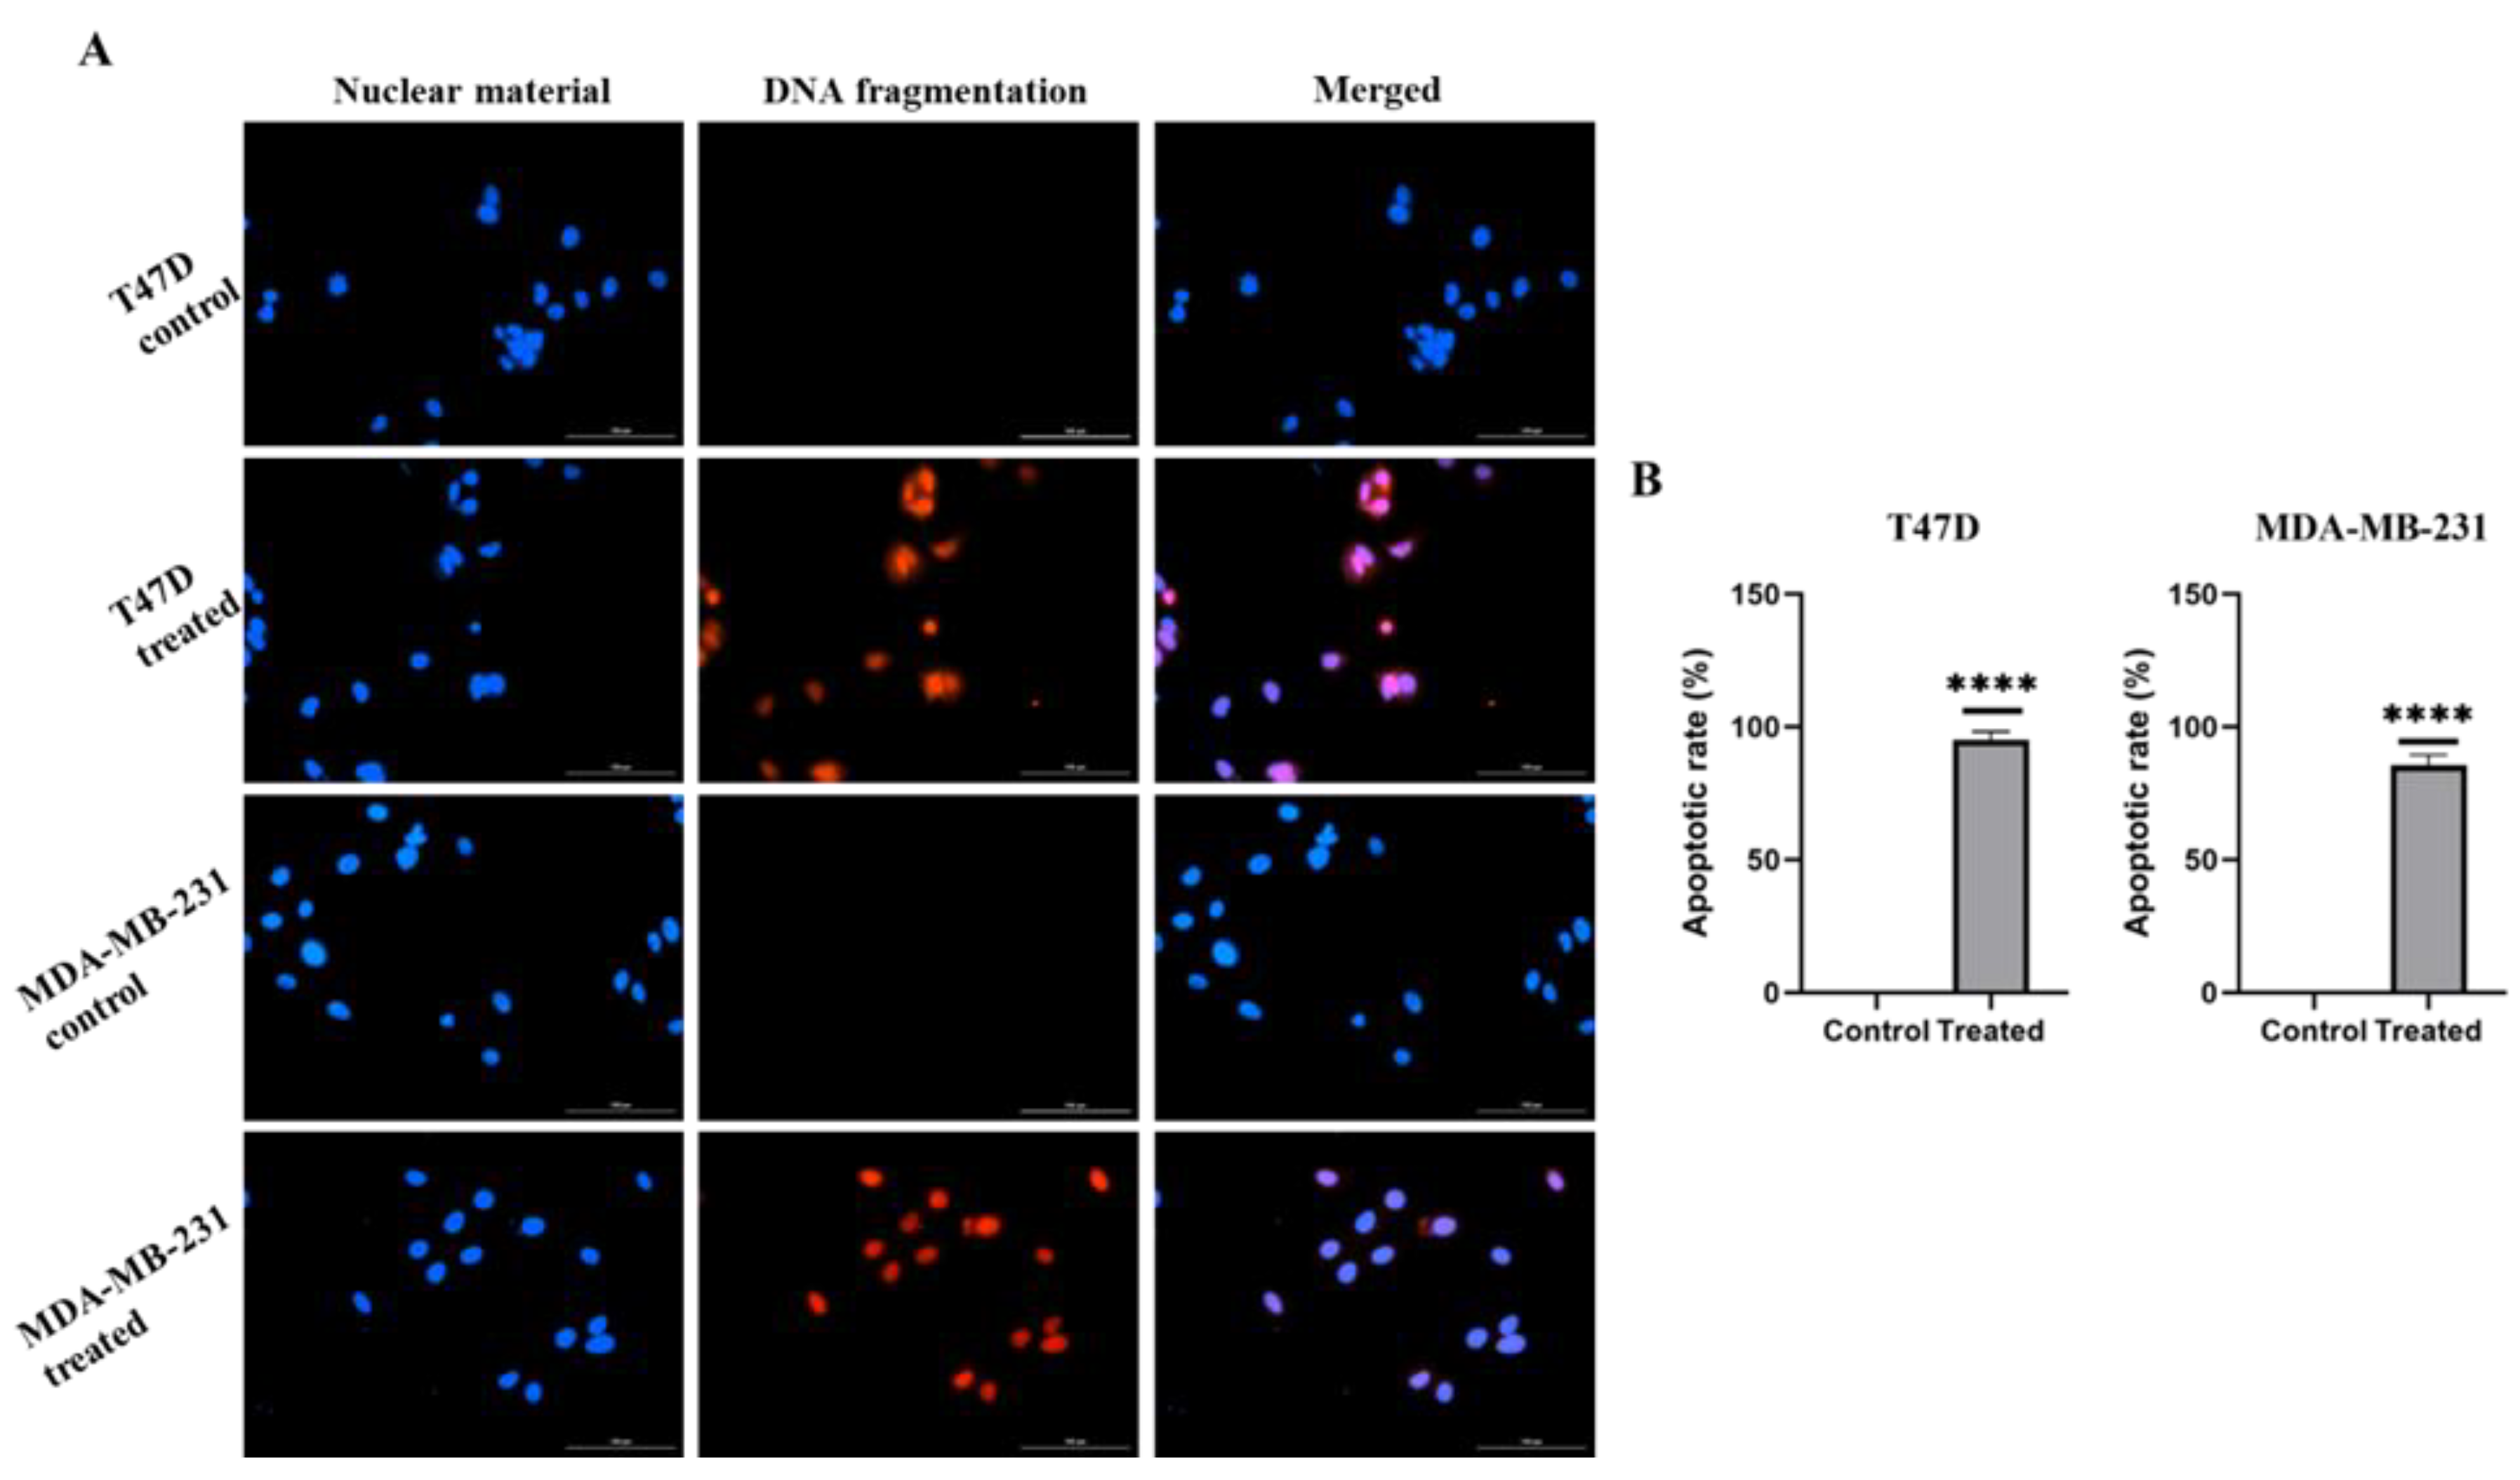
2.2. E. bicolor Diterpene Extract Induces Apoptosis in T47D and MDA-MB-231 Cells
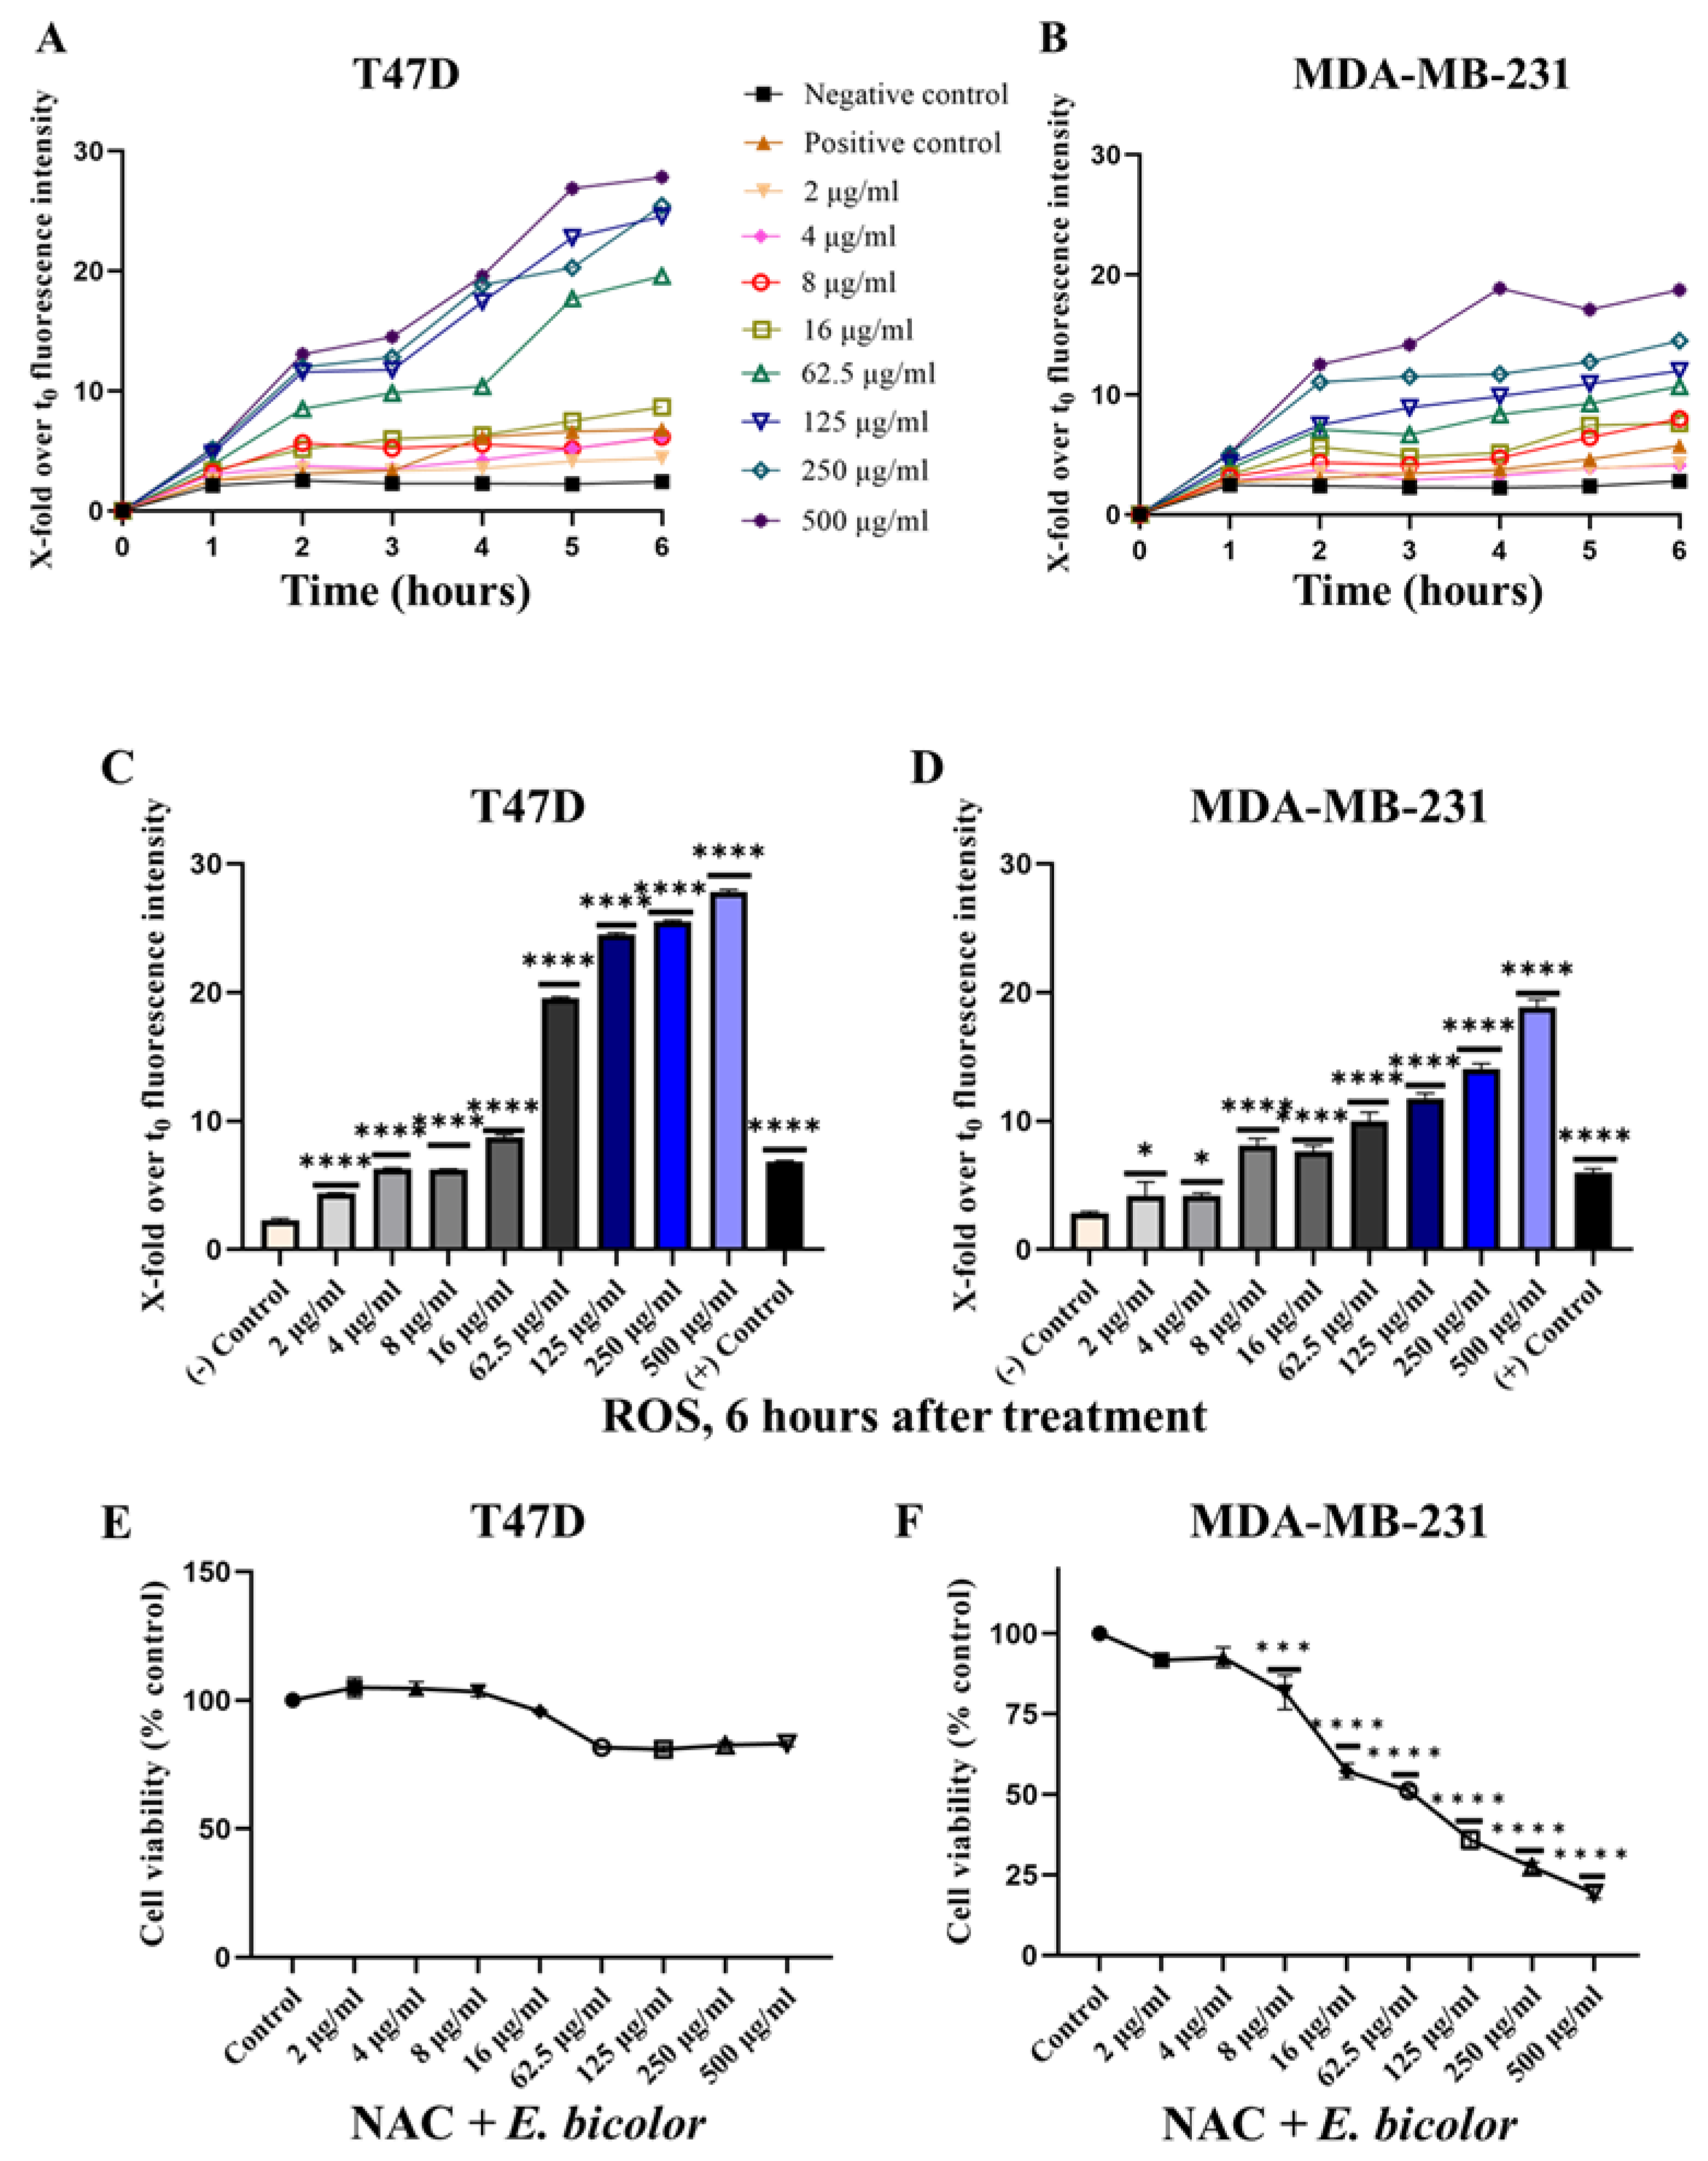
2.3. ROS Production Activated E. bicolor-Induced Apoptosis in T47D Cells
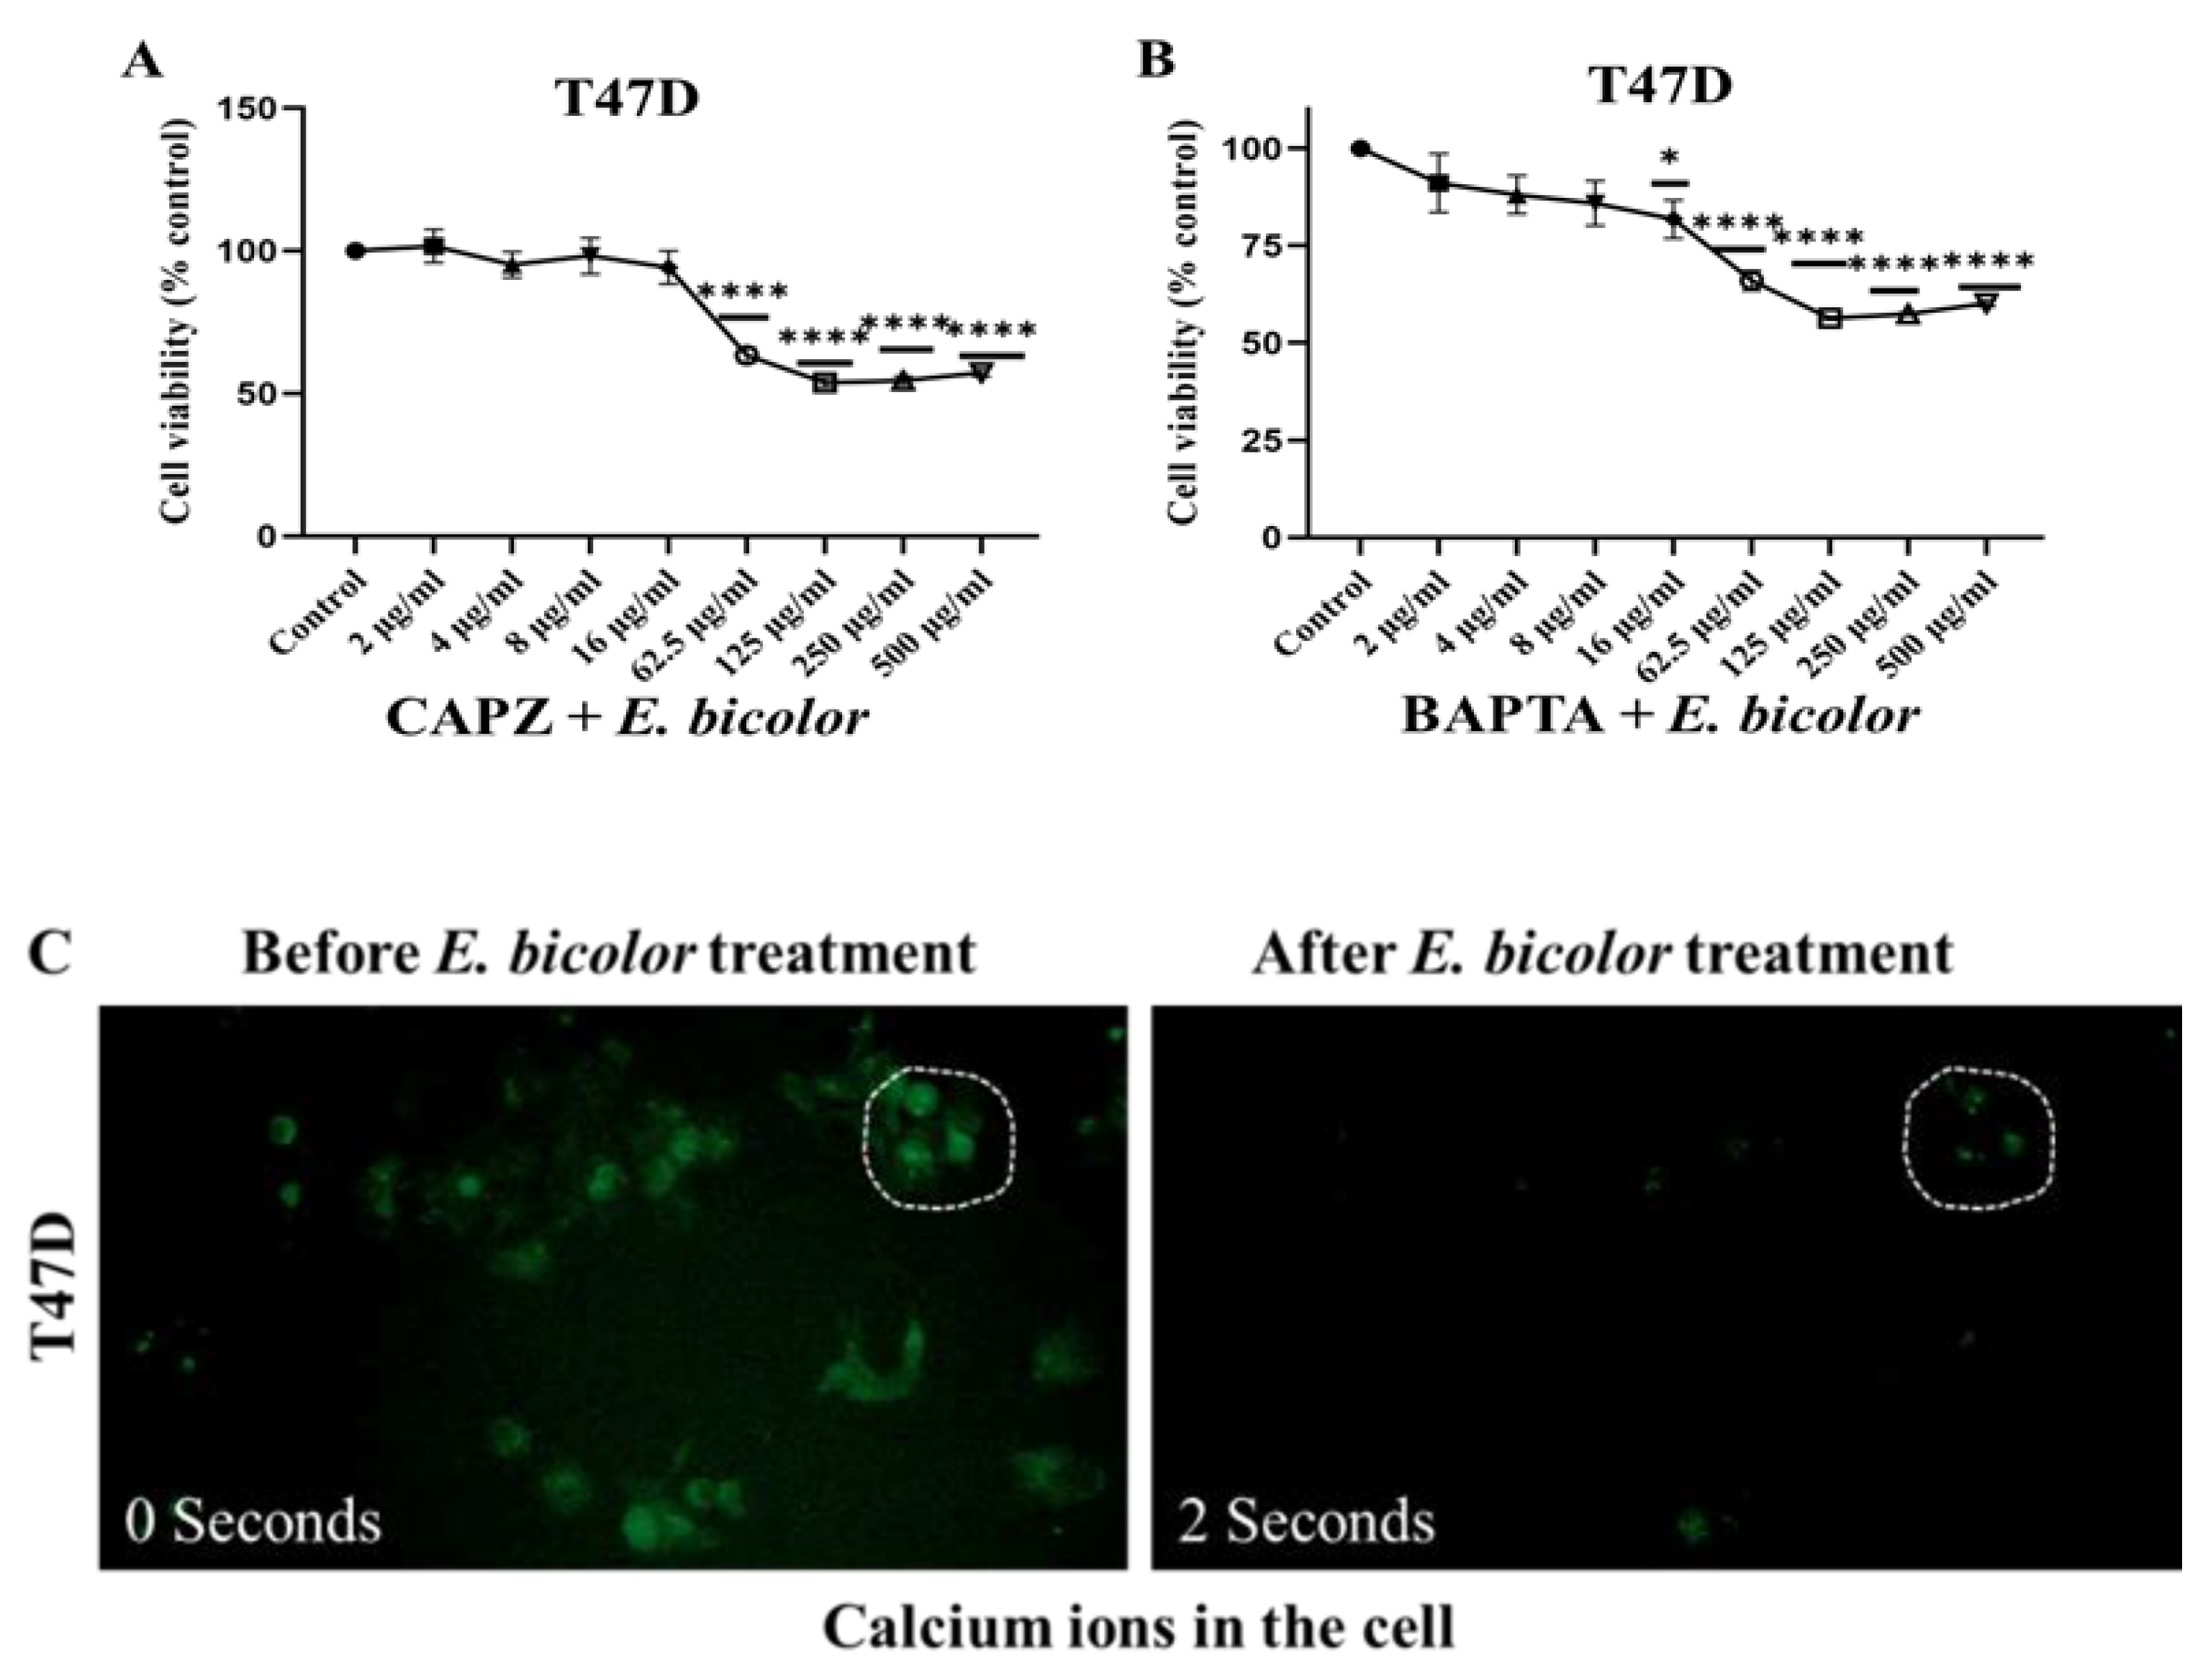
2.4. Blocking TRPV1 and Chelating Calcium Could Not Completely Inhibit the Antiproliferative Activity of E. bicolor Extract in T47D
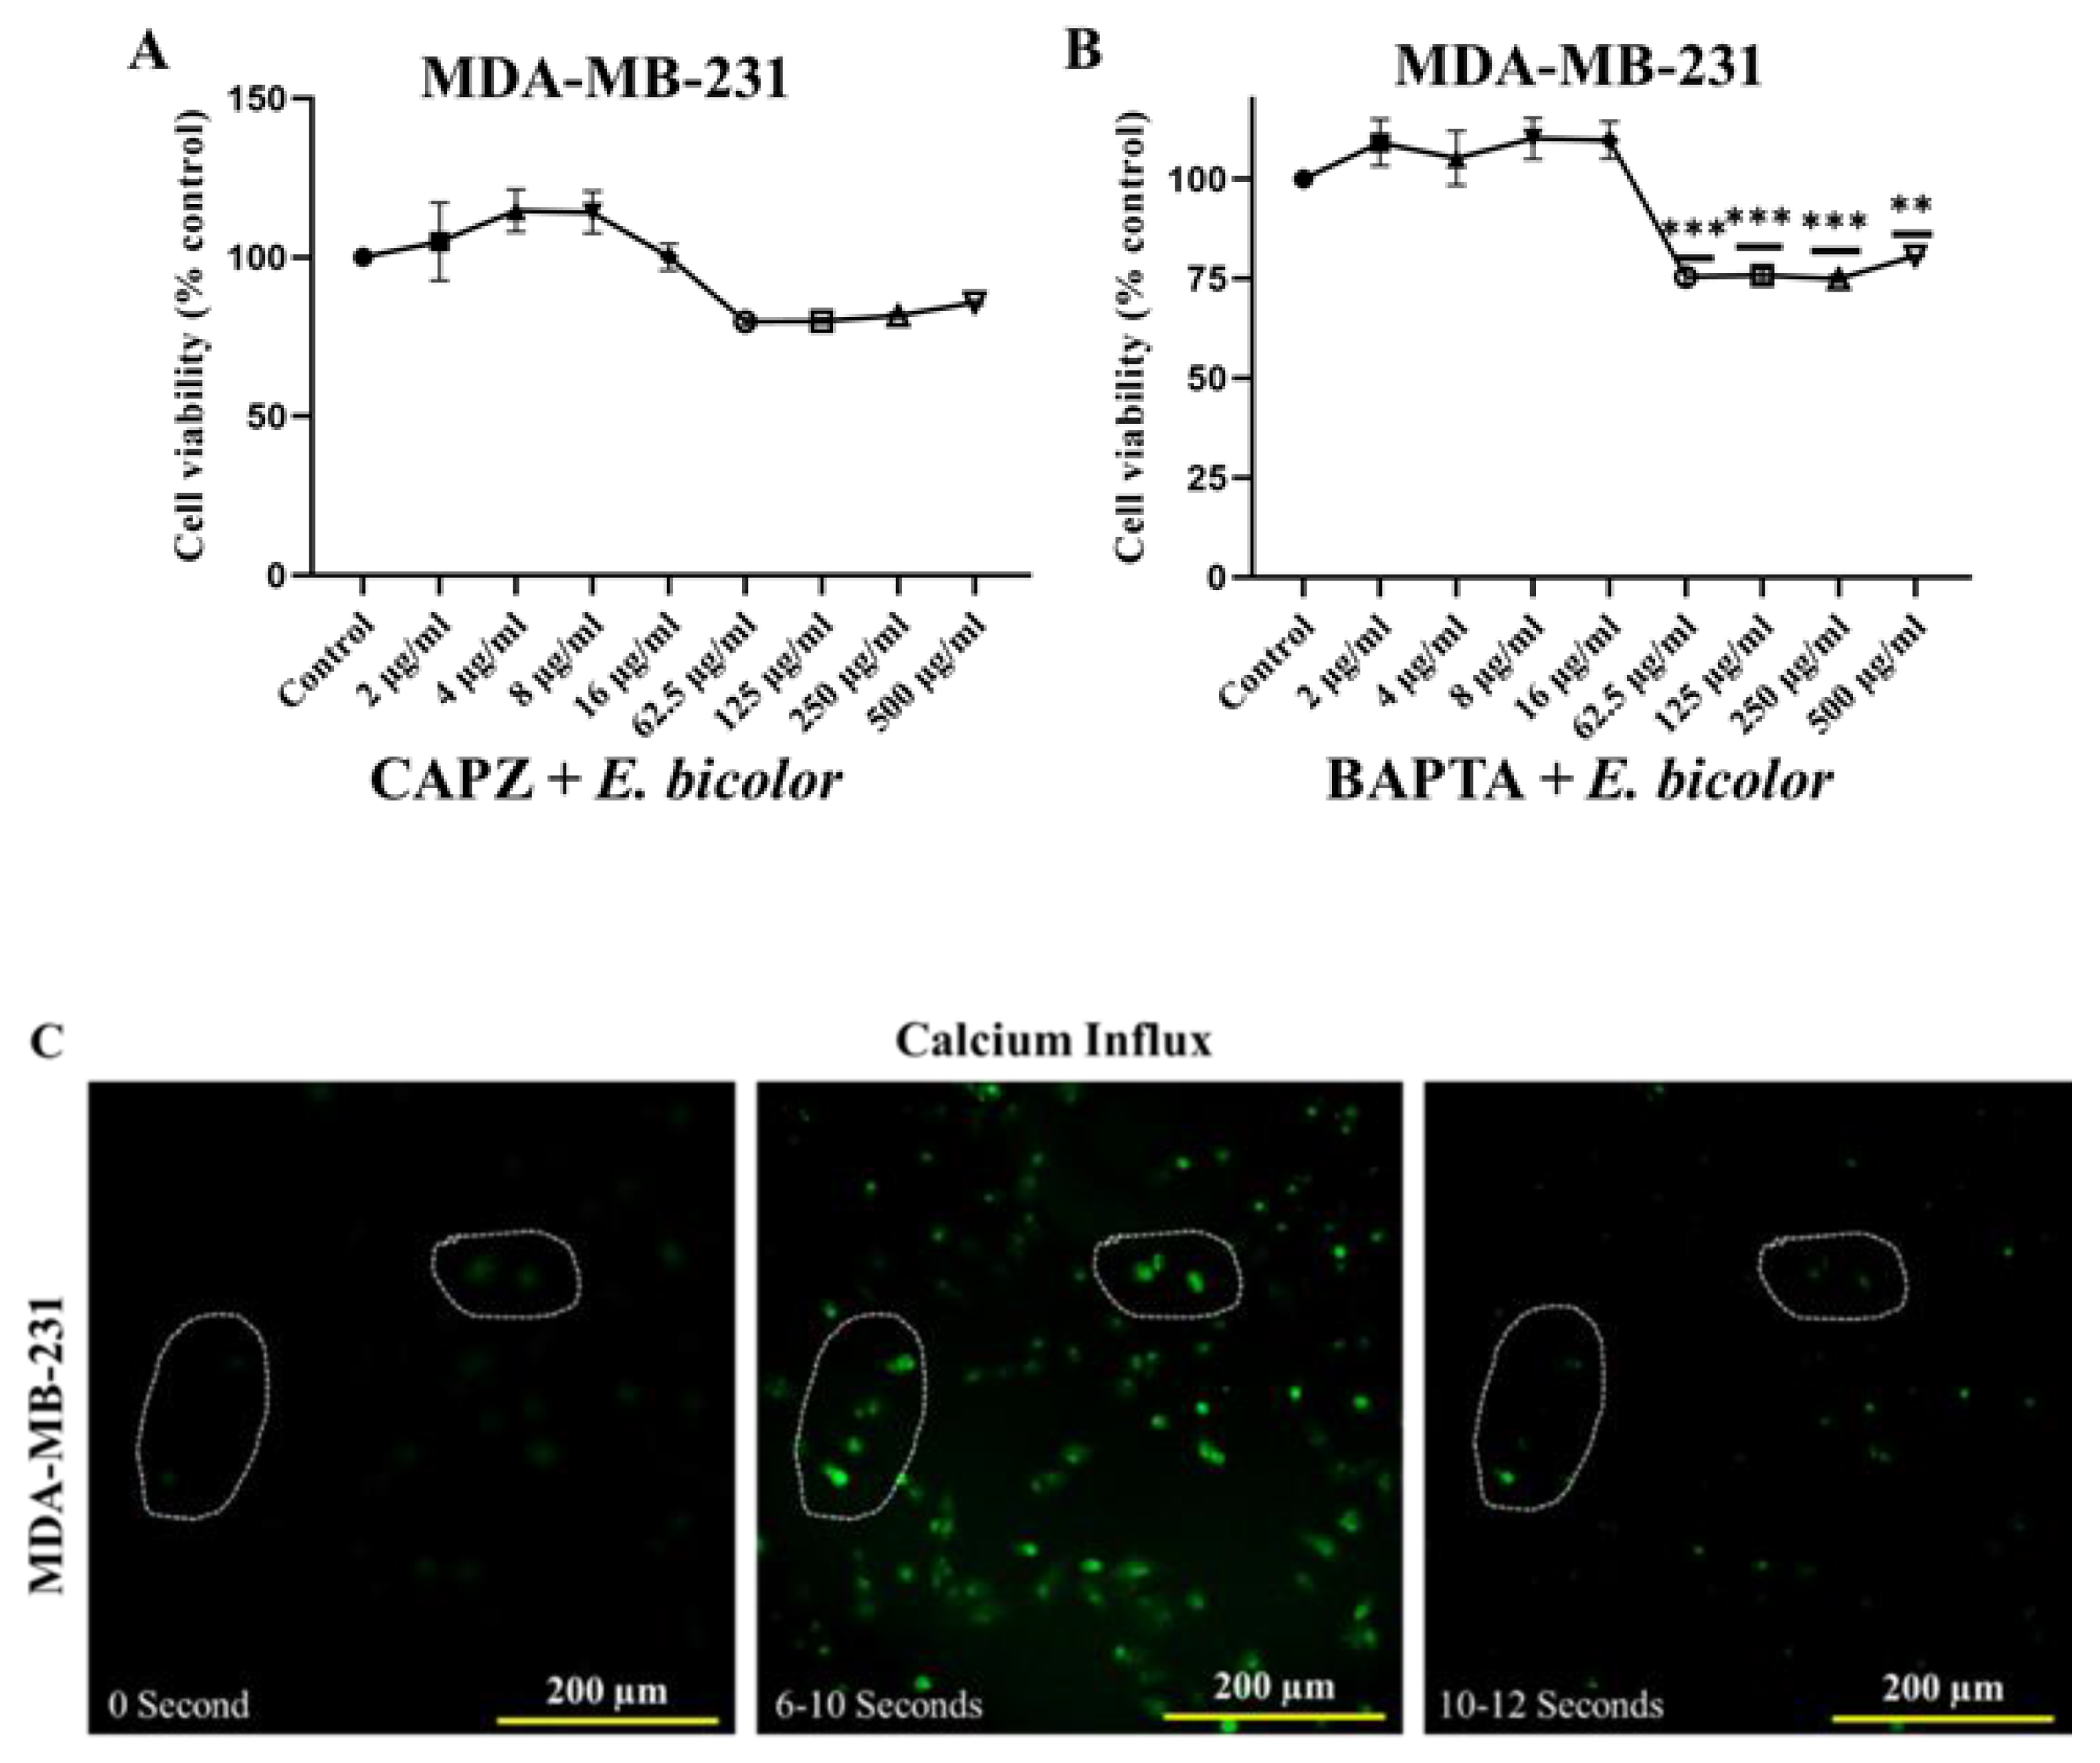
2.5. TRPV1 Activation Triggered E. bicolor-Induced Apoptosis in MDA-MB-231 Cells
2.6. E. bicolor Diterpene Extract Induced Mitochondrial Intrinsic and Extrinsic Apoptotic Signaling Pathways in T47D and MDA-MB-231 Cells
2.7. E. bicolor Diterpene Extract Downregulates the PI3K/AKT Signaling Pathway in T47D and MDA-MB-231 Cells
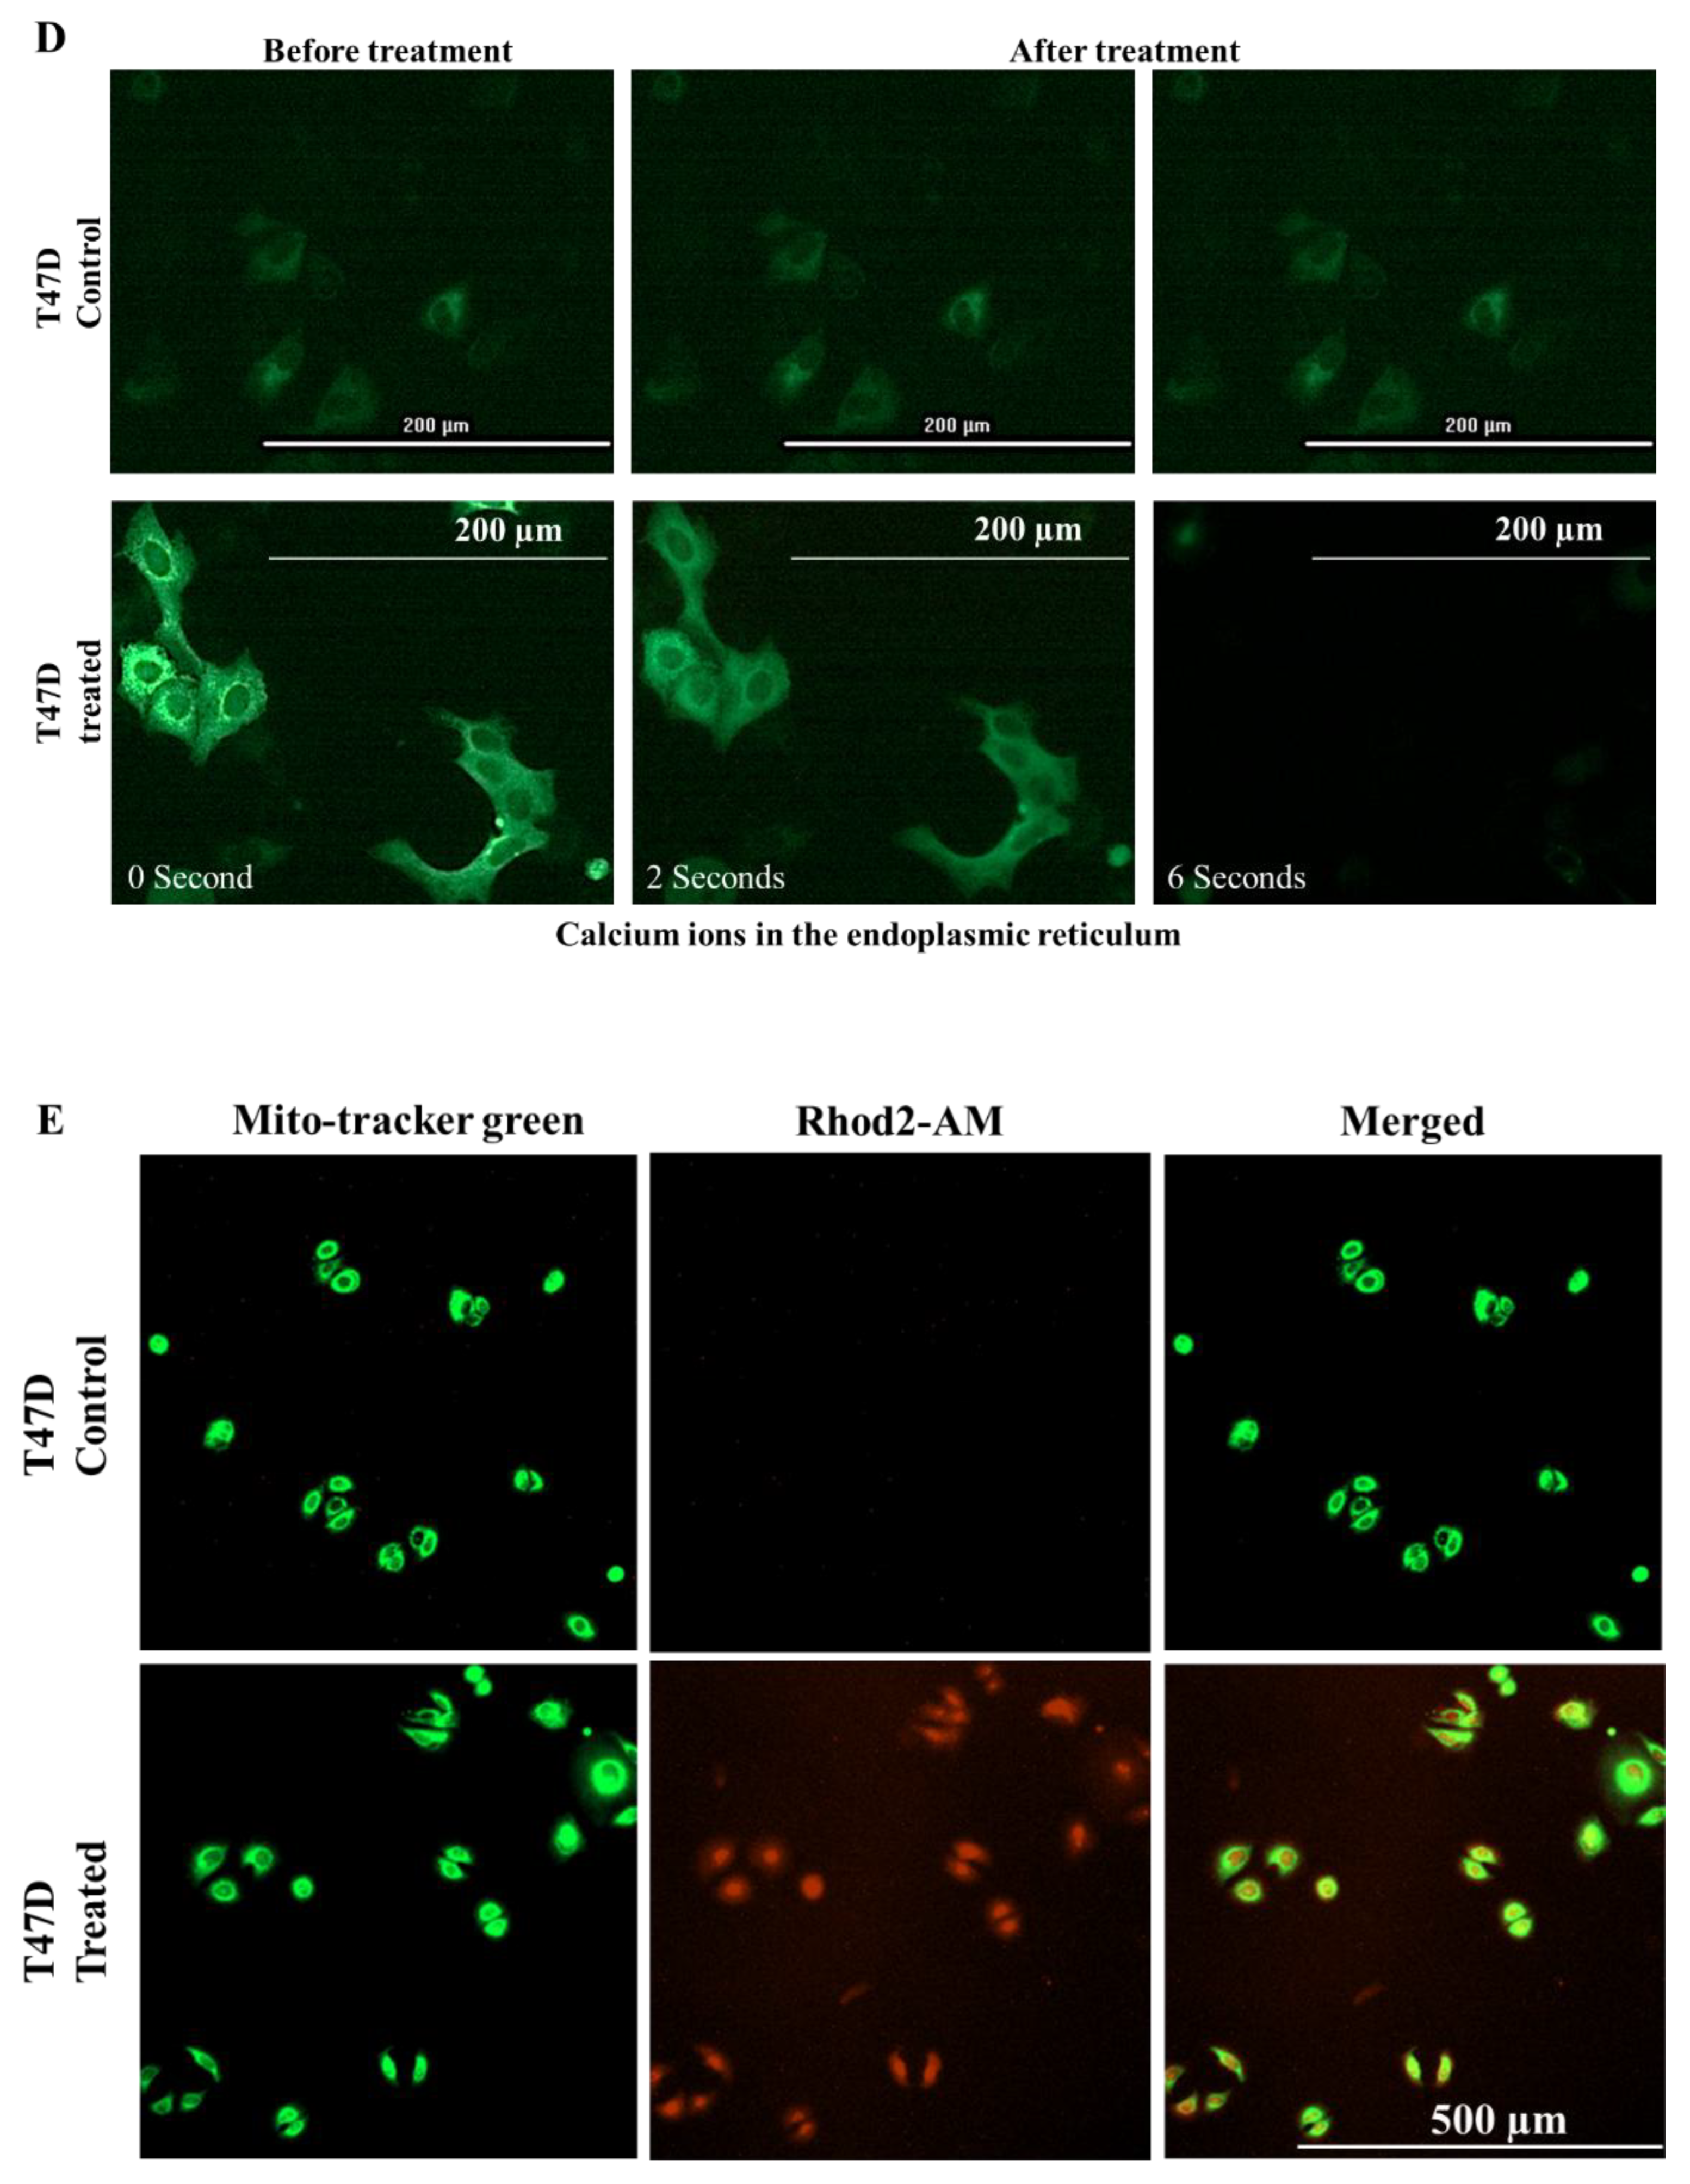
2.8. E. bicolor Diterpene Extract Induces ER-Dependent Apoptosis in T47D and MDA-MB-231 Cells
3. Discussion
4. Materials and Methods
4.1. Plant Extracts
4.2. Cell Lines and Cell Culture Conditions
4.3. Cell Culture Treatments
4.4. Antiproliferative Assays
4.5. IC50 Estimation
4.6. Visualization of Cytotoxic Effects
4.7. Detection of Apoptosis
4.8. Capsazepine Treatments to Block TRPV1
4.9. Calcium Chelation
4.10. Visualization of TRPV1 Activation
4.11. ROS Detection
4.12. N-acetyl-L-cysteine (NAC) Treatments to Block ROS Generation
4.13. Visualization of ER Calcium
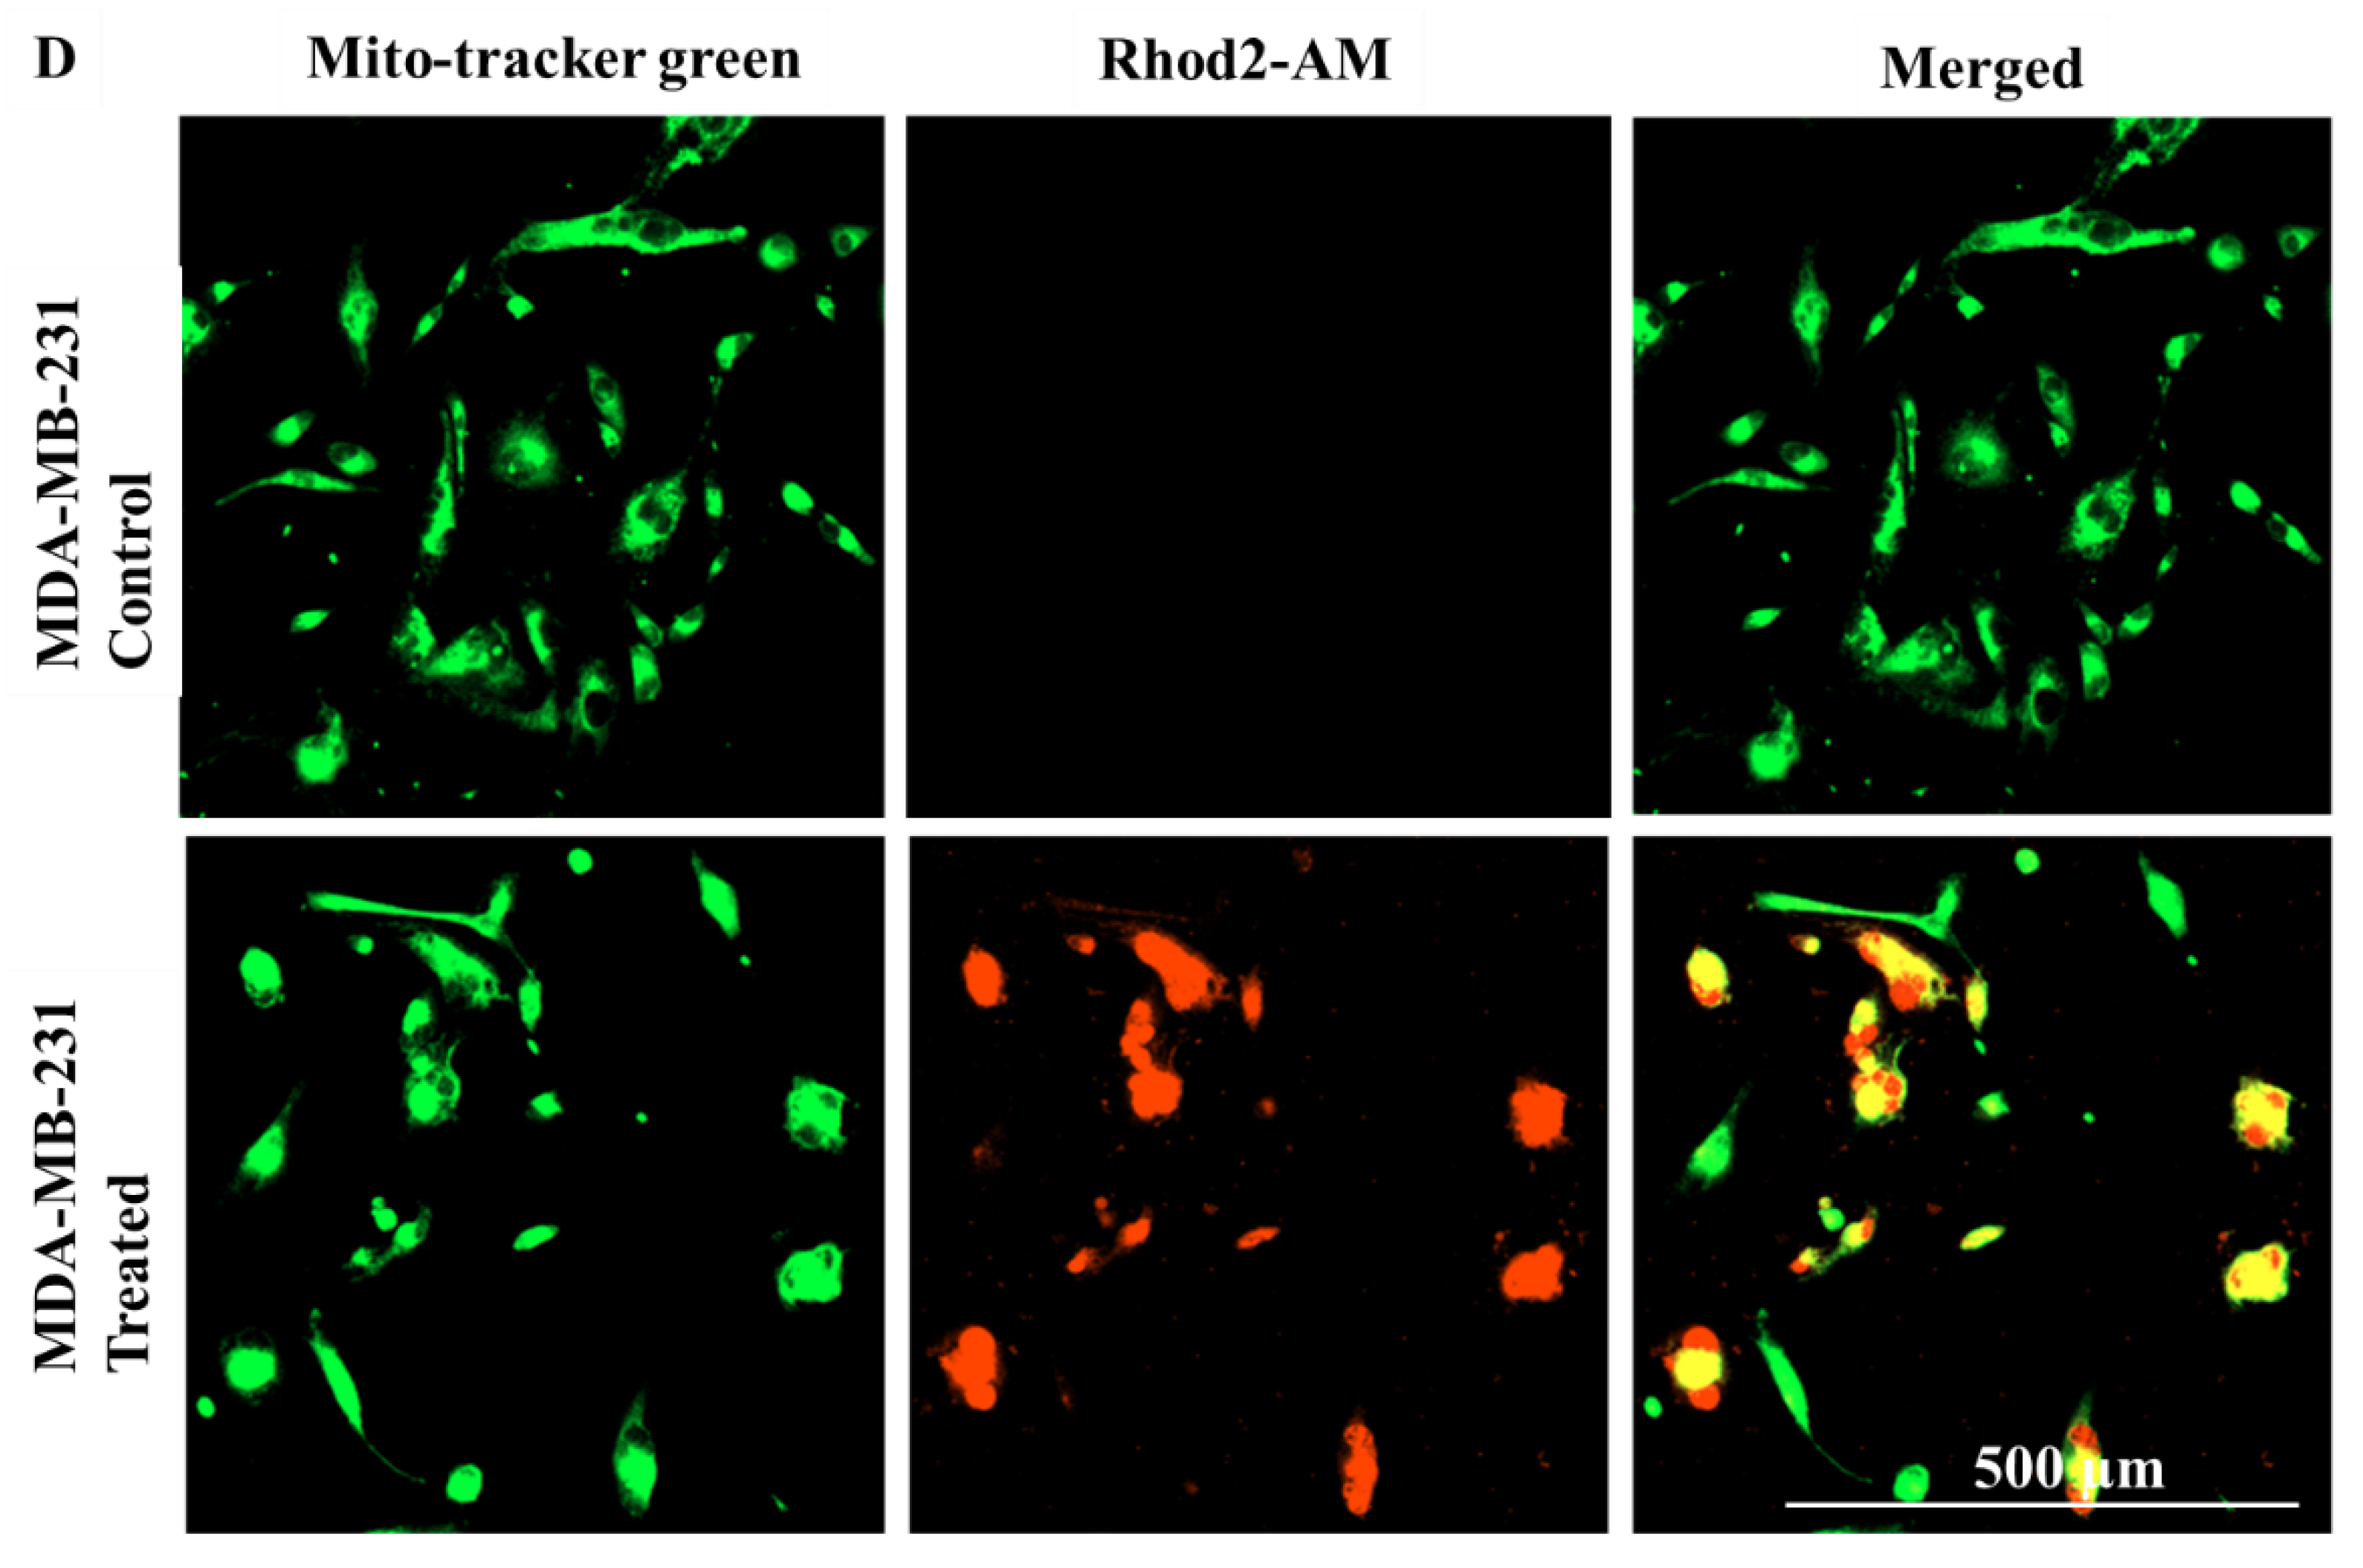
4.14. Visualization of Mitochondrial Calcium
4.15. Caspase 3 Activation Assay
4.16. Western Blotting
4.17. Statistical Analyses
5. Conclusions
Author Contributions
Funding
Data Availability Statement
Acknowledgments
Conflicts of Interest
References
- Kim, J.; Harper, A.; McCormack, V.; Sung, H.; Houssami, N.; Morgan, E.; Mutebi, M.; Garvey, G.; Soerjomataram, I.; Fidler-Benaoudia, M. Global patterns and trends in breast cancer incidence and mortality across 185 countries. Nat. Med. 2025, 31, 1154–1162. [Google Scholar] [CrossRef] [PubMed]
- Giaquinto, A.N.; Sung, H.; Miller, K.D.; Kramer, J.L.; Newman, L.A.; Minihan, A.; Jemal, A.; Siegel, R.L. Breast cancer statistics, 2022. CA Cancer J. Clin. 2022, 72, 524–541. [Google Scholar] [CrossRef]
- Siegel, R.L.; Miller, K.D.; Wagle, N.S.; Jemal, A. Cancer statistics, 2023. CA Cancer J. Clin. 2023, 73. [Google Scholar] [CrossRef]
- Chikara, S.; Nagaprashantha, L.D.; Singhal, J.; Horne, D.; Awasthi, S.; Singhal, S.S. Oxidative stress and dietary phytochemicals: Role in cancer chemoprevention and treatment. Cancer Lett. 2018, 413, 122–134. [Google Scholar] [CrossRef]
- Pucci, C.; Martinelli, C.; Ciofani, G. Innovative approaches for cancer treatment: Current perspectives and new challenges. Ecancermedicalscience 2019, 13. [Google Scholar] [CrossRef]
- Liu, Y.-Q.; Wang, X.-L.; He, D.-H.; Cheng, Y.-X. Protection against chemotherapy- and radiotherapy-induced side effects: A review based on the mechanisms and therapeutic opportunities of phytochemicals. Phytomedicine 2021, 80, 153402. [Google Scholar] [CrossRef]
- de Carvalho, A.P.A.; Conte-Junior, C.A. Health benefits of phytochemicals from Brazilian native foods and plants: Antioxidant, antimicrobial, anti-cancer, and risk factors of metabolic/endocrine disorders control. Trends Food Sci. Technol. 2021, 111, 534–548. [Google Scholar] [CrossRef]
- Alibakhshi, A.; Malekzadeh, R.; Hosseini, S.A.; Yaghoobi, H. Investigation of the therapeutic role of native plant compounds against colorectal cancer based on system biology and virtual screening. Sci. Rep. 2023, 13, 11451. [Google Scholar] [CrossRef] [PubMed]
- Khan, M.I.; Bouyahya, A.; Hachlafi, N.E.; Menyiy, N.E.; Akram, M.; Sultana, S.; Zengin, G.; Ponomareva, L.; Shariati, M.A.; Ojo, O.A. Anticancer properties of medicinal plants and their bioactive compounds against breast cancer: a review on recent investigations. Environ. Sci. Pollut. Res. 2022, 29, 24411–24444. [Google Scholar] [CrossRef] [PubMed]
- Shrihastini, V.; Muthuramalingam, P.; Adarshan, S.; Sujitha, M.; Chen, J.-T.; Shin, H.; Ramesh, M. Plant-derived bioactive compounds, their anti-cancer effects, and in silico approaches as an alternative target treatment strategy for breast cancer: An updated overview. Cancers 2021, 13, 6222. [Google Scholar] [CrossRef]
- Khan, T.; Ali, M.; Khan, A.; Nisar, P.; Jan, S.A.; Afridi, S.; Shinwari, Z.K. Anticancer plants: A review of active phytochemicals, applications in animal models, and regulatory aspects. Biomolecules 2019, 10, 47. [Google Scholar] [CrossRef]
- Tomiotto-Pellissier, F.; Gonçalves, M.D.; Silva, T.F.; Concato, V.M.; da Silva Bortoleti, B.T.; Arakawa, N.S.; Conchon-Costa, I.; Pavanelli, W.R.; Panis, C. Plant-derived diterpenes for breast cancer treatment: new perspectives and recent advances. Stud. Nat. Prod. Chem. 2022, 74, 41–80. [Google Scholar]
- Gao, X.; Li, X.; Ho, C.-T.; Lin, X.; Zhang, Y.; Li, B.; Chen, Z. Cocoa tea (Camellia ptilophylla) induces mitochondria-dependent apoptosis in HCT116 cells via ROS generation and PI3K/Akt signaling pathway. Food Res. Int. 2020, 129, 108854. [Google Scholar] [CrossRef]
- Xu, S.; Cheng, X.; Wu, L.; Zheng, J.; Wang, X.; Wu, J.; Yu, H.; Bao, J.; Zhang, L. Capsaicin induces mitochondrial dysfunction and apoptosis in anaplastic thyroid carcinoma cells via TRPV1-mediated mitochondrial calcium overload. Cell. Signal. 2020, 75, 109733. [Google Scholar] [CrossRef] [PubMed]
- Tajada, S.; Villalobos, C. Calcium permeable channels in cancer hallmarks. Front. Pharmacol. 2020, 11, 968. [Google Scholar] [CrossRef] [PubMed]
- Rumpa, M.M.; Maier, C. TRPV1-dependent antiproliferative activity of Maclura pomifera extracts in estrogen receptor positive breast cancer involves multiple apoptotic pathways. Int. J. Mol. Sci. 2024, 25, 5258. [Google Scholar] [CrossRef]
- Calixto, J.B.; Kassuya, C.A.; André, E.; Ferreira, J. Contribution of natural products to the discovery of the transient receptor potential (TRP) channels family and their functions. Pharmacol. Ther. 2005, 106, 179–208. [Google Scholar] [CrossRef] [PubMed]
- Zhang, M.; Ma, Y.; Ye, X.; Zhang, N.; Pan, L.; Wang, B. TRP (transient receptor potential) ion channel family: structures, biological functions and therapeutic interventions for diseases. Signal Transduct. Target. Ther. 2023, 8, 261. [Google Scholar] [CrossRef]
- Rosenberger, D.C.; Binzen, U.; Treede, R.-D.; Greffrath, W. The capsaicin receptor TRPV1 is the first line defense protecting from acute non damaging heat: a translational approach. J. Transl. Med. 2020, 18, 1–16. [Google Scholar] [CrossRef]
- Asadi-Samani, M.; Rafieian-Kopaei, M.; Lorigooini, Z.; Shirzad, H. The effect of Euphorbia szovitsii Fisch. & CAMey extract on the viability and the proliferation of MDA-MB-231 cell line. Biosci. Rep. 2019, 39. [Google Scholar]
- Bao, Z.; Dai, X.; Wang, P.; Tao, Y.; Chai, D. Capsaicin induces cytotoxicity in human osteosarcoma MG63 cells through TRPV1-dependent and-independent pathways. Cell Cycle 2019, 18, 1379–1392. [Google Scholar] [CrossRef] [PubMed]
- Nie, R.; Liu, Q.; Wang, X. TRPV1 is a potential tumor suppressor for its negative association with tumor proliferation and positive association with antitumor immune responses in pan-cancer. J. Oncol. 2022, 6964550. [Google Scholar] [CrossRef]
- Weber, L.V.; Al-Refae, K.; Wölk, G.; Bonatz, G.; Altmüller, J.; Becker, C.; Gisselmann, G.; Hatt, H. Expression and functionality of TRPV1 in breast cancer cells. Breast Cancer Targets Ther. 2016, 243–252. [Google Scholar] [CrossRef]
- Zhai, K.; Liskova, A.; Kubatka, P.; Büsselberg, D. Calcium entry through TRPV1: A potential target for the regulation of proliferation and apoptosis in cancerous and healthy cells. Int. J. Mol. Sci. 2020, 21, 4177. [Google Scholar] [CrossRef]
- Bujak, J.K.; Kosmala, D.; Szopa, I.M.; Majchrzak, K.; Bednarczyk, P. Inflammation, cancer and immunity-implication of TRPV1 channel. Front. Oncol. 2019, 9, 1087. [Google Scholar] [CrossRef]
- Nogueira, M.L.; Fava, W.S.; Correia, J.B.; et al. Medicinal species of the genus croton (Euphorbiaceae): a worldwide view on the dynamics and evolution of scientific production. Rev. Gest. Soc. Ambient. 2024, 18, e04476. [Google Scholar] [CrossRef]
- Zhao, H.; Sun, L.; Kong, C.; Mei, W.; Dai, H.; Xu, F.; Huang, S. Phytochemical and pharmacological review of diterpenoids from the genus Euphorbia Linn (2012–2021). J. Ethnopharmacol. 2022, 298, 115574. [Google Scholar] [CrossRef] [PubMed]
- Radi, M.H.; El-Shiekh, R.A.; El-Halawany, A.M.; Al-Abd, A.M.; Abdel-Sattar, E. In vitro cytotoxic study of Euphorbia grantii Oliv. aerial parts against MCF-7 and MCF-7ADR breast cancer cell lines: A bioactivity-guided isolation. ACS Omega 2023, 8, 18299–18305. [Google Scholar] [CrossRef]
- Basu, P.; Tongkhuya, S.A.; Harris, T.L.; et al. Euphorbia bicolor (Euphorbiaceae) latex phytochemicals induce long-lasting non-opioid peripheral analgesia in a rat model of inflammatory pain. Front. Pharmacol. 2019, 10, 958. [Google Scholar] [CrossRef]
- Benjamaa, R.; Moujanni, A.; Kaushik, N.; Choi, E.H.; Essamadi, A.K.; Kaushik, N.K. Euphorbia species latex: A comprehensive review on phytochemistry and biological activities. Front. Plant Sci. 2022, 13, 1008881. [Google Scholar] [CrossRef] [PubMed]
- Yang, Y.; Chen, X.; Luan, F.; et al. Euphorbia helioscopia L.: A phytochemical and pharmacological overview. Phytochemistry 2021, 184, 112649. [Google Scholar] [CrossRef]
- Basu, P.; Meza, E.; Bergel, M.; Maier, C. Estrogenic, antiestrogenic and antiproliferative activities of Euphorbia bicolor (Euphorbiaceae) latex extracts and its phytochemicals. Nutrients 2020, 12, 59. [Google Scholar] [CrossRef]
- Sadeghi-Aliabadi, H.; Sajjadi, S.E.; Khodamoradi, M. Cytotoxicity of Euphorbia macroclada on MDA-MB-468 breast cancer cell line. Iran. J. Pharm. Sci. 2009, 5, 103–108. [Google Scholar]
- Elokely, K.; Velisetty, P.; Delemotte, L.; et al. Understanding TRPV1 activation by ligands: Insights from the binding modes of capsaicin and resiniferatoxin. Proc. Natl. Acad. Sci. USA 2016, 113, E137–E145. [Google Scholar] [CrossRef] [PubMed]
- Farfariello, V.; Liberati, S.; Morelli, M.B.; et al. Resiniferatoxin induces death of bladder cancer cells associated with mitochondrial dysfunction and reduces tumor growth in a xenograft mouse model. Chem. Biol. Interact. 2014, 224, 128–135. [Google Scholar] [CrossRef] [PubMed]
- Hua, H.; Zhang, H.; Chen, J.; Wang, J.; Liu, J.; Jiang, Y. Targeting Akt in cancer for precision therapy. J. Hematol. Oncol. 2021, 14, 128. [Google Scholar] [CrossRef] [PubMed]
- Chiang, J.-H.; Tsai, F.-J.; Hsu, Y.-M.; et al. Sensitivity of allyl isothiocyanate to induce apoptosis via ER stress and the mitochondrial pathway upon ROS production in colorectal adenocarcinoma cells. Oncol. Rep. 2020, 44, 1415–1424. [Google Scholar] [CrossRef]
- Arnold, M.; Morgan, E.; Rumgay, H.; et al. Current and future burden of breast cancer: Global statistics for 2020 and 2040. Breast 2022, 66, 15–23. [Google Scholar] [CrossRef]
- Siddiqui, A.J.; Jahan, S.; Singh, R.; et al. Plants in anticancer drug discovery: from molecular mechanism to chemoprevention. Biomed Res. Int. 2022, 5425485. [Google Scholar] [CrossRef]
- Kwan, Y.P.; Saito, T.; Ibrahim, D.; et al. Evaluation of the cytotoxicity, cell-cycle arrest, and apoptotic induction by Euphorbia hirta in MCF-7 breast cancer cells. Pharmaceutical biology. Pharm. Biol. 2016, 54, 1223–1236. [Google Scholar]
- Taş, A.; Şahin Bölükbaşı, S.; Çevik, E.; Ozmen, E.; Gümüş, E.; Siliğ, Y. An in vitro study of cytotoxic activity of Euphorbia macroclada Boiss on MCF-7 cells. Indian J. Pharm. Educ. Res. 2018, 52. [Google Scholar] [CrossRef]
- Choene, M.; Motadi, L. Validation of the antiproliferative effects of Euphorbia tirucalli extracts in breast cancer cell lines. Mol. Biol. 2016, 50, 98–110. [Google Scholar] [CrossRef]
- Monteith, G.R.; McAndrew, D.; Faddy, H.M.; Roberts-Thomson, S.J. Calcium and cancer: Targeting Ca²⁺ transport. Nat. Rev. Cancer 2007, 7, 519–530. [Google Scholar] [CrossRef]
- Varghese, E.; Samuel, S.M.; Sadiq, Z.; et al. Anti-cancer agents in proliferation and cell death: the calcium connection. International journal of molecular sciences. Int. J. Mol. Sci. 2019, 20, 3017. [Google Scholar] [CrossRef]
- Wu, T.T.; Peters, A.A.; Tan, P.T.; Roberts-Thomson, S.J.; Monteith, G.R. Consequences of activating the calcium-permeable ion channel TRPV1 in breast cancer cells with regulated TRPV1 expression. Cell Calcium 2014, 56, 59–67. [Google Scholar] [CrossRef]
- Zhu, A.; Sun, Y.; Zhong, Q.; et al. Effect of euphorbia factor L1 on oxidative stress, apoptosis, and autophagy in human gastric epithelial cells. Phytomedicine 2019, 64, 152929. [Google Scholar] [CrossRef] [PubMed]
- Hsieh, W.-T.; Lin, H.-Y.; Chen, J.-H.; et al. Latex of Euphorbia antiquorum induces apoptosis in human cervical cancer cells via c-jun n-terminal kinase activation and reactive oxygen species production. Nutr. Cancer 2011, 63, 1339–1347. [Google Scholar] [CrossRef]
- Ma, L.; Chen, Z.; Li, J.; et al. DP from Euphorbia fischeriana S. mediated apoptosis in leukemia cells via the PI3k/Akt signaling pathways. J. Ethnopharmacol. 2021, 279, 113889. [Google Scholar] [CrossRef]
- Baev, A.Y.; Vinokurov, A.Y.; Novikova, I.N.; et al. Interaction of mitochondrial calcium and ROS in neurodegeneration. Cells 2022, 11, 706. [Google Scholar] [CrossRef]
- De Nicolo, B.; Cataldi-Stagetti, E.; Diquigiovanni, C.; Bonora, E. Calcium and reactive oxygen species signaling interplays in cardiac physiology and pathologies. Antioxidants 2023, 12, 353. [Google Scholar] [CrossRef] [PubMed]
- Rajendran, P.; Maheshwari, U.; Muthukrishnan, A.; et al. Myricetin: Versatile plant based flavonoid for cancer treatment by inducing cell cycle arrest and ROS–reliant mitochondria-facilitated apoptosis in A549 lung cancer cells and in silico prediction. Mol. Cell. Biochem. 2021, 476, 57–68. [Google Scholar] [CrossRef]
- Zhao, X.; Tao, X.; Xu, L.; et al. Dioscin induces apoptosis in human cervical carcinoma HeLa and SiHa cells through ROS-mediated DNA damage and the mitochondrial signaling pathway. Molecules 2016, 21, 730. [Google Scholar] [CrossRef]
- Almilaibary, A. Phyto-therapeutics as anti-cancer agents in breast cancer: Pathway targeting and mechanistic elucidation. Saudi J. Biol. Sci. 2024, 103935. [Google Scholar] [CrossRef]
- Marchi, S.; Patergnani, S.; Missiroli, S.; et al. Mitochondrial and endoplasmic reticulum calcium homeostasis and cell death. Cell Calcium 2018, 69, 62–72. [Google Scholar] [CrossRef]
- Alkhalaf, M.; El-Mowafy, A.; Renno, W.; et al. Resveratrol-induced apoptosis in human breast cancer cells is mediated primarily through the caspase-3-dependent pathway. Arch. Med. Res. 2008, 39, 162–168. [Google Scholar] [CrossRef]
- Archanjo, A.B.; de Paula Careta, F.; Costa, A.V.; et al. Evaluation of cytotoxicity and expression of caspase-3 and p53 in HCT-116 cells of lineage treated with different extracts of Euphorbia tirucalli L. Arch. Vet. Sci. 2016, 21. [Google Scholar] [CrossRef]
- Fu, Z.-Y.; Han, X.-D.; Wang, A.-H.; Liu, X.-B. Apoptosis of human gastric carcinoma cells induced by Euphorbia esula latex. World J. Gastroenterol. 2016, 22, 3564. [Google Scholar] [CrossRef] [PubMed]
- Basu, A. The interplay between apoptosis and cellular senescence: Bcl-2 family proteins as targets for cancer therapy. Pharmacol. Ther. 2022, 230, 107943. [Google Scholar] [CrossRef]
- Antonsson, B.; Montessuit, S.; Sanchez, B.; Martinou, J.-C. Bax is present as a high molecular weight oligomer/complex in the mitochondrial membrane of apoptotic cells. J. Biol. Chem. 2001, 276, 11615–11623. [Google Scholar] [CrossRef] [PubMed]
- Kim, S.; Kang, C.; Shin, C.Y.; et al. TRPV1 recapitulates native capsaicin receptor in sensory neurons in association with Fas-associated factor 1. J. Neurosci. 2006, 26, 2403–2412. [Google Scholar] [CrossRef]
- Abd El-Hafeez, A.A.; Marzouk, H.M.M.; Abdelhamid, M.A.; et al. Anti-cancer effect of Hyoscyamus muticus extract via its activation of Fas/FasL-ASK1-p38 pathway. Biotechnol. Bioprocess Eng. 2022, 27, 833–845. [Google Scholar] [CrossRef]
- Zhao, R.; Tsang, S.Y. Versatile roles of intracellularly located TRPV1 channel. Journal of Cellular Physiology. J. Cell. Physiol. 2017, 232, 1957–1965. [Google Scholar] [CrossRef] [PubMed]
- Park, S.-M.; Kang, T.-I.; So, J.-S. Roles of XBP1s in transcriptional regulation of target genes. Biomedicines 2021, 9, 791. [Google Scholar] [CrossRef] [PubMed]
- Hu, H.; Tian, M.; Ding, C.; Yu, S. The C/EBP homologous protein (CHOP) transcription factor functions in endoplasmic reticulum stress-induced apoptosis and microbial infection. Front. Immunol. 2019, 9, 3083. [Google Scholar] [CrossRef]
- He, Y.; Sun, M.M.; Zhang, G.G.; et al. Targeting PI3K/Akt signal transduction for cancer therapy. Signal Transduct. Target. Ther. 2021, 6, 425. [Google Scholar] [CrossRef] [PubMed]
- Yang, J.; Nie, J.; Ma, X.; et al. Targeting PI3K in cancer: mechanisms and advances in clinical trials. Mol. Cancer 2019, 18, 26. [Google Scholar] [CrossRef]
- Bou Zerdan, M.; Ghorayeb, T.; Saliba, F.; et al. Triple negative breast cancer: updates on classification and treatment in 2021. Cancers 2022, 14, 1253. [Google Scholar] [CrossRef]
- Beňačka, R.; Szabóová, D.; Guľašová, Z.; et al. Classic and new markers in diagnostics and classification of breast cancer. Cancers 2022, 14, 5444. [Google Scholar] [CrossRef]
- Chen, X.; Li, H. Bruceine D and Narclasine inhibit the proliferation of breast cancer cells and the prediction of potential drug targets. PLoS One 2024, 19, e0297203. [Google Scholar] [CrossRef]
- Tidgewell, K.J. Development of novel analgesics from the neoclerodane diterpene natural product salvinorin A. Ph.D. Thesis, University of Iowa, 2007. [Google Scholar]
Disclaimer/Publisher’s Note: The statements, opinions and data contained in all publications are solely those of the individual author(s) and contributor(s) and not of MDPI and/or the editor(s). MDPI and/or the editor(s) disclaim responsibility for any injury to people or property resulting from any ideas, methods, instructions or products referred to in the content. |
© 2025 by the authors. Licensee MDPI, Basel, Switzerland. This article is an open access article distributed under the terms and conditions of the Creative Commons Attribution (CC BY) license (http://creativecommons.org/licenses/by/4.0/).


