
Submitted:
04 August 2025
Posted:
06 August 2025
You are already at the latest version
Abstract
Background: Breast cancer is a common and chronic condition, and despite improvements in diagnosis, treatment, and prevention, the number of cases of breast cancer is rising annually. New therapeutic drugs that target specific checkpoints should be created to fight breast cancer. Mandragora autumnalis is considered one of the most important medicinal plants and has significant cultural value as an herb; however, little is known about its anti-cancerous biological activity and chemopreventive molecular pathways against the triple-negative breast cancer (MDA-MB-231) cell line. Methods: The present study aimed to determine the phytochemical content of Mandragora autumnalis leaves ethanolic extract (MAE), both qualitatively and quantitatively. Evaluations were conducted on its anti-oxidant properties, anti-cancer properties, and underlying molecular mechanisms. Results: Results showed that MAE reduced the viability of MDA-MB-231 cells in a concentration and time-dependent manner. While MAE exhibited radical scavenging activity in the DPPH assay, it also caused an increase in reactive oxygen species (ROS) production in MDA-MB-231 cells, however, the antioxidant N-acetyl cysteine (NAC) blocked this effect. Additionally, MAE caused an increase in the tumor suppressor p53. Moreover, this extract caused a significant decrease in the levels of the cell proliferation marker and the transcription factor , Ki67, MMP-9 and STAT-3 respectively. Also, MAE altered cell cycle, cell migration, angiogenesis, invasion, aggregation, and adhesion to suppress cellular processes linked to metastasis. Conclusions: All of our research points to MAE's potential to function as an anticancer agent and opens up new possibilities for the development of innovative triple-negative breast cancer treatments.
Keywords:
mandragora autumnalis
; phytochemistry
; antioxidant
; anti-cancerous activity
; triple nega-tive breast cancer cells
1. Introduction
Breast cancer is one of the many common malignant tumors that affect women[1]. Numerous internal and external factors contribute to the development and occurrence of breast cancer[2]. The milk duct is often the site of emergence; lobules are the site of less serious cases. Cancers that affect the ductal region are referred to as ductal carcinomas, and those that affect the mammary lobules are known as lobular carcinomas[3]. Triple-negative breast cancers, or TNBCs, are considered aggressive forms of breast cancer and result from reduced expression of the human growth factor receptor 2 as well as the progesterone and estrogen receptors[4]. Natural recurrence occurs in TNBCs, which account for 12–17% of all breast cancer cases. Compared to other subtypes of breast cancer, their clinical behavior is comparatively more aggressive. Furthermore, TNBCs account for 24% of newly diagnosed breast cancers, and their incidence has been reported to be steadily rising. These cancers also have poor prognoses and typical metastatic patterns where the average survival rate is approximately 10.2 months; for regional tumors, the 5-year survival rate is 65%, and for tumors that have spread to distant organs, it is 11%[5,6,7]. Globally, the incidence of breast cancer is increasing along with the disease's burden, making breast cancer an important public health concern[8]. Due to population growth and aging, it is predicted that the incidence of breast cancer will increase by more than 40% by 2040, reaching roughly 3 million cases annually. In a similar vein, over 50% more people will die from breast cancer in 2040[9]. Breast cancer has been linked to several established risk factors, such as late menopause, advanced age at first birth, fewer children, decreased breastfeeding, menopausal hormone replacement therapy, oral contraceptives, alcohol consumption, and excess body weight[10].
The use of phytonutrients, also known as nutraceuticals and herbal medicines, is still growing worldwide, with many people turning to these products in various national healthcare settings to treat various health issues. For years, herbal remedies have been used as anticancer medications. They also have anti-inflammatory properties and many anticancer ingredients that have been shown to have direct cytotoxic effects and indirect actions on the tumor microenvironment, cancer immunity, and chemotherapy progression[11,12]. From 200 to 1800 AD, according to Aristotle and Galen's teachings, cancer was thought to be caused by the coagulation of "black bile." Until recently, when the prevalence of biology has led to a 25% decrease in mortality, herbs were crucial in managing cancer symptoms and improving the quality of life and survival of patients with the disease[13]. Compared to conventional chemical drugs, herbal medicine fights cancer in a significantly different way, as it prevents DNA mutation in surviving cells. Another benefit of herbal medicines is that they can create an environment that is unfavorable to the growth of cancer[14].
The Mandragora autumnalis plant has been prized as one of the most significant medicinal plants and has had great cultural significance as an herb since ancient times. It was remarkably used throughout history. Mandragora has a wide range of uses, including medicinal, hallucinogenic, and boosting ovulation. Furthermore, Mandragora autumnalis possesses a narcotic effect, which is most likely caused by the presence of an alternative form of alkaloids[15]. The plant genus Mandragora, a member of the Solanaceae family, is commonly known as "mandrake". Historically, various parts of the Mandragora species, including the root, fruit, and leaves, have been used to treat conditions like ulcers, inflammation, sleeplessness, and eye health issues. The mandrake plant has been used for centuries as a valuable and traditional herbal medicine; however, little research has been conducted on its biological activity and potential phytochemicals [16,17,18].
In this work, we used Liquid Chromatography Mass Spectrometry (LC-MS) analytical examination and qualitative assays to examine the phytochemical composition of Mandragora autumnalis ethanolic leaf extract (MAE). Using the MDA-MB-231 cell line, we also investigated the anticancer potential of MAE by examining its effects on cell proliferation, the induction of apoptosis, and various hallmarks of cancer metastasis on a molecular level, including adhesion, invasion, cell cycle, angiogenesis, migration, and aggregation in TNBC.
2. Results
2.1. Phytochemical Composition, Total Phenolic, and Total Flavonoid Content (TPC and TFC) Assays
The presence of various primary and secondary bioactive metabolites, including terpenoids, tannins, fatty acids, flavonoids, phenols, and steroids, was revealed by a qualitative phytochemical screening of the MAE crude extract (Table 1).
A large class of secondary metabolites known as polyphenolic compounds is responsible for most plants' antioxidant qualities. Our results showed that the TPC of MAE is 58.98±7.40 mg GAE/g and TFC is 36.47±0.87 mg QE/g, as shown in Table 2.
2.2. LC-MS Analysis of MAE Extract
The mass-to-charge ratios (m/z) and retention times (RT) of 34 compounds were determined by LC-MS analysis of MAE in both positive and negative ionization. The LC-MS analysis in positive ionization mode (Table 3A, Figure 1) revealed a chemically diverse profile consisting of multiple classes of bioactive compounds. The most abundant group was alkaloids, represented by hyoscyamine, tropine, methylisopelletierine, tropinone, and solacaproine. The phenolic compounds group was marked by the presence of chlorogenic acid, and flavonoids were identified through the detection of quercetin and chrysin. Fatty acid derivatives were another major group, including hexadecanamide (palmitic amide), ethyl palmitate, ethyl oleate, linoleic acid, and ethyl linolenate. Esters such as ethyl 3-hydroxybutanoate, 3-(methylthio)propyl acetate, and ethyl hydrocinnamate were also detected in notable quantities. Additionally, furan derivatives like 5-hydroxymethyl-2-furancarboxaldehyde and ketones and aldehydes such as 1-hydroxy-2-propanone acetate and β-ionone were present. A unique compound, simulanoquinoline, representing the quinoline alkaloids, was also observed. On the other hand, among the principal compounds detected under negative ionization mode (Table 3B, Figure 1) were polyphenolic acids and their derivatives, including chlorogenic acid with a high intensity, and caffeic acid. Also, Linolenic acid, a polyunsaturated fatty acid, and coumarins with their derivatives, including scopoletin, and 4-Methylumbelliferyl acetate, were present. Furthermore, flavonoids and glycosides, including rutin and Hyperoside, are identified. All things considered, these results show MAE has a rich phytochemical profile, bolstering its potential as a source of bioactive compounds for additional pharmacological research.
2.3. MAE Extract Has a Potent Radical Scavenging Potential
The results of this investigation demonstrated concentration-dependent free-radical scavenging activity for MAE extract (Figure 2). MAE demonstrated a high reducing power, where the DPPH free radical scavenging of MAE at a concentration of 600 µg/mL was 54.94 ± 0.89%. The TPC, TFC, and LC-MS data are consistent with these results, indicating that the extract's antioxidant capacity increases with phenolic and flavonoid concentration.
2.4. MAE Significantly Inhibits the Proliferation of MDA-MB-231 Cells
To examine the potential anti-proliferative impact of MAE extract on breast cancer, different concentrations of each extract (0, 50, 100, 200, 400, and 600 μg/mL) were examined at 24, 48, and 72 hours of treatment. Findings indicate that MAE treatment reduced the viability of cells in a concentration- and time-dependent manner. After 48 hr of treatment with 50, 100, 200, 400, and 600 µg/mL of MAE, the proliferation of MDAMB-231 cells was 92.18±7.32, 66.66±8.82, 22.67±0.17, 17.19± 0.92,18.00± 1.42 % respectively (Figure 3A). Using the MTT assay, the IC50 of MAE was 467.28, 132.33, and 109.4 µg/mL at 24, 48, and 72 h. Based on that and the IC50 values, 100 and 200 µg/mL of MAE were used in further experiments. Crucially, the viability assay against MDA-MB-231 cells revealed that DOXO was more harmful to MDA-MB-231 cells with a CC50 of 0.0036 µg/mL after 72 hours (Figure 3B).
To examine the potential correlation between the antiproliferative effects of the extracts and the generation of ROS induced by MAE, MDAMB-231 cells were pretreated with N-acetyl cysteine (NAC), a ROS scavenger[19]. The findings indicated that NAC significantly reduced NAC-mediated cell death (Figure 3C). Specifically, the viability of cells treated with 100 μg/mL MAE for 24 hours was 64.33% ± 0.007% in the absence of NAC and was significantly increased to 165.36% ± 0.001% when cells were pre-treated with NAC. Similarly, the viability of cells treated with 200 μg/mL MAE was 36.25% ± 0.002% in the absence of NAC, and NAC pretreatment significantly elevated cell viability to 281.47% ± 0.01%. These results suggest that MAE exerts its anti-proliferative effect in TNBC cells through a ROS-dependent mechanism.
To further validate MAE's anti-proliferative properties, protein lysates from MAE-treated cells were immunoblotted with an anti-Ki67 antibody, which is strongly linked to the proliferation of cancer cells. Ki67 is highly expressed in TNBC and is a known predictive and prognostic marker for many cancers[20]. The treatment of MDA-MB-231 cells with MAE at 200 µg/mL significantly reduced Ki67 protein levels in a concentration-dependent manner by 0.47±0.07 fold, in comparison to the vehicle-treated control cells, as shown in Figure 3D. These findings demonstrate that MAE inhibits MDA-MB-231 cells' ability to proliferate by interfering with their growth.
2.5. MAE Induces Intrinsic apoptosis in MDA-MB-231 Cells
After subjecting MDA-MB-231 cells to a 24-hour MAE treatment, the cells were viewed under an inverted phase-contrast microscope. The morphological observation of MAE-treated cells showed a concentration-dependent decrease in the total number of cells per microscopic field. Furthermore, MAE-treated cells displayed characteristics of apoptosis. At higher magnifications, apoptotic bodies were visible along with cytoplasmic shrinkage, loss of epithelial morphology, membrane blebbing, and rounded shape in the cells (Figure 4A). Additional examination of MAE-treated cells using DAPI staining demonstrated the development of apoptotic bodies, chromatin lysis, and nuclear condensation (Figure 4B). Next, we aimed to confirm that cells treated with MAE undergo activated apoptosis. To achieve this, we first assessed the levels of procaspase-3, a protein that is essential to apoptosis[21]. Western blotting was used to analyze the protein levels of the apoptosis effector enzyme pro-Caspase 3 and its cleavage products in order to confirm that MAE activated apoptosis. The results showed reduced levels of the Pro-Caspase 3 protein in a concentration-dependent manner.
The levels of procaspase-3 in cells treated with MAE at 200 μg/mL decreased significantly, reaching 0.54 ± 0.12-fold (Figure 4C). The levels of cleaved caspase 3 fragments were also markedly elevated by MAE treatment concurrently. The increase in Caspase3 cleavage products was significant, with a 1.27±0.02 increase at 200 μg/mL of MAE. This implies that the intrinsic cascade of apoptosis was initiated by MAE extracts, which caused the proteolytic cleavage of pro-Caspase 3 into its active form, caspase 3.
Another anti-apoptotic protein known to be important for the intrinsic apoptosis pathway is B-cell lymphoma 2 (Bcl-2)[22]. According to our findings, MAE significantly reduced Bcl-2 protein levels to reach 0.70±0.05 decrease at 200 µg/mL of MAE compared to the control (Figure 4C). Bcl-2-associated X-protein (Bax), a pro-apoptotic protein, is another apoptosis regulator[23]. In our investigation, cells treated with 200 µg/mL MAE showed significantly higher Bax levels with 1.64±0.02 fold (Figure 4C). These findings suggest that MAE targets apoptotic pathways to mediate its anticancer effects.
2.6. MAE Enhances the Aggregation of MDA-MB231 Cells
Epithelial-mesenchymal transition (EMT), a process where epithelial cells acquire a mesenchymal phenotype characterized by a decrease in cell-cell adhesion and enhanced migratory and invasive capabilities, which is one of the hallmarks of cancer progression towards metastasis[24]. An aggregation assay was used to assess how MAE affected the MDA-MB-231 cells' cell-cell adhesion characteristics. As demonstrated in Figure 5, there was a concentration-dependent rise in cell-cell aggregates following the treatment of cells with 100 and 200 µg/mL MAE, with significant increases of 73.39 ±12.35 and 80.80±8.86 %, respectively. One of the main constituents of adherens junctions, which are specialized structures that facilitate robust cell-cell adhesion in epithelial tissues, is E-cadherin, also known as epithelial cadherin[25]. Particularly in TNBC, E-cadherin downregulation facilitates the migration of breast cancer cells through the extracellular matrix and their invasion of blood and lymphatic vessels, and encourages the spread of disease to other organs. E-cadherin protein levels were raised in MDA-MB-231 cells treated with 100 and 200 µg/mL MAE in a dose-dependent manner, and significantly at 200 µg/mL, there was a discernible difference from the control, with a 1.67 ± 0.22-fold change.
2.7. MAE Lowers the Adhesion Potential of MDA Cells
Integrins, among other members of the adhesion molecule family, are the primary mediators of cell-ECM interaction. Elevated integrin β1 expression confers survival benefits to cancer cells and is linked to their capacity for migration and metastasis[26]. As seen in Figure 6A, the treatment of cells with 100 and 200 µg/mL MAE significantly reduced their adhesive abilities to 53.14103 ± 0.08237 and 48.45218 ± 0.031702%, respectively, compared to the control cells. Here, the application of 100 and 200 µg/mL MAE to MDA-MB-231 cells resulted in a significant decrease in the concentration-dependent increase in integrin β1 protein levels by 0.68 and 0.60-fold, contrasted, in turn, with the control cells that were subjected to the vehicle (Figure 6B). All of these findings support the hypothesis that MAE disrupts the integrin-ECM axis, which may limit MDA cells' ability to spread.
2.8. MAE Decreases MDA Cells' Ability to Migrate
Cell migration is crucial during physiological processes like immune responses, wound healing, and embryonic morphogenesis. It is also a crucial process that plays a major role in the early stages of cancer metastasis and is a primary feature of a malignant phenotype[27]. Using the wound-healing assay, the impact of MAE extract on MDA cell migration was investigated. MAE reduced the MDA cells' ability to migrate and fill the wound in a concentration- and time-dependent manner, as shown in Figure 7A. For instance, treating MDA cells with 100 and 200 μg/mL of MAE significantly decreased their migration ability by 0.59 ± 0.13 and 0.40±0.07 fold, respectively, compared to the control cells. These results were further confirmed by the transwell migration assay. MAE treatment significantly reduced MDA-MB-231 cells' capacity to migrate from the upper to the lower chamber Figure 7B.
2.9. MAE Inhibits the Invasive Properties of MDA Cells
An important stage in the initial phases of the cancer metastatic cascade, in which cancer cells spread from the primary tumor site and invade secondary sites, is the invasion of other tissues[28]. When compared to the control, MAE treatment significantly decreased the invasive potential of MDA-MB-231 cells in a dose-dependent manner using the Matrigel-coated trans-well chambers by 0.45±0.13 and 0.26±0.03 fold for 100 and 200 µg/mL, respectively (Figure 8).
STAT3 is a well-known and important participant in the development of tumors. Thus, focusing on the STAT3 pathway is a viable approach for creating new cancer medications because it stimulates the migration and invasion of cancer cells, prevents apoptosis, and promotes cell proliferation[29]. We measured the amount of the active phosphorylated form of STAT3 in MAE-treated MDA-MB-231 cells to see if Mandragora autumnalis mediates its anticancer activity by targeting the STAT3 pathway. Our findings demonstrated that, in comparison to the control, MAE treatment at 100 and 200 µg/mL significantly decreased the levels of STAT3 by 0.65 ± 0.08 and 0.48 ± 0.11 fold, respectively (Figure 8). This finding implies that the downregulation of the STAT3 signaling pathway is a necessary component of the MAE-mediated impact of TNBC progression and metastasis. Also, one widely known mechanism that encourages the migration and invasion of cancer cells is the breakdown of the extracellular matrix (ECM) by matrix metalloproteinases (MMPs)[30]. MMP-9 activity levels were significantly reduced by 200μg/mL MAE with 0.57 fold change in comparison to vehicle-treated cells. These findings suggest that MAE may inhibit MMPs to lessen the invasive potential of MDA-MB-231 cells.
2.10. MAE Triggers MDA-MB-231 Cells to Arrest in the G0/G1 Phase of the Cell Cycle
MDA-MB-231 cells were treated with 200 µg/mL of MAE for 24 hours, and the cell cycle distribution was investigated using flow cytometry. As seen in Figure 9A, the percentage of cells in the G0 phase rose in MAE-treated cells (12.3 ± 2.3 versus 5.3 ± 1.7 in control cells). The percentage of cells in the G1 phase increased with this (53.2 ± 5.8 vs. 29 ± 7.9 in control cells). The findings imply that MAE promotes a cell cycle arrest during the G0/G1 phase. The percentage of cells in the S and G2-M phases decreased along with this, with 15.7 ± 2.7 and 17.6 ± 3.4 for control cells and 3.4 ± 1.2 and 8.2 ± 3.14, respectively, indicating that MAE causes a cell cycle arrest at the G1 phase and prevents cell entry into the S phase.
The p53 gene is a tumor suppressor; that is, when it is active, tumors cannot grow[31]. Phosphorylated p53 levels rose in response to MAE treatment in a concentration-dependent manner; at 200 µg/mL, there was a significant increase (1.53±0.02-fold change in the control) (Figure 9B). This data implies that cell cycle arrest may result from MAE-induced p53 activation. Moreover, the p38 MAPK (mitogen-activated protein kinase) pathway is frequently associated with preventing cell proliferation by regulating the progression of the cell cycle and inducing apoptosis[32], Western blotting was used to measure the protein levels of the active phosphorylated form of p38 (P-p38). The findings indicate that MAE increased P-p38 levels in a concentration-dependent manner; following treatment with MAE, the cells increased by 1.3 ± 0.09 at 100 μg/mL and significantly by 1.5 ± 0.15-fold at 200 μg/mL (Figure 9B). Moreover, MAE significantly increased the levels of CDK inhibitors p21 and p27, which are downstream effectors of p38, to 1.61±0.21 and 1.51±0.26 at 200 μg/mL, respectively. In addition to being a downstream effector of p38 signaling, retinoblastoma protein (Rb) plays a part in differentiation, tumor suppression, cell cycle regulation, and apoptosis control[33] . P-rb levels were markedly decreased by MAE in a concentration-dependent manner (Figure 8B). Rb phosphorylation was significantly decreased by 200μg/mL to 0.29±0.1-fold compared to the vehicle control. The impact of MAE on cell cycle dynamics is further supported by these findings.
2.11. MAE Reduces iNOS and COX-2 Levels and Inhibits Angiogenesis in Ovo
Angiogenesis is the process by which new blood vessels are created to supply cells with oxygen and nutrients as a result of tumor cells spreading from the primary tumor site and metastasizing into secondary sites. As a result, stopping angiogenesis is crucial to preventing[34]. The chick-embryo chorioallantoic membrane (CAM) assay was used to investigate how MAE influences angiogenesis. This was done by applying MAE to the surface of the widely vascularized CAM membrane over 24 hours. By reducing the overall vessel length and number of junctions, MAE treatment of 200µg/mL significantly suppressed angiogenesis, compared to the control, and resulted in a decrease in the number of junctons of 72.92 ± 3.44% and a reduction in the total vessel length of 44.56 ± 9.4% as seen in Figure 10B. Moreover, inducible nitric oxide synthase (iNOS), a crucial producer of nitric oxide (NO)[35], and cyclooxygenase 2 (COX-2), an enzyme that produces prostaglandin E2 (PGE2)[36] are both mediators of angiogenesis. Our findings demonstrated that 200 µg/mL MAE significantly decreased the levels of COX-2 and iNOS proteins by 0.58 ± 0.038 and 0.52 ± 0.11, respectively compared to the control. According to these findings, MAE suppresses angiogenesis by focusing on the synthesis of PGE2 and NO (Figure 10A).
3. Discussion
Plants and plant-derived metabolites still have major roles in the development of drugs for the prevention or treatment of diseases. Currently, there is growing interest in screening plants to identify therapeutic agents. However, there are scarce investigations on the therapeutic potential of its therapeutic bioactivities. Plant-derived drugs are the source of many of the current cancer chemotherapy agents[37]. In this context, the Food and Drug Administration (FDA) has authorized three herbal mixture-based treatments, including antiallergenic, anticancer, and anti-psoriatic medications, in recent years[38]. Plants are rich in secondary metabolites with a variety of biological functions that are essential to the growth and development of the plant, in addition to serving as a reservoir of phytochemicals that shield the plant from environmental constraints and aid in adaptation. It is well known that many of these secondary metabolites have potent anti-inflammatory, anti-cancer, and antioxidant therapeutic qualities[39]. However, Mandragora autumnalis's medicinal potential has not been thoroughly studied. In this current study, we assessed the ethanolic extract of Mandragora autumnalis (MAE) for antioxidant potential. We used LC-MS to qualitatively and quantitatively analyze the phytochemical composition of the extract. Furthermore, we examined MAE's potential as an anticancer agent by evaluating its impact on key indicators of cancer, such as adhesion, aggregation, invasion, migration, and proliferation, compared to the aggressive triple-negative breast cancer cell subtype and the underlying molecular mechanisms. Numerous classes of phytochemical compounds, such as flavonoids, phenols, tannins, steroids, and essential oils, were found in MAE, according to the qualitative phytochemical analysis. Our findings concur with earlier research indicating the presence of coumarins and lipid-like compounds in extracts from Mandragora species[17]. As a result of its capacity to scavenge DPPH radicals, the ethanolic extract of Mandragora autumnalis demonstrated good antioxidant potential in vitro[40,41]. Moreover, phenols and flavonoids are recognized for their anticancer activity, anti-inflammatory, and antioxidant function[42]. The LC-MS profiling of the tested plant extract revealed a diverse set of bioactive phytochemicals, many of which have been documented in other medicinal plants for their promising anticancer properties, particularly against triple-negative breast cancer (TNBC). TNBC is an aggressive breast cancer subtype lacking estrogen, progesterone, and HER2 receptors, often exhibiting poor prognosis and limited therapeutic options[43]. Hence, phytochemicals capable of multi-targeted anticancer action offer significant therapeutic value. In this study, the LC-MS analysis revealed a diverse profile of bioactive compounds, including alkaloids (hyoscyamine, tropine, tropinone, solacaproine), phenolic acids (chlorogenic acid), flavonoids (quercetin, chrysin), fatty acid derivatives (hexadecanamide, ethyl palmitate, linoleic acid, ethyl linolenate), and esters (ethyl hydrocinnamate, ethyl 3-hydroxybutanoate). Similar phytochemical compositions have been reported in medicinal plants like Datura stramonium, Atropa belladonna, and Withania somnifera, which are known for their rich alkaloid and flavonoid contents, targeted anticancer therapies. Among the major identified compounds, chlorogenic acid, scopoletin, caffeic acid, rutin, hyperoside, and linolenic acid have garnered substantial interest for their roles in inhibiting TNBC cell viability and metastasis. For instance, chlorogenic acid—widely found in Coffea arabica, Lonicera japonica, and Solanum nigrum—has demonstrated the ability to suppress TNBC cell proliferation, migration, and invasion through the modulation of key signaling pathways such as NF-κB and PI3K/Akt[44]. In MDA-MB-231 TNBC cells, chlorogenic acid downregulated MMP-9 expression and induced apoptosis, suggesting its chemopreventive potential[45]. Scopoletin, found in Morinda citrifolia, Artemisia absinthium, and Scopolia carniolica, appeared at high intensities in the sample, indicating a major role in bioactivity. This coumarin compound has been reported to inhibit TNBC cell growth by inducing oxidative stress-mediated apoptosis and enhancing chemosensitivity[46]. Rutin and hyperoside, both flavonol glycosides, are common in Sophora japonica, Ginkgo biloba, and Hypericum perforatum and exhibit anticancer potential by inhibiting epithelial-mesenchymal transition (EMT), a critical event in TNBC metastasis. Rutin has also shown synergistic effects with doxorubicin in reducing TNBC tumor burden[47]. Similarly, hyperoside inhibits the proliferation and migration of MDA-MB-231 cells by regulating miRNA expression and downregulating MMPs. Additionally, 3-methyl-2,5-furandione, a furan derivative, though less studied, shares structural similarity with compounds known for antiproliferative effects and may represent a novel candidate for anti-TNBC activity[48]. Collectively, the presence of these compounds, many of which are found in medicinal plants traditionally used in cancer therapy, supports the potential of this extract as a multi-targeted approach against cancer, especially TNBC.
Cancer is marked by uncontrolled proliferation, resulting from improper cell division and death regulation[49]. We found that MAE extract had significant anti-proliferative activity against MDA-MB-231 cells in a concentration-dependent manner. This coincided with a substantial decrease in Ki67, a highly expressed proliferation marker that correlates with tumor severity[50]. Inducing apoptosis is an effective strategy for controlling cancer cell proliferation, and targeting apoptotic pathways is becoming increasingly important in cancer treatment development [51]. To better understand the anti-proliferative mechanism of the MAE extract, we studied apoptosis induction. MAE significantly inhibited MDA-MB-231 cell proliferation in a dose-dependent manner. Previous research has shown that Mandragora autumnalis inhibits the proliferation of various cancer cell lines [15]. This study is the first to evaluate the impact of MAE on the triple-negative subtype of breast cancer, including its underlying molecular mechanisms and cancer phenotypes.
In cancer therapy, inducing apoptosis in cancer cells is an essential tactic in addition to preventing unchecked proliferation [52]. TNBC is among the cancer cells that frequently avoid apoptosis, which promotes tumor growth and treatment failure[53]. Consequently, activating apoptotic pathways is a highly effective method of treating cancer. The downregulation of pro-caspase 3, the anti-apoptotic Bcl-2 protein, and the upregulation of the pro-apoptotic Bax protein and caspase 3 in our investigation all suggested that MAE induced intrinsic apoptosis. This comes in line with previous studies on other plant extracts, including Ziziphus nummularia, and Haludule uninervis, on triple-negative breast cancer cells[54,55].
Additionally, the p53 pathway was investigated to better understand the mechanism of MAE's anti-proliferative effects. p53 is a tumor suppressor protein encoded by the TP53 gene; its primary biological function appears to be to protect the DNA integrity of the cell. TP53 has additional functions in development, aging, and cell differentiation [56,57]. Activated p53 promotes cell cycle arrest to allow DNA repair and apoptosis to prevent the spread of cells with severe DNA damage by transactivating target genes involved in cell cycle arrest and apoptosis[58]. Mutations in the p53 gene (mtp53) are associated with a variety of cancers, including 70-80% of TNBC [59]. Interestingly, the phosphorylation of Ser15 (mediated primarily by the ATM and ATR protein kinases in response to genotoxic stress) acts as a nucleation event that promotes or permits subsequent sequential modification of many residues[60]. Furthermore, ATM-induced phosphorylation promotes the recruitment of histone/lysine acetyltransferases (HAT), such as p300 and CBP, resulting in the acetylation of multiple lysine residues in p53's DNA binding (DBD) and carboxy-terminal domains. These modifications are thought to contribute to the stabilization of p53 by blocking ubiquitylation and suggest that p53 restores its tumor-suppressive activity[61]. MAE induced p53 phosphorylation in MDA-MB-231 cells, potentially restoring its wild-type conformation and increasing transcriptional activity. This suggests a promising therapeutic strategy for preventing cancer cell proliferation. Moreover, to gain insight into the mechanism of MAE-induced anti-proliferative effects, the involvement of the p38 mitogen-activated protein kinase (MAPK) pathway was investigated. P38 is known to play a crucial role in maintaining cellular homeostasis by regulating various cellular processes, including cell cycle progression, apoptosis, and cellular response to stress[62]. Our results showed that MAE increased the levels of p38, which is by other studies reporting the relationship between p38 activation and the induction of cell cycle arrest[63]. In addition to that, the levels of the cell cycle inhibitor protein p21, a downstream effector of p38, and p27 were significantly increased by MAE. Moreover, MAE significantly reduced the phosphorylation of Rb, further implicating the p38 MAPK pathway in the proliferation of MDA-MB-231 cells. This can be explained by the activation of p38 MAPK, which stabilizes CDK inhibitors (e.g., p21 and p27) , delaying Rb phosphorylation, which keeps Rb in its active, growth-suppressing form and causes cell cycle arrest in the G1 phase[64,65]. As a result of TNBC, increasing the levels of activity of p27, p21, p38, Rb, and p53 leads to a significant extension of the G0 and G1 phases of the cell cycle, preventing cancer cells from entering the DNA synthesis S phase. This cell cycle arrest is a desirable therapeutic effect, as it limits tumor cell proliferation and promotes apoptosis or senescence. Targeting this network of tumor suppressors and stress response proteins holds promise for developing more effective treatments for TNBC, which currently lacks targeted therapies.
Reactive oxygen species (ROS) are elevated in nearly all cancers, where they support various aspects of the growth and spread of the tumor. The delicate regulation of intracellular ROS signaling to efficiently rob cells of ROS-induced tumor-promoting events and tip the scales in favor of ROS-induced apoptotic signaling will present a challenge for innovative therapeutic approaches. On the other hand, therapeutic antioxidants may stop critical early stages of tumor development before ROS are produced[66]. In this study, MAE reduction of MDA-MB-231 viability was attenuated by suppressing ROS levels with a potent antioxidant like NAC. All of these points to a scenario in which MAE causes ROS levels to rise, which in turn triggers anti-proliferative signaling pathways in MDA-MB-231 cells. It's possible that this signaling involves the ROS-p53 axis. Similar findings stated that when hysapubescin B, a withanolide derived from Physalis pubescens, was applied to HCT116 colorectal cancer cells, it produced reactive oxygen species (ROS) that inhibited mTORC1, which in turn activated autophagy and caused cell death[67] Notably, MAE stimulates the production of reactive oxygen species (ROS), suggesting that MAE contributes to oxidative stress in MDA cells. One of the main causes of DNA damage and a threat to genomic integrity is oxidative stress, which activates members of the p53 family, most notably p53, which is essential for tumor suppression[68]. Upcoming experiments using p53 inhibitors and ROS scavengers should provide insight into the mode of interaction between ROS and p53, including whether p53 acts upstream or downstream of ROS or whether there is a bidirectional crosstalk.
Furthermore, we demonstrated that MAE impacted MDA's ability to migrate and adhere to one another. These functions are essential to the epithelial-mesenchymal transition (EMT) and serve as a marker of the cancer's spread to metastases. Cancer cells can migrate and invade more areas with less cell-to-cell adhesion[69].
Our study's results showed that treating MDA extract with MAE increased the creation of cell-cell aggregates and reduced their migration and invasion, reversing the EMT phenotype and preventing metastasis as a result. The complicated process of cancer metastasis involves the cancer cells moving from the main tumor site to other organs. It contributes to the spread of cancer and accounts for a sizable share of cancer-related mortality. Because of its aggressive nature, dismal prognosis, and resistance to treatment, TNBC metastasis poses a serious clinical challenge[70]. Tumor cell invasion is commonly believed to require the epithelial-to-mesenchymal transition (EMT); however, mounting data suggests that there are other pathways through which tumor cells can spread. Using mesenchymal or amoeboid dissemination mechanisms, tumor cells can spread individually or in clusters. Mesenchymal cells move forward through the production of traction force through integrin-mediated extracellular matrix adhesion and cytoskeletal contractility[71]. With their elongated morphology, mesenchymal cells can move forward by producing traction force through integrin-mediated extracellular matrix adhesion and cytoskeletal contractility[72]. The production of migration pathways by mesenchymal tumor cells is also dependent on proteolysis-dependent ECM degradation[73]. It has been determined that epithelial tumor cells can acquire mesenchymal phenotypes through the use of EMT and hybrid EMT. However, in the absence of proteolysis-dependent ECM remodeling, amoeboid cells with a rounded and deformable morphology can fit through small pores and narrow spaces in the ECM[74]. High-speed movement is produced during this kind of movement when the cells display bleb-like protrusions powered by actomyosin contractility and maintain weak but dynamic cell adhesion to ECM[75]. Collective cell migration is a movement pattern of multiple cells that maintain cell-cell connections and migrate in unison, as opposed to single-cell motility[76].Actin dynamics, integrin-based ECM adhesion, and proteolytic cleavage of ECM are the three factors that control this kind of tumor cell migration. The diverse tumor cells that migrate in cohesive groups preserve front-rear polarity and collaborate hierarchically [77]. The increase in cancer cell migration and invasion is partly due to the dysregulation of cell-cell adhesion and the extracellular matrix (ECM) degradation by metalloproteinases (MMPs)[78]. The MDA-MB-231 cells' ability to adhere to collagen was reduced by MAE treatment, suggesting that the cell-ECM interaction had been disrupted. Furthermore, MAE reduced the amounts of integrin β1, an adhesion molecule linked to TNBC's heightened invasiveness and aggression [79]. These findings support MAE's capacity to suppress TNBC cells' capacity to spread by focusing on cell-cell and cell-ECM interactions. Boyden chamber and wound-healing assays were used in our study to examine the impact of MAE on the migration and invasion characteristics of MDA-MB-231. In this study, TNBC cell migration and invasion were markedly inhibited by MAE. Multiple investigations involving various plant extracts have demonstrated that the inhibition of MMP-2 and MMP-9 expression diminishes the migratory and invasive potential of MDA-MB-231 cells[80]. In our investigation, MAE significantly and concentration-dependently decreased the MDA-MB-231 cells' cell-cell adhesion.
This was accompanied by a decrease in integrin β1 protein levels, suggesting that MAE could block tumor migration by inhibiting cell-to-cell adhesion. All things considered, MAE may be able to reduce TNBC metastasis by reducing cell-–ECM contact, preventing cell migration, adhesion, and invasion, and boosting cell-cell aggregation. More research is needed to determine whether the downregulation of MMPs mediates the MAE-induced inhibition of migration and invasion. The existence of multiple signaling pathways involved in cancer pathogenesis emphasizes the need for additional research[81,82]. Despite progress in cancer research, providing more involved pathways and molecular targets is very important[83]. STAT3, in particular, plays important roles in a variety of cellular processes, including the cell cycle, cell proliferation, cellular apoptosis, and tumorigenesis[84]. Persistent activation of STAT3 has been reported in a variety of cancer types, and a poor prognosis of cancer may be associated with the phosphorylation level of STAT3[85]. STAT3 promotes tumor progression and metastasis in TNBC by regulating gene expression-related apoptosis, EMT, cell migration, aggregation, and invasion. STAT3 can be tightly controlled by upstream signaling molecules like Janus kinase (JAK) and epidermal growth factor receptor (EGFR)[86]. It then localizes to the nucleus of cells and binds to target DNA, regulating the expression of subsequent proteins. However, in addition to its normal cell functions, STAT3 activation in the tumor microenvironment (TME) is considered an oncogenic event. High phospho-STAT3 expression is linked to a poor prognosis in cancer patients[87]. STAT3 constitutive activation is critical for tumor formation, development, metastasis, and recurrence. These are strongly associated with cancer hallmarks and lead to poor patient outcomes[88]. Therefore, the STAT3 pathway is a promising target for cancer therapy. Based on previous findings it has been shown that plant-derived compounds can reduce cancer by inhibiting the STAT3 signaling pathway and its associated genes. As an example, Baicalein and Cantharidin inhibit the STAT3 pathway via downregulating of IL6 and EGFR levels respectively. Moreover, Hydroxy-jolkinolide B, Deoxy-2β,16-dihydroxynagilactone E, Acetoxychavicol acetate inhibit triple negative breast cancer cells by downregulating of JAK/STAT pathway[88].It has been demonstrated that phosphorylated STAT3 (p-STAT3), which was significantly decreased by MAE, downregulates important pro-metastatic factors like matrix metalloproteinase-9 (MMP-9) which was significantly decreased, effectively inhibits tumor growth. When activated, the transcription factor p-STAT3 moves into the nucleus and stimulates the expression of genes related to invasion, metastasis, and cell survival. MMP-9, an enzyme that breaks down extracellular matrix components to promote cancer cell invasion and metastasis, is one of its well-established targets[89]. Thus, blocking STAT3 phosphorylation results in a decrease in MMP-9 expression[90], which in turn reduces TNBC cells' capacity for invasion which was achievedieved by MAE in this investigation. In order to reduce tumor aggressiveness and enhance outcomes for patients with TNBC, this regulatory axis emphasizes the therapeutic potential of targeting the STAT3/MMP-9 pathway.
The development of new blood vessels, or angiogenesis, is a crucial step in the growth, invasion, and metastasis of tumors[91]. Particularly, triple-negative breast cancer (TNBC) has high angiogenic activity, which promotes fast tumor growth and makes metastasis easier. Therefore, blocking pro-angiogenic factors to target angiogenesis has become a promising therapeutic strategy for controlling the progression of TNBC[92]. Inducible nitric oxide synthase (iNOS) and cyclooxygenase-2 (COX-2) are two important pro-angiogenic enzymes that are upregulated in TNBC. In TNBC, their overexpression increases the risk of metastasis and vascularization[93]. Notably, treatment with MAE decreased the expression of COX-2 and iNOS in MDA-MB-231 cells. Additionally, in the chick embryo chorioallantoic membrane (CAM) assay, MAE significantly reduced vessel length and the number of junctions, demonstrating a strong anti-angiogenic effect in vivo-like environment. These results are in line with earlier studies that demonstrated that Halodule uninervis , a seagrass, also inhibits angiogenesis in TNBC[55].
As a sum up, Effective therapeutic responses in TNBC are frequently characterized by downregulation of survival and invasion markers (e.g., Bcl-2, p-STAT3, MMP-9) and upregulation of pro-apoptotic and tumor suppressor proteins (e.g., Bax, caspase-3, p21, p27, p-p53). Increases in E-cadherin and decreases in integrin/MMP-9 indicate that EMT and metastasis are suppressed. All markers studied in this investigation were listed with their change and proposed role after treatment with MAE (Table 4).
Per these findings, MAE inhibited apoptosis, adhesion, migration, invasion, cell cycle, and angiogenesis in MDA-MB-231 cells. Our research concludes that there are numerous significant plant phytochemicals in the ethanolic extract of Mandragora autumnalis leaves, many of which have been shown to have pharmacological properties. Additionally, we showed that the extract has potent anti-metastatic and anti-cancer characteristics, which may help to lessen the malignant phenotype of TNBC. The carcinogenesis process's hallmarks, such as cell proliferation, cell aggregation, cellular adhesion, migration, and invasion, were all impacted by MAE. This calls for additional investigation into MAE and the isolation of the bioactive metabolites responsible for the reported anticancer effects. These investigations could identify MAE as a new source of innovative drug candidates.
4. Materials and Methods
4.1. Collection of Mandragora autumnalis Leaves and Preparation of their Ethanolic Extract MAE
Mandragora autumnalis leaves were collected during the spring season from south Lebanon. The leaves were cleaned and dried at room temperature. The plants were identified by Mohammad Al-Zein, a resident plant taxonomist at the American University of Beirut (AUB) herbarium. A voucher specimen has been stored at the Post Herbarium, AUB, with identification number GA 2025-1. Leaves were washed and dried at room temperature and ground mechanically. The powder was suspended in 80% ethanol and incubated while shaking at 40 rpm in the dark for 72 hours. Afterward, the suspension was filtered using filter paper and lyophilized using a freeze-dryer. The obtained powder was dissolved in DMSO at a concentration of 100 mg/mL. The prepared plant extract MAE was then stored in the dark at 4 °C for further usage and analysis.
4.2. Phytochemical Analysis
The chemical composition of the Mandragora autumnalis ethanolic and aqueous extracts was investigated by performing qualitative tests to detect the presence of primary and secondary metabolites. Test for anthocyanins: A total of 0.5 g of the extract was dissolved in 5 mL of ethanol, followed by ultrasonication for 15 min at 30 ◦C. Subsequently, 1 mL of each extract was combined with 1 mL of NaOH (Sigma-Aldrich Co., St. Louis, MO, USA) and heated for 5 min at 100 ◦C. The presence of anthocyanins was indicated by the appearance of a bluish-green color. Anthraquinone test: 0.5 g of each extract (Sigma-Aldrich Co., St. Louis, MO, USA) was dissolved in 4 mL of benzene. 10% ammonia solution was added to the filtrate following filtration. The presence of anthraquinones was verified by the formation of a red or violet color. Test for cardiac glycosides: 5 mL of ethanol was used to dissolve 0.5 g of each extract. This was then ultrasonicated at 30 °C, filtered, and evaporated. Subsequently, the dehydrated extract was combined with 1 milliliter of glacial acetic acid (from Sigma-Aldrich Co., St. Louis, MO, USA) and a few drops of 2% FeCl3. Subsequently, the test tube's side was filled with 1 milliliter of concentrated sulfuric acid (H2SO4) from Sigma-Aldrich Co., St. Louis, MO, USA. The appearance of a brown ring indicated the presence of cardiac glycosides. To test for essential oils, 0.5 g of each extract was dissolved in 5 mL of ethanol, then the mixture was ultrasonically sonicated at 30 °C and filtered. 100 µL of 1MNaOH was mixed with the filtrate. A tiny amount of 1MHCl (MERCK, Darmstadt, Germany) was then added. A white precipitate's formation indicated the presence of essential oils. Test for flavonoids. One milliliter of 2% NaOH and 0.2 g of each extract were combined. When a concentrated, yellow-colored solution was achieved, a few drops of diluted acid were added to the mixture. The color in the solution vanished, indicating that flavonoids were present. Phenols test: 5 mL of ethanol was used to dissolve 0.5 g of each extract, which was then ultrasonically sonicated at 30 °C and filtered. A mixture of 2 mL distilled water and the filtrate was prepared. Subsequently, a small amount of 5% FeCl3 was added, and this caused a dark green color to form, indicating the presence of phenols. 5 mL of ethanol was used to dissolve 0.5 g of the extract, which was then ultrasonicated at 30 °C and filtered. The filtrate was then mixed with 1 mL of concentrated sulfuric acid (H2SO4). The development of a red hue was indicative of the presence of quinones. To test for tannins, dissolve 0.5 g of each extract in 5 mL of distilled water, then filter and ultrasonicate at 80 °C. Once the filtrate had cooled to room temperature, five drops of 0.1% FeCl3 were added. A brownish-green or blue-green coloration suggested the presence of tannins. To test for terpenoids, dissolve 0.5 g of the extract in 5 mL of chloroform, then filter and ultrasonicate at 30 °C. The filtrate was then mixed with 2 mL of concentrated sulfuric acid (H2SO4). The creation of a reddish-brown hue indicated the presence of quinones.
4.3. Total Phenolic Content (TPC)
With a few minor modifications, the Folin–Ciocalteu method was used to determine the total polyphenol content (TPC) of MAE[94]. The concentration of both extracts was made to be 1 mg/mL. 500 μL of the extract was separated, combined with 2.5 mL of Folin-Ciocalteu reagent, and left to oxidize for five minutes. After adding 2 mL of a 75 g/L sodium carbonate solution to neutralize the reaction, the mixture of the extract was left to incubate for 1 hour at 37° C in the dark. Following incubation, the samples' absorbance at 765 nm was compared to standards of gallic acid, which is a known polyphenol. The TPC of the extract was given as a percentage (mg GAE/g) of the total gallic acid equivalents per gram of dry leaves used in the extract's preparation. The TPC analysis was carried out three times, and the mean values ±SEM of the outcomes are shown.
2.4. Total Flavonoid Content (TFC)
Using a modified aluminum chloride colorimetric assay, the total flavonoid content (TFC) of MAE was ascertained[94]. To put it briefly, a concentration of 1 mg/mL was used to prepare the extract. Then, an aliquot (0.5 mL) of the extract was combined with 1.5 mL of 95% ethanol, 2.8 mL of ultra-pure distilled water, 0.1 mL of a 10% methanolic aluminum chloride solution, and 0.1 mL sodium acetate. Using quercetin as a standard, the absorbance was measured at 415 nm following a 30-minute dark incubation period at room temperature. The TFC was measured in (mg QE/g) of quercetin equivalents per gram of dry leaves used to prepare the extract. Three runs of this analysis were conducted, and the results are shown as mean values ± SEM.
4.5. The antioxidant Activity (DPPH) of Mandragora autumnalis Ethanolic Extract
Using the free-radical-scavenging activity of α, α-diphenyl-α-picrylhydrazyl (DPPH), the antioxidant activity of MAE was assessed. MAE at different concentrations (50, 100, 200, 400, or 600μg/mL) was combined with a 0.5 mM DPPH solution in methanol. DPPH solution (0.5 mL), methanol (3 mL), and 80% ethanol (0.5 mL) made up the blank solution, which was used for comparison. The combined samples were then exposed to darkness for 30 minutes, and a spectrophotometer was used to measure the optical density (OD) at a wavelength of 517 nm. The following formula was used to calculate the percentage of DPPH-scavenging activity for each MAE concentration. For comparison, ascorbic acid was used as the standard. Percentage of inhibition (absorbance of control − absorbance of the extract)/ (absorbance of control) × 100.
4.6. Liquid Chromatography-Mass Spectrometry
The Stock solution was prepared by dissolving 5 mg of the MAE sample in a solution of 50 µL of Dimethyl sulfoxide (DMSO) and 450 µL of methanol, then 250 µL of the solution was diluted with 1 mL of methanol and then used for identification of the metabolite in the LC-MS system. All the other reagents, Acetonitrile, methanol, water, and formic acid, used were LC/MS grade. A Bruker Daltonik (Bremen, Germany) Impact II ESI-Q-TOF System equipped with Bruker Dalotonik. The Elute UPLC system (Bremen, Germany) was used for screening compounds of interest. We used standards for identification of m/z with high-resolution Bruker TOF MS and exact retention time of each analyte after chromatographic separation. This instrument was operated using the Ion Source Apollo II ion Funnel electrospray source. The capillary voltage was 2500 V, the nebulizer gas was 2.0 bar, the dry gas (nitrogen) flow was 8 L/min, and the dry temperature was 200 ºC. The mass accuracy was ˂ 1 ppm; the mass resolution was 50000 FSR (Full Sensitivity Resolution), and the TOF repetition rate was up to 20 kHz. using Elute UHPLC coupled to a Bruker Impact II QTOFMS. Chromatographic separation was performed using Bruker Solo 2.0_C-18 UHPLC column (100 mm x 2.1 mm x 2.0 μm) at a flow rate of 0.51 mL/min and a column temperature of 40 °C. Solvents:(A) water with 0.1% methanol and (B) Methanol injection volume 3 Μl. Data analysis was performed using Bruker's MetaboScape and DataAnalysis software. Compound annotation in MetaboScape was conducted using the MetaboBase library, a list of standards, as well as a custom list of previously reported compounds in the specific plant under investigation. The raw data files were converted to the mzML format using msConvert, a C++ tool from the ProteoWizard suite designed to convert raw files into standard mass spectrometry formats. The resulting mzML files were analyzed using an in-house R script based on the xcms, CAMERA, and MSnbase packages. Chemical formulas for annotated ions were generated and checked using the Rdisop package. The isotopic pattern for annotated chemical formulas matched the theoretical pattern with more than 99%. Chromatograms and spectra were generated using both Bruker Data Analysis and the ggplot2 library in R. The analyses performed using the two methods yielded comparable results.
4.7. Cell Culture
Human breast cancer cells MDA-MB-231 were acquired from the American Type Culture Collection (Manassas, VA). The cells were cultured in a 37°C, 5% CO2 humidified chamber using DMEM high-glucose medium supplemented with 10% fetal bovine serum (FBS; Sigma-Aldrich, St. Louis, MO, United States) and 1% penicillin/streptomycin (Corning, Massachusetts, United States).
4.8. MTT Cell Availability Assay
MDA-MB-231 cells were seeded in a 96-well tissue culture plate at a density of 5 × 10³ cells/well, and they were left to grow until 30% confluence was reached. The cells were subjected to escalating concentrations of MAE (50, 100, 200, 400, 600, and 1000 μg/mL) for 72 hours. The viability of the cells was assessed using 3-(4,5-dimethylthiazol-2-yl)-2,5-diphenyltetrazolium bromide (MTT; Sigma-Aldrich, St. Louis, MO, United States). The viability of the cells was determined by comparing the proportionate viability of the treated cells to the vehicle-treated cells (equivalent concentration of DMSO), whose viability was assumed to be 100%.
4.9. Migration (Scratch) Assay
In 12-well plates, MDA-MB-231 cells were cultured until a confluent cell monolayer was formed. Next, a 10 μL pipette tip was used to create a scratch across the confluent cell monolayer. After removing the cell culture medium, the cells were cleaned with PBS to get rid of any debris. Following the addition of fresh medium containing MAE at the designated concentration (100, or 200 μg/mL), cells were incubated at 37°C. With an inverted microscope (objective ×4), photomicrographs of the scratch were taken at baseline (0 hours) and 10 hours post-scratch. Using the ZEN software (Zeiss, Germany), the width of the scratch was measured and expressed as the average difference ±SEM between the measurements made at time zero and the specified time point (10 hours).
4.10. Trans-Well Migration Assay
To test MDA-MB-231 cells' migratory potential, trans-well inserts (8 µm pore size; BD Biosciences, Bedford, MA, USA) were employed. 3 × 10⁵ cells were seeded into the insert's upper chamber. After that, cells were given the indicated MAE concentrations or not. A DMEM medium with 10% FBS was added as a chemoattractant in the lower chamber. After that, the cells were cultured at 37 °C and given 24 hours to migrate. The cells on the insert's upper surface were eliminated using a sterile cotton swab. Additionally, cells that moved to the insert's lower surface were stained with DAPI (1 µg/mL) and fixed with 4% formaldehyde. and examined for quantification at a 10× magnification using a fluorescence microscope. Three assay runs were conducted, and the results are shown as mean values ± SEM.
4.11. Matrigel Invasion Assay
To evaluate MDA-MB-231 cells' invasive potential, a BD Matrigel Invasion Chamber (8µm pore size; BD Biosciences, Bedford, MA, USA) was utilized. The experiment is comparable to the trans-well migration chamber assay, except that a diluted 1:20 Matrigel matrix is added. For quantification, cells that penetrated the Matrigel layer to the insert's lower surface were fixed with 4% formaldehyde, stained with DAPI, and examined under a fluorescence microscope. Three assay runs were conducted, and the results are shown as mean values ± SEM.
4.12. Aggregation Assay
MDA-MB-231 cells were collected from confluent plates using sterile 2 mM EDTA in Ca2+/Mg2+-free PBS to measure cell aggregation. The cells were divided into individual non-adherent culture plates and subjected to MAE treatment (100 or 200 μg/mL). After three hours of gentle shaking at 90 rpm and 37°C, the cells were fixed with 1% formaldehyde. Photomicrographs were taken to be examined using an Olympus IX 71 inverted microscope.
4.13. Adhesion Assay
For a duration of 24 hours, MDA-MB-231 cells were cultured with or without different concentrations (100 or 200 μg/mL) of MAE. Following a collagen pre-coating, they were seeded onto 24-well plates and incubated for 60 minutes at 37°C. The MTT reduction assay was then used to determine the quantity of adherent cells after the cells had been washed with PBS to remove non-adherent cells.
4.14. Analysis of Apoptotic Morphological Changes
Using a phase-contrast inverted microscope, characteristics associated with apoptotic cells were observed. For this, different concentrations of MAE (100 or 200 μg/mL) were either present or absent when growing cells in 6-well plates. After 24 hours, images at 4x, 10x, and 20x magnifications were captured. 4′, 6-diamidino-2-phenylindole, dihydrochloride (DAPI) staining was used to identify changes in nuclear morphology indicative of apoptosis. For a full day, MDA-MB-231 cells were cultured in a 12-well plate with or without the indicated concentrations of MAE (100 or 200 μg/mL). Following the manufacturer's instructions, the cells were stained with DAPI (Cell Signaling #4083), fixed with 4% formaldehyde, and then fluorescence microscopy was used to visualize the apoptotic morphological alterations.
4.15. Western Blot Analysis
To create whole-cell lysates, MDA-MB-231 cells were subjected to two PBS washes before being lysed in a lysis buffer that contained 60 mM Tris and 2% SDS (pH of 6.8). After that, the lysate mixture was centrifuged for 10 minutes at 1.5 × 10⁴ g. Bradford protein quantification kit (Biorad, Hercules, CA, United States) was used to measure the amount of protein in the resultant supernatant. Protein extracts aliquots ranging from 25 to 30 μg were resolved using 10% sodium dodecyl sulfate-polyacrylamide gel electrophoresis (SDS-PAGE) and subsequently placed onto an Immobilon PVDF membrane (Biorad).
PVDF membrane was blocked with a 5% non-fat dry milk solution in TBST (Tris-buffered saline with 0.05% Tween 20) for one hour at room temperature. To perform immunodetection, a particular primary antibody was incubated with the PVDF membrane for an entire night at 4°C. After removing the primary antibody and washing the membrane with TBST, the membrane was incubated for an hour with the secondary antibody, horseradish peroxidase-conjugated anti-IgG. Thermo Scientific, Rockford, IL, USA) supplied an enhanced chemiluminescence (ECL) substrate kit to visualize immunoreactive bands after washing the secondary antibody with TBST, by the manufacturer's instructions. Sourced from Cell Signaling (Cell Signaling Technology, Inc., Danvers, MA, United States), all primary and secondary antibodies were used.
4.16. Gelatin Zymography
In a 100mm tissue culture plate, MDA-MB-231 cells (1.0 × 10⁶) were cultivated in serum-free DMEM medium with or without varying concentrations (100, or 200 μg/mL) of MAE. The cultures' conditioned media were gathered and concentrated following a 24-hour incubation period. A 10% non-reducing polyacrylamide gel containing 0.1% gelatin was used to separate 30 µg of proteins. After electrophoresis, the gels were rinsed for one hour in 2.5% (v/v) Triton X-100 to get rid of SDS. They were then incubated for the entire night at 37°C in a solution that contained 50 mM Tris-HCl (pH 7.5), 150 mM NaCl, 0.5 mM ZnCl2, and 10 mM CaCl2 to enable the media's proteases to break down the gelatin substrate enzymatically. A 0.5% solution of Coomassie brilliant blue R-250 was used to stain the resultant gel. The gel showed clear patches that showed matrix metalloproteinases (MMPs) breaking down the gelatin. Using ImageJ software, densitometry analysis was performed, and each cleared band's density was normalised to a nonspecific band on the gel that was equally loaded.
4.17. Flow Cytometry Analysis of Cell Cycle
MDA-MB-231 cells were cultivated in 100 mm tissue culture plates before incubating with or without MAE. Cells were extracted and then suspended in 500 µL of PBS after 24 hours. After that, the cells were fixed using an equivalent volume of 100% ethanol and maintained at -20°C for at least 12 hours. The cells were then centrifuged, pelleted, and washed with PBS before being resuspended in PBS containing 1 µg/mL of 4′, 6-diamidino-2-phenylindole dihydrochloride (DAPI, Cell Signaling Technology, Inc., Danvers, MA, USA) and incubated at room temperature for half an hour. After that, the cell samples were evaluated using the Becton Dickinson BD FACSCanto II Flow Cytometry System (Franklin Lakes, NJ, USA), and FACSDiva 6.1 software was used to facilitate data.
4.18. Chorioallantoic Membrane
Fertilized chicken eggs were cleaned with 70% ethanol, rotated, and incubated at 37 °C and 60% relative humidity. After a week, the air sac was revealed when the highly vascularized chorioallantoic membrane (CAM) was dropped by making an opening in the eggshell. The CAM was treated with 200 μg/mL of MAE and incubated for 24 hours to investigate its impact on blood vessel growth between treatment and control. AngioTool 0.5 software was then used to measure the lengths of the vessels and count the number of junctions in the CAM images that were taken.
4.19. Statistical Analysis
The results were assessed using the student's t-test. When comparing more than two means, one-way ANOVA followed by Dunnett's post hoc test or two-way ANOVA followed by Tukey-Kramer's post hoc test were also utilized. P-values less than 0.05 were regarded as statistically significant.
5. Conclusions
Collectively, the findings of this study unveil the Mandragora autumnalis ethanolic leaf extract as a promising phytopharmacological candidate for the management of triple-negative breast cancer, a highly aggressive and therapeutically refractory breast cancer subtype. The observed reduction in MDA-MB-231 cell viability in a dose- and time-dependent manner reflects the cytotoxic potential of MAE, aligning with prior studies on other Solanaceae species known for their bioactive alkaloids and phenolics. Notably, the significant upregulation of the tumor suppressor p53 and concomitant downregulation of proliferation and metastasis-associated markers (Ki67, MMP-9, STAT-3) reinforce the mechanistic plausibility of MAE-induced tumor suppression. These molecular events are consistent with canonical antitumor pathways modulated by natural agents. The capacity of MAE to modulate these pathways points to its potential for not only cytotoxic but also anti-metastatic and anti-angiogenic applications. Furthermore, the interference of MAE with critical metastatic processes—including cell migration, invasion, angiogenesis, aggregation, and adhesion—broadens its functional relevance. These phenotypic suppressions reflect anti-metastatic activity comparable to compounds like quercetin and apigenin. Unlike many monotherapeutic agents that narrowly target single pathways, the broad-spectrum bioactivity of MAE implies a synergistic interplay of its phytochemical constituents, which is characteristic of botanical therapeutics and presents an advantage in overcoming the molecular heterogeneity and drug resistance typical of TNBC. These results also suggest that bioactivity-guided fractionation of MAE could yield novel lead compounds with defined molecular targets, warranting further investigation through high-resolution metabolomics and in vivo tumor models.
Author Contributions
Conceptualization, G.A, A.H, and E.B; investigation, G.A, A.B, R.A. and E.B; writing-review and editing, G.A, and H.H.; visualization, E.B, S.B., M.A., M.M, and A.H.; project administration, A.H., E.B, and M.M. All authors have read and agreed to the published version of the manuscript.
Funding
This research received no external funding.
Data Availability Statement
Not applicable.
Acknowledgments
The authors would like to thank the University Research Board (URB) of the American University of Beirut and the University of Petra for their support.
Conflicts of Interest
The authors declare no conflicts of interest.
Abbreviations
The following abbreviations are used in this manuscript:
| MAE | Mandragora autumnalis ethanolic extract |
| TNBC | Triple negative breast cancer |
| DOXO | Doxorubicin |
| iNOS | Inducible nitric oxide synthase |
| NO | nitric oxide |
| COX-2 | cyclooxygenase 2 |
| PGE2 | prostaglandin E2 |
| Bcl-2 | B-cell lymphoma 2 |
| Bax | Bcl-2-associated X-protein |
References
- Sun, Y.-S.; Zhao, Z.; Yang, Z.-N.; Xu, F.; Lu, H.-J.; Zhu, Z.-Y.; Shi, W.; Jiang, J.; Yao, P.-P.; Zhu, H.-P. Risk Factors and Preventions of Breast Cancer. Int. J. Biol. Sci. 2017, 13, 1387–1397. [Google Scholar] [CrossRef]
- Obeagu, E.I.; Babar, Q.; Vincent, C.C.N.; Udenze, C.L.; Eze, R.; Okafor, C.J.; Ifionu, B.I.; Amaeze, A.A.; Amaeze, F.N. Therapeutic Targets In Breast Cancer Signaling: A Review. JPRI 2021, 82–99. [Google Scholar] [CrossRef]
- Medina, M.A.; Oza, G.; Sharma, A.; Arriaga, L.G.; Hernández Hernández, J.M.; Rotello, V.M.; Ramirez, J.T. Triple-Negative Breast Cancer: A Review of Conventional and Advanced Therapeutic Strategies. IJERPH 2020, 17, 2078. [Google Scholar] [CrossRef] [PubMed]
- Bianchini, G.; Balko, J.M.; Mayer, I.A.; Sanders, M.E.; Gianni, L. Triple-Negative Breast Cancer: Challenges and Opportunities of a Heterogeneous Disease. Nat Rev Clin Oncol 2016, 13, 674–690. [Google Scholar] [CrossRef] [PubMed]
- Dent, R.; Trudeau, M.; Pritchard, K.I.; Hanna, W.M.; Kahn, H.K.; Sawka, C.A.; Lickley, L.A.; Rawlinson, E.; Sun, P.; Narod, S.A. Triple-Negative Breast Cancer: Clinical Features and Patterns of Recurrence. Clinical Cancer Research 2007, 13, 4429–4434. [Google Scholar] [CrossRef]
- Singh, S.; Numan, A.; Agrawal, N.; Tambuwala, M.M.; Singh, V.; Kesharwani, P. Role of Immune Checkpoint Inhibitors in the Revolutionization of Advanced Melanoma Care. International Immunopharmacology 2020, 83, 106417. [Google Scholar] [CrossRef]
- Tsai, J.; Bertoni, D.; Hernandez-Boussard, T.; Telli, M.L.; Wapnir, I.L. Lymph Node Ratio Analysis After Neoadjuvant Chemotherapy Is Prognostic in Hormone Receptor-Positive and Triple-Negative Breast Cancer. Ann Surg Oncol 2016, 23, 3310–3316. [Google Scholar] [CrossRef]
- Xia, C.; Dong, X.; Li, H.; Cao, M.; Sun, D.; He, S.; Yang, F.; Yan, X.; Zhang, S.; Li, N.; et al. Cancer Statistics in China and United States, 2022: Profiles, Trends, and Determinants. Chinese Medical Journal 2022, 135, 584–590. [Google Scholar] [CrossRef]
- Arnold, M.; Morgan, E.; Rumgay, H.; Mafra, A.; Singh, D.; Laversanne, M.; Vignat, J.; Gralow, J.R.; Cardoso, F.; Siesling, S.; et al. Current and Future Burden of Breast Cancer: Global Statistics for 2020 and 2040. Breast 2022, 66, 15–23. [Google Scholar] [CrossRef]
- Korn, A.R.; Reedy, J.; Brockton, N.T.; Kahle, L.L.; Mitrou, P.; Shams-White, M.M. The 2018 World Cancer Research Fund/American Institute for Cancer Research Score and Cancer Risk: A Longitudinal Analysis in the NIH-AARP Diet and Health Study. Cancer Epidemiology, Biomarkers & Prevention 2022, 31, 1983–1992. [Google Scholar] [CrossRef]
- Ávalos, Y.; Canales, J.; Bravo-Sagua, R.; Criollo, A.; Lavandero, S.; Quest, A.F.G. Tumor Suppression and Promotion by Autophagy. BioMed Research International 2014, 2014, 1–15. [Google Scholar] [CrossRef] [PubMed]
- Aggarwal, B.B.; Shishodia, S. Molecular Targets of Dietary Agents for Prevention and Therapy of Cancer. Biochemical Pharmacology 2006, 71, 1397–1421. [Google Scholar] [CrossRef] [PubMed]
- Peto, R.; Boreham, J.; Clarke, M.; Davies, C.; Beral, V. UK and USA Breast Cancer Deaths down 25% in Year 2000 at Ages 20–69 Years. The Lancet 2000, 355, 1822. [Google Scholar] [CrossRef] [PubMed]
- Ali, M.; Wani, S.U.D.; Salahuddin, M.; S. N., M.; K, M.; Dey, T.; Zargar, M.I.; Singh, J. Recent Advance of Herbal Medicines in Cancer- a Molecular Approach. Heliyon 2023, 9, e13684. [Google Scholar] [CrossRef]
- Mahmod, A.I.; Talib, W.H. Anticancer Activity of Mandragora Autumnalis: An in Vitro and in Vivo Study. PHAR 2021, 68, 827–835. [Google Scholar] [CrossRef]
- Benítez, G.; Leonti, M.; Böck, B.; Vulfsons, S.; Dafni, A. The Rise and Fall of Mandrake in Medicine. Journal of Ethnopharmacology 2023, 303, 115874. [Google Scholar] [CrossRef]
- Monadi, T.; Azadbakht, M.; Ahmadi, A.; Chabra, A. A Comprehensive Review on the Ethnopharmacology, Phytochemistry, Pharmacology, and Toxicology of the Mandragora Genus; from Folk Medicine to Modern Medicine. CPD 2021, 27, 3609–3637. [Google Scholar] [CrossRef]
- Albahri, G.; Badran, A.; Baki, Z.A.; Alame, M.; Hijazi, A.; Daou, A.; Mesmar, J.E.; Baydoun, E. Mandragora Autumnalis Distribution, Phytochemical Characteristics, and Pharmacological Bioactivities. Pharmaceuticals 2025, 18, 328. [Google Scholar] [CrossRef]
- Halasi, M.; Wang, M.; Chavan, T.S.; Gaponenko, V.; Hay, N.; Gartel, A.L. ROS Inhibitor N -Acetyl- L -Cysteine Antagonizes the Activity of Proteasome Inhibitors. Biochemical Journal 2013, 454, 201–208. [Google Scholar] [CrossRef]
- Davey, M.G.; Hynes, S.O.; Kerin, M.J.; Miller, N.; Lowery, A.J. Ki-67 as a Prognostic Biomarker in Invasive Breast Cancer. Cancers 2021, 13, 4455. [Google Scholar] [CrossRef]
- Boudreau, M.W.; Peh, J.; Hergenrother, P.J. Procaspase-3 Overexpression in Cancer: A Paradoxical Observation with Therapeutic Potential. ACS Chem. Biol. 2019, 14, 2335–2348. [Google Scholar] [CrossRef]
- Banta, K.L.; Wang, X.; Das, P.; Winoto, A. B Cell Lymphoma 2 (Bcl-2) Residues Essential for Bcl-2’s Apoptosis-Inducing Interaction with Nur77/Nor-1 Orphan Steroid Receptors. Journal of Biological Chemistry 2018, 293, 4724–4734. [Google Scholar] [CrossRef]
- Qian, S.; Wei, Z.; Yang, W.; Huang, J.; Yang, Y.; Wang, J. The Role of BCL-2 Family Proteins in Regulating Apoptosis and Cancer Therapy. Front. Oncol. 2022, 12, 985363. [Google Scholar] [CrossRef]
- Kalluri, R.; Weinberg, R.A. The Basics of Epithelial-Mesenchymal Transition. J. Clin. Invest. 2009, 119, 1420–1428. [Google Scholar] [CrossRef]
- Troyanovsky, S.M. Adherens Junction: The Ensemble of Specialized Cadherin Clusters. Trends in Cell Biology 2023, 33, 374–387. [Google Scholar] [CrossRef] [PubMed]
- Hamidi, H.; Ivaska, J. Every Step of the Way: Integrins in Cancer Progression and Metastasis. Nat Rev Cancer 2018, 18, 533–548. [Google Scholar] [CrossRef] [PubMed]
- Krakhmal, N.V.; Zavyalova, M.V.; Denisov, E.V.; Vtorushin, S.V.; Perelmuter, V.M. Cancer Invasion: Patterns and Mechanisms. Acta Naturae 2015, 7, 17–28. [Google Scholar] [CrossRef] [PubMed]
- Fares, J.; Fares, M.Y.; Khachfe, H.H.; Salhab, H.A.; Fares, Y. Molecular Principles of Metastasis: A Hallmark of Cancer Revisited. Sig Transduct Target Ther 2020, 5, 28. [Google Scholar] [CrossRef]
- Wang, H.; Man, Q.; Huo, F.; Gao, X.; Lin, H.; Li, S.; Wang, J.; Su, F.; Cai, L.; Shi, Y.; et al. STAT3 Pathway in Cancers: Past, Present, and Future. MedComm 2022, 3, e124. [Google Scholar] [CrossRef]
- Mustafa, S.; Koran, S.; AlOmair, L. Insights Into the Role of Matrix Metalloproteinases in Cancer and Its Various Therapeutic Aspects: A Review. Front. Mol. Biosci. 2022, 9, 896099. [Google Scholar] [CrossRef]
- Rivlin, N.; Brosh, R.; Oren, M.; Rotter, V. Mutations in the P53 Tumor Suppressor Gene: Important Milestones at the Various Steps of Tumorigenesis. Genes & Cancer 2011, 2, 466–474. [Google Scholar] [CrossRef] [PubMed]
- Yue, J.; López, J.M. Understanding MAPK Signaling Pathways in Apoptosis. IJMS 2020, 21, 2346. [Google Scholar] [CrossRef] [PubMed]
- Cress, D.; Engel, B.; Santiago-Cardona, P. The Retinoblastoma Protein: A Master Tumor Suppressor Acts as a Link between Cell Cycle and Cell Adhesion. CHC 2014, 1. [Google Scholar] [CrossRef] [PubMed]
- Saman, H.; Raza, S.S.; Uddin, S.; Rasul, K. Inducing Angiogenesis, a Key Step in Cancer Vascularization, and Treatment Approaches. Cancers 2020, 12, 1172. [Google Scholar] [CrossRef]
- Njau, M.N.; Jacob, J. Inducible Nitric Oxide Synthase Is Crucial for Plasma Cell Survival. Nat Immunol 2014, 15, 219–221. [Google Scholar] [CrossRef]
- Nørregaard, R.; Kwon, T.-H.; Frøkiær, J. Physiology and Pathophysiology of Cyclooxygenase-2 and Prostaglandin E2 in the Kidney. Kidney Research and Clinical Practice 2015, 34, 194–200. [Google Scholar] [CrossRef]
- Aarland, R.C.; Bañuelos-Hernández, A.E.; Fragoso-Serrano, M.; Sierra-Palacios, E.D.C.; Díaz De León-Sánchez, F.; Pérez-Flores, L.J.; Rivera-Cabrera, F.; Mendoza-Espinoza, J.A. Studies on Phytochemical, Antioxidant, Anti-Inflammatory, Hypoglycaemic and Antiproliferative Activities of Echinacea Purpurea and Echinacea Angustifolia Extracts. Pharmaceutical Biology 2017, 55, 649–656. [Google Scholar] [CrossRef]
- Newman, D.J.; Cragg, G.M. Natural Products As Sources of New Drugs over the 30 Years from 1981 to 2010. J. Nat. Prod. 2012, 75, 311–335. [Google Scholar] [CrossRef]
- Bhattacharya, A. Effect of High-Temperature Stress on Crop Productivity. In Effect of High Temperature on Crop Productivity and Metabolism of Macro Molecules; Elsevier, 2019; pp. 1–114 ISBN 978-0-12-817562-0.
- Huang, W.-Y.; Cai, Y.-Z.; Zhang, Y. Natural Phenolic Compounds From Medicinal Herbs and Dietary Plants: Potential Use for Cancer Prevention. Nutrition and Cancer 2009, 62, 1–20. [Google Scholar] [CrossRef]
- Al-Maharik, N.; Jaradat, N.; Bassalat, N.; Hawash, M.; Zaid, H. Isolation, Identification and Pharmacological Effects of Mandragora Autumnalis Fruit Flavonoids Fraction. Molecules 2022, 27, 1046. [Google Scholar] [CrossRef]
- Ammendola, M.; Haponska, M.; Balik, K.; Modrakowska, P.; Matulewicz, K.; Kazmierski, L.; Lis, A.; Kozlowska, J.; Garcia-Valls, R.; Giamberini, M.; et al. Stability and Anti-Proliferative Properties of Biologically Active Compounds Extracted from Cistus L. after Sterilization Treatments. Sci Rep 2020, 10, 6521. [Google Scholar] [CrossRef]
- Obidiro, O.; Battogtokh, G.; Akala, E.O. Triple Negative Breast Cancer Treatment Options and Limitations: Future Outlook. Pharmaceutics 2023, 15, 1796. [Google Scholar] [CrossRef] [PubMed]
- Liang, J.; Wen, T.; Zhang, X.; Luo, X. Chlorogenic Acid as a Potential Therapeutic Agent for Cholangiocarcinoma. Pharmaceuticals 2024, 17, 794. [Google Scholar] [CrossRef] [PubMed]
- Zeng, A.; Liang, X.; Zhu, S.; Liu, C.; Wang, S.; Zhang, Q.; Zhao, J.; Song, L. Chlorogenic Acid Induces Apoptosis, Inhibits Metastasis and Improves Antitumor Immunity in Breast Cancer via the NF-κB Signaling Pathway. Oncol Rep 2020, 45, 717–727. [Google Scholar] [CrossRef] [PubMed]
- Ovadje, P.; Chochkeh, M.; Akbari-Asl, P.; Hamm, C.; Pandey, S. Selective Induction of Apoptosis and Autophagy Through Treatment With Dandelion Root Extract in Human Pancreatic Cancer Cells. Pancreas 2012, 41, 1039–1047. [Google Scholar] [CrossRef]
- Ganeshpurkar, A.; Saluja, A.K. The Pharmacological Potential of Rutin. Saudi Pharmaceutical Journal 2017, 25, 149–164. [Google Scholar] [CrossRef]
- Yoshida, T.; Ozawa, Y.; Kimura, T.; Sato, Y.; Kuznetsov, G.; Xu, S.; Uesugi, M.; Agoulnik, S.; Taylor, N.; Funahashi, Y.; et al. Eribulin Mesilate Suppresses Experimental Metastasis of Breast Cancer Cells by Reversing Phenotype from Epithelial–Mesenchymal Transition (EMT) to Mesenchymal–Epithelial Transition (MET) States. Br J Cancer 2014, 110, 1497–1505. [Google Scholar] [CrossRef]
- Brown, J.S.; Amend, S.R.; Austin, R.H.; Gatenby, R.A.; Hammarlund, E.U.; Pienta, K.J. Updating the Definition of Cancer. Molecular Cancer Research 2023, 21, 1142–1147. [Google Scholar] [CrossRef]
- Mrouj, K.; Andrés-Sánchez, N.; Dubra, G.; Singh, P.; Sobecki, M.; Chahar, D.; Al Ghoul, E.; Aznar, A.B.; Prieto, S.; Pirot, N.; et al. Ki-67 Regulates Global Gene Expression and Promotes Sequential Stages of Carcinogenesis. Proc. Natl. Acad. Sci. U.S.A. 2021, 118, e2026507118. [Google Scholar] [CrossRef]
- Yuan, L.; Cai, Y.; Zhang, L.; Liu, S.; Li, P.; Li, X. Promoting Apoptosis, a Promising Way to Treat Breast Cancer With Natural Products: A Comprehensive Review. Front. Pharmacol. 2022, 12, 801662. [Google Scholar] [CrossRef]
- Carneiro, B.A.; El-Deiry, W.S. Targeting Apoptosis in Cancer Therapy. Nat Rev Clin Oncol 2020, 17, 395–417. [Google Scholar] [CrossRef]
- Kamalabadi-Farahani, M.; H Najafabadi, M.R.; Jabbarpour, Z. Apoptotic Resistance of Metastatic Tumor Cells in Triple Negative Breast Cancer: Roles of Death Receptor-5. Asian Pac J Cancer Prev 2019, 20, 1743–1748. [Google Scholar] [CrossRef] [PubMed]
- Abdallah, R.; Shaito, A.A.; Badran, A.; Baydoun, S.; Sobeh, M.; Ouchari, W.; Sahri, N.; Eid, A.H.; Mesmar, J.E.; Baydoun, E. Fractionation and Phytochemical Composition of an Ethanolic Extract of Ziziphus Nummularia Leaves: Antioxidant and Anticancerous Properties in Human Triple Negative Breast Cancer Cells. Front. Pharmacol. 2024, 15, 1331843. [Google Scholar] [CrossRef] [PubMed]
- Wehbe, N.; Badran, A.; Baydoun, S.; Al-Sawalmih, A.; Maresca, M.; Baydoun, E.; Mesmar, J.E. The Antioxidant Potential and Anticancer Activity of Halodule Uninervis Ethanolic Extract against Triple-Negative Breast Cancer Cells. Antioxidants 2024, 13, 726. [Google Scholar] [CrossRef] [PubMed]
- Hernández Borrero, L.J.; El-Deiry, W.S. Tumor Suppressor P53: Biology, Signaling Pathways, and Therapeutic Targeting. Biochimica et Biophysica Acta (BBA) - Reviews on Cancer 2021, 1876, 188556. [Google Scholar] [CrossRef]
- Jain, A.K.; Barton, M.C. P53: Emerging Roles in Stem Cells, Development and Beyond. Development 2018, 145, dev158360. [Google Scholar] [CrossRef]
- Ozaki, T.; Nakagawara, A. Role of P53 in Cell Death and Human Cancers. Cancers 2011, 3, 994–1013. [Google Scholar] [CrossRef]
- Berke, T.P.; Slight, S.H.; Hyder, S.M. Role of Reactivating Mutant P53 Protein in Suppressing Growth and Metastasis of Triple-Negative Breast Cancer. OTT 2022, Volume 15, 23–30. [Google Scholar] [CrossRef]
- Dumaz, N.; Milne, D.M.; Meek, D.W. Protein Kinase CK1 Is a P53-threonine 18 Kinase Which Requires Prior Phosphorylation of Serine 15. FEBS Letters 1999, 463, 312–316. [Google Scholar] [CrossRef]
- Meek, D.W.; Anderson, C.W. Posttranslational Modification of P53: Cooperative Integrators of Function. Cold Spring Harbor Perspectives in Biology 2009, 1, a000950–a000950. [Google Scholar] [CrossRef]
- García-Hernández, L.; García-Ortega, M.B.; Ruiz-Alcalá, G.; Carrillo, E.; Marchal, J.A.; García, M.Á. The P38 MAPK Components and Modulators as Biomarkers and Molecular Targets in Cancer. IJMS 2021, 23, 370. [Google Scholar] [CrossRef]
- Phong, M.S.; Van Horn, R.D.; Li, S.; Tucker-Kellogg, G.; Surana, U.; Ye, X.S. P38 Mitogen-Activated Protein Kinase Promotes Cell Survival in Response to DNA Damage but Is Not Required for the G2 DNA Damage Checkpoint in Human Cancer Cells. Molecular and Cellular Biology 2010, 30, 3816–3826. [Google Scholar] [CrossRef]
- Whitaker, R.H.; Cook, J.G. Stress Relief Techniques: P38 MAPK Determines the Balance of Cell Cycle and Apoptosis Pathways. Biomolecules 2021, 11, 1444. [Google Scholar] [CrossRef] [PubMed]
- Gubern, A.; Joaquin, M.; Marquès, M.; Maseres, P.; Garcia-Garcia, J.; Amat, R.; González-Nuñez, D.; Oliva, B.; Real, F.X.; de Nadal, E.; et al. The N-Terminal Phosphorylation of RB by P38 Bypasses Its Inactivation by CDKs and Prevents Proliferation in Cancer Cells. Molecular Cell 2016, 64, 25–36. [Google Scholar] [CrossRef] [PubMed]
- Liou, G.-Y.; Storz, P. Reactive Oxygen Species in Cancer. Free Radical Research 2010, 44, 479–496. [Google Scholar] [CrossRef]
- Xu, J.; Wu, Y.; Lu, G.; Xie, S.; Ma, Z.; Chen, Z.; Shen, H.-M.; Xia, D. Importance of ROS-Mediated Autophagy in Determining Apoptotic Cell Death Induced by Physapubescin B. Redox Biology 2017, 12, 198–207. [Google Scholar] [CrossRef]
- Liu, D.; Xu, Y. P53, Oxidative Stress, and Aging. Antioxidants & Redox Signaling 2011, 15, 1669–1678. [Google Scholar] [CrossRef]
- Ribatti, D.; Tamma, R.; Annese, T. Epithelial-Mesenchymal Transition in Cancer: A Historical Overview. Translational Oncology 2020, 13, 100773. [Google Scholar] [CrossRef]
- Seyfried, T.N.; Huysentruyt, L.C. On the Origin of Cancer Metastasis. Crit Rev Oncog 2013, 18, 43–73. [Google Scholar] [CrossRef]
- Pearson, G.W. Control of Invasion by Epithelial-to-Mesenchymal Transition Programs during Metastasis. JCM 2019, 8, 646. [Google Scholar] [CrossRef]
- Mekhdjian, A.H.; Kai, F.; Rubashkin, M.G.; Prahl, L.S.; Przybyla, L.M.; McGregor, A.L.; Bell, E.S.; Barnes, J.M.; DuFort, C.C.; Ou, G.; et al. Integrin-Mediated Traction Force Enhances Paxillin Molecular Associations and Adhesion Dynamics That Increase the Invasiveness of Tumor Cells into a Three-Dimensional Extracellular Matrix. MBoC 2017, 28, 1467–1488. [Google Scholar] [CrossRef]
- Fortier, A.-M.; Asselin, E.; Cadrin, M. Keratin 8 and 18 Loss in Epithelial Cancer Cells Increases Collective Cell Migration and Cisplatin Sensitivity through Claudin1 Up-Regulation. Journal of Biological Chemistry 2013, 288, 11555–11571. [Google Scholar] [CrossRef] [PubMed]
- Liao, T.-T.; Yang, M.-H. Hybrid Epithelial/Mesenchymal State in Cancer Metastasis: Clinical Significance and Regulatory Mechanisms. Cells 2020, 9, 623. [Google Scholar] [CrossRef] [PubMed]
- Lorentzen, A.; Bamber, J.; Sadok, A.; Elson-Schwab, I.; Marshall, C.J. An Ezrin-Rich, Rigid Uropod-like Structure Directs Movement of Amoeboid Blebbing Cells. Journal of Cell Science 2011, 124, 1256–1267. [Google Scholar] [CrossRef] [PubMed]
- Plasticity of Cancer Cell Invasion—Mechanisms and Implications for Therapy. In Advances in Cancer Research; Elsevier, 2016; Vol. 132, pp. 209–264 ISBN 978-0-12-804140-6.
- Haeger, A.; Wolf, K.; Zegers, M.M.; Friedl, P. Collective Cell Migration: Guidance Principles and Hierarchies. Trends in Cell Biology 2015, 25, 556–566. [Google Scholar] [CrossRef]
- Jiang, H.; Li, H. Prognostic Values of Tumoral MMP2 and MMP9 Overexpression in Breast Cancer: A Systematic Review and Meta-Analysis. BMC Cancer 2021, 21, 149. [Google Scholar] [CrossRef]
- Desgrosellier, J.S.; Cheresh, D.A. Integrins in Cancer: Biological Implications and Therapeutic Opportunities. Nat Rev Cancer 2010, 10, 9–22. [Google Scholar] [CrossRef]
- El Hasasna, H.; Saleh, A.; Samri, H.A.; Athamneh, K.; Attoub, S.; Arafat, K.; Benhalilou, N.; Alyan, S.; Viallet, J.; Dhaheri, Y.A.; et al. Rhus Coriaria Suppresses Angiogenesis, Metastasis and Tumor Growth of Breast Cancer through Inhibition of STAT3, NFκB and Nitric Oxide Pathways. Sci Rep 2016, 6, 21144. [Google Scholar] [CrossRef]
- Fakhri, S.; Abbaszadeh, F.; Jorjani, M.; Pourgholami, M.H. The Effects of Anticancer Medicinal Herbs on Vascular Endothelial Growth Factor Based on Pharmacological Aspects: A Review Study. Nutrition and Cancer 2021, 73, 1–15. [Google Scholar] [CrossRef]
- Ochwang’i, D.O.; Kimwele, C.N.; Oduma, J.A.; Gathumbi, P.K.; Mbaria, J.M.; Kiama, S.G. Medicinal Plants Used in Treatment and Management of Cancer in Kakamega County, Kenya. Journal of Ethnopharmacology 2014, 151, 1040–1055. [Google Scholar] [CrossRef]
- Nouri, Z.; Fakhri, S.; Nouri, K.; Wallace, C.E.; Farzaei, M.H.; Bishayee, A. Targeting Multiple Signaling Pathways in Cancer: The Rutin Therapeutic Approach. Cancers 2020, 12, 2276. [Google Scholar] [CrossRef]
- Levy, D.E.; Darnell, J.E. STATs: Transcriptional Control and Biological Impact. Nat Rev Mol Cell Biol 2002, 3, 651–662. [Google Scholar] [CrossRef]
- Gu, Y.; Mohammad, I.; Liu, Z. Overview of the STAT-3 Signaling Pathway in Cancer and the Development of Specific Inhibitors (Review). Oncol Lett 2020. [Google Scholar] [CrossRef]
- Hirano, T.; Ishihara, K.; Hibi, M. Roles of STAT3 in Mediating the Cell Growth, Differentiation and Survival Signals Relayed through the IL-6 Family of Cytokine Receptors. Oncogene 2000, 19, 2548–2556. [Google Scholar] [CrossRef] [PubMed]
- Huynh, J.; Chand, A.; Gough, D.; Ernst, M. Therapeutically Exploiting STAT3 Activity in Cancer — Using Tissue Repair as a Road Map. Nat Rev Cancer 2019, 19, 82–96. [Google Scholar] [CrossRef] [PubMed]
- Yu, H.; Pardoll, D.; Jove, R. STATs in Cancer Inflammation and Immunity: A Leading Role for STAT3. Nat Rev Cancer 2009, 9, 798–809. [Google Scholar] [CrossRef] [PubMed]
- Zhu, S.; He, J.; Yin, L.; Zhou, J.; Lian, J.; Ren, Y.; Zhang, X.; Yuan, J.; Wang, G.; Li, X. Matrix Metalloproteinases Targeting in Prostate Cancer. Urologic Oncology: Seminars and Original Investigations 2024, 42, 275–287. [Google Scholar] [CrossRef]
- Barillari, G. The Impact of Matrix Metalloproteinase-9 on the Sequential Steps of the Metastatic Process. IJMS 2020, 21, 4526. [Google Scholar] [CrossRef]
- Bielenberg, D.R.; Zetter, B.R. The Contribution of Angiogenesis to the Process of Metastasis. The Cancer Journal 2015, 21, 267–273. [Google Scholar] [CrossRef]
- Sun, H.; Zhang, D.; Yao, Z.; Lin, X.; Liu, J.; Gu, Q.; Dong, X.; Liu, F.; Wang, Y.; Yao, N.; et al. Anti-Angiogenic Treatment Promotes Triple-Negative Breast Cancer Invasion via Vasculogenic Mimicry. Cancer Biology & Therapy 2017, 18, 205–213. [Google Scholar] [CrossRef]
- Chen, T. Unveiling the Significance of Inducible Nitric Oxide Synthase: Its Impact on Cancer Progression and Clinical Implications. Cancer Letters 2024, 592, 216931. [Google Scholar] [CrossRef]
- Mesmar, J.; Abdallah, R.; Hamade, K.; Baydoun, S.; Al-Thani, N.; Shaito, A.; Maresca, M.; Badran, A.; Baydoun, E. Ethanolic Extract of Origanum Syriacum L. Leaves Exhibits Potent Anti-Breast Cancer Potential and Robust Antioxidant Properties. Front. Pharmacol. 2022, 13, 994025. [Google Scholar] [CrossRef]
Figure 1.
Total ion chromatogram of MAE obtained using LC-MS (the intensity is multiplied by 10^7 a.u.).
Figure 1.
Total ion chromatogram of MAE obtained using LC-MS (the intensity is multiplied by 10^7 a.u.).
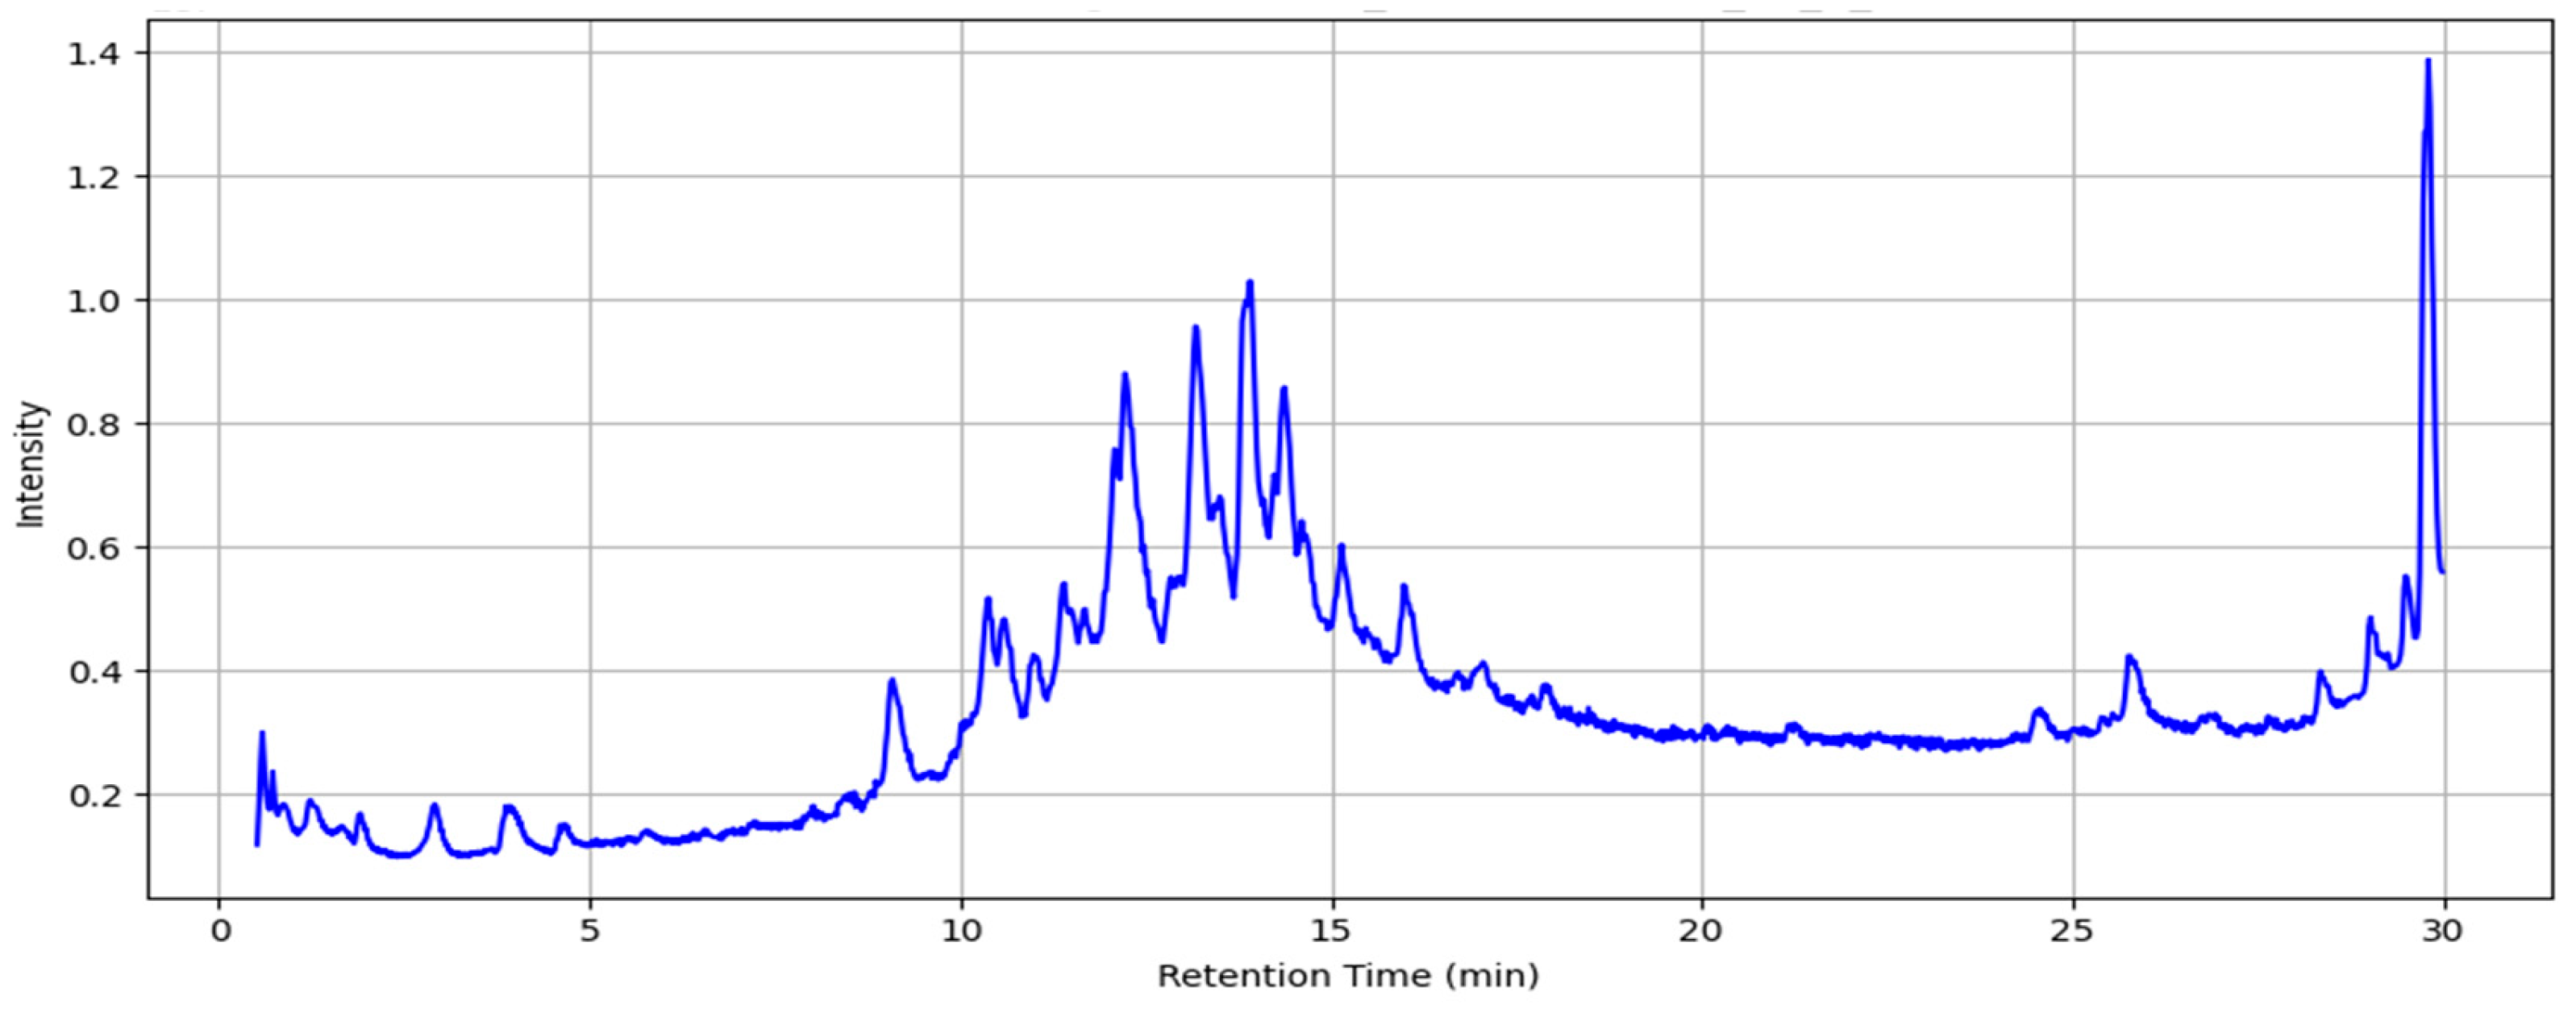
Figure 2.
The antioxidant capacities of various concentrations of MAE (50, 100, 200, 400, and 600 µg/mL) were measured using the DPPH free-radical-scavenging assay. The reference used was ascorbic acid. The values are displayed as the three experiments' average ± standard error (**** p < 0.0001).
Figure 2.
The antioxidant capacities of various concentrations of MAE (50, 100, 200, 400, and 600 µg/mL) were measured using the DPPH free-radical-scavenging assay. The reference used was ascorbic acid. The values are displayed as the three experiments' average ± standard error (**** p < 0.0001).
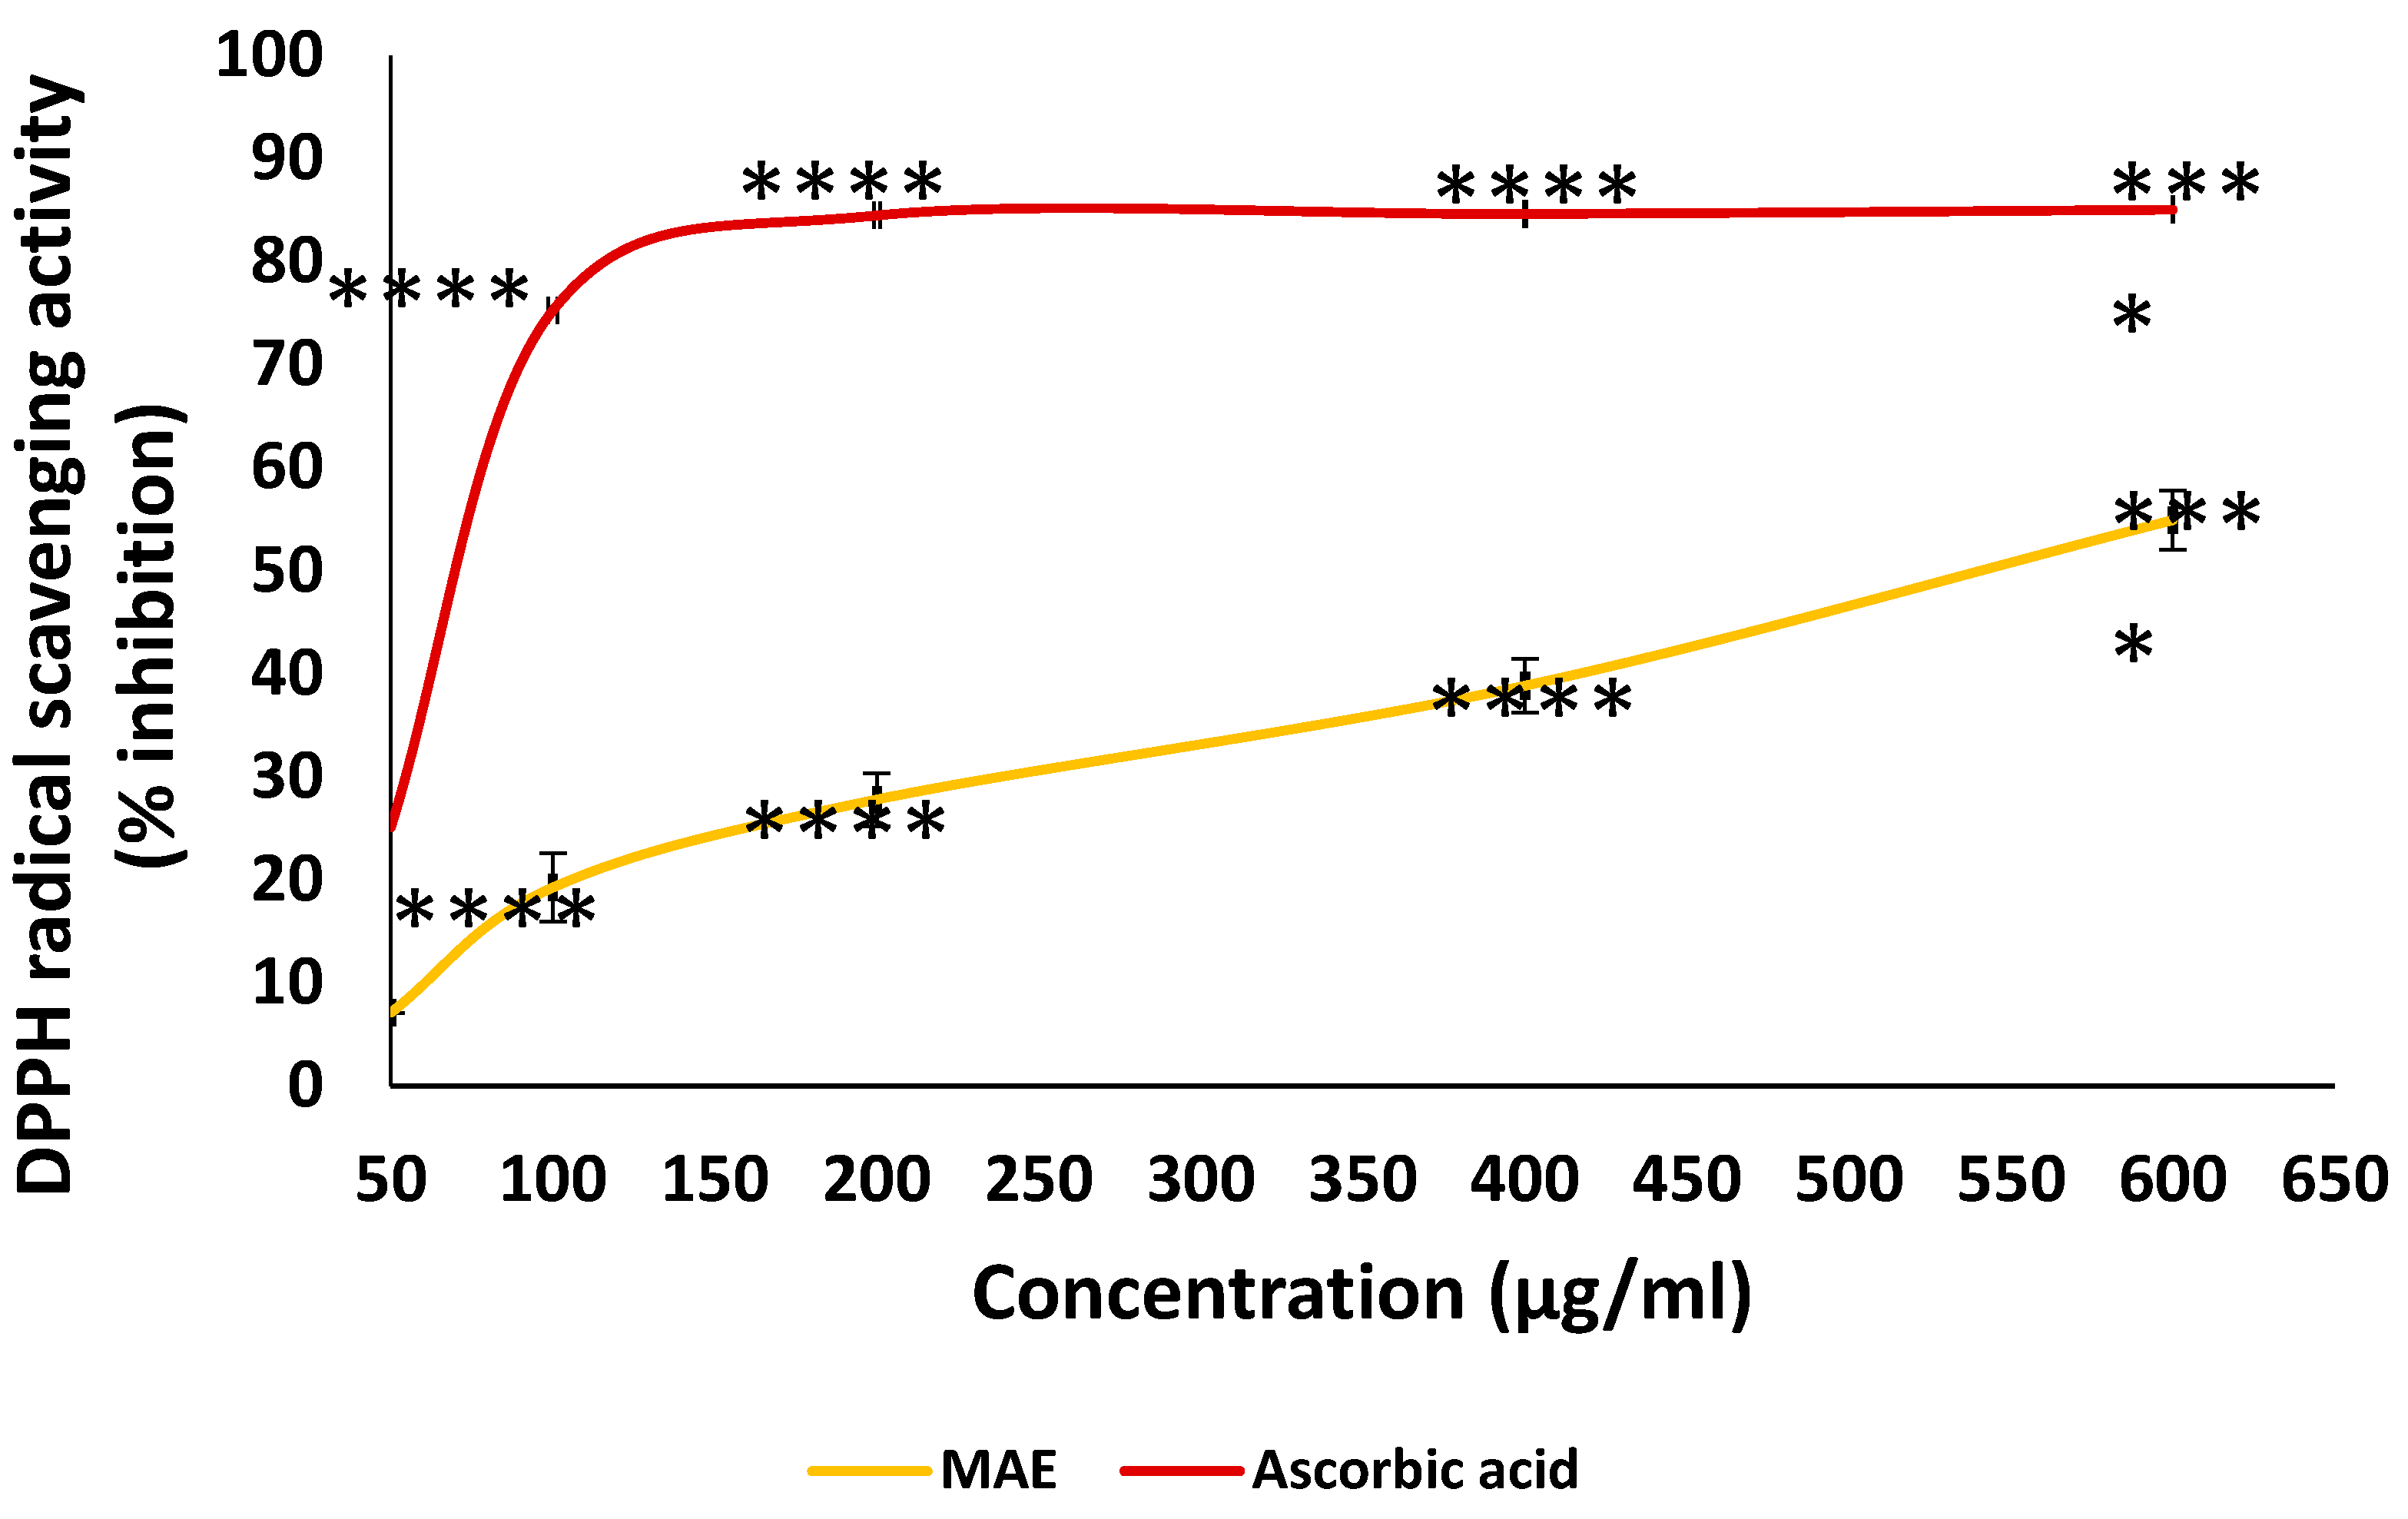
Figure 3.
The cellular proliferation of MDA-MB-231 cancer cells is inhibited by MAE extract. (A) MDA-MB-231 cells received the indicated MAE concentrations for 24, 48, and 72 hours. The MTT assay, detailed in Materials and Methods, was used to assess the viability of the cells. The information is presented as a percentage and shows the mean ± SEM of three separate, triplicate experiments (n = 3), comparable control cells. (B) After 24, 48, and 72 hours of treatment, cell viability was assessed using either the vehicle control or the specified doxorubicin (DOXO) concentrations. (C) MDA-MB-231 cells were pre-treated with NAC (10 mM) for 30 min and then with MAE for 24 h. Values are expressed as % of the vehicle control and are represented as the mean ± SEM of three independent experiments. (D)The indicated concentrations of MAE (100 and 200 μg/mL) were incubated with and without MDA cells for 24 hours. After the cells were lysed, protein lysates were loaded with β-actin and subjected to Western blotting using a Ki67 antibody. The data are presented as a percentage of the corresponding control cells and show the mean ± SEM of three experiments (n = 3). One-way ANOVA was used for statistical analysis, and the LSD post hoc test was used after (*p < 0.05, **p < 0.01, ***p < 0.001, and ****p < 0.0001).
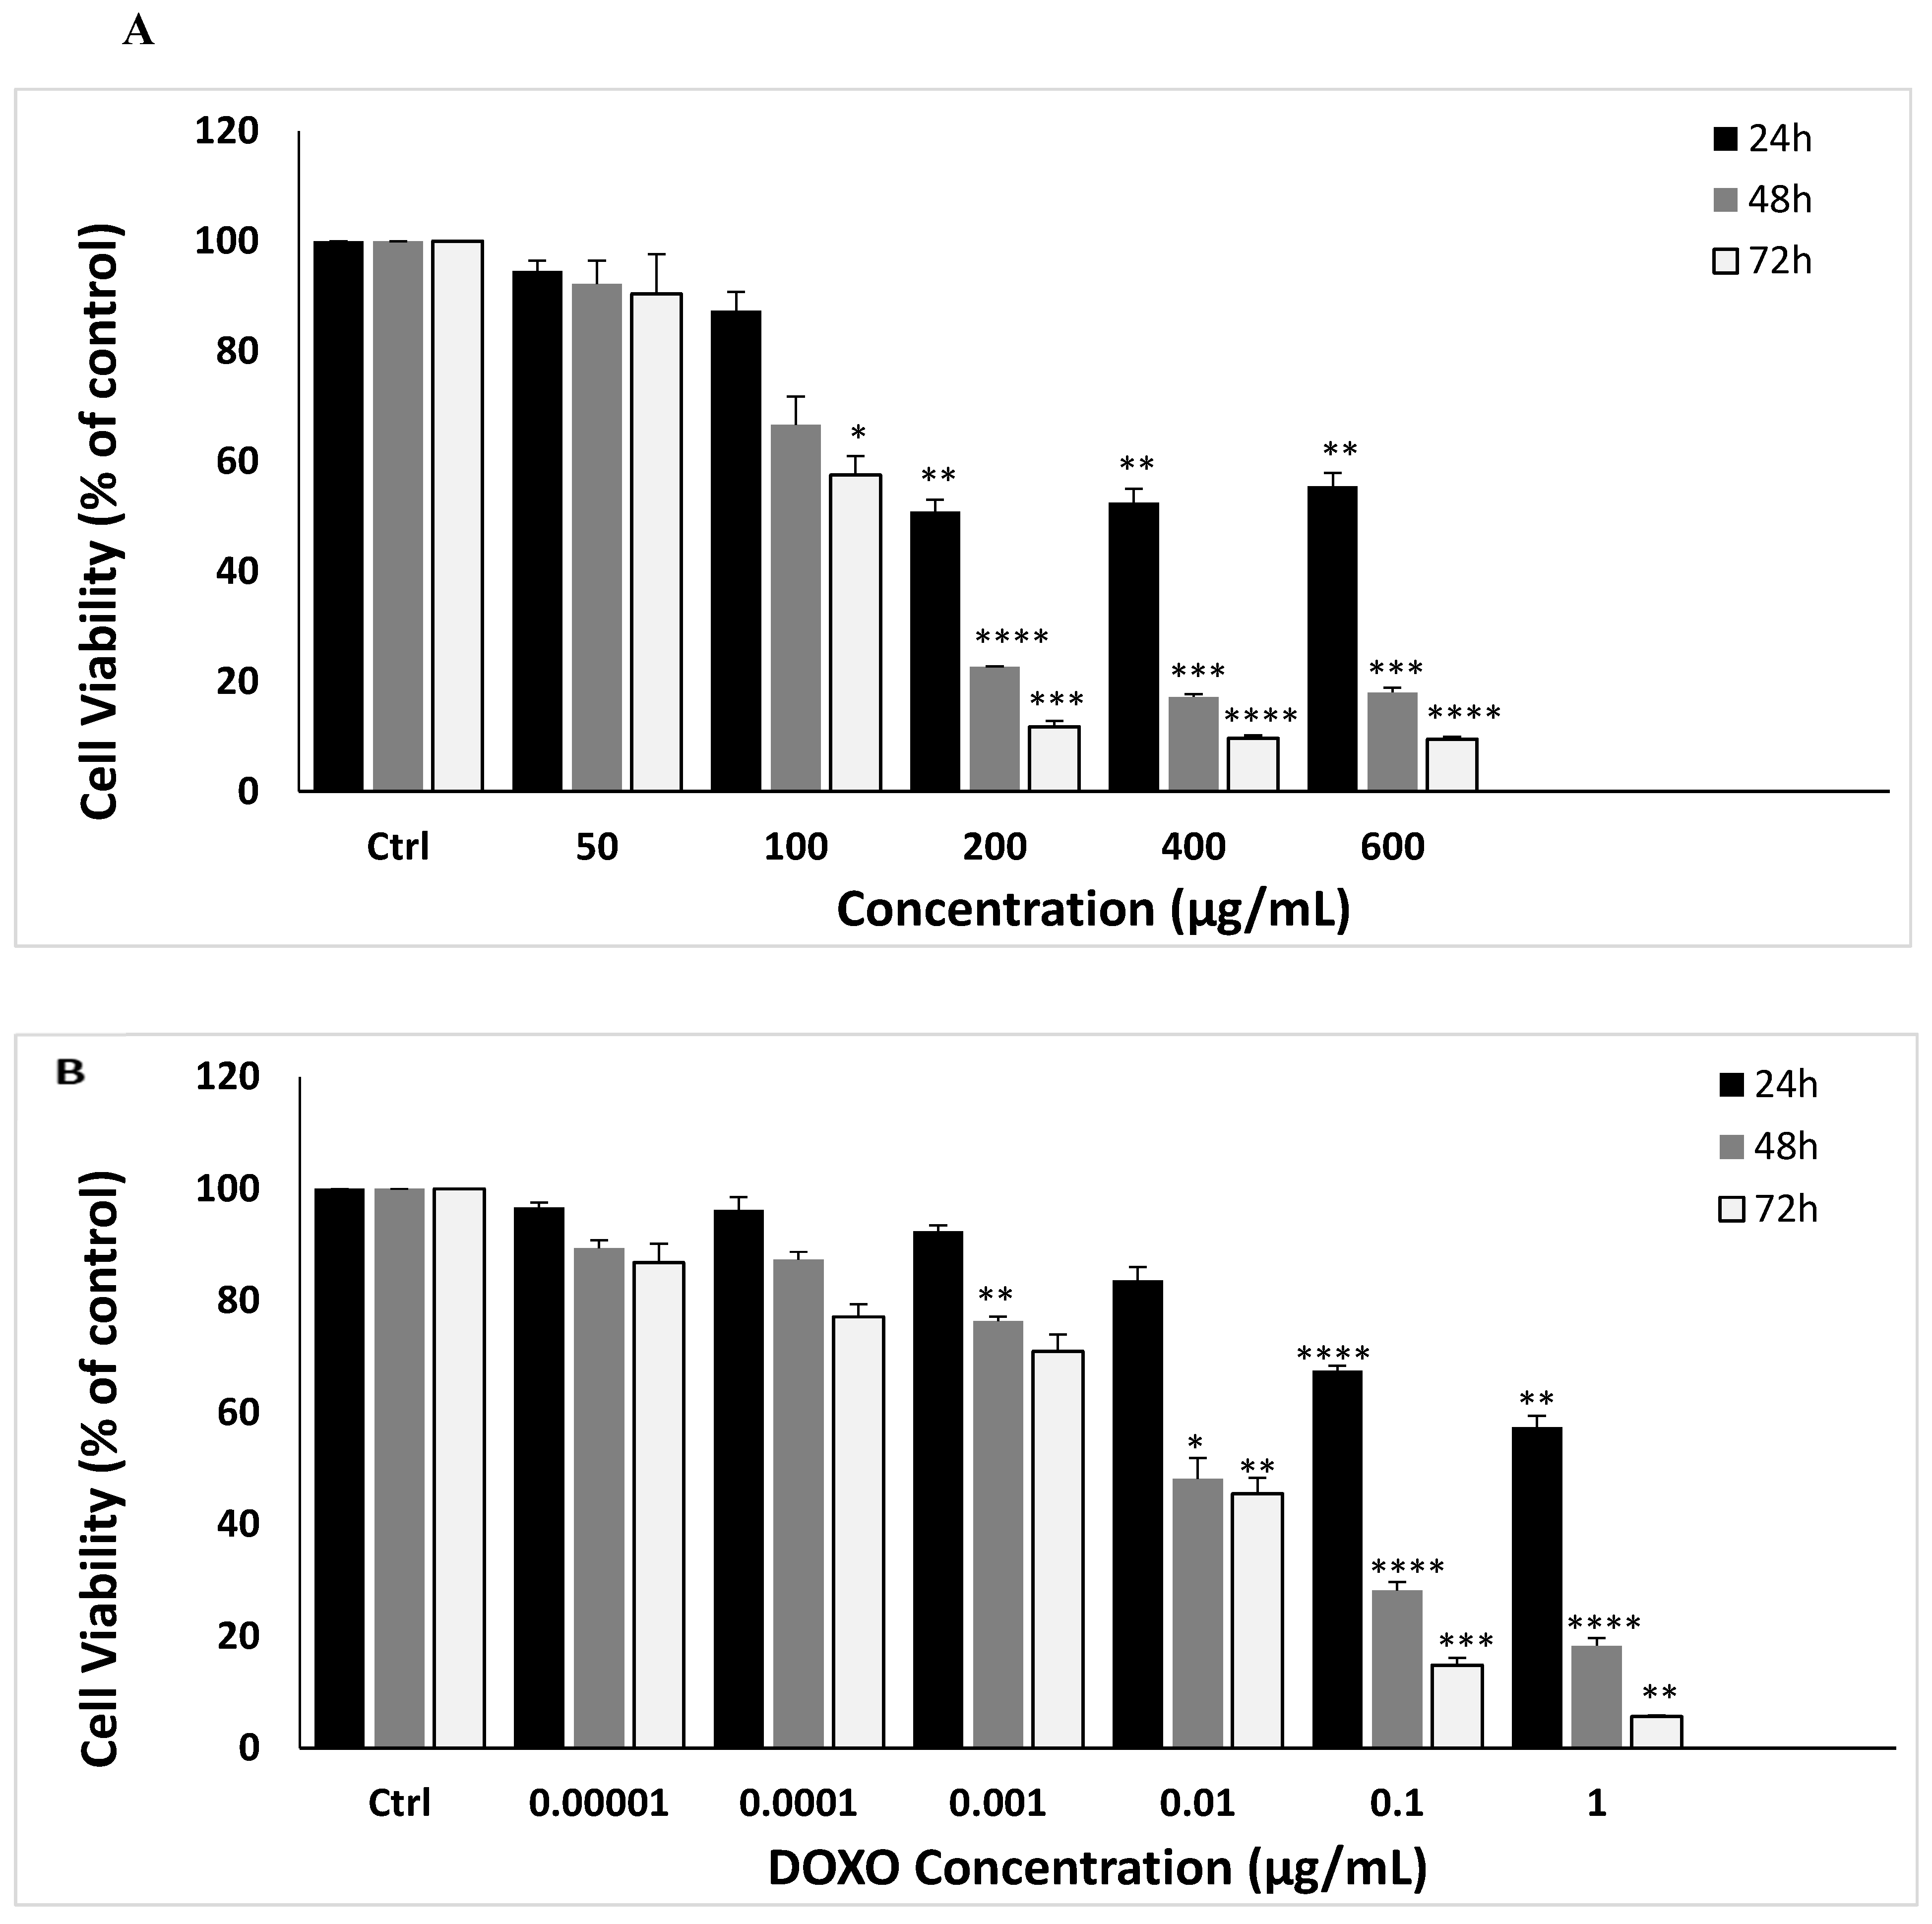
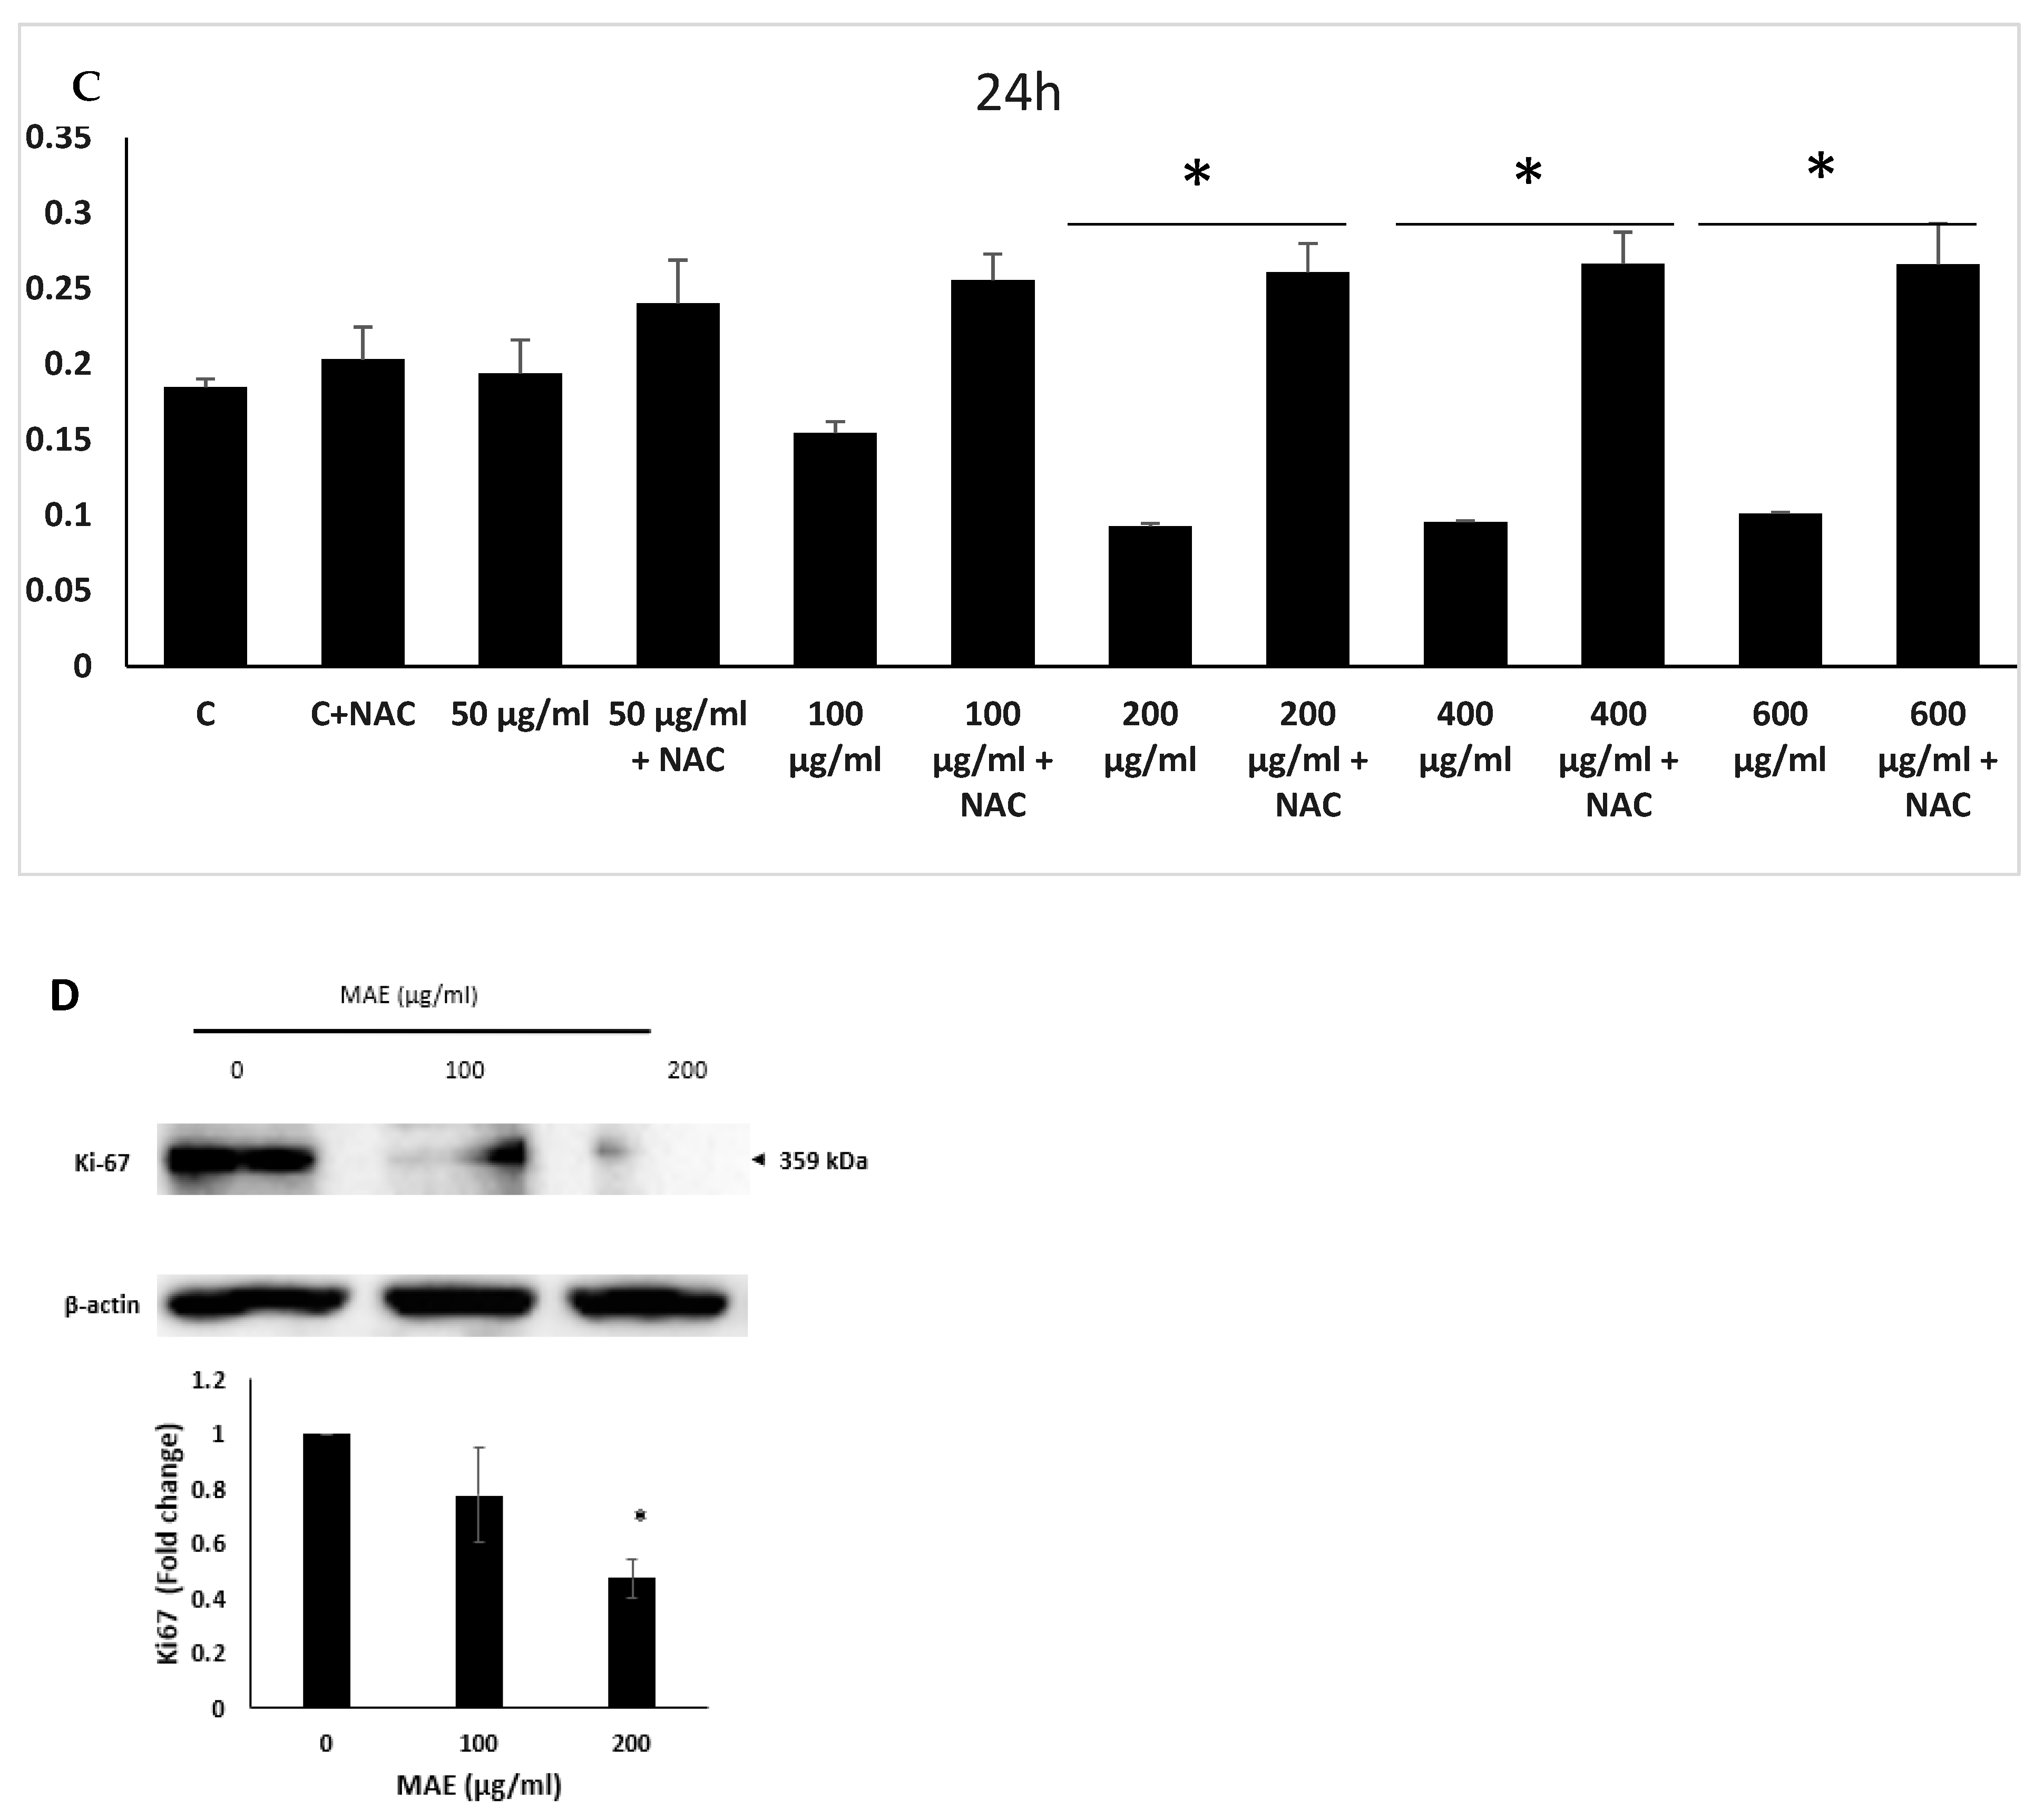
Figure 4.
Changes in the morphology of cells were observed using light optical microscopy. Apoptotic bodies, echinoid spikes, membrane blebbing, and cell shrinkage are all indicated by arrows. (A) For 24 and 48 hours, cells were treated with either a vehicle-containing control or MAE (100 or 200 µg/mL). (B) After that, they were stained with DAPI so that fluorescence microscopy could be used to see changes in nuclear morphology. Photos were captured with a 10× magnification. Arrows depict chromatin lysis, nuclear condensation, and apoptotic bodies. (C) MAE (100 or 200 µg/mL) or a vehicle-containing control was used to treat the cells. Using Western blotting, the protein levels of procaspase 3, cleaved caspase 3, Bcl2, and Bax were ascertained. Loading control was established using β-actin. The three separate experiments' mean ± SEM (n = 3) is represented by the data. (*** indicates p < 0.001, and ** indicates p < 0.005).
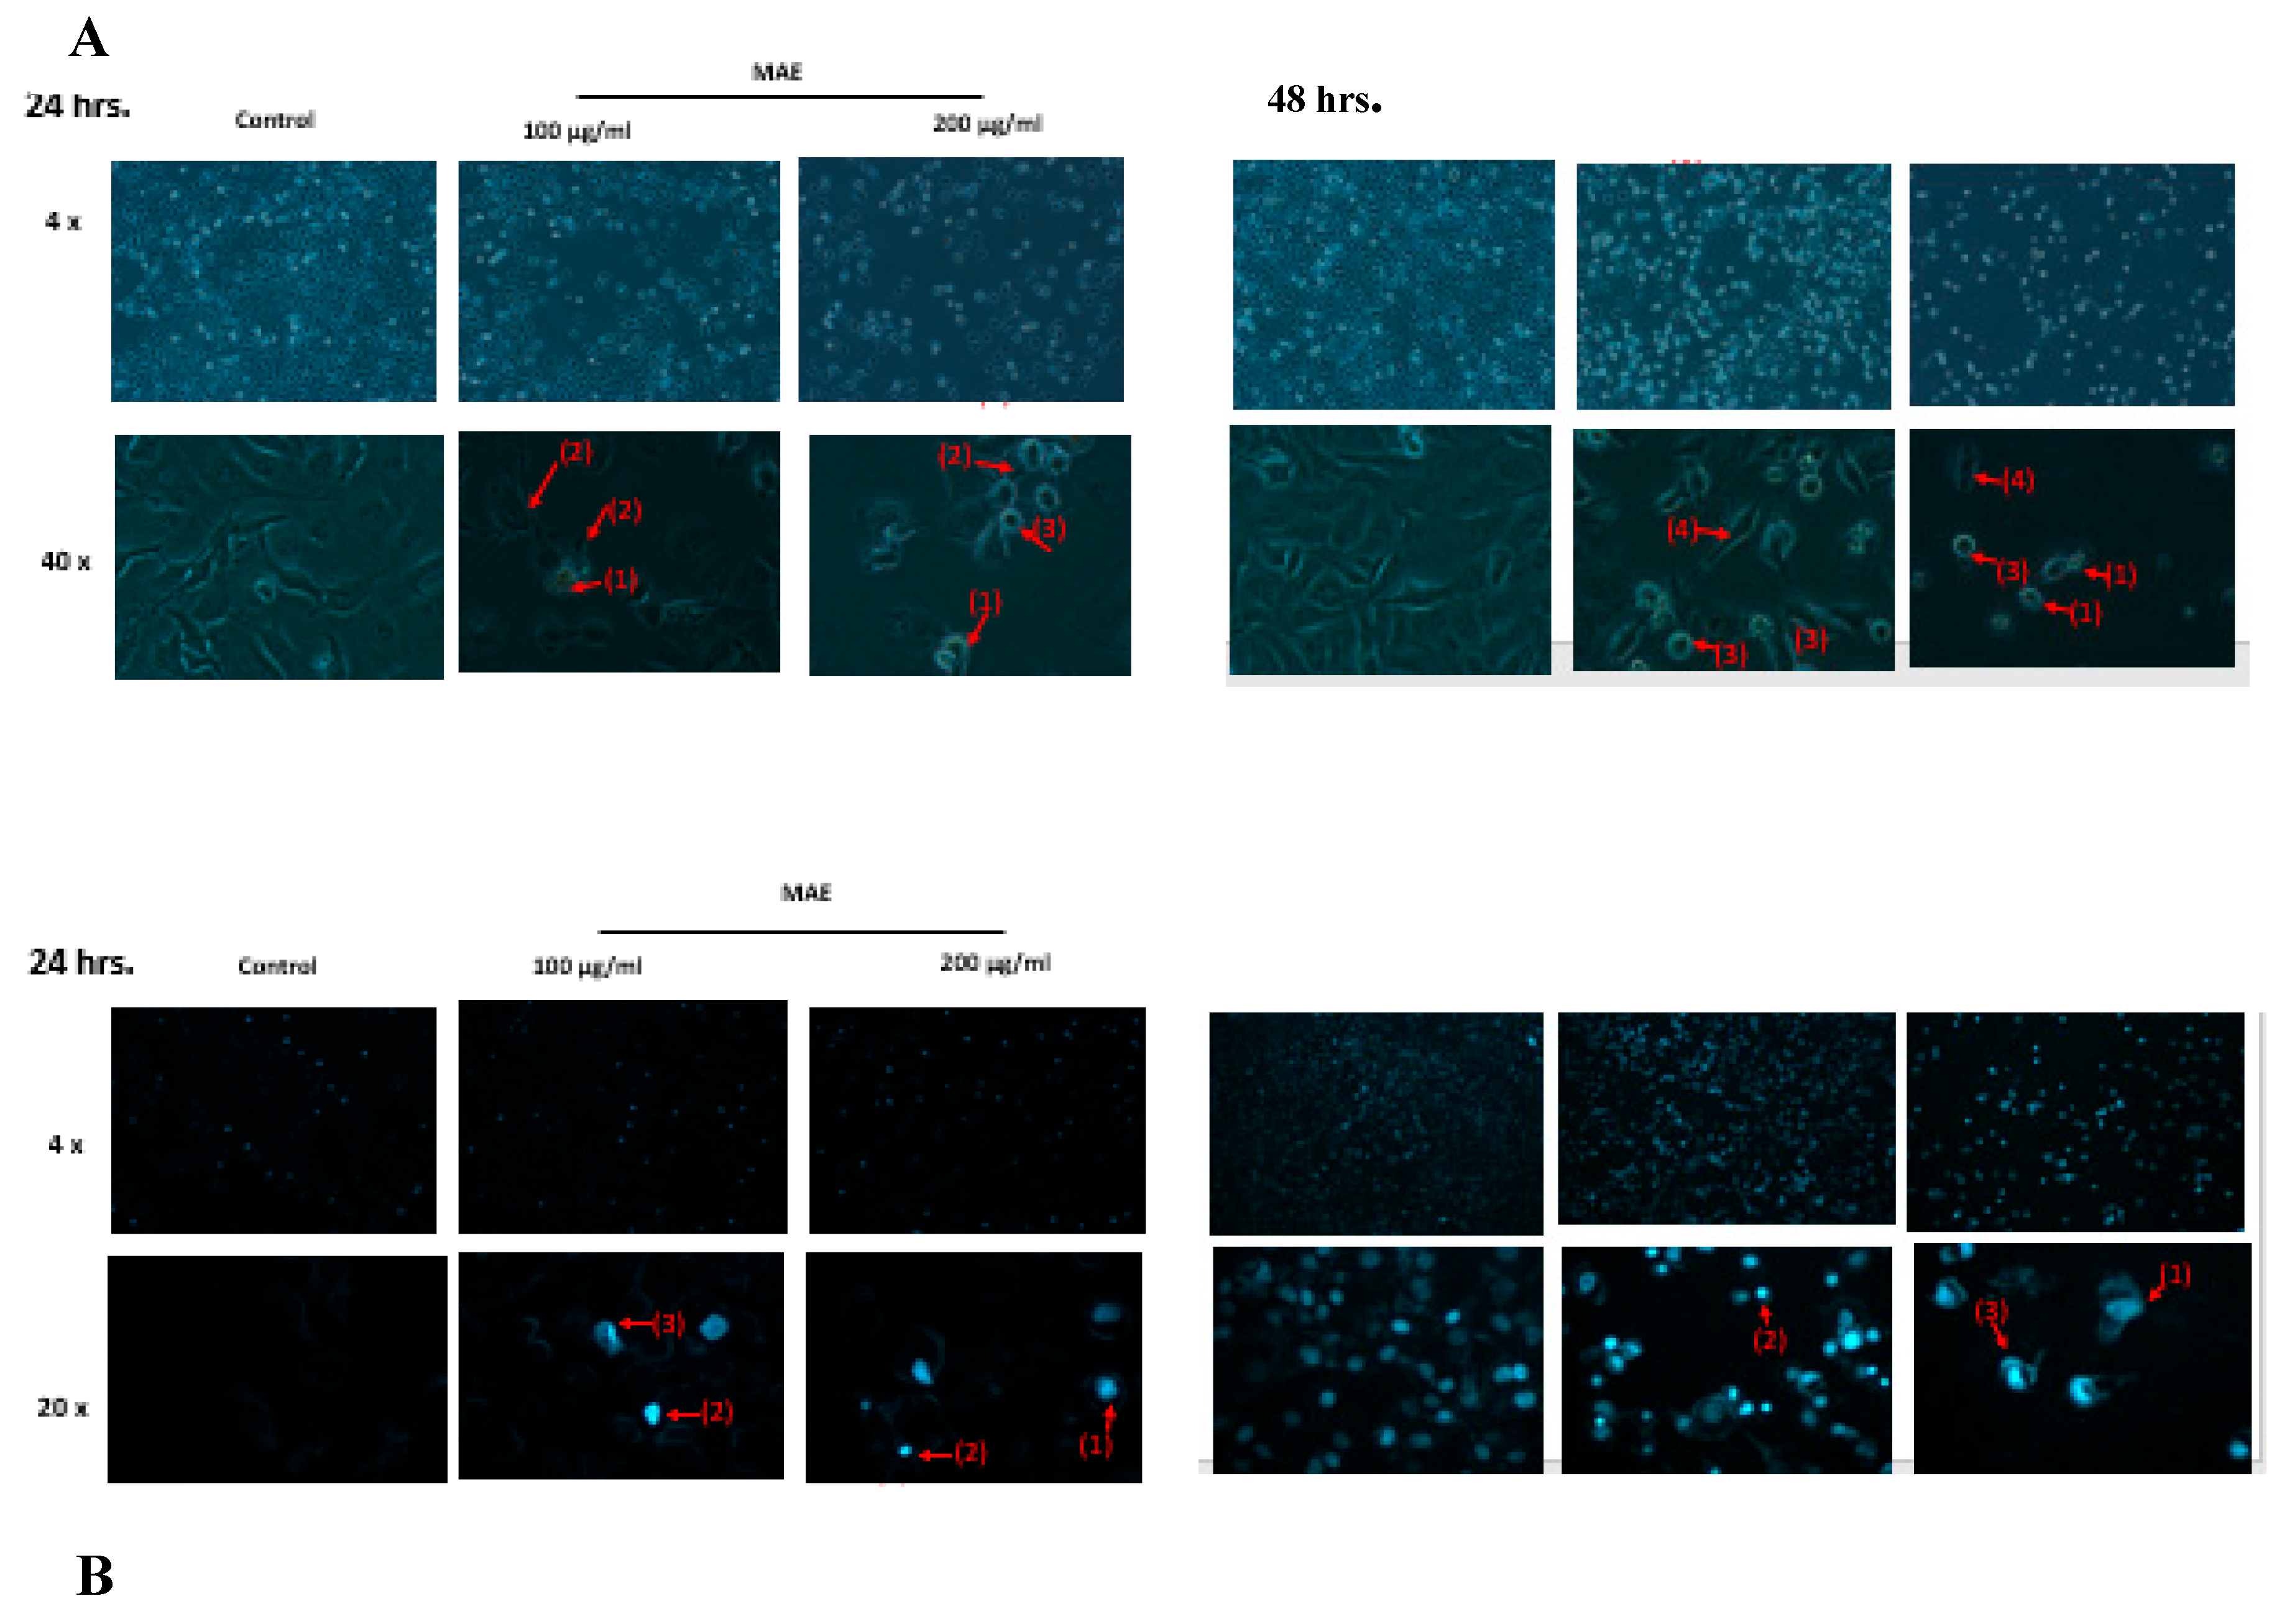
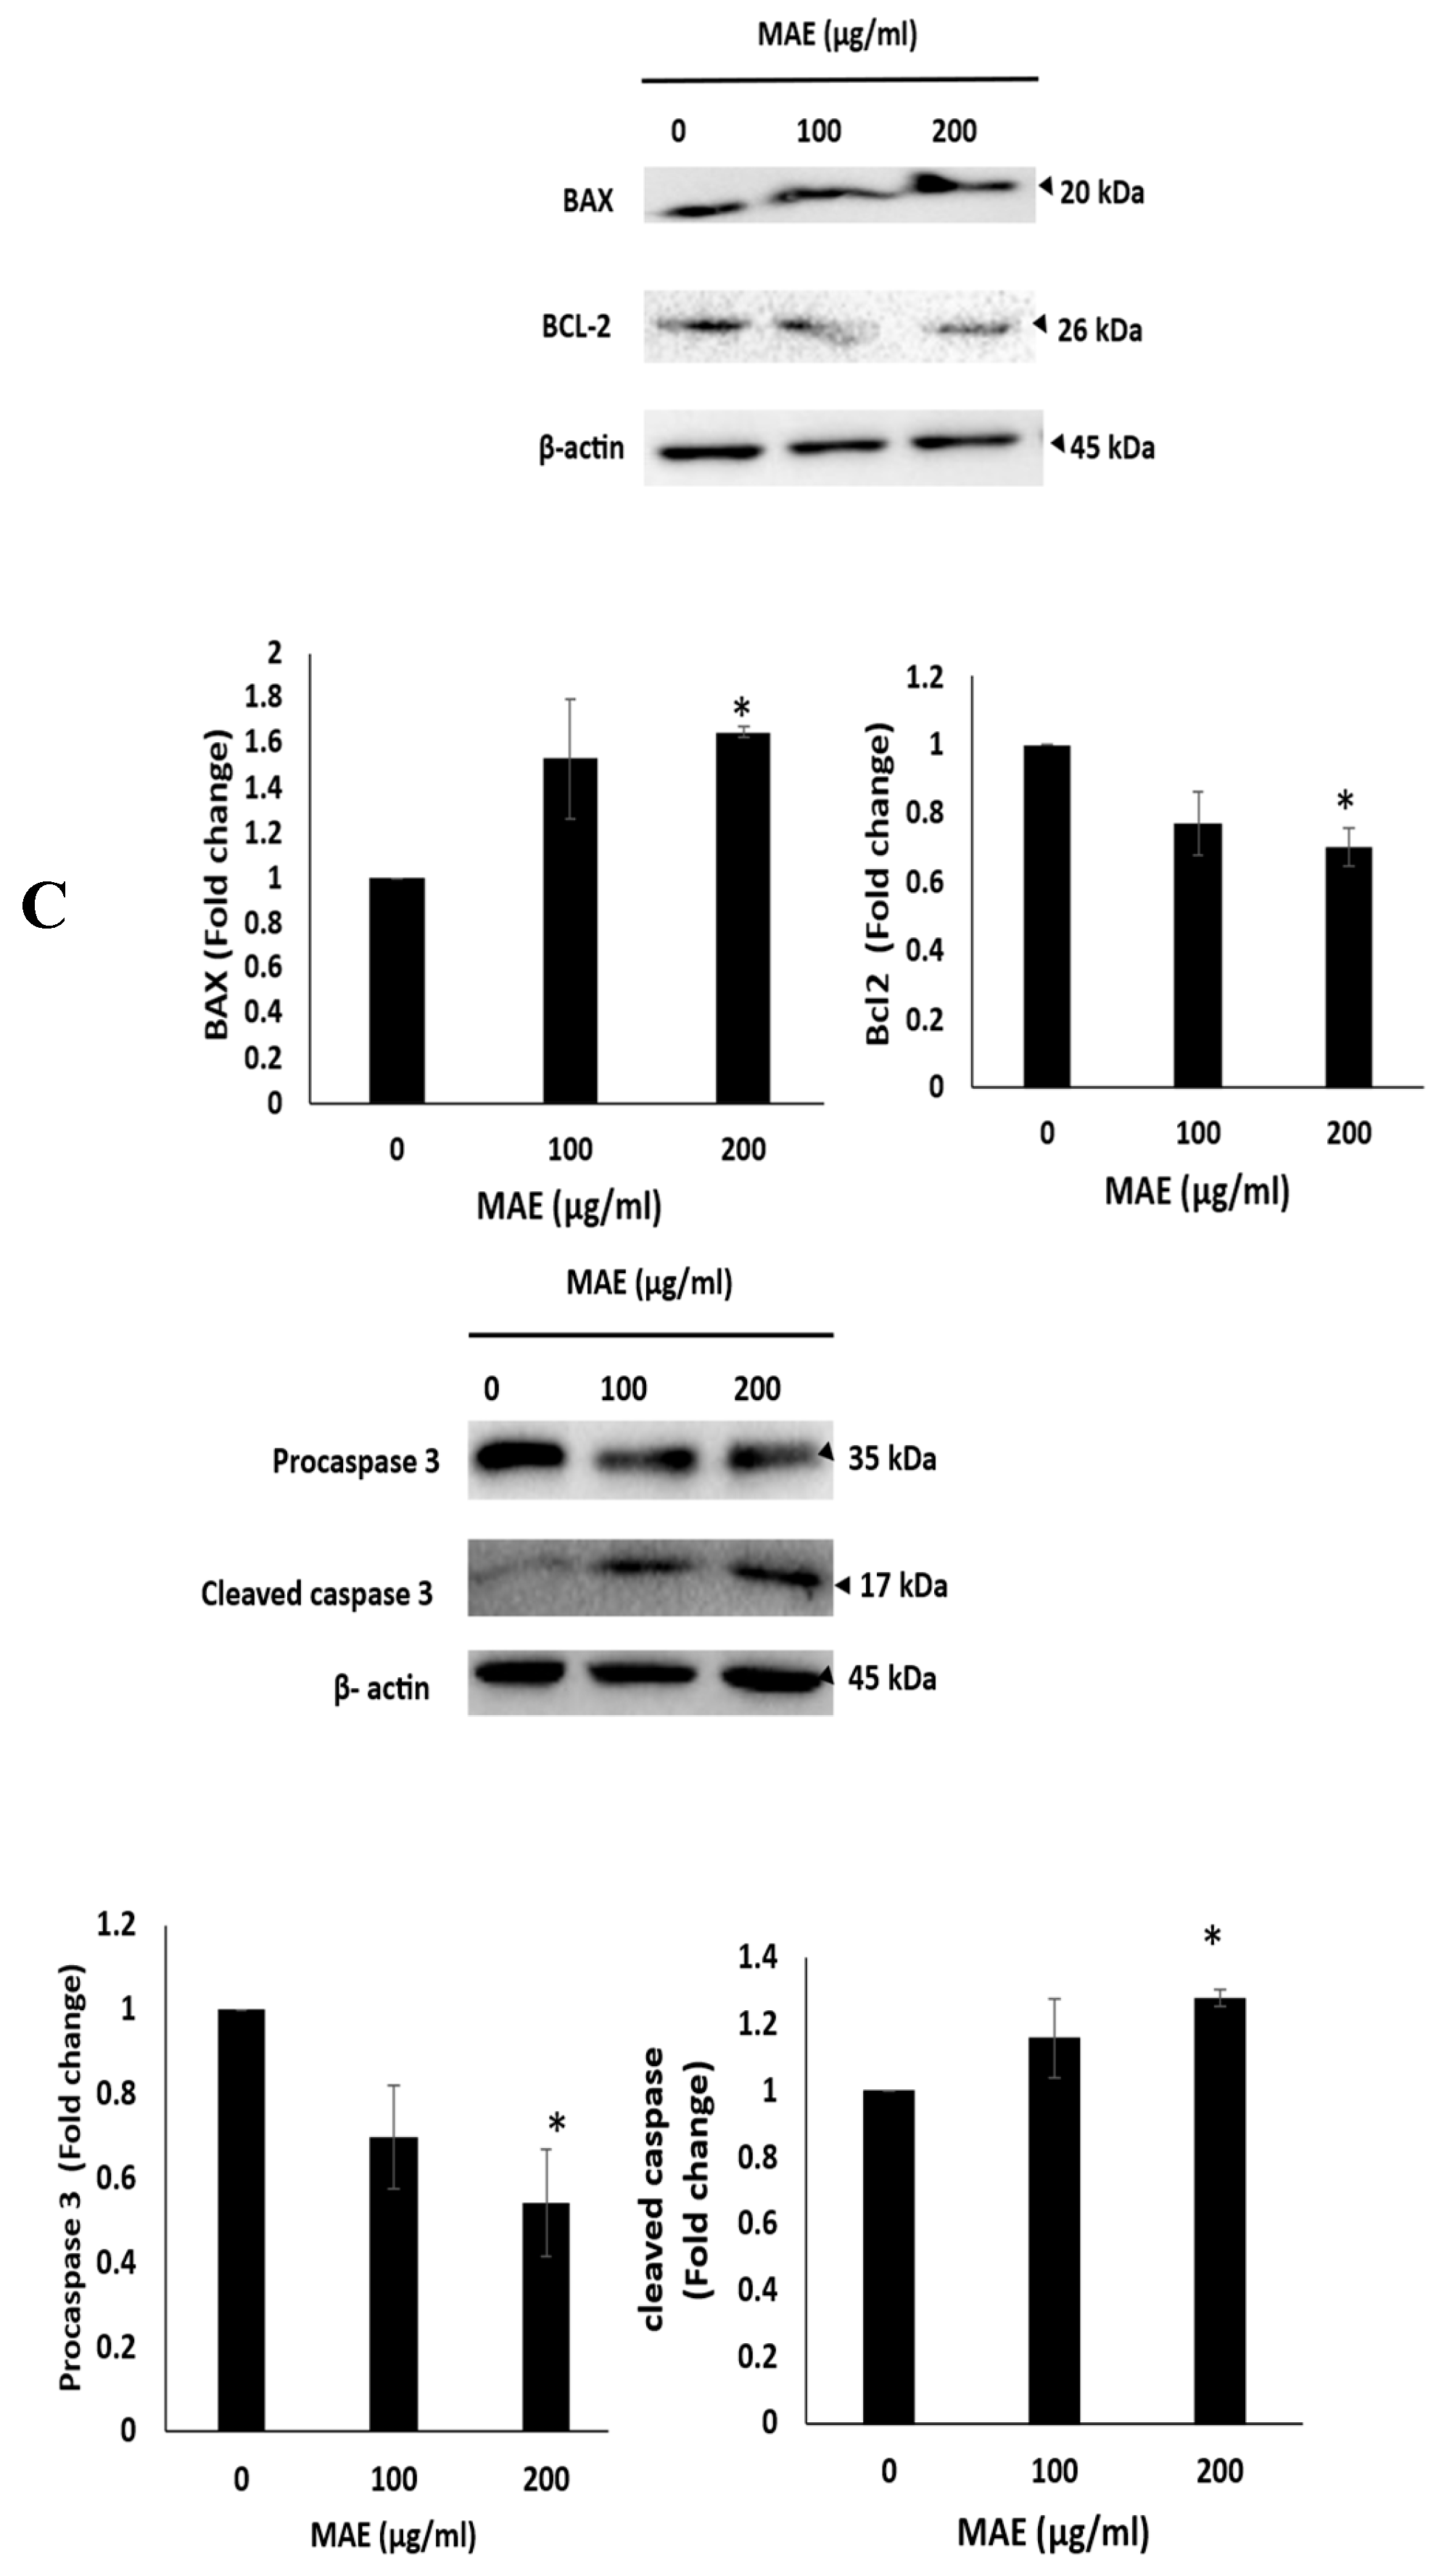
Figure 5.
MAE promotes intercellular aggregation, and E-cadherin levels in MDA-MB-231 breast cancer cells. After incubating MDA-MB-231 cells with either 100 or 200 µg/mL of MAE or a vehicle-containing control, the cells were tested for cell aggregation. The cells were photographed at a magnification of 4× after 4 hours, and the percentage of cell-cell aggregates was calculated as mentioned in the Materials and Methods section. Western blotting was used to analyze the protein levels of E-cadherin, using β-actin as a loading control where MAE (100 or 200 µg/mL) or a vehicle-containing control was applied to MDA-MB-231 cells for 24 hours. The three separate experiments' mean ± SEM (n = 3) is represented by the data (p* < 0.05, p **< 0.005).
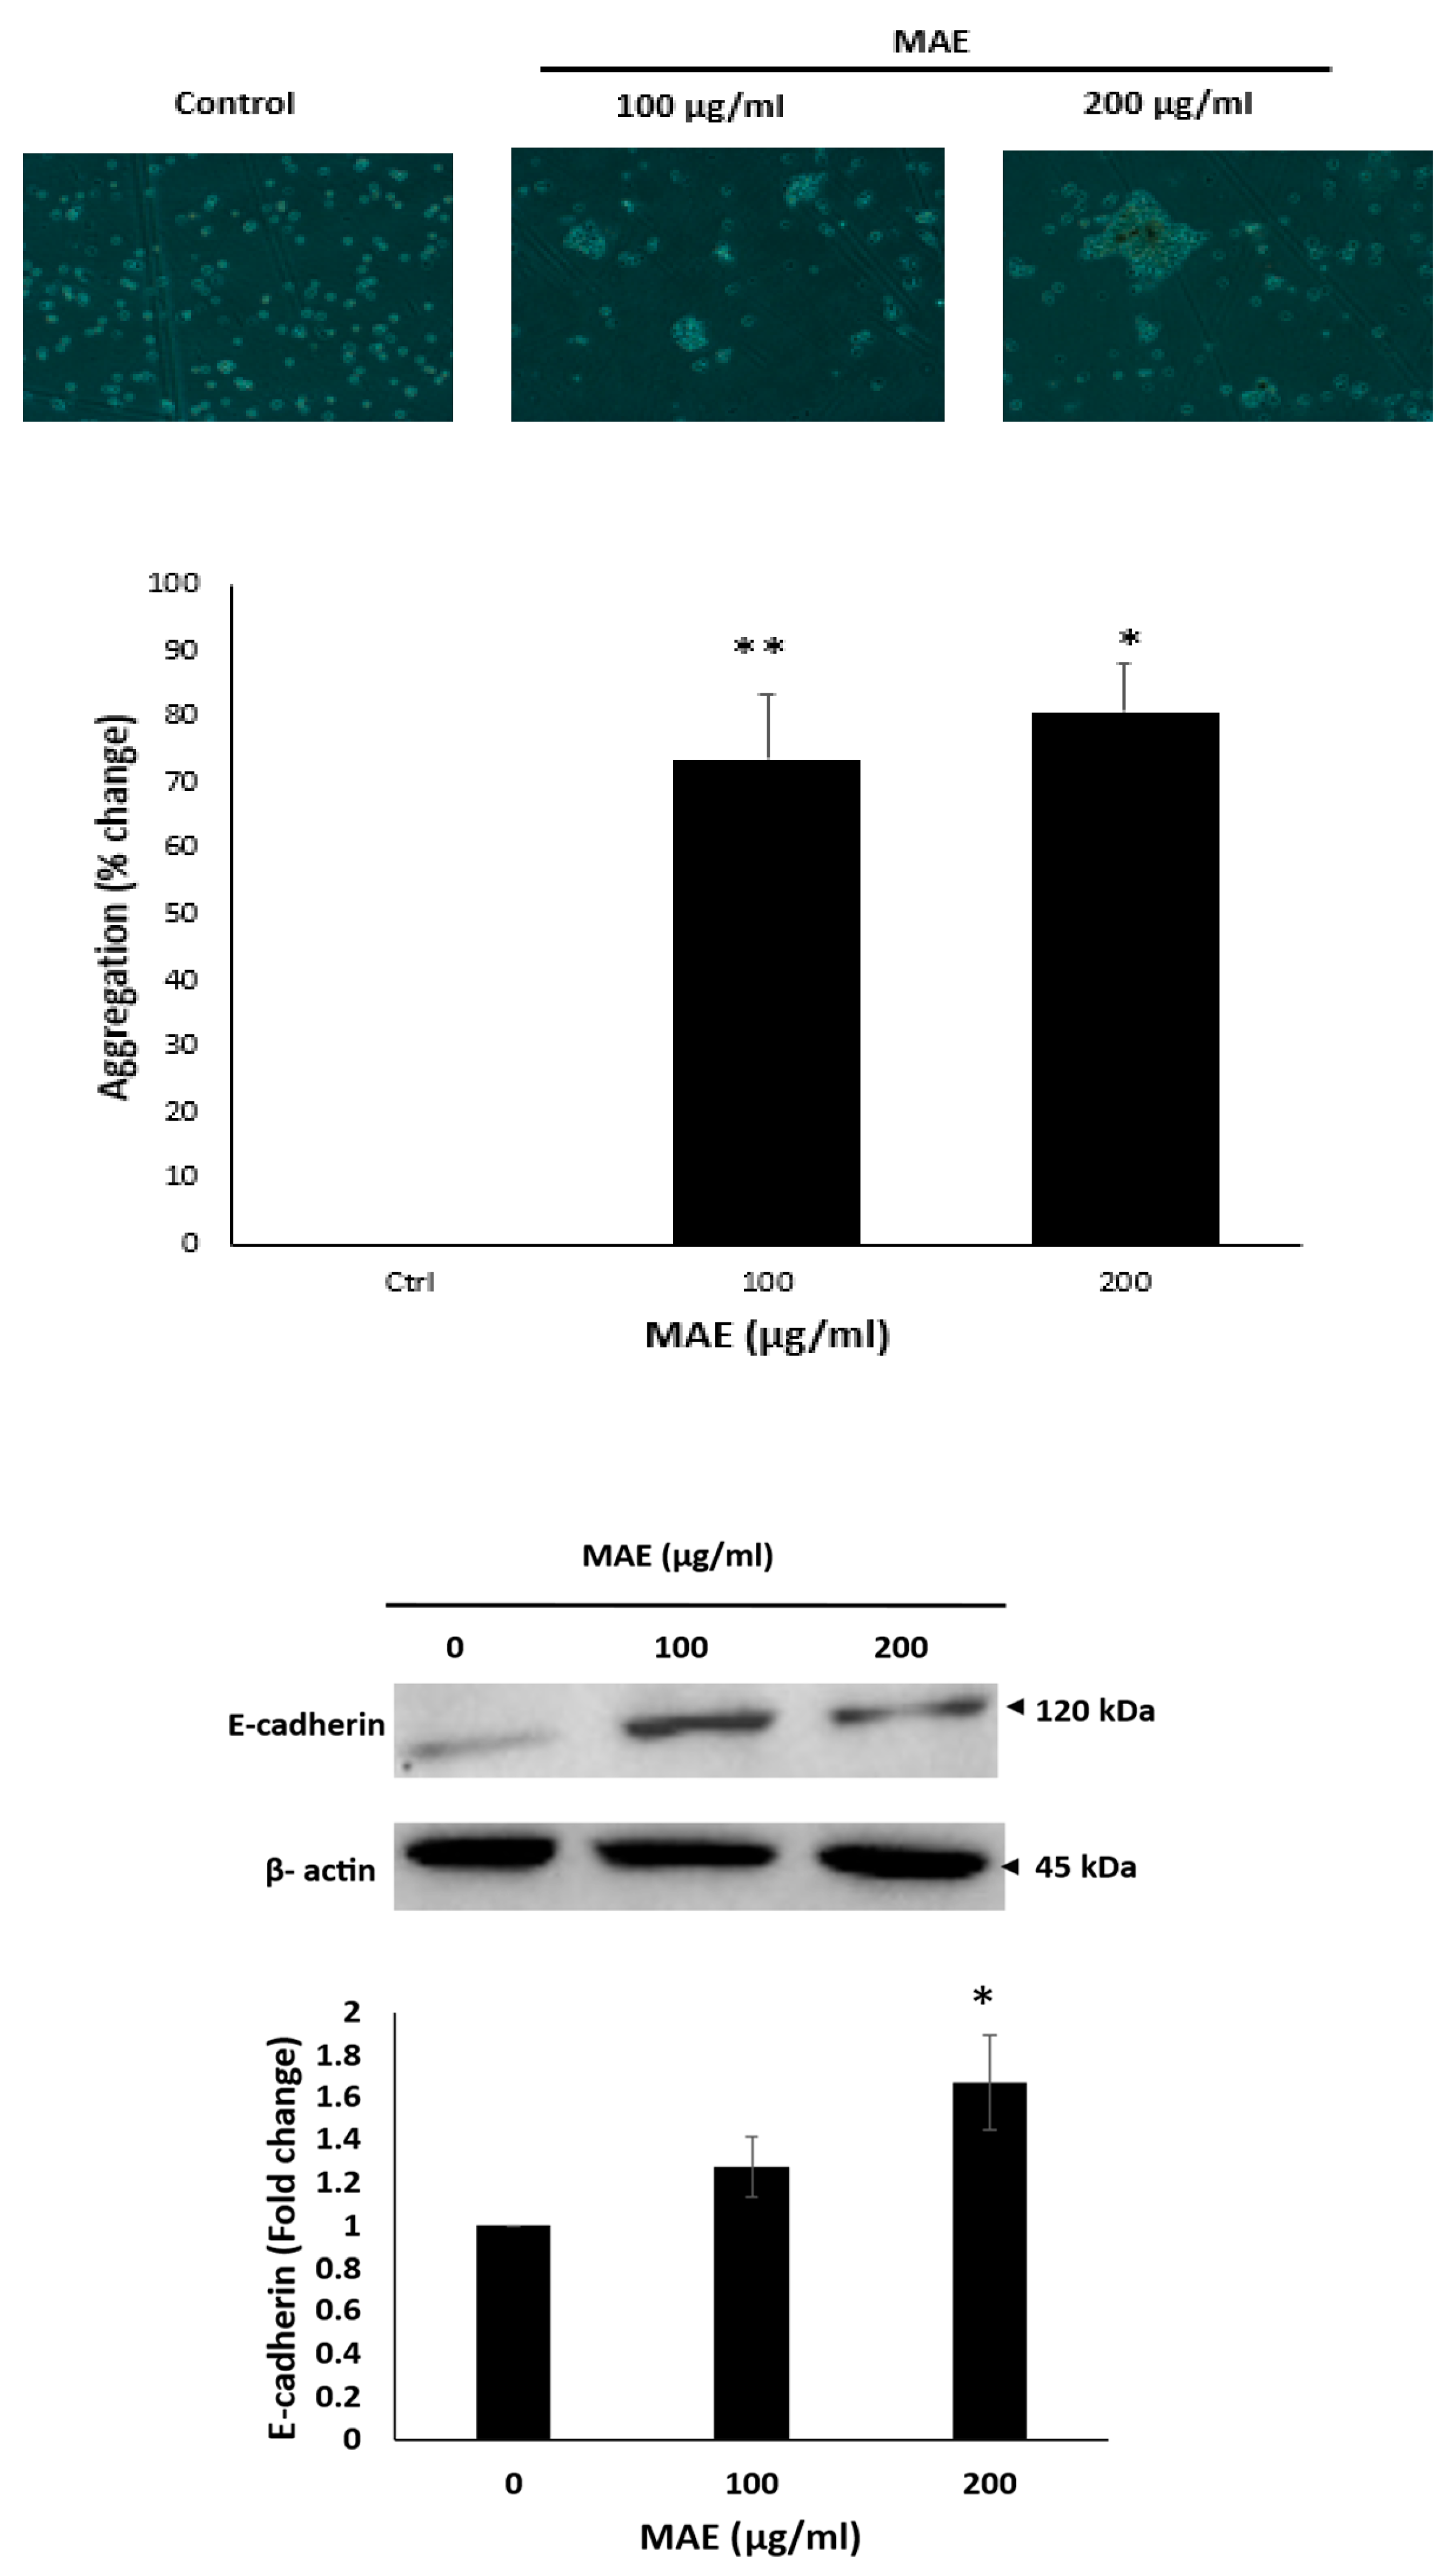
Figure 6.
The ethanolic extract of Mandragora autumnalis inhibits the adherence of MDA-MB-231 breast cancer cells to collagen and lowers the levels of the protein integrin β1. (A) MDA-MB-231 cells were cultured for 24 hours with either MAE (100 or 200 µg/mL) or a vehicle-containing control. After that, cells were seeded into wells coated with collagen and given three hours to adhere. The MTT assay was used to measure adhesion, and the results were reported as a percentage of the corresponding control cells. (B) For 24 hours, MDA-MB-231 cells were cultured with either vehicle-containing control or MAE (100 or 200 µg/mL). β-actin served as a loading control when integrin β1 expression levels in whole-cell protein lysates were examined by Western blotting. The data show the average ± standard error of three separate experiments (n = 3), (* p < 0.05, ** p < 0.005, **** p < 0.0001).
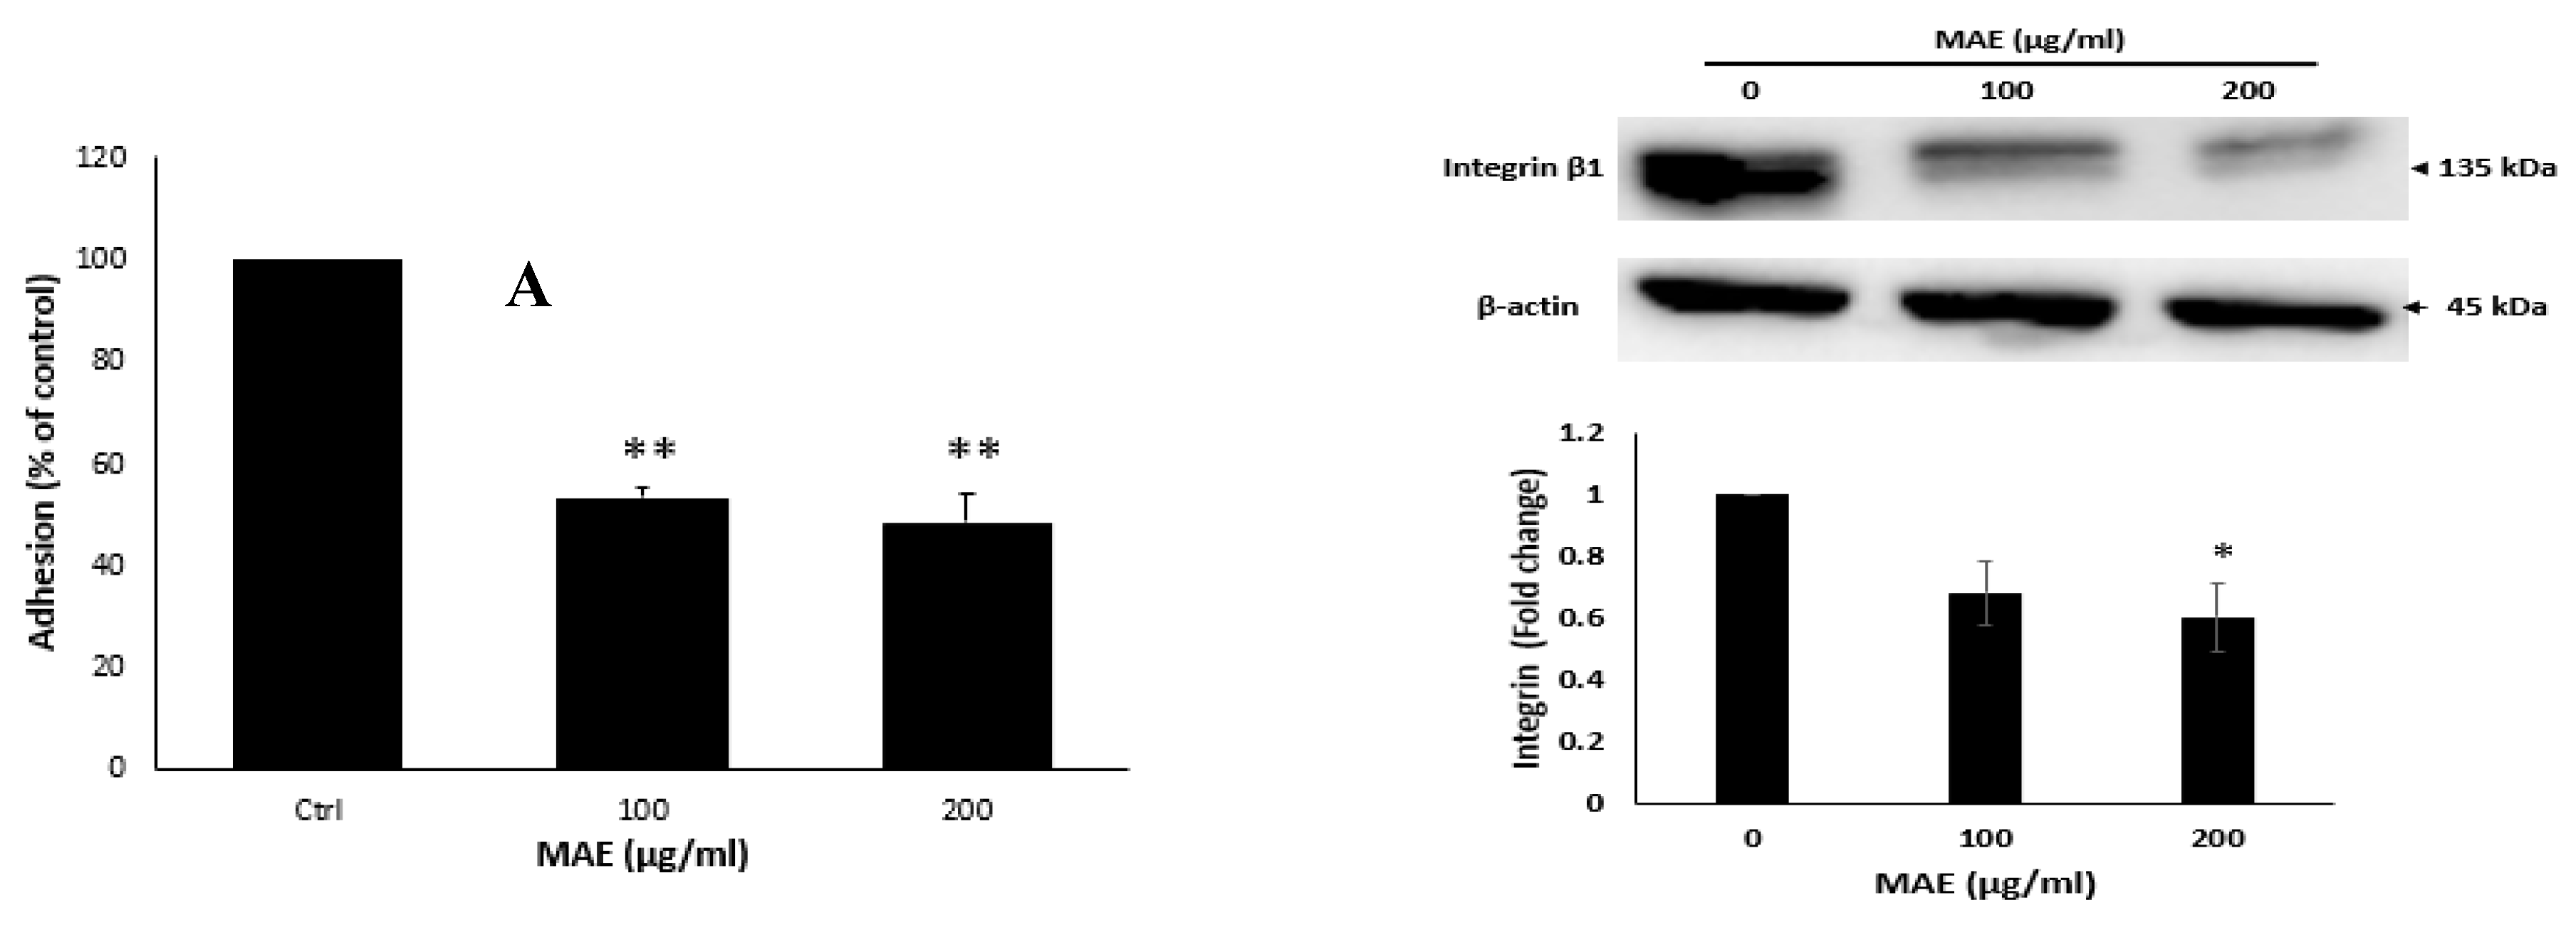
Figure 7.
Using an inverted phase-contrast microscope at the designated time points and 4× magnification, photomicrographs of the wound were taken. Plotted values represent the fold change in migration relative to control cells treated with a vehicle. (B) In Boyden chamber trans-well inserts, MDA-MB-231 cells were treated overnight with either MAE (100 or 200 µg/mL) or a vehicle-containing control. After migrating to the chamber's lower surface, the cells were counted, examined, photographed at a 4x magnification, and stained with DAPI. The data show the average ± standard error of three separate experiments (n = 3). (** p < 0.005, **** p < 0.0001).
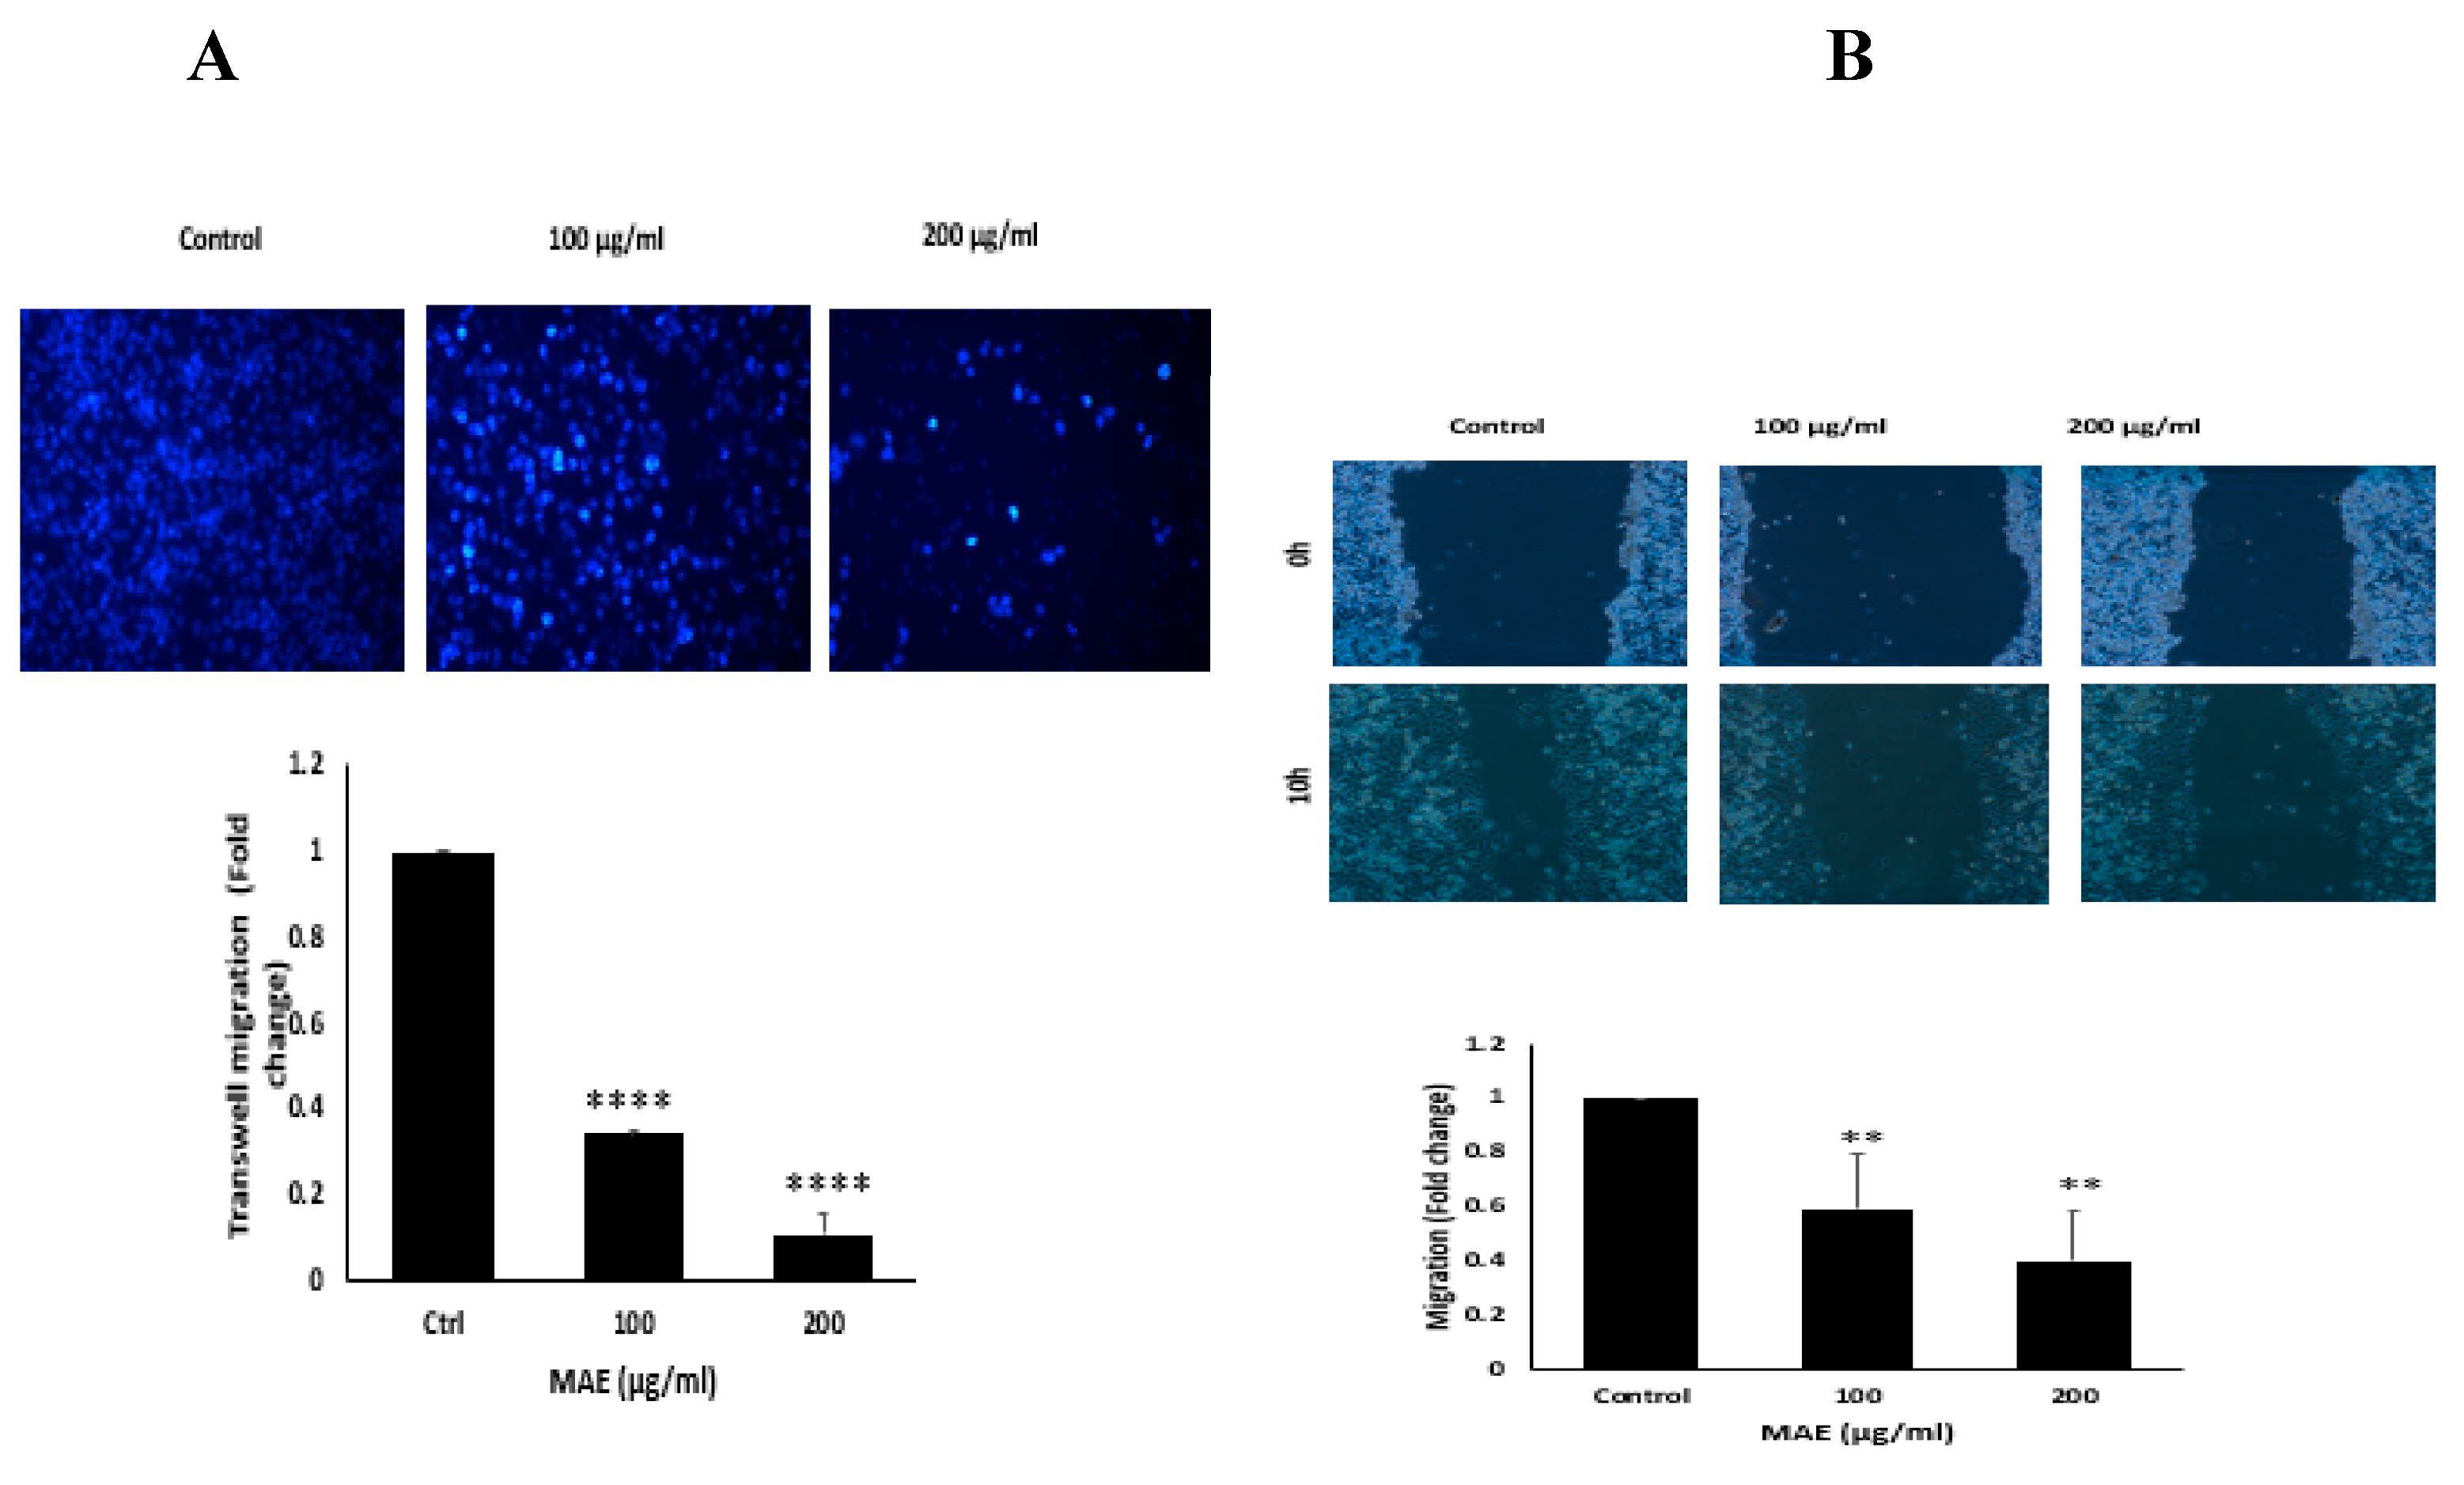
Figure 8.
The invasive potential of MDA-MB-231 breast cancer cells is decreased by MAE extract. For 24 hours, MDA cells were cultured in Boyden chamber trans-well inserts that had been previously coated with Matrigel, either with a vehicle-containing control or with 100 or 200 µg/mL of MAE. The Matrigel layer's invading cells were imaged, counted, and examined using DAPI staining. Images were captured with a 4x magnification. The three separate experiments' mean ± SEM (n = 3) is represented by the data. (**p < 0.005 and *** p < 0.001).Western blotting was used to measure the phosphorylated STAT3 protein levels, with β-actin serving as a loading control. Cells were treated either with a vehicle-containing control or with MAE (100 or 200 µg/mL). The results showe that the the STAT3 signaling pathway is inhibited by MAE extract. Data represent the mean ± SEM of three independent experiments (n = 3), (*p < 0.05 and ** p < 0.005). After being seeded in serum-free media, MDA-MB-231 cells were treated with 100 or 200 µg/mL of MAE. Then the conditioned media were concentrated and put through gelatin zymography to determine MMP-9 activity (**p<0.01 and *** p <0.001).
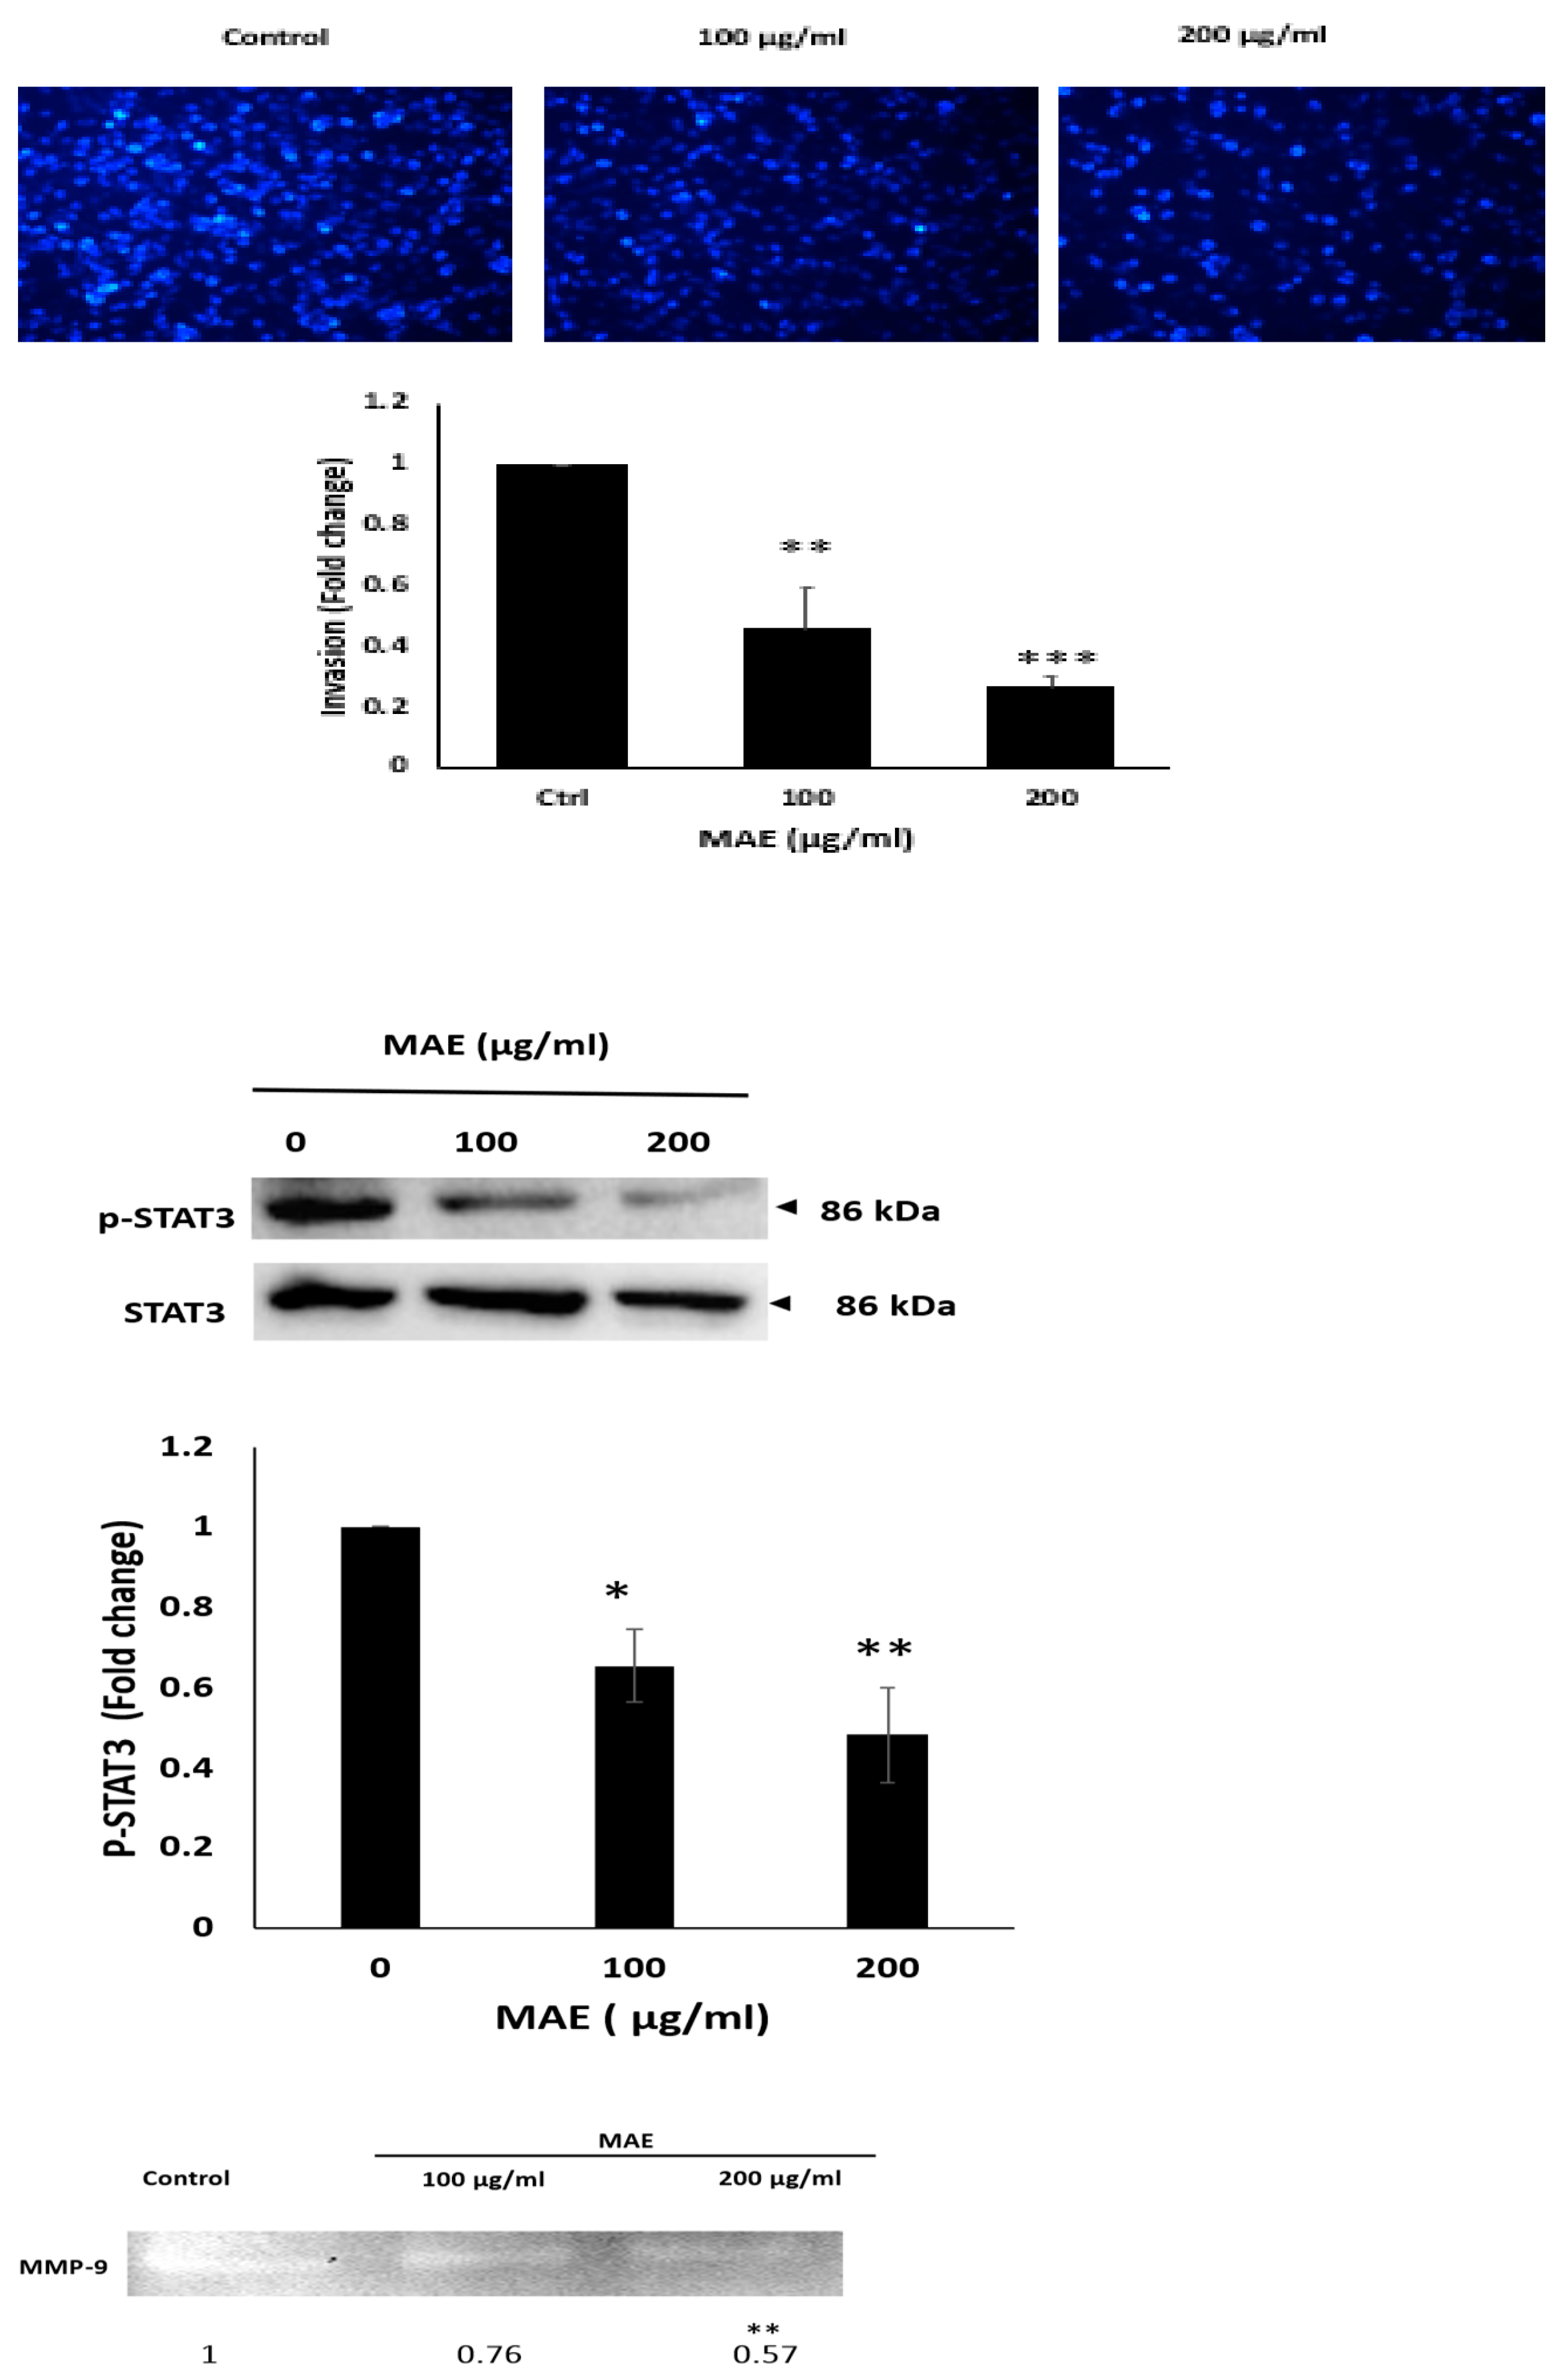
Figure 9.
The G0/G1 cell cycle arrest in MDA-MB-231 cells is induced by MAE. (A) MDA-MB-231 cells were cultured for 24 hours with 200 µg/mL of MAE or a vehicle-containing control. Following collection and fixation, cells were stained with 4′, 6-diamino-2-phenylindole (DAPI) and subjected to flow cytometry analysis. The mean ± SEM of three separate experiments (n = 3) is represented by the data. (B) MAE (200 µg/mL) or a vehicle-containing control was used to treat the cells. Western blotting was used to measure the amounts of phosphorylated p38, p21, p27, Rb, and phosphorylated p53 proteins. To control loading, β-actin was employed. The mean ± SEM of three separate experiments (n = 3) is represented by the data. ** indicates p < 0.005, and * indicates p < 0.05.
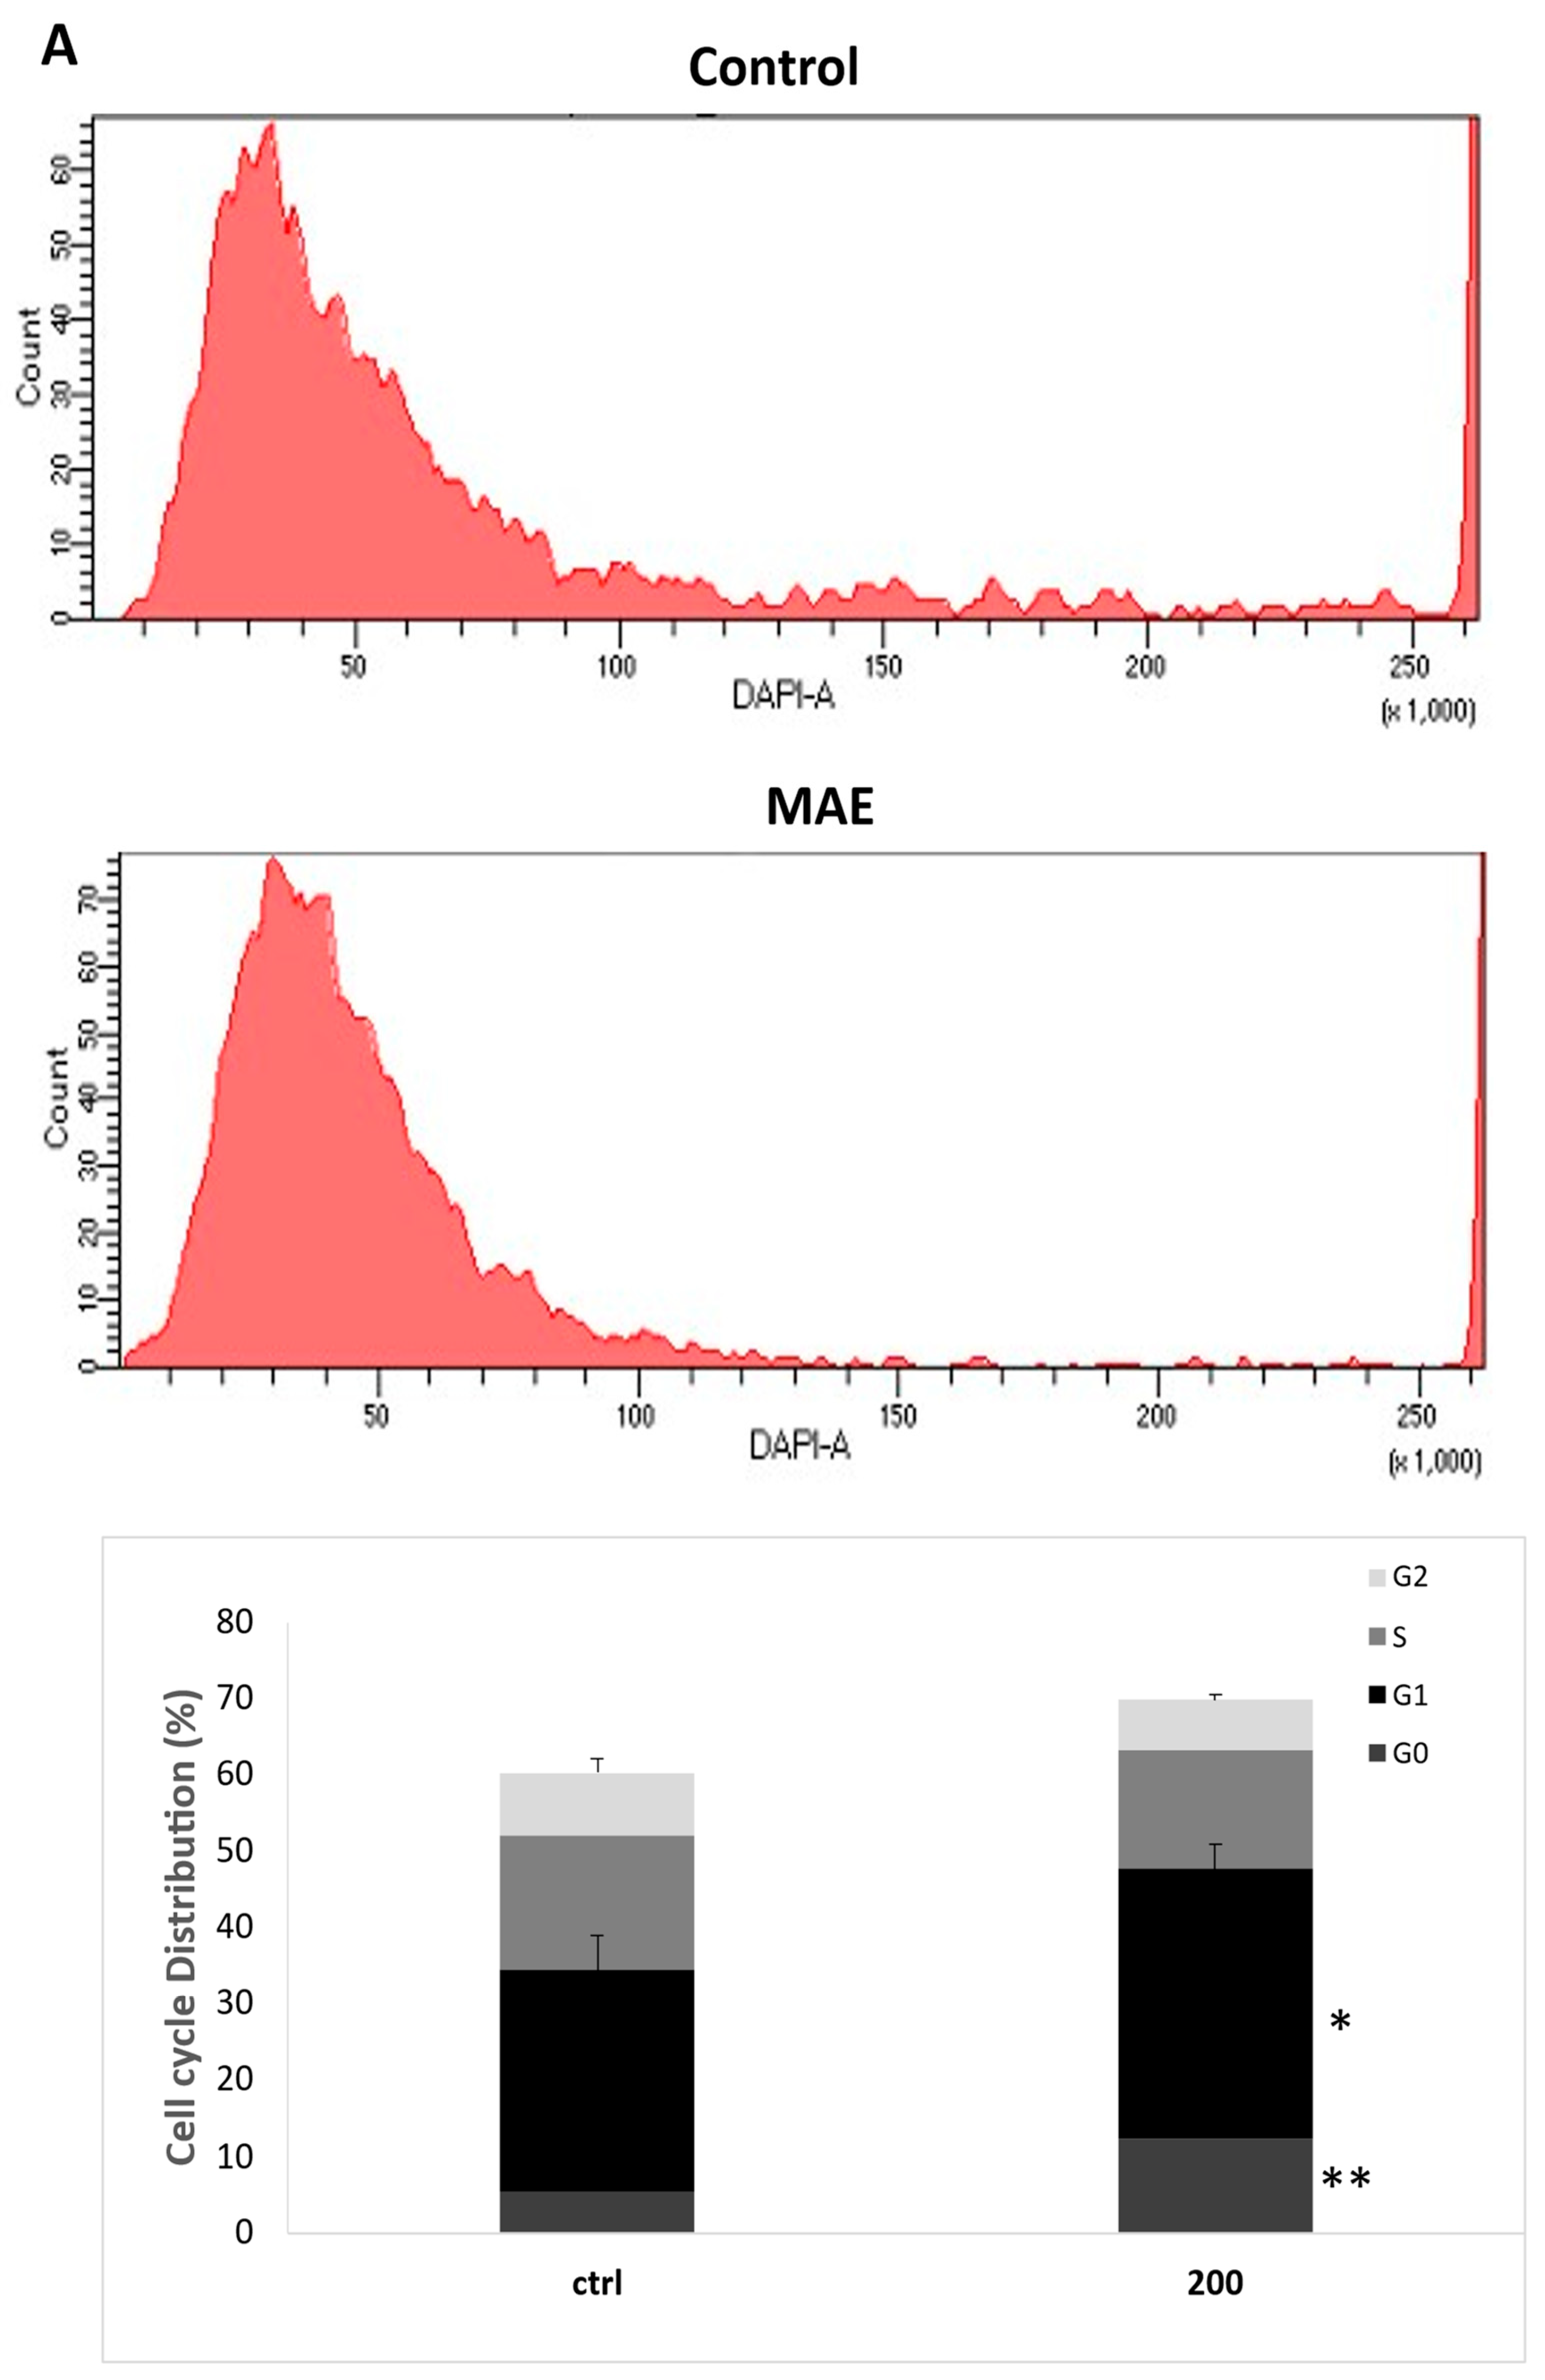
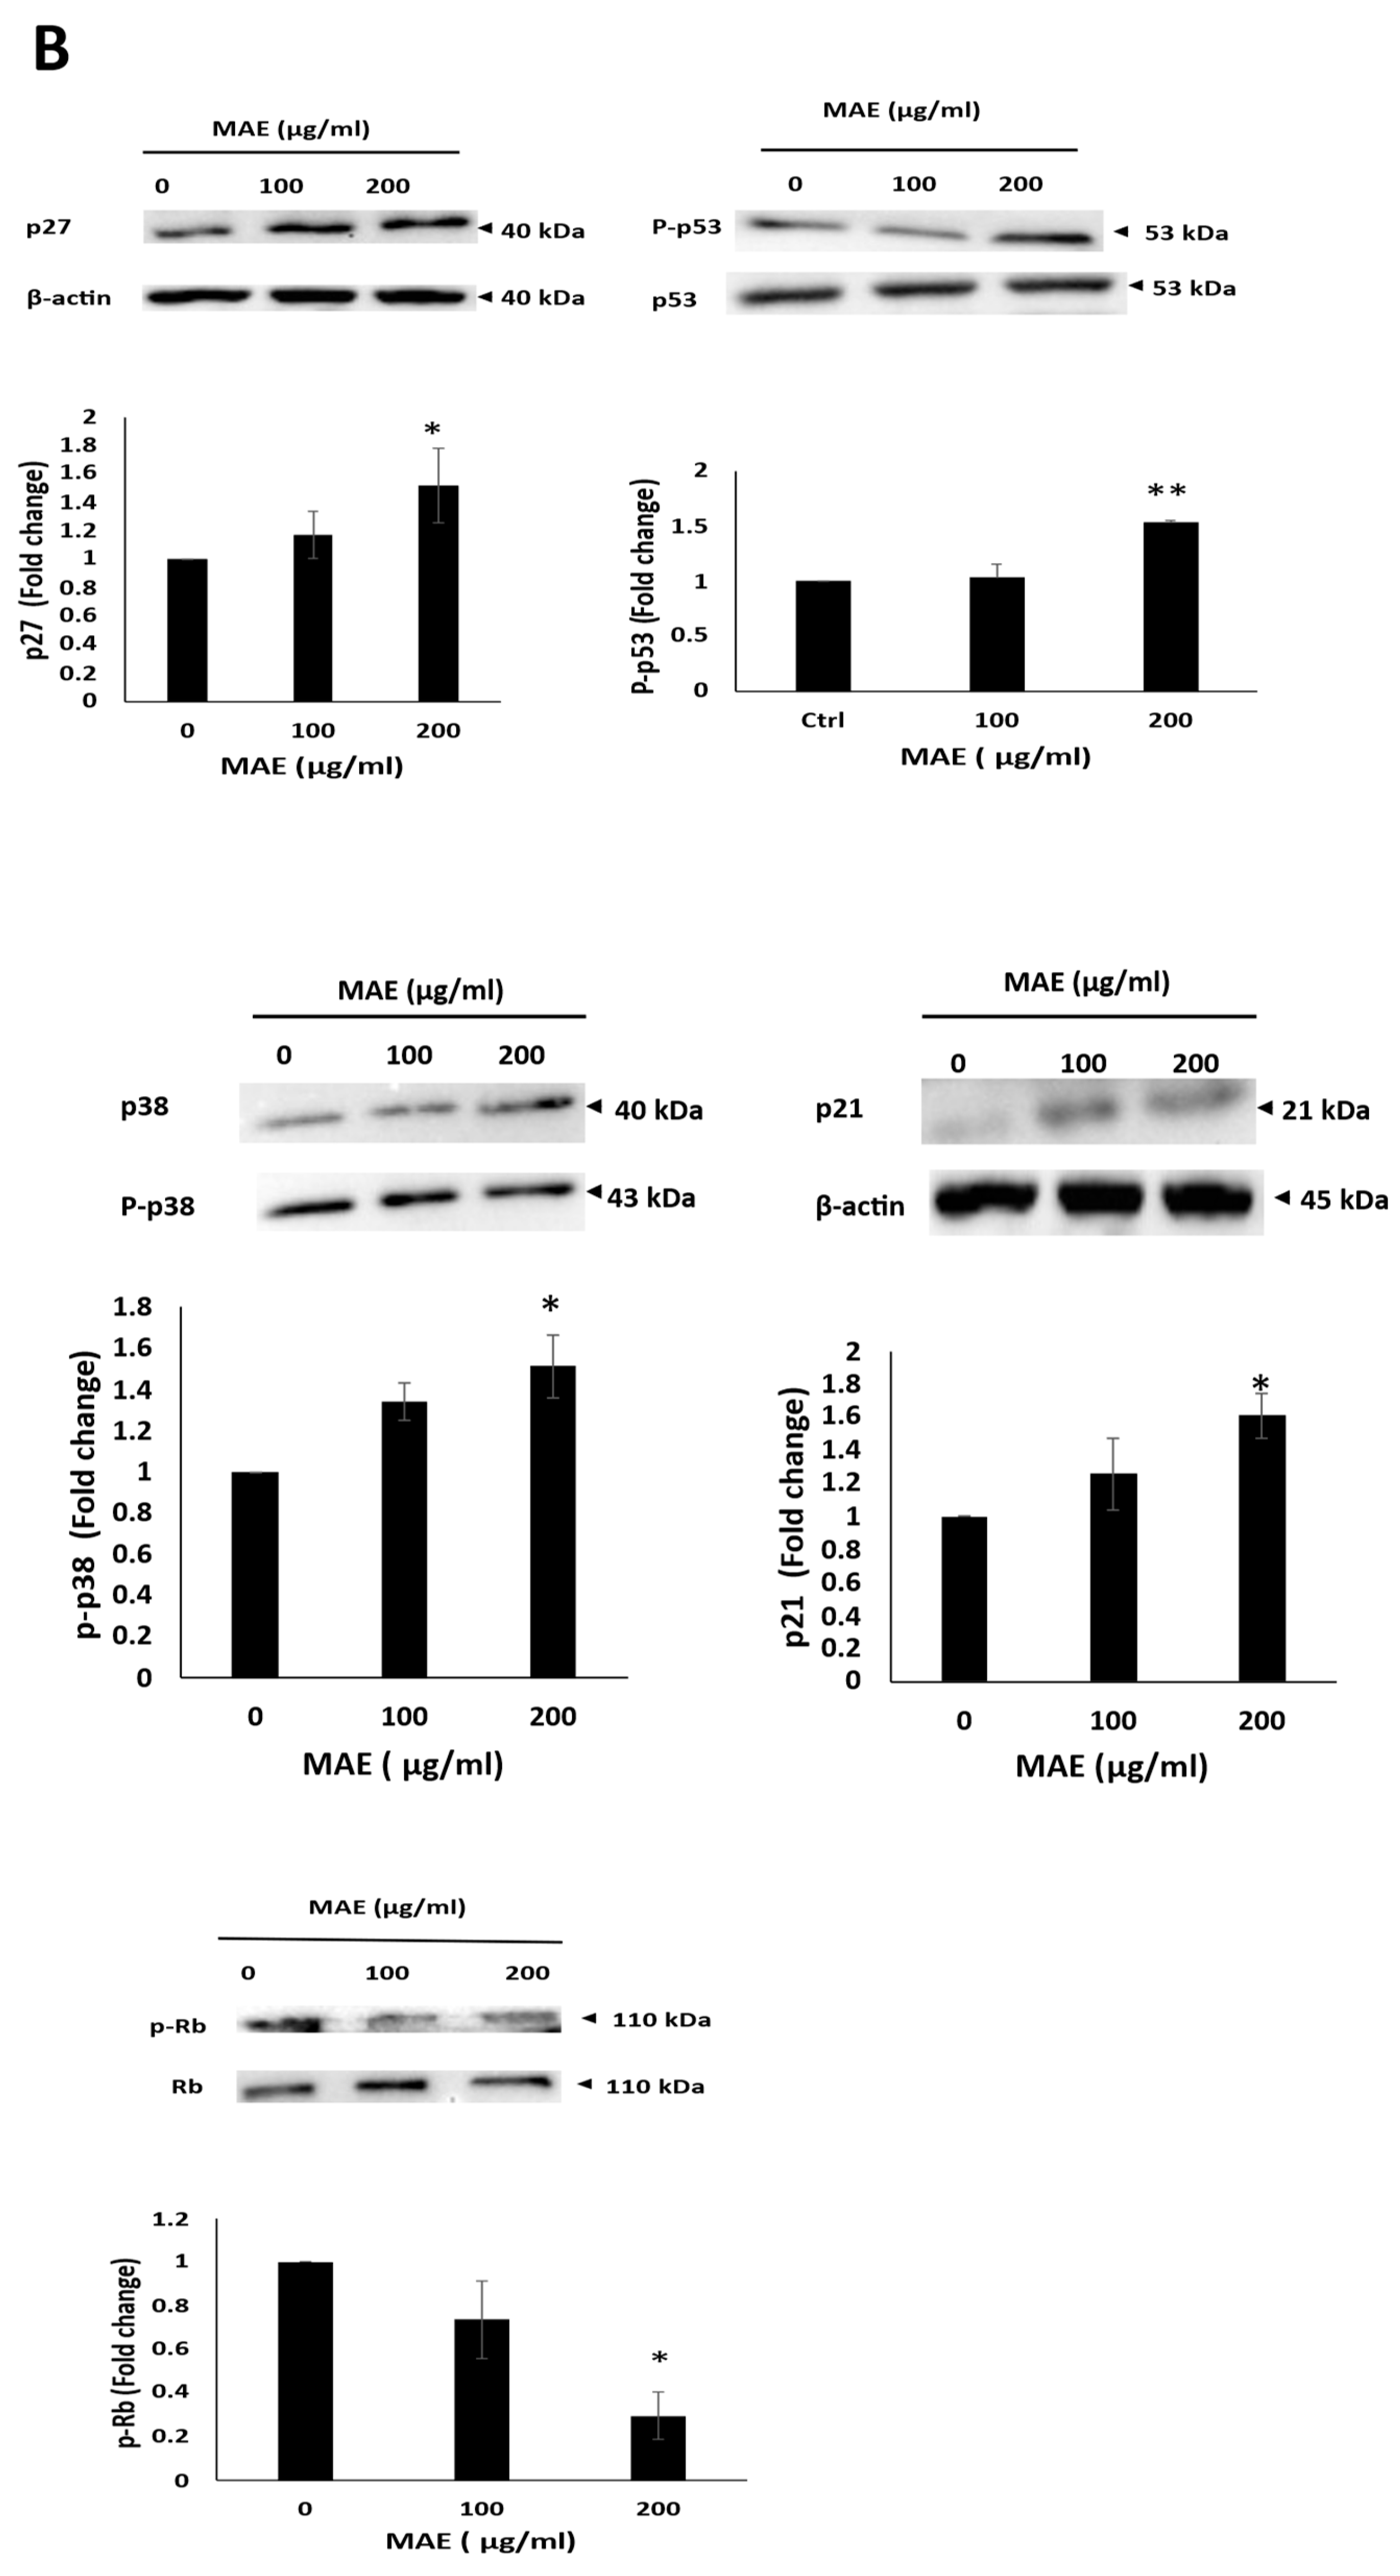
Figure 10.
MAE extract lowers the amounts of iNOS and COX-2 in MDA-MB-231 breast cancer cells and suppresses angiogenesis in fertilized chicken eggs. (A) MAE lowers the amounts of iNOS and COX-2 in MDA-MB-231 breast cancer cells and prevents angiogenesis in fertilized chicken eggs. (B) For 24 hours, MAE was applied to the fertilized chicken eggs' chorioallantoic membrane (CAM). Pictures were taken 24 hours before the fertilized chicken eggs' chorioallantoic membrane (CAM). To score the angiogenic response, pictures were taken both before and after treatment. AngiTool 0.5a software was used to measure the total length of the vessel and the total number of junctions. . Western blotting was used to measure the protein levels of COX-2 and iNOS, with β-actin serving as a loading control. The results were displayed as the percentage change compared to the vehicle-treated control.. The mean ± SEM of three separate experiments (n = 3) is represented by the data. ** p<0.005, *** p<0.001, * p<0.05).
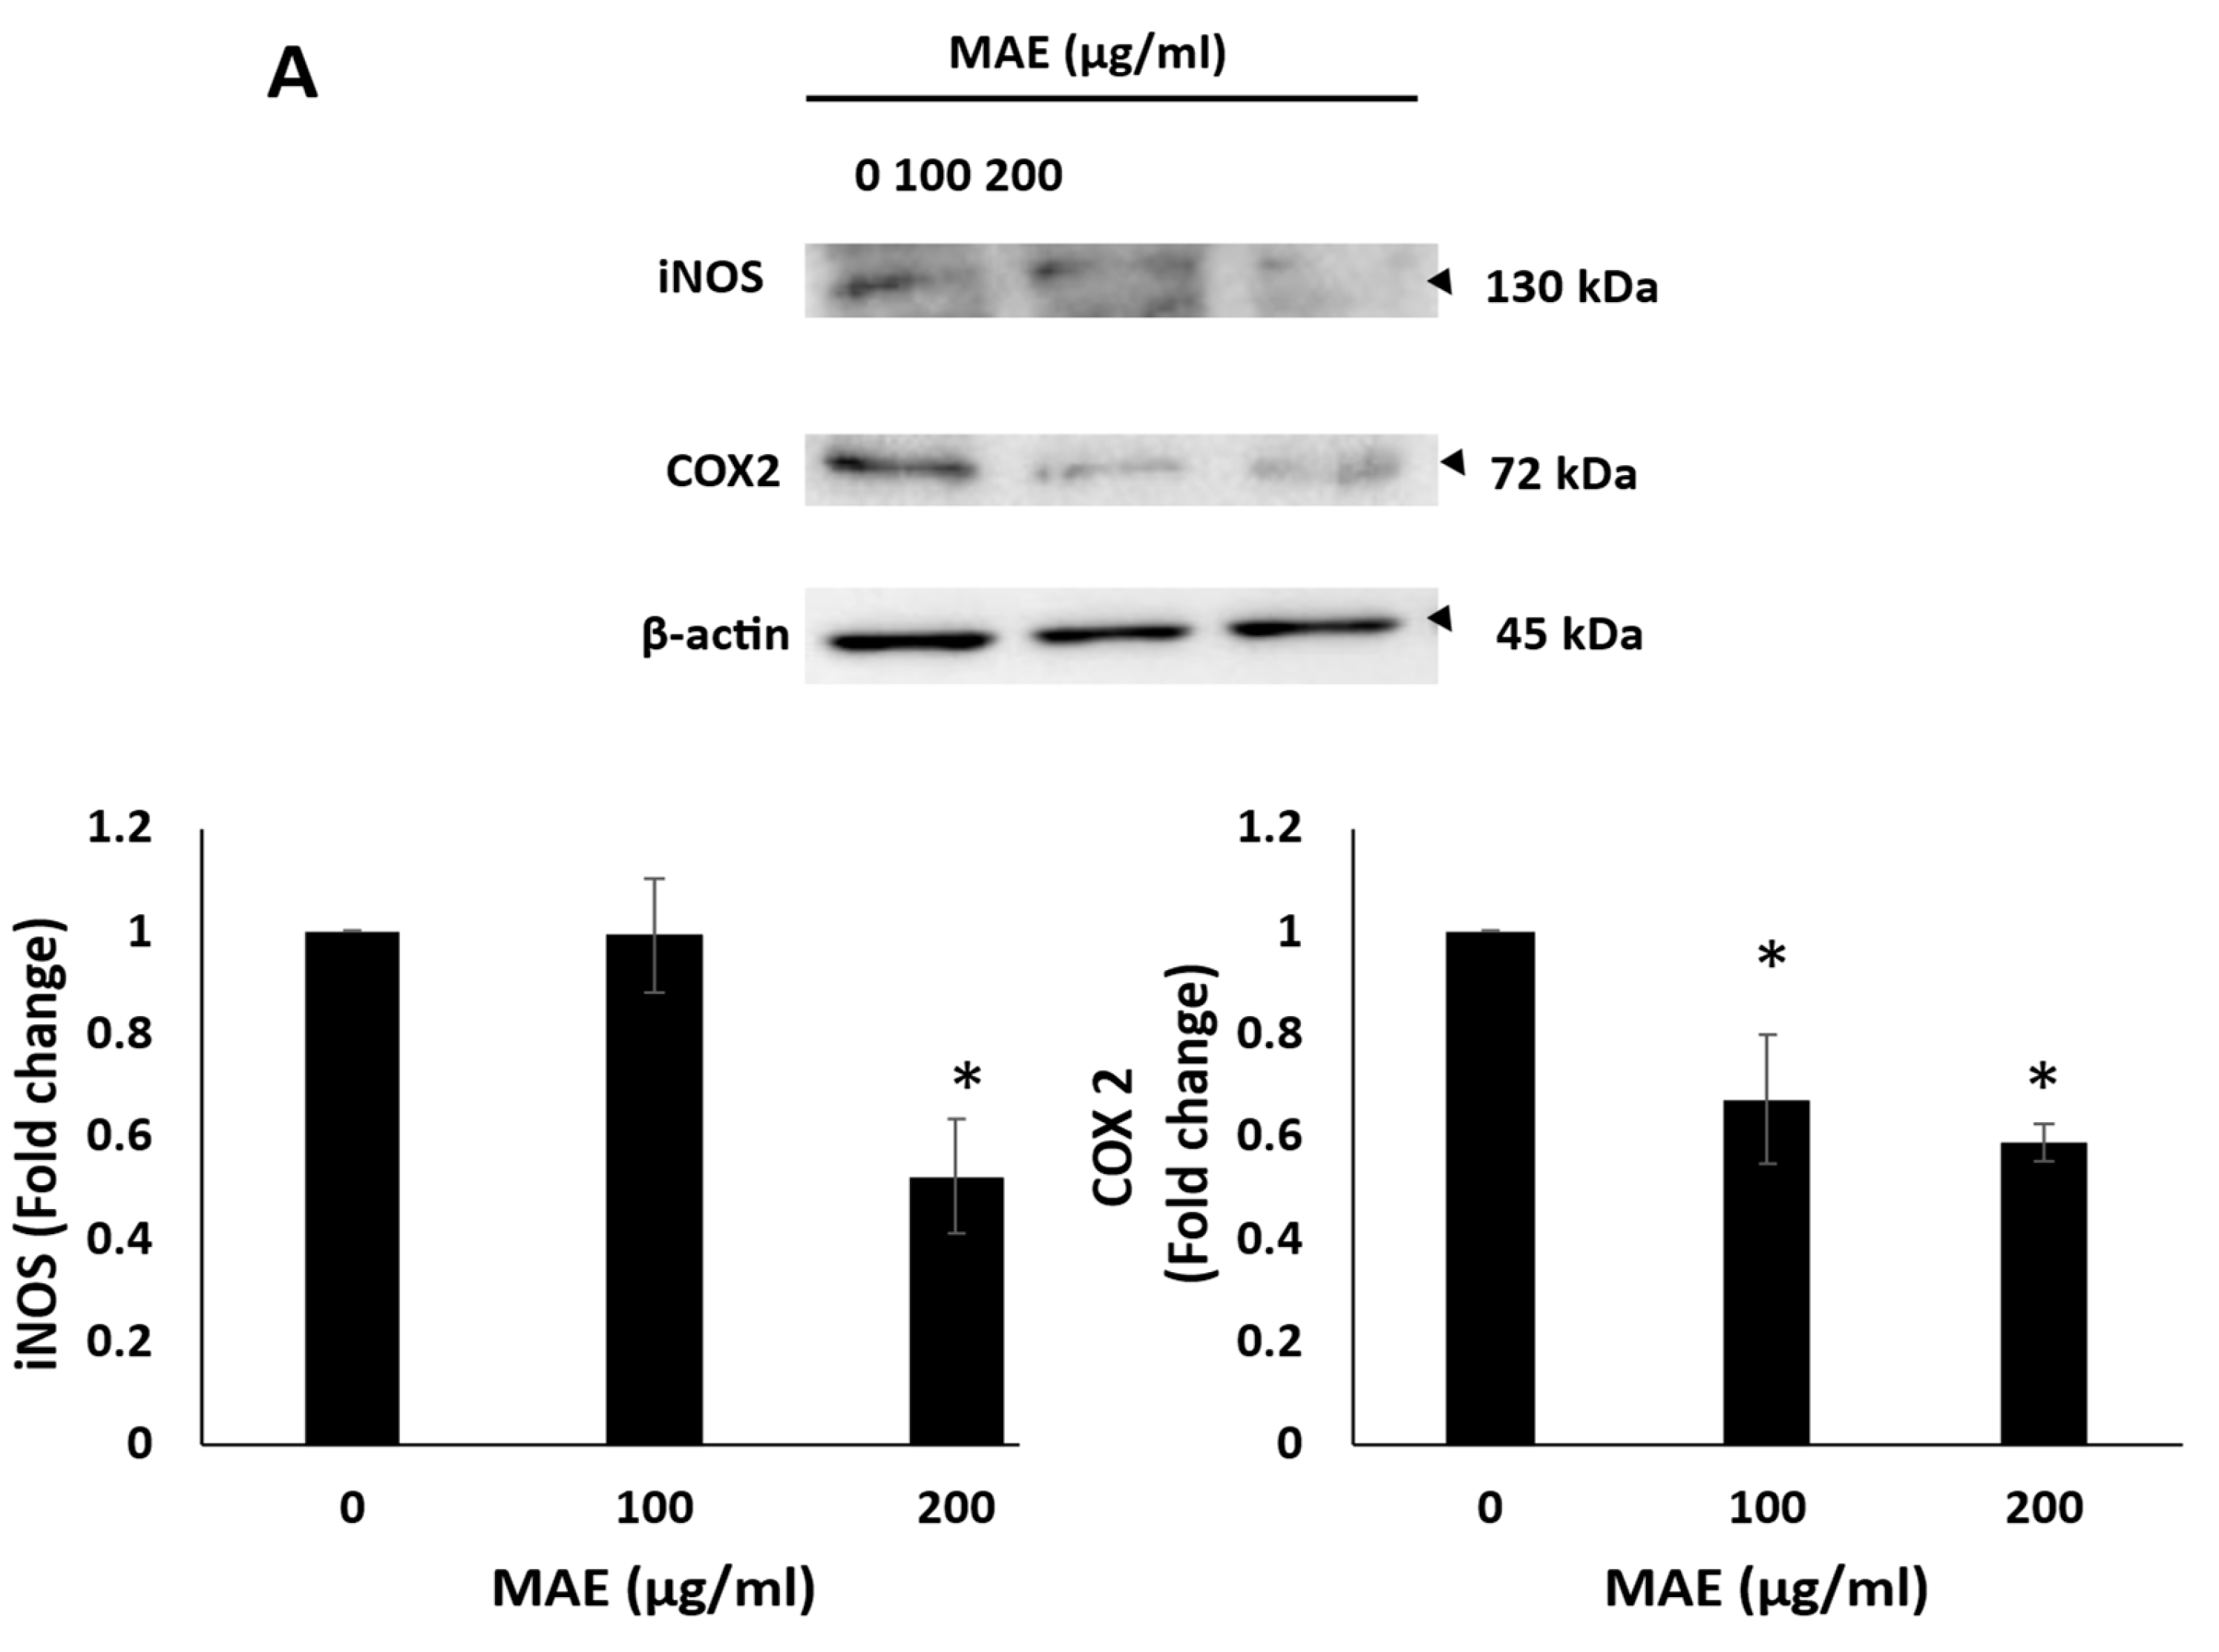
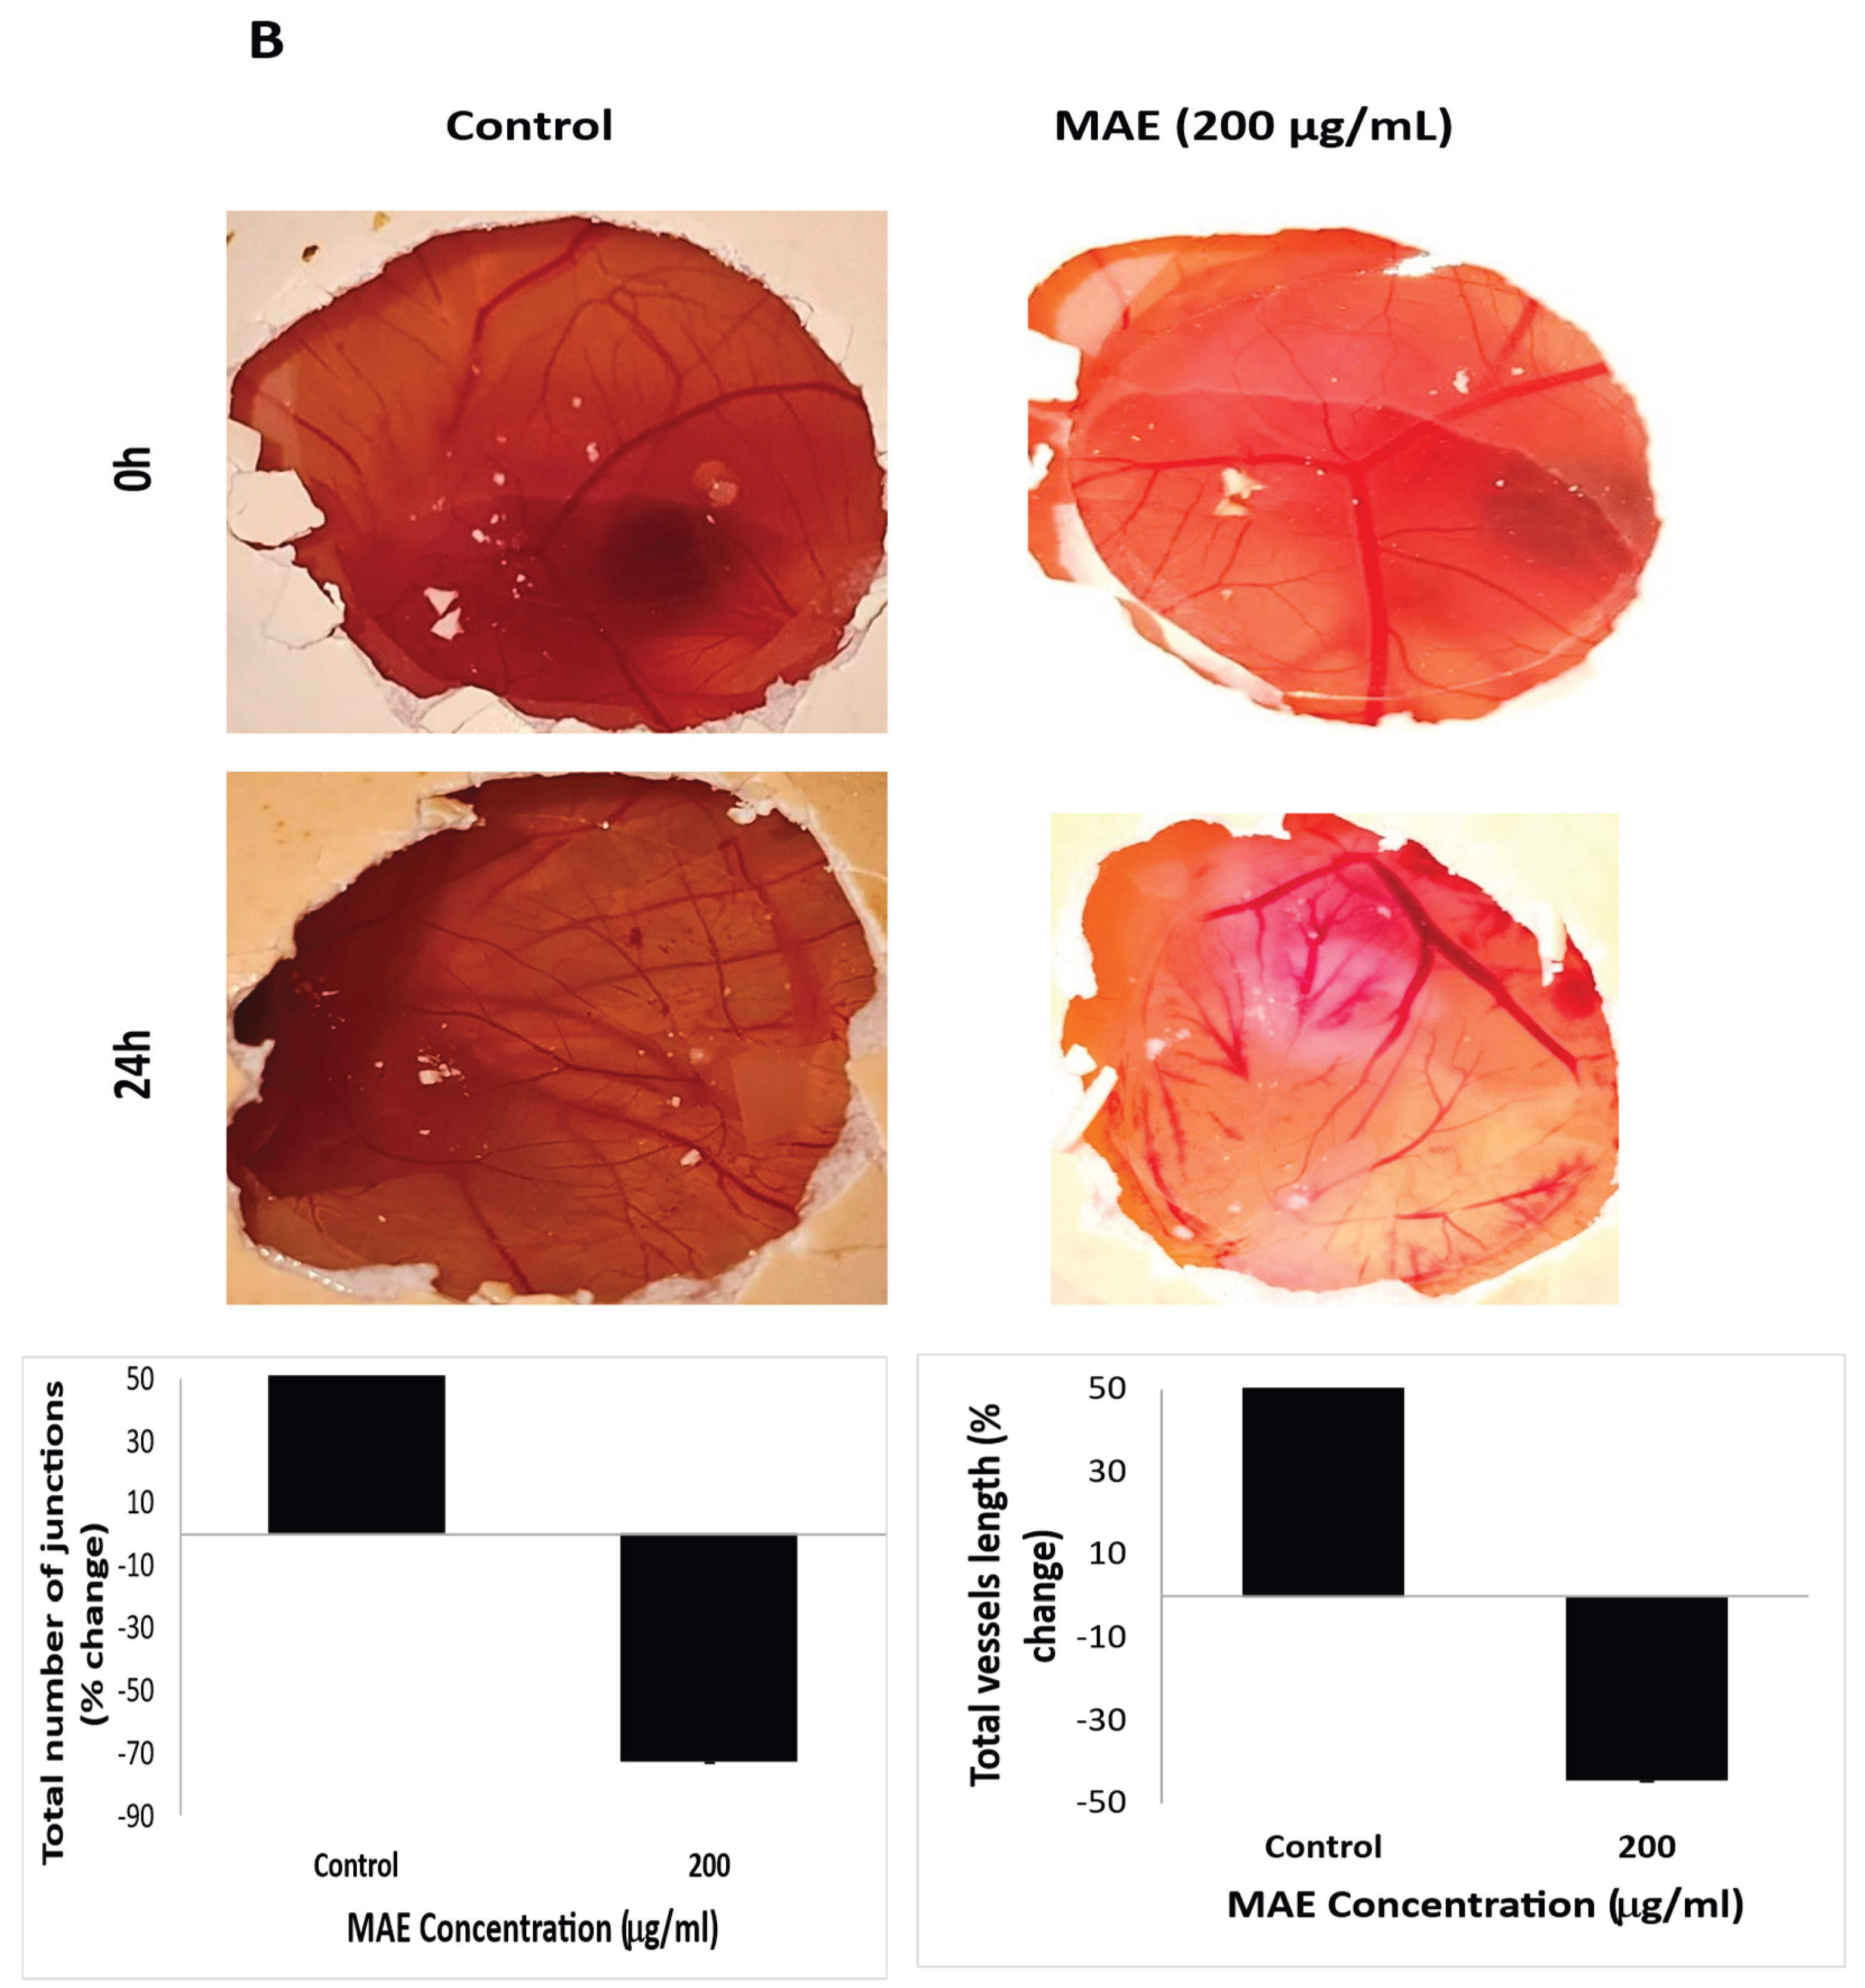

Table 1.
Qualitative Phytochemical analysis of Mandragora autumnalis ethanolic extract (MAE), (+) indicates the presence and (-) indicates the absence of the secondary metabolite.
Table 1.
Qualitative Phytochemical analysis of Mandragora autumnalis ethanolic extract (MAE), (+) indicates the presence and (-) indicates the absence of the secondary metabolite.
| Metabolite | MAE |
| Anthraquinones | - |
| Tannins | + |
| Resins | - |
| Terpenoids | + |
| Flavonoids | + |
| Quinones | - |
| Anthocyanins | - |
| Saponins | - |
| Phenols | + |
| Steroids | + |
| Cardiac glycosides | - |
| Fixed oils and fatty acids | + |
Table 2.
TPC and TFC of Mandragora autumnalis ethanolic extract.
| Assay Type | MAE |
| TPC (mg GAE/g) | 58.98± 7.40 |
| TFC (mg QE/g) | 36.47± 0.87 |
Table 3.
Identified compounds in the ethanolic extract of Mandrgaora autumnalis using both (A) positive and (B) negative ionization modes in LC-MS.
Table 3.
Identified compounds in the ethanolic extract of Mandrgaora autumnalis using both (A) positive and (B) negative ionization modes in LC-MS.
| |||||||||||
| Number | m/z | RT [min] | Ions | Compound Name | Molecular Formula | Intensity | |||||
| 1 | 127.0389 | 0.58 | [M+H]+ | 5-Hydroxymethyl-2-furancarboxaldehyde | C6H6O3 | 49130.136 | |||||
| 2 | 133.0827 | 0.71 | [M+H]+ | Ethyl 3-hydroxy-butanoate | C6H12O3 | 72955.974 | |||||
| 3 | 140.1066 | 0.86 | [M+H]+ | Tropinone | C8H13NO | 21053.859 | |||||
| 4 | 149.0596 | 1.23 | [M+H]+ | 3-(Methylthio)propyl acetate | C6H12O2S | 8790.512 | |||||
| 5 | 117.0542 | 1.3 | [M+H]+ | 1-Hydroxy-2-propanone acetate | C5H8O3 | 8646.324 | |||||
| 6 | 193.0492 | 2.91 |
[M+H-C6H10O5]+ | Chlorogenic acid | C16H18O9 | 669015.883 | |||||
| 355.1018 | [M+H]+ | 221652.966 | |||||||||
| 445.0708 | [M+Na+NaCOOH]+ | 20681.809 | |||||||||
| 7 | 619.2479 | 2.91 | [M+H]+ | Simulanoquinoline | C37H34N2O7 | 11326.110 | |||||
| 8 | 641.2302 | [M+Na]+ | 90245.22 | ||||||||
| 9 | 290.1745 | 3.89 | [M+H]+ | Hyoscyamine | C17H23NO3 | 5938808.003 | |||||
| 10 | 303.0494 | 9.16 | [M+H]+ | Quercetin | C15H10O7 | 20868.344 | |||||
| 11 | 179.1178 | 9.6 | [M+H]+ | Ethyl hydrocinnamate | C11H14O2 | 24858.923 | |||||
| 12 | 255.0862 | 13.43 | [M+H]+ | Chrysin | C15H10O4 | 11043.2 | |||||
| 13 | 281.266 | 26.76 | [M+H]+ | Linoleic acid | C18H32O2 | 70427.883 | |||||
| 14 | 311.2933 | 27.7 | [M+H]+ | Ethyl oleate | C20H38O2 | 4151.762 | |||||
| 15 | 243.2505 | 28.62 | [M+H]+ | n-Pentadecanoic acid | C15H30O2 | 13652.643 | |||||
| 16 | 193.1581 | 29.04 | [M+H]+ | Ionone (β-Ionone) | C13H20O | 10667.398 | |||||
| 17 | 307.266 | 29.32 | [M+H]+ | Ethyl linolenate | C20H34O2 | 10224.308 | |||||
| 18 | 156.138 | 29.41 | [M+H]+ | Methylisopelletierine | C9H17NO | 48479.510 | |||||
| 19 | 114.0911 | 29.41 | [M+H-C2H4]+ | Tropine | C8H15NO | 42742.76 | |||||
| 142.1224 | [M+H]+ | 57239.581 | |||||||||
| 20 | 336.2868 | 29.49 | [M+Na]+ | Solacaproine | C18H39N3O | 8765.329 | |||||
| 21 | 256.2629 | 29.51 | [M+H]+ | Hexadecanamide (Palmitic amide) | C16H33NO | 7806388.659 | |||||
| 278.2449 | [M+Na]+ | 1763628.958 | |||||||||
| 511.5185 | 29.52 | [2M+H]+ | 449241.592 | ||||||||
| 533.5006 | [2M+Na]+ | 363277.043 | |||||||||
| 294.2182 | [M+K]+ | 35062.909 | |||||||||
| 22 | 297.2893 | [M+H-NH3]+ | Solacaproine | C18H39N3O | 86740.906 | ||||||
| 314.3049 | [M+H]+ | 52611.286 | |||||||||
| 23 | 285.2879 | 29.77 | [M+H]+ | Ethyl palmitate | C18H36O2 | 58073.530 | |||||
| |||||||||||
| 24 | 111.0088 | 0.75 | [M-H]- | 3-Methyl-2-5-furandione | C5H4O3 | 100.285 | |||||
| 25 | 117.01932 | 0.83 | [M-H]- | Succinic acid | C4H6O4 | 12012 | |||||
| 26 | 353.08783 | 2.21 | [M-H]- | Chlorogenic acid | C16H18O9 | 258912 | |||||
| 27 | 207.050913 | 3.29 | [M-H]- | 4-O-Methylglucuronic acid | C7H12O7 | 4598.659 | |||||
| 28 | 131.07127 | 3.33 | [M-H]- | Ethyl 3-hydroxy-butanoate | C6H12O3 | 2582 | |||||
| 29 | 179.03492 | 3.86 | [M-H]- | Caffeic Acid | C9H8O4 | 5934 | |||||
| 30 | 175.04000 | 4.23 | [M-H-COCH2]- |
4-Methylumbelliferyl acetate |
C12H10O4 | 27106.992 | |||||
| 217.05106 | [M-H]- | 4492.950 | |||||||||
| 31 | 176.01133 | 6.56 | [M-H-CH3]- |
Scopoletin |
C10H8O4 |
26388.932 | |||||
| 191.03486 | [M-H]- | 43250.386 | |||||||||
| 259.02198 | [M-H+NaCOOH]- | 9135.296 | |||||||||
| 32 | 609.1457 | 9.19 | [M-H]- | Rutin | C27H30O16 | 25850 | |||||
| 33 | 463.08799 | 10.39 | [M-H]- | Hyperoside | C21H20O12 | 18198 | |||||
| 34 | 277.21675 | 29.84 | [M-H]- |
Linolenic acid |
C18H30O2 |
51774.794 | |||||
| 345.20465 | [M-H+NaCOOH]- | 4077.093 | |||||||||
Table 4.
The proposed mechanism of action of MAE in the treatment of TNBC through mediation of the selected markers.
Table 4.
The proposed mechanism of action of MAE in the treatment of TNBC through mediation of the selected markers.
| Marker | Change | Proposed Role of MAE in TNBC Treatment |
| Ki-67 | ↓ Decrease | Reduced cell proliferation indicates an antiproliferative treatment effect. |
| Procaspase-3 | ↓ Decrease | Suggests activation of caspase-3; promotes apoptosis. |
| Bcl-2 | ↓ Decrease | Loss of anti-apoptotic protection favors apoptosis. |
| Caspase-3 | ↑ Increase | Active executioner of apoptosis; confirms pro-apoptotic effect |
| BaX | ↑ Increase | promotes mitochondrial apoptosis pathway |
| E-cadherin | ↑ Increase | Enhances cell–cell adhesion; suppresses EMT and metastasis |
| Integrin β1 | ↓ Decrease | Reduces cell migration and invasion; anti-metastatic effect |
| p-STAT3 | ↓ Decrease | Reduces invasion, EMT, and survival signaling; enhances chemosensitivity. |
| MMP-9 | ↓ Decrease | Less ECM degradation; limits invasion and metastasis |
| p21 | ↑ Increase | CDK inhibitor; induces cell cycle arrest (G1 phase). |
| p27 | ↑ Increase | CDK inhibitor; halts cell cycle progression; anti-proliferative |
| p-p38 | ↑ Increase | Stress-activated kinase; can enhance apoptosis and cell cycle arrest. |
| p-p53 | ↑ Increase | Activated tumor suppressor; promotes DNA repair or apoptosis |
| iNOS | ↓ Decrease | May reduce nitric oxide-induced tumor progression and inflammation |
| p-Rb | ↓ Decrease | May reflect enhanced apoptosis or cell cycle deregulation |
| COX-2 | ↓ Decrease | Reduces inflammation and tumor-promoting prostaglandins; anti-tumor effect |
Disclaimer/Publisher’s Note: The statements, opinions and data contained in all publications are solely those of the individual author(s) and contributor(s) and not of MDPI and/or the editor(s). MDPI and/or the editor(s) disclaim responsibility for any injury to people or property resulting from any ideas, methods, instructions or products referred to in the content. |
© 2025 by the authors. Licensee MDPI, Basel, Switzerland. This article is an open access article distributed under the terms and conditions of the Creative Commons Attribution (CC BY) license (http://creativecommons.org/licenses/by/4.0/).
Copyright: This open access article is published under a Creative Commons CC BY 4.0 license, which permit the free download, distribution, and reuse, provided that the author and preprint are cited in any reuse.


