1. Introduction
Plastics are ubiquitous in the global environment. Around 350 million tons of plastics are produced annually across the world (Yee et al., 2021). These plastics are being utilized in several industrial uses. Nowadays, they are considered as essential material due to their low weight, low cost, low density, flexibility and electrical insulation properties.
Microplastics (MPs) can be considered as “synthetic solid polymers, having regular or irregular shape and with size ranging from 1µm to 5mm, which are insoluble in water and non-degradable” (Campanale et al., 2020). Nowadays, MPs exist in the environment in many forms including different polymers, sizes and shapes. Primary MP particles are small plastic particles that are artificially manufactured in industries as a byproduct (Emenike et al., 2023b). Primary MPs are usually found in cosmetics, artificial turf, cleaning products and fishing nets. Secondary MPs arise from the degradation of large plastics items (bottles, bags and packing items) (Emenike et al., 2023). Mechanical forces, UV rays facilitate the degradation of large plastic items leading to the formation of secondary MPs. Inhalation, oral intake and dermal contact are the major pathways of human exposure to MPs. The term “plastic cycle” in science proposed by Rillig et al. (2022) refers to the capability of MPs to move between different abiotic and biotic mediums.
Concentration of MPs present in the human body should be determined experimentally to identify the toxic effects. MPs ingested may get attached into organs or tissues. These ingested MPs may transmit environmental pollutants which are present on their surface affecting the organisms’ reproduction capacity. For the first time, scientists have identified microplastic pollution in human blood, detecting the microscopic particles in nearly 80% of the people. According to a recent study, MPs are discovered in many biological parts of human, including the spleen, liver, colon, lung, feces, placenta, urine, sputum and breastmilk etc (Li et al., 2023). MPs were discovered in human cardiovascular system, digestive system, endocrine system, lymphatic system, respiratory system and reproductive system.
MP particles are migrated through the blood circulatory system after entering the human body through food consumption, skin contact and breathing. Therefore, it is important to understand how blood cells interact with these MP particles. In vitro studies have demonstrated that MPs tend to accumulate in the gills, stomachs, and brain systems of marine fishes, leading to cellular changes (Emenike et al., 2023). MPs are responsible for the production of reactive oxygen species (ROS) leading to inflammation (Kadac-Czapska et al., 2024). Similarly, observed that large MP particles (0.3-10 µm) promote the release of pro-inflammatory cytokines (Agrawal et al., 2024). Under physiological conditions, plasma protein surrounds the MP particles resulting in the formation of a corona (Lundqvist et al., 2008). Protein corona reduces the MP particle internalization by phagocytic cells (Prietl et al., 2013). The genotoxic effect of MPs was confirmed on many cell lines including intestinal cells and lung cells (Rajendran and Chandrasekaran, 2023).
Only few researchers have examined the toxic effect of MPs exposure on human blood cells. Therefore, study on the toxic effect of MPs on human peripheral blood mononuclear cells (PBMCs) needs to be explored. The occurrence of MPs in human peripheral blood was detected recently (Dzierżyński et al., 2024). Nearly 80% of participants had MP particles in their body (Babonaitė et al., 2023). Majority of studies were conducted to seek the impact of MPs on animal systems including mainly in aquatic fishes (Subaramaniyam et al., 2023). Blood cells are constantly exposed to various xenobiotics and metabolites, and these cells can be considered a useful target for pollution exposition. In recent studies, MPs that were used were not directly exposed to the environment. MPs exposed to the environment may accelerate the immune response. Therefore, it is necessary to understand the biological effect of micro sized plastic particles on human cells. Therefore, the aim of this study is to assess the biological effects of MPs suspension on human PBMCs blood cells and explore potential risks that might be associated with human exposure to MPs.
2. Methods
2.1. Source and Preparation of MPs
Ethical approval for this study was obtained from the Ethics Review Committee (ERC) of Institute of Biology of Sri Lanka (ERC IOBSL 357 07 2024).
Natural MPs solutions were prepared according to the steps described by Rahman et al. (2024) with some alterations. Plastics were collected from Mount Lavinia Beach, which is located in the western littoral region of Sri Lanka (Colombo District). The sampling location is situated approximately 12 km south of Colombo and lies at the coordinates 6.8298° N latitude and 79.8631° E longitude. The site is positioned between the suburban localities of Dehiwala and Ratmalana and is accessible via the Galle Road (A2). Collected plastics were washed properly with Milli Q water to eliminate contaminants. They were air dried for two days to enhance breaking. These plastic pieces were kept in falcon tubes at −80 °C, for 3 days. After 3 days, the plastic pieces were mixed with methanol (1:1). They were kept on dry ice for one hour. The mixture was sonicated in an ice bath at 40 kHz for two hours until a uniform suspension of MPs was evident. Then MPs were dissolved in 0.5% hydrochloric acid (HCl) to further eliminate impurities which are present on the surface of MPs. Furthermore, the powdered material was examined under a scanning electron microscope and confirmed to be in the size range of 1 μm to 5 mm. The natural MP particles were stored in glass bottles, and concentrations of MPs solutions 0.5 µg/ml, 5 µg/ml, 50 µg/ml, 500 µg/ml were prepared in Roswell Park Memorial Institute Medium (RPMI 1640 culture medium) (Gibco, Thermo Fisher Scientific, USA, Cat no: 23400-013). Then the obtained material was examined under a scanning electron microscope. It was confirmed that MPs are in the size range from 1 μm to 5 mm. Fourier-transform infrared (FTIR) spectroscopy was used to confirm the polymer type of MP.
Similarly, concentrations of Polyethylene Glycol (PEG) (Gibco, Thermo Fisher Scientific, Waltham, MA, USA, Cat no: 25322-68-3) 0.5 µg/ml, 5 µg/ml, 50 µg/ml, 500 µg/ml were prepared in RPMI 1640 culture medium. The test concentrations were prepared from this stock solution.
2.2. Preparation of PBMCs
Peripheral blood samples from twelve healthy (n=12, healthy volunteer donors of age 18-30 were selected for this study. These participants didn’t have any history of alcohol consumption, smoking or long-term drug use and no history of any previous acute infections for two weeks prior of duration prior to sample collection. (About 5 ml of peripheral blood collected by venipuncture in EDTA tubes.
PBMCs were isolated from whole blood using the Ficoll-Paque density centrifugation method (Jia et al., 2017). An amount of 5 ml of heparinized blood was centrifuged at 1960 revolutions per minute (RPM) for 5 minutes in breaks on mode. The supernatant was discarded and RPMI 1640 culture media was added in 1:1 ratio. 3 ml of Ficoll PaqueTM Plus (Cytiva, Thermo Fisher Scientific, Waltham, MA, USA) was added to the above diluted blood sample. Tube containing Ficoll PaqueTM Plus was held at 45° degrees and the diluted cell suspension was carefully overlayed onto Ficoll PaqueTM Plus media (Figure 2.1). The cell suspension was centrifuged at 1960 rpm for 20 minutes at brakes off mode (Figure 2.2). White mononuclear cell layer was drawn off using a sterilized pipette between Ficoll PaqueTM Plus media and plasma without disturbing the interface. The mononuclear cells layer was transfused to a sterile centrifuge tube using a sterile pipette. The mononuclear cell suspension was washed with 1 × PBS solution and centrifuged at 1960 rpm for 10 minutes at brakes low mode. The cell pellet was resuspended with RPMI 1640 culture media (containing 10% fetal bovine serum, glutamine). Isolated PBMCs were counted using a Neubauer improved hemocytometer.
2.3. PBMC Treatment with PEG and Natural MPs
Different concentrations of PEG and manually grinded natural MPs (0.5 µg/ml, 5 µg/ml, 50 µg/ml, 500 µg/ml) were exposed to PBMCs in 96 well sterile cell culture plate at 0.1 × 10⁶ cells / well in RPMI medium and incubated for 24 h at 37° C, 5% CO2. (Model: Galaxy 170S, Manufacturer: New Brunswick, Eppendorf AG, Hamburg, Germany). Equal number of cells without treating with PEG or manually grinded natural MPs were considered as the negative control.
2.4. Assessment of Cell Viability and Phagocytic Capacity
The viability of the PBMCs exposed against different concentrations of PEG, natural MPs and the negative control were examined following the Trypan blue cell viability method (Hudson L, Hay FC. Practical immunology,1980).
2.4.1. Neutral Red Uptake Assay
Phagocytic activity of PBMCs was measured using neutral red dye uptake assay (Hudson L, Hay FC. Practical immunology, 1980). PBMCs stained with red color were counted using a Neubauer improved hemocytometer. The phagocytic index was calculated using this formula:
Phagocytic Index = [Number of active PBMC / Number of total PBMC] × 100%
In vitro phagocytic activity of PBMCs was established by the nitroblue tetrazolium (NBT) reduction assay (Manosroi, Saraphanchotiwitthaya and Manosroi, 2005). PBMCs were incubated with 0.1% NBT solution according to MP concentration. The absorbance was measured at 610 nm using a microplate reader (Microplate reader 680, Bio-Rad, USA).
2.5. Griess Colorimetric Assay for Determination of Nitrite Levels
The level of Nitrite in PBMCs which were exposed to both PEG and Natural MPs were measured using Griess colorimetric assay (Tsikas, 2007).
2.6. Determination of the LC50 /IC 50 Concentration
Median lethal concentration (LC50) was statistically analyzed by SPSS 6 software. LC50 value is determined based on probit analysis which is a graphical method for calculating the LC50. IC 50 value was calculated using MS excel using this below formula.
IC50 = (Concentration of tested agent × 50) / % inhibition
2.7. Statistical Analysis
IBM® SPSS® Statistics 30.0.0.0 (172) (2025) was used to conduct statistical analyses and produce graphical representations of the data. The findings were presented as mean ± SD. The one-way analysis of variance (ANOVA) test was used for normally distributed data. The one-way ANOVA test followed by Tukey’s Post Hoc test was used to test the statistical significance between treatment groups and control. In this study, p value < 0.05 is considered as statistically significant. Each experiment was performed in triplicate.
3. Results
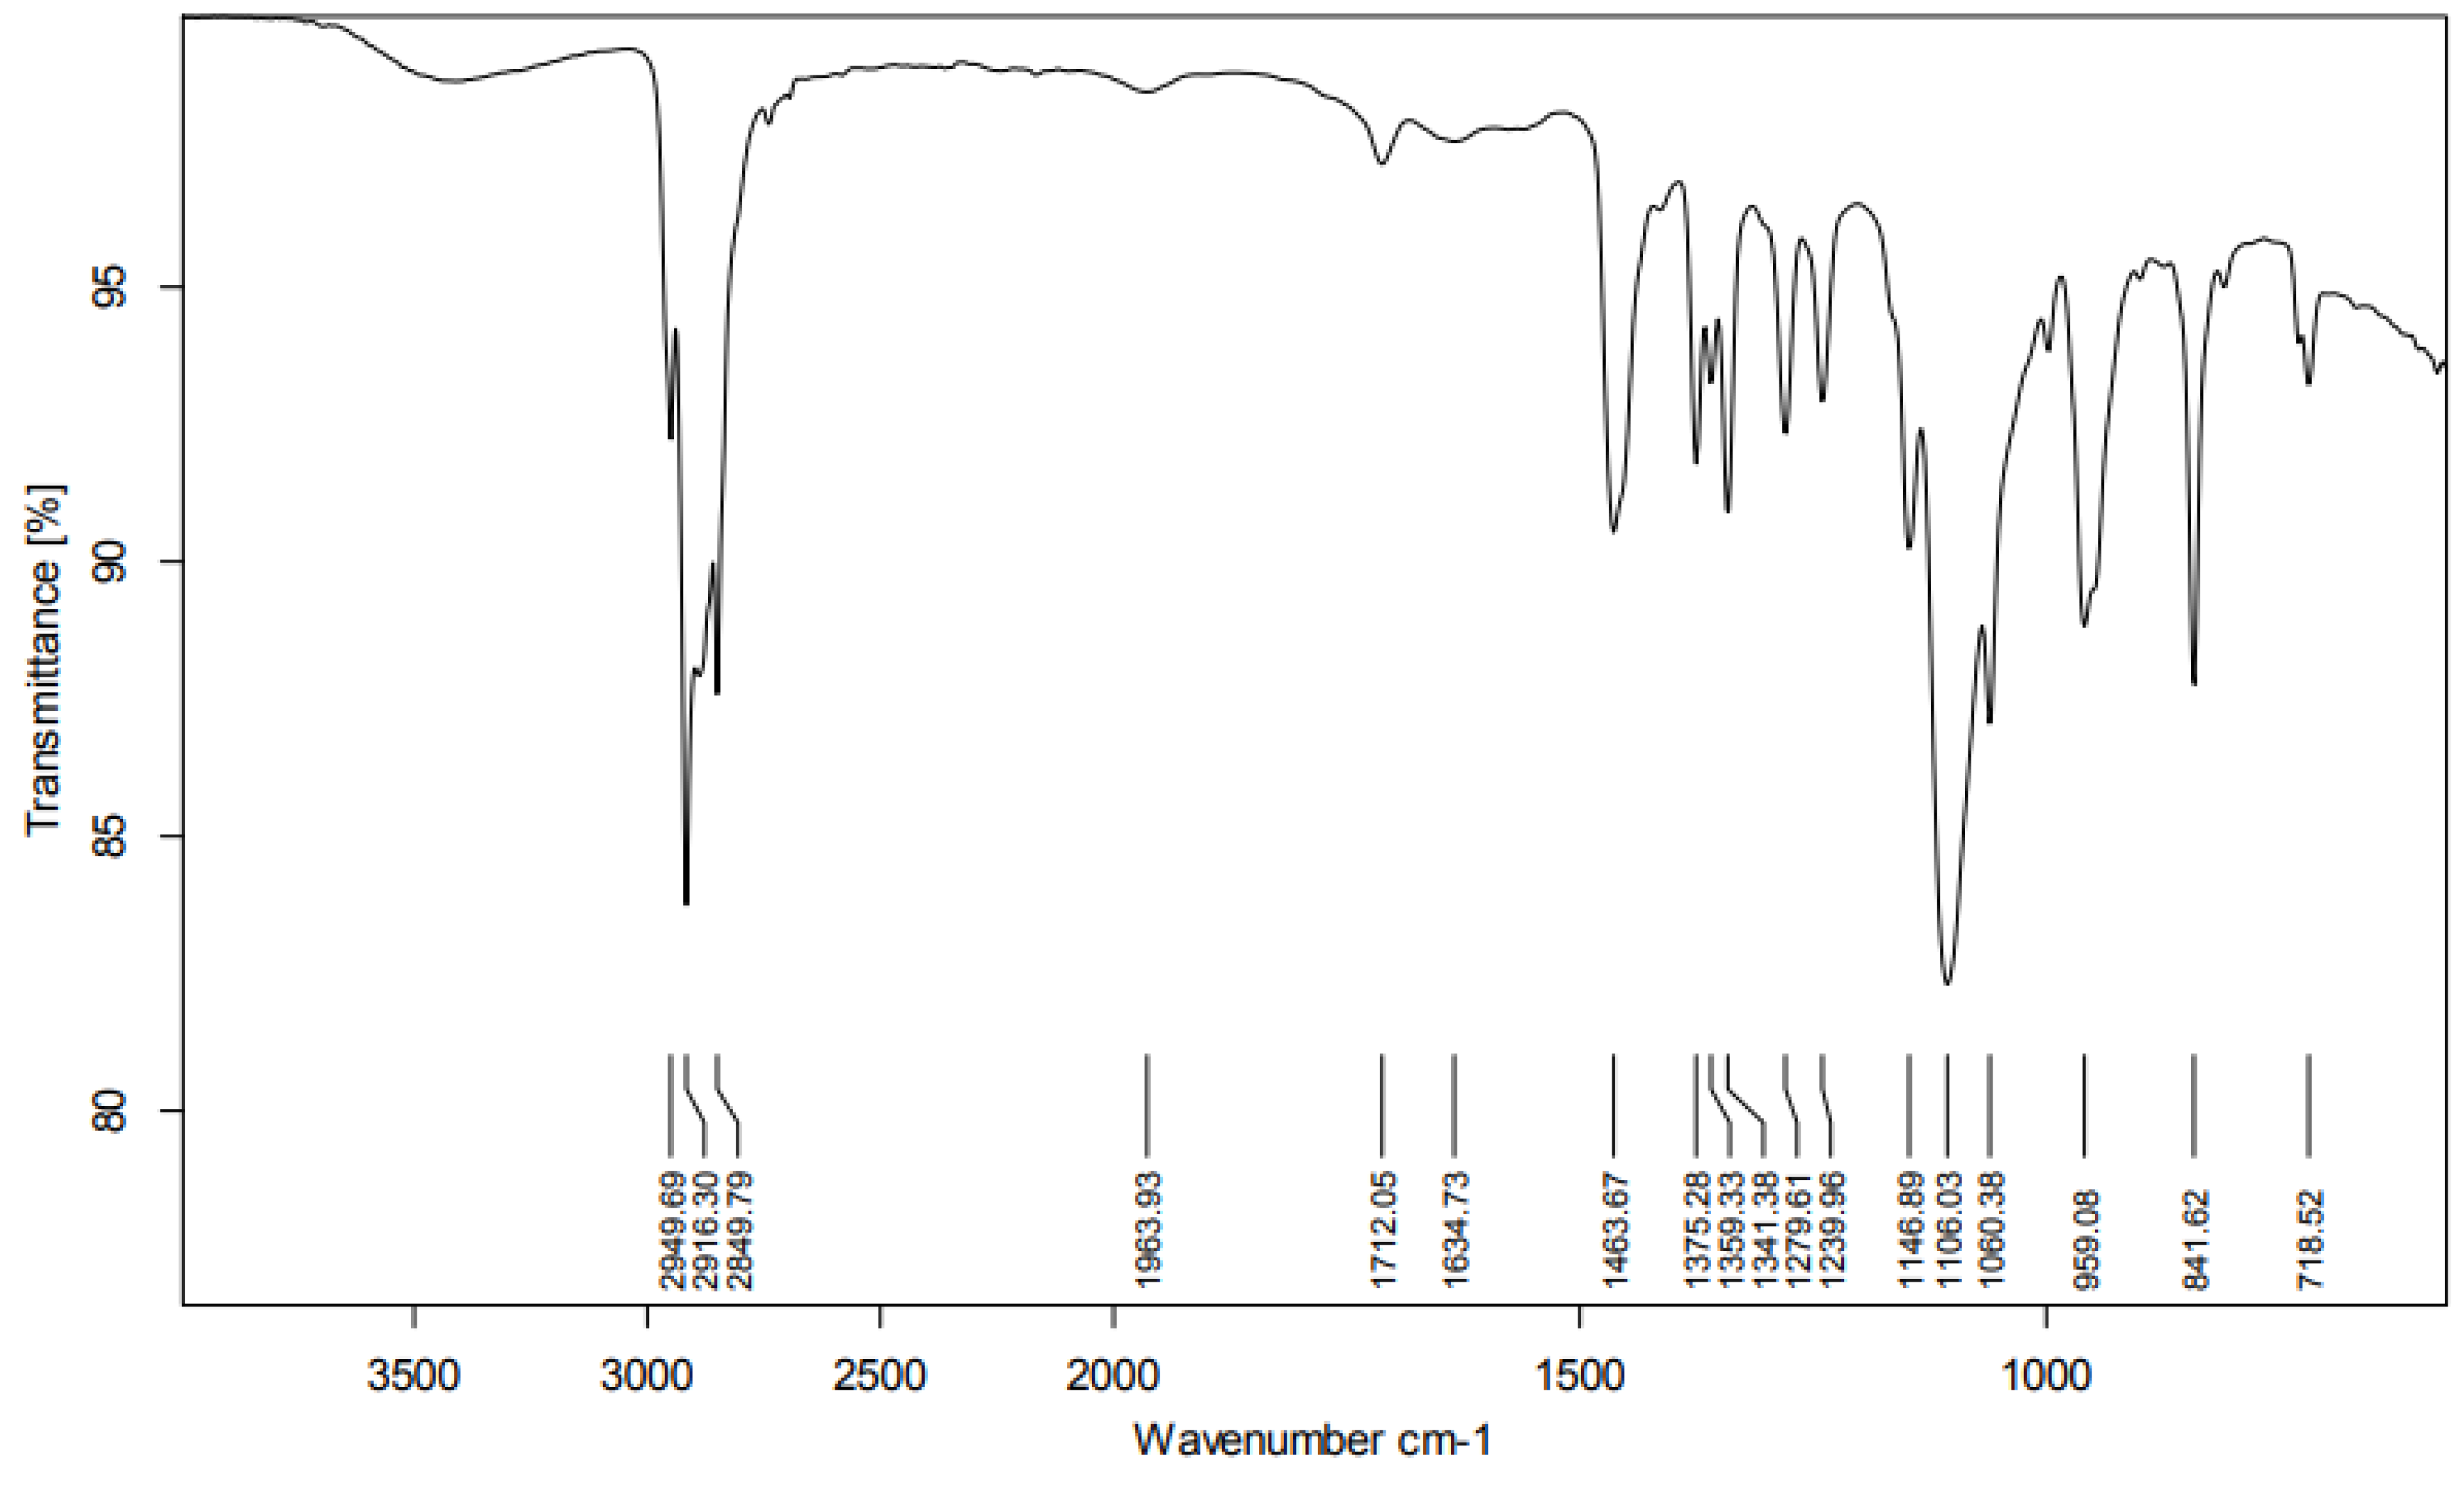
3.1. FTIR Spectrum Analysis
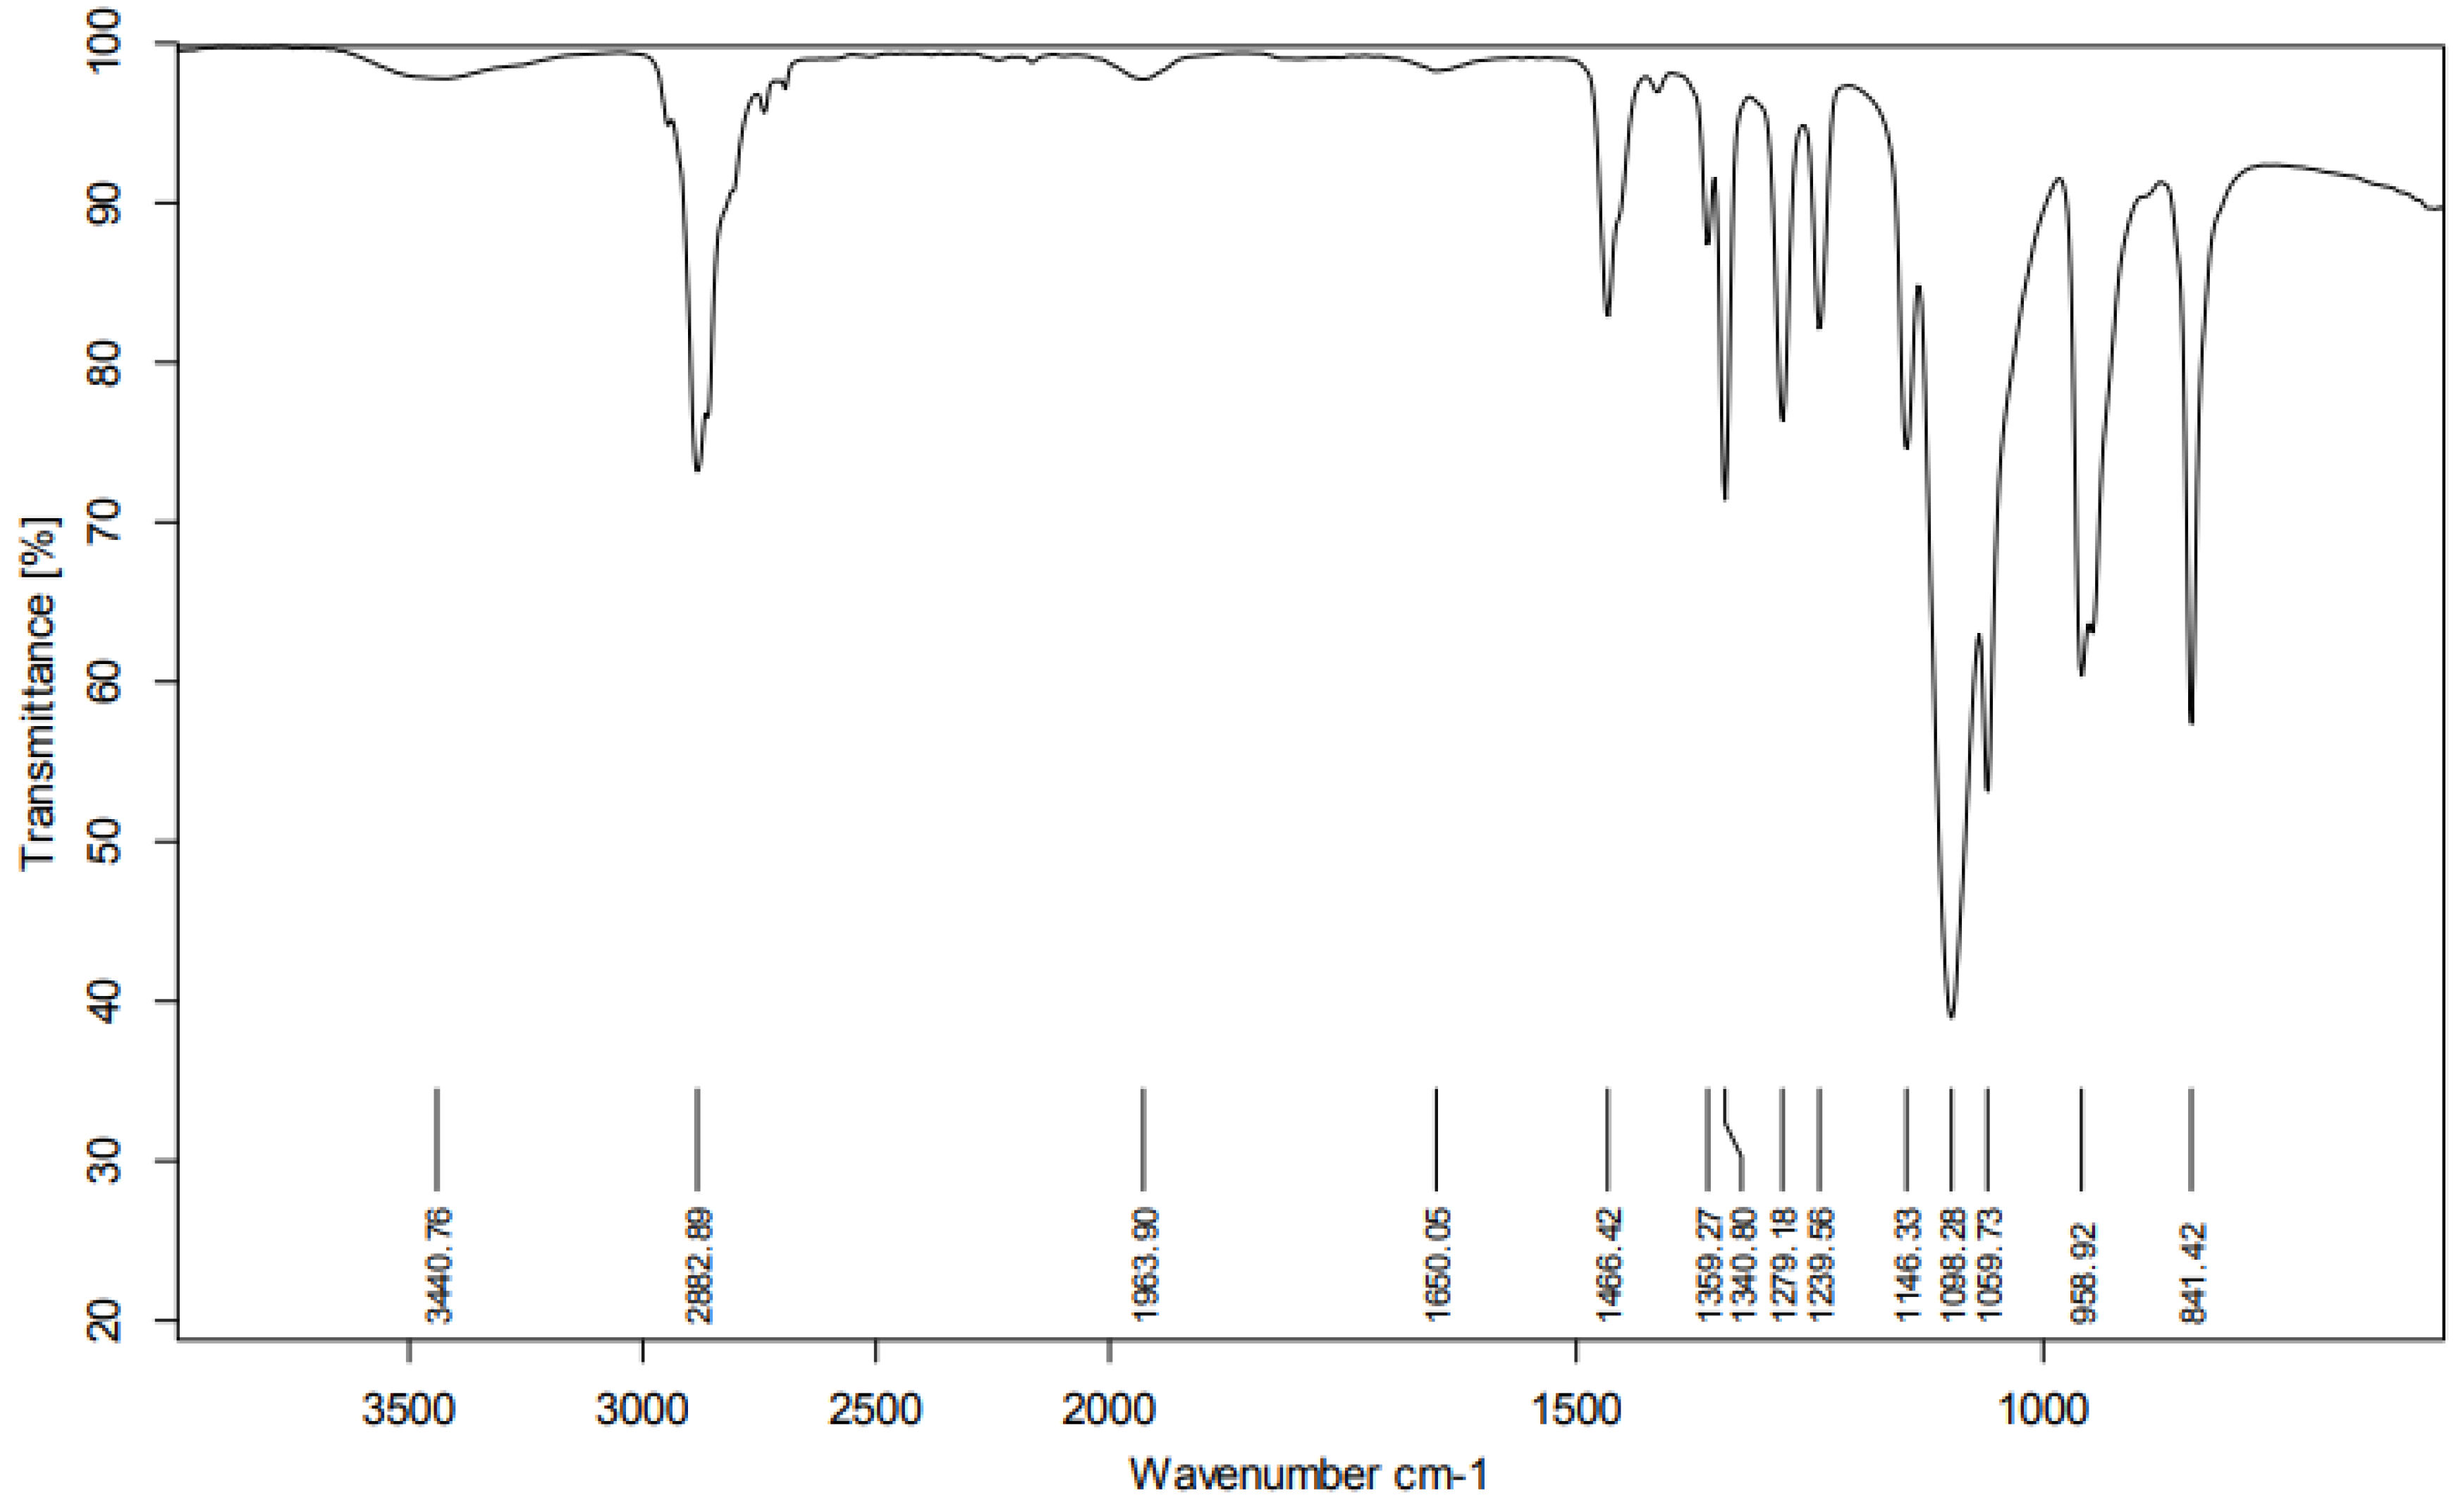
The FTIR spectrum of this compound in
Figure 1-a shows the characteristic absorption bands that confirm the presence of functional groups associated with PEG. A sharp absorption band present around 1100 cm⁻¹ is responsible for C–O–C stretching vibrations of the ether linkages, a characteristic feature of PEG. Peaks observed between 2880 cm⁻¹ and 2950 cm⁻¹ occur due to C–H bonds from the –CH₂– groups that arise from the polymer backbone. This FTIR spectrum in
Figure 1-b indicates the presence of one or more MP particles, with notable features indicating polyethylene terephthalate (PET), polyethylene (PE) and polypropylene (PP). Based on the spectrum, characteristic bands observed at 1240 cm⁻¹, 1712 cm⁻¹, 720 cm⁻¹ confirm the presence of ester and aromatic functional groups. Therefore, it was concluded that PET is present in this sample.
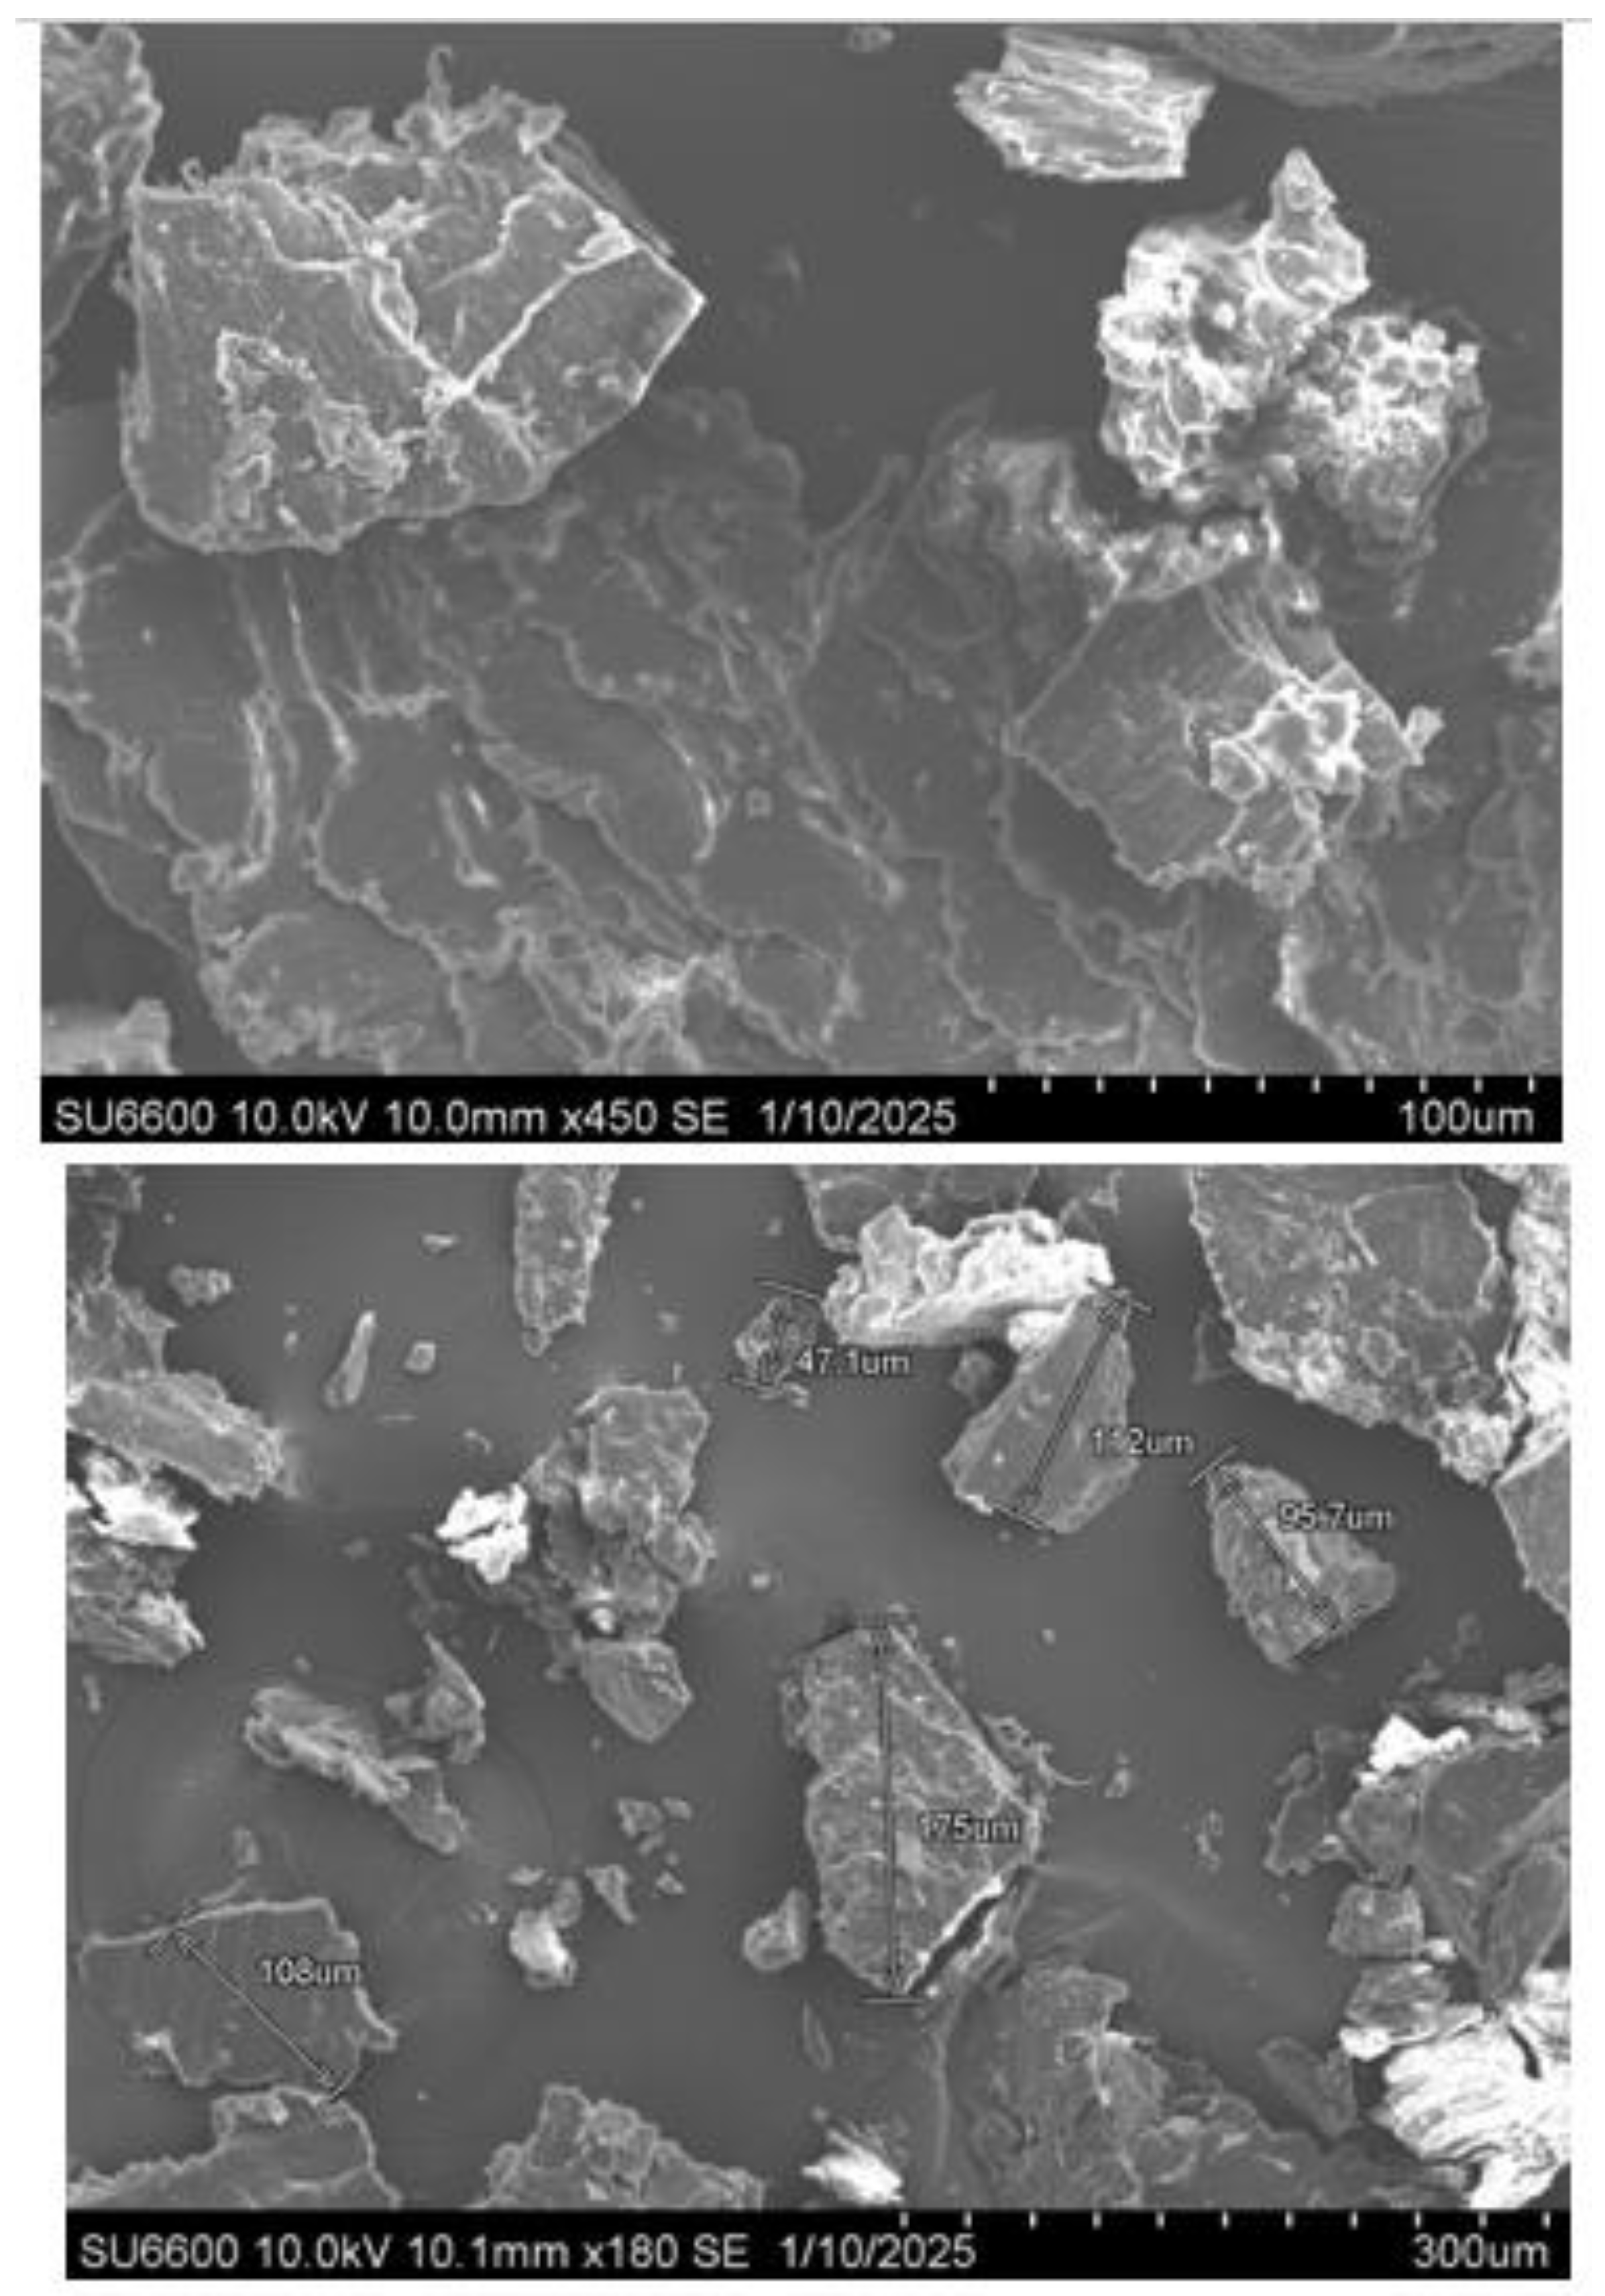
3.2. SEM Analysis of Natural MPs
SEM images of Natural MPs shows that the majority of obtained MPs particles were fragments and pellets (
Figure 2). Size range of obtained MPs are between 1 µm and 5mm.
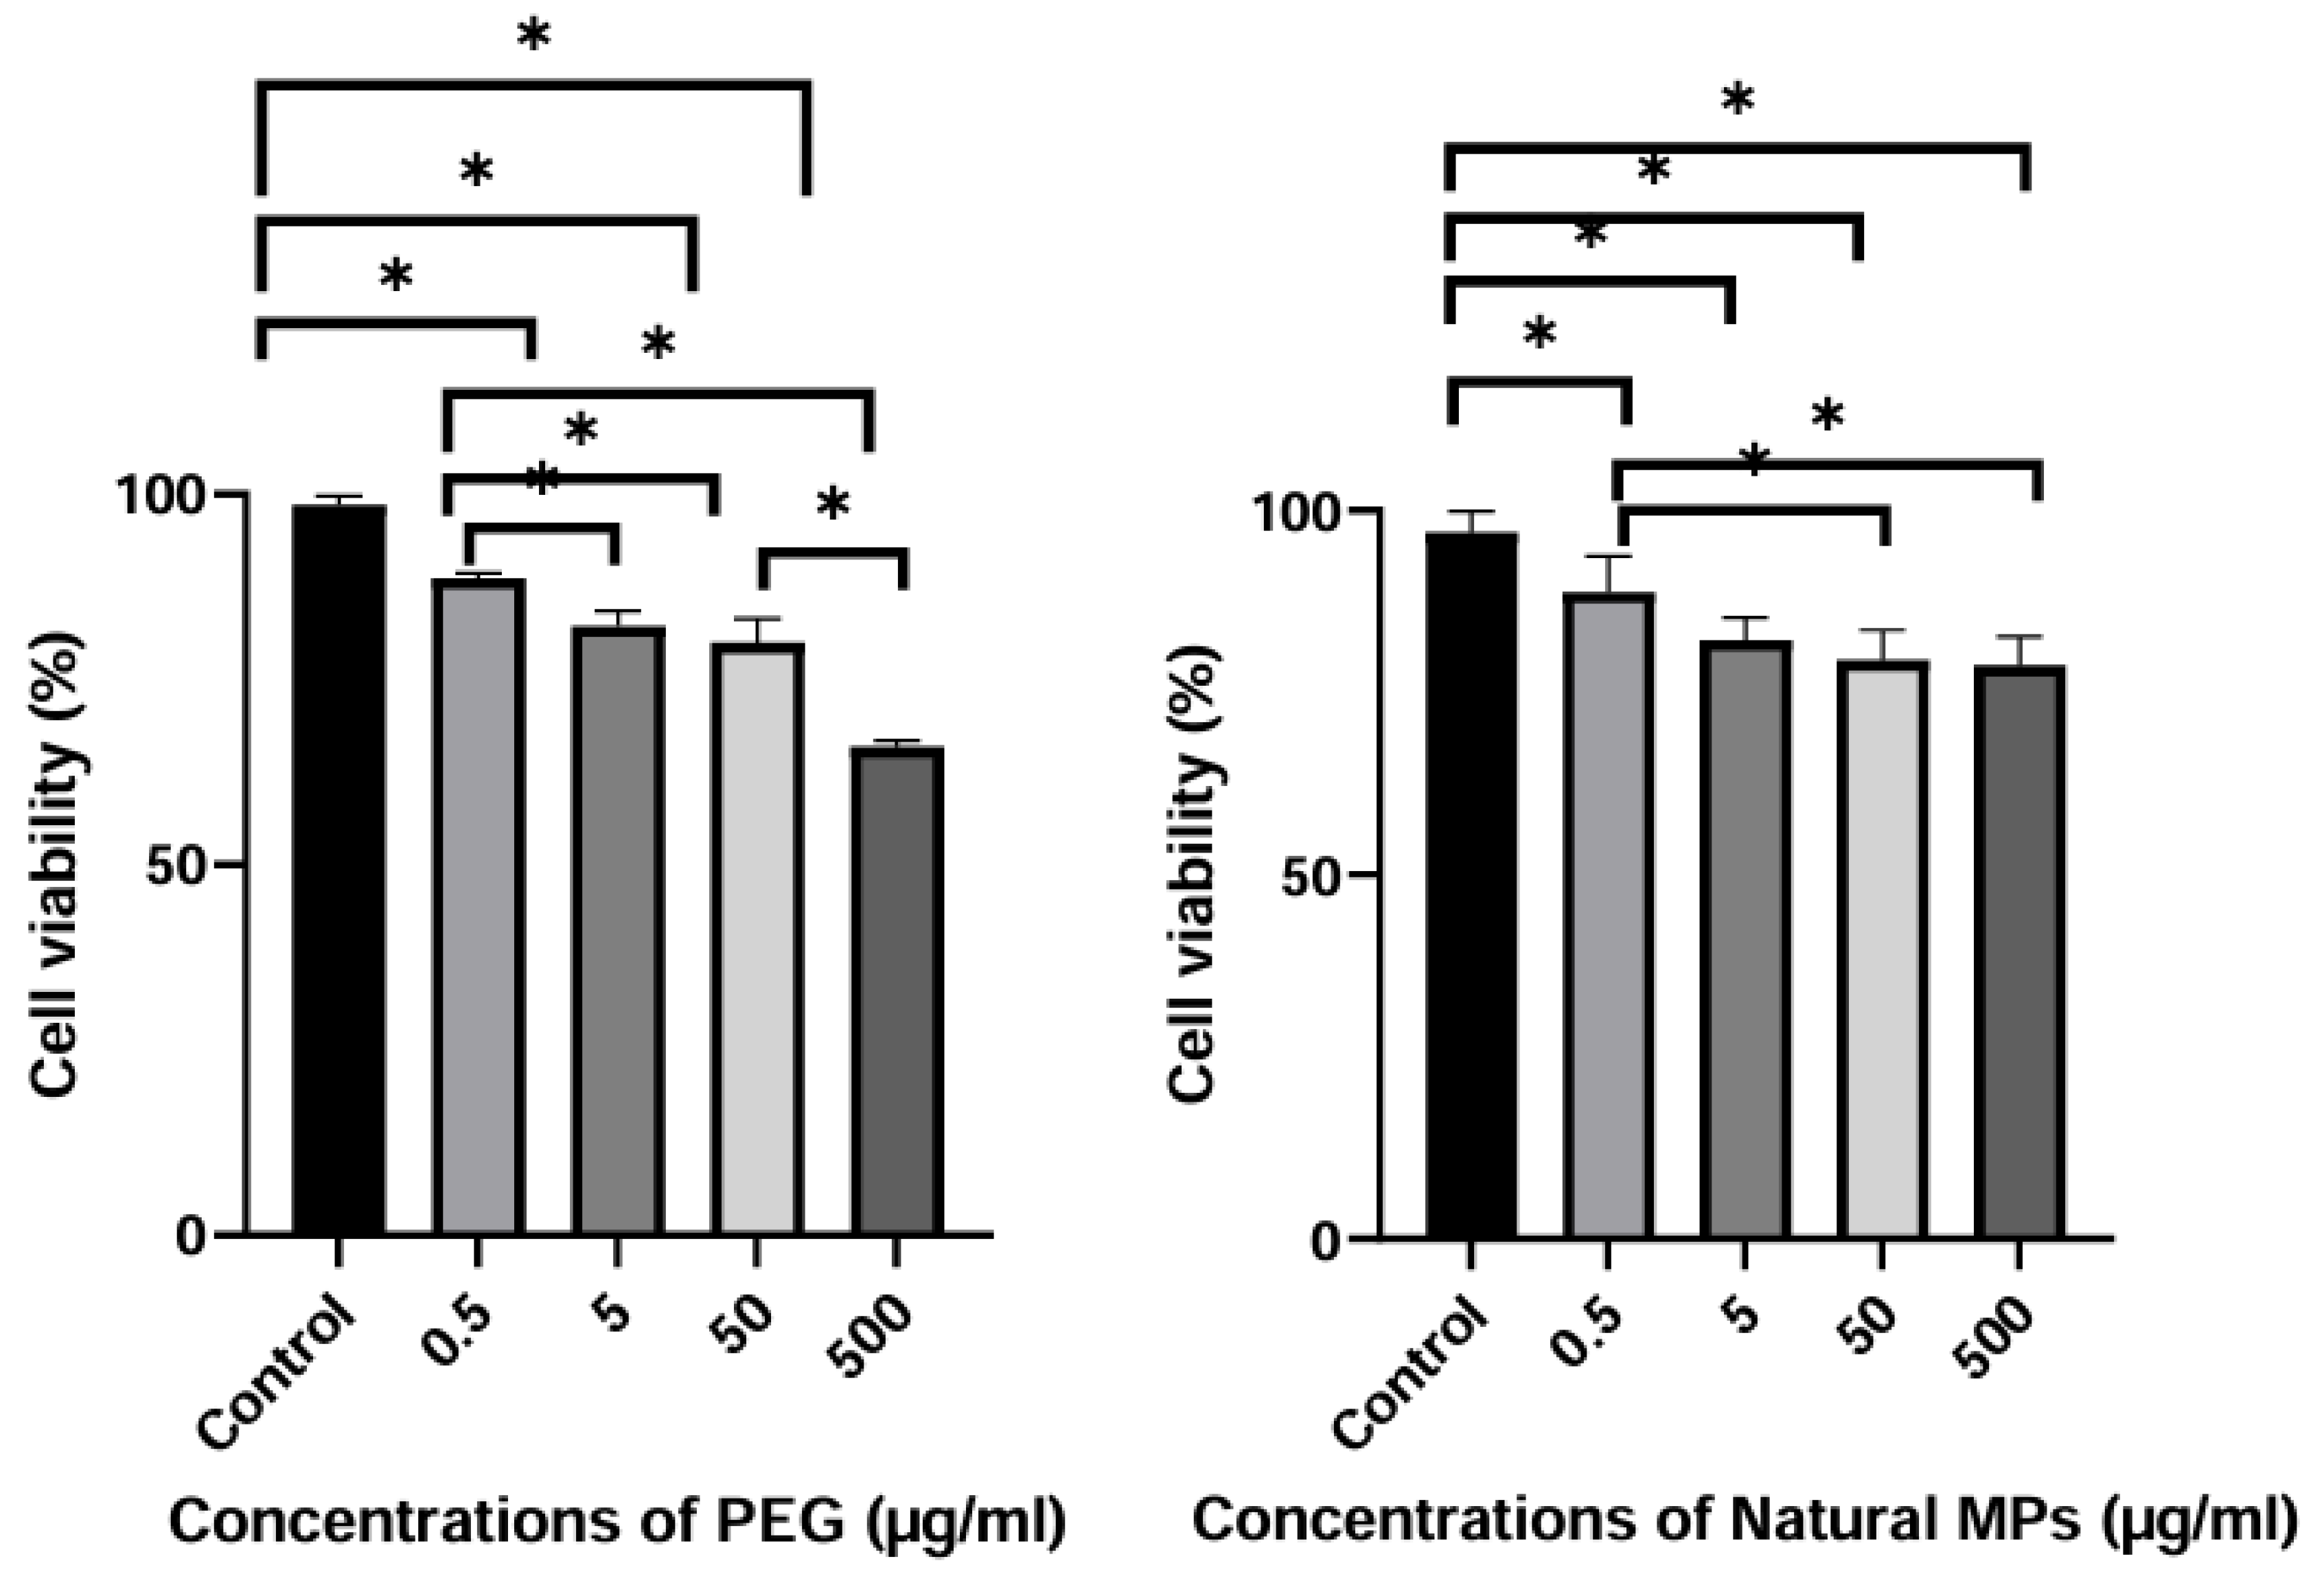
3.3. Cell Viability (%) of PBMCs Treated with Different Concentrations of PEG and Natural MPs
A significant difference was observed in the mean cell viability values of PBMCs treated with 0.5 μg/ml (88.68 ± 0.68%), 5 μg/ml (82.25 ± 2.07%), 50 μg/ml (80.07 ± 3.15%), and 500 μg/ml (65.95 ± 0.88%) PEG, when compared to the control group (98.67 ± 1.13%, p < 0.001). Furthermore, the mean cell viability (%) at 0.5 μg/ml PEG was significantly higher than that of 5, 50, and 500 μg/ml groups (0.5 μg/ml; 88.68 ± 0.68%, p < 0.001; Tukey’s Post Hoc test). A statistically significant reduction in cell viability was observed in the 500 μg/ml PEG-treated group when compared to the control group (65.95 ± 0.88, p < 0.001; Tukey’s Post Hoc test). Similarly, significant viability reductions were observed at 0.5 μg/ml, 50 μg/ml, and 500 μg/ml compared to the control group (0.5 μg/ml, 88.68 ± 0.68%, p < 0.001; 50 μg/ml, 80.07 ± 3.15%, p < 0.001; 500 μg/ml, 65.95 ± 0.88%, p < 0.001; Tukey’s Post Hoc test). There was no statistically significant difference between the 5 μg/ml and 50 μg/ml groups (p = 0.268, p > 0.05) (
Figure 3-a).
A significant difference was observed for the mean cell viability (%) values of 0.5 µg/ml (89.14 ± 4.79%), 5 µg/ml (82.194 ± 3.13%), 50 µg/ml (79.444 ± 4.08%) and 500 µg/ml (77.250 ± 5.61%) natural MPs exposed groups, when compared to the control group (96.962 ± 2.90%). Statistically significant decrease in viability (%) was also observed between 0.5 µg/ml and 500 µg/ml, (0.5 µg/ml, 89.14 ± 4.79%, p < 0.001; 50 µg/ml, 79.44 ± 4.08%, p < 0.001; 500 µg/ml, 77.25 ± 5.61%; Tukey’s Post Hoc test) (
Figure 3-b).
Table 1 depicts the Mean± SD cell viability levels and the standard error (SE) of each concentration of natural MPs and PEG.
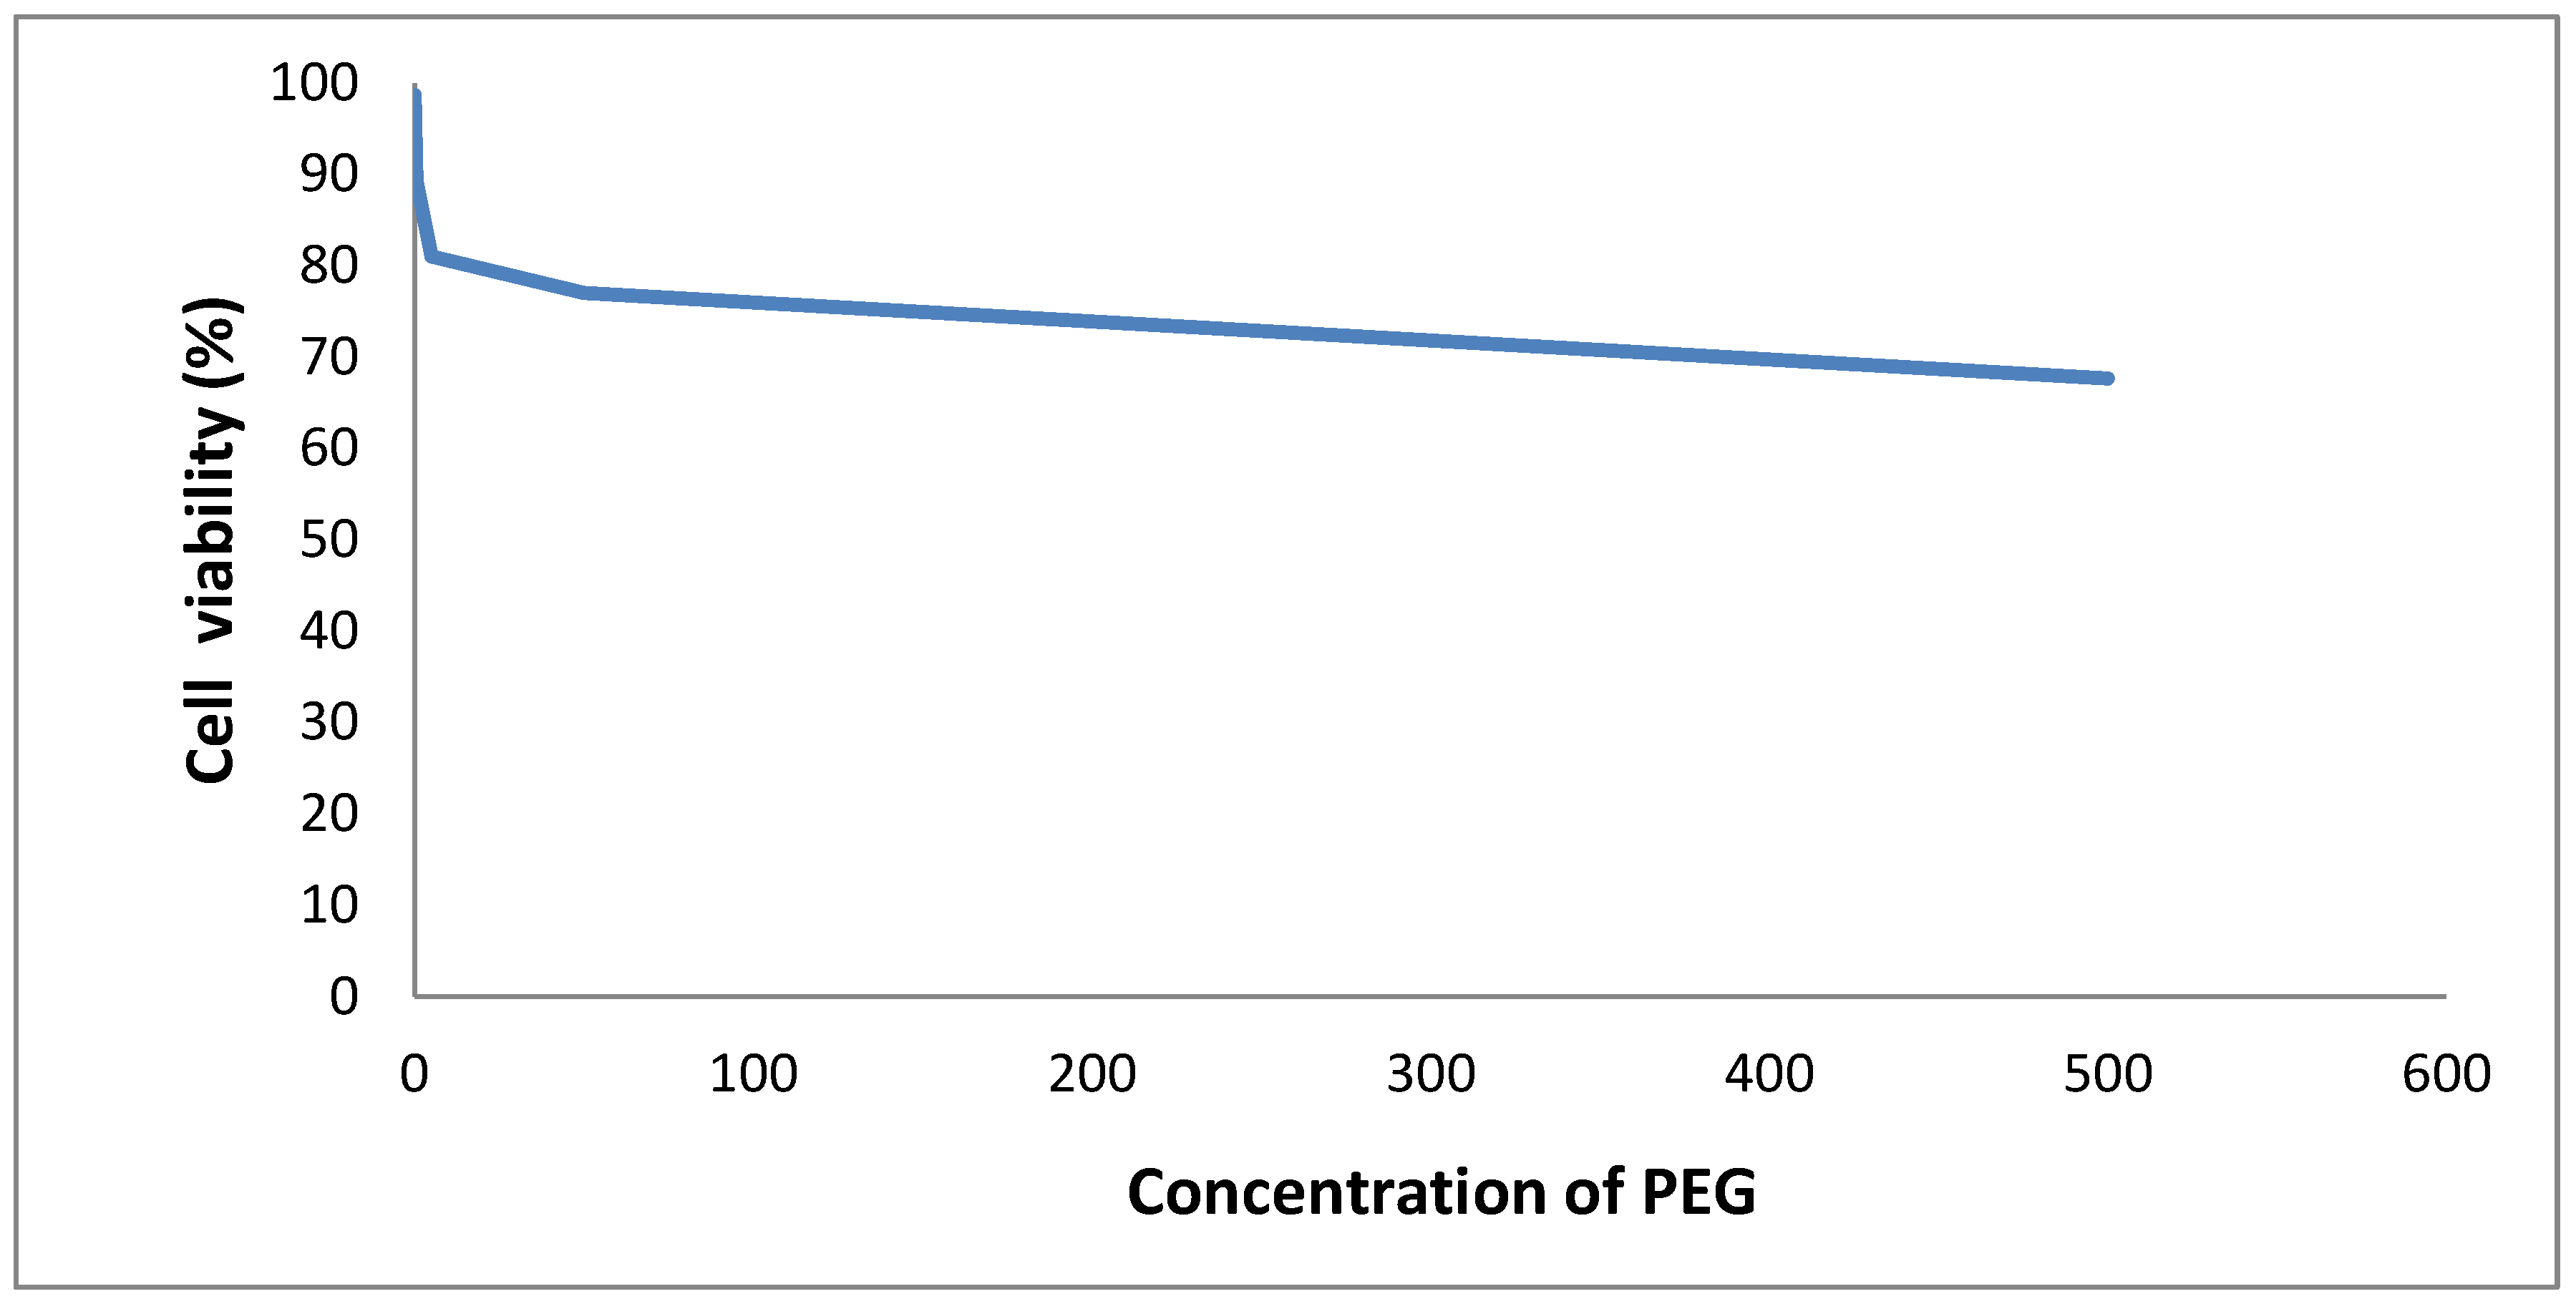
3.3.1. LC50 Assessment of PBMCs with Natural MPs and PEG
Based on the dose–response curve, the LC₅₀ value for PEG was determined to be 157.9 µg/mL, representing the concentration at which cell viability decreased to 50% relative to the untreated control (
Figure 4 and
Figure 5).
The below dose–response curve (
Figure 5) indicates that the LC₅₀ value for PEG is 158.87 µg/mL, representing the concentration at which cell viability decreased to 50%.
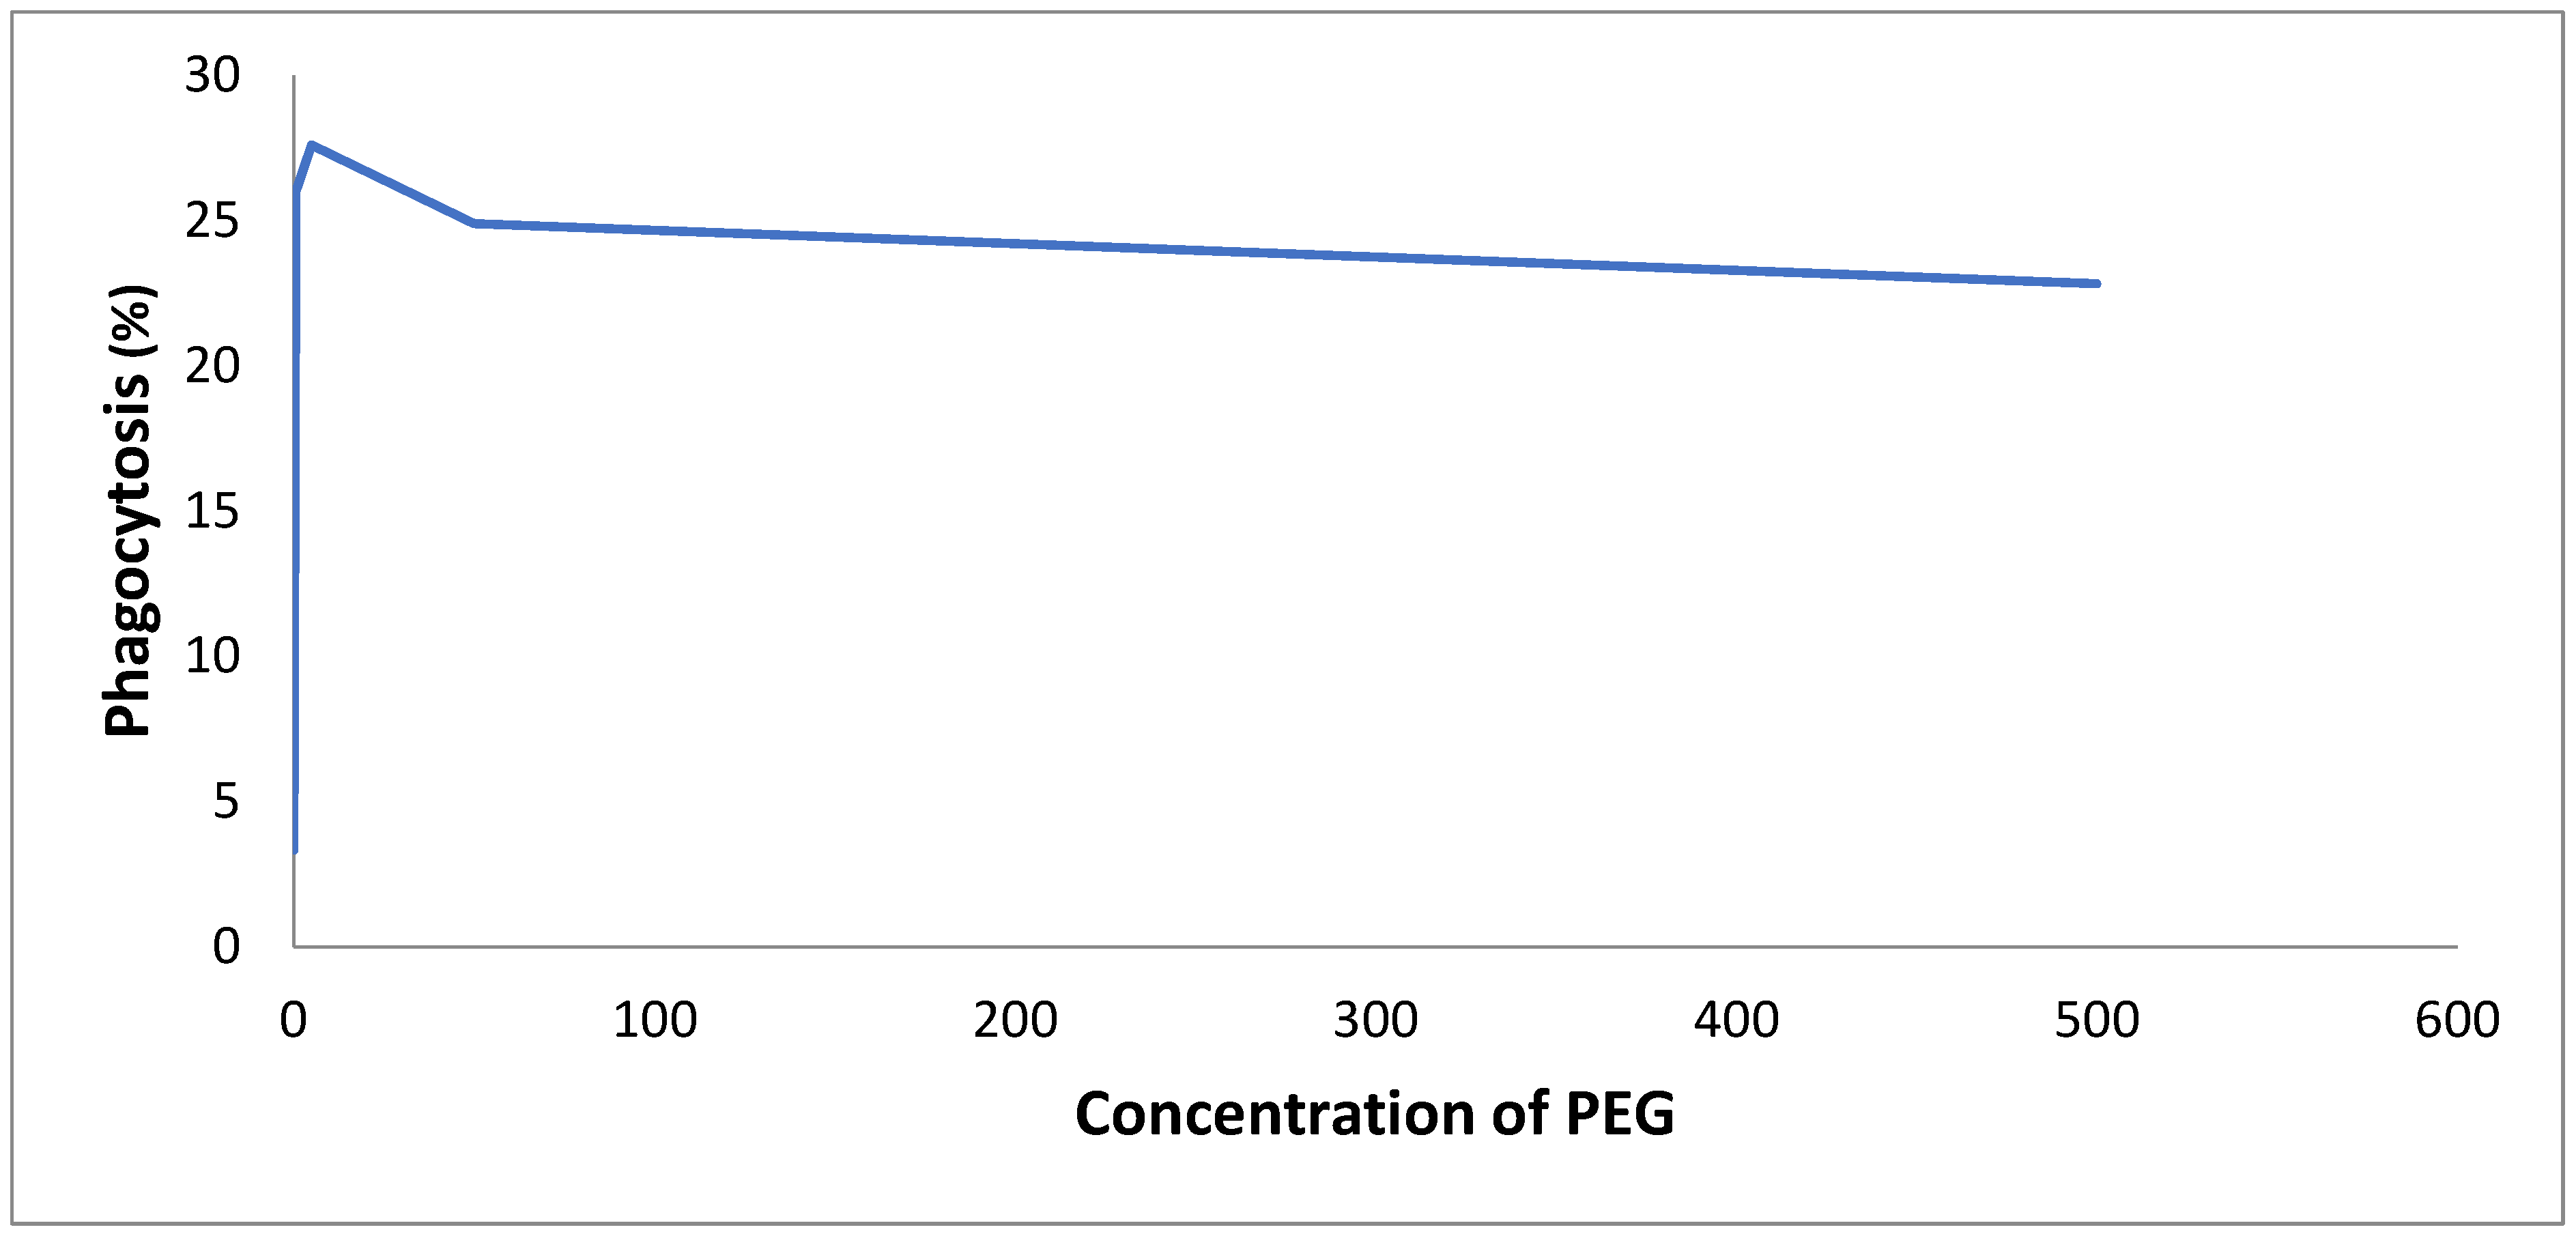
3.4. Comparison of Phagocytic Index (%) of PBMCs in PEG and Natural MPs Tested Groups and Control
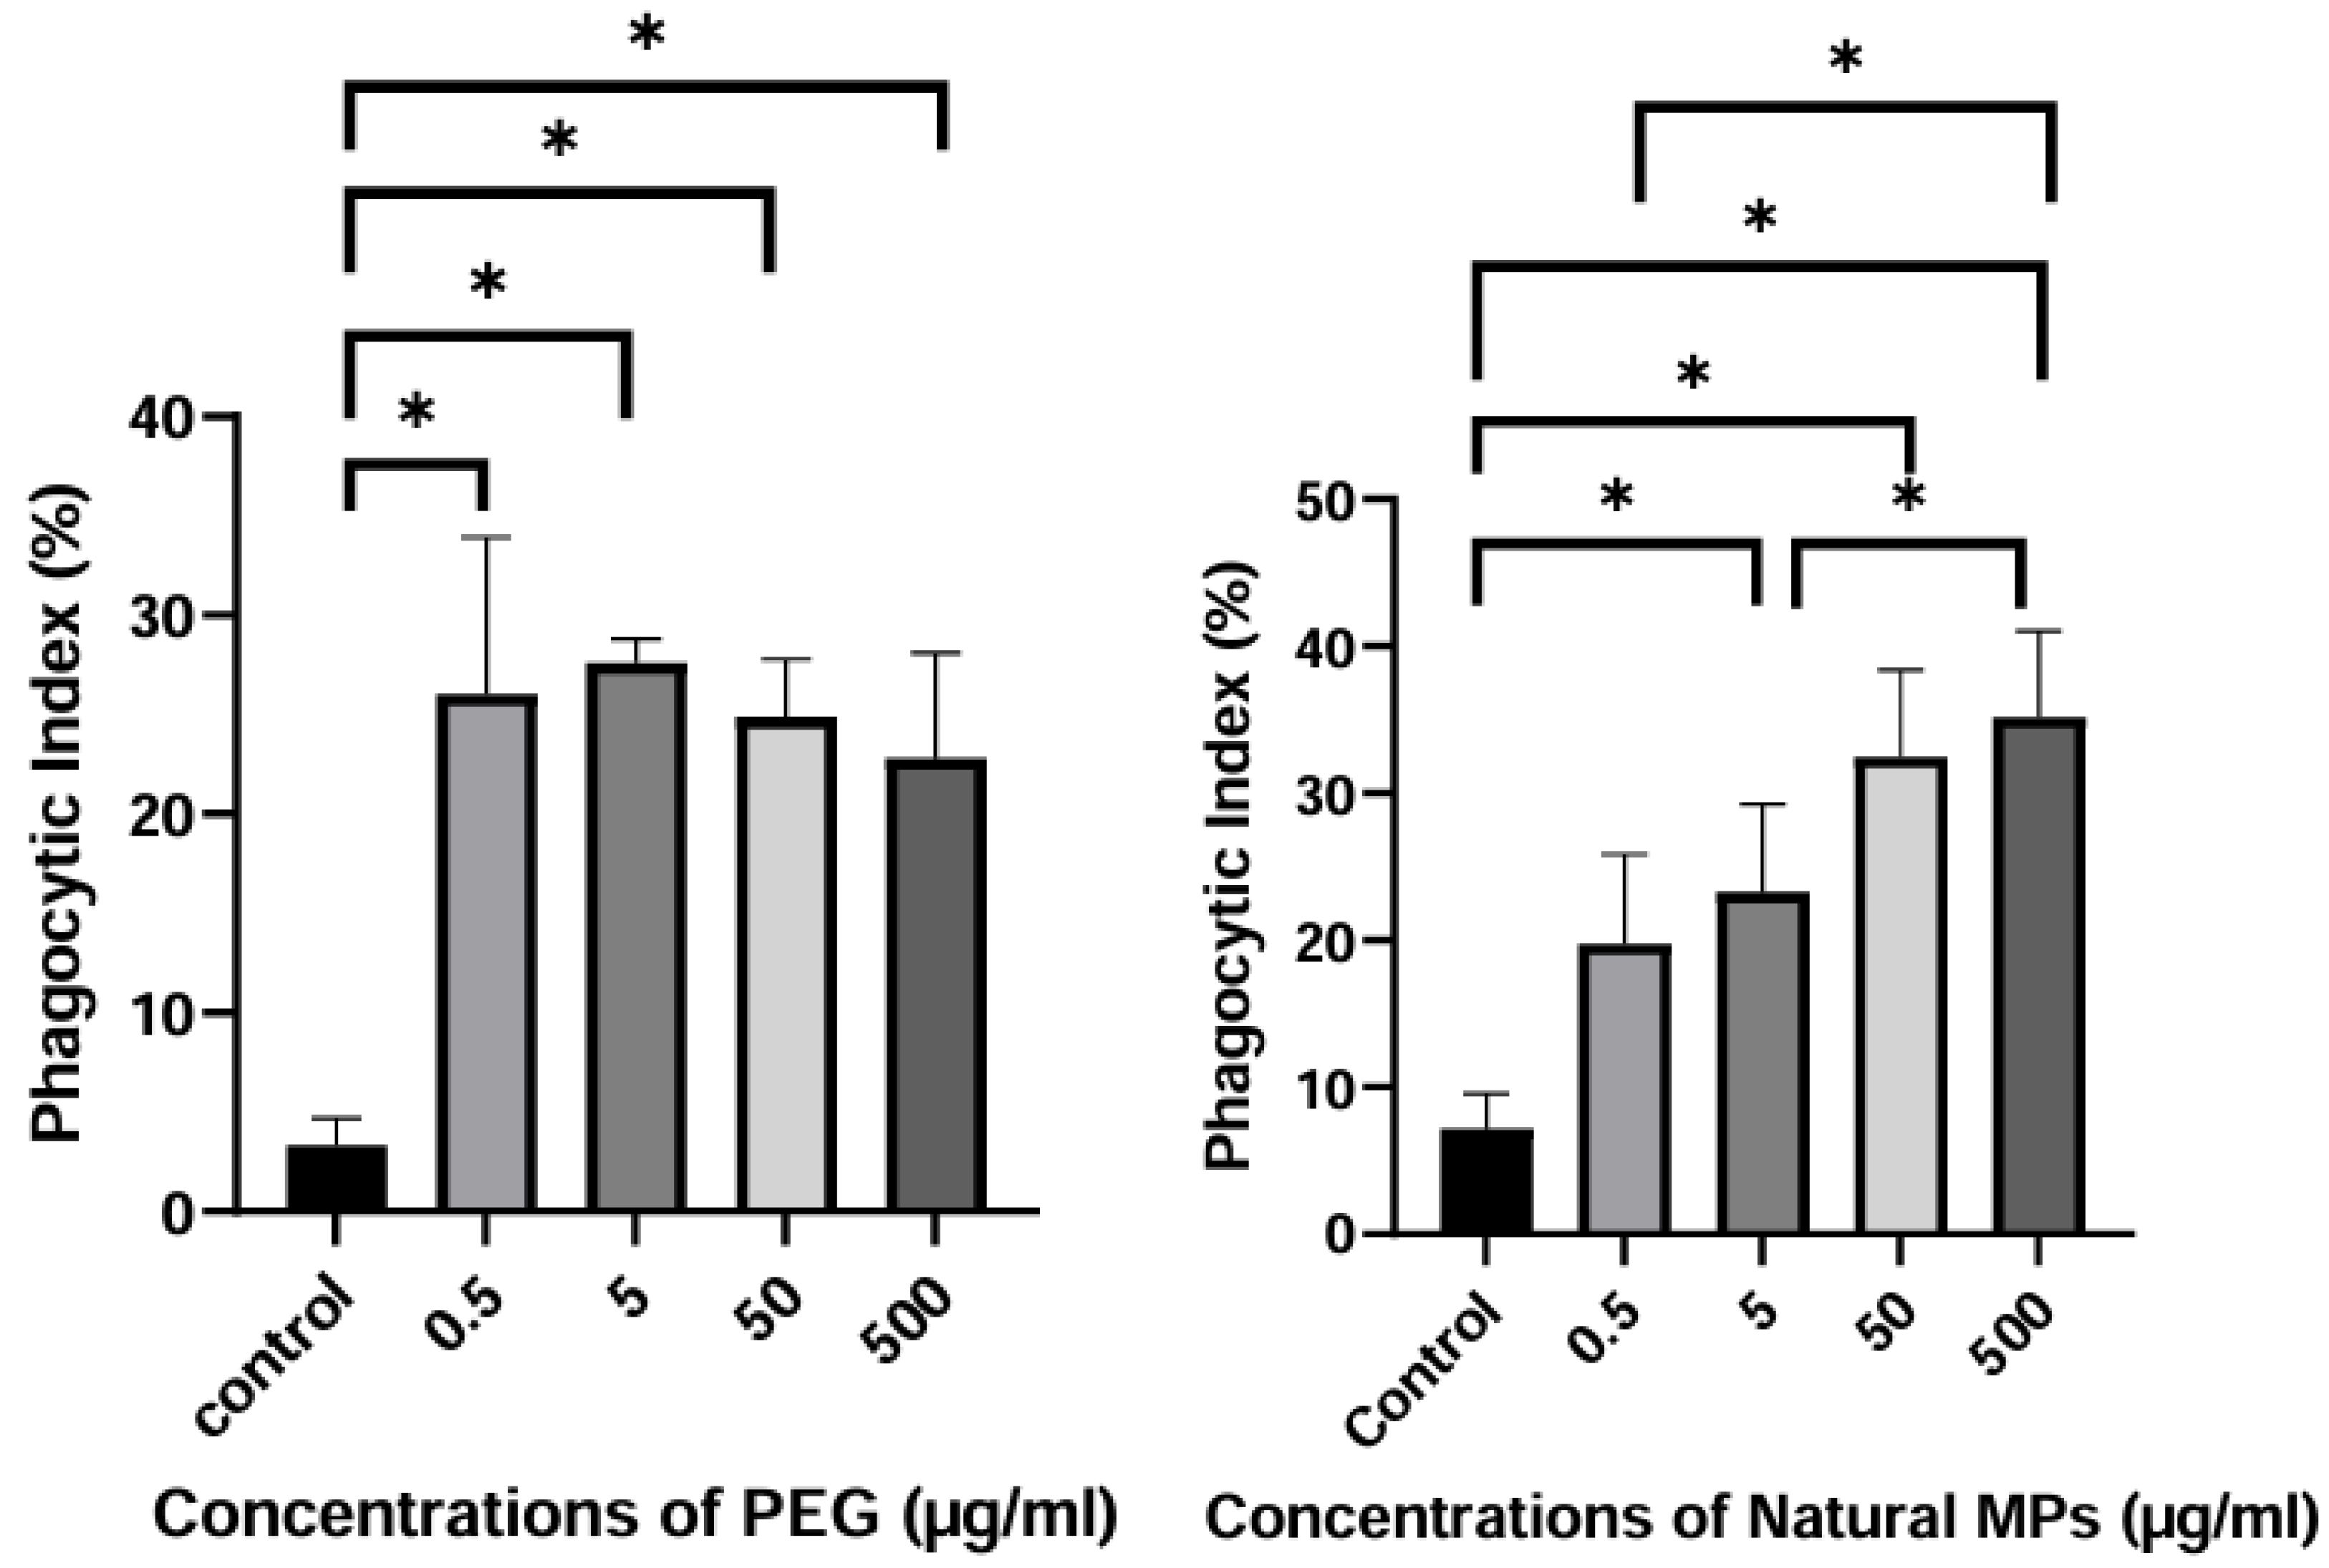
A significant difference was observed in the mean Phagocytic Index values of PBMCs treated with 0.5 µg/ml (26.03 ± 7.89%), 5 µg/ml (27.60 ± 1.21%), 50 µg/ml (24.88 ± 2.88%), and 500 µg/ml (22.83 ± 5.23%) PEG, when compared to the control group (3.33 ± 1.37%; Tukey’s Post Hoc test, p < 0.050) (
Figure 6-a).
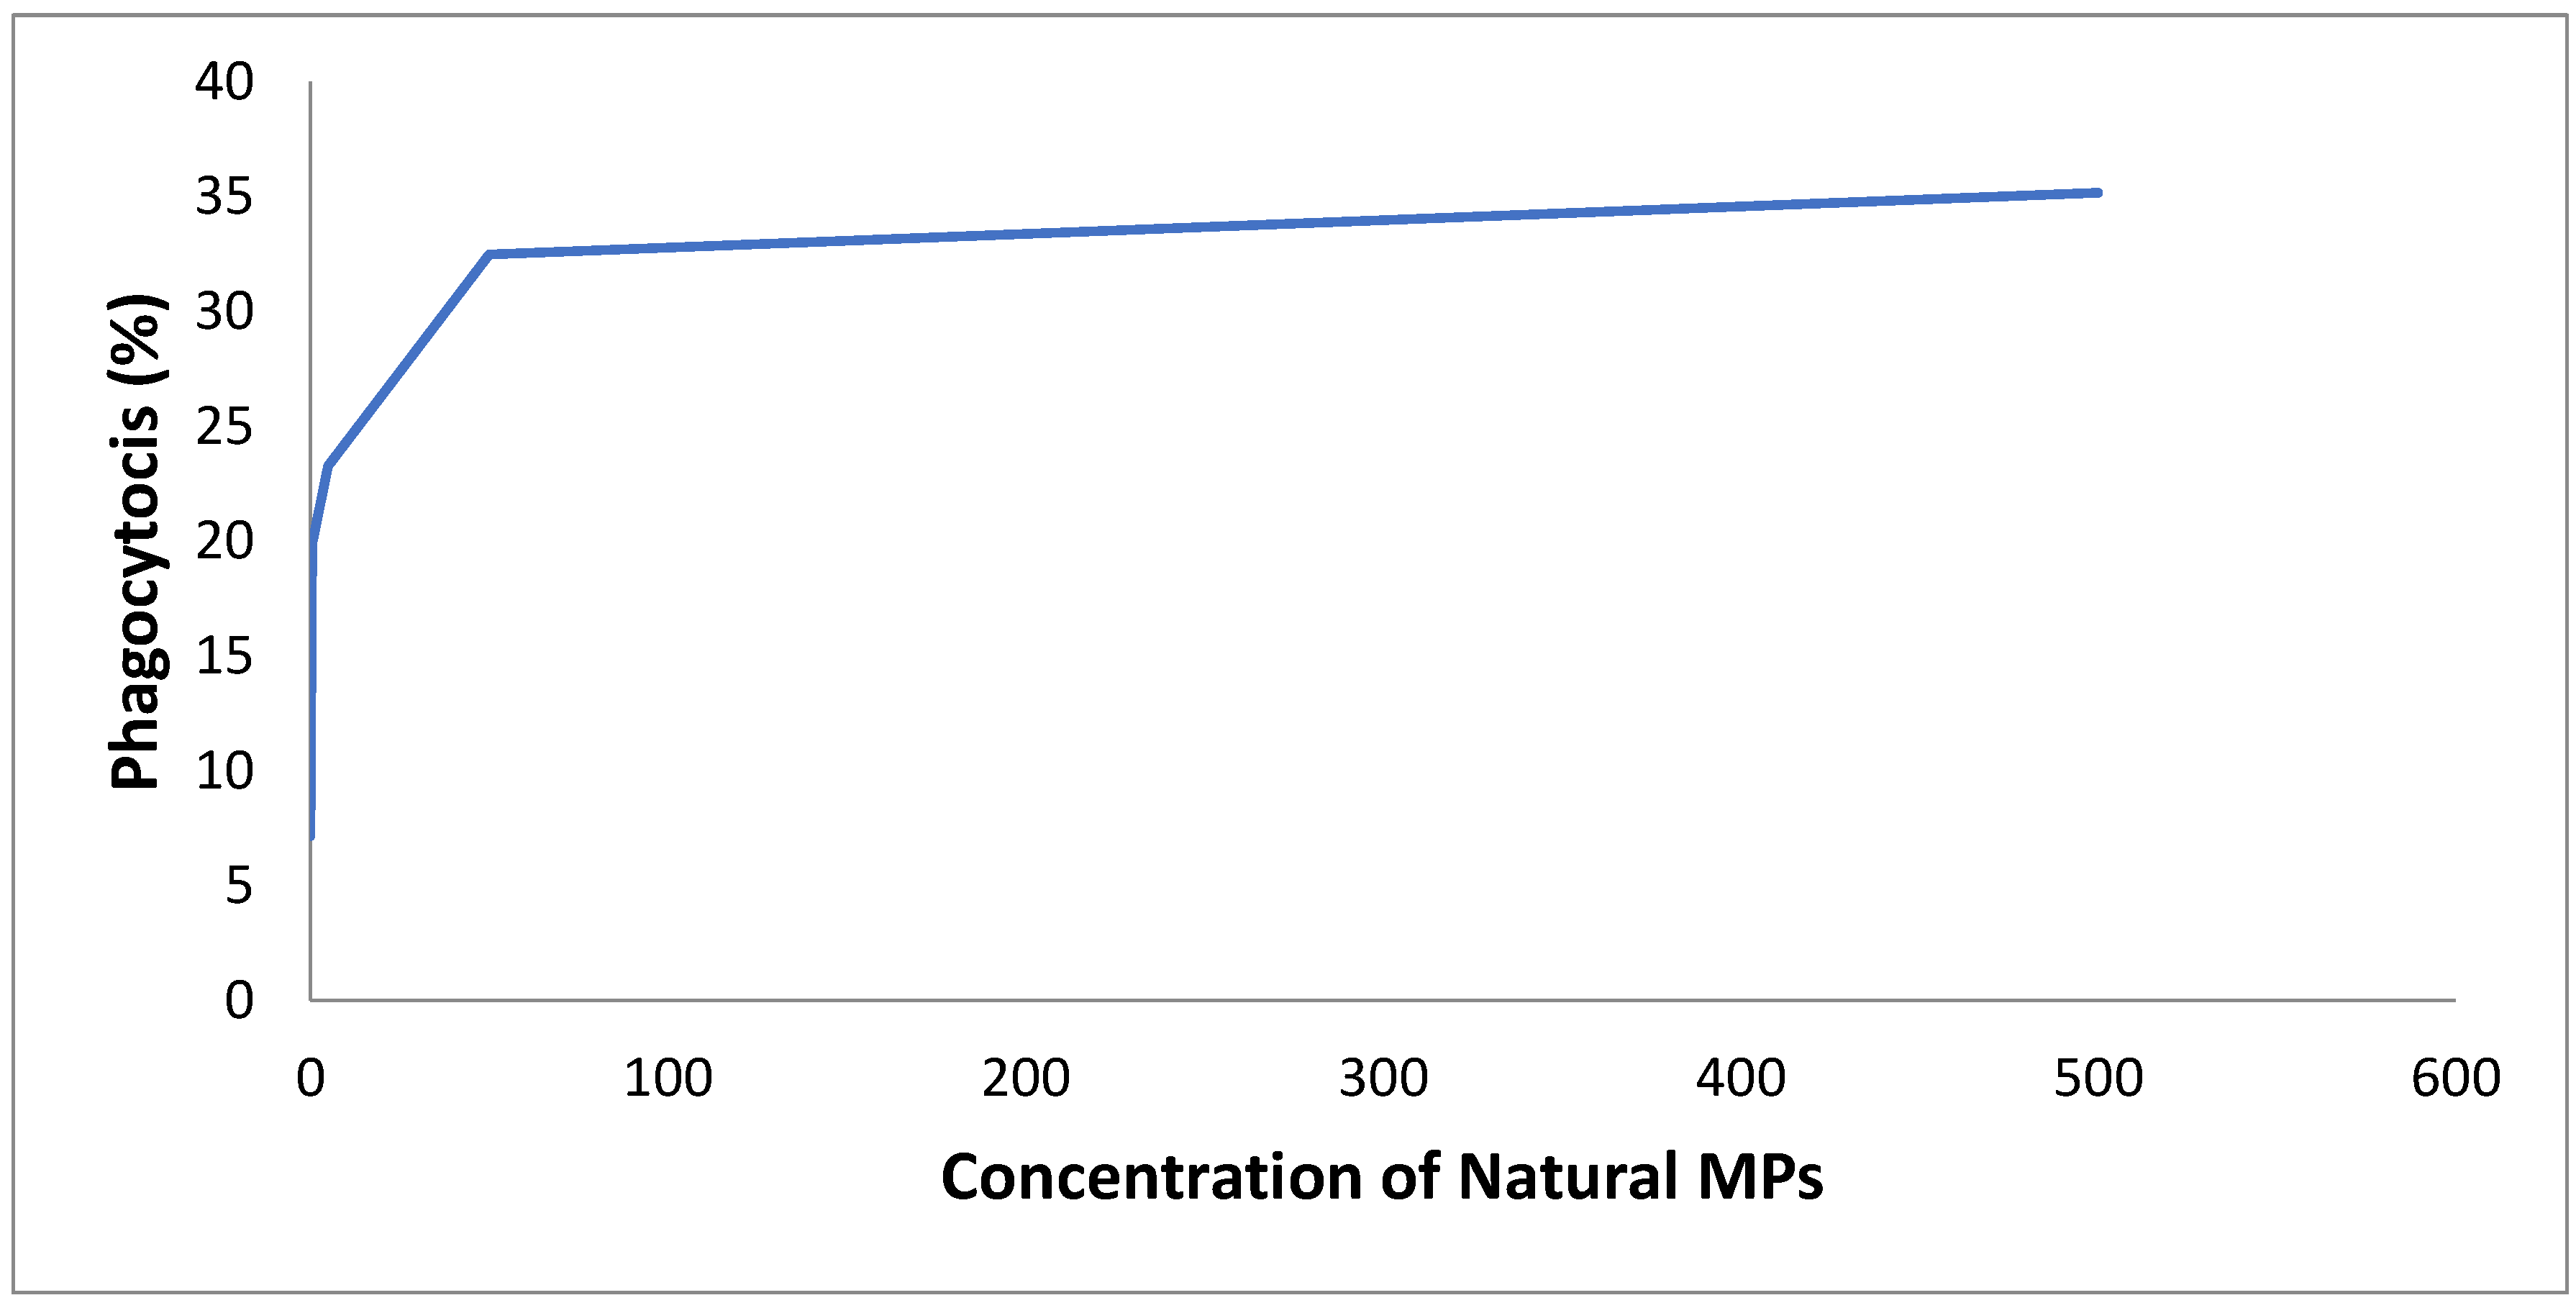
Mean Phagocytic Index values of PBMCs treated with 5 µg/ml, 50 µg/ml, and 500 µg/ml Natural MPs were significantly higher when compared to the control group. (5 µg/ml, 23.28 ± 5.98%, p < 0.001; 50 µg/ml, 32.44± 5.88%; 500 µg/ml, 35.17 ± 5.91%, p < 0.001; Tukey’s Post Hoc test). Mean phagocytic Index of PBMCs treated with 500 µg/mL was significantly higher compared to 5 µg/ml and 0.5 µg/ml treated group (35.17 ± 5.91%, p < 0.001; Tukey’s Post Hoc test) (
Figure 6-b).
Table 2 depicts the Mean± SD phagocytic index and the SE of each concentration of natural MPs and PEG.
3.5. Comparison of Nitrite Level in PBMCs After Treatment with PEG Tested Groups and Control
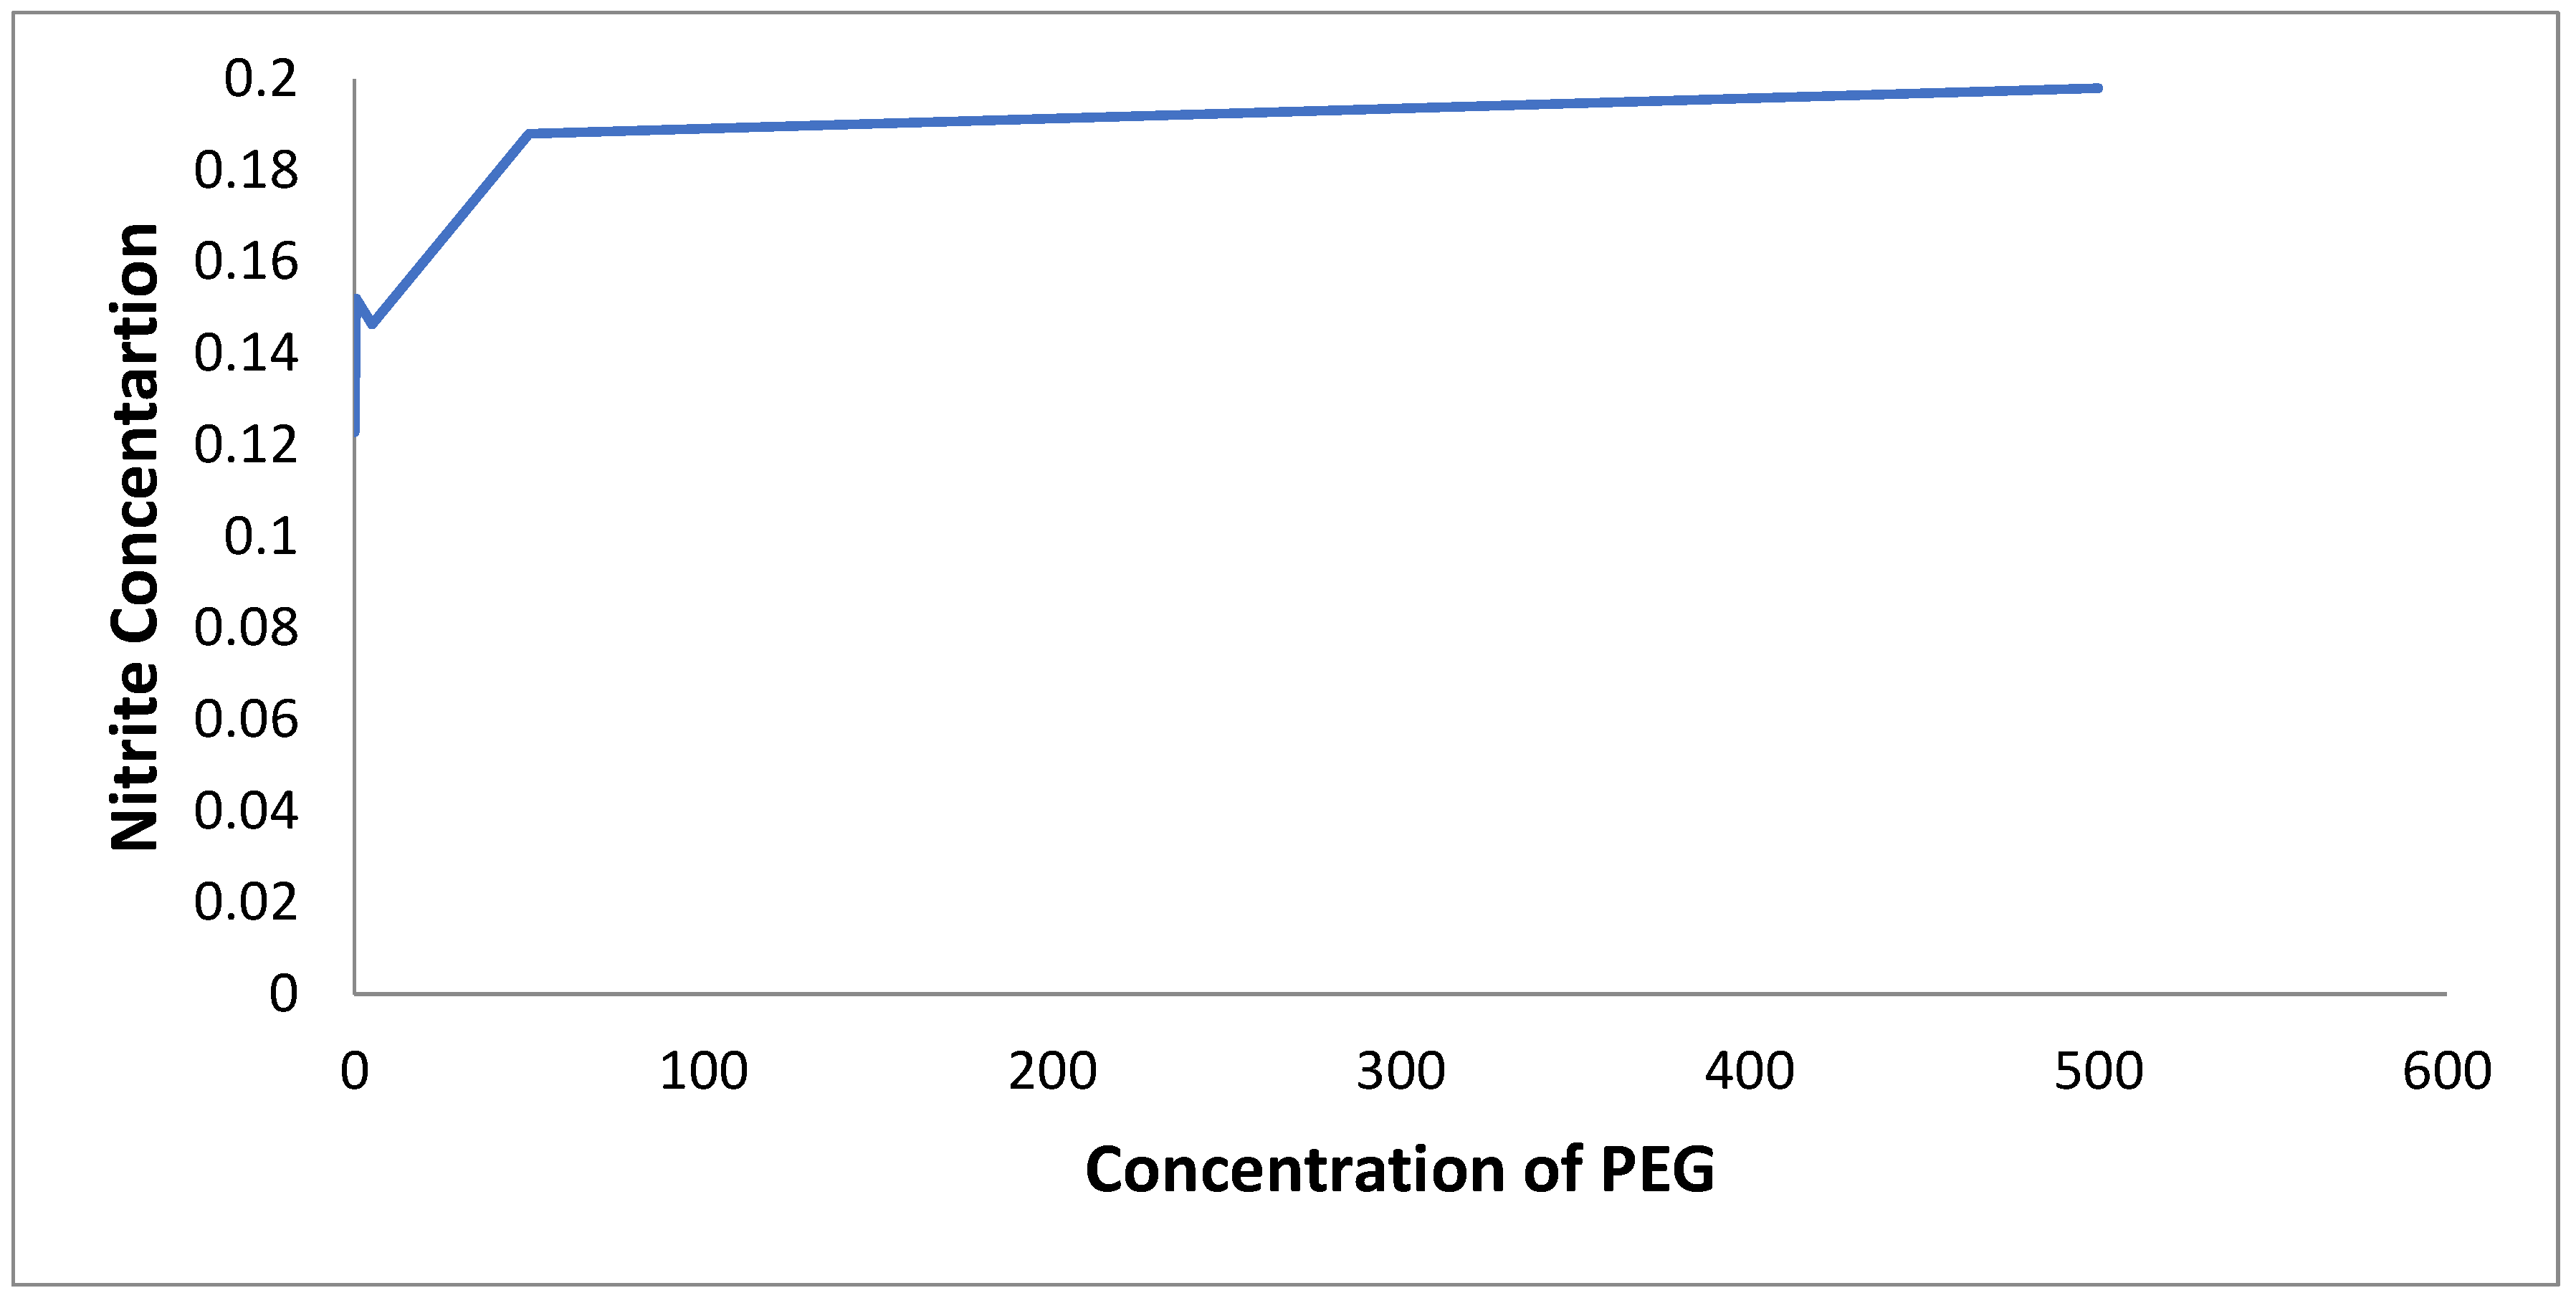
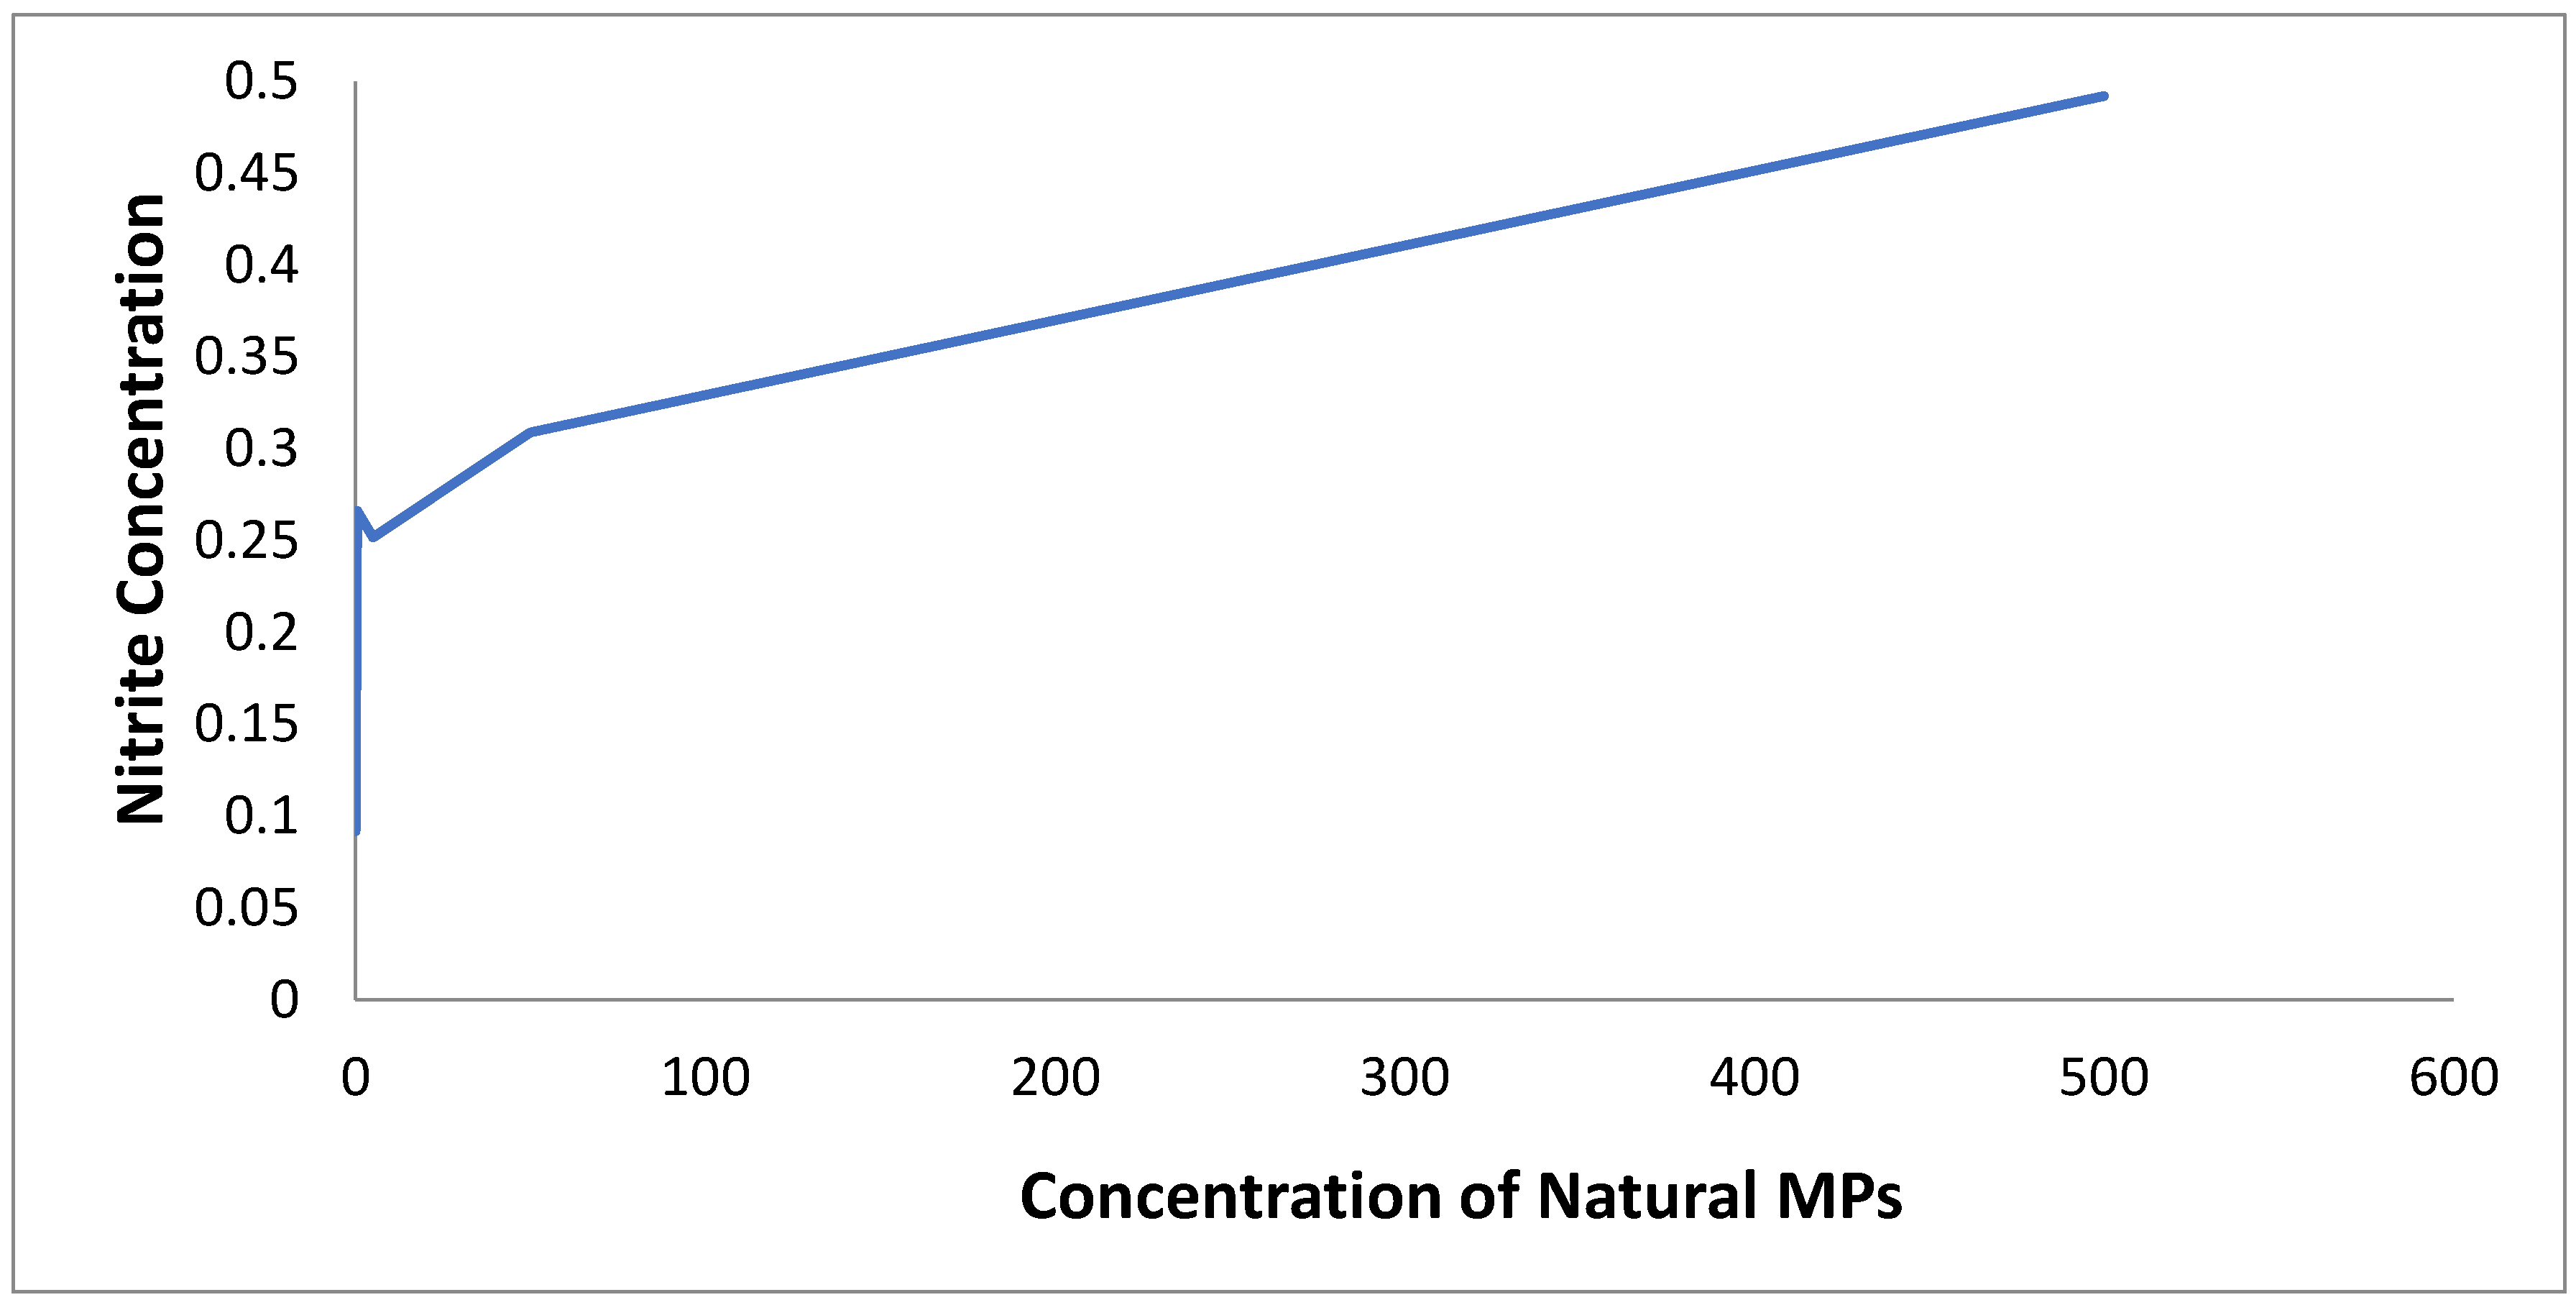
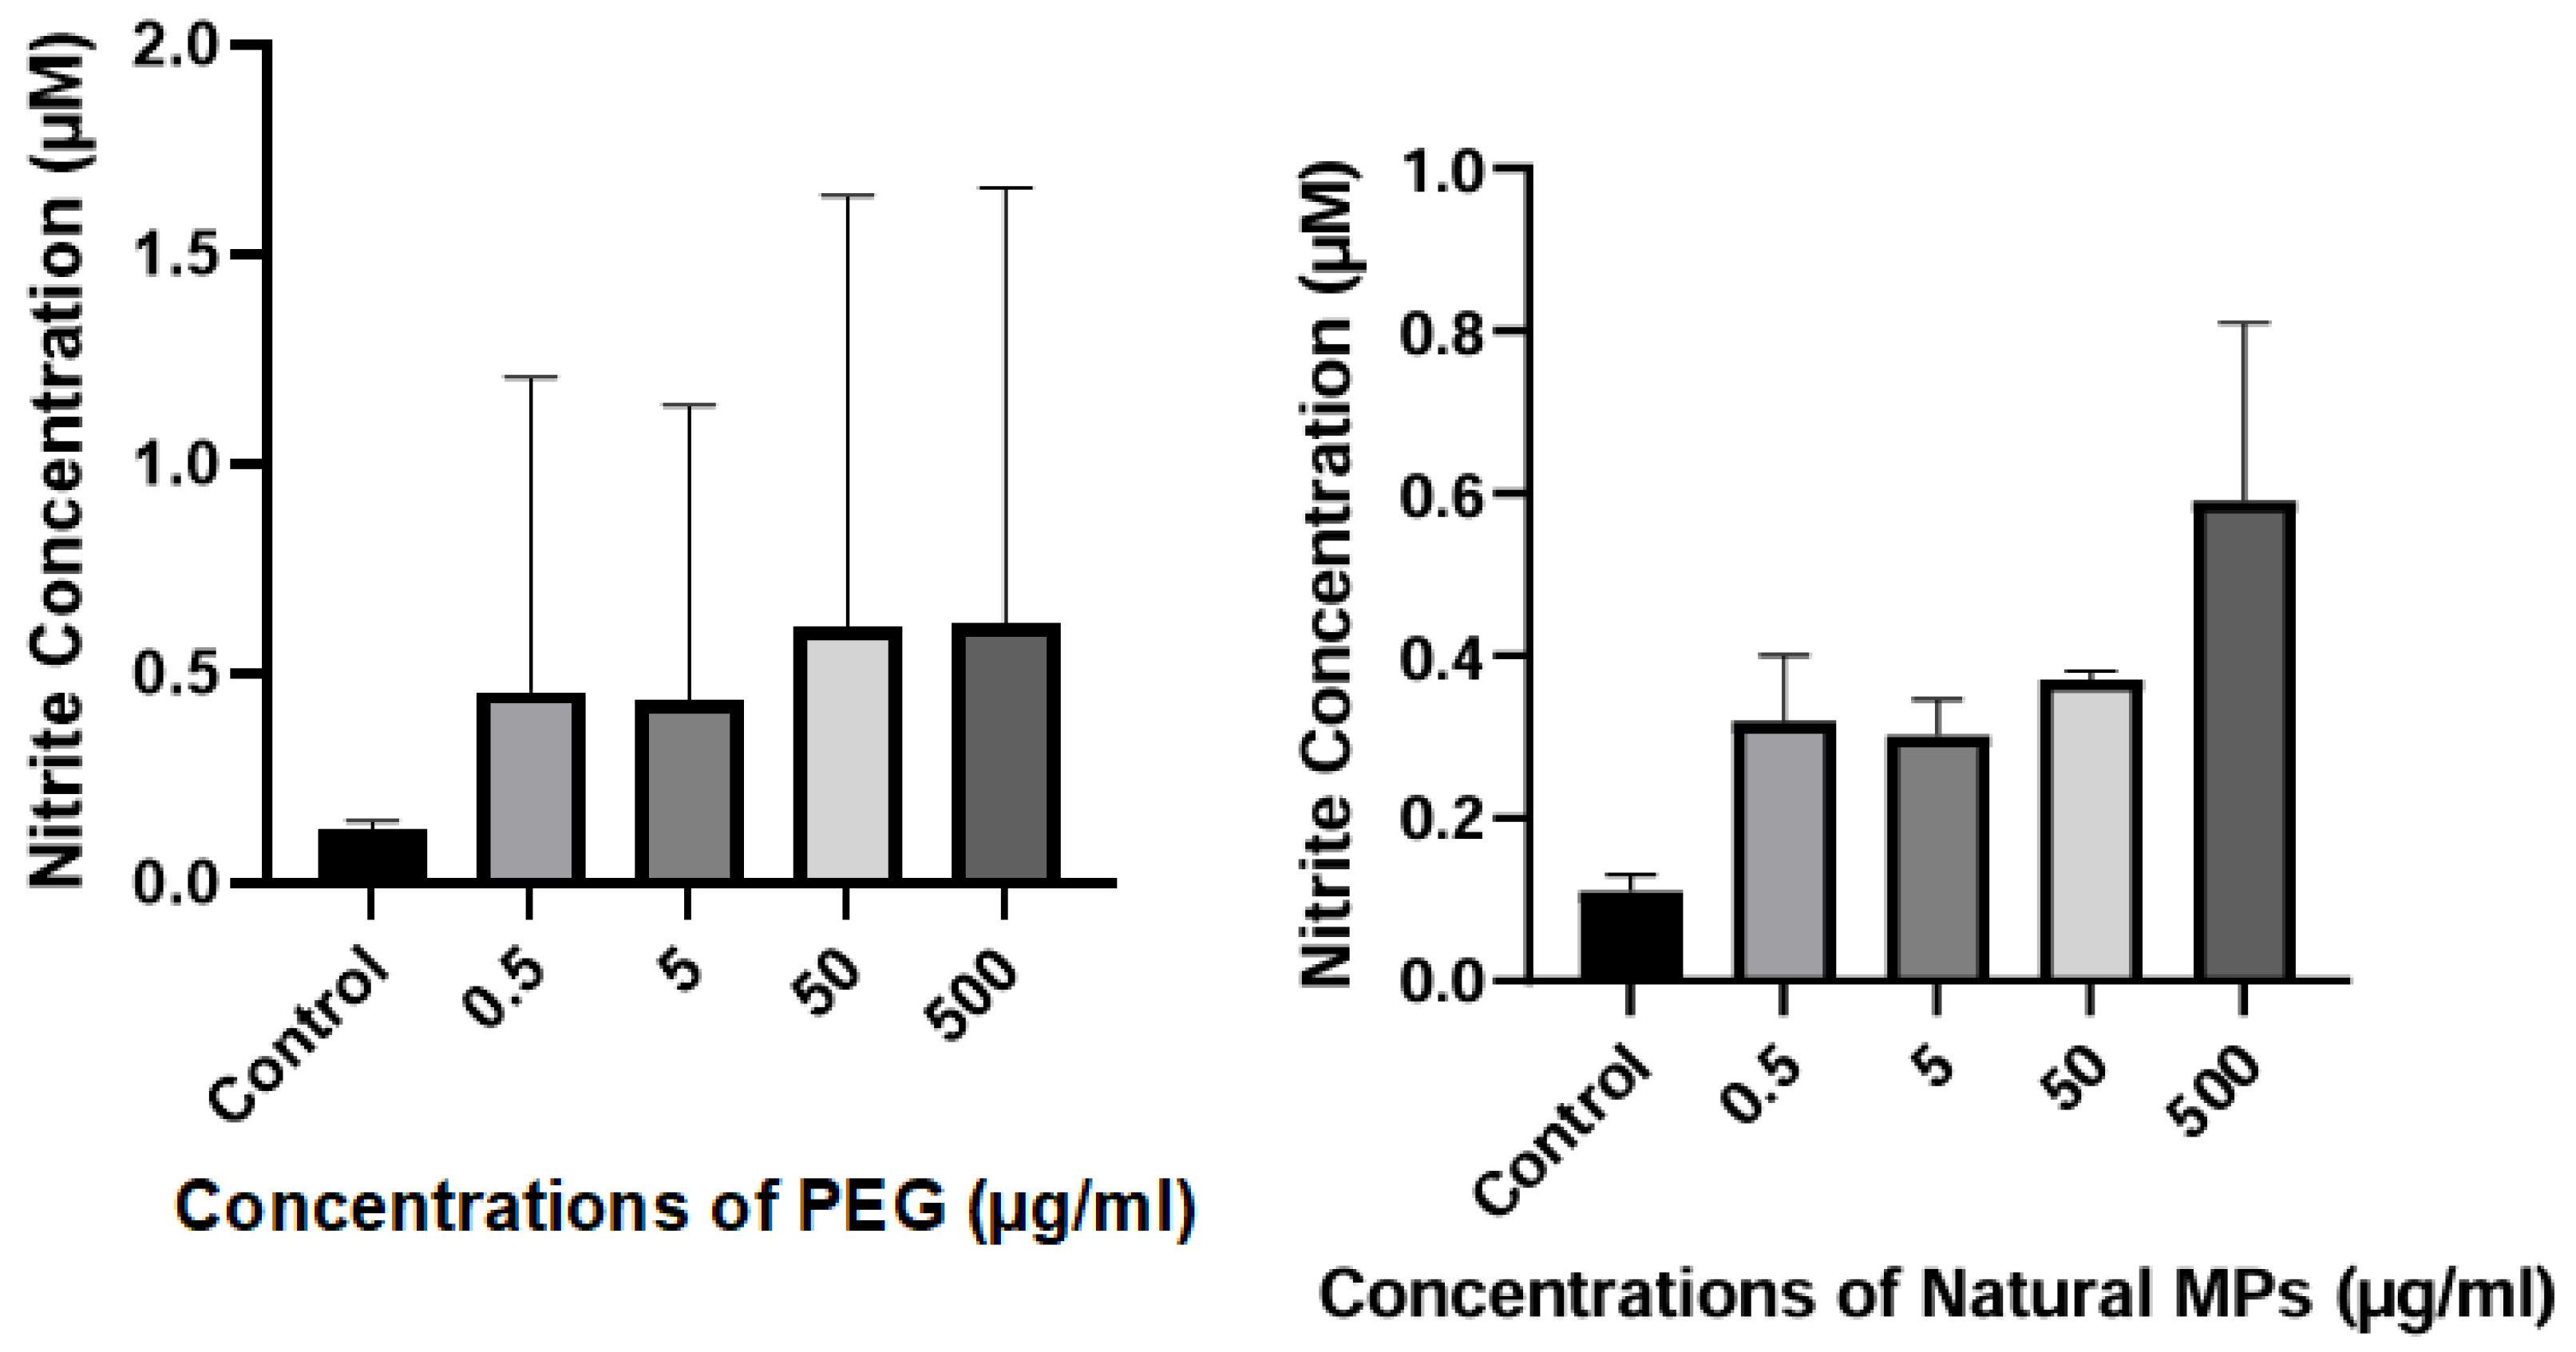
There were no statistically significant differences between PEG and natural MPs exposed treatment groups and control groups (p > 0.05; Tukey’s Post Hoc Test) (
Figure 7). The mean values of Nitrite level in PBMCs after treatment with both PEG and Natural MPs were depicted in
Table 3.
3.6. Comparison of ROS Production in PBMCs Treated with PEG
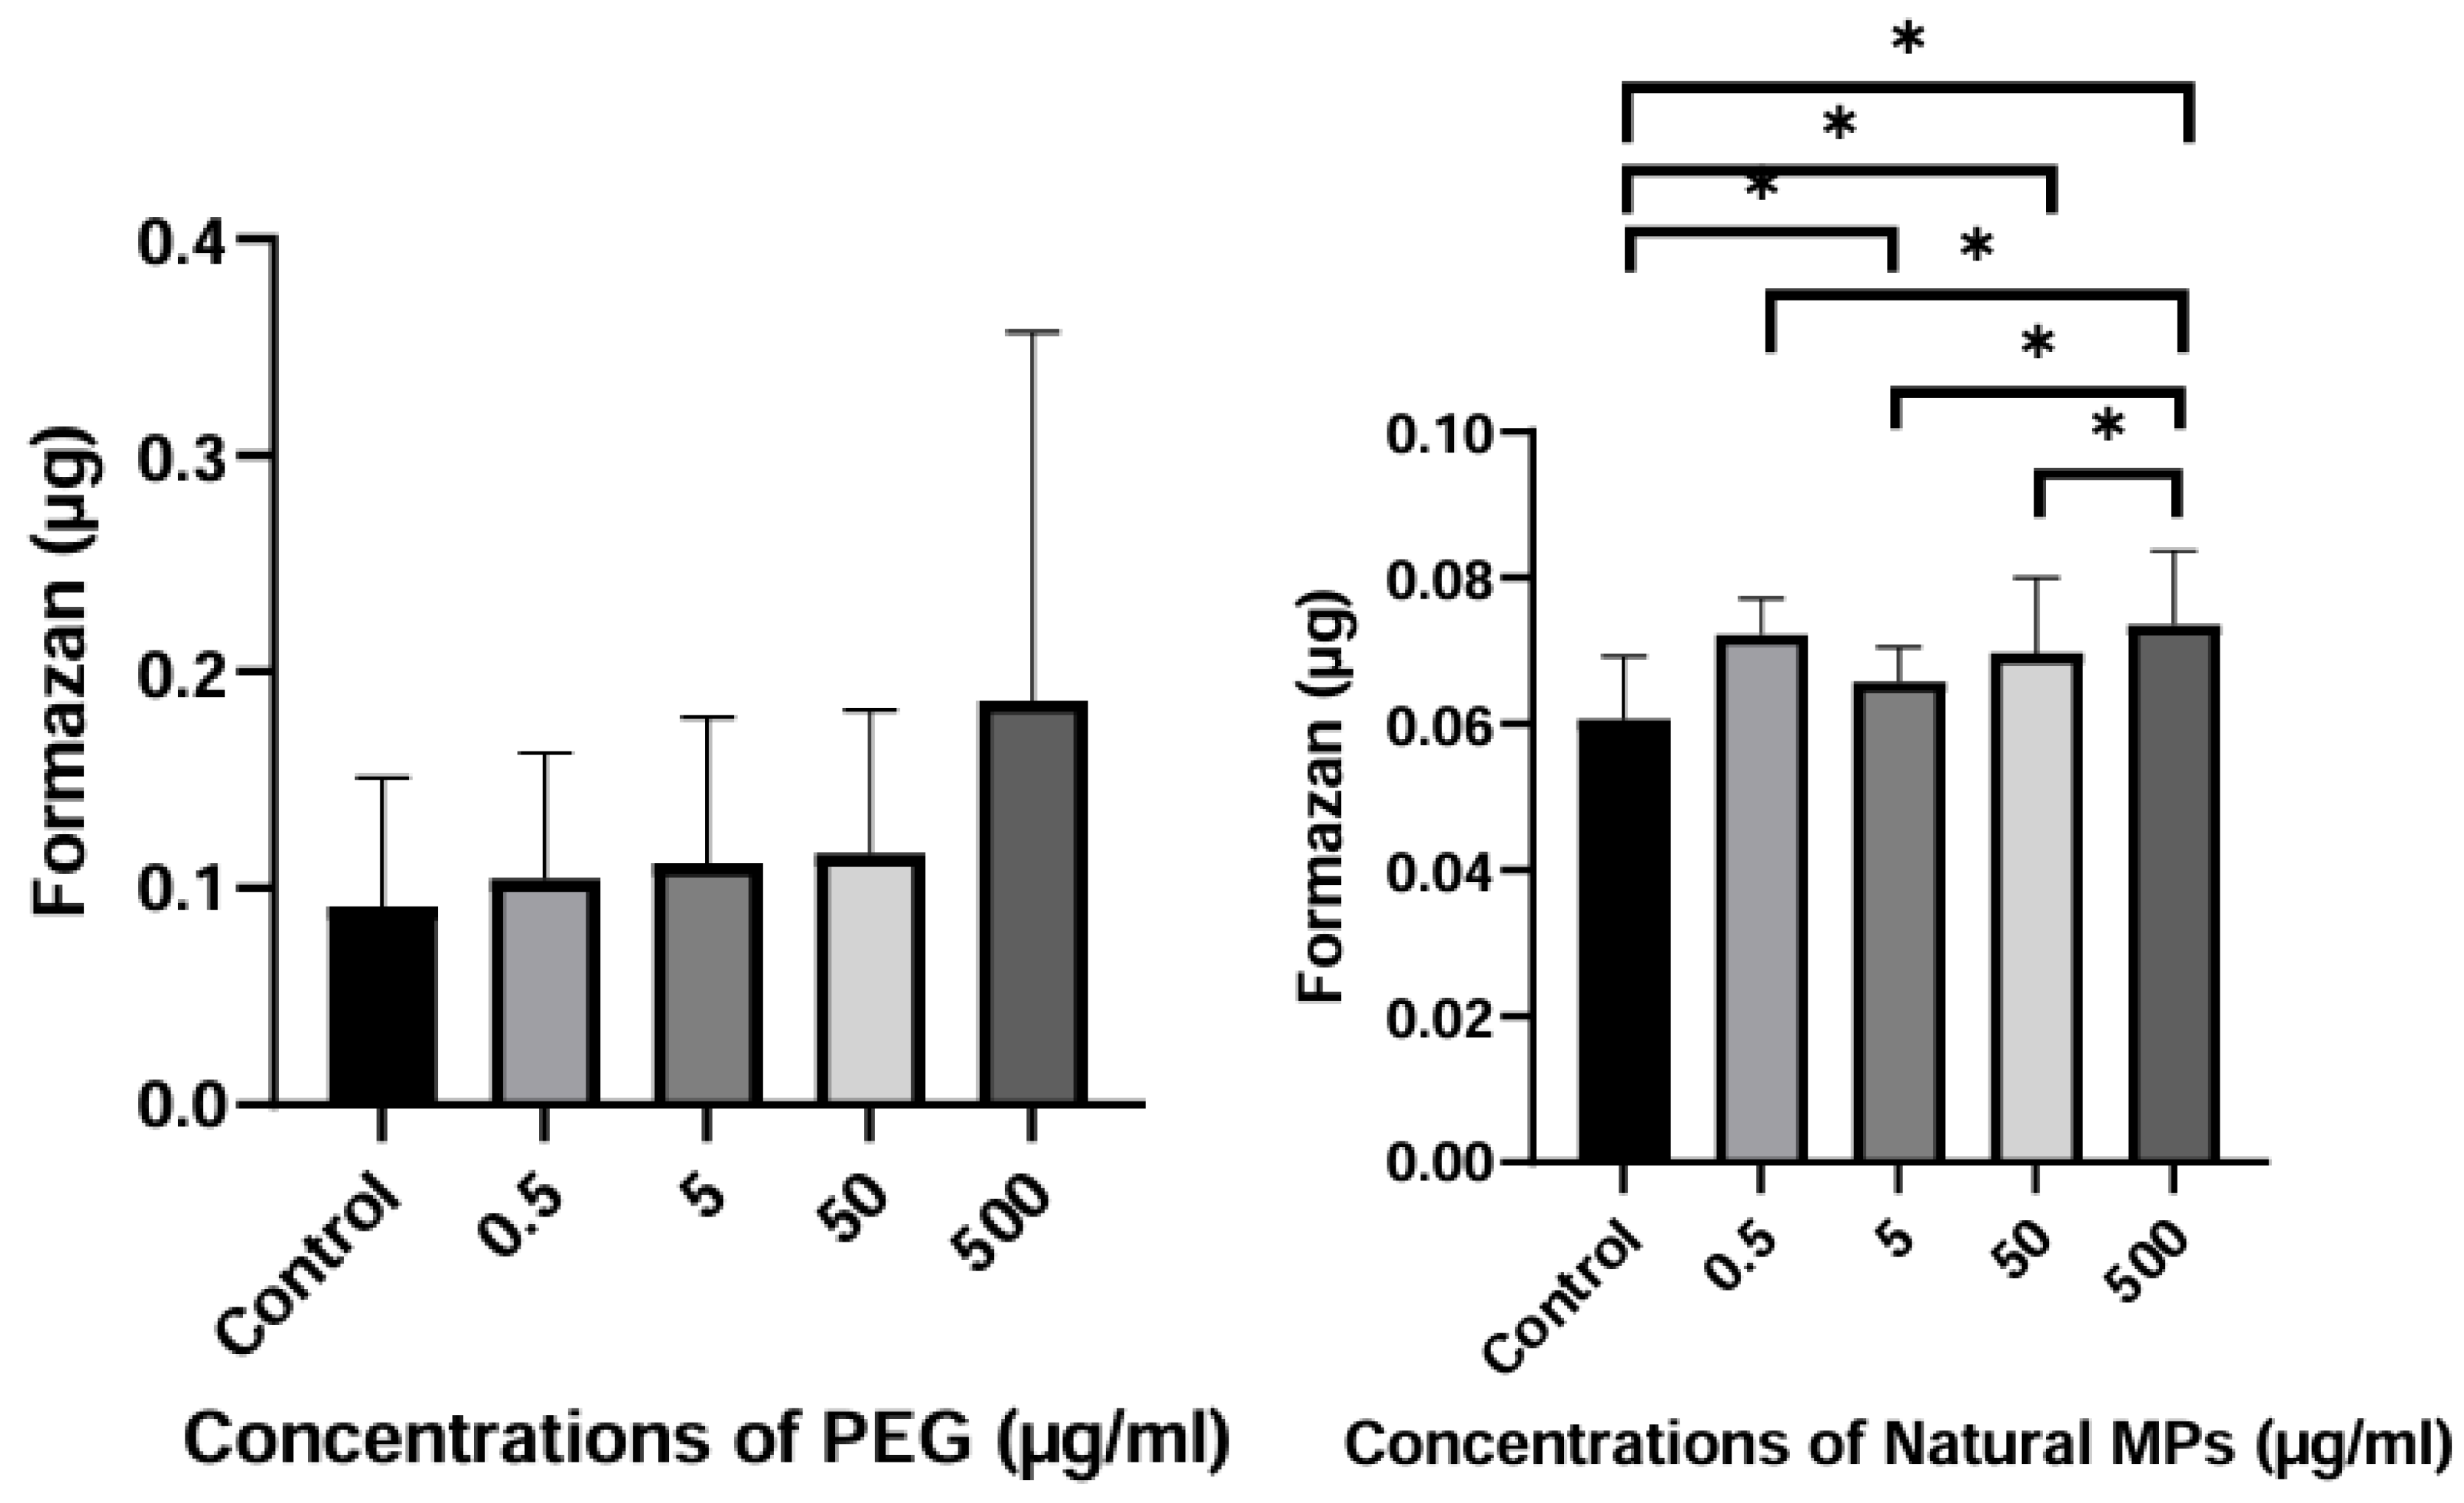
There were no statistically significant differences between control groups and treatment groups (p > 0.05; Games Howell Post Hoc test). However, slight elevation of ROS was observed at 50 µg/ml and 500 µg/ml (50 µg/ml; 3.31 ± 0.70, 500 µg/ml, 3.49 ± 1.98) (
Figure 8-a). Formazan produced in PBMCs treated with 5 µg/ml, 50 µg/ml, and 500 µg/ml Natural MPs were significantly higher when compared to the control group. (5 µg/ml, 5.32 ± 0.75, p < 0.001; 50 µg/ml, 6.51 ± 0.22; 500 µg/ml, 10.42 ± 3.85, p < 0.001; Tukey’s Post Hoc test). Formazan produced in PBMCs treated with 500 µg/ml was significantly higher compared to that of the 50 µg/ml group (
Figure 8-b). The comparative levels of ROS production in PBMCs after exposure to PEG and Natural MPs are given in
Table 4.
3.7. Analysis of IC50 Values of Phagocytic Capacity, Nitrite Concentration in PBMCs Treated with PEG and Natural MPs
Dose–response analysis revealed an IC₅₀ of 15.4246 µg/mL for PEG and an LC₅₀ of 5.092 µg/mL for natural microplastics in the phagocytosis assay, indicating the concentration required to reduce phagocytic activity by 50% (
Figure 9 and
Figure 10).
In the NBT assay, PEG exhibited an IC₅₀ of 30.9996 µg/mL, whereas natural microplastics showed a higher IC₅₀ value of 313.4864 µg/mL, indicating a lower inhibitory effect on oxidative burst activity at comparable concentrations (
Figure 11 and
Figure 12).
Figure 11.
Phagocytic Inhibition Curve of Natural MPs.
Figure 11.
Phagocytic Inhibition Curve of Natural MPs.
Figure 12.
Dose–response curve showing the inhibitory effect of PEG on superoxide production in PBMCs.
Figure 12.
Dose–response curve showing the inhibitory effect of PEG on superoxide production in PBMCs.
Figure 13.
Dose–response curve showing the inhibitory effect of Natural MPs on superoxide production in PBMCs.
Figure 13.
Dose–response curve showing the inhibitory effect of Natural MPs on superoxide production in PBMCs.
4. Discussion
Mean Phagocytic Index values of PBMCs treated with 5 µg/ml, 50 µg/ml, and 500 µg/ml Natural MPs were significantly higher when compared to the control group. This may occur due to many reasons. MPs may act as stimulants for the uptake of neutral red dye by phagocytic cells. Neutral red uptake depends on the cell’s capacity to maintain pH gradients through ATP production. The observed increase in Phagocytic Index may show enhanced lysosomal activity and phagocytic cells activation. Natural MPs used in this study may have been undergone physical and chemical weathering processes (oxidation, UV degradation). These processes cause surface modifications of MPs. In previous studies, it has been shown that aged MPs enhance cellular uptake of MP particles by professional phagocytes (Visalli et al., 2023b). These properties enhance the engulfment of MPs by innate immune cells especially by monocytes. The high-surface area ratio, irregular shaped particles (pellets, fragments) may facilitate phagocytosis.
Results showed that cell viability of PBMCs decreased with the increasing PEG concentration. A significant difference was observed in the mean cell viability values of PBMCs treated with 0.5 µg/ml, 5 µg/ml, 50 µg/ml, and 500 µg/ml PEG, when compared to the control group. Under invitro conditions, it has been found that PEG causes cellular stress at certain concentrations (Pham Le Khanh et al., 2022). The dose - dependent decrease in cell viability (%) observed in Natural MPs including PP, PE, PET exposure. At higher concentrations, MPs are likely inhibiting cell proliferation. MP concentration increases with decreased cell proliferation and increased cytostasis. A statistically significant reduction in cell viability was observed at 0.5 µg/ml, 5 µg/ml, 50 µg/ml and 500 µg/ml natural MPs exposed groups, when compared to the control group. In this study, since these MPs were exposed to the environment, they may contain pollutants, plastic additives and pathogens on their surface. Therefore, the discharge of plastic additives is the main component of cell cytotoxicity during MPs exposure. MPs used in this study may act as carriers of organic pollutants present in the marine environment. Recently, MPs were detected in human blood samples ranging from 1.8 - 4.7 µg/ml (V. L. Leonard et al., 2024). Most abundant MP particles that were detected in human blood samples were PET, PE, ethylene propylene diene and PS (D.-W. Lee et al., 2024). Compared to these environmental exposure levels, the concentrations used in this study (0.5 µg/ml to 500 µg/ml) include both environmentally relevant doses (e.g., 0.5 and 5 µg/ml) causing reduced cell viability compared to control. It indicates that even exposure levels comparable to those found in human samples (0.5–5 µg/ml) have measurable cytotoxic effects on blood cells. In this present study, though Natural MPs had minimal impact on cell viability in PBMCs, at the highest concentration of 500 µg/mL, it induced reduced cell viability.
Formazan produced in PBMCs treated with 5 µg/ml, 50 µg/ml, and 500 µg/ml Natural MPs were significantly higher when compared to the control group. Therefore, the increase in formazan production could be an indirect indicator of increased ROS production. This could be an oxidative/ pro-inflammatory response to MPs exposure. MPs are associated with increased levels of ROS and causes change in the balance of mitochondrial kinetic homeostasis (Yin et al., 2023). In previous studies, it has been shown that degradation of plastic items is associated with extracellular ROS. Therefore, ROS production induced by MPs occur as a result of extracellular and intracellular processes (Jeong et al., 2016). When zebrafish (Danio rerio) larvae exposed to MPs, increased ROS level was observed with the increased immunotoxicity (Rajendran & Chandrasekaran, 2023).
The results showed that no statistically significant differences in nitrite levels across all tested concentrations of PEG when compared to the untreated control group. Similarly, there is no significant differences in nitrite level across all tested concentrations of Natural MPs when compared to the untreated control group.
These findings suggest that PEG and Natural MPs does not cause change in NO level production in PBMCs. It indicates that both PEG and natural MPs don’t significantly influence NO mediated inflammation pathway.
Since this study has mainly focused on short time incubation (24 hour) of PBMCs with MPs, long-term incubation of PBMCs with MPs should be done in future. This study is mainly focused on short-term cytotoxicity. There is no enough time to allow for the release of plastic additives, chemicals from the plastics. Depend on the type of MPs, cytotoxicity may also differ. Future research studies should be aimed to determine the genotoxic effect such as DNA damage, micronucleus formation of MPs using different cell lines and animal models.
5. Conclusion
The results showed that both natural MPs and PEG significantly reduced cell viability in a dose-dependent manner. At highest concentrations, Natural MPs induced phagocytic activity of PBMCs. This may be due to the presence of eco-corona on the surface of MPs. These MPs may act as stimulants to increase phagocytic activity. Regarding oxidative stress, Natural MPs exposure with PBMCs showed a significant increase in ROS production, whereas PEG exposure didn’t induce notable ROS production. It indicates that environmental weathering and pollutants can induce oxidative stress on PBMCs. NO production levels remained unchanged in PBMCs after exposure to both PEG and Natural MPs, showing that under the tested conditions, neither treatment significantly influenced the NO-mediated inflammatory pathways.
Funding
This work was supported by the Department of Zoology and Environment Sciences, Faculty of Science, University of Colombo and Faculty of Medicine, General Sir John Kotelawala Defense University, Ratmalana, Sri Lanka.
Acknowledgments
The authors acknowledge all the voluntary participants who donated blood for the study. This work was financially supported by the Department of Zoology and Environment Sciences, Faculty of Science, University of Colombo, Sri Lanka and Dr. Dharshan de Silva from the Faculty of Medicine, General Sir John Kotelawala Defense University, Ratmalana, Sri Lanka.
Disclosure
The author reports no conflicts of interest in this work.
References
- Abihssira-García, I. S., Park, Y., Kiron, V., & Olsvik, P. A. (2020). Fluorescent Microplastic Uptake by Immune Cells of Atlantic Salmon (Salmo salar L.). Frontiers in Environmental Science, 8, 560206. [CrossRef]
- Acarer Arat, S. (2024). An overview of microplastic in marine waters: Sources, abundance, characteristics and negative effects on various marine organisms. Desalination and Water Treatment, 317, 100138. [CrossRef]
- Agrawal, M., Vianello, A., Picker, M., Simon-Sánchez, L., Chen, R., Estevinho, M. M., Weinstein, K., Lykkemark, J., Jess, T., Peter, I., Colombel, J.-F., Allin, K. H., & Vollertsen, J. (2024). Micro- and nano-plastics, intestinal inflammation, and inflammatory bowel disease: A review of the literature. Science of The Total Environment, 953, 176228. [CrossRef]
- Andonian, M. R., Barrett, A. S., & Vinogradov, S. N. (1975). Physical properties and subunits of Haemopis grandis erythrocruorin. Biochimica Et Biophysica Acta, 412(2), Article 2. [CrossRef]
- Ashrafy, A., Liza, A. A., Islam, M. N., Billah, M. M., Arafat, S. T., Rahman, M. M., & Rahman, S. M. (2023). Microplastics Pollution: A Brief Review of Its Source and Abundance in Different Aquatic Ecosystems. Journal of Hazardous Materials Advances, 9, 100215. [CrossRef]
- Baroni, A., Buommino, E., De Gregorio, V., Ruocco, E., Ruocco, V., & Wolf, R. (2012). Structure and function of the epidermis related to barrier properties. Clinics in Dermatology, 30(3), Article 3. [CrossRef]
- Bouwstra, J., Pilgram, G., Gooris, G., Koerten, H., & Ponec, M. (2001). New Aspects of the Skin Barrier Organization. Skin Pharmacology and Physiology, 14(Suppl. 1), Article Suppl. 1. [CrossRef]
- Cox, K. D., Covernton, G. A., Davies, H. L., Dower, J. F., Juanes, F., & Dudas, S. E. (2019). Human Consumption of Microplastics. Environmental Science & Technology, 53(12), Article 12. [CrossRef]
- Domenech, J., Hernández, A., Rubio, L., Marcos, R., & Cortés, C. (2020). Interactions of polystyrene nanoplastics with in vitro models of the human intestinal barrier. Archives of Toxicology, 94(9), Article 9. [CrossRef]
- Dzierżyński, E., Gawlik, P. J., Puźniak, D., Flieger, W., Jóźwik, K., Teresiński, G., Forma, A., Wdowiak, P., Baj, J., & Flieger, J. (2024). Microplastics in the Human Body: Exposure, Detection, and Risk of Carcinogenesis: A State-of-the-Art Review. Cancers, 16(21), Article 21. [CrossRef]
- Emenike, E. C., Okorie, C. J., Ojeyemi, T., Egbemhenghe, A., Iwuozor, K. O., Saliu, O. D., Okoro, H. K., & Adeniyi, A. G. (2023). From oceans to dinner plates: The impact of microplastics on human health. Heliyon, 9(10), Article 10. [CrossRef]
- Fadare, O. O., & Okoffo, E. D. (2020). Covid-19 face masks: A potential source of microplastic fibers in the environment. Science of The Total Environment, 737, 140279. [CrossRef]
- Grattagliano, A., Grattagliano, Z., Manfra, L., Libralato, G., Biandolino, F., & Prato, E. (2025). An Overview on Microplastics Hazards to the Marine Ecosystem and Humans’ Health. Water, 17(7), Article 7. [CrossRef]
- Han, S., Bang, J., Choi, D., Hwang, J., Kim, T., Oh, Y., Hwang, Y., Choi, J., & Hong, J. (2020). Surface Pattern Analysis of Microplastics and Their Impact on Human-Derived Cells. ACS Applied Polymer Materials, 2(11), Article 11. [CrossRef]
- Haque, Md. K., Uddin, M., Kormoker, T., Ahmed, T., Zaman, Md. R. U., Rahman, M. S., Rahman, Md. A., Hossain, Md. Y., Rana, Md. M., & Tsang, Y. F. (2023). Occurrences, sources, fate and impacts of plastic on aquatic organisms and human health in global perspectives: What Bangladesh can do in future? Environmental Geochemistry and Health, 45(8), Article 8. [CrossRef]
- He, Y.-J., Qin, Y., Zhang, T.-L., Zhu, Y.-Y., Wang, Z.-J., Zhou, Z.-S., Xie, T.-Z., & Luo, X.-D. (2021). Migration of (non-) intentionally added substances and microplastics from microwavable plastic food containers. Journal of Hazardous Materials, 417, 126074. [CrossRef]
- Hendrickson, W. A., & Ward, K. B. (1975). Atomic models for the polypeptide backbones of myohemerythrin and hemerythrin. Biochemical and Biophysical Research Communications, 66(4), Article 4. [CrossRef]
- Hirt, N., & Body-Malapel, M. (2020). Immunotoxicity and intestinal effects of nano- and microplastics: A review of the literature. Particle and Fibre Toxicology, 17(1), Article 1. [CrossRef]
- Jeong, C.-B., Won, E.-J., Kang, H.-M., Lee, M.-C., Hwang, D.-S., Hwang, U.-K., Zhou, B., Souissi, S., Lee, S.-J., & Lee, J.-S. (2016). Microplastic Size-Dependent Toxicity, Oxidative Stress Induction, and p-JNK and p-p38 Activation in the Monogonont Rotifer ( Brachionus koreanus ). Environmental Science & Technology, 50(16), Article 16. [CrossRef]
- Kadac-Czapska, K., Ośko, J., Knez, E., & Grembecka, M. (2024). Microplastics and Oxidative Stress—Current Problems and Prospects. Antioxidants, 13(5), Article 5. [CrossRef]
- Khoaele, K. K., Gbadeyan, O. J., Chunilall, V., & Sithole, B. (2023). The Devastation of Waste Plastic on the Environment and Remediation Processes: A Critical Review. Sustainability, 15(6), Article 6. [CrossRef]
- Kumar, R., Manna, C., Padha, S., Verma, A., Sharma, P., Dhar, A., Ghosh, A., & Bhattacharya, P. (2022). Micro(nano)plastics pollution and human health: How plastics can induce carcinogenesis to humans? Chemosphere, 298, 134267. [CrossRef]
- Kumari, S., Mg, S., & Mayor, S. (2010). Endocytosis unplugged: Multiple ways to enter the cell. Cell Research, 20(3), Article 3. [CrossRef]
- Lee, D.-W., Jung, J., Park, S., Lee, Y., Kim, J., Han, C., Kim, H.-C., Lee, J. H., & Hong, Y.-C. (2024). Microplastic particles in human blood and their association with coagulation markers. Scientific Reports, 14(1), Article 1. [CrossRef]
- Lee, Y., Cho, J., Sohn, J., & Kim, C. (2023). Health Effects of Microplastic Exposures: Current Issues and Perspectives in South Korea. Yonsei Medical Journal, 64(5), Article 5. [CrossRef]
- Li, Y., Tao, L., Wang, Q., Wang, F., Li, G., & Song, M. (2023). Potential Health Impact of Microplastics: A Review of Environmental Distribution, Human Exposure, and Toxic Effects. Environment & Health, 1(4), Article 4. [CrossRef]
- Liu, G., Li, Y., Yang, L., Wei, Y., Wang, X., Wang, Z., & Tao, L. (2017). Cytotoxicity study of polyethylene glycol derivatives. RSC Advances, 7(30), Article 30. [CrossRef]
- Lu, K., Zhan, D., Fang, Y., Li, L., Chen, G., Chen, S., & Wang, L. (2022). Microplastics, potential threat to patients with lung diseases. Frontiers in Toxicology, 4, 958414. [CrossRef]
- Mahmud, F., Sarker, D. B., Jocelyn, J. A., & Sang, Q.-X. A. (2024). Molecular and Cellular Effects of Microplastics and Nanoplastics: Focus on Inflammation and Senescence. Cells, 13(21), Article 21. [CrossRef]
- Marcovici, I., Vlad, D., Buzatu, R., Popovici, R. A., Cosoroaba, R. M., Chioibas, R., Geamantan, A., & Dehelean, C. (2024). Rutin Linoleate Triggers Oxidative Stress-Mediated Cytoplasmic Vacuolation in Non-Small Cell Lung Cancer Cells. Life, 14(2), Article 2. [CrossRef]
- Moroi, K., & Sato, T. (1975). Comparison between procaine and isocarboxazid metabolism in vitro by a liver microsomal amidase-esterase. Biochemical Pharmacology, 24(16), Article 16. [CrossRef]
- Osman, A. I., Hosny, M., Eltaweil, A. S., Omar, S., Elgarahy, A. M., Farghali, M., Yap, P.-S., Wu, Y.-S., Nagandran, S., Batumalaie, K., Gopinath, S. C. B., John, O. D., Sekar, M., Saikia, T., Karunanithi, P., Hatta, M. H. M., & Akinyede, K. A. (2023). Microplastic sources, formation, toxicity and remediation: A review. Environmental Chemistry Letters, 21(4), Article 4. [CrossRef]
- Parolini, M., Stucchi, M., Ambrosini, R., & Romano, A. (2023). A global perspective on microplastic bioaccumulation in marine organisms. Ecological Indicators, 149, 110179. [CrossRef]
- Pham Le Khanh, H., Nemes, D., Rusznyák, Á., Ujhelyi, Z., Fehér, P., Fenyvesi, F., Váradi, J., Vecsernyés, M., & Bácskay, I. (2022). Comparative Investigation of Cellular Effects of Polyethylene Glycol (PEG) Derivatives. Polymers, 14(2), Article 2. [CrossRef]
- Pinsino, A., Russo, R., Bonaventura, R., Brunelli, A., Marcomini, A., & Matranga, V. (2015). Titanium dioxide nanoparticles stimulate sea urchin immune cell phagocytic activity involving TLR/p38 MAPK-mediated signalling pathway. Scientific Reports, 5(1), Article 1. [CrossRef]
- Ragusa, A., Lelli, V., Fanelli, G., Svelato, A., D’Avino, S., Gevi, F., Santacroce, C., Catalano, P., Rongioletti, M. C. A., De Luca, C., Gulotta, A., Rinalducci, S., & Timperio, A. M. (2022). Plastic and Placenta: Identification of Polyethylene Glycol (PEG) Compounds in the Human Placenta by HPLC-MS/MS System. International Journal of Molecular Sciences, 23(21), Article 21. [CrossRef]
- Ragusa, A., Notarstefano, V., Svelato, A., Belloni, A., Gioacchini, G., Blondeel, C., Zucchelli, E., De Luca, C., D’Avino, S., Gulotta, A., Carnevali, O., & Giorgini, E. (2022). Raman Microspectroscopy Detection and Characterisation of Microplastics in Human Breastmilk. Polymers, 14(13), Article 13. [CrossRef]
- Rajendran, D., & Chandrasekaran, N. (2023). Journey of micronanoplastics with blood components. RSC Advances, 13(45), Article 45. [CrossRef]
- Ramsperger, A. F. R. M., Narayana, V. K. B., Gross, W., Mohanraj, J., Thelakkat, M., Greiner, A., Schmalz, H., Kress, H., & Laforsch, C. (2020). Environmental exposure enhances the internalization of microplastic particles into cells. Science Advances, 6(50), Article 50. [CrossRef]
- Rivolta, I., Panariti, & Miserocchi. (2012). The effect of nanoparticle uptake on cellular behavior: Disrupting or enabling functions? Nanotechnology, Science and Applications, 87. [CrossRef]
- Roslan, N. S., Lee, Y. Y., Ibrahim, Y. S., Tuan Anuar, S., Yusof, K. M. K. K., Lai, L. A., & Brentnall, T. (2024). Detection of microplastics in human tissues and organs: A scoping review. Journal of Global Health, 14, 04179. [CrossRef]
- Stein, J. M. (1975). The effect of adrenaline and of alpha- and beta-adrenergic blocking agents on ATP concentration and on incorporation of 32Pi into ATP in rat fat cells. Biochemical Pharmacology, 24(18), Article 18. [CrossRef]
- Thushari, G. G. N., & Senevirathna, J. D. M. (2020). Plastic pollution in the marine environment. Heliyon, 6(8), Article 8. [CrossRef]
- Tran, D. Q., Stelflug, N., Hall, A., Nallan Chakravarthula, T., & Alves, N. J. (2022). Microplastic Effects on Thrombin–Fibrinogen Clotting Dynamics Measured via Turbidity and Thromboelastography. Biomolecules, 12(12), Article 12. [CrossRef]
- Unuofin, J. O., & Igwaran, A. (2023). Microplastics in seafood: Implications for food security, safety, and human health. Journal of Sea Research, 194, 102410. [CrossRef]
- V. L. Leonard, S., Liddle, C. R., Atherall, C. A., Chapman, E., Watkins, M., D. J. Calaminus, S., & Rotchell, J. M. (2024). Microplastics in human blood: Polymer types, concentrations and characterisation using μFTIR. Environment International, 188, 108751. [CrossRef]
- Visalli, G., Laganà, A., Facciolà, A., Iaconis, A., Curcio, J., Pollino, S., Celesti, C., Scalese, S., Libertino, S., Iannazzo, D., & Di Pietro, A. (2023). Enhancement of biological effects of oxidised nano- and microplastics in human professional phagocytes. Environmental Toxicology and Pharmacology, 99, 104086. [CrossRef]
- Weis, J. S., & Alava, J. J. (2023). (Micro)Plastics Are Toxic Pollutants. Toxics, 11(11), Article 11. [CrossRef]
- Yahaya, T. O., Ibrahim, A. B., Kalgo, A. S., Adewale, M. K., Emmanuela, C. C., Abdulkadir, B., Fari, A. Z., Attahiru, A. K., Saadatu, A., & Wanda, J. D. (2024). Microplastics exposure altered hematological and lipid profiles as well as liver and kidney function parameters in albino rats (Rattus norvegicus). Environmental Analysis Health and Toxicology, 39(2), Article 2. [CrossRef]
- Yee, M. S.-L., Hii, L.-W., Looi, C. K., Lim, W.-M., Wong, S.-F., Kok, Y.-Y., Tan, B.-K., Wong, C.-Y., & Leong, C.-O. (2021). Impact of Microplastics and Nanoplastics on Human Health. Nanomaterials, 11(2), Article 2. [CrossRef]
- Yin, K., Wang, D., Zhang, Y., Lu, H., Hou, L., Guo, T., Zhao, H., & Xing, M. (2023). Polystyrene microplastics promote liver inflammation by inducing the formation of macrophages extracellular traps. Journal of Hazardous Materials, 452, 131236. [CrossRef]
- Ziani, K., Ioniță-Mîndrican, C.-B., Mititelu, M., Neacșu, S. M., Negrei, C., Moroșan, E., Drăgănescu, D., & Preda, O.-T. (2023). Microplastics: A Real Global Threat for Environment and Food Safety: A State of the Art Review. Nutrients, 15(3), Article 3. [CrossRef]
|
Disclaimer/Publisher’s Note: The statements, opinions and data contained in all publications are solely those of the individual author(s) and contributor(s) and not of MDPI and/or the editor(s). MDPI and/or the editor(s) disclaim responsibility for any injury to people or property resulting from any ideas, methods, instructions or products referred to in the content. |