Submitted:
26 December 2025
Posted:
29 December 2025
You are already at the latest version
Abstract
This work presents a study on the erosive wear behavior of laminated composites, manufactured using the vacuum assisted resin infusion (VARI) method with an epoxy matrix reinforced with glass fibers and modified with SiO2 nanoparticles. Three materials were fabricated with SiO2 nanoparticle concentrations of 0, 1.5, and 3 wt% to evaluate the effect of nanoparticle addition and dispersion on mechanical and microstructural properties, as well as erosion resistance. The results showed that the FG-1.5-SiO2 composite, containing 1.5 wt% SiO2 nanoparticles, exhibited the best nanoparticle dispersion, as evidenced by FTIR, GIXRD, and SEM analyses. This material displayed the lowest surface roughness (Ra = 0.215 μm), the highest Vickers hardness (35.58), and the highest modulus of elasticity (19.66 GPa), indicating an effective load transfer and adequate interfacial interaction. In erosion tests, the FG-1.5-SiO2 material demonstrated the lowest total mass loss (0.0261 mg) and the lowest erosion rate (2.3360E-5 mg/g), representing an approximately 38 % improvement in erosion resistance compared to the reference material without nanoparticles (FG-0-SiO2). Profilometry and SEM analyses confirmed that this composite FG-1.5-SiO2 exhibited less severe erosional damage, with shallower wear depth, characterized by less matrix removal and a stronger fiber-matrix interface. On the other hand, the composite with 3 wt% SiO2 (FG-3-SiO2) showed poor dispersion and agglomeration, resulting in increased roughness, lower mechanical properties, and erosion resistance similar to that of the material without nanoparticle reinforcement. This was attributed to the agglomerates acting as stress concentrators and structural defects that facilitate material detachment.
Keywords:
epoxy nanocomposites
; erosive wear
; SiO2 nanoparticles
; resin infusion
; nanoparticle dispersion
; erosion resistance
1. Introduction
Laminated composite materials have gained significant importance in sectors such as aerospace, aeronautics, automotive, energy, and marine in recent years due to their high strength-to-weight ratio, good thermal stability, corrosion resistance, and versatility in structural design [1,2,3,4,5,6,7]. However, when exposed to impact from solid particles, polymer matrix composites with fiber reinforcement experience surface material loss due to erosion. This phenomenon alters their morphology, generates microcracks, and negatively affects their mechanical properties, which can accelerate component failure and significantly shorten their service life [8,9]. Two intrinsic factors that limit their erosion resistance compared to metallic or ceramic materials are the brittleness of thermoset matrices and the limited strength of the fiber-matrix interface [10].
One alternative to overcome these limitations is the incorporation of nanoparticles (NPs) into the polymer matrix, a strategy that has proven effective in improving the mechanical and tribological performance of these materials. This is because NPs, due to their high surface-to-volume ratio, promote better interfacial interaction with the polymer matrix, improving stress transfer, the degree of crosslinking, and beneficial microstructural modifications [11,12,13,14,15]. Various NPs such as Al2O3, TiO2, SiC, and SiO2 have been studied as secondary reinforcements in epoxy matrices, showing improvements in hardness and wear resistance under erosion conditions [16,17,18,19,20]. Specifically, silicon dioxide (SiO2) NPs have generated great interest due to their chemical stability, high hardness, low cost, and excellent compatibility with epoxy polymer matrices [21]. In addition, surface protection strategies such as the application of hybrid coatings incorporating nanomaterials have also shown significant potential for mitigating erosive wear on composite substrates [22]. When properly dispersed, SiO2 NPs can form a microbarrier effect that restricts plastic deformation and microcrack propagation during impacts [23]. In addition, their surface hydroxyl groups can chemically interact with the epoxy matrix, improving interfacial adhesion and the overall load-bearing capacity of the composite [24].
Despite these advantages, most studies have focused on polymer nanocomposites without considering the synergistic influence of fiber reinforcement, or have analyzed the effects on mechanical properties rather than the mechanisms that arise due to erosional wear. Therefore, it is necessary to investigate how the addition and dispersion of SiO2 NPs affect the erosional wear behavior of glass fiber-reinforced epoxy systems, where both, the matrix and the fiber-matrix interface, play a fundamental role in energy absorption and material wear.
In this study, fiberglass-reinforced epoxy matrix laminates containing 0, 1.5 and 3 wt% SiO2 nanoparticles were fabricated using the resin infusion method. The main objective was to evaluate the effect of SiO2 nanoparticle concentration on the mechanical, microstructural, and erosion resistance properties of the nanocomposites. Dispersal of the NPs was achieved by ultrasonic stirring to minimize agglomeration and promote homogeneous distribution within the matrix.
Experimental results revealed that the composite with 1.5 wt% SiO2 exhibited the lowest rate of erosive wear, indicating that an optimal concentration of NPs and uniform dispersion can significantly improve the erosion resistance of epoxy/fiberglass laminates. The results of this research provide valuable information for the design of NPs-modified polymer composites for structural applications under erosive conditions.
2. Materials and Methods
2.1. Materials
Epolam 2015 epoxy resin (viscosity of 550 mPa∙s at 25 °C), non-porous Skyspring SiO₂ NPs (99.5% purity, diameter between 10 and 20 nm), and TBR600 fiberglass fabric (Type E glass, average filament diameter 15 μm) in bidirectional woven pattern with 5mm spacing were used to manufacture the composite materials.
The reference composite material was fabricated as shown in Figure 1 using the vacuum assisted resin infusion (VARI) method. The matrix was prepared by mixing epoxy resin and hardener in a 100:10 weight ratio. Eight layers (166.4 g per layer) of 150 x 220 mm bidirectional fiberglass fabric (Figure 2) were laid on a metal base, distribution mesh, and vacuum bag, which was then hermetically sealed with polyurethane tape. The resin was injected at a vacuum pressure of 50 kPa and a temperature of 25 °C, with an impregnation time of 25 min. Curing was achieved by heating the metal base to 70 °C for 4 h, resulting in a 150 × 220 mm laminate with a thickness of 4 mm.
The specimens showed a uniform distribution of fibers within the epoxy resin without apparent porosity or voids (Figure 3).
2.2. Incorporation of SiO2 NPs
For the compounds with 1.5 and 3 wt% NPs relative to the resin, the NPs were dispersed in the epoxy resin using a 40 kHz ultrasonic bath for 5 min. The hardener was added, and an additional 7 min of ultrasonication was applied. The mixture was degassed for 7 minutes to reduce the presence of bubbles using this function of the ultrasonic bath. The same VARI and curing conditions as the reference laminate composite were applied to obtain the laminate composites with SiO2 NPs in the matrix. Three different fiberglass (FG) materials were produced, based on its NPs % concentration, see Table 1.
2.3. Erosive Particle
Silicon carbide (SiC) was used as the erosive particle, with a HV of 31 GPa. Figure 4 shows the SiC particles, which display polyhedral shapes with sharp angles. The selection of this particular abrasive is based on the size distribution and morphology with few variations, which guarantees reproducibility in erosion tests, minimizing variations due to the morphology or composition of the abrasive.
To determine the particle size distribution, static image analysis was used [25,26,27]. A total of 100 particle size measurements were taken from a series of images of the SiC particles captured by a stereoscope; with these data, a particle size distribution was made (Figure 5). Based on the results obtained, the particle size with the highest percentage was 249 μm.
2.4. Characterization
The chemical composition and distribution of the SiO2 NPs were verified by Fourier transform infrared spectroscopy (FTIR) in transmission mode. Grazing incidence X-ray diffraction (GIXRD) was used as a complementary analysis to verify the presence and distribution of the nanoparticles in the resin matrix. XRD scans were performed in a 2θ range of 5° to 80° at a scan rate of 2°/min at room temperature. To determine the hardness and modulus of elasticity, nanoindentation tests were performed at a temperature of 22.0 ± 0.2 °C. All samples were subjected to a load of 50 mN for 10 seconds. The wear track profile and the roughness of the laminate composites were determined using a profilometer. A confocal microscope was used to identify the wear zone, and a scanning electron microscope was used to observe the wear mechanisms.
2.5. Erosive Wear Tests
The specimens were mechanically cut to dimensions of 20 × 50 mm. They were cleaned in a 40 kHz ultrasonic bath in soapy water for 10 minutes, followed by air drying. A homemade horizontal erosion test platform based on ASTM G76 [28] was used, and three tests were performed per sample. A simplified schematic diagram is shown in Figure 6. An air pressure of 45 Psi, a SiC erosion particle flow rate of approximately 0.838 kg/min and an impact velocity of 6 m/s, verified with an anemometer, were established. The nozzle used had an internal diameter of 8 mm and a separation distance of 10 mm from the sample. An impact angle of 90° was established due to the significant erosional damage it produces [29,30]. Before the tests, the initial mass of each sample was determined using an analytical balance, then the sample was removed every 20 seconds to record the mass loss and observe the effect of the SiO2 NPs. This process was repeated for a total of 80 seconds.
The erosion rate () was calculated by Equation 1 from the mass lost from the evaluated laminated composite material () and the total mass of the erosive particle used in the test () [31].
3. Results and Discussion
3.1. Roughness, Hardness and Modulus of Elasticity
Table 2 presents the average roughness (Ra), Vickers hardness (VH) and modulus of elasticity (E) of FG-0-SiO2, FG-1.5-SiO2 and FG-3-SiO2, with their respective standard deviation (SD). The Ra values of FG-1.5-SiO2 and FG-3-SiO2 were lower than those of the reference material, FG-0-SiO2. This reduction is attributed to the fact that the SiO2 nanoparticles act as nanofillers for pores, microcracks, and surface defects present in the epoxy resin, generating a more homogeneous surface [32]. FG-1.5-SiO2 exhibited the lowest roughness, suggesting an effective and homogeneous dispersion of the SiO2 nanoparticles within the epoxy resin matrix [33]. In contrast, FG-3-SiO2 showed a greater increase in roughness because its nanoparticle concentration promotes the formation of agglomerations [34]. This trend in FG-1.5-SiO2 is validated by its higher VH and E values, indicating effective charge transfer and adequate interaction of the nanoparticles with the matrix [35,36]. In the case of FG-3-SiO2, its properties showed even lower values than the reference material FG-0-SiO2, confirming the presence of agglomerations that cause structural defects in the material [37].
3.2. FTIR
Figure 7 presents the FTIR spectra of specimens FG-0-SiO2, FG-1.5-SiO2, and FG-3-SiO2. Characteristic bands confirming the presence of SiO2 containing groups are identified in all spectra. In FG-0-SiO2, these bands are attributed to the contribution of the glass fiber reinforcement, because this specimen does not contain NPs of SiO2. To differentiate the NPs contribution from the glass fiber signal in FG-1.5-SiO2 and FG-3-SiO2, the bending band (δ) of the O–Si–O bond, located between 450 and 500 cm⁻¹, was analyzed [38]. As shown in the magnification, in FG-0-SiO2 this band is observed at 479 cm⁻¹ with low intensity, corresponding to the silica in the fiber. In FG-1.5-SiO2, a slight shift to 470 cm⁻¹ is observed, maintaining low intensity. In contrast, in FG-3-SiO2, the band becomes wider and more intense, located at 472 cm⁻¹. These shifts and changes reflect variations in the local chemical environment due to interfacial interactions between the epoxy matrix and the NPs, which intensify with increasing NPs concentration [39]. The corresponding bands for symmetric (νS) and asymmetric (νAS) stretching of Si–O–Si are located at 830 cm⁻¹ and 1038 cm⁻¹, respectively [40]. Although no shifts are observed, their intensity increases markedly in FG-3-SiO2, this is attributed to the higher concentration of NPs and the possible formation of agglomerates, which, although contributing to the FTIR signal, may limit interfacial interaction [41]. The Si–OH band at 936 cm⁻¹ [42] also shows an increase in intensity in FG-3-SiO2 compared to the other specimens. Although part of this increase is explained by the higher concentration of NPs, the marked intensity suggests the presence of aggregates containing Si-OH groups trapped at internal interfaces, reducing their accessibility and reactivity with the matrix [43]. In the band at 3369 cm⁻¹, assigned to OH groups [44], a higher intensity is again observed in FG-3-SiO2. This is directly attributed to the surface silanol (Si–OH) groups of the NPs, whose signal is amplified by agglomeration and the consequent formation of hydrogen bonds between neighboring silanes [45]. This behavior is typical of nanocomposite systems where high concentration favors NPs agglomeration. Overall, the FTIR results indicate that FG-3-SiO2 exhibits a marked tendency toward agglomeration, evidenced by the generalized increase in intensity of the Si-O-Si and Si-OH bands, along with morphological changes in the O-Si-O bending band. In contrast, FG-1.5-SiO2 shows moderate changes compared to FG-0-SiO2, suggesting better NPs dispersion and more effective interfacial interaction, without significant alterations in the main SiO2 bands.
3.3. GIXRD
Figure 8 shows the GIXRD patterns obtained for specimens FG-0-SiO2, FG-1.5-SiO2 and FG-3-SiO2. In all three spectra, the characteristic amorphous halo of SiO2 is identified in the 10–30° region of 2θ [46,47]. In FG-0-SiO2, this halo is primarily attributed to the amorphous silica of the glass fiber, as it does not contain SiO2 nanoparticles (NPs). In FG-1.5-SiO2, the intensity of the halo increases, reflecting the additional contribution of the amorphous SiO2 NPs. This behavior indicates a homogeneous surface distribution of the NPs, which maximizes their contribution to X-ray scattering [48]. On the other hand, in FG-3-SiO2, a decrease in halo intensity is observed, even below that of FG-0-SiO2. This reduction, despite the higher concentration of NPs, indicates the presence of surface agglomeration. The agglomerates formed may be partially or completely coated by the epoxy matrix, reducing their direct exposure to the incident beam [49]. Additionally, dense nanoparticle agglomerates tend to behave as regions of greater X-ray absorption, which decreases the diffuse signal from the amorphous silica and causes a reduction in the overall intensity of the halo [50,51,52].
3.4. Topographic Analysis
Figure 9 shows scanning electron microscopy (SEM) images of the surfaces of specimens FG-0-SiO2, FG-1.5-SiO2, and FG-3-SiO2. FG-0-SiO2 (Figure 9a) exhibits a surface with significant irregularities, attributable to the natural morphology of the glass fiber and the absence of SiO2 nanoparticles. FG-1.5-SiO2 (Figure 9b) displays a more homogeneous and uniform surface morphology, with no evidence of nanoparticle clumping or agglomeration. This suggests good dispersion of the SiO2 NPs within the epoxy matrix, which is consistent with the results obtained for roughness, hardness, elastic modulus, FTIR, and GIXRD. On the other hand, in FG-3-SiO2 (Figure 9c), regions with dense and heterogeneous clusters of NPs are observed, indicative of significant agglomeration. This non-homogeneous distribution confirms the trend observed in spectroscopic techniques, where the high concentration of NPs favors the formation of surface aggregates that can negatively affect the interfacial properties of the nanocomposite.
3.5. Mass Loss, Profilometry and Erosion Rate
Figure 10 shows the erosion test results for FG-0-SiO2, FG-1.5-SiO2, and FG-3-SiO2, expressed as mass loss over time. For FG-0-SiO2, a pronounced mass loss is observed during the first 60 seconds, primarily attributed to the detachment of the epoxy resin matrix. Subsequently, the mass loss stabilizes and remains minimal, indicating that the glass fibers have been reached due to their greater hardness and wear resistance, resulting in significantly less damage. FG-3-SiO2 exhibits similar behavior to FG-0-SiO2, with a notable mass loss in the initial stage from 0 to 60 seconds and subsequent stabilization without significant changes. This suggests that the agglomeration of the NPs observed due to their concentration in previous techniques does not improve erosion resistance. Agglomeration limits the reinforcing properties of SiO2 NPs, such as their high stiffness and hardness, since agglomerates act as stress concentrators and reduce the effective interfacial surface area, generating structural defects that facilitate matrix detachment. In contrast, FG-1.5-SiO2 exhibits a behavior in which the greatest mass loss occurs within a 0-40 second interval, followed by progressive mass loss. This indicates that detachment of the epoxy resin matrix continues for a longer period, without reaching the fibers. This behavior is attributed to the optimal dispersion of the SiO2 NPs, which, due to their high surface area and ability to chemically interact with the epoxy matrix through silanol groups, form a reinforced and cohesive interface. The adequate dispersion of the NPs allows them to act as barriers to the propagation of microcracks and dissipate impact energy during erosion, thus improving resistance to erosive wear compared to FG-0-SiO2 and FG-3-SiO2.
Figure 11 presents the erosional wear zones and corresponding depth contrast images for specimens FG-0-SiO2, FG-1.5-SiO2, and FG-3-SiO2. Differences in the extent and severity of erosional damage can be observed among the samples. FG-1.5-SiO2 exhibits slightly fewer deep regions and a smaller total wear zone compared to FG-0-SiO2 and FG-3-SiO2. This suggests greater resistance to penetration and propagation of erosional damage, which is consistent with the previously presented mass loss results. On the other hand, both FG-0-SiO2 and FG-3-SiO2 exhibit deeper zones and a wider wear zone, indicating a lower capacity to resist erosion. In the case of FG-3-SiO2, it can again be attributed to the agglomeration of NPs, which generates structural heterogeneities and stress concentration sites that favor the detachment of material.
Figure 12 presents the results of total accumulative mass loss as a function of time and erosion rate for specimens FG-0-SiO2, FG-1.5-SiO2, and FG-3-SiO2. In Figure 12a, FG-1.5-SiO2 exhibited the lowest accumulative mass loss at the end of the test, indicating greater resistance to erosive wear of the epoxy matrix due to the good distribution of the NPs. Conversely, FG-0-SiO2 and FG-3-SiO2 showed a greater cumulative mass loss, indicating less protection against erosion. Figure 12b confirms that FG-1.5-SiO2 exhibited the lowest erosion rate, while FG-0-SiO2 showed the highest. The behavior of FG-3-SiO2 falls between the two, but is closer to that of FG-0-SiO2, suggesting that agglomerating NPs at higher concentrations does not significantly improve erosion resistance. Based on these results, it can be stated that the addition of 1.5 wt% SiO2 NPs increases erosion resistance by approximately 38% compared to FG-0-SiO2. This improvement is explained by the homogeneous dispersion of the nanoparticles, which reinforce the epoxy matrix through charge transfer, microcrack blocking, and impact energy dissipation, thus reducing material loss during the erosion test. Table 3 presents the erosion rate and total mass loss values for each specimen.
The profilometry performed in the erosional wear zone of FG-0-SiO2, FG-1.5-SiO2, and FG-3-SiO2 is presented in Figure 13. The analysis shows the differences in erosion track depth among the samples. FG-0-SiO2 and FG-3-SiO2 exhibited the greatest wear depths, indicating lower erosion resistance, while FG-1.5-SiO2 showed less pronounced wear depths, demonstrating better erosion resistance and good surface integrity under particle impact conditions. These results are consistent with the reported erosion rate, mass loss over time, and total cumulative mass loss.
3.6. Wear Mechanisms
Figure 14 presents SEM images obtained at 500X and 1500X magnification showing the traces of erosive wear on specimens FG-0-SiO2, FG-1.5-SiO2, and FG-3-SiO2. To maximize surface damage, erosion tests were performed with a normal impact angle (90°) of the erosive agent. Figure 14a and Figure 14b, and 14c show that all samples exhibit epoxy matrix detachment and fiber exposure. However, the severity and mechanisms of wear vary significantly among them. In FG-0-SiO2 (Figure 14a), extensive regions of matrix removal are identified, exposing the reinforcing fibers and demonstrating a brittle failure mechanism characteristic of epoxy matrix composites. This behavior is attributed to the weak interface between the matrix and the fiber, and therefore, to the low wear resistance of the matrix not reinforced with SiO2 nanoparticles. FG-3-SiO2 (Figure 14c) also shows considerable matrix removal, accompanied by brittle fracture, fragmentation, and fiber breakage. These findings are consistent with previous results for hardness, elastic modulus, and wear rate, due to the agglomeration of SiO2 nanoparticles, which generates areas of structural weakness and stress concentration that favor premature failure. FG-1.5-SiO2 (Figure 14b) exhibits less matrix removal, a stronger interface, and a more controlled failure pattern, with small cavities and limited regions of fiber exposure and breakage. This confirms that the optimal dispersion of 1.5 wt% SiO2 NPs strengthens the matrix, improves the interface, and mitigates erosive damage, as deduced from the mass loss and profilometry tests.
4. Conclusions
Based on the results obtained in this study on the erosive wear behavior of fiberglass reinforced epoxy matrix laminated composites modified with SiO2 NPs, the following conclusions are presented:
1. The incorporation of SiO2 NPs into the epoxy matrix of fiberglass reinforced laminated composites improves resistance to erosive wear, but this effect depends directly on the concentration and homogeneous dispersion of the NPs.
2. An optimal concentration of 1.5 wt% of SiO2 NPs, combined with an ultrasonic dispersion and degassing process, allows for a homogeneous distribution of the NPs within the epoxy matrix. This generates a more uniform surface, increases hardness and elastic modulus, and strengthens the interface between the matrix and the fiber.
3. The improvement in mechanical and tribological properties observed in the FG-1.5-SiO2 composite is attributed to the well dispersed NPs, which act as barriers to microcrack propagation, improve stress transfer, and dissipate impact energy during the erosion process.
4. An excessive concentration of nanoparticles, such as the 3 wt% concentration found in FG-3-SiO2, causes agglomeration of NPs. This compromises the properties of the material by creating structural defects, reducing the effective interfacial area, and acting as stress concentration points, resulting in behavior similar to that of the material without NPs.
5. The results of this study demonstrate that there is an optimal concentration of SiO2 NPs to significantly improve erosion resistance in laminated epoxy matrix and fiberglass composites. This provides valuable information for the design of laminated composite materials modified with NPs intended for structural applications in environments subject to wear from solid particles, where surface integrity and service life are critical.
Acknowledgments
The authors gratefully acknowledge Dr. José de Jesús Ku Herrera and the Center for Research in Applied Chemistry (CIQA) for providing the SiO2 nanoparticles used in this study. Financial support was provided by SECIHTI through a postgraduate scholarship awarded to Angel Sebastián Alvarez Lozano. To the Secretariat of Science, humanities and Technology and Innovation (Before CONAHCyT) for financing the research project number 319941. We also extend our thanks to Reina Araceli Mauricio Sánchez and the Polymer and Biomaterials Laboratory at CINVESTAV Querétaro for their technical and laboratory assistance. Institutional support was provided by the Department of Strategic Technologies and Postgraduate Studies, SECIHTI–Engineering and Industrial Development Center (CIDESI).
References
- Georgantzinos, S.K.; Giannopoulos, G.I.; Stamoulis, K.; Markolefas, S. Composites in Aerospace and Mechanical Engineering. Materials 2023, 16, 7230. [Google Scholar] [CrossRef]
- Butler, R. Academic research for composite aerostructures - A personal perspective. Composites Part B: Engineering 2024, 273, 111239. [Google Scholar] [CrossRef]
- Wazeer, A.; Das, A.; Abeykoon, C.; Sinha, A.; Karmakar, A. Composites for electric vehicles and automotive sector: A review. Green Energy and Intelligent Transportation 2023, 2, 100043. [Google Scholar] [CrossRef]
- Balakrishnan, V.S.; Seidlitz, H. Potential repair techniques for automotive composites: A review. Composites Part B: Engineering 2018, 145, 28–38. [Google Scholar] [CrossRef]
- Tomasi, I.; Grandi, S.; Solazzi, L. Implementation of Composite Materials for an Industrial Vehicle Component: A Design Approach. Journal of Composites Science 2025, 9, 168. [Google Scholar] [CrossRef]
- Trzepieciński, T.; Batu, T.; Kibrete, F.; Lemu, H.G. Application of Composite Materials for Energy Generation Devices. Journal of Composites Science 2023, 7, 55. [Google Scholar] [CrossRef]
- Suryanto, S.; Rio Prabowo, A.; Adiputra, R.; Ehlers, S.; Braun, M.; Yaningsih, I.; Istanto, I.; Wijaya, R. A review of composite materials for marine purposes: Historical perspective and current state. Procedia Structural Integrity 2025, 72, 427–435. [Google Scholar] [CrossRef]
- Rajendran, S.; Shanmugam, V.; Palani, G.; Marimuthu, U.; Veerasimman, A.; Korniejenko, K.; Oliinyk, I.; Trilaksana, H.; Sundaram, V. Investigation on Erosion Resistance in Polyester–Jute Composites with Red Mud Particulate: Impact of Fibre Treatment and Particulate Addition. Polymers 2024, 16, 2793. [Google Scholar] [CrossRef]
- Wang, S.; Li, J.; Cao, J.; Zhao, Z.; Huang, J.; Xing, J.; Zhang, C. Damage mechanism and residual tensile strength of CFRP laminates subjected to high-velocity sand erosion. Composites Part B: Engineering 2025, 300, 112459. [Google Scholar] [CrossRef]
- Patnaik, A.; Satapathy, A.; Chand, N.; Barkoula, N.M.; Biswas, S. Solid particle erosion wear characteristics of fiber and particulate filled polymer composites: A review. Wear 2010, 268, 249–263. [Google Scholar] [CrossRef]
- Hiremath, A.; Murthy, A.A.; Thipperudrappa, S. KNB Nanoparticles Filled Polymer Nanocomposites: A Technological Review. Cogent Engineering 2021, 8, 1–23. [Google Scholar] [CrossRef]
- Domun, N.; Hadavinia, H.; Zhang, T.; Sainsbury, T.; Liaghat, G.H.; Vahid, S. Improving the fracture toughness and the strength of epoxy using nanomaterials – a review of the current status. Nanoscale 2015, 7, 1–36. [Google Scholar] [CrossRef]
- Zare, Y.; Fasihi, M.; Rhee, K.Y. Efficiency of stress transfer between polymer matrix and nanoplatelets in clay/polymer nanocomposites. Applied Clay Science 2017, 143, 265–272. [Google Scholar] [CrossRef]
- Ali, H.; Ali, S.; Ali, K.; Ullah, S.; Ismail, P.M.; Humayun, M.; Zeng, C. Impact of the nanoparticle incorporation in enhancing mechanical properties of polymers. Results in Engineering 2025, 24, 106151. [Google Scholar] [CrossRef]
- Rahman, M.M.; Khan, K.H.; Parvez, M.M.H.; Irizarry, N.; Uddin, M.N. Polymer Nanocomposites with Optimized Nanoparticle Dispersion and Enhanced Functionalities for Industrial Applications. Processes 2025, 13, 994. [Google Scholar] [CrossRef]
- Alam, M.A.; Samad, U.A.; Anis, A.; Alam, M.; Ubaidullah, M.; Al-Zahrani, S.M. Effects of SiO2 and ZnO Nanoparticles on Epoxy Coatings and Its Performance Investigation Using Thermal and Nanoindentation Technique. Polymers 2021, 13, 1490. [Google Scholar] [CrossRef]
- Srinivasa Perumal, K.P.; Selvarajan, L.; Manikandan, K.P.; Velmurugan, C. Mechanical, tribological, and surface morphological studies on the effects of hybrid ilmenite and silicon dioxide fillers on glass fibre reinforced epoxy composites. Journal of the Mechanical Behavior of Biomedical Materials 2023, 146. [Google Scholar] [CrossRef] [PubMed]
- Al-Zubaydi, A.S.J.; Salih, R.M.; Al-Dabbagh, B.M. Effect of nano TiO2 particles on the properties of carbon fiber-epoxy composites. Prog. Rubber Plast. Recycl. Technol. 2021, 37, 216–232. [Google Scholar] [CrossRef]
- Bazrgari, D.; Moztarzadeh, F.; Sabbagh-Alvani, A.A.; Rasoulianboroujeni, M.; Tahriri, M.; Tayebi, L. Mechanical properties and tribological performance of epoxy/Al2O3 nanocomposite. Ceramics International 2018, 44, 1220–1224. [Google Scholar] [CrossRef]
- Nassar, A.; Younis, M.; Ismail, M.; Nassar, E. Improved Wear-Resistant Performance of Epoxy Resin Composites Using Ceramic Particles. Polymers 2022, 14, 333. [Google Scholar] [CrossRef] [PubMed]
- Chuanga, W.; Geng-sheng, J.; Lei, P.; Bao-lin, Z.; Ke-zhi, L.; Jun-long, W. Influences of surface modification of nano-silica by silane coupling agents on the thermal and frictional properties of cyanate ester resin. Results in Physics 2018, 9, 886–896. [Google Scholar] [CrossRef]
- Govea Paz, L.I.; Martínez Pérez, A.I.; Vera Cárdenas, E.E.; Moreno Ríos, M.; González Carmona, J.M. Study of erosion wear by solid particle of a PMMA/SiO2 hybrid coating with graphene oxide applied on a composite laminate. J. Thermoplast. Compos. Mater. 2024, 38, 2570–2592. [Google Scholar] [CrossRef]
- Demirci, M.T. Low velocity impact and fracture characterization of SiO2 nanoparticles filled basalt fiber reinforced composite tubes. Journal of Composite Materials 2020, 54, 3415–3433. [Google Scholar] [CrossRef]
- Ragosta, G.; Abbate, M.; Musto, P.; Scarinzi, G.; Mascia, L. Epoxy-silica particulate nanocomposites: Chemical interactions, reinforcement and fracture toughness. Polymer 2005, 46, 10506–10516. [Google Scholar] [CrossRef]
- Tinke, AP; Carnicer, A; Govoreanu, R; Scheltjens, G; Lauwerysen, L; Mertens, N; Vanhoutte, K; Brewster, ME. Particle shape and orientation in laser diffraction and static image analysis size distribution analysis of micrometer sized rectangular particles. Powder Technology 2008, 186, 154–167. [Google Scholar] [CrossRef]
- Houghton, JE; Behnsen, J; Duller, RA; Nichols, TE; Worden, RH. Particle size analysis: a comparison of laboratory-based techniques and their application to geoscience. Sedimentary Geology 2024, 464, 106607. [Google Scholar] [CrossRef]
- Billones, RG; Tackx, MLM; Flachier, AT; Zhu, L; Daro, MH. Image analysis as a tool for measuring particulate matter concentrations and gut content, body size, and clearance rates of estuarine copepods: validation and application. Journal of Marine Systems 1999, 22, 179–194. [Google Scholar] [CrossRef]
- ASTM Standard G76-95; Standard Test Method for Conducting Erosion Tests by Solid Particle Impingement Using Gas Jets1. Annual Book of ASTM Standards. 1995; 3, pp. 321–325.
- Khare, JM; Dahiya, S; Gangil, B; Ranakoti, L; Sharma, S; Huzaifah, MRM; Ilyas, RA; Dwivedi, SP; Chattopadhyaya, S; Kilinc, HC; Li, C. Comparative analysis of erosive wear behaviour of epoxy, polyester and vinyl esters based thermosetting polymer composites for human prosthetic applications using Taguchi design. Polymers 2021, 13, 3607. [Google Scholar] [CrossRef] [PubMed]
- Harsha, A.P.; Sanjeev, K.J. Erosive wear studies of epoxy-based composites at normal incidence. Wear 2008, 265, 1129–1135. [Google Scholar] [CrossRef]
- Lv, G; Zhang, N; Huang, M; Shen, C; Castro, J; Tan, K; Liu, X; Liu, C. The remarkably enhanced particle erosion resistance and toughness properties of glass fiber/epoxy composites via thermoplastic polyurethane nonwoven fabric, Polymer Testing. Polymer Testing 2018, 69, 470–477. [Google Scholar] [CrossRef]
- Xijing, L.; Yong, C. Effect of SiO2 nanoparticles on the hardness and corrosion resistance of NiW/SiO2 nano composite coating prepared by electrodeposition. International Journal of Electrochemical Science 2023, 18, 100138. [Google Scholar] [CrossRef]
- Golshokouh, M.A.; Refahati, N.; Saffari, P.R. Effect of Silicon Nanoparticles on Moisture Absorption and Fracture Toughness of Polymethyl Methacrylate Matrix Nanocomposites. Journal of Composites Science 2024, 8, 1–12. [Google Scholar] [CrossRef]
- Yousry Zaghloul, M.M.; Fuseini, M.; Yousry Zaghloul, M.M. Review of epoxy nano-filled hybrid nanocomposite coatings for tribological applications. FlatChem 2025, 49, 1–38. [Google Scholar] [CrossRef]
- Kontou, E.; Christopoulos, A.; Koralli, P.; Mouzakis, D.E. The Effect of Silica Particle Size on the Mechanical Enhancement of Polymer Nanocomposites. Nanomaterials 2023, 13, 1095. [Google Scholar] [CrossRef]
- Wang, Z.; Lv, Q.; Chen, S.; Li, C.; Sun, S.; Hu, S. Effect of Interfacial Bonding on Interphase Properties in SiO2/Epoxy Nanocomposite: A Molecular Dynamics Simulation Study. ACS Applied Materials & Interfaces 2016, 8, 7499–7508. [Google Scholar] [CrossRef]
- Zare, Y. Study of nanoparticles aggregation/agglomeration in polymer particulate nanocomposites by mechanical properties. Composites: Part A 2016, 84, 158–164. [Google Scholar] [CrossRef]
- Ellerbrock, R.; Stein, M.; Schaller, J. Comparing amorphous silica, short-range-ordered silicates and silicic acid species by FTIR. Scientific Reports 2022, 12, 1–8. [Google Scholar] [CrossRef]
- Oufakir, A.; Khouchaf, L.; Elaatmani, M.; Zegzouti, A.; Louarn, G.; Ben Fraj, A. Study of structural short order and surface changes of SiO2 compounds. MATEC Web of Conferences 2018, 149, 1–5. [Google Scholar] [CrossRef]
- Nayak, P.; Datta, A. Synthesis of SiO2-Nanoparticles from Rice Husk Ash and its Comparison with Commercial Amorphous Silica through Material Characterization. Silicon 2021, 13, 1209–1214. [Google Scholar] [CrossRef]
- Ellerbrock, R.H.; Stein, M.; Schaller, J. Comparing silicon mineral species of different crystallinity using Fourier transform infrared spectroscopy. Frontiers in Environmental Chemistry 2024, 5, 1462678. [Google Scholar] [CrossRef]
- Praseptiangga, D.; Zahara, H.L.; Widjanarko, P.I.; Joni, I.M.; Panatarani, C. Preparation and FTIR spectroscopic studies of SiO2-ZnO nanoparticles suspension for the development of carrageenan-based bio-nanocomposite film. AIP Conference Proceedings 2020, 2219, 1–5. [Google Scholar] [CrossRef]
- Ellerbrock, R.; Stein, M.; Schaller, J. Comparing amorphous silica, short-range-ordered silicates and silicic acid species by FTIR. Scientific Reports 2022, 12, 1–9. [Google Scholar] [CrossRef]
- Dai, F.; Zhuang, Q.; Huang, G.; Deng, H.; Zhang, X. Infrared Spectrum Characteristics and Quantification of OH Groups in Coal. ACS Omega 2023, 8, 17064–17076. [Google Scholar] [CrossRef]
- Al Soud, A.; Daradkeh, S.I.; Knápek, A.; Holcman, V.; Sobola, D. Electrical characteristics of different concentration of silica nanoparticles embedded in epoxy resin. Physica Scripta 2023, 98, 1–15. [Google Scholar] [CrossRef]
- Farman, A.; Nisar, A.; Madiha, A.; Amir, S.; Shah, S.S.; Bilal, M. Epoxy Polyamide Composites Reinforced with Silica Nanorods: Fabrication, Thermal and Morphological Investigations. Journal of Inorganic and Organometallic Polymers and Materials. 2020, 30, 3869–3877. [Google Scholar] [CrossRef]
- Ke, X.; Wu, Z.; Lin, J.; Wang, F.; Li, P.; Xu, R.; Yang, M.; Han, L.; Zhang, D. A rapid analytical method for the specific surface area of amorphous SiO2 based on X-Ray diffraction. Journal of Non-Crystalline Solids 2020, 531, 119841. [Google Scholar] [CrossRef]
- Khouchaf, L.; Boulahya, K.; Das, P.P.; Nicolopoulos, S.; Kis, V.K.; Lábár, J.L. Study of the Microstructure of Amorphous Silica Nanostructures Using High-Resolution Electron Microscopy, Electron Energy Loss Spectroscopy, X-ray Powder Diffraction, and Electron Pair Distribution Function. Materials 2020, 13, 4393. [Google Scholar] [CrossRef]
- Chandran, S.; Begam, N.; Basu, J.K. Dispersion of polymer grafted nanoparticles in polymer nanocomposite films: Insights from surface x-ray scattering and microscopy. Journal of Applied Physics 2014, 116, 1–15. [Google Scholar] [CrossRef]
- Raulkar, S.R.; Pawar, N.R. Synthesis of SiO2 Nanoparticles by Using Sol Gel Method. International Journal of Scientific Research in Science and Technology 2025, 12, 510–513. [Google Scholar] [CrossRef]
- Kumar, D.A.; Shyla, J.M.; Xavier, F.P. Synthesis and characterization of TiO2/SiO2 nano composites for solar cell applications. Applied Nanoscience 2012, 2, 429–436. [Google Scholar] [CrossRef]
- Elizondo Villarreal, N.; Gandara Martínez, E.; García Méndez, M.; Gracia Pinilla, M.; Guzmán Hernández, A.M.; Castaño, V.M.; Gómez Rodríguez, C. Synthesis and Characterization of SiO2 Nanoparticles for Application as Nanoadsorbent to Clean Wastewater. Coatings 2024, 14, 919. [Google Scholar] [CrossRef]
Figure 1.
VARI method.
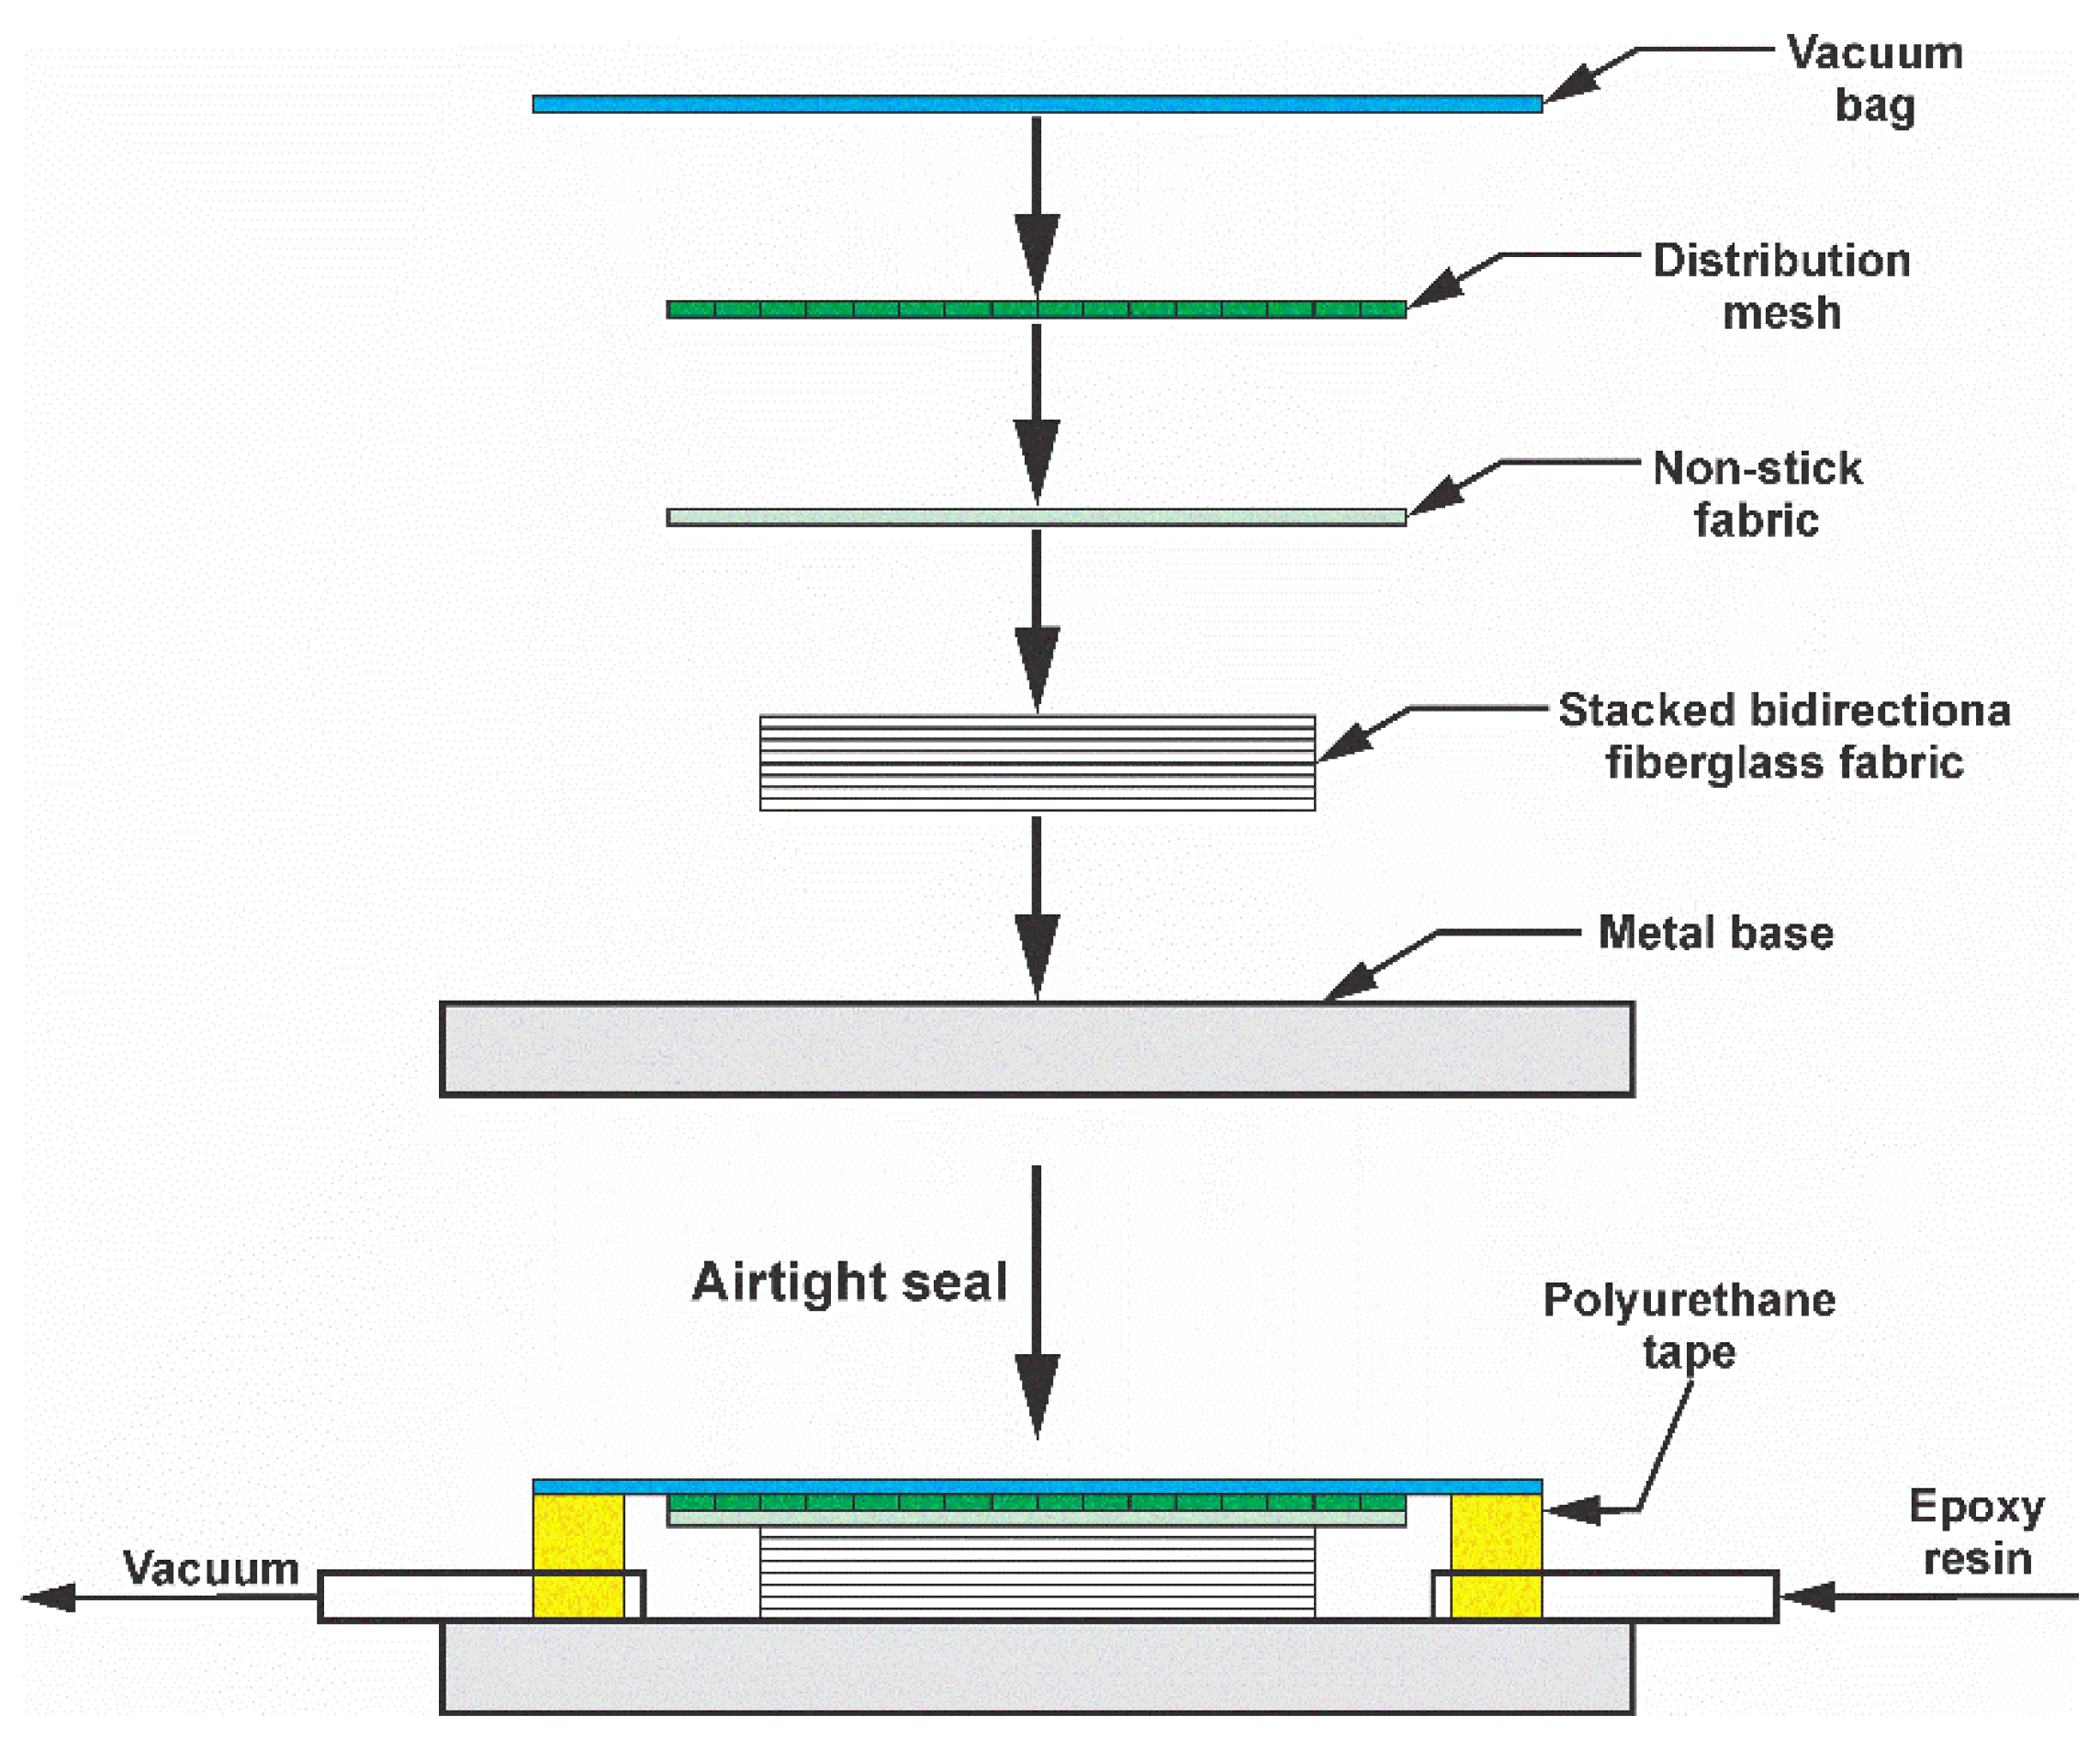
Figure 2.
Fiberglass fabric.
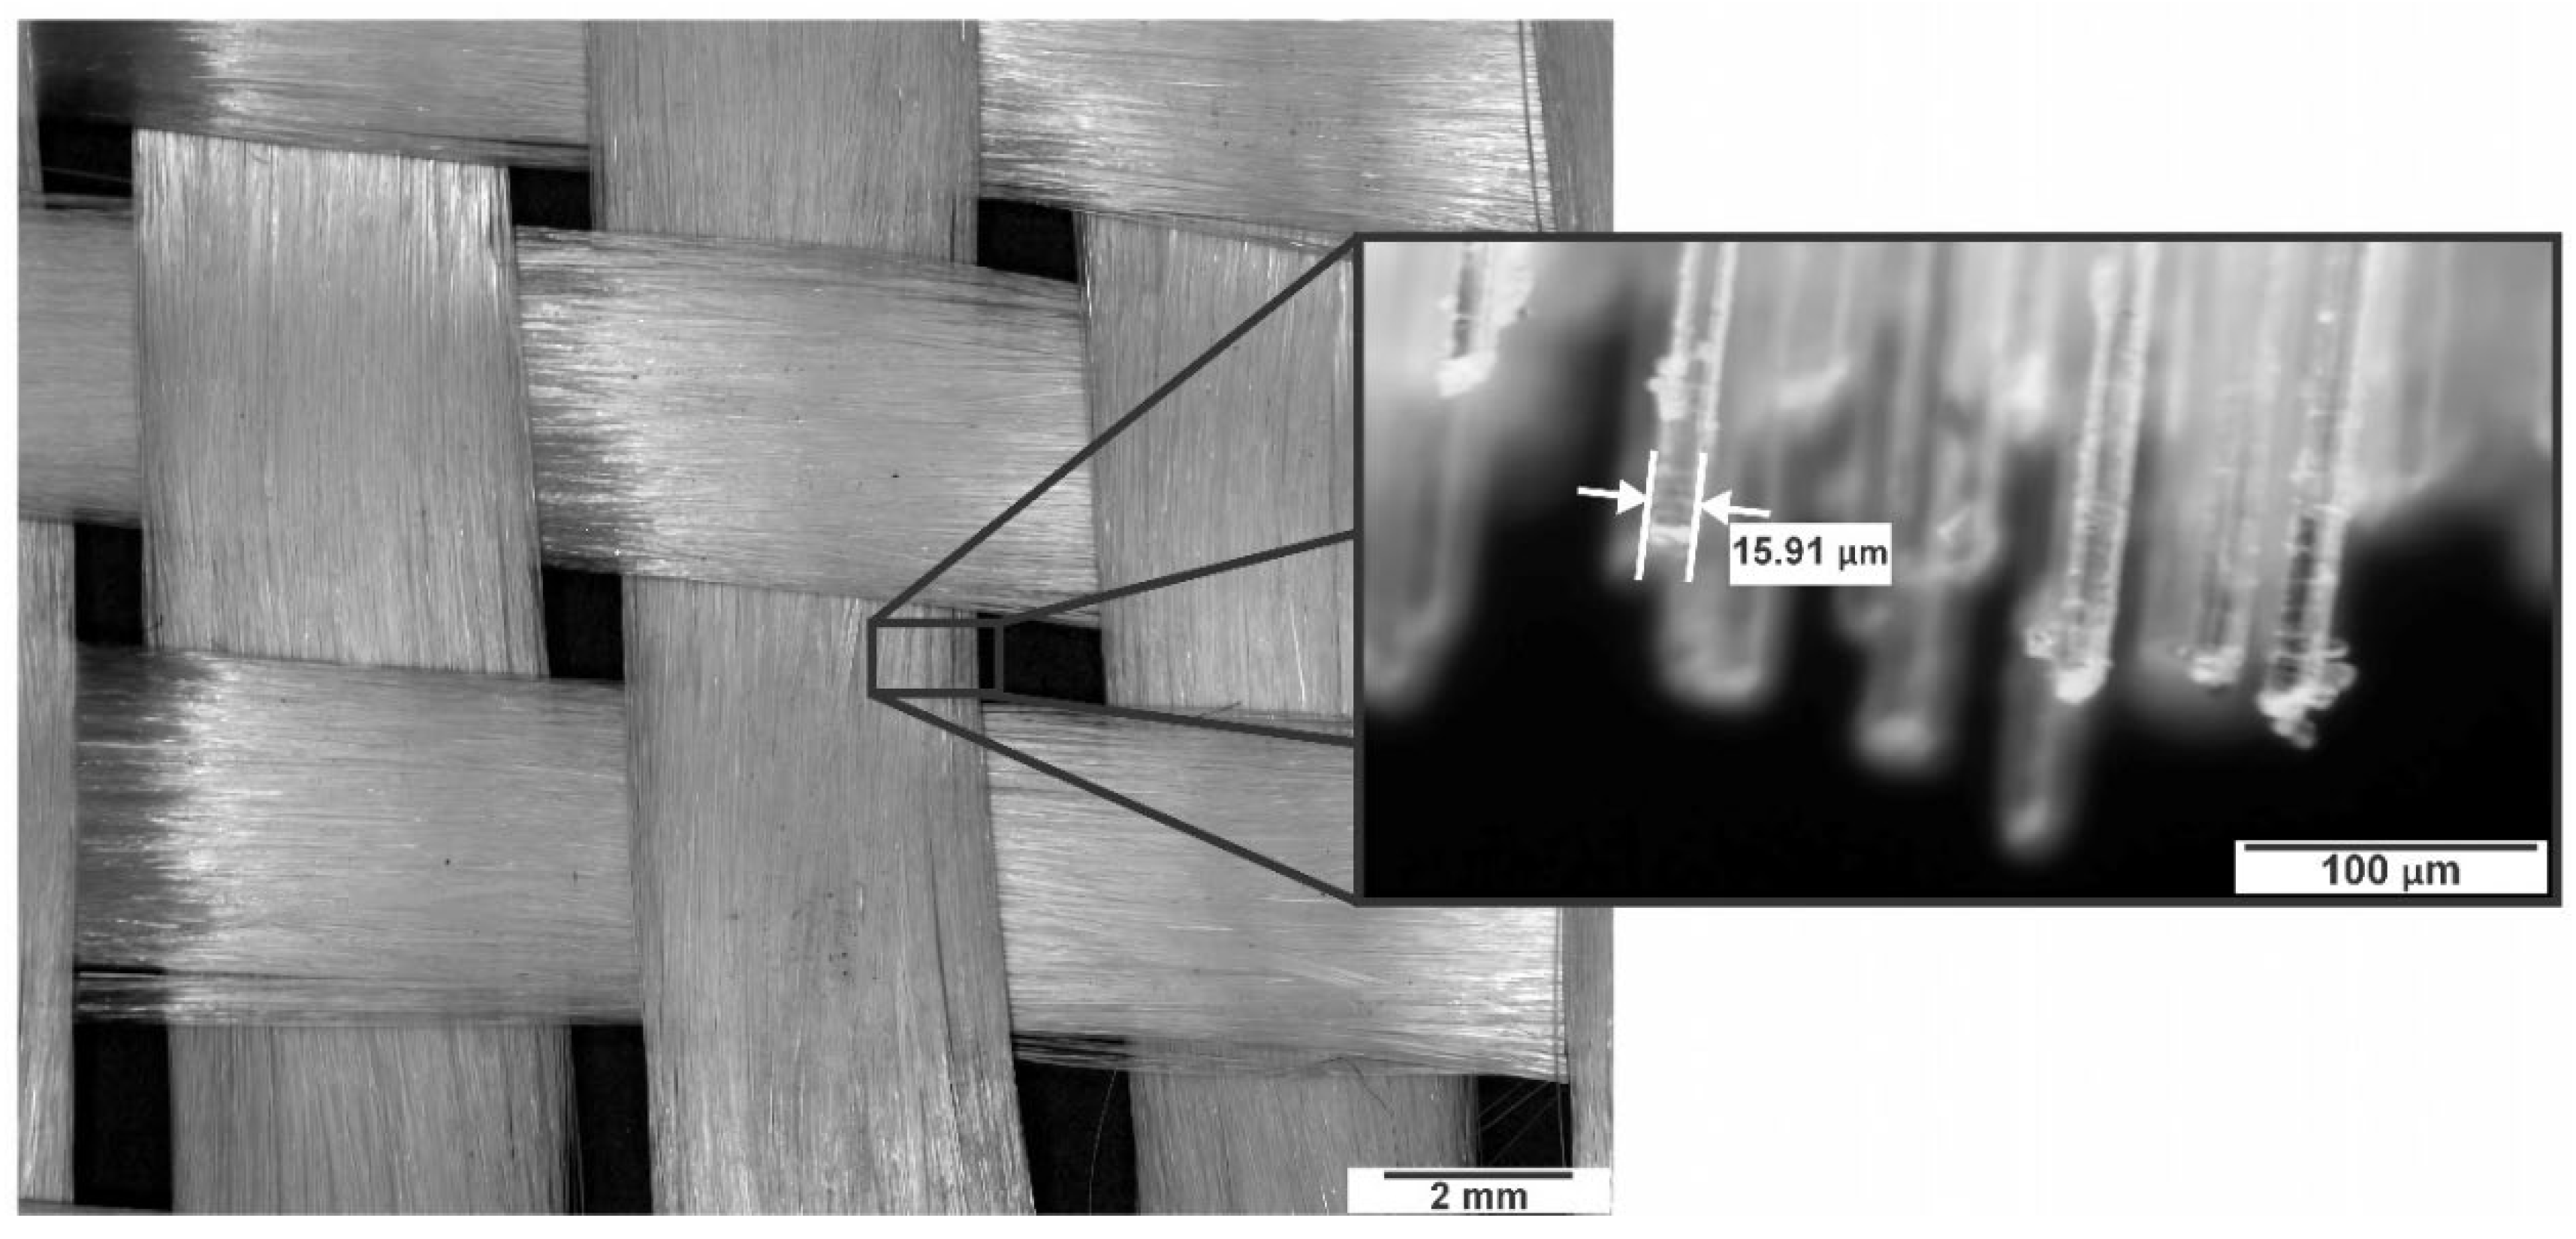
Figure 3.
Cross section of the laminated composite.
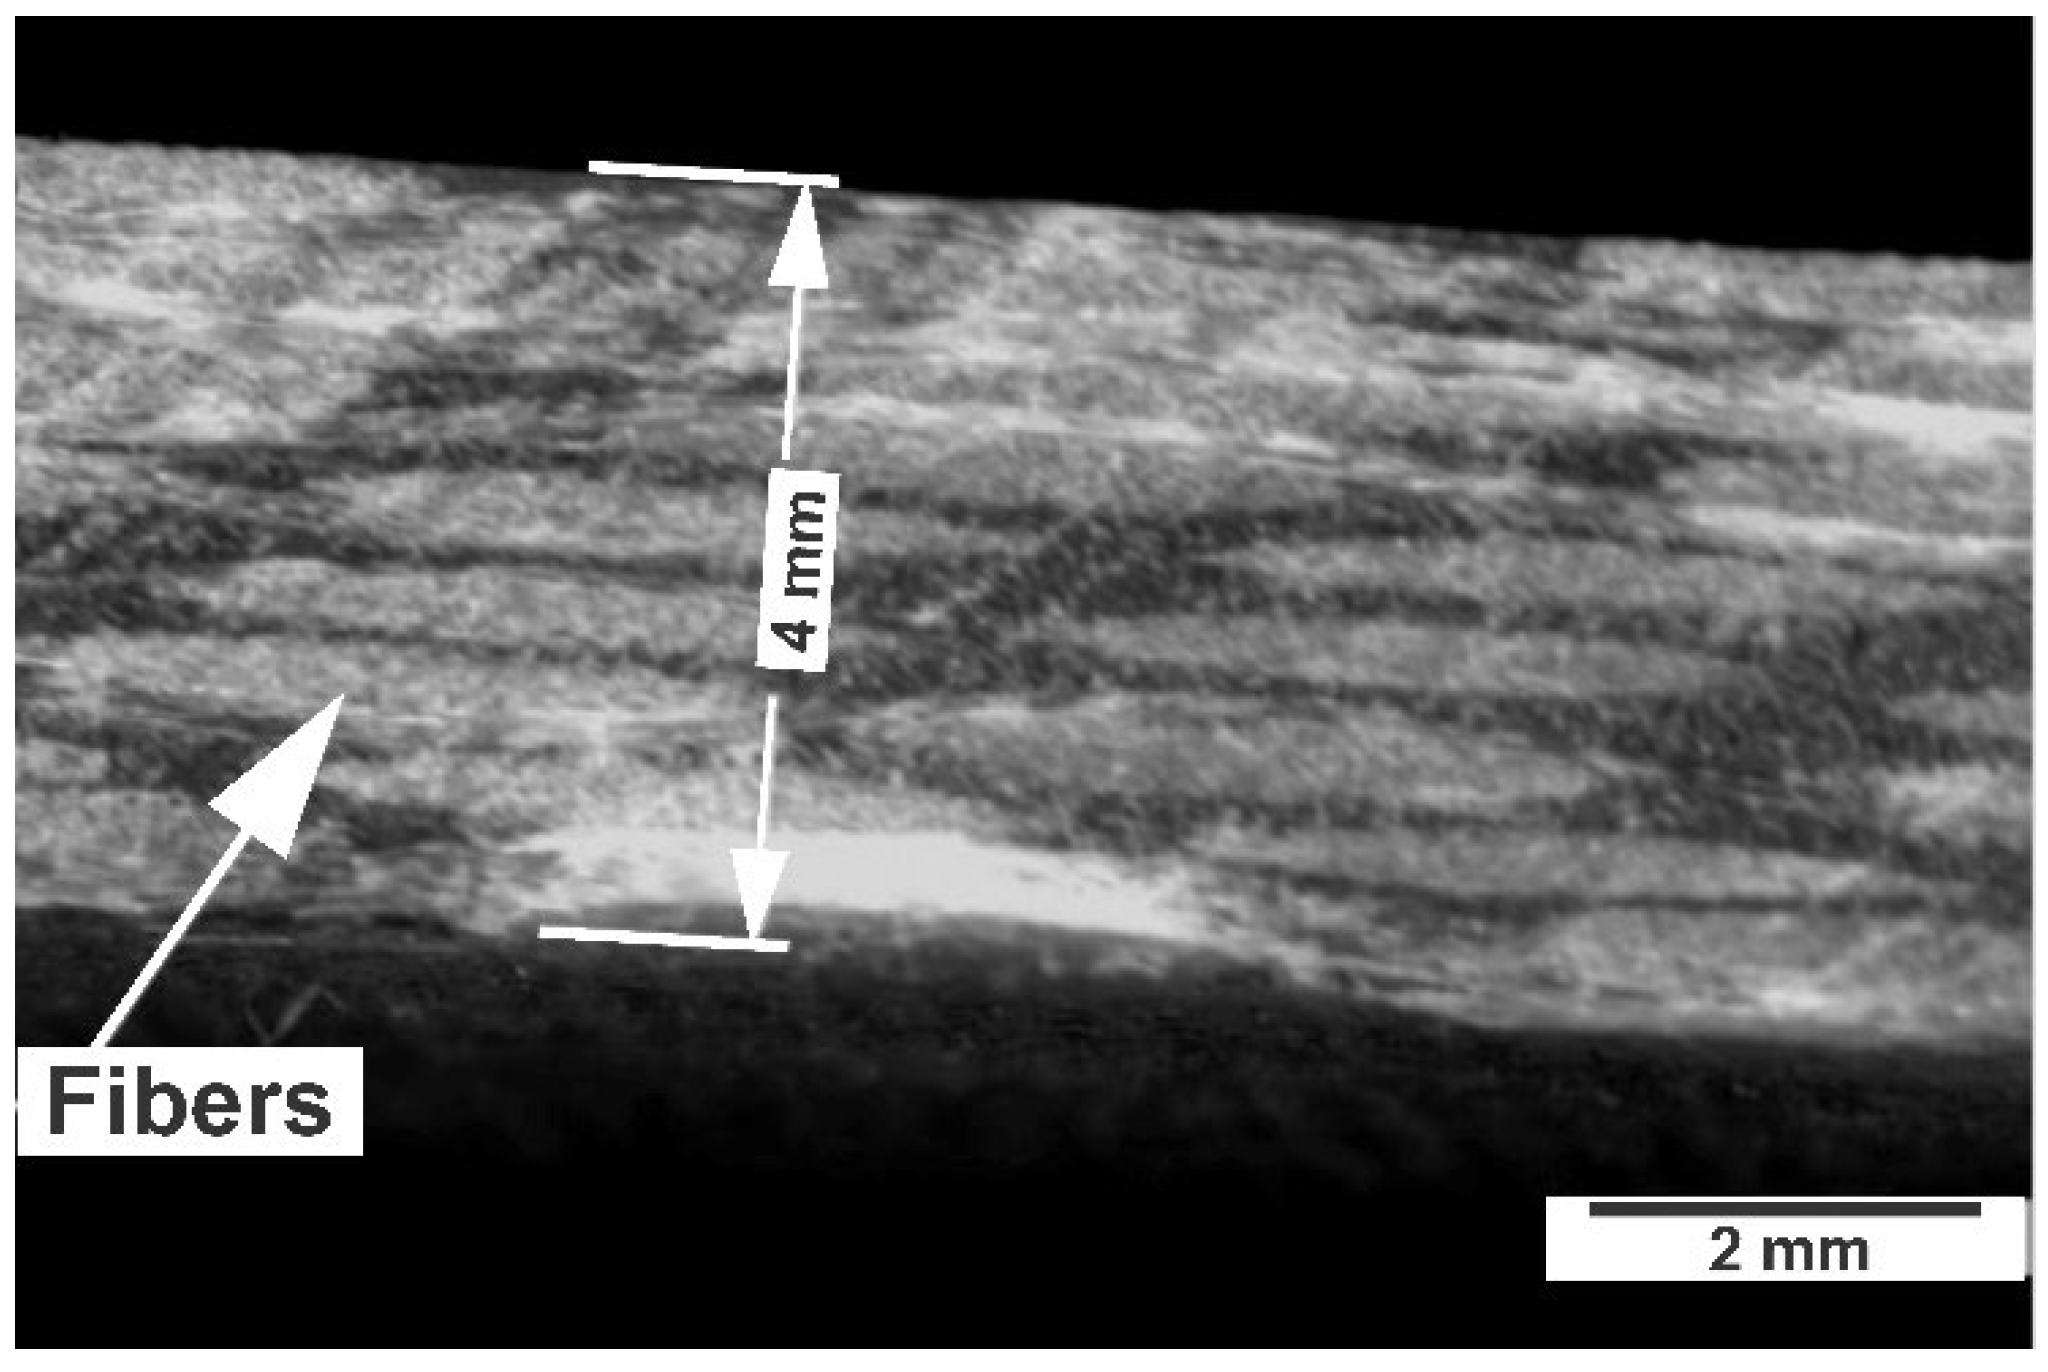
Figure 4.
Erosive particle.
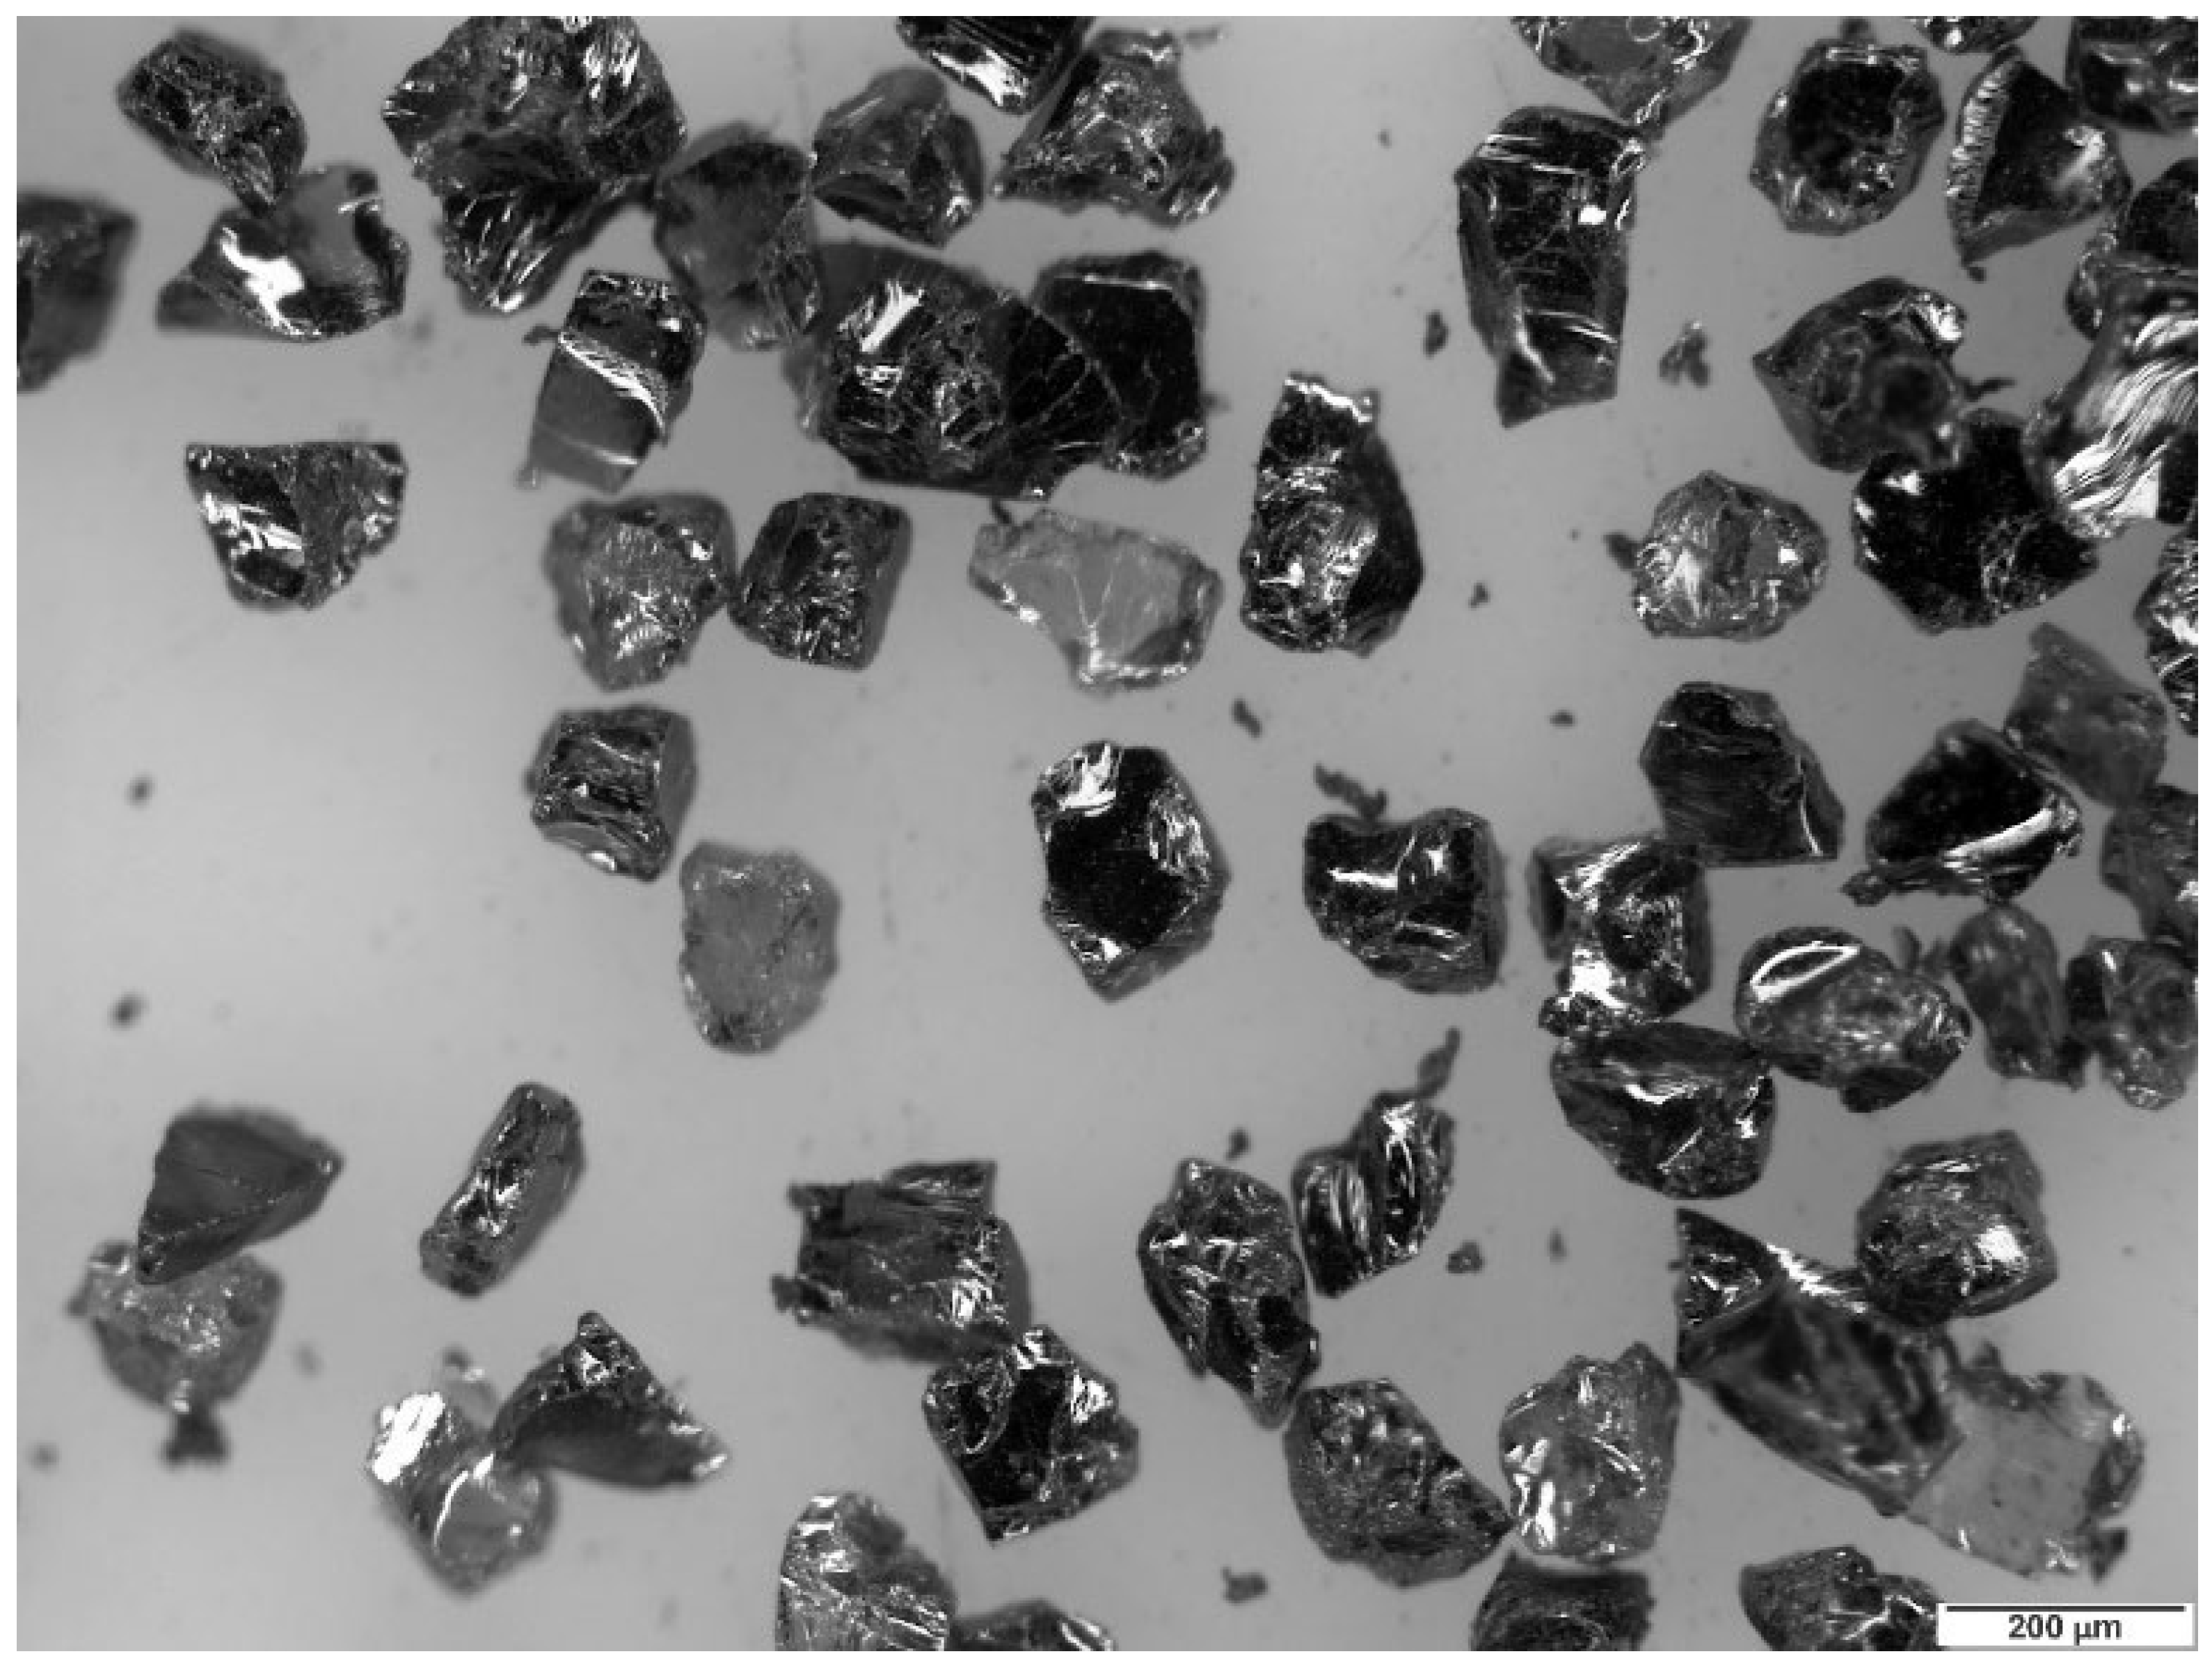
Figure 5.
Erosive particle size distribution.
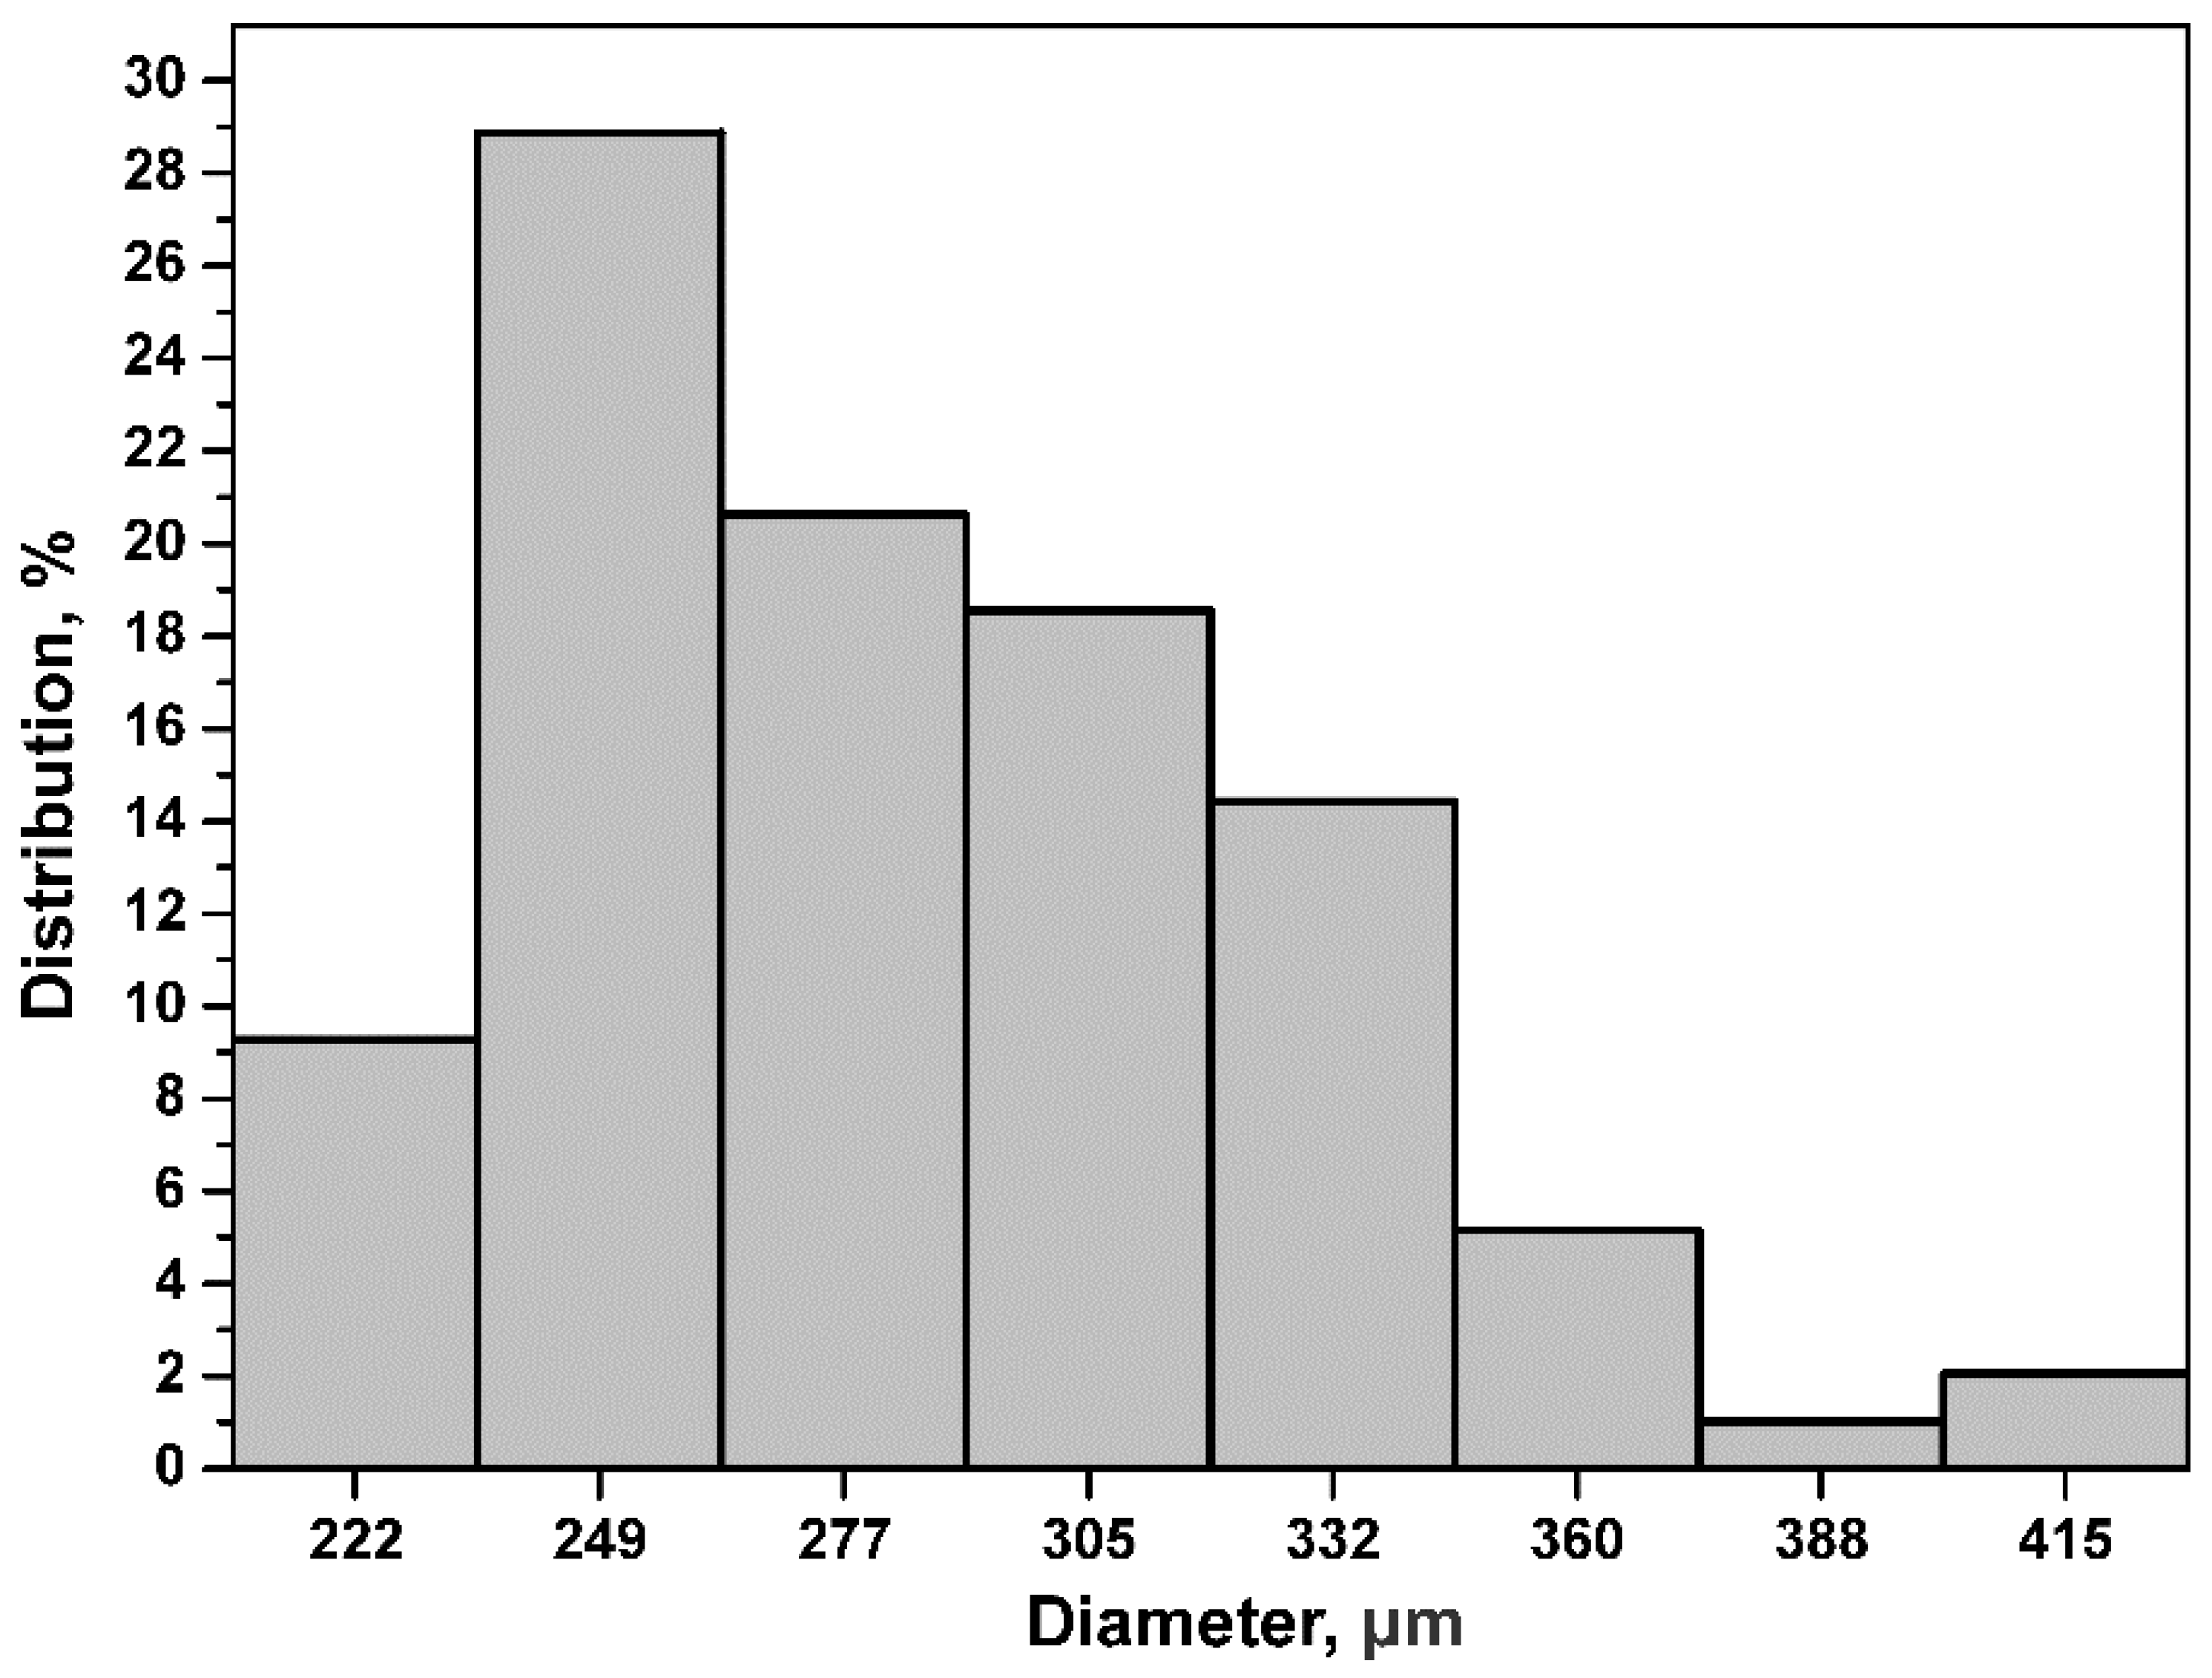
Figure 6.
Schematic diagram of the horizontal erosion test platform, 1: Air compressor; 2: pipe; 3: feedback pipe; 4: erosive particle container; 5: erosion chamber; 6: nozzle; 7: sample; 8: sample holder.
Figure 6.
Schematic diagram of the horizontal erosion test platform, 1: Air compressor; 2: pipe; 3: feedback pipe; 4: erosive particle container; 5: erosion chamber; 6: nozzle; 7: sample; 8: sample holder.
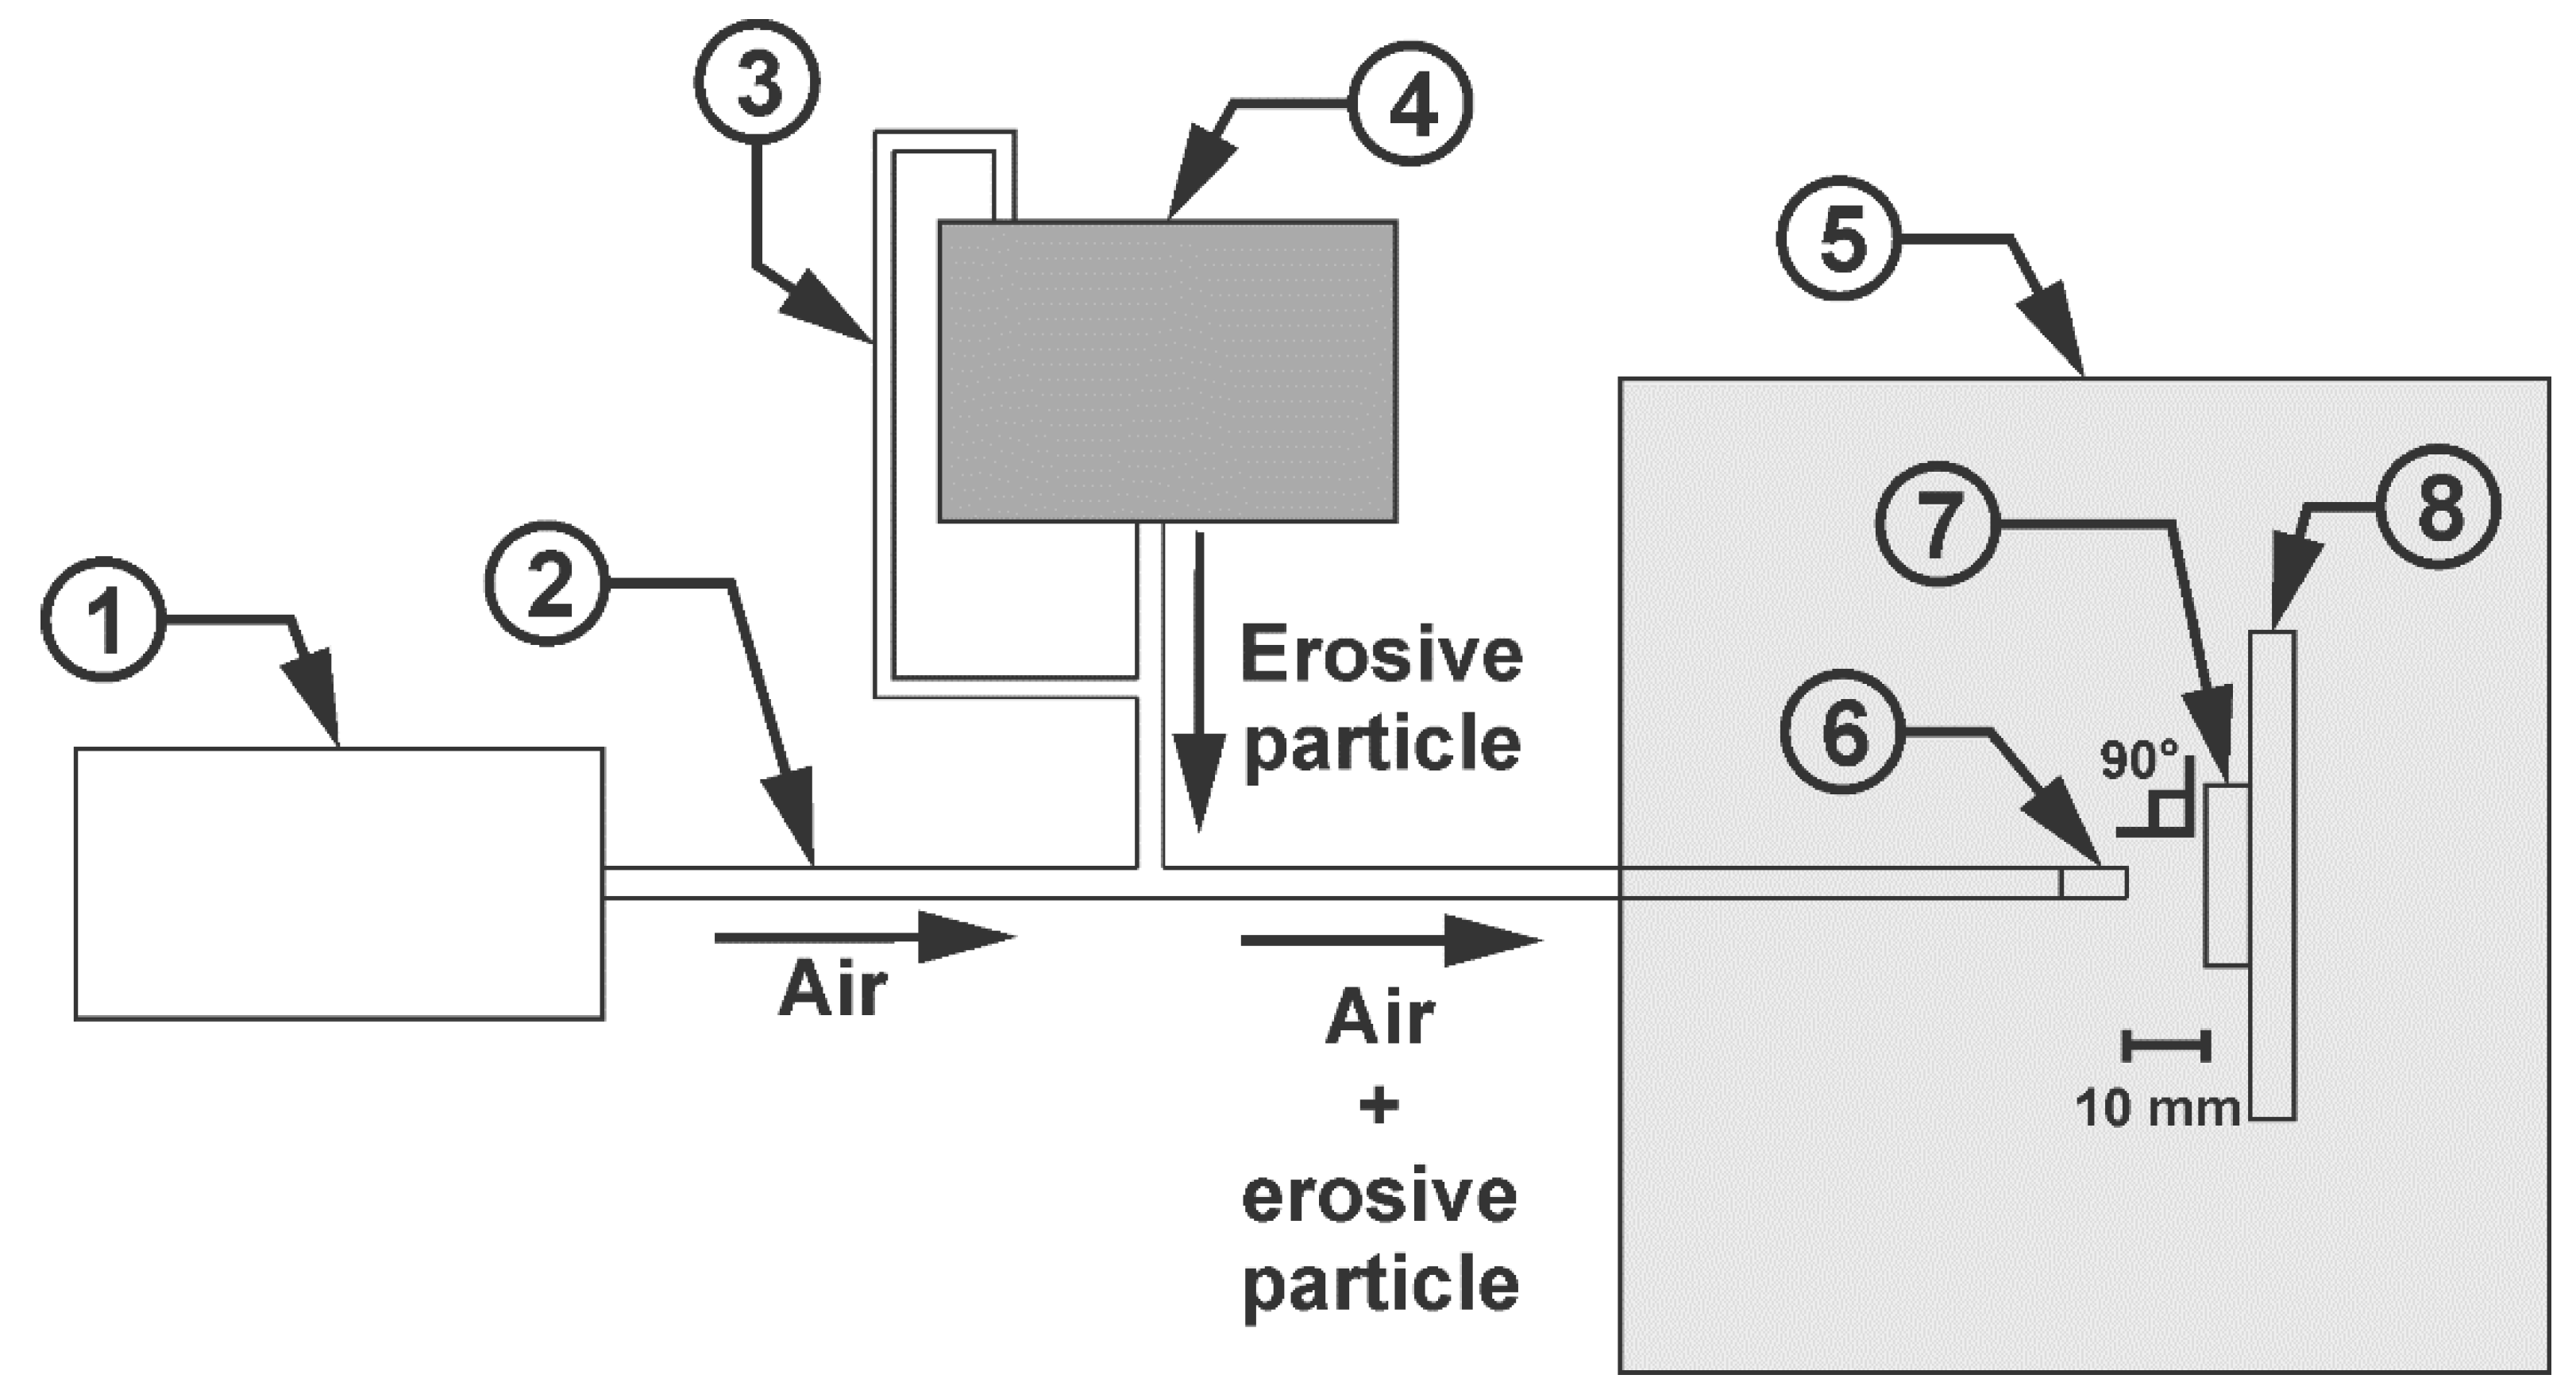
Figure 7.
FTIR Spectrum and magnification.
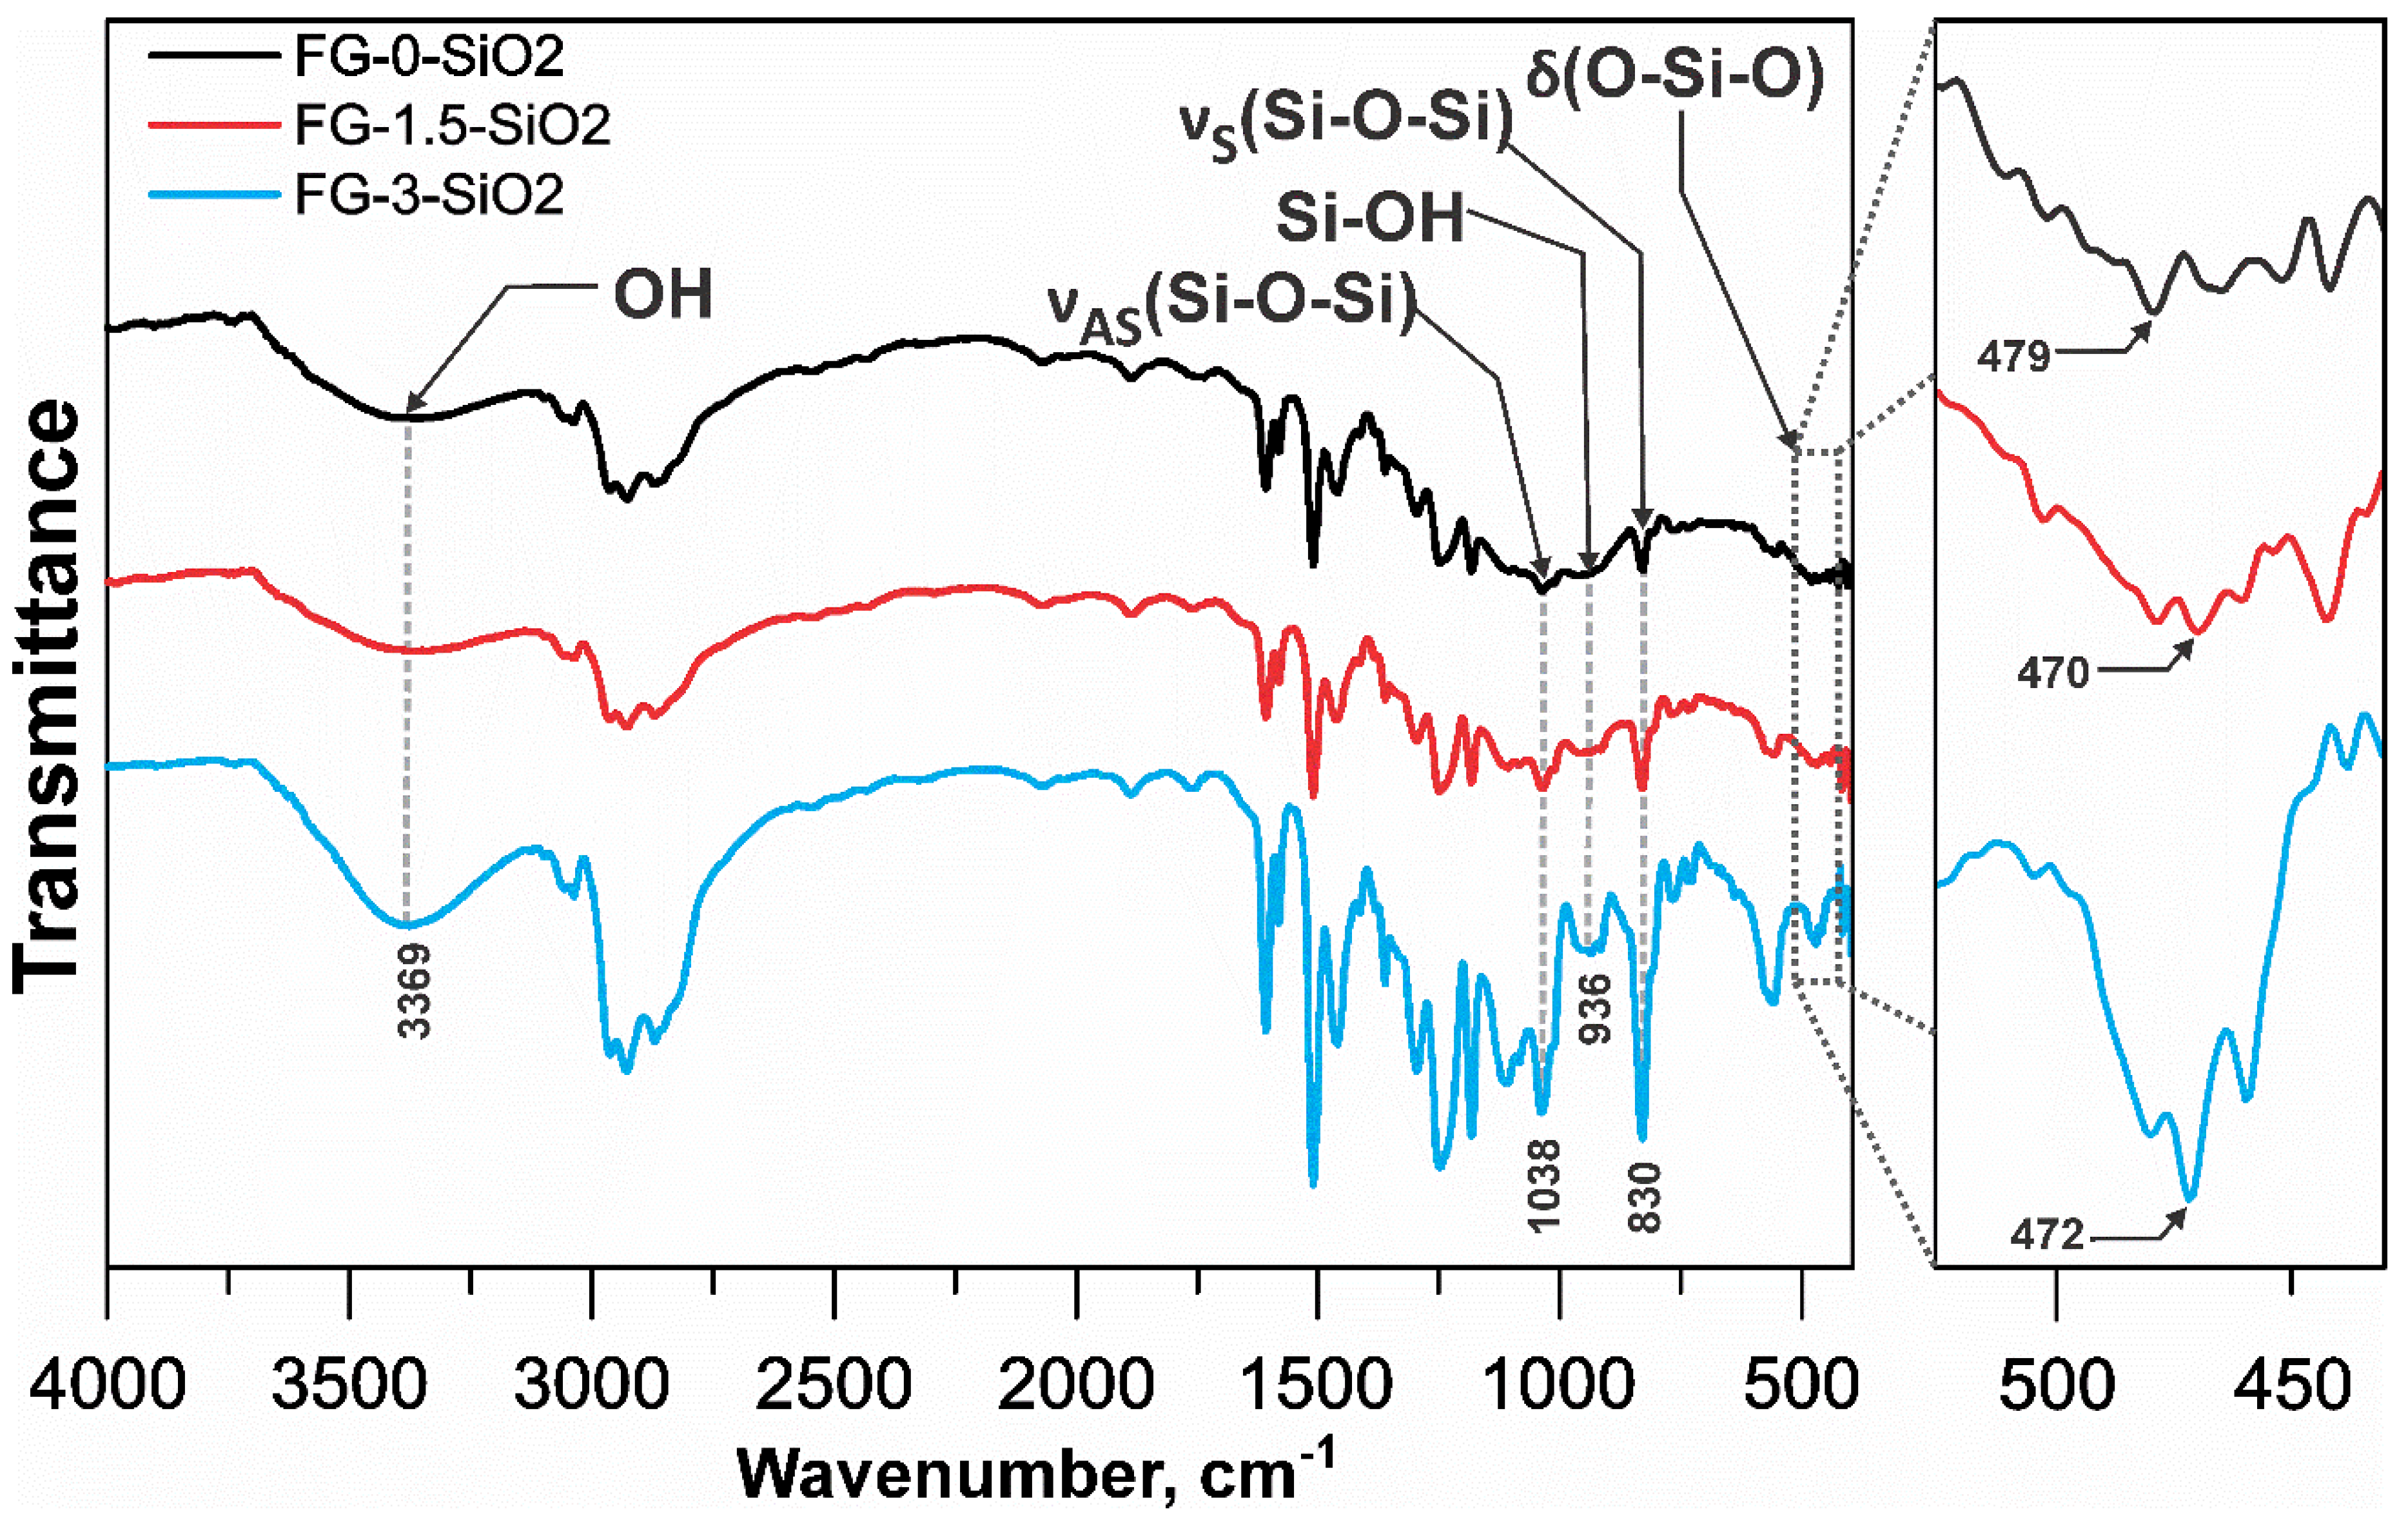
Figure 8.
GIXRD pattern.
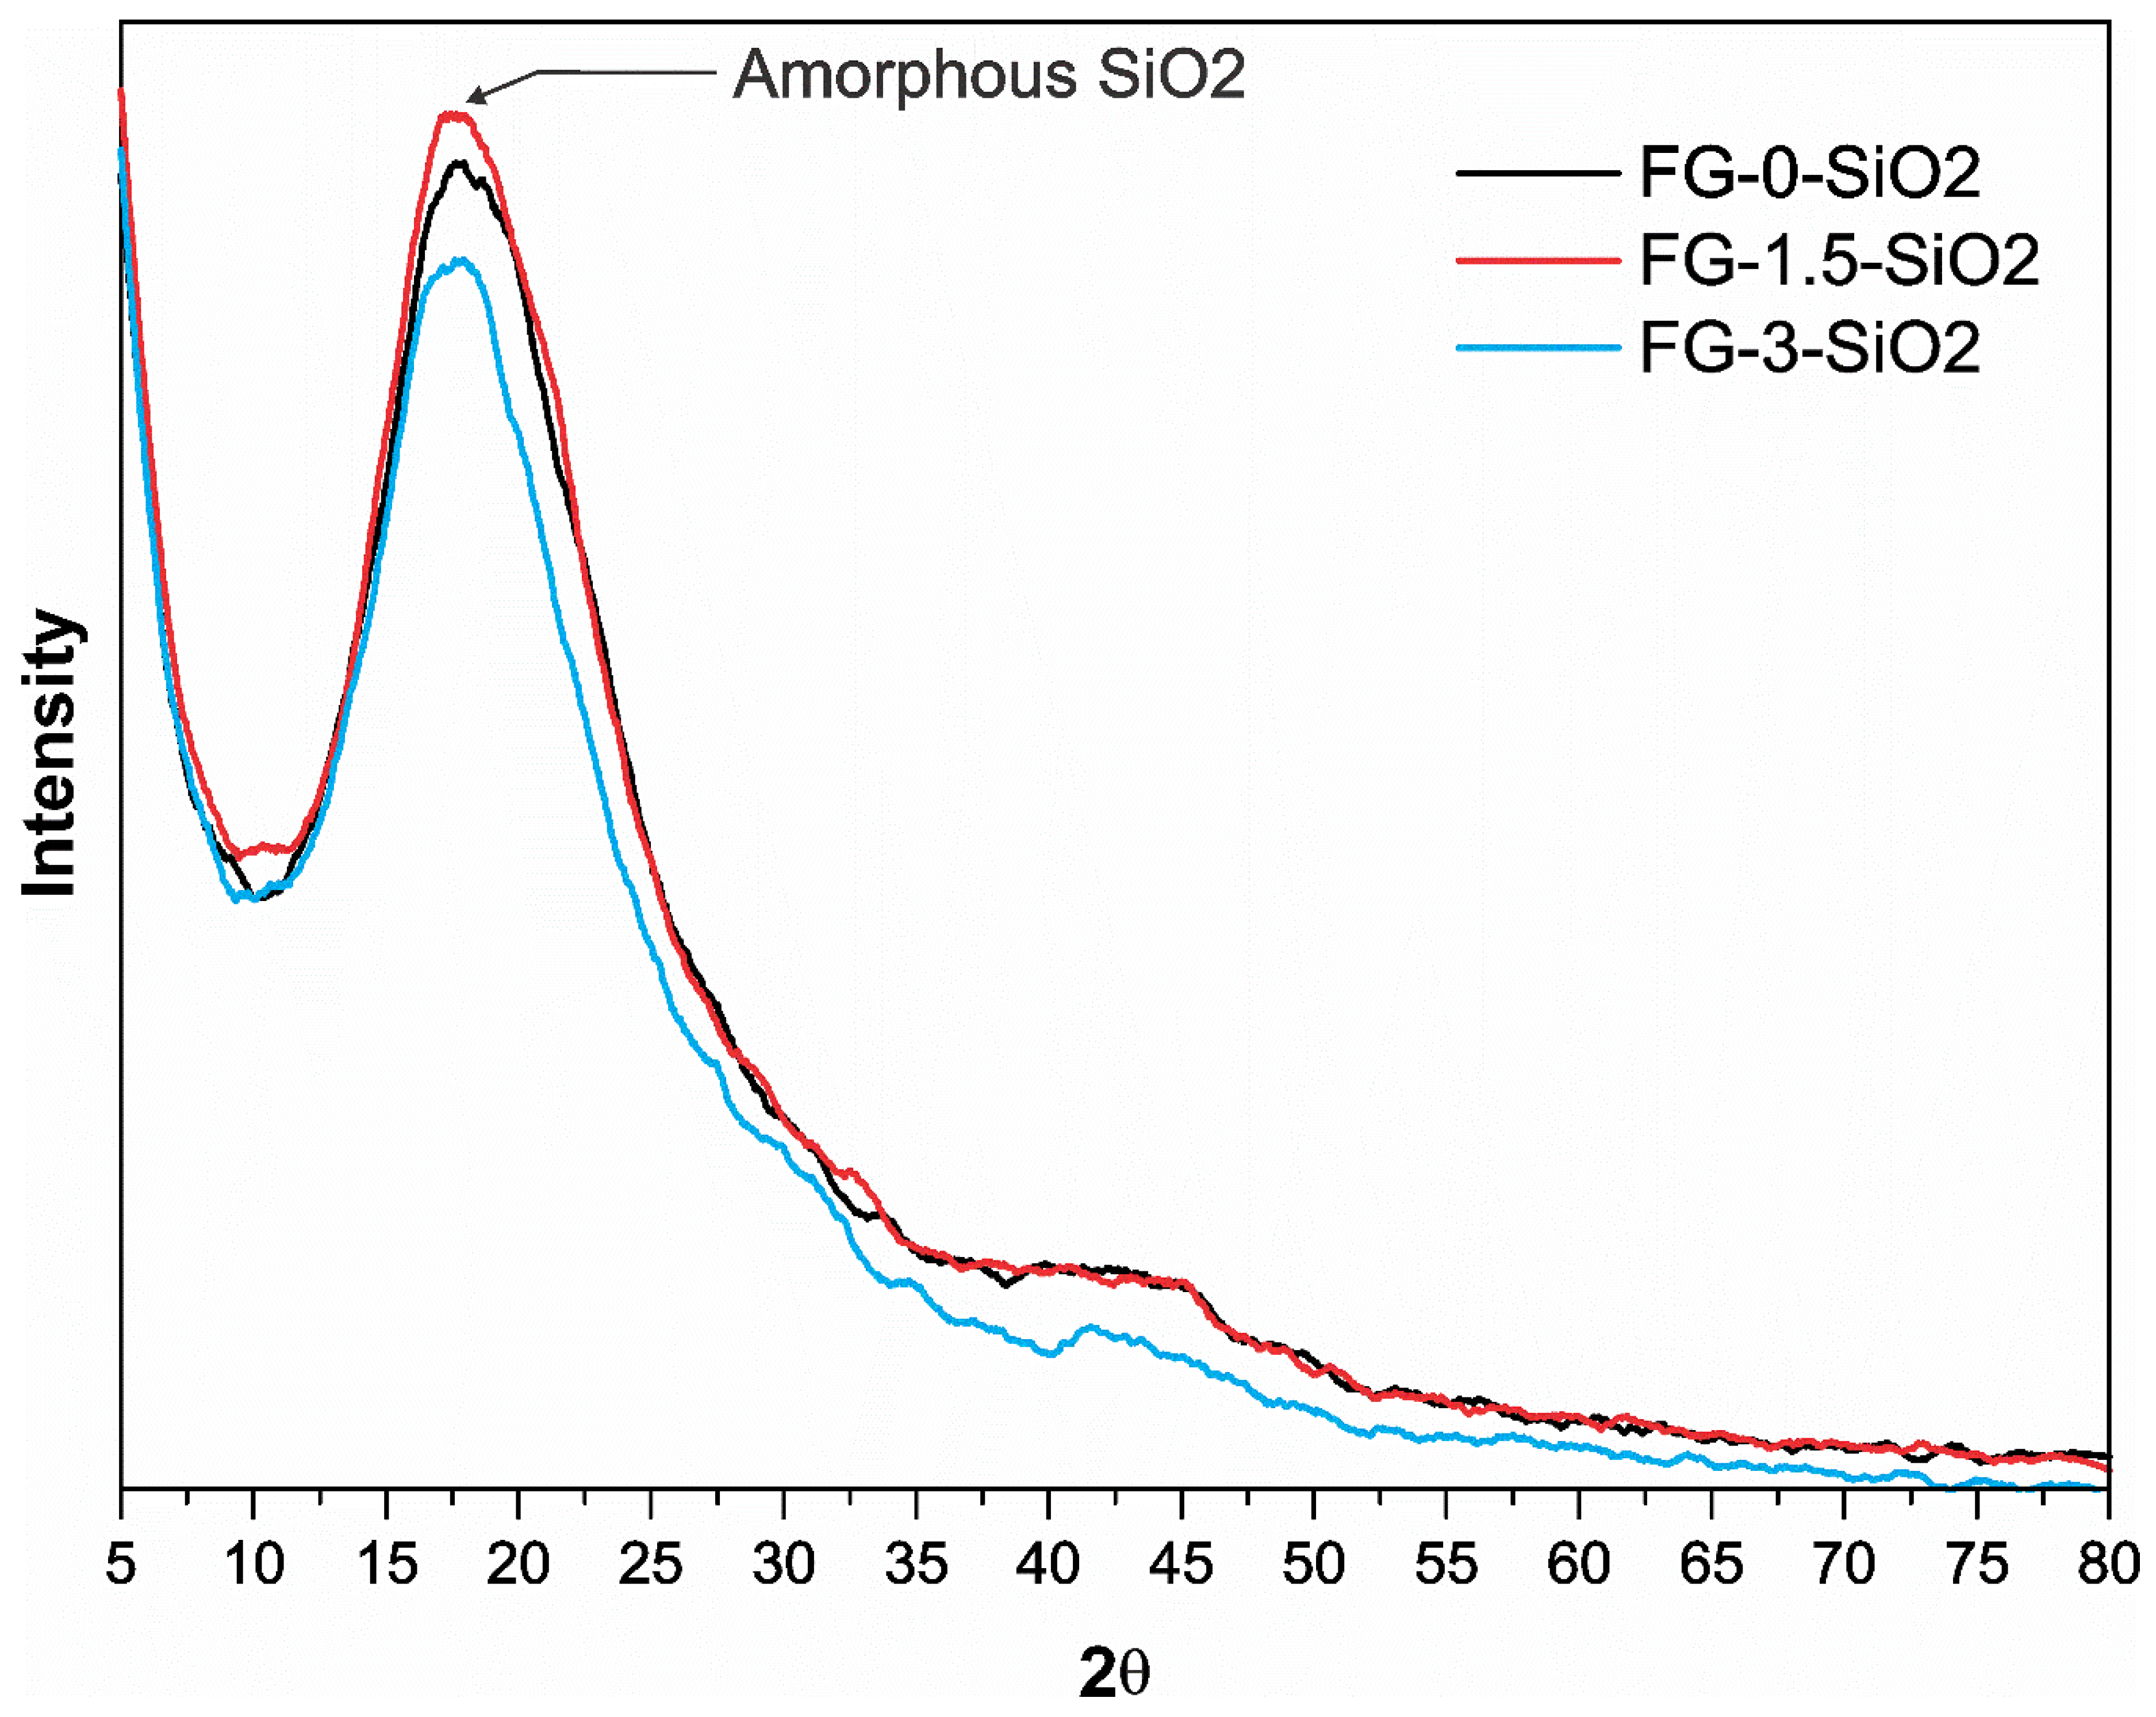
Figure 9.
SEM micrographs of a) FG-0-SiO2, b) FG-1.5-SiO2 and c) FG-3-SiO2.
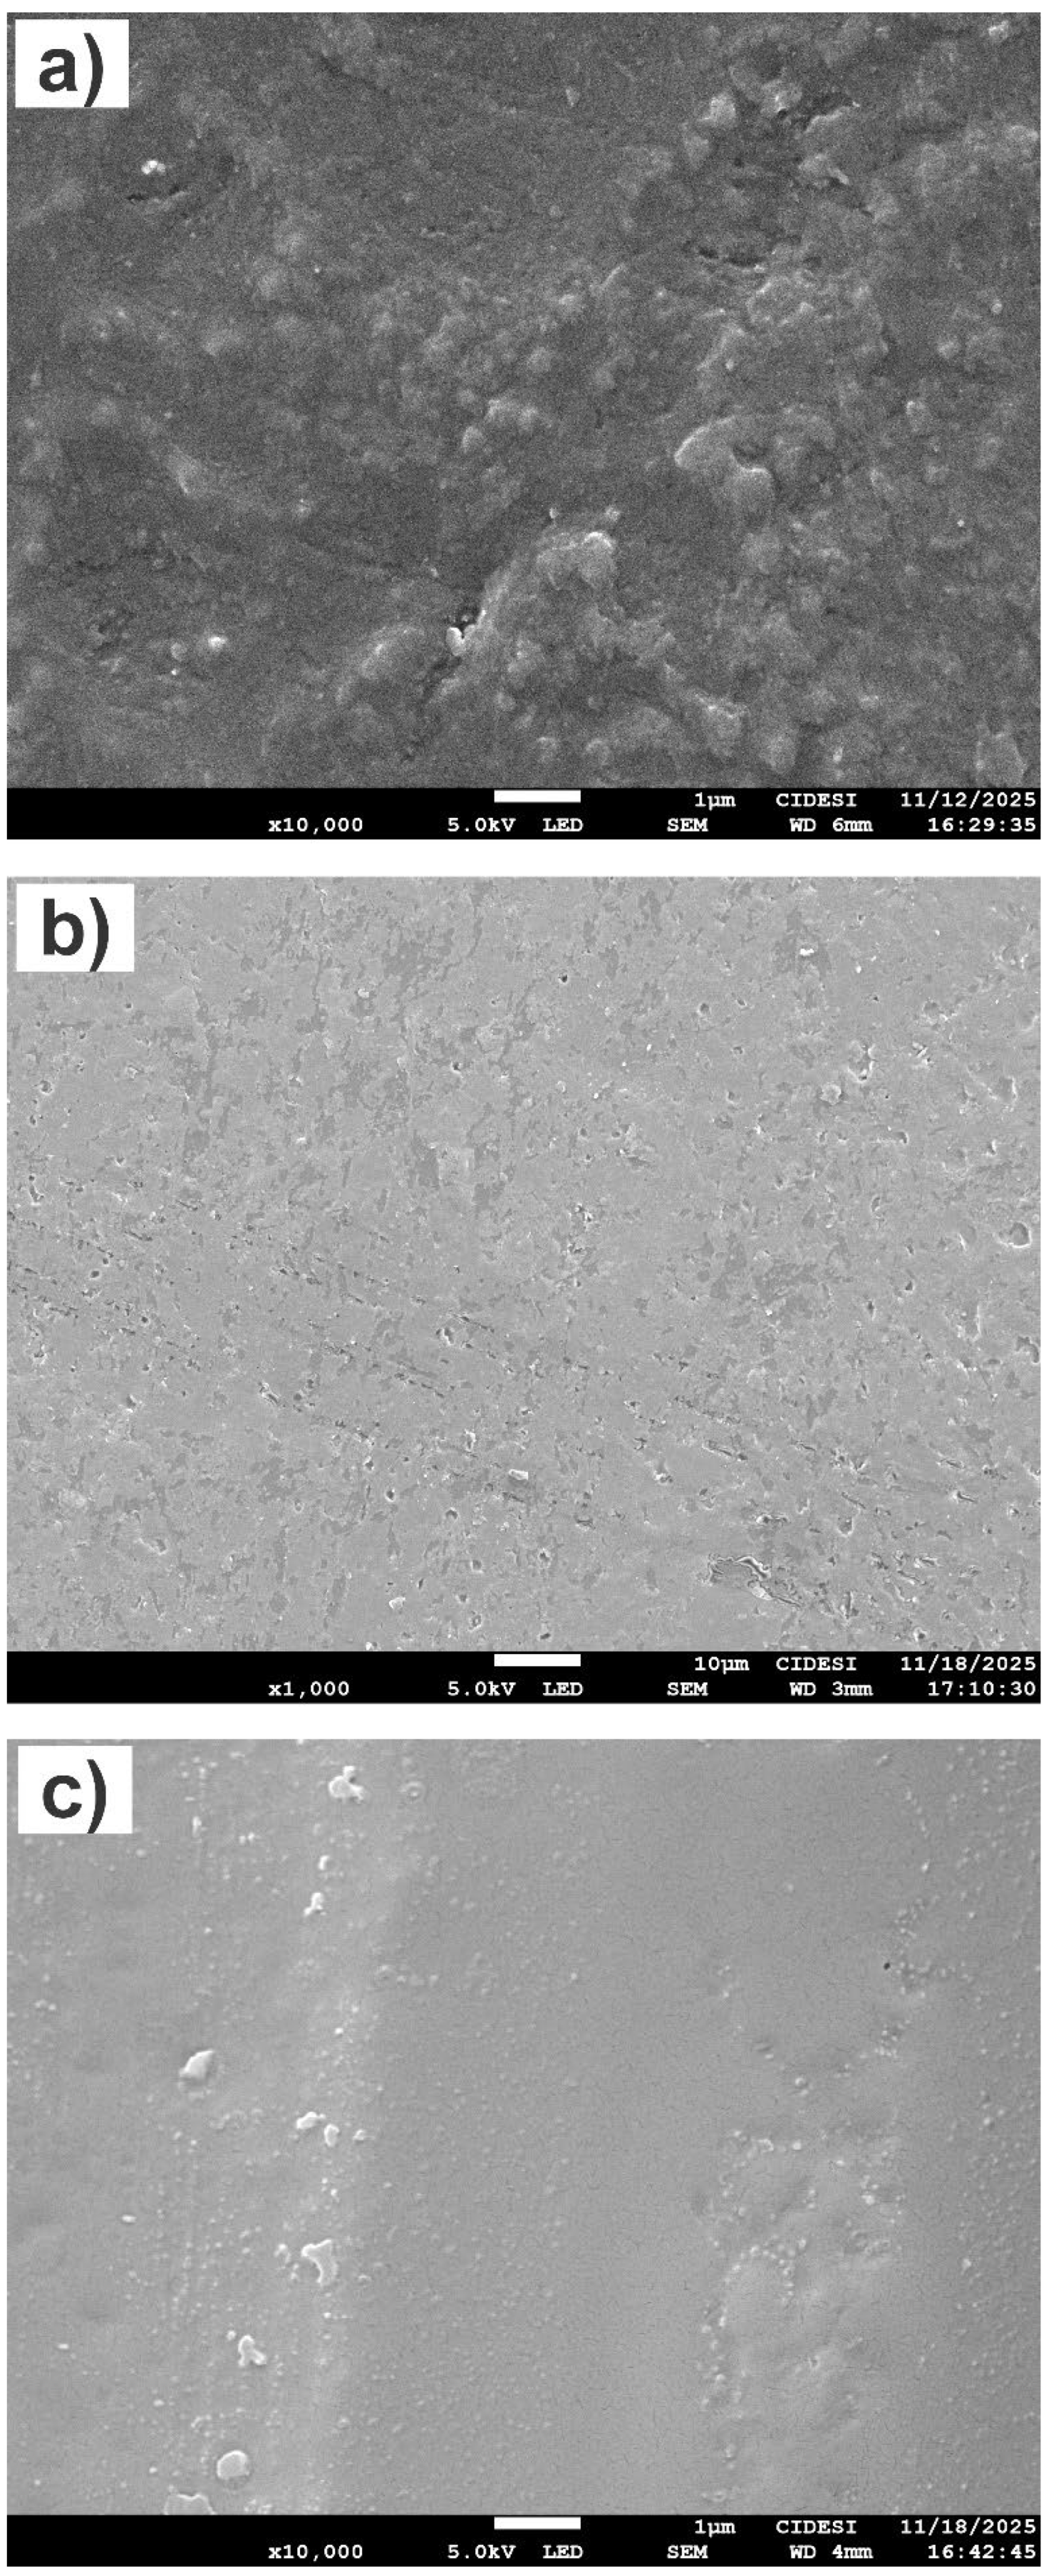
Figure 10.
Mass loss over time.
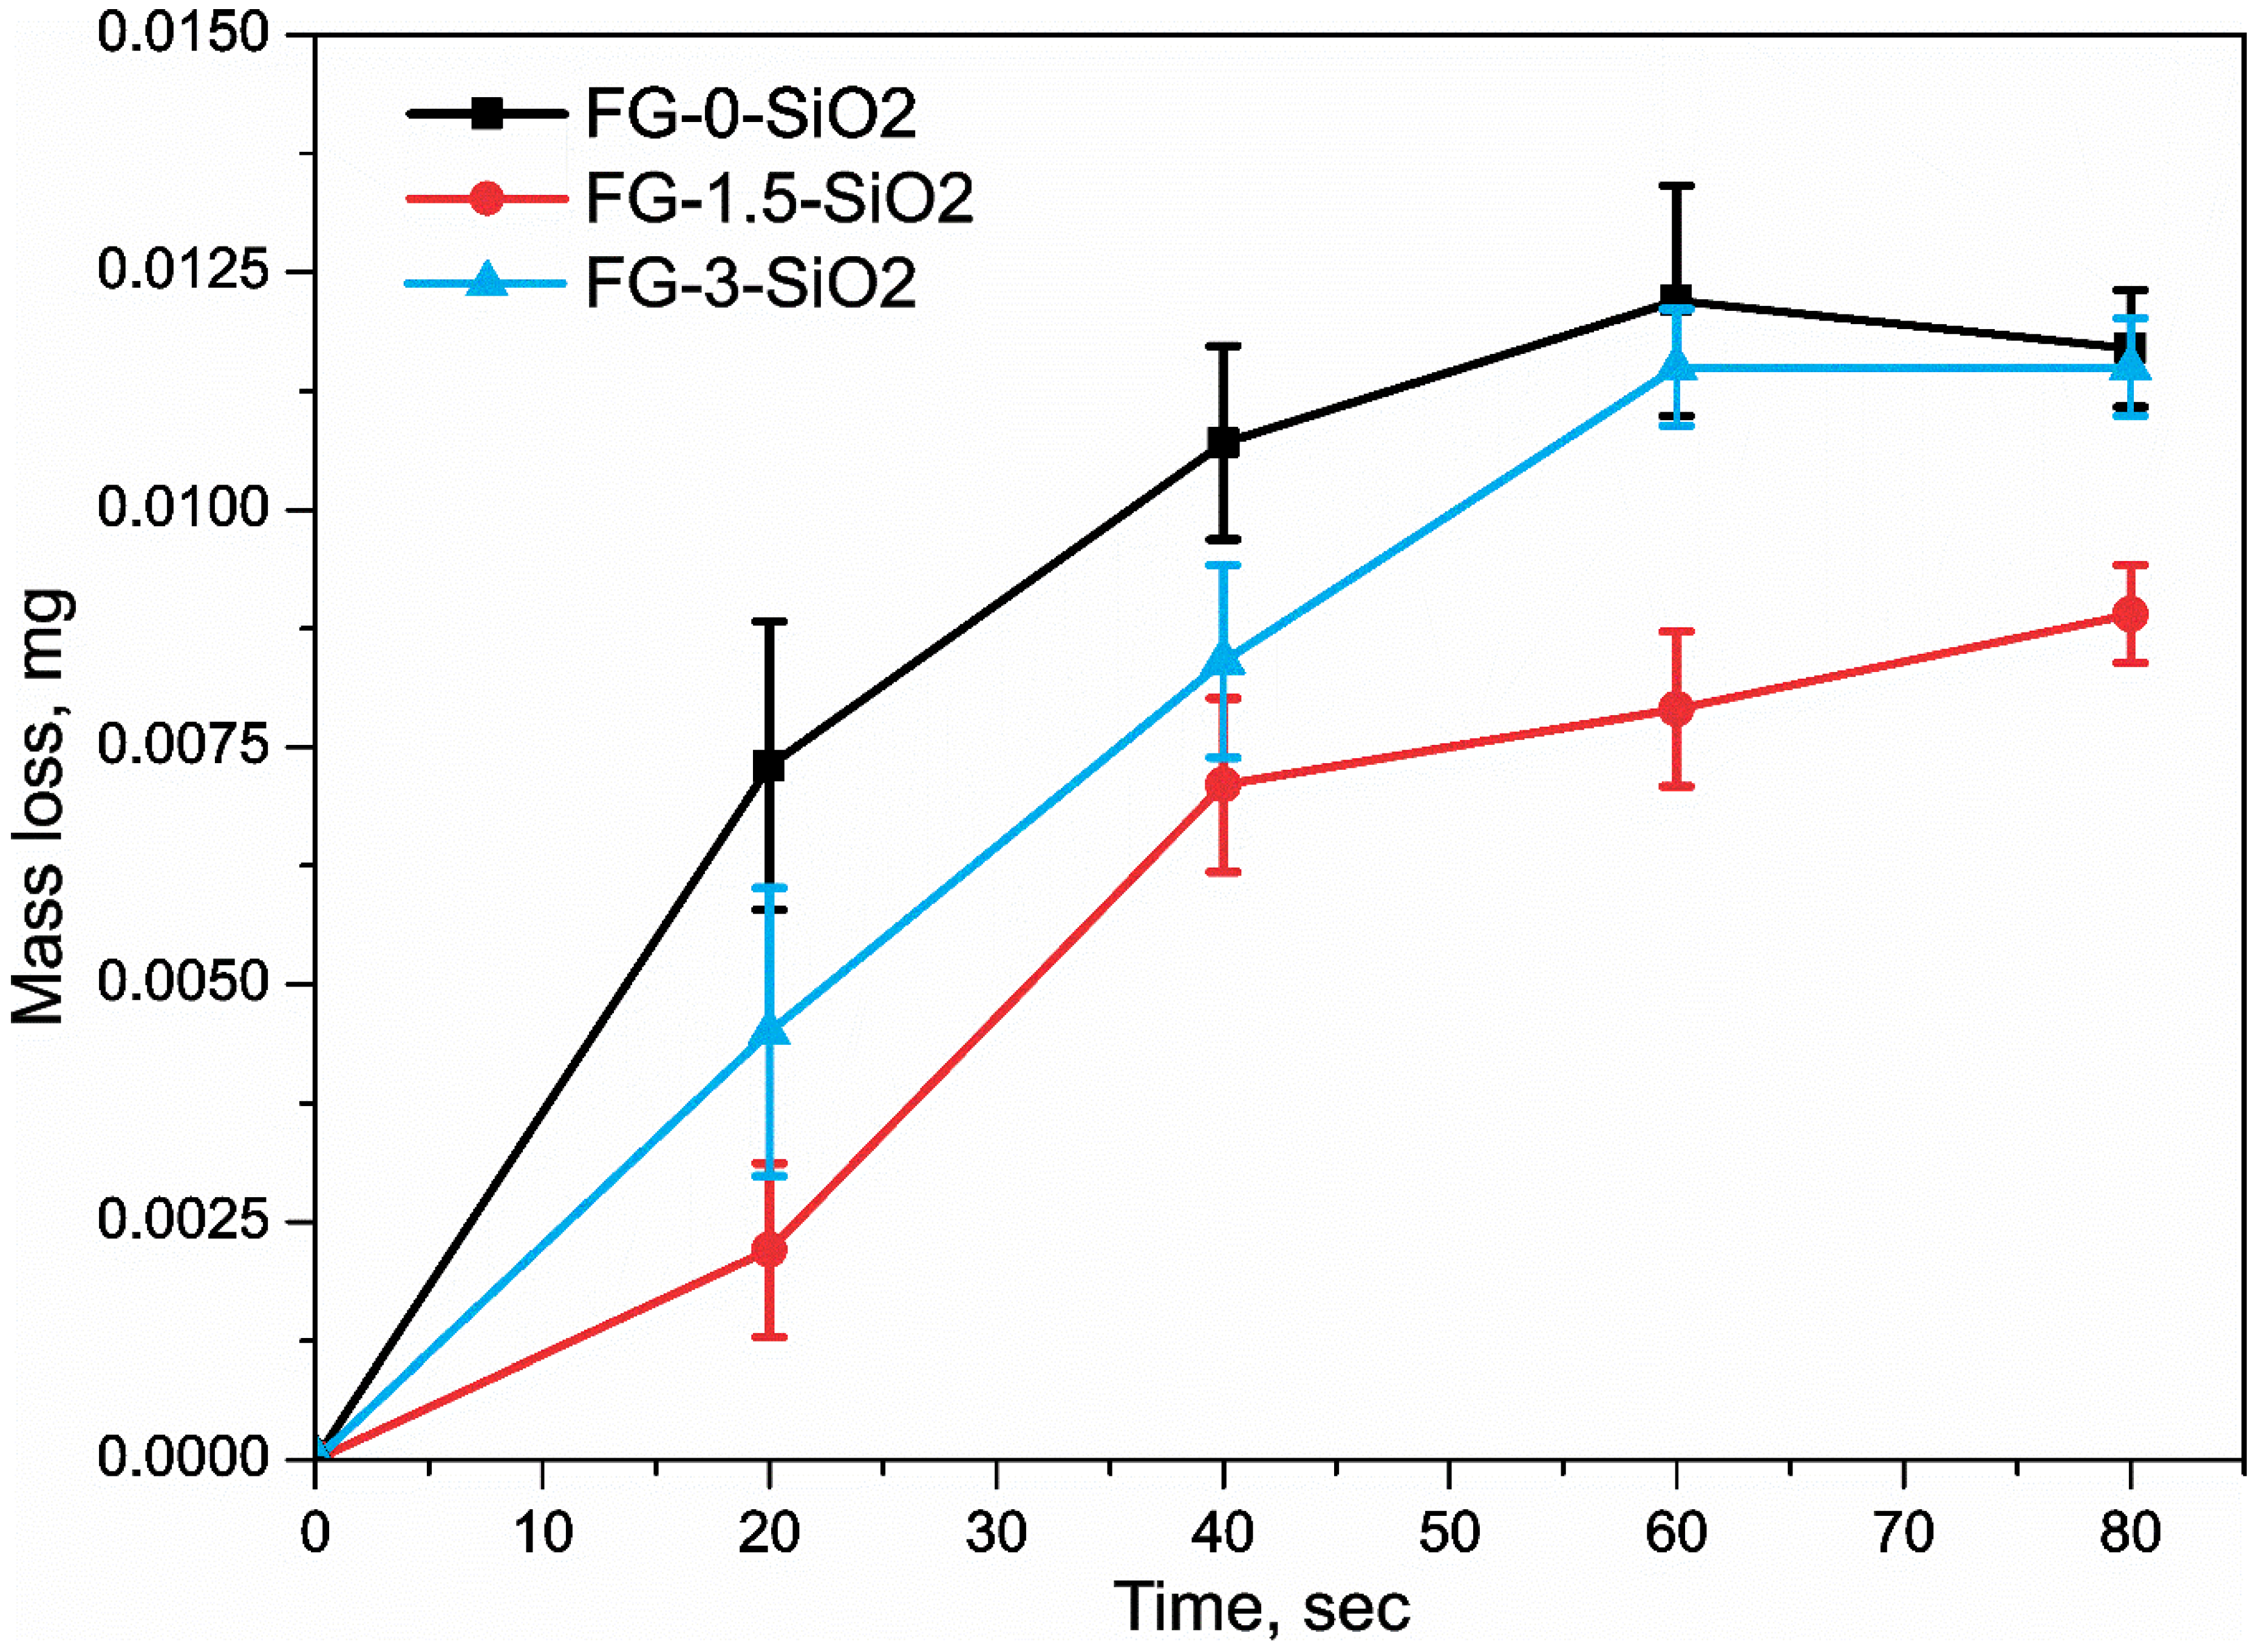
Figure 11.
Wear zone and contrast image.
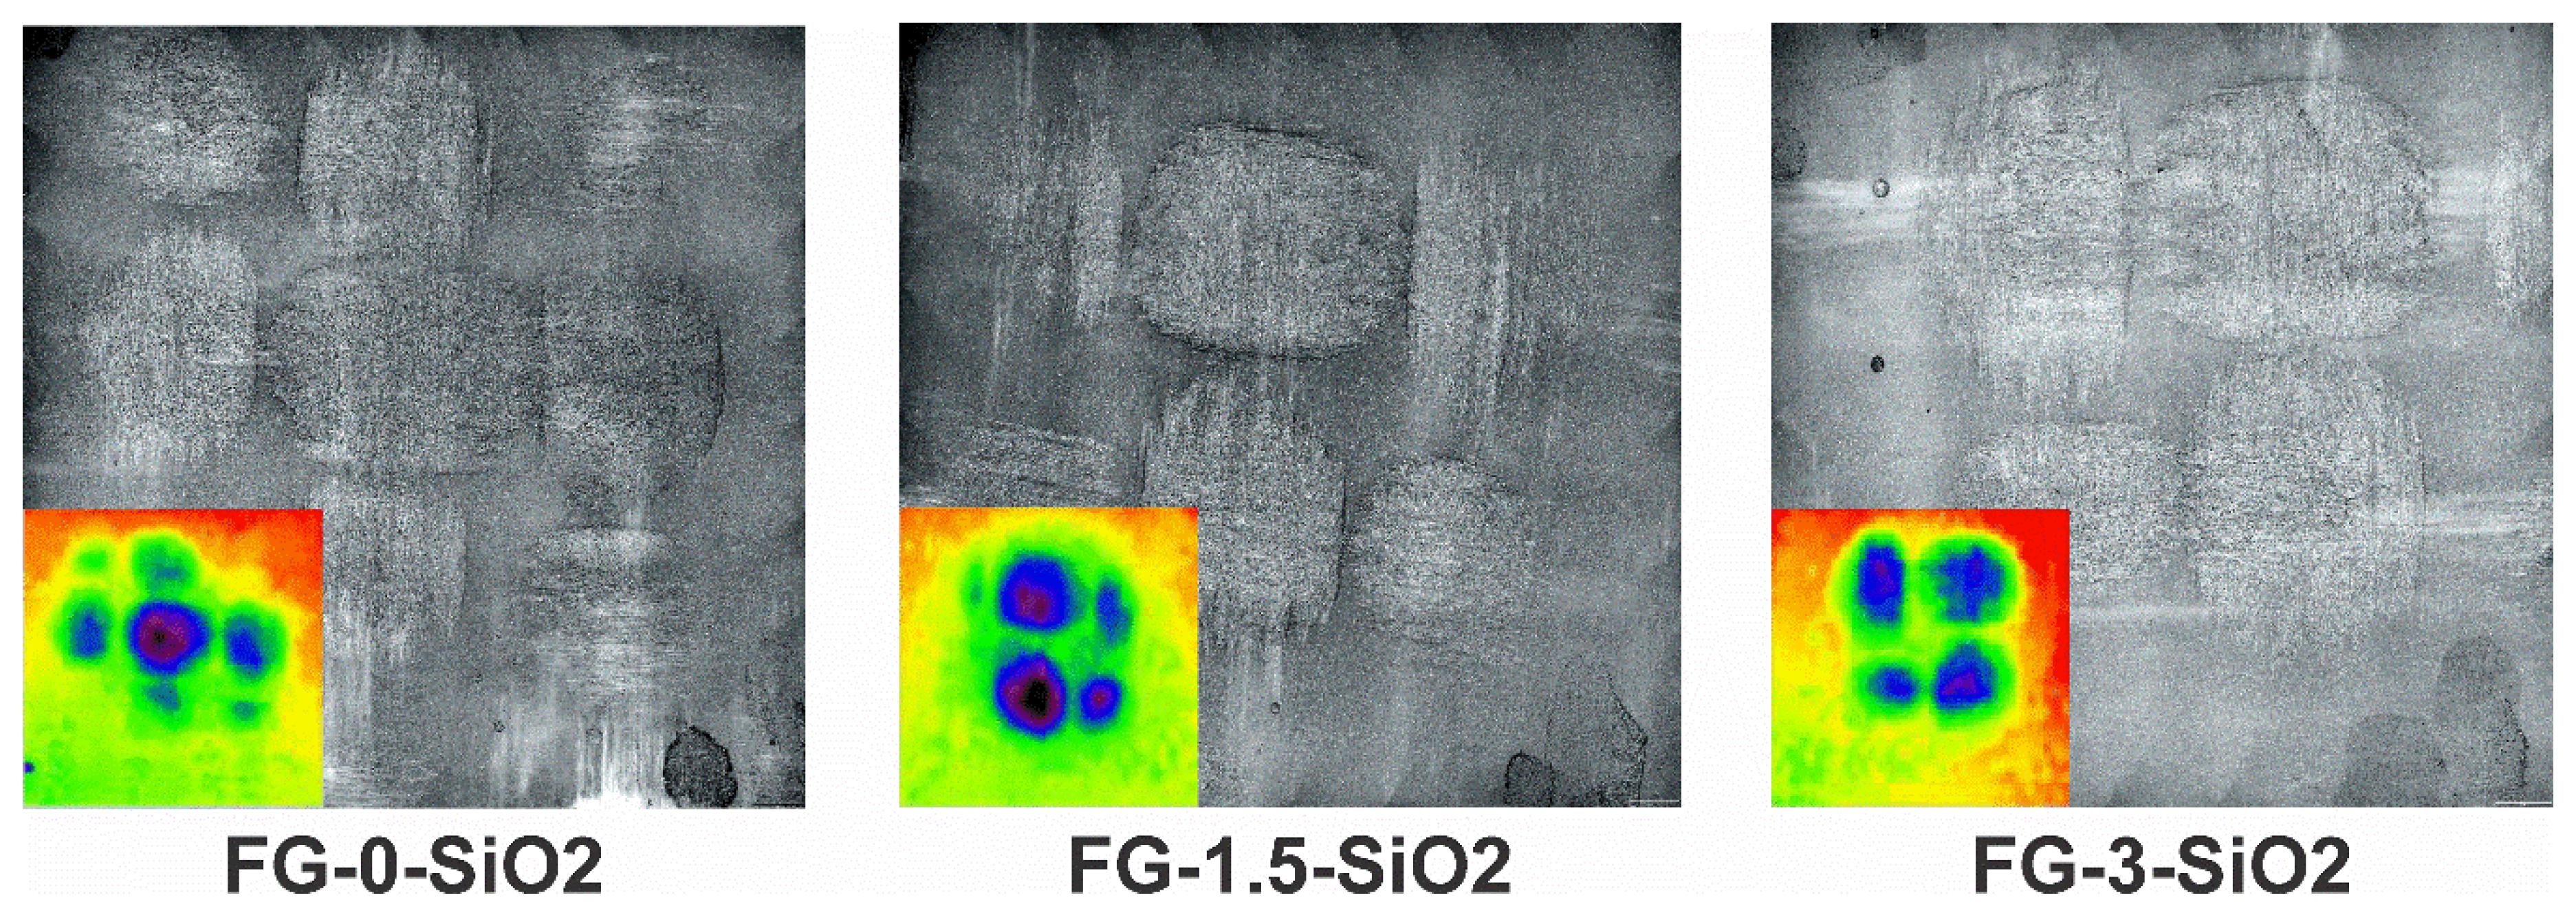
Figure 12.
a) Accumulated mass loss and b) erosion rate.
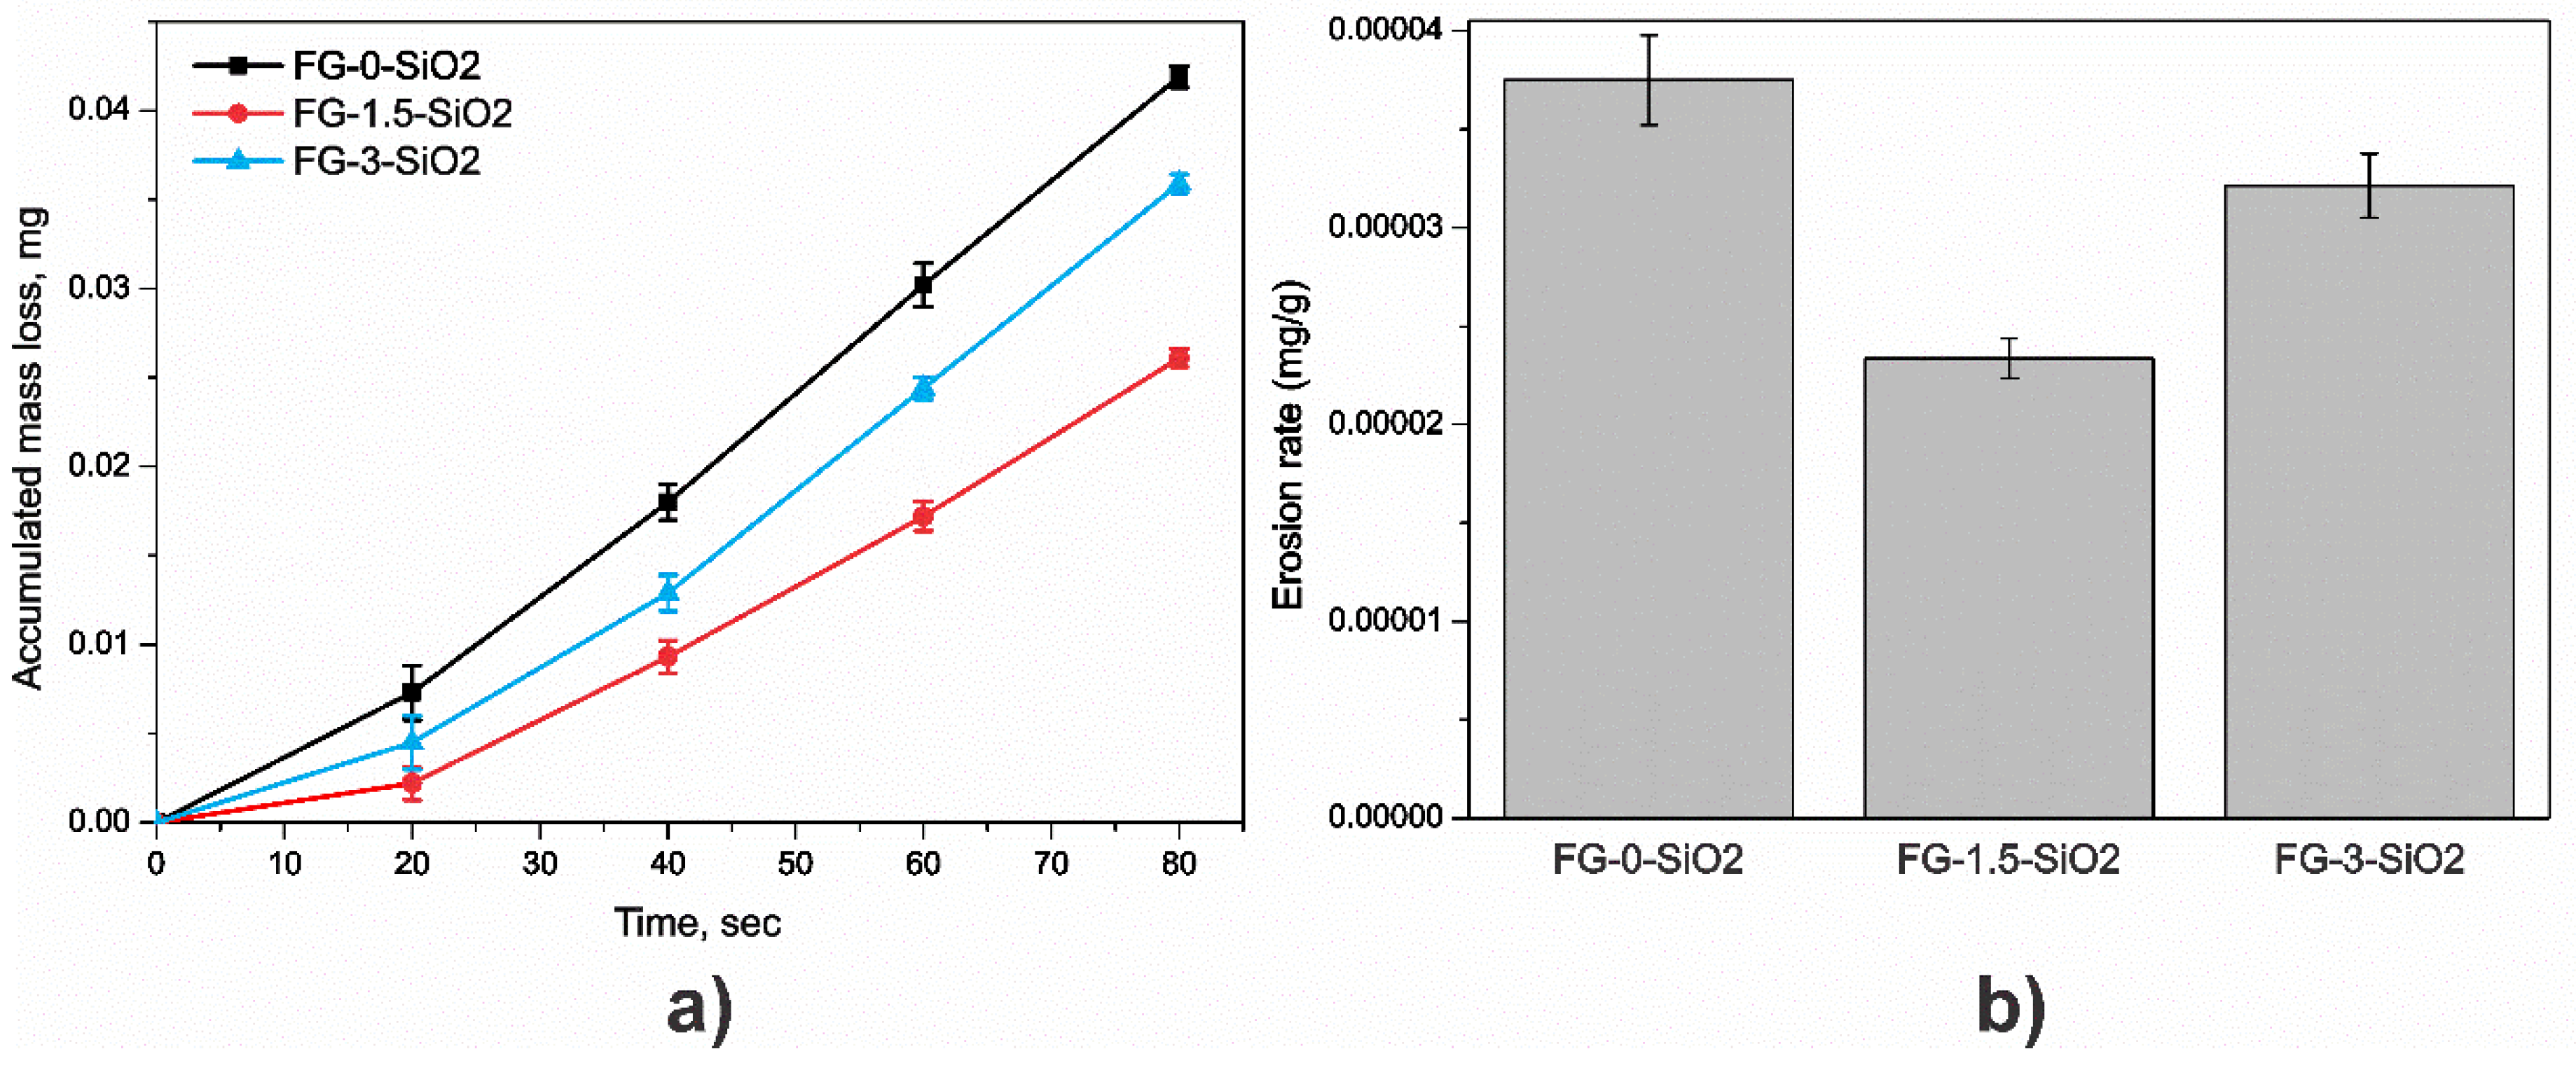
Figure 13.
Perfilometry.
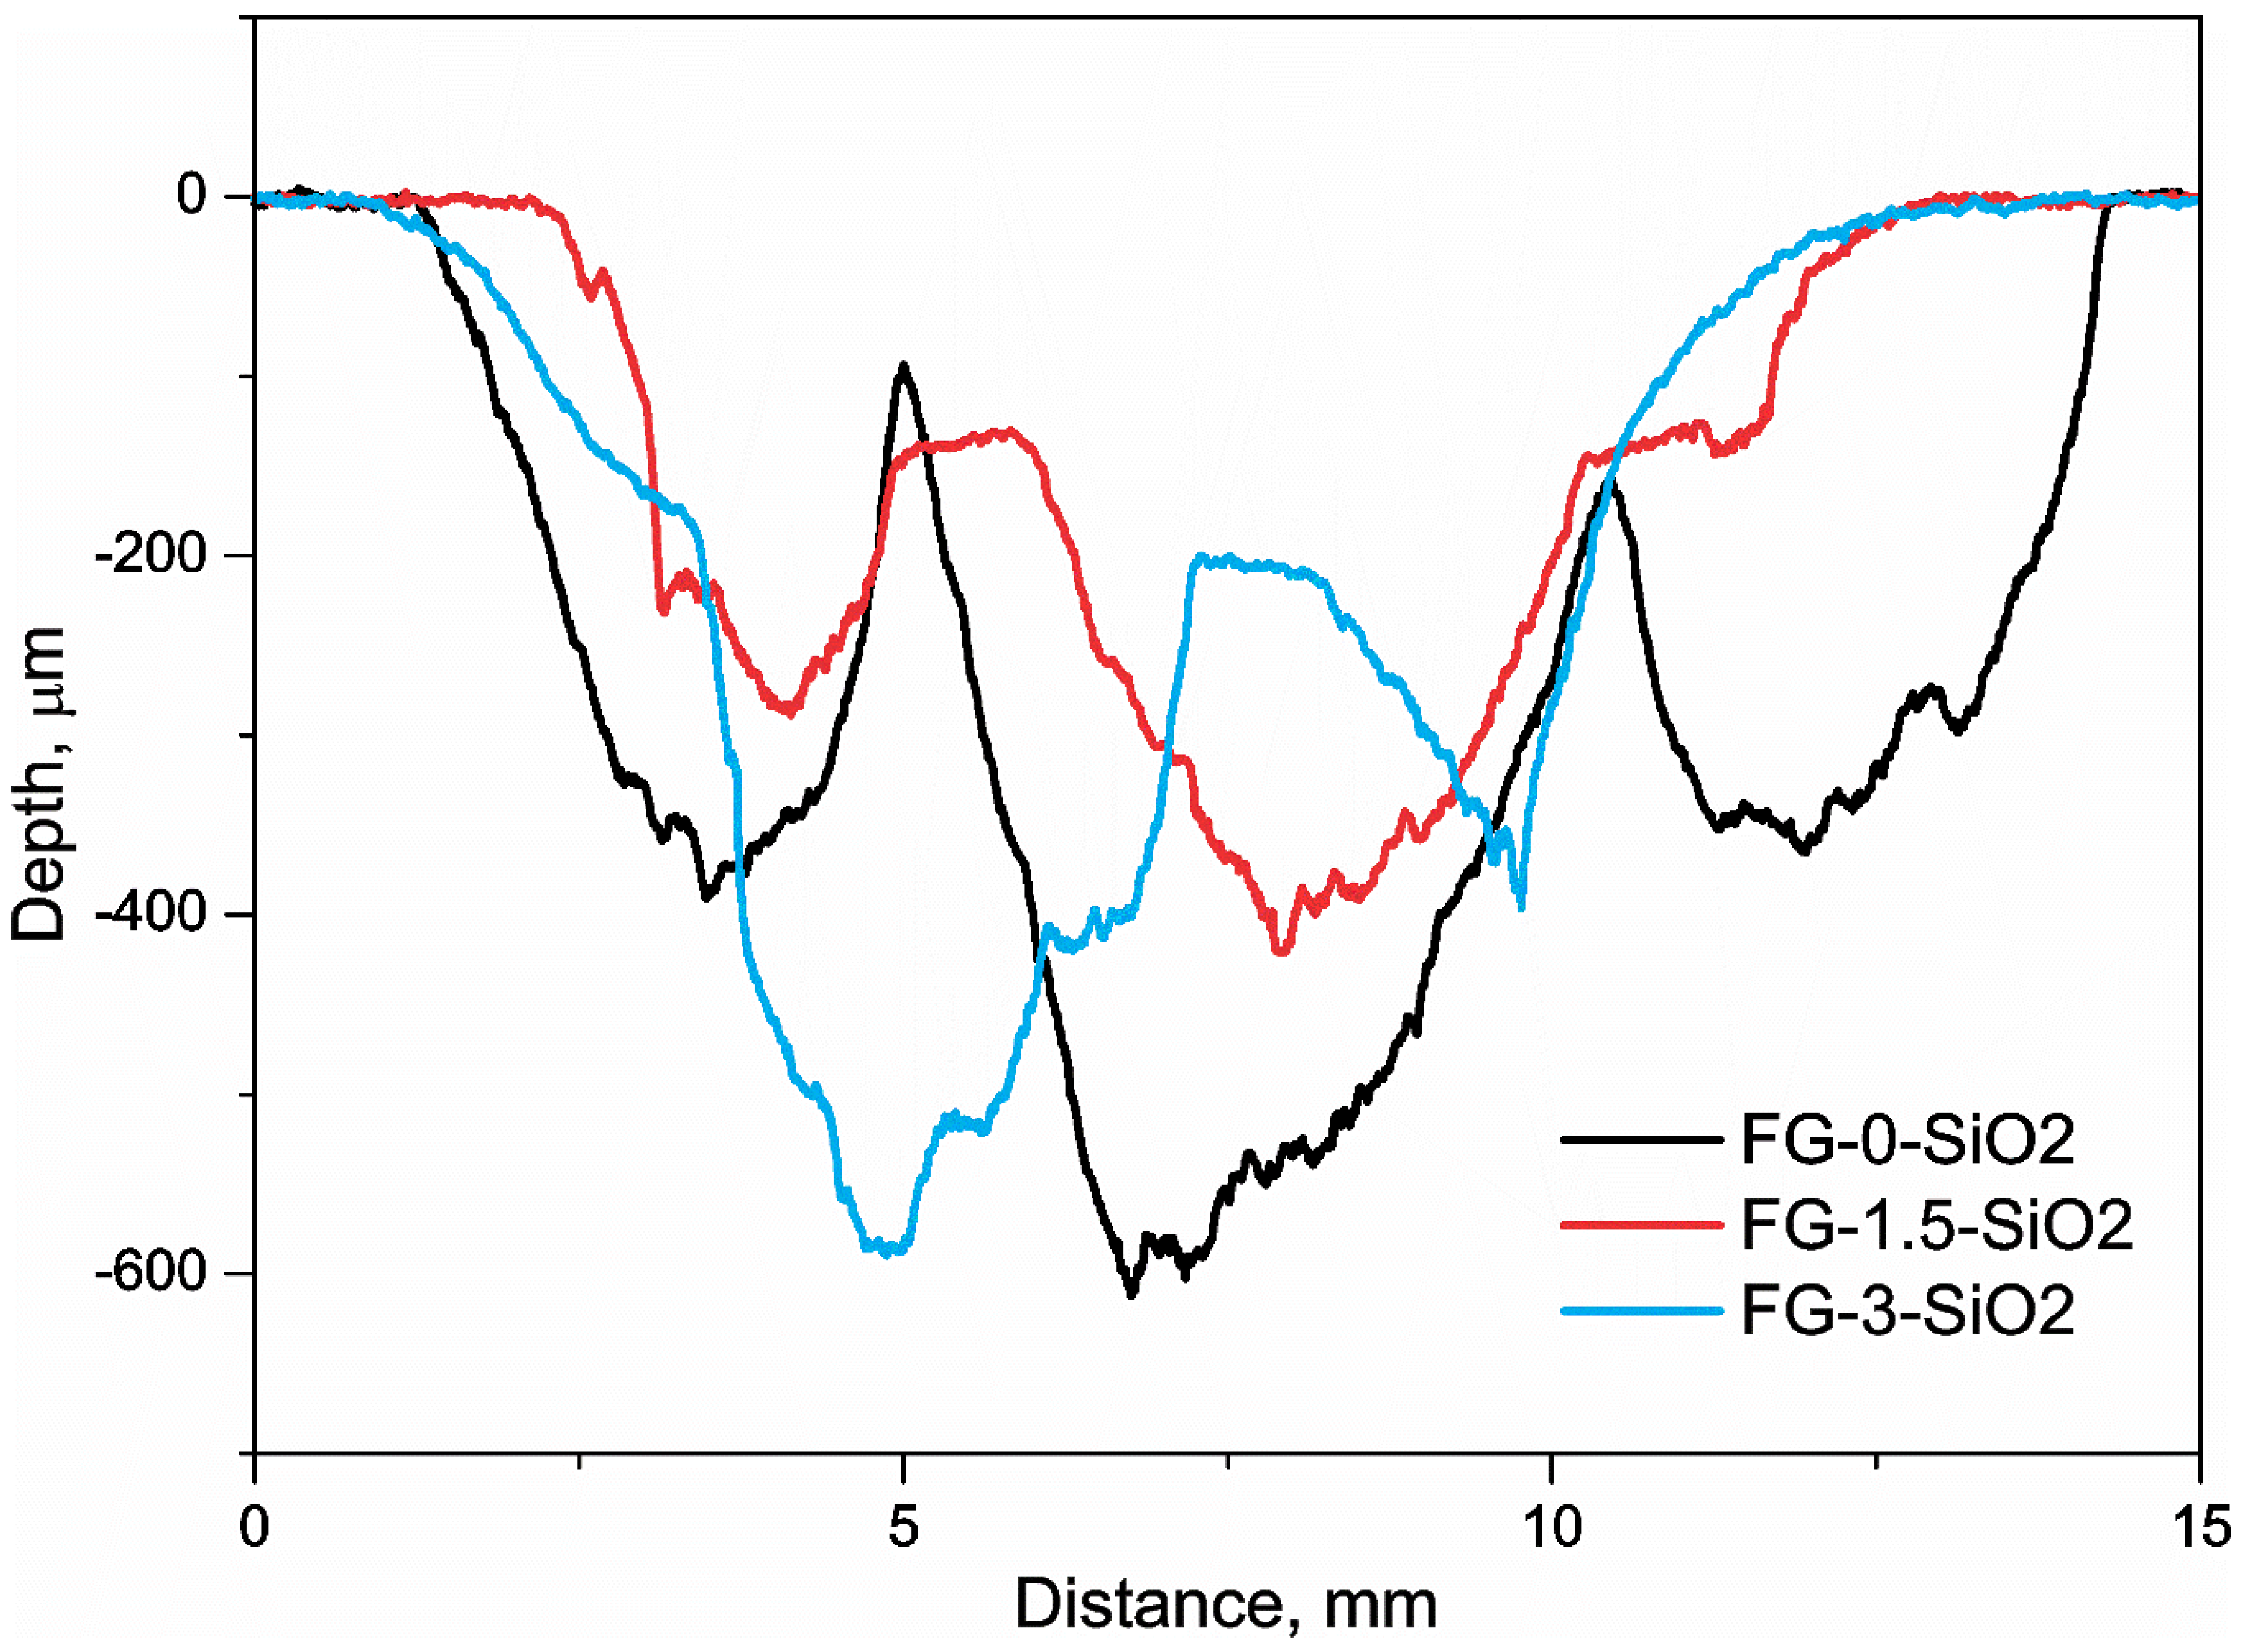
Figure 14.
Wear mechanism at 500 and 1500X of a) FG-0-SiO2, b) FG-1.5-SiO2 and c) FG-3-SiO2.
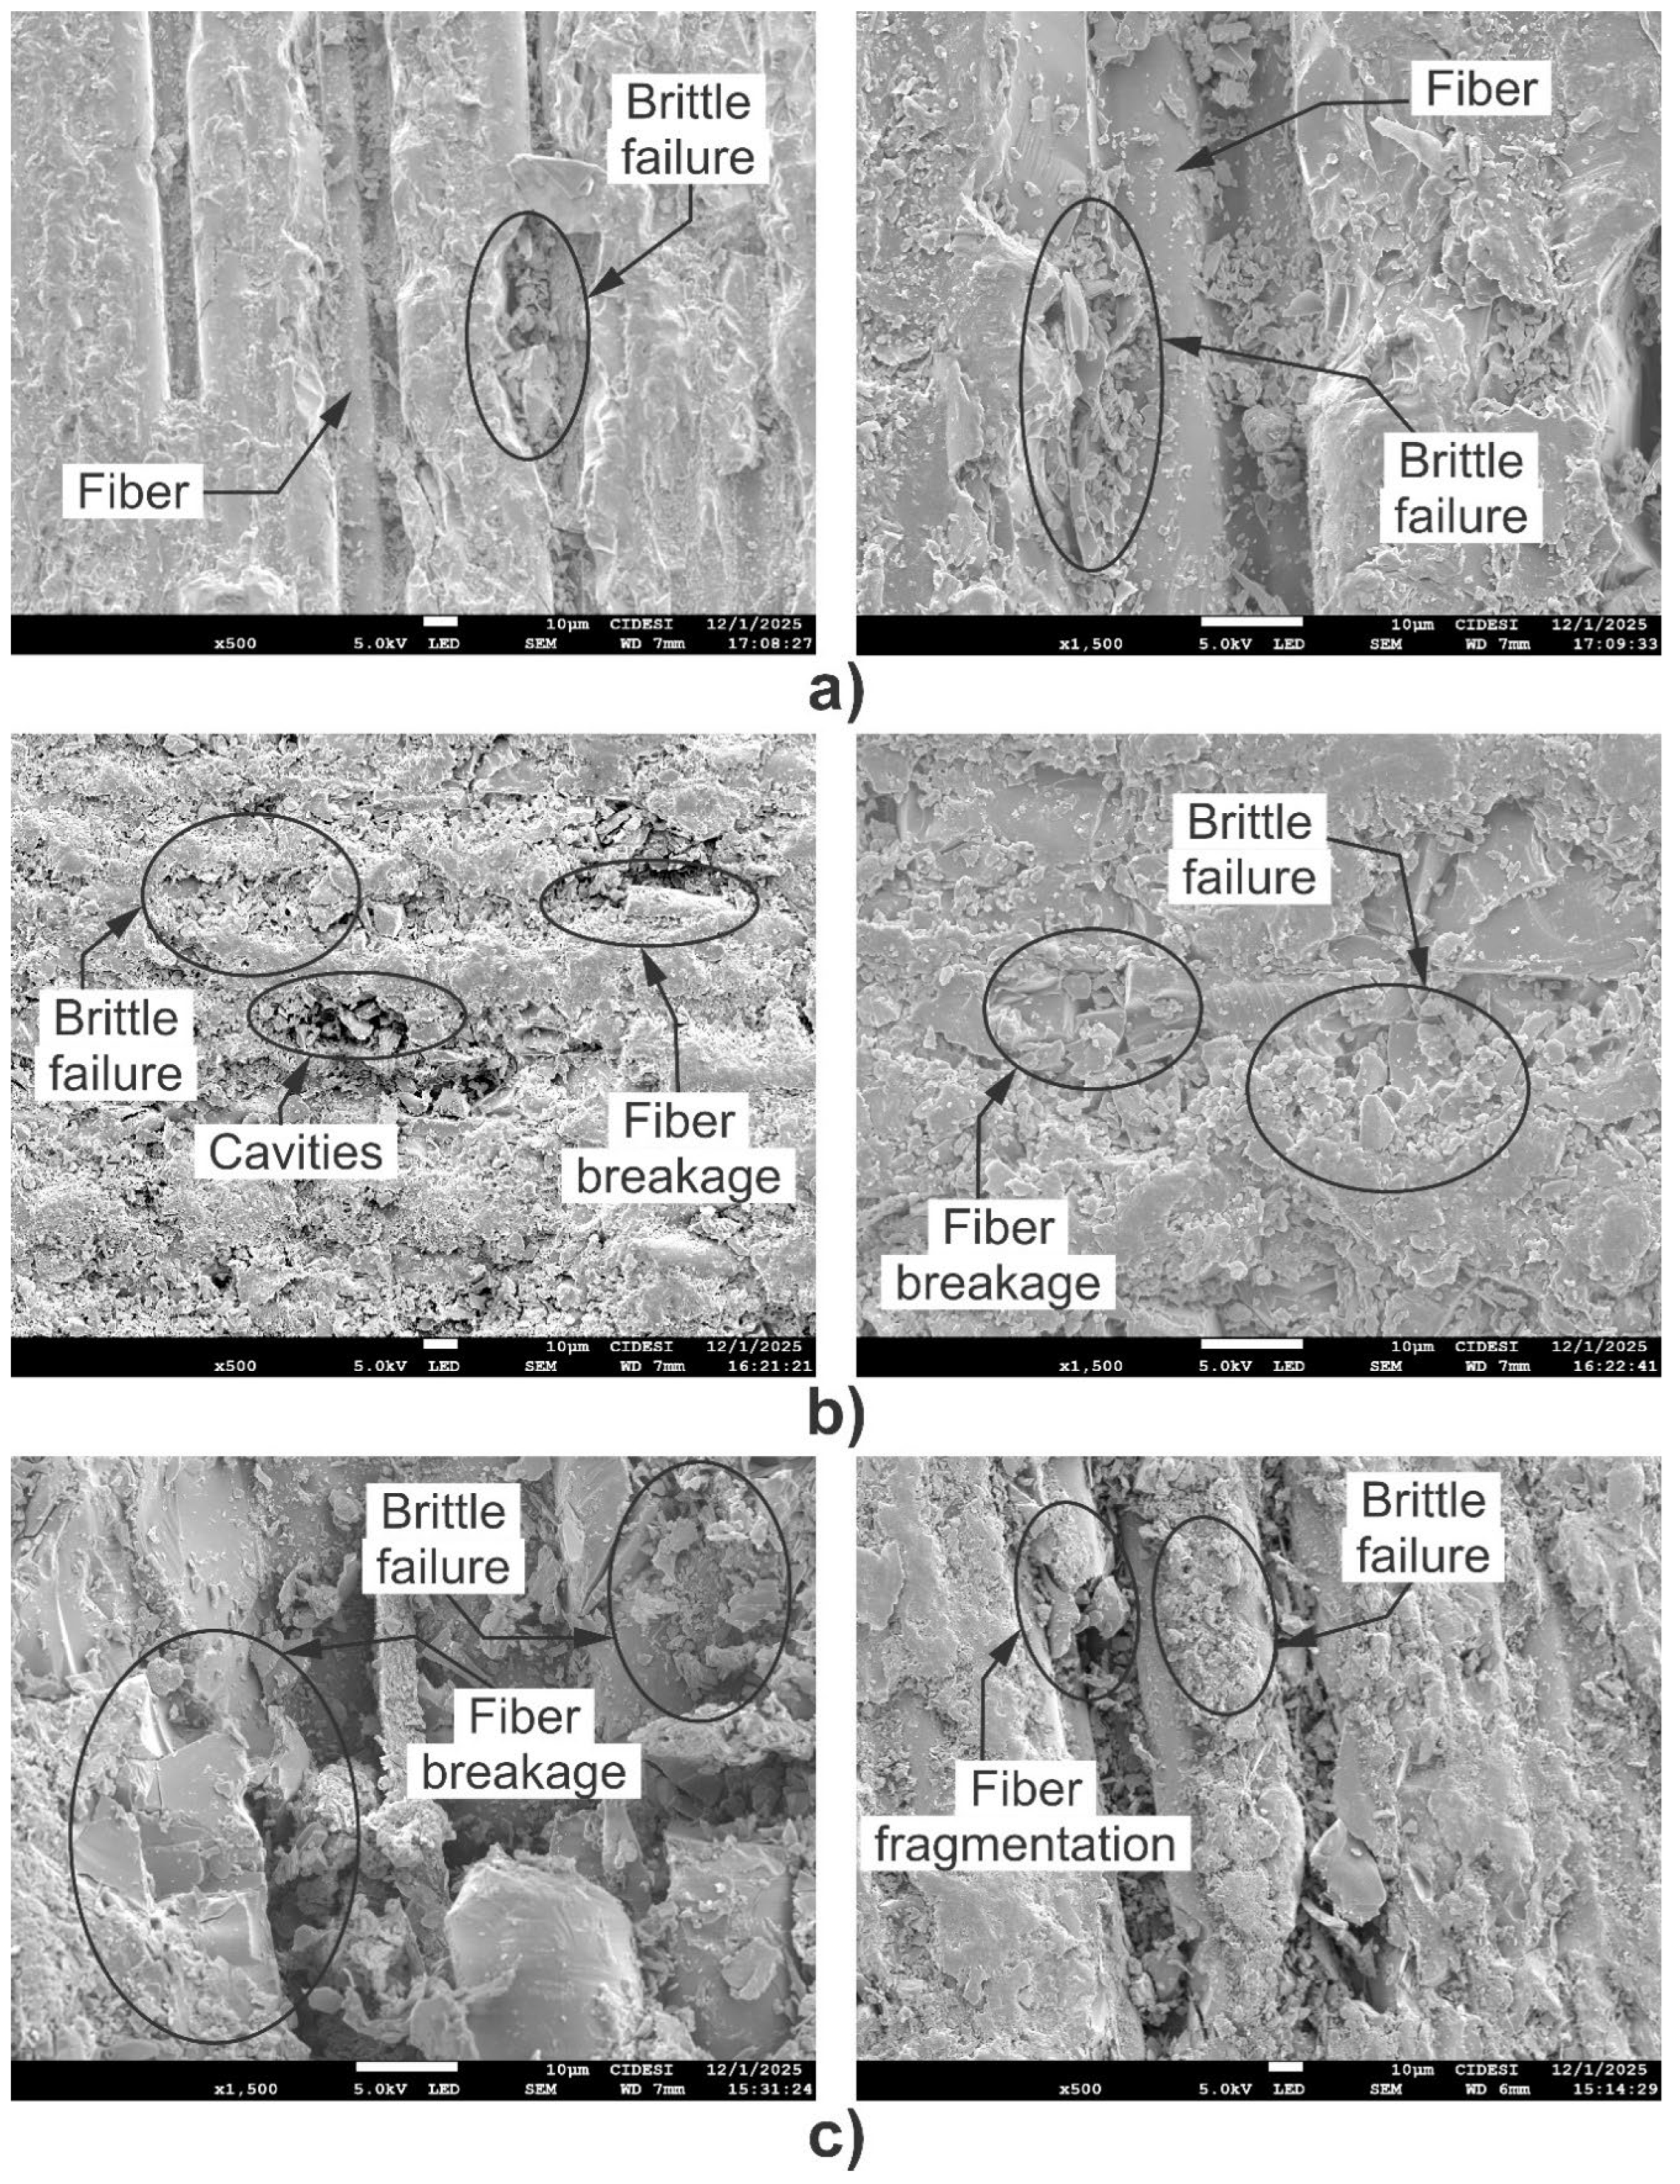

Table 1.
Materials with different concentration of NPs.
| Material | Concentration of SiO2 NPs, wt% |
|---|---|
| FG-0-SiO2 | 0 |
| FG-1.5-SiO2 | 1.5 |
| FG-3-SiO2 | 3 |
Table 2.
Summary of Ra, HV and E.
| Specimen | Ra, μm | SD, μm | VH | SD | E, GPa | SD |
|---|---|---|---|---|---|---|
| FG-0-SiO2 | 0.684 | 0.188 | 19.840 | 0.059 | 9.912 | 0.120 |
| FG-1.5-SiO2 | 0.215 | 0.020 | 35.580 | 0.496 | 19.66 | 2.549 |
| FG-3-SiO2 | 0.475 | 0.230 | 13.830 | 0.208 | 5.491 | 0.052 |
Table 3.
Erosion rate and total mass loss.
| Specimens | Erosion rate, mg/g | SD, mg/g | Total mass loss, mg | SD, mg |
|---|---|---|---|---|
| FG-0-SiO2 | 3.7501E-5 | 2.279E-6 | 0.0419 | 0.0006 |
| FG-1.5-SiO2 | 2.3360E-5 | 1.007E-6 | 0.0261 | 0.0005 |
| FG-3-SiO2 | 3.2131E-5 | 1.621E-6 | 0.0359 | 0.0005 |
Disclaimer/Publisher’s Note: The statements, opinions and data contained in all publications are solely those of the individual author(s) and contributor(s) and not of MDPI and/or the editor(s). MDPI and/or the editor(s) disclaim responsibility for any injury to people or property resulting from any ideas, methods, instructions or products referred to in the content. |
© 2025 by the authors. Licensee MDPI, Basel, Switzerland. This article is an open access article distributed under the terms and conditions of the Creative Commons Attribution (CC BY) license (http://creativecommons.org/licenses/by/4.0/).
Copyright: This open access article is published under a Creative Commons CC BY 4.0 license, which permit the free download, distribution, and reuse, provided that the author and preprint are cited in any reuse.


