
Submitted:
22 January 2026
Posted:
23 January 2026
You are already at the latest version
Abstract
Coastal salt marshes are essential for climate change mitigation due to their high carbon storage capacity, which is influenced by soil type, hydrology, and floristic composition. Over the past century, invasive Phragmites australis has displaced native Sporobolus alterniflorus (formerly Spartina alterniflora) across salt marshes on the Long Island Sound, and it is widely hypothesized that its larger biomass and rapid growth enhance soil carbon sequestration. This study tested that hypothesis by comparing total organic carbon stocks and physical soil properties in two southern Connecticut marshes over multiple seasons. Our results show that mean soil bulk density was significantly higher under P. australis than S. alterniflorus at both locations. However, this did not translate to superior carbon storage. Analysis showed significant seasonal effect but no significant overall difference in median TOC between species, indicating that P. australis is competitive in total mass only due to its higher soil density. Notably, Levene’s test for homogeneity of variance was significant (P = 0.039), revealing that P. australis creates highly heterogeneous "hot spots" of carbon storage compared to the relatively uniform distribution found in native stands. These findings suggest that while P. australis invasion results in a more physically dense and potentially resilient marsh platform—relevant for surviving sea-level rise and filtering nutrient runoff—it may simultaneously compromise the stability and uniformity of regional carbon sinks. Management strategies should consider these tradeoffs when prioritizing the protection of native S. alterniflorus for consistent carbon sequestration.
Keywords:
blue carbon
; bulk density
; coastal resilience
; Connecticut
; Phragmites australis
; Spartina alterniflora
; Sporobolus alterniflorus
; total organic carbon
1. Introduction
Coastal salt marshes are among the most productive and valuable ecosystems globally, providing essential services such as critical habitat for commercially important fisheries, storm surge buffers and carbon sequestration [1]. Like other blue carbon systems, salt marshes’ ability to capture and store carbon is directly related to their proximity to the marine ecosystems and hydrology. Despite their ecological significance, salt marshes of the northeastern United States are facing escalating threats that challenge both their functional integrity and physical persistence. Foremost among these are accelerating sea-level rise (SLR), which threatens to drown marshes that cannot accrete vertically [2]; shoreline encroachment [3]; and excess nutrient loading, which can compromise the root structure necessary to hold marsh soil together [4].
Compounding these global change stressors is the widespread proliferation of the invasive common reed, Phragmites australis (Cav.) Trin. ex Steud. subsp. australis (hereafter P. australis). While the native subspecies, P. australis (Cav.) Trin. ex Steud. subsp. americanus Saltonst., P.M. Peterson and Soreng, has existed in North American wetlands for millennia [5], the non-native invasive lineage—introduced from Europe by the late-1800s [6]—is recognized as one of the most problematic invasive wetland plants in eastern North America [7]. While native and invasive P. australis can coexist, they exhibit distinct physiological differences; invasive Phragmites produce larger inflorescences, leaves, and height [8,9]. Crucially, this invasion represents more than a biological displacement of native flora; it drives a fundamental restructuring of marsh geomorphology and soil architecture.
Invasive P. australis forms dense, monotypic stands with high aboveground biomass that significantly alter local hydrology by trapping mineral sediment and rapidly elevating the marsh surface [10]. While P. australis is typically associated with higher elevations to avoid high salinity, it can spread clonally into the low marsh [11,12], bringing its robust root architecture into zones previously dominated by Sporobolus alterniflorus (Loisel.) P.M. Peterson and Saarela (formerly Spartina alterniflora). This structural modification is critical in the context of erosion; while nutrient enrichment has been shown to weaken the peat fabric of Sporobolus alterniflorus (hereafter S. alterniflorus) marshes leading to creek bank collapse [4], P. australis may offer a different geomorphic trajectory. Understanding how the physical density and stability of the soil matrix change during this invasion is paramount to effective marsh management, particularly as physical resilience to wave energy becomes as valuable as biological diversity.
Despite its reputation as a biological threat, invasive P. australis has been widely reported to provide superior ecosystem benefits relative to indigenous counterparts like S. alterniflorus and Sporobolus pumilus (Roth) P.M. Peterson and Saarela. (formerly Spartina patens (Aiton) Muhl), specifically regarding sediment stabilization and accretion [13,14]. A study conducted at a St. Lawrence Estuary marsh found that invasive P. australis contributed more to soil volume and carbon stock than native Spartina spp. [15]. Similarly, [16] found that P. australis produced far greater above- and below-ground biomass than S. patens. Coupled with slower decomposition rates, it was hypothesized that this robust biomass production would lead to increased carbon sequestration and a physically denser peat layer. However, recent research suggests that anthropogenically driven changes, such as nutrient enrichment, may complicate this picture, potentially resulting in soil organic carbon (SOC) loss [17,18,19].
Therefore, evaluating the trade-offs of this invasion requires looking beyond simple carbon quantities to the stability of the soil itself. While carbon sequestration rates are often reported as offsetting greenhouse gas emissions, carbon stocks provide a clearer indication of the ecosystem's potential to mitigate climate change [20]. Furthermore, the physical properties of these stocks—specifically bulk density—determine the marsh's ability to resist erosion. In this study, we compared total organic carbon (TOC) stocks and physical soil properties in locations dominated by P. australis and S. alterniflorus at a salt marsh in southern Connecticut, aiming to determine if long term shifts in vegetation species composition alters the soil architecture required to withstand rising seas.
The overall objective of this study was to evaluate the functional shifts caused by encroachment by invasive Phragmites australis over Sporobolus alterniflorus in Long Island Sound salt marshes. Primarily, the research sought to determine whether the higher biomass and rapid growth of Phragmites significantly enhance TOC sequestration, thereby altering the soil’s biochemical stoichiometry. Additionally, the study quantified soil physical characteristics to determine how these changes may have influenced the marsh’s structural integrity.
2. Materials and Methods
2.1. Study Area
Soil samples were collected at two tidal salt marshes (Figure 1) located in southern Connecticut namely; Branford Trolley Trail (41°16'9.28"N, 72°45'18.60"W) and Quinnipiac Meadows (Eugene B. Fargeorge) Preserve located in the lower section of the Quinnipiac River (41° 19 '00"N, 72° 52' 50"W). Both marshes exchange tides with the Long Island Sound and share a similar temperate climate with an average annual temperature of 11.3 °C, and average annual rainfall of 1273 mm. Temperatures peak in July, with highs of 23.2 °C, while the lowest average temperatures occur in January, at around -0.5 °C. The lowest amount of rainfall occurs in July with an average of 81 mm, while the greatest amount of precipitation occurs in December, with an average of 130 mm [21]. The region experiences four distinct seasons with cold winters (-7 to 4 °C) with occasional snow and ice, though tidal flow prevents full soil freezing. Spring (4 to 18 °C) brings increased rainfall and promotes plant growth. Summers (18 to 29 °C) are warm and humid, with peak marsh productivity and frequent thunderstorms. Fall (10 to 21 °C) introduces potential for early frost and coastal storm surges, affecting both vegetation and soil chemistry [22,23]. At the time of this study, Branford had an average tidal range of about 1.5 meters [24], whereas Quinnipiac Meadows experiences a much greater tidal range of about 2.8 meters [25]. Marsh vegetation at Branford is dominated by stands of P. australis, S. alterniflorus and S. patens interspersed with smaller patches of Distichlis spicata. P. australis stands occupy higher elevations of the marsh and distinctively along recently disturbed areas such as gravel pathways, roads and railroad tracks. The gravel path along the northern perimeter of the study site is frequented by human traffic and often littered with animal feces. The elevation of the gravel path is approximately 0.7 meters above sea level (m.a.s.l) descending to sea level at the lowest southern boundary. At Quinnipiac Meadows, the marsh f S. alterniflorus and P. australis backed by coastal forest. Branford marsh soils were dominated by Westbrook mucky peat and Quiambog silt loam, intertidal while Quinnipiac Meadows soils were mainly Westbrook mucky peat in the high and mid-marsh areas and Pishagqua silt loam in the low marsh [26]. Invasive P. australis was identified in the field by examining the height of the plant and size of inflorescence which is longer and denser than native species.
2.2. Sample Collection
We employed a stratified random sampling approach to collect soil cores at both sites. Soil cores were stratified and equally distributed by plant type in zones dominated by P. australis and S. alterniflorus respectively. In some instances, P. australis or S. alterniflorus soils were collected under plants growing in transition zones where both species were present, but we were careful to core immediately adjacent or under plants of one species. At Branford, samples also captured a range of elevations with equal distribution across each of three zones (Figure 1). Determination of marsh zone boundaries was based on a perpendicular transect originating from the highest elevation (areas that remain dry even at peak high tide) to the waters edge. Vegetation composition was a secondary determent of marsh zones based on plant inundation and salinity tolerances [27]. High marsh zones lay adjacent to a walking path (approximately 0.7 m.a.s.l), to the lowest areas as close as possible to the water’s edge (0 m.a.s.l) to assess the influence of inundation depth, flood frequency and human disturbance on carbon stocks. Sample locations at the lowest elevations by the water’s edge experienced deeper flooding, more frequent flooding and less disturbance than the sites closer to the walking path at the northern border. A 5.5 cm diameter stainless steel regular soil auger was used to collect soil samples with minimum compaction to a depth of 30 cm. Surface dead vegetative matter such as leaves, rhizomes and roots were removed from the sample in the field. Soil cores were stored in polyethylene Ziploc® bags and stored as in the previous mentioned methods.
In 2024, samples were collected from Quinnipiac Meadows on three occasions over three seasons (Spring, Summer and Fall) in 2024, with 20 samples collected at each visit with equal number of samples collected under each species. Soil samples were carefully collected to minimize compaction from the rhizosphere. Due to drier conditions in 2024 and to avoid damaging soil structure, the collection depths varied between 20-30 cm using a 2.5 cm diameter stainless-steel soil corer [28].
2.3. Sample Processing and Analysis
In both Branford and Quinnipiac Meadows, dead vegetative matter including leaves and rhizomes were removed from the surface of the soils prior to coring. Samples were transported in a cooler containing dry ice to maintain a temperature of approximately 4 °C in the field upon return to the University of New Haven where they were immediately stored at -20 °C until processing. During processing, entire soil samples from each site were thawed, homogenized and weighed in grams to obtain wet weight. Samples were then dried at 60 °C for 24 hours and re-weighed to obtain dry weight. For all cores, dry bulk density was calculated by dividing the dry weight by the initial volume. Initial volume was estimated from core depth and surface area of the sample. Dried samples were then ground using an electric spice grinder. Soil samples were then milled to fine powder in a mortar and pestle, sieved through a 2mm mesh, and packed into tin capsules [29]. All samples were acidified with 2% HCl and analyzed for total organic carbon. Branford samples were analyzed using an Eltra® CS580 elemental analyzer at the Yale Analytical and Stable Isotope Center (YASIC) while Quinnipiac Meadows samples were analyzed at the University of California, Merced Stable Isotope Ecosystems Laboratory using a Costech 4010 Elemental Analyzer coupled with a Delta V Plus Continuous Flow Isotope Ratio Mass Spectrometer. These yielded Carbon percent in each sample which was then used to estimate TOC. Data analysis was conducted in Microsoft Excel ® and program R [30]. Total organic carbon (g ha-1) stock of each sample was estimated using the equation below [29] (Equation 1).
where:
%C = Percent carbon in sample
b = Soil dry bulk density (g cm-3)
D = Soil depth (cm)
A sub-sample of remaining dry soil samples underwent additional sorting to extract all traces of below-ground live and dead rhizomes and fine roots to determine the vegetation fraction within the soils. Below ground vegetative material was rinsed, patted dry and dried at 60 °C for 24 hours. The proportion of vegetative matter (roots) was then estimated as a fraction of the dry sub-sample weight. All response variables were tested for normality using a Shapiro-Wilk test.
3. Results
A total of 48 soil samples were collected over a 5-month period between October 2022 and February 2023 at Branford and 60 samples from Quinnipiac Meadows from April to November 2024. Soils at Quinnipiac Meadows were drier than those at Branford, which resulted in shallower samples. Below ground vegetative matter including dead and live roots, rhizomes constituted 10-11% of soil samples under both species. A Shapiro-Wilk test run on soil data from both sites revealed that bulk density data was significantly non-normal (Branford W = 0.95, P < 0.01; Quinnipiac Meadows W = 0.86, P < 0.001), as was dry weight (Branford W = 0.97, P < 0.01; Quinnipiac Meadows W = 0.88, P < 0.001). Consequently, a non-parametric Wilcoxon rank sum test was used to compare between species. Results indicated a significant difference in bulk density and dry weight between species at both locations, with P. australis generally exhibiting higher variability and higher mean and median bulk density values compared to S. alterniflorus (Table 1 and Table 2). Soil moisture content was greater under S. alterniflorus at Branford but greater in P. australis at Quinnipiac Meadows (Figure 2 and Figure 3).
Total organic carbon (TOC; kg C ha-1) varied spatially and temporally but was greater in S. alterniflorus than P. australis at Branford and vice versa for Quinnipiac Meadows (Figure 2 and Figure 3). A Scheirer-Ray Hare test revealed no interaction between species and zone at Branford (P = 0.89) and Welch’s ANOVA detected a significant effect of season (F = 12.52, P < 0.001) but no effect by species at Quinnipiac Meadows. The post-hoc Dunn’s Test found significantly greater TOC in S. alterniflorus across all zones (P = 0.04).
4. Discussion
4.1. Alterations in Soil Physical Architecture and Geomorphology
The results of this study highlight a distinct and functional divergence in the physical soil properties between the invasive Phragmites australis and the native Sporobolus alterniflorus, even in the absence of significant disparities in overall carbon storage capacities. While general plant characteristics—such as aboveground biomass, stand density, and height—followed expected phenological patterns, the subsurface interactions reveal a more complex narrative. Our bulk density estimates align with regional observations from St. Lawrence Bay [15], though they fall below values recorded in southern ranges [31]. However, the critical finding lies in the significantly higher and more variable bulk density associated with P. australis.
This variance suggests that P. australis acts as a distinct geomorphic engineer compared to its native counterpart. The elevated bulk density indicates that P. australis likely facilitates higher rates of mineral sediment deposition or possesses a root architecture robust enough to physically compact the surrounding substrate to a greater degree than S. alterniflorus. This aligns with established research indicating that P. australis increases surface elevation in tidal marshes more rapidly than native species, utilizing a dual mechanism of organic matter accumulation and the efficient trapping of inorganic sediments [10]. The pronounced variance within the P. australis data further supports the "plasticity" hypothesis; this species is renowned for its ability to colonize a wider spectrum of micro-topographies and salinity gradients. Consequently, P. australis creates a more heterogeneous soil environment, contrasting sharply with the relatively uniform, monocultural stands typical of S. alterniflorus [32].
Above-ground vegetation, which influences soil carbon accumulation through organic matter inputs and root production, may respond strongly to interannual climate variability. Although P. australis is highly adaptable and occurs across a broad climatic range from temperate to tropical regions [33,34], our anecdotal observations at Branford suggest that the proximity of most P. australis stands to a regularly mowed walking path, coupled with the higher elevation and drier conditions may have contributed to lower soil carbon in 2023. By contrast, S. alterniflorus occurred at lower elevations, closer to the waters edge thereby experiencing more frequent flooding, thereby limiting carbon decomposition. Furthermore, the growing season of 2022 was marked by severe drought which may have limited all vegetation growth and carbon deposition [23]. Sporobolus alterniflorus typically performs best under moderate temperatures and precipitation but is sensitive to environmental extremes such as prolonged drought or excessive flooding [35]. In 2024 hydrologic and thermal extremes such as excessive flooding and subsequent inundation may have imposed physiological stress on S. alterniflorus, limiting growth and reducing biomass.
4.2. Carbon Storage Dynamics: Quantity vs. Density
The transition in salt marsh vegetation composition from native to invasive does not equate to a collapse in carbon sequestration potential, challenging the assumption that native marshes are invariably superior carbon sinks. The lack of a significant difference in total carbon stock between the two species contradicts literature suggesting that P. australis significantly outperforms native marshes [36], while also complicating views that native species are superior due to litter quality [37].
Instead, our data suggests a compensatory mechanism: while P. australis plots may exhibit lower carbon percentages per unit of soil, the total mass of carbon stored remains competitively high because the soil is more densely packed. This density-dependent storage suggests that P. australis creates a physically heavier carbon platform. The discrepancy between our findings and studies favoring native storage [37] hydrology, sediment supply, and microbial activity—are significant drivers of carbon stocks. For instance, while S. alterniflorus may produce recalcitrant litter that stabilizes soil carbon, P. australis may encourage higher mineralization rates by promoting microbial decomposition [38]. Additionally, the variability in our P. australis carbon data may reflect its flexibility in belowground biomass allocation, a trait responsive to nutrient availability and flooding stress [16]. The inconsistency among various studies strengthens the argument that local environmental drivers often override species-specific carbon traits.
4.3. Nutrient Synergy and Structural Integrity
When viewed from the perspective of nutrient enrichment, high nutrient runoff along coastal habitats of the Long Island Sound may stimulate aboveground growth at the expense of belowground root biomass. In S. alterniflorus marshes, this allocational shift can be catastrophic, leading to "marsh collapse" where the root mat weakens, causing the soil to disintegrate [4]. On the other hand, P. australis, a documented “nitriphile” is capable of rapidly absorbing excess nutrients to fuel massive biomass production without suffering the same level of belowground structural degradation [39]. Its high nitrogen demand drives it to extract deep nitrogen stores, a trait that fuels its invasiveness (Mozdzer et al., 2023) but also results in a denser soil matrix. Therefore, the higher bulk density and variable carbon distribution in P. australis stands suggest this species may be more effective at "locking away" nutrients into a dense soil matrix. In eutrophic coastal waters, P. australis may function as a superior bio-filter compared to S. alterniflorus, stabilizing the physical platform even as it alters the biological community.
4.4. Resilience to Sea-Level Rise: The "Islands of Resilience"
The observed heterogeneity in P. australis soil properties may have profound implications for resilience against sea-level rise (SLR). The high variance in carbon stocks and bulk density suggests a trade-off: while P. australis builds a denser physical platform, its sequestration is less spatially uniform. However, in the context of rapid SLR, this heterogeneity may be advantageous. The "hot spots" of high carbon and high bulk density within P. australis stands may function as "islands of resilience." These dense patches could resist drowning and erosion more effectively than the uniform, but potentially slower-accreting, S. alterniflorus stands [40]. Since higher bulk density typically correlates with increased soil shear strength [41], the invasion of P. australis may represent a shift toward a physically "hardened" coastline, capable of withstanding higher wave energy and deeper inundation, albeit at the cost of the micro-topographical uniformity preferred by some native fauna.
Despite the suggested geomorphic advantages of the establishment of non-native P. australis, it comes with significant ecological trade-offs. The tendency of P. australis to form dense, near-monocultural stands simplifies habitat structure, potentially reducing biodiversity and altering trophic pathways for native avian and macroinvertebrate communities [32,42]. Thus, the invasion represents a transition from the biological heterogeneity and specialized habitat niches of S. alterniflorus to a more physically stable but biologically uniform state.
5. Conclusions
We found no consistent evidence to suggest that the invasion of Connecticut’s salt marshes by non-native plants significantly impacts carbon stocks. However, given the known losses in wildlife habitat and diversity, we propose that the transition from S. alterniflorus to P. australis represents a trade-off in ecological functions. Further exploration of the role played by hydrological regimes, sediment supply, and nutrient loading characteristics across multiple salt marshes of the Long Island Sound would clarify the extent to which the observed patterns are locally driven versus broadly generalized.
The implications of this study extend into the management of coastal wetlands in the Anthropocene. As sea levels continue to rise and anthropogenic nutrient loading persists, the restoration preference for S. alterniflorus must be weighed against the geomorphic stability provided by P. australis. While traditionally managed as an aggressive invasive threat to biodiversity, P. australis demonstrates a capacity to maintain high bulk density and substantial carbon stocks under conditions that might destabilize native marshes.
Consequently, in areas subject to rapid subsidence, high wave energy, or extreme eutrophication, P. australis may provide a critical "geomorphic service." The species’ ability to create a dense, heterogeneous, and nutrient-absorbent soil matrix suggests it could act as a buffer against marsh collapse. Future management strategies should consider this functional trade-off: the preservation of native biodiversity versus the maintenance of a physically resilient marsh platform capable of keeping pace with rising seas. The "islands of resilience" created by P. australis may well prove to be essential components of coastal defense in a rapidly changing climate.
Author Contributions
Conceptualization, S.K.; methodology, P.A., R.N. and S.K.; software, P.A. and R.N.; validation, S.K..; formal analysis, P.A., R.N. and S.K.; investigation, P.A. and R.N.; resources, S.K.; data curation, S.K.; writing—original draft preparation, P.A. and R.N.; writing—review and editing, S.K.; visualization, S.K.; supervision, S.K.; project administration, S.K.; funding acquisition, S.K. and P.A. All authors have read and agreed to the published version of the manuscript.
Data Availability Statement
We are willing to submit our raw data and codes to MPDI but have not placed them in any repository.
Acknowledgments
We thank the Connecticut Association of Wetland Scientists for funding support provided for this project. We also thank P. Khanal, J. Sanchez, J. Ofili, J. Yalamati, J. Aseperi and I. Otuomagie for their assistance in field data collection and sample analysis. Finally, we thank D. Mays for the initial review and edits of this manuscript. During the preparation of this manuscript, the authors used Google Gemini to check spellings, grammar and formatting. The authors have reviewed and edited the output and take full responsibility for the content of this publication.
Conflicts of Interest
The authors declare no conflicts of interest. The funders had no role in the design of the study; in the collection, analyses, or interpretation of data; in the writing of the manuscript; or in the decision to publish the results.
References
- Duarte, C.M.; Losada, I.J.; Hendriks, I.E.; Mazarrasa, I.; Marbà, N. The role of coastal plant communities for climate change mitigation and adaptation. Nat. Clim. Change 2013, 3(11), 961–968. [Google Scholar] [CrossRef]
- Kirwan, M.L.; Murray, A.B.; Boyd, W.S. Extreme controls on the evolution of marsh microtopography and the efficiency of marsh accretion. Limnol. Oceanogr. 2010, 55(2), 659–668. [Google Scholar] [CrossRef]
- Doody, J.P. Coastal squeeze—an historical perspective. J. Coast. Conserv. 2008, 12, 1–4. [Google Scholar] [CrossRef]
- Deegan, L.A.; Johnson, D.S.; Warren, R.S.; Peterson, B.J.; Fleeger, J.W.; Fagherazzi, S.; Wollheim, W.M. Coastal eutrophication as a driver of salt marsh loss. Nature 2012, 490(7420), 388–392. [Google Scholar] [CrossRef]
- Saltonstall, K.; Peterson, P.M.; Soreng, R.J. Recognition of Phragmites australis subsp. americanus (Poaceae: Arundinoideae) in North America. SIDA, Contrib. Bot. 2004, 21(2), 683–692. [Google Scholar]
- Fofonoff, P.W.; Ruiz, G.M.; Steves, B.; Simkanin, C.; Carlton, J.T. Phragmites australis (Common Reed). National Exotic Marine and Estuarine Species Information System (NEMESIS); Smithsonian Environmental Research Center, 2024. Available online: https://invasions.si.edu/nemesis/species_summary/Phragmites+australis (accessed on 1 November 2024).
- Meyerson, L.A.; Cronin, J.T.; Pyšek, P. Phragmites australis as a model organism for studying plant invasions. Biol. Invasions 2016, 18(9), 2421–2431. [Google Scholar] [CrossRef]
- Kettenring, K.M.; McCormick, M.K.; Baron, H.M.; Whigham, D.F. Mechanisms of Phragmites australis invasion. J. Appl. Ecol. 2011, 48(5), 1305–1313. [Google Scholar] [CrossRef]
- Mozdzer, T.J.; Brisson, J.; Hazelton, E.L.G. Physiological ecology and functional traits of Phragmites australis. AoB Plants 2013, 5, plt048. [Google Scholar] [CrossRef]
- Rooth, J.E.; Stevenson, J.C. Sediment deposition patterns in Phragmites australis communities. Wetlands Ecol. Manage 2000, 8(2–3), 173–183. [Google Scholar] [CrossRef]
- Amsberry, L.; Baker, M.A.; Ewanchuk, P.J.; Bertness, M.D. Clonal integration and expansion of Phragmites australis. Ecol. Appl. 2000, 10(4), 1110–1118. [Google Scholar] [CrossRef]
- Bernal, B.; Megonigal, J.P.; Mozdzer, T.J. An invasive wetland grass primes deep soil carbon pool. Glob. Change Biol. 2017, 23(5), 2104–2116. [Google Scholar] [CrossRef]
- Kiviat, E. Ecosystem services of Phragmites in North America. AoB Plants 2013, 5, plt008. [Google Scholar] [CrossRef]
- Lathrop, R.G.; Windham, L.; Montesano, P. Does Phragmites expansion alter marsh landscapes? Estuaries 2003, 26(2), 423–435. [Google Scholar] [CrossRef]
- Gu, J.; van Ardenne, L.B.; Chmura, G.L. Invasive Phragmites increases blue carbon stock. J. Geophys. Res. Biogeosci. 2020, 125(12), e2020JG005831. [Google Scholar] [CrossRef]
- Windham, L. Biomass production and decomposition in tidal marshes. Wetlands 2001, 21(2), 179–188. [Google Scholar] [CrossRef]
- González-Alcaraz, M.N.; Jiménez-Cárceles, F.J.; Álvarez, Y.; Tercero, M.C. Storage of organic carbon in Phragmites australis stands: Soil-plant relationships in Mediterranean semiarid wetlands. Geoderma 2012, 185–186, 61–72. [Google Scholar] [CrossRef]
- Mozdzer, T.J.; Caplan, J.S.; Thomsen, M.S.; Gribsholt, B.; Zieman, J.C. Mining of deep nitrogen facilitates Phragmites australis invasion in a salt marsh. Estuar. Coasts 2023, 46(4), 998–1008. [Google Scholar] [CrossRef]
- Zhang, X.; Zhang, Y.; Yao, X.; Wang, J.; Zheng, L.; Yao, S. Nutrient enrichment decreases DOC sequestration in a typical shallow lake of the middle and lower Yangtze River basin. Ecol. Indic. 2022, 145, 109576. [Google Scholar] [CrossRef]
- Don, A.; Schumacher, J.; Freibauer, A. Impact of land-use change on soil carbon stocks. Glob. Change Biol. 2023, 29(3), 702–718. [Google Scholar] [CrossRef]
- Climate Data. Branford Climate. 2023. Available online: https://en.climate-data.org/ (accessed on 30 August 2023).
- Season, Nomad. Branford, Connecticut climate and seasonal weather patterns. 2025. Available online: https://www.nomadseason.com (accessed on 15 November 2025).
- WeatherSpark. Average weather in Branford, Connecticut. 2025. Available online: https://weatherspark.com (accessed on 1 November 2025).
- Branford Land Trust; Branford Conservation and Inland Wetlands Commission. Natural Resources Inventory for the Town of Branford, Connecticut. Branford, CT. 2023. Available online: https://branfordlandtrust.org/nri/ (accessed on 15 August 2023).
- NOAA. Tides and currents: Quinnipiac River, CT. NOAA Tides & Currents. 2025. Available online: https://tidesandcurrents.noaa.gov (accessed on 15 November 2025).
- USDA-NRCS. Web Soil Survey. 2025. Available online: https://websoilsurvey.nrcs.usda.gov (accessed on 30 August 2025).
- Chapman, V.J. Coastal Vegetation, 2nd ed.; Pergamon Press: Oxford, 1976. [Google Scholar] [CrossRef]
- Hunnings, S.R.; Berry, K.L.; Chanton, J.P. A lightweight coring method for tidal wetland soils. Wetlands 2019, 39(4), 815–823. [Google Scholar] [CrossRef]
- Soil Sampling and Methods of Analysis, 2nd ed.; Carter, M.R., Gregorich, E.G., Eds.; CRC Press, 2008. [Google Scholar] [CrossRef]
- R Core Team. R: A Language and Environment for Statistical Computing (Version 4.3.0) [Computer software]. R Foundation for Statistical Computing. 2023. Available online: https://www.R-project.org/ (accessed on 30 August 2023).
- Unger, V.; Elsey-Quirk, T.; Sommerfield, C.; Velinsky, D. Stability of organic carbon in salt marshes. Estuar. Coast. Shelf Sci. 2016, 182, 179–189. [Google Scholar] [CrossRef]
- Meyerson, L.A.; Saltonstall, K.; Chambers, R.M. The role of Phragmites australis in altering ecosystem processes. Estuaries 2000, 23(6), 768–780. [Google Scholar] [CrossRef]
- Eller, F.; Skálová, H.; Caplan, J.S.; Bhattarai, G.P.; Anderson, J.T.; Cronin, J.T.; Lodge, A.G.; Lambert, A.M.; Welch, A.J.; Meyerson, L.A. Cosmopolitan species as models for ecophysiological responses to global change: The case of Phragmites australis. Front. Plant Sci. 2017, 8, 1833. [Google Scholar] [CrossRef]
- Windham, L.; Lathrop, R.G. Effects of Phragmites australis invasion on marsh nutrient cycling. Estuaries 1999, 22(3), 786–793. [Google Scholar] [CrossRef]
- Hanson, A.; Johnson, R.; Wigand, C.; Oczkowski, A.; Davey, E.; Markham, E. Responses of Spartina alterniflora to Multiple Stressors: Changes in Nutrients, Sediments, and Sea Level. Estuar. Coasts 2016, 39(5), 1376–1385. [Google Scholar] [CrossRef]
- Templer, P.H.; Reinmann, A.B.; Socci, A.M.; Weathers, K.C. Effects of Phragmites australis invasion on nitrogen dynamics in a New England salt marsh. J. Ecol. 2016, 104(5), 1500–1512. [Google Scholar] [CrossRef]
- Yu, L.F.; Wang, G.X.; Shen, J.Y.; Zhang, H.S. Biomass and carbon storage of Phragmites australis and Spartina alterniflora in the Minjiang River estuary. Ying Yong Sheng Tai Xue Bao (J. Appl. Ecol.) 2013, 24(8), 2112–2118. [Google Scholar] [PubMed]
- Bernal, B.; Kim, S.; Mozdzer, T.J. Species shifts induce soil organic matter priming. Sci. Total Environ. 2023, 859, 159956. [Google Scholar] [CrossRef]
- Mozdzer, T.J.; Megonigal, J.P. High-performance phenotypes in Phragmites australis. Evol. Appl. 2013, 6(5), 754–765. [Google Scholar] [CrossRef]
- Cahoon, D.R.; McKee, K.L.; Morris, J.T. How plants influence resilience of salt marsh wetlands to sea-level rise. Estuaries Coasts 2021, 44(4), 883–898. [Google Scholar] [CrossRef]
- Turner, R.E.; Swenson, E.M.; Milan, C.S. Organic and inorganic contributions to vertical accretion in salt marsh sediments. In Concepts Controv. Tidal Marsh Ecol.; Springer, 2000. [Google Scholar] [CrossRef]
- Hunter, K.L.; Fox, L.; Brown, R. Effects of Phragmites australis on marsh fauna. Wetlands 2006, 26(1), 141–151. [Google Scholar] [CrossRef]
Figure 1.
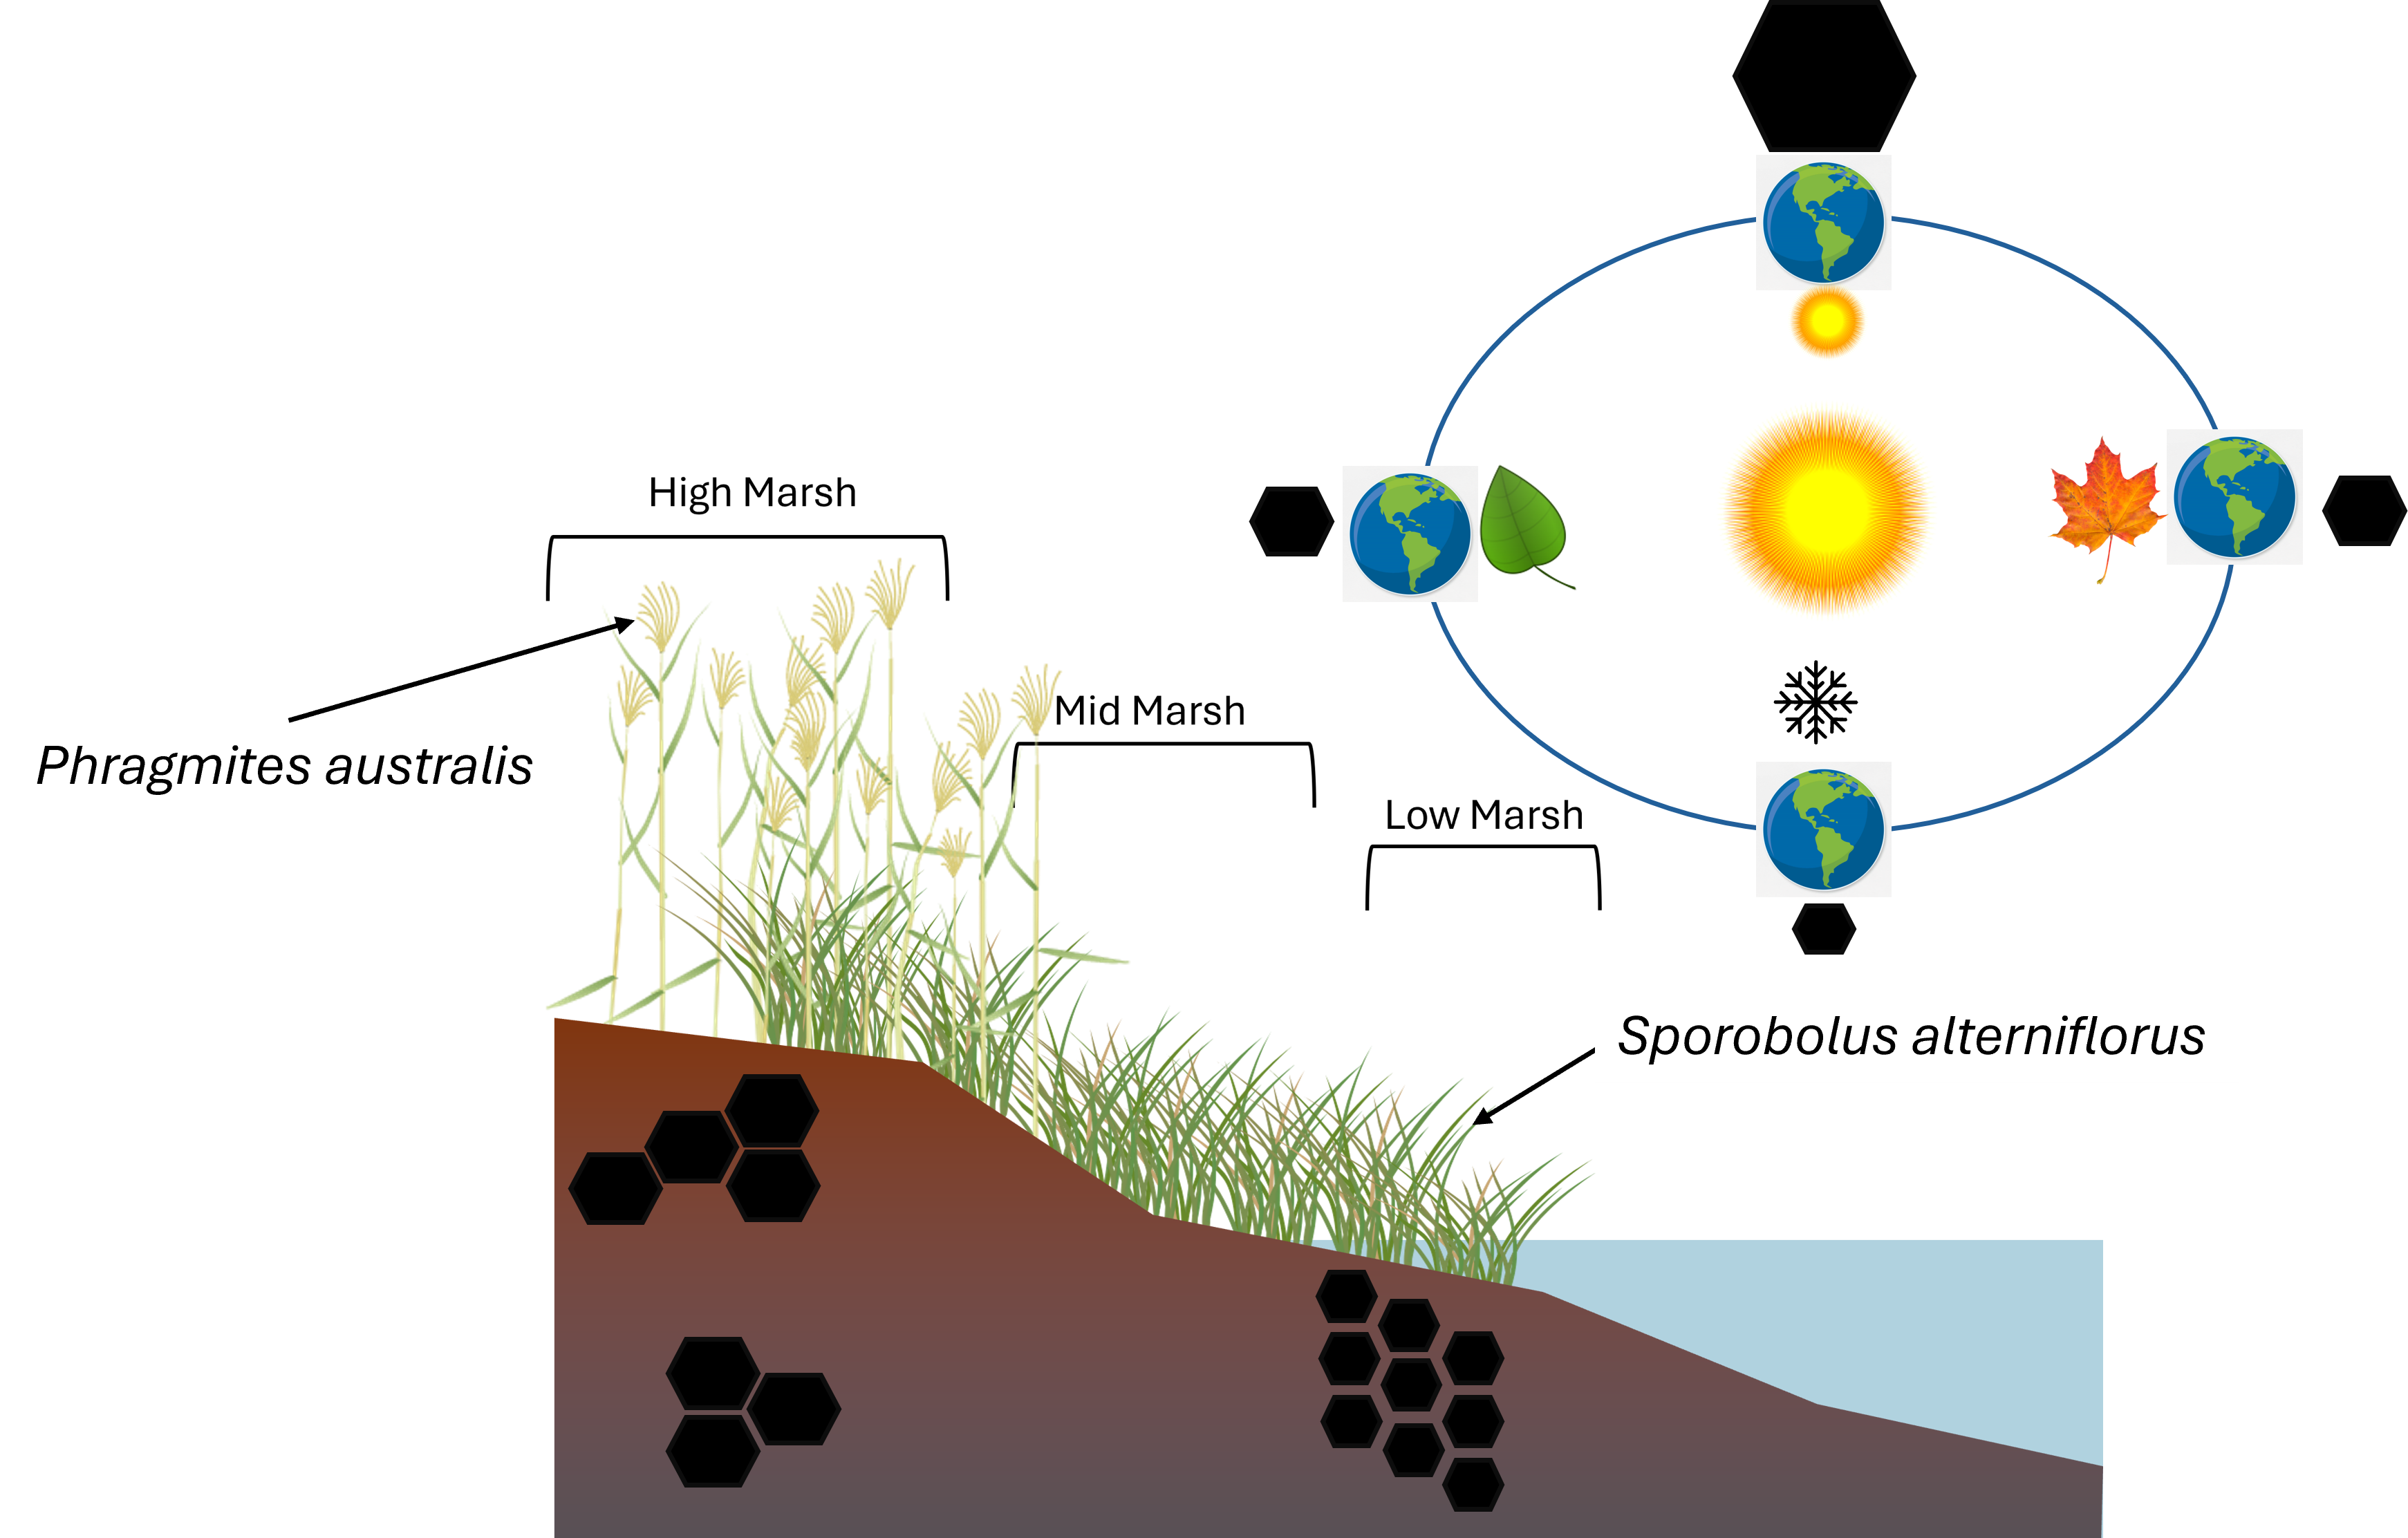
Soil sampling locations at (A) Quinnipiac Meadows and (B) Branford marsh. Distribution of dominant vegetation in a typical tidal salt marsh profile in southern Connecticut (C).
Figure 1.
Soil sampling locations at (A) Quinnipiac Meadows and (B) Branford marsh. Distribution of dominant vegetation in a typical tidal salt marsh profile in southern Connecticut (C).
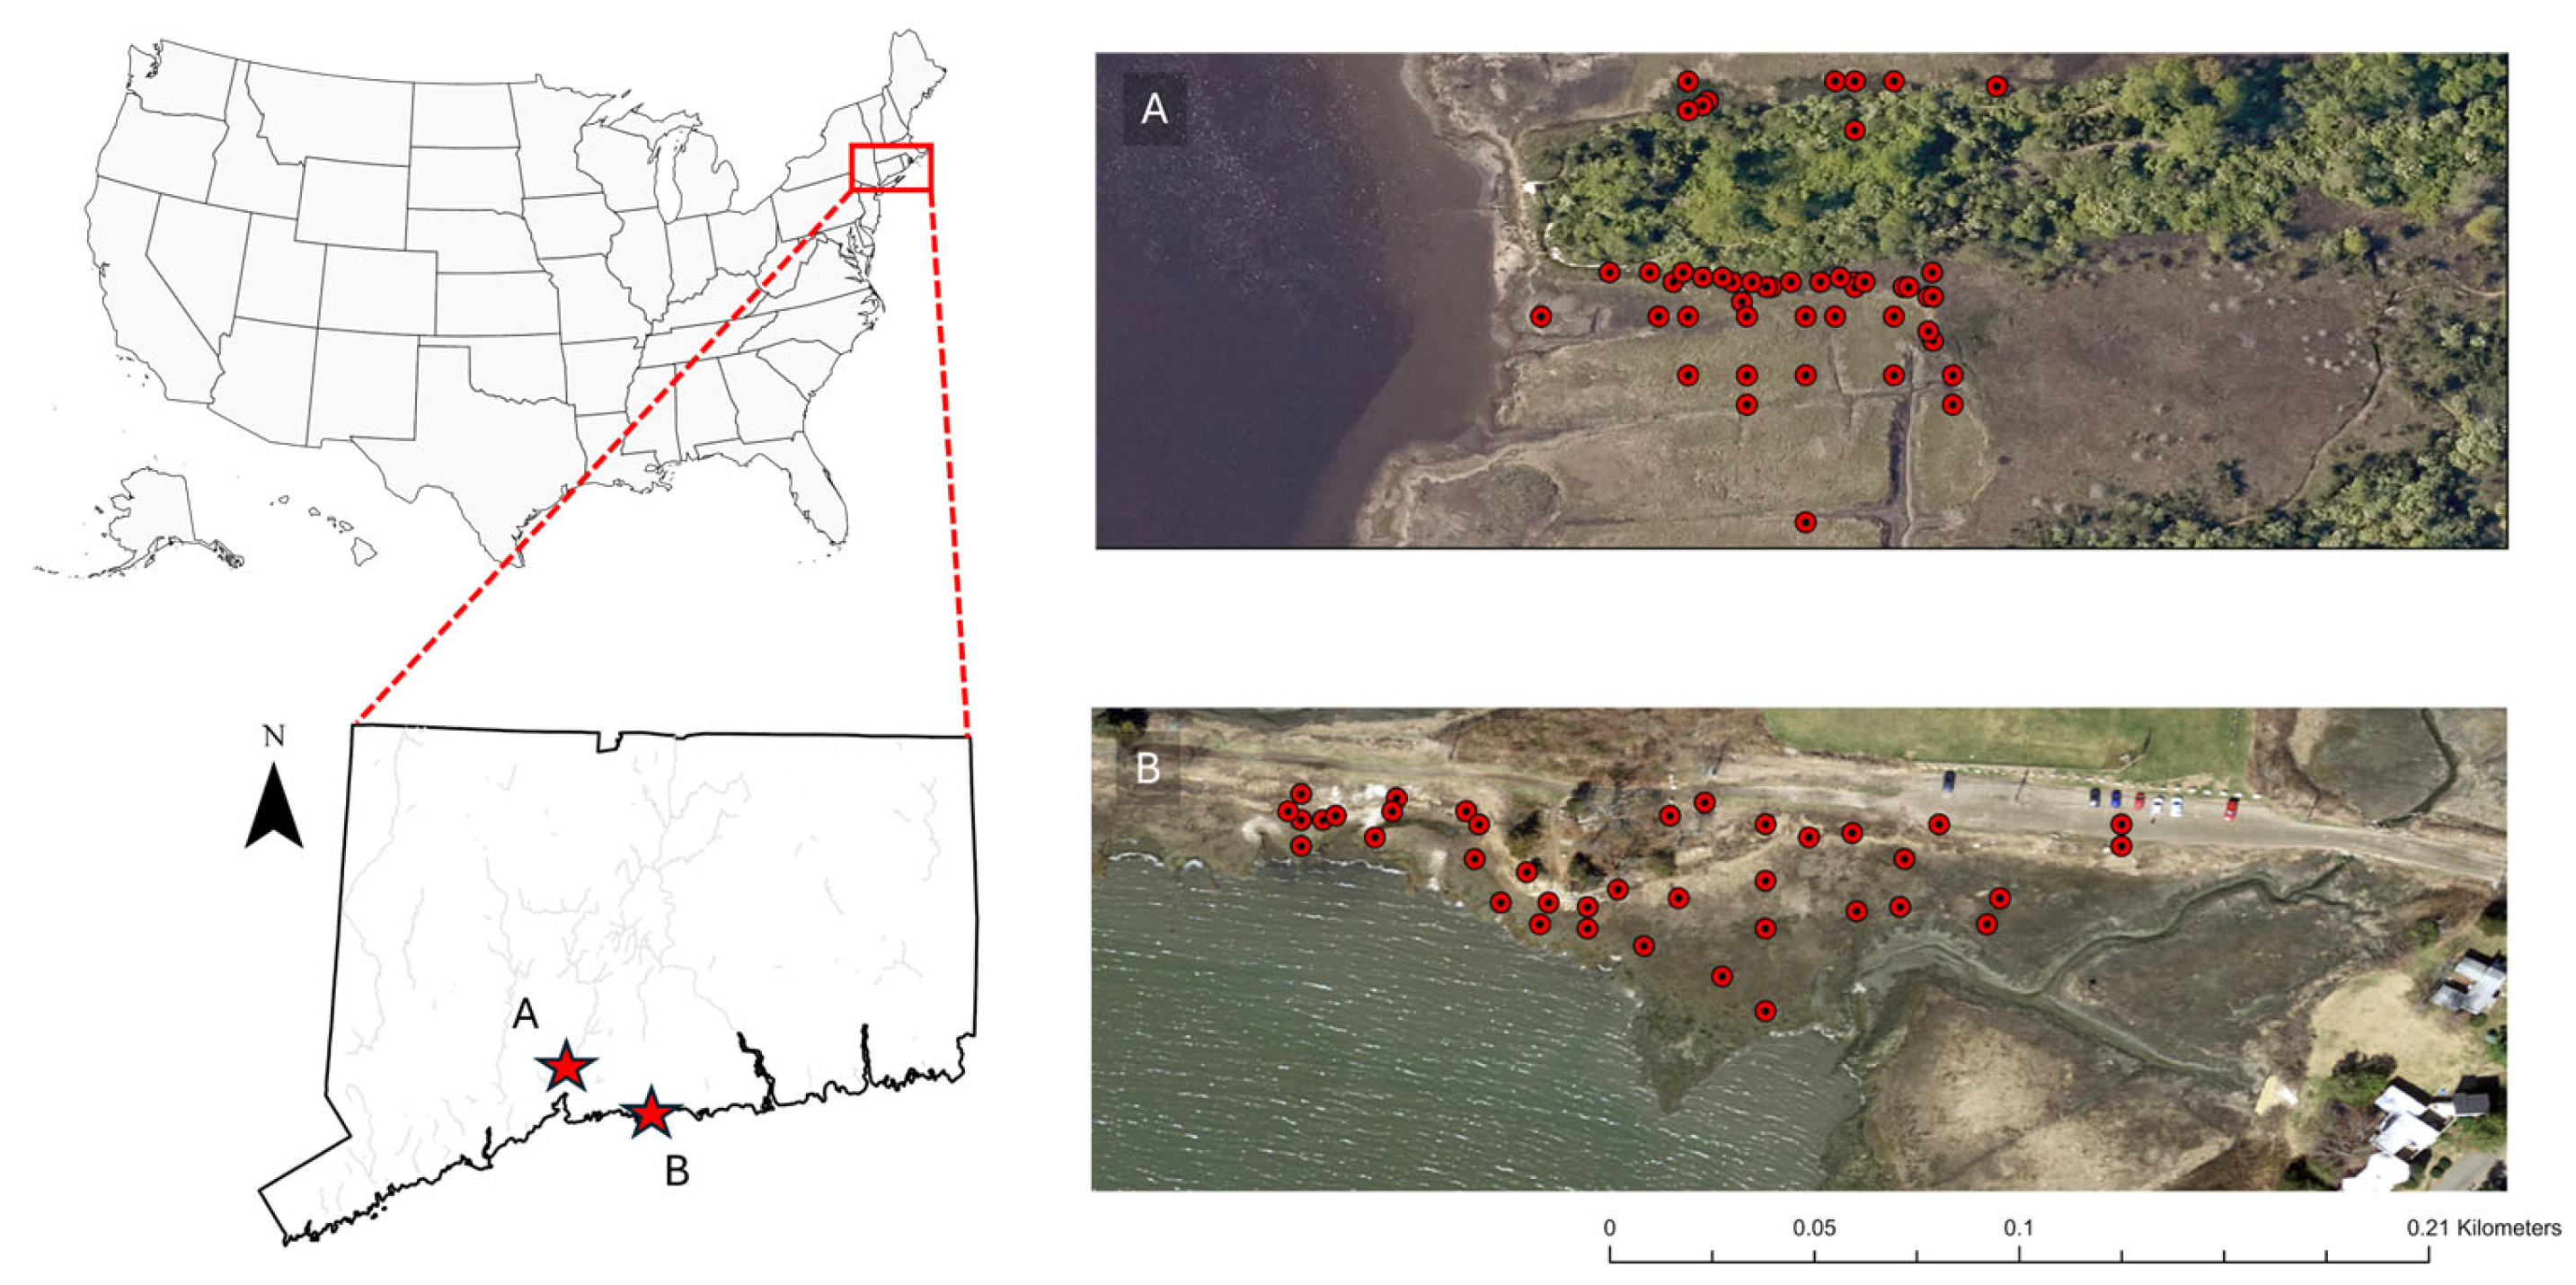
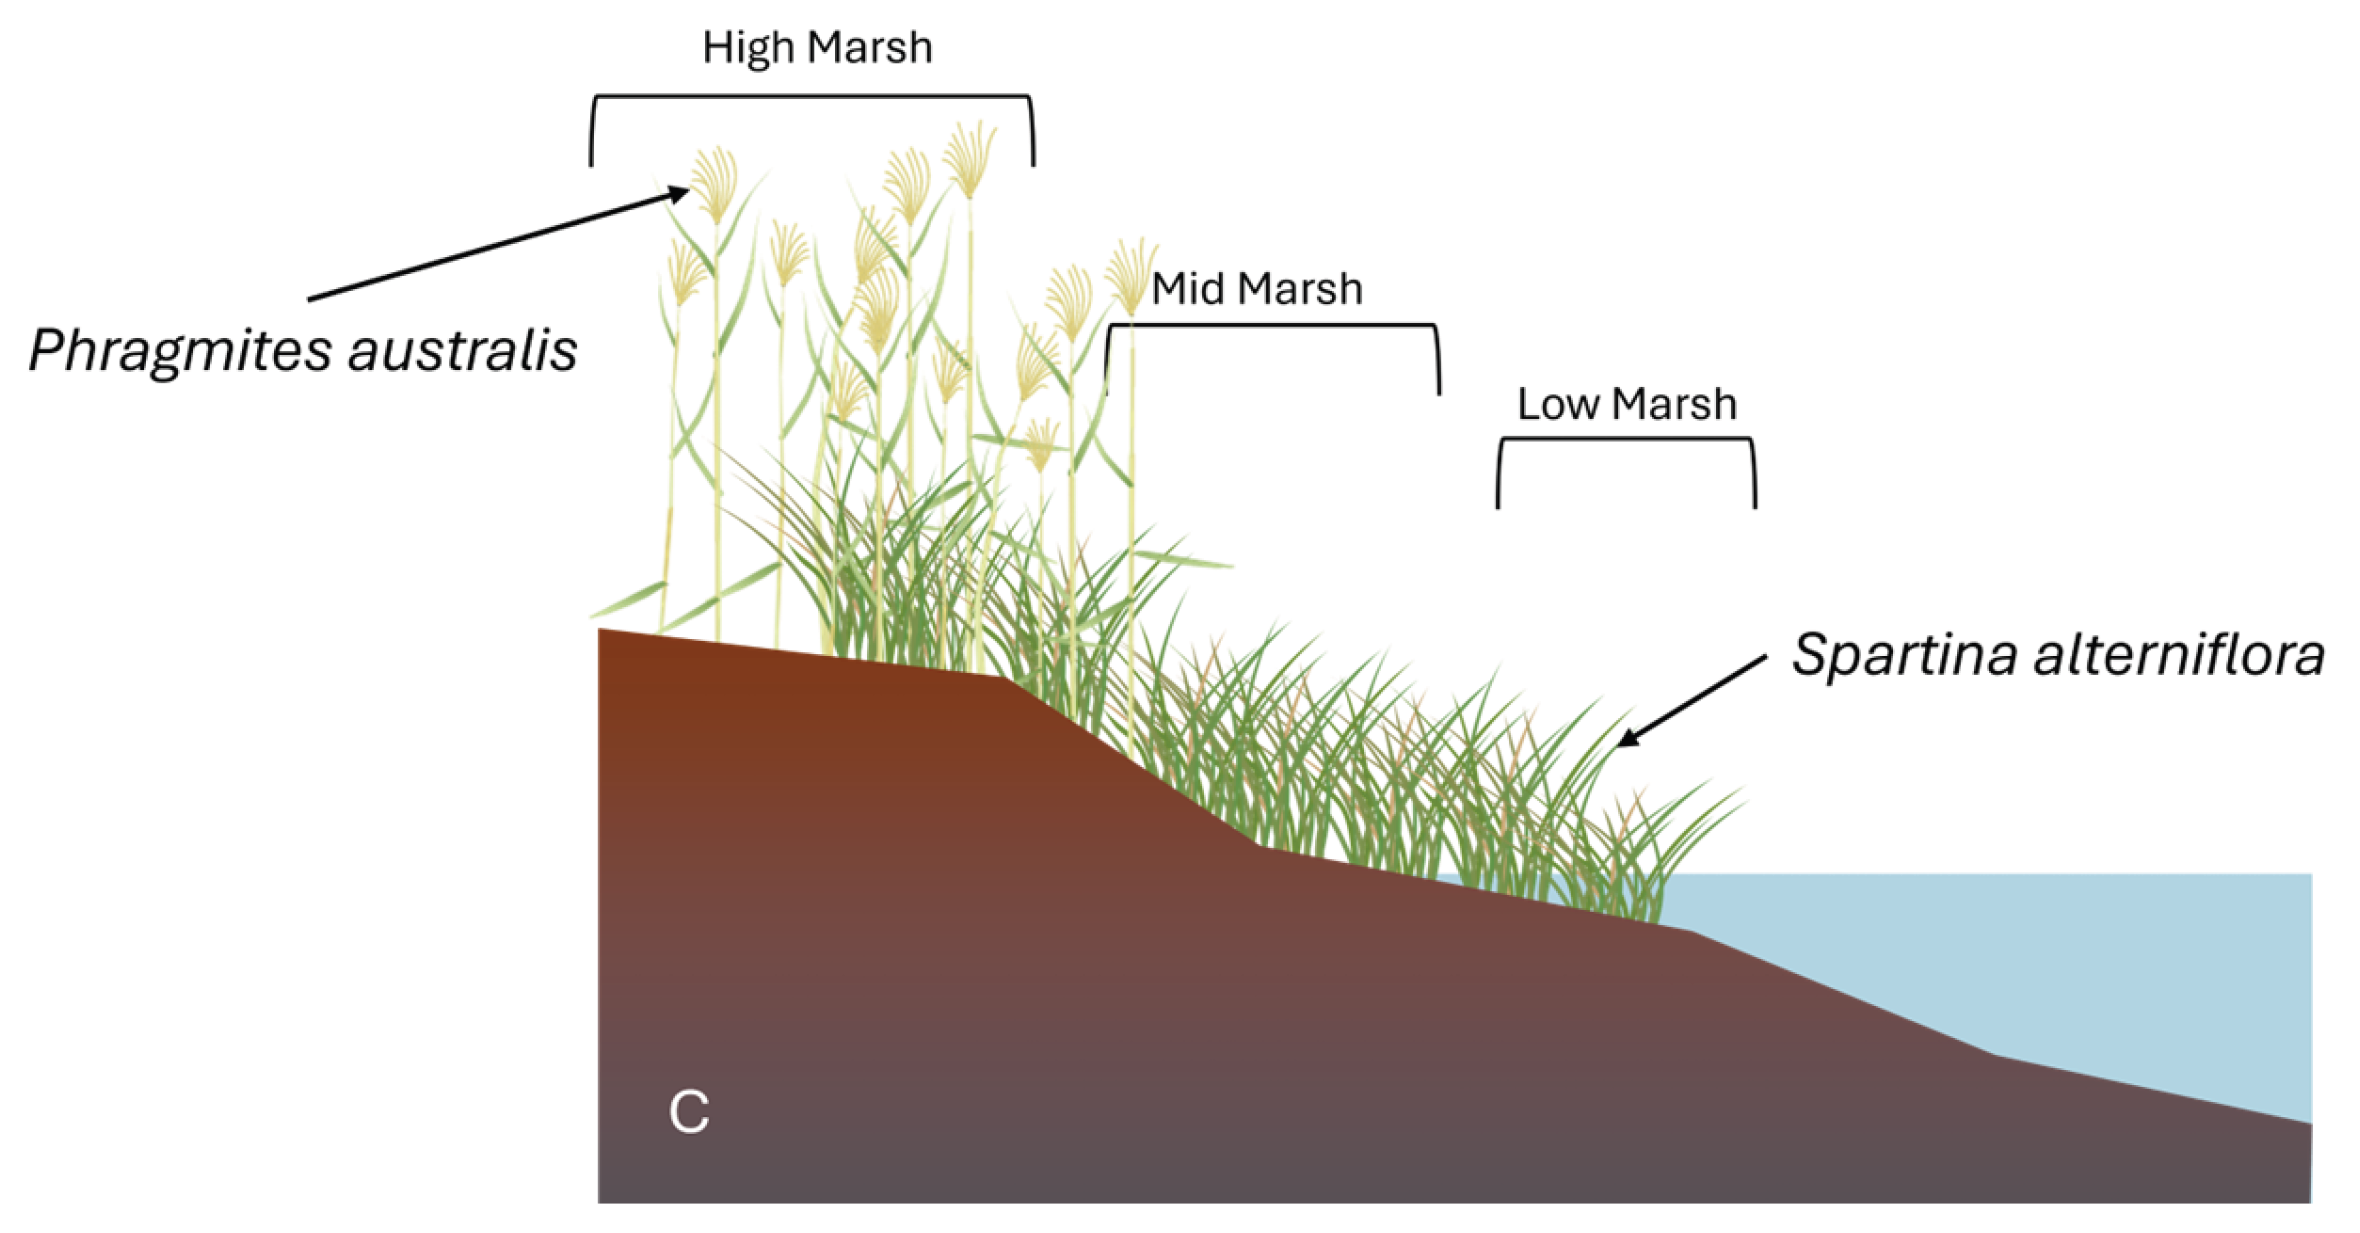
Figure 2.
Soil parameters by zone collected between the fall of 2022 and winter of 2023 under two dominant species in a tidal salt marsh located in Branford, CT. Boxplots show median (solid line), mean (dashed line), interquartile range (box), range (whisker) and outliers. Asterisks at top right of each panel denote statistical significance between species (* = P < 0.05, ** = P <0.001, *** = P < 0.0001, ns = not significant). .
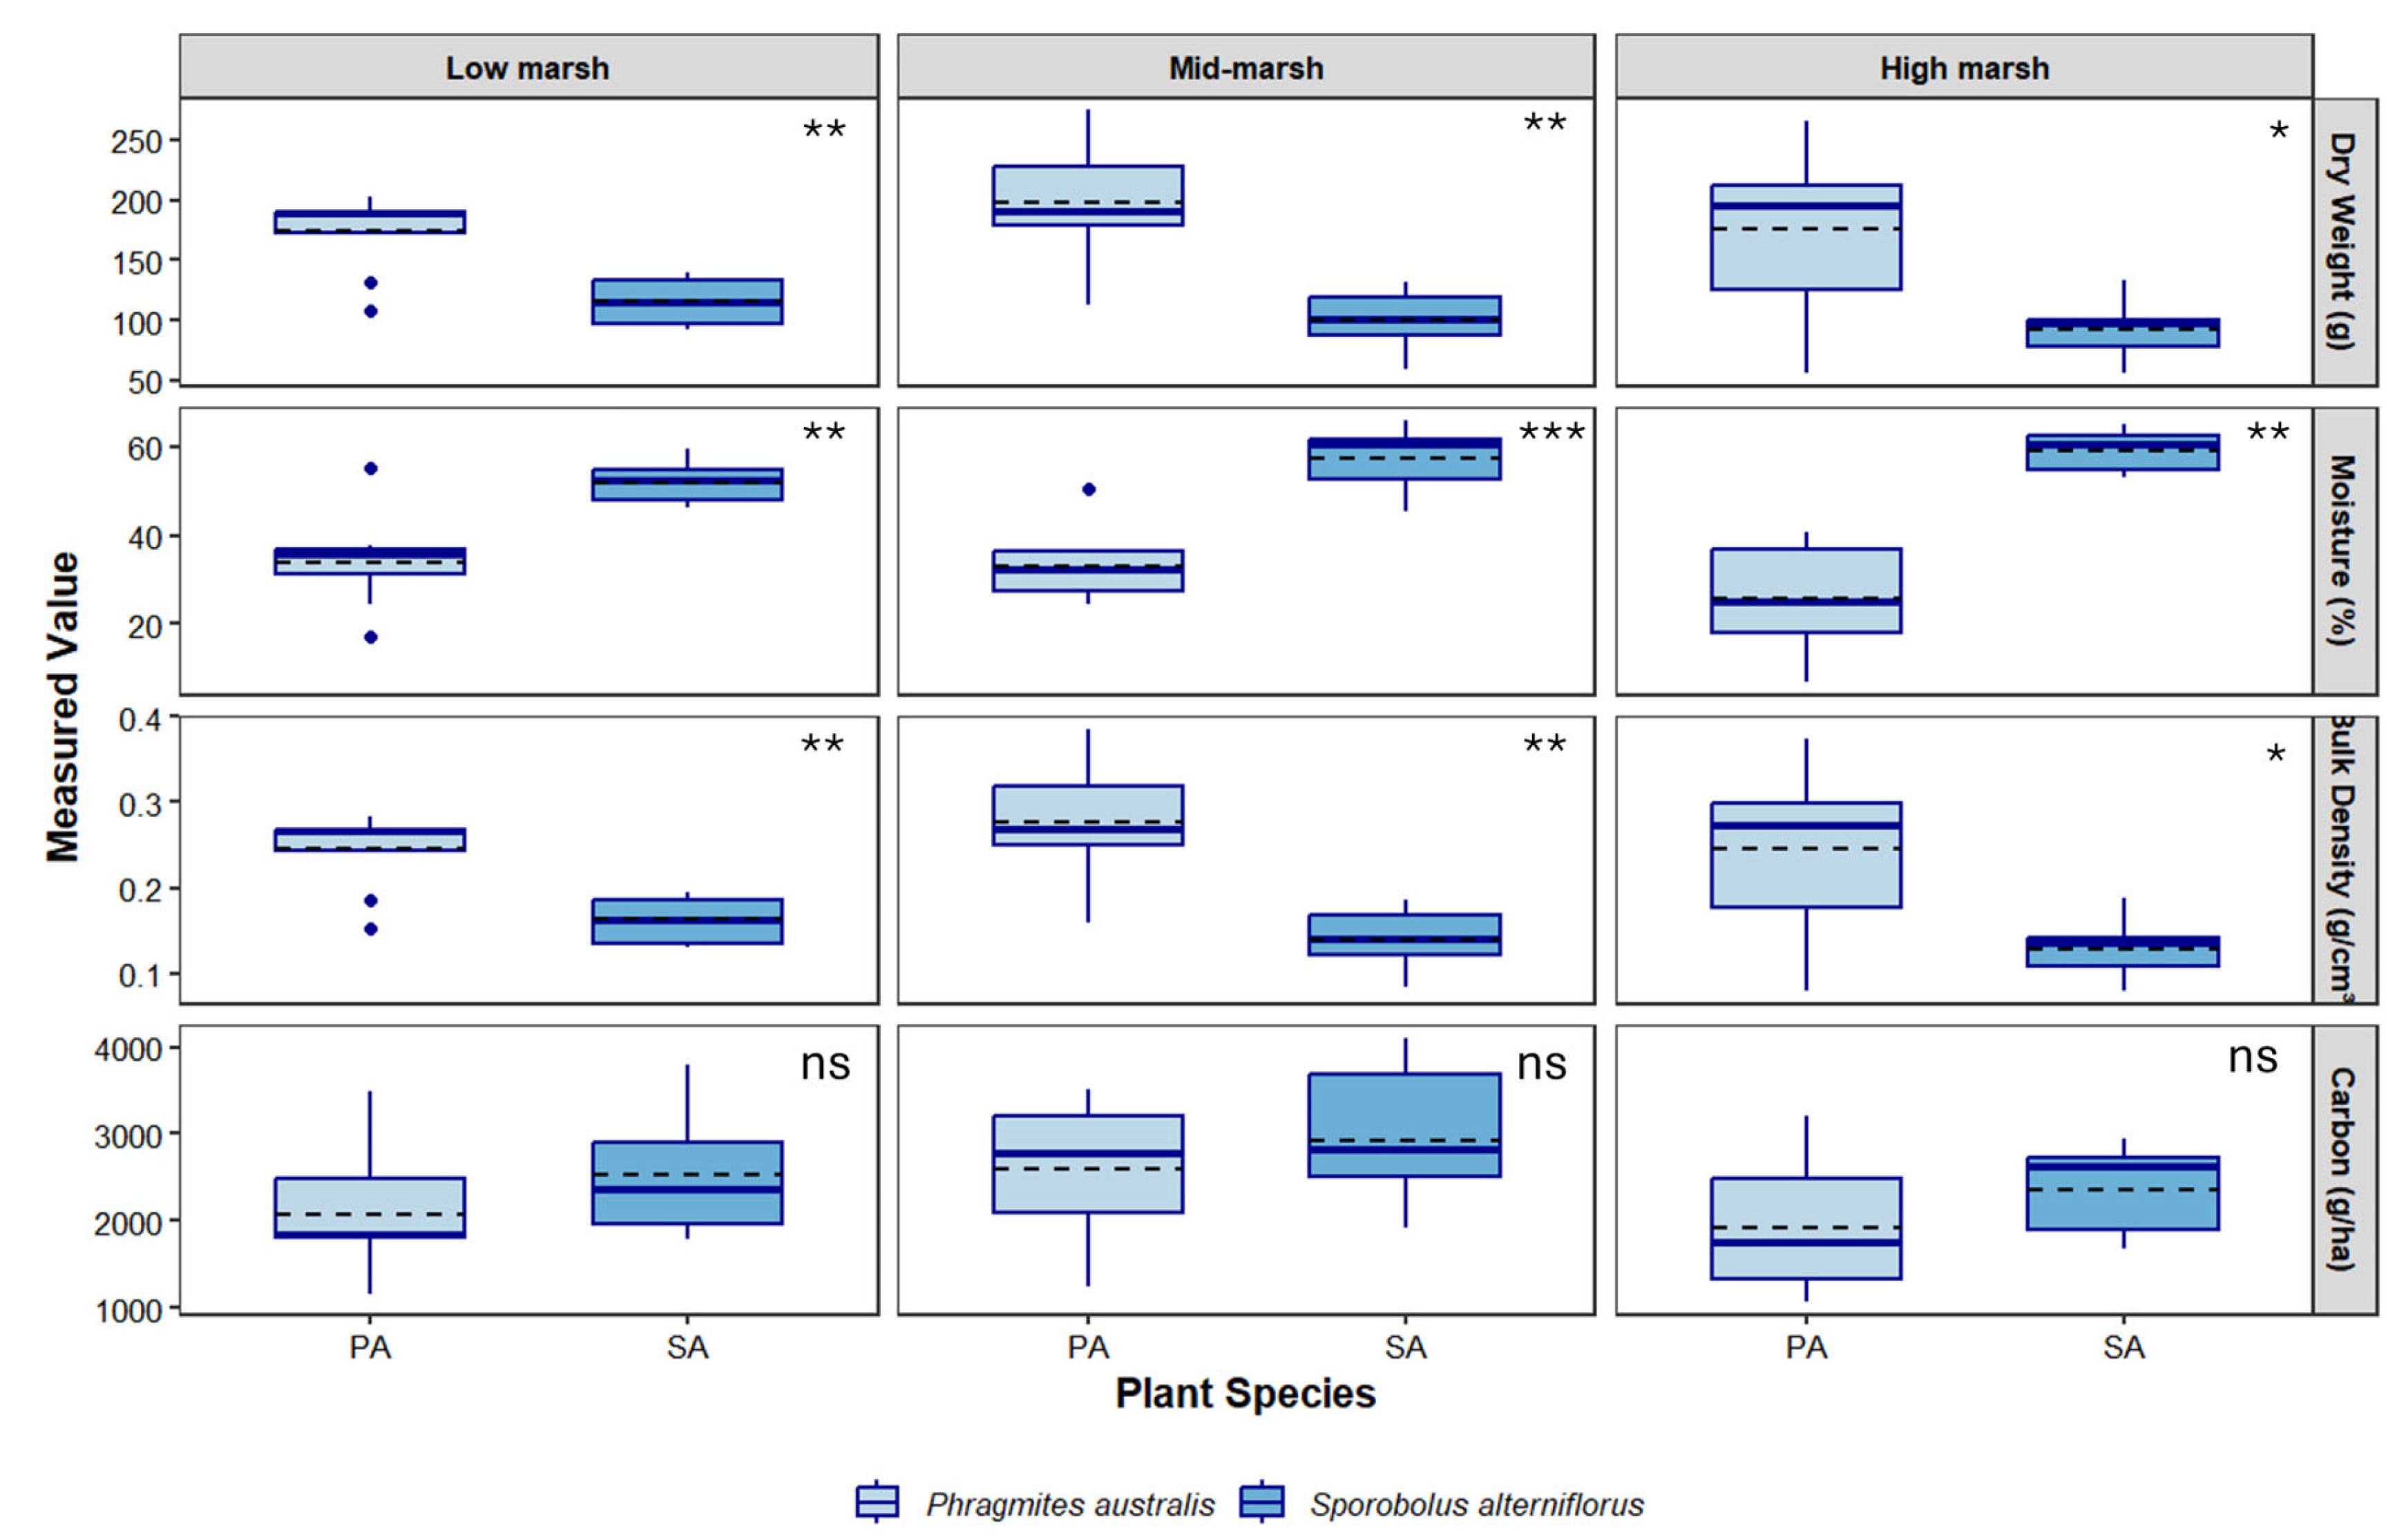
Figure 3.
Seasonal variation in dry weight, percent moisture, bulk density and total organic carbon (TOC) content of soils collected over the spring, summer and fall of 2024 under two dominant species in a tidal salt marsh located in Quinnipiac Meadows, CT. Boxplots show median (solid line), mean (dashed line), interquartile range (box), range (whisker) and outliers. Asterisks at top right of each panel denote statistical significance between species (* = P < 0.05, ** = P <0.001, *** = P < 0.0001, ns = not significant). .
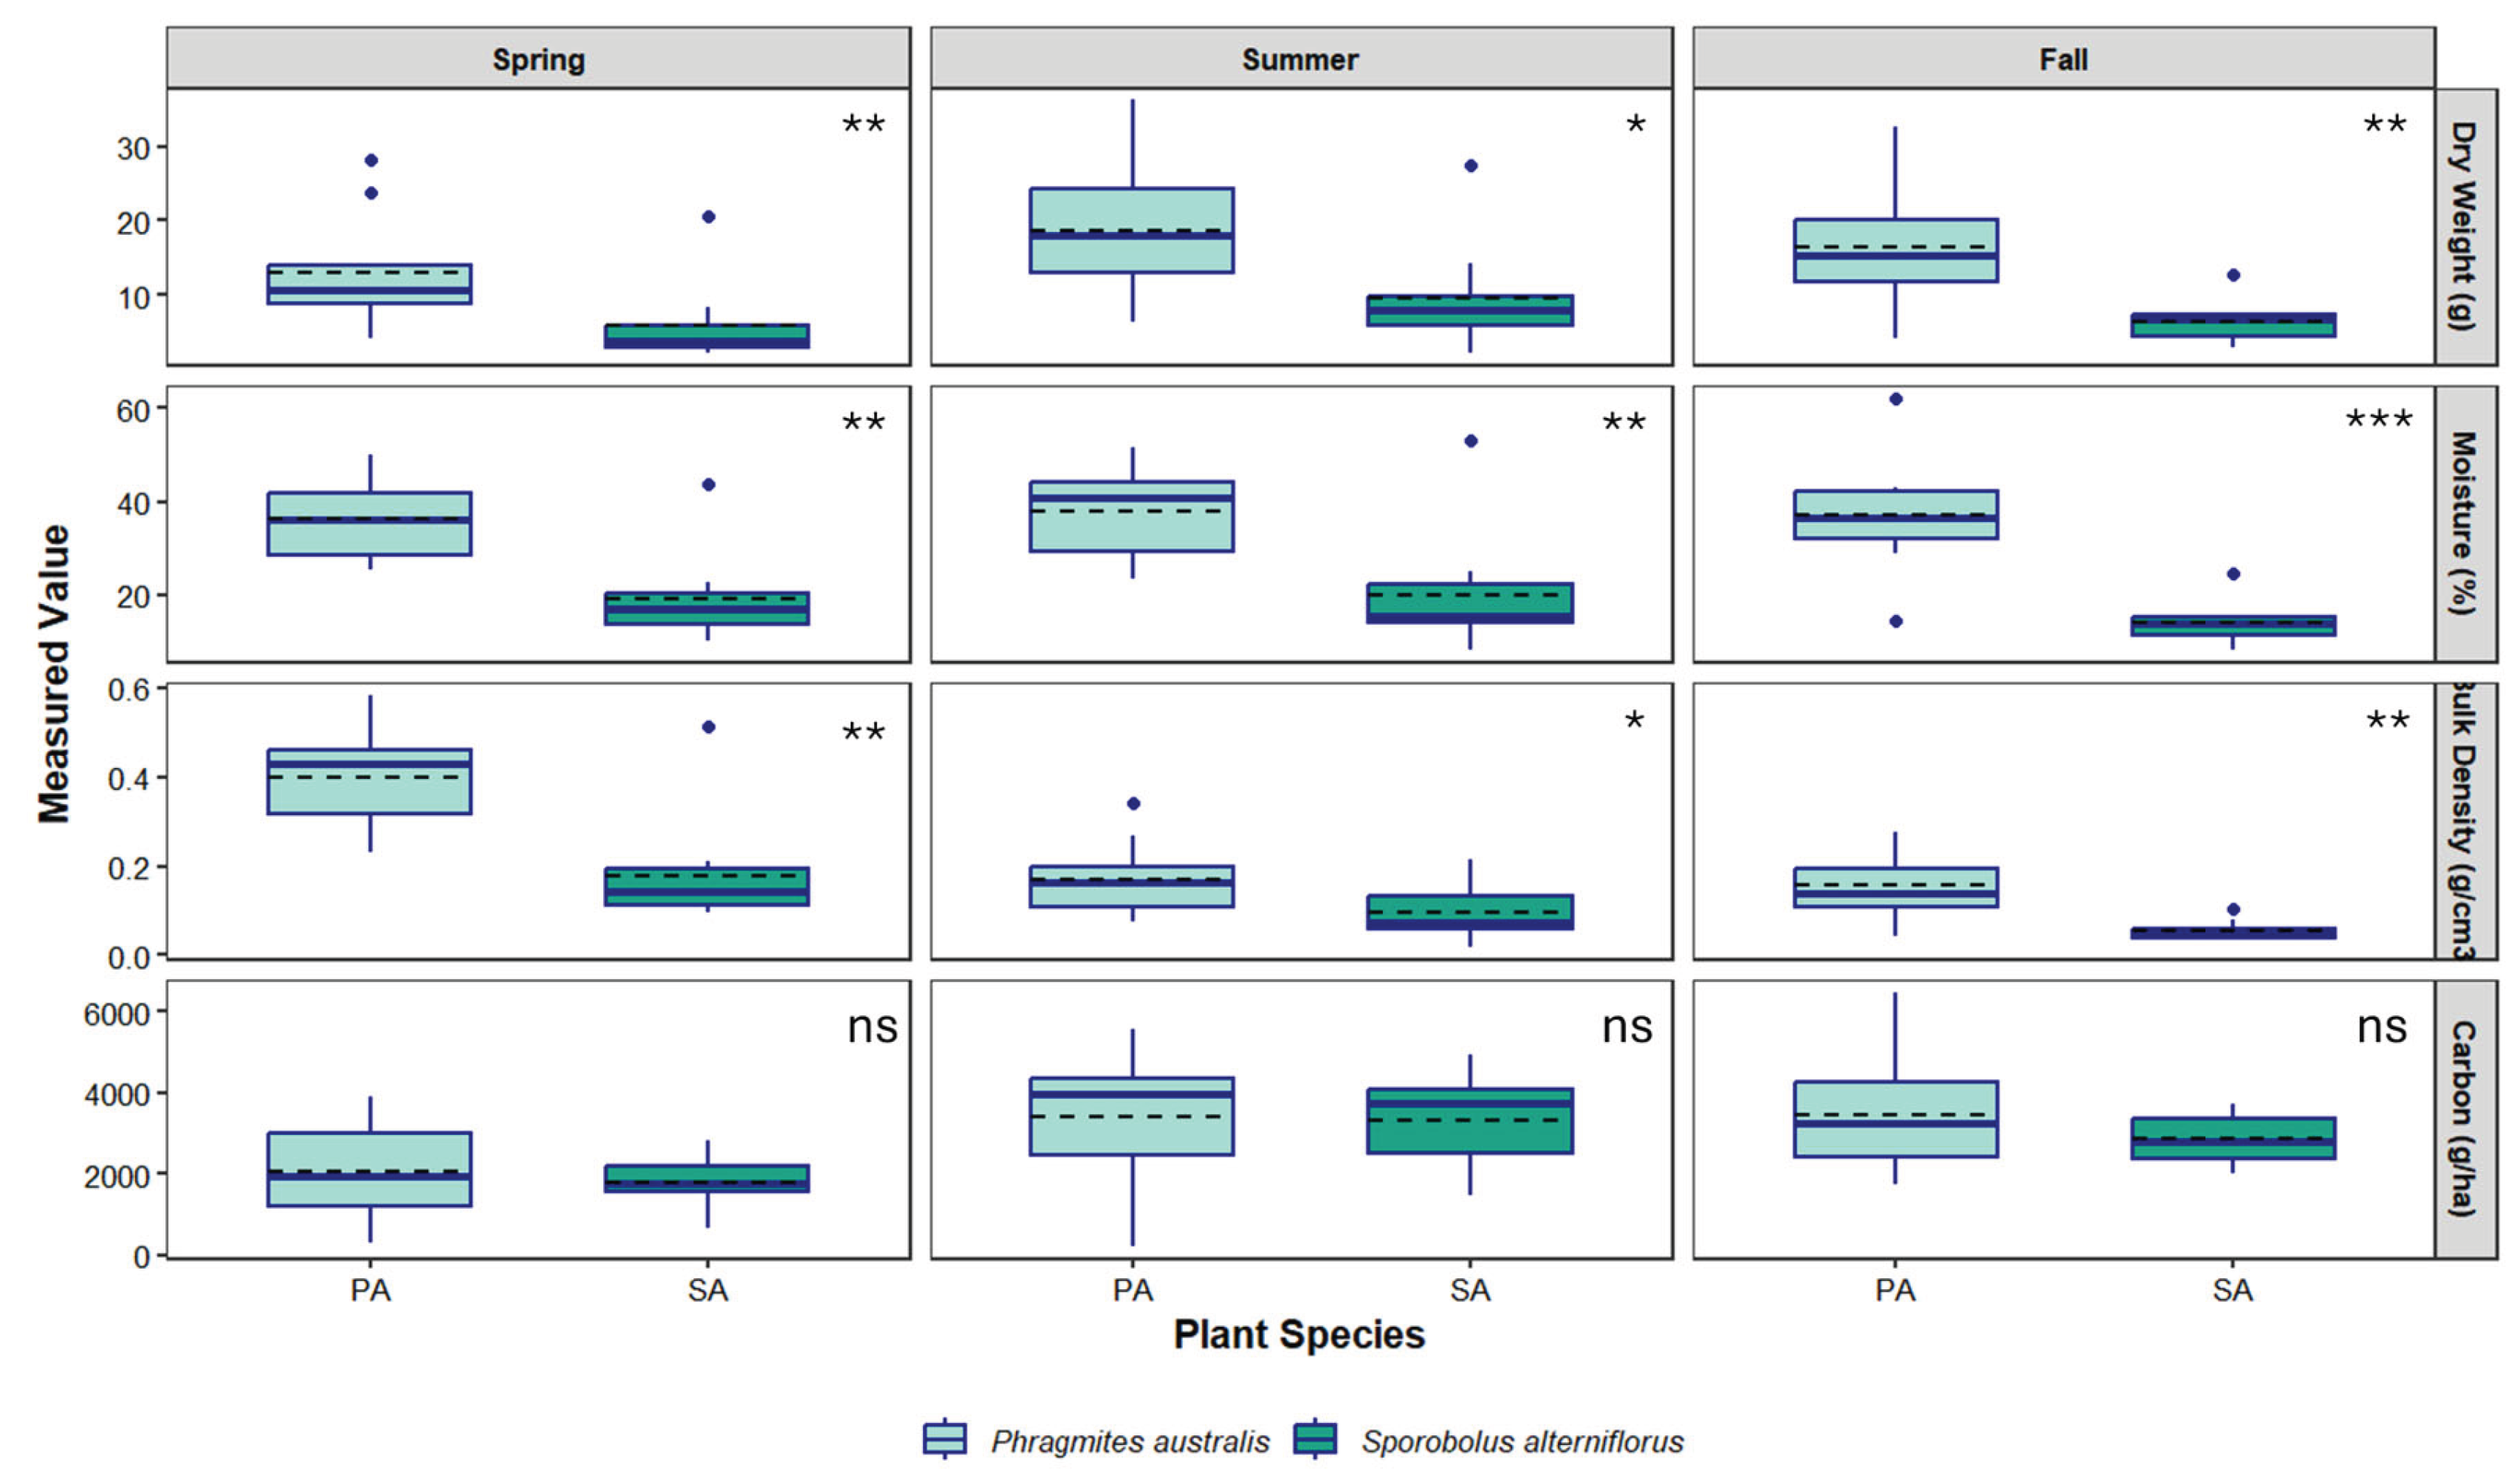

Table 1.
Mean soil parameters along transects surveyed at a tidal salt marsh in Branford, CT from October 2022 to February 2023. Mean elevation at the high marsh was approximately 0.7 meters above sea level.
Table 1.
Mean soil parameters along transects surveyed at a tidal salt marsh in Branford, CT from October 2022 to February 2023. Mean elevation at the high marsh was approximately 0.7 meters above sea level.
| Species | N | High marshSE) | Mid marshSE) | Low marshSE) | |
|---|---|---|---|---|---|
| Dry weight (g) | P. australis | 9 | 175.33 ± 22.67 | 197.25 ± 17.39 | 174.49 ± 10.87 |
| S. alterniflorus | 7 | 91.98 ± 9.31 | 102.70 ± 8.12 | 116.02 ± 6.21 | |
| Bulk density (g cm-3) | P. australis | 9 | 0.26 ± 0.03 | 0.28 ± 0.02 | 0.24 ± 0.02 |
| S. alterniflorus | 7 | 0.14 ± 0.03 | 0.14 ± 0.01 | 0.16 ± 0.01 | |
| Carbon weight percent (%) | P. australis | 9 | 30.00 ± 4.13 | 31.91 ± 2.89 | 29.67 ± 5.77 |
| S. alterniflorus | 7 | 56.04 ± 8.24 | 74.90 ± 9.68 | 52.00 ± 4.21 | |
| Total Organic Carbon (g ha-1) | P. australis | 9 | 1915.40 ± 239.23 | 2596.41 ± 267.58 | 2065.79 ± 249.58 |
| S. alterniflorus | 7 | 2351.09 ± 197.21 | 3065.70 ± 266.47 | 2522.15 ± 217.15 |
Table 2.
Seasonal variations in soil parameters along transects surveyed Quinnipiac Meadows over the Spring, Summer and Fall of 2024.
Table 2.
Seasonal variations in soil parameters along transects surveyed Quinnipiac Meadows over the Spring, Summer and Fall of 2024.
| Species | N | SpringSE) | SummerSE) | Fall | |
|---|---|---|---|---|---|
| Dry weight (g) | P. australis | 10 | 12.92 ± 8.37 | 18.63 ± 2.82 | 16.46 ± 2.61 |
| S. alterniflorus | 10 | 5.78 ± 1.74 | 9.52 ± 2.33 | 6.34 ± 0.88 | |
| Bulk density (g cm-3) | P. australis | 10 | 0.40 ± 0.03 | 0.17 ± 0.03 | 0.16 ± 0.02 |
| S. alterniflorus | 10 | 0.18 ± 0.04 | 0.10 ± 0.02 | 0.06 ± 0.01 | |
| Carbon weight percent (%) | P. australis | 10 | 8.13 ± 1.34 | 9.45 ± 1.67 | 11.06 ± 2.09 |
| S. alterniflorus | 10 | 19.03 ± 2.66 | 20.84 ± 2.68 | 22.30 ± 1.87 | |
| Total Organic Carbon (g ha-1) | P. australis | 10 | 2035.10 ± 367.45 | 3389.83 ± 528.19 | 3438.59 ± 480.02 |
| S. alterniflorus | 10 | 1794.80 ±185.53 | 3324.65 ± 400.73 | 2849.43 ± 200.84 |
Disclaimer/Publisher’s Note: The statements, opinions and data contained in all publications are solely those of the individual author(s) and contributor(s) and not of MDPI and/or the editor(s). MDPI and/or the editor(s) disclaim responsibility for any injury to people or property resulting from any ideas, methods, instructions or products referred to in the content. |
© 2026 by the authors. Licensee MDPI, Basel, Switzerland. This article is an open access article distributed under the terms and conditions of the Creative Commons Attribution (CC BY) license (http://creativecommons.org/licenses/by/4.0/).
Copyright: This open access article is published under a Creative Commons CC BY 4.0 license, which permit the free download, distribution, and reuse, provided that the author and preprint are cited in any reuse.


