
Submitted:
27 December 2025
Posted:
29 December 2025
You are already at the latest version
Abstract
The landmine press in a reliable and valid test for assessing upper body push strength. This study developed a markerless, non-contact vision-based system with an enhanced YOLOv8 model and mathematical modeling to measure four kinematic indicators during the concentric phase of the landmine press. By integrating a polarized self-attention mechanism, an improved C3k2 module, and an optimized SPPF structure, the system significantly enhanced detection accuracy and robustness for small targets at both ends of the barbell, achieving an mAP@0.5 of 0.995 on the test set. Agreement validation with the GymAware linear transducer across four loads (20–35 kg) in 247 trials showed strong correlations (r > 0.85) for peak velocity, mean velocity, peak power, and mean power. Although the vision-based method systematically overestimated velocity metrics due to differences in barbell length measurement, the bias was predictable. Moreover, it outperformed GymAware under high-load conditions (35 kg) by avoiding sensor drift and noise. The findings demonstrate that this vision-based system offers a reliable and practical solution for monitoring landmine press kinematics, suitable for both training and scientific research.
Keywords:
landmine press
; kinematics
; YOLOv8
; mathematical modeling
1. Introduction
The landmine is a barbell setup with one fixed end anchored to the floor [1], and the other end is free-moving [2]. Typically, the fixed end is secured to the ground using a three-dimensional base fixed to the floor or barbell plates and sandbags [3]. The landmine is suitable for athletes to develop unilateral strength and anti-rotation core stability [4]. The common training exercises include the press, clean, rotation, squat, and deadlift [4].
The standing landmine press is performed from a non-dominant foot forward stance, with the athlete push the moved end rapidly from elbow towards the ground to arm extension with an initial 40-60°angle. The movement pattern is similar with to the straight punch in boxing, emphasizing lower-body triple extension, torso rotation and upper-body push. Studies has showed that the landmine press is a highly reliable tool for assessing upper-body power in sports like boxing and MMA [2]. It also serves as a valid training method for improving punching force [1]. During landmine press testing and monitoring, sport scientists commonly monitor indicators such as peak velocity, mean velocity, peak power, mean power, peak force, mean force, and barbell displacement [5].
In the velocity indicators, the peak velocity is highly related to the punch effect [6]. Mean velocity is a vital velocity-based training metric for predicting the 1RM [5].
Among power indicators, peak power is directly associated the power output of punching movement [5], and mean power serves to evaluate an athlete’s ability to maintain power output over time [5].
In current practice, the primary technology for monitoring the landmine press is the Linear Position Transducer (LPT). Representative devices such as the GymAware (GymAware, ACT, Australia) employ a cable attached the moving end of the barbell. The sensor calculates barbell trajectory based on the vertical displacement of this cable. An internal encoder records the real-time positional changes of the cable at a sampling frequency of 50 Hz. Combing with time and angle information, the velocity can be computed. Consequently, force and power can be calculated. Research indicates that its reliability is superior with low to moderate loads but decreases when the load increases. Especially, at a load of 35kg, intraclass correlation coefficient falls below 0.75 [5]. The movement control ability of athletes declines with the heavier load, which can cause zero drift and cumulative noise in the LPT to lead the error of displacement measurement [7]. The LPT technology represented by GymAware is regarded as the "golden standard" for monitoring barbell training [7]. Nevertheless, it presents certain limitations, in the following aspects: (1) zero drift and signal noise of LPT [7]. (2) The ability to monitor diagonal movement trajectories is poor [5]. (3) Manual zeroing is required for each test [5]. Therefore, a primary objective for a novel monitoring system is to demonstrate valid and reliable measurements especially under high-load conditions where current technologies are known to fail.
The purposes of this study are as follows: (1) to develop a computer vision-based algorithm for measuring kinematic indicators during the concentric phase of the landmine press, with an enhanced YOLOv8 object detection model and mathematical modeling; (2) to collect paired kinematic data during the concentric phase under various loads using both the vision-based algorithm and GymAware, and to assess the agreement between the two systems. The objective of this study was to develop a reliable and markerless vision-based method for measuring kinematic indicators during the concentric phase of the landmine press.
2. Materials and Methods
2.1. Data Collection and Annotation
This study constructed a self-collected dataset. A camera (Sony FDR-AX60, 50 fps, 1080p) fixed at a 90°frontal view in a controlled gym environment recorded 15 videos of different loads standing landmine press with two volunteers. Both the moving and fixed ends of the barbell remained within the video frame throughout the movement. All video frames were annotated according to a standard protocol. A single researcher labeled and tagged the moving end and the fixed end with oriented bounding boxes (OBBs) using the X-AnyLabeling tool. To verify annotation consistency, a random sample of 100 frames was cross-checked by a second researcher. The root mean square error (RMSE) of the annotation coordinates was less than 2.5 pixels, confirming high inter-rater reliability. An annotated dataset comprising 1,120 frames was established.
2.2. An Improved YOLOv8-Based Object Detection Approach
Based on the YOLOv8-OBB framework, this study employs an improved BAN-YOLO architecture to optimize the model for precise detection of two small targets: the moving and fixed ends of the landmine.
The model was enhanced with three key improvements for small object detection. First, during the press, the athlete's torso and limbs produce accompanying movements, creating a complex dynamic background. The "filter and focus" mechanism of the Polarized Self-Attention (PSA) module can eliminate these distractions and concentrate computational resources on the small yet critical regions of interest at both ends of the barbell [8].
Second, the barbell undergoes a wide range of angular variation during the press. Accurately capturing this angular motion is critical for kinematic analysis. To address the potential loss of angular signal that may occur when using a single-feature-path approach to capture such a broad range of rotational changes, the standard C3 module was replaced with the C3k2 module. The heterogeneous fusion paths of C3k2 enable the parallel processing of features at different levels of abstraction: local fine-grained features are leveraged to detect subtle initial angular displacements, while global contextual features help stabilize angle estimation under challenging conditions such as complex backgrounds or motion blur [9].Third, accurate determination of the moving end's instantaneous state (e.g., concentric phase, peak instant) requires the model to understand the brief motion context surrounding a frame. the SPP module was substituted with a faster SPPF module, which uses serial 5×5 max-pooling layers to capture contextual information across varying receptive fields for each target with high computational efficiency. This design not only enhances the differentiation between normal motion and anomalous jitter but also ensures high processing speed [10]. The improved model architecture diagram is shown in Figure 1.
The improved BAN-YOLOv11m-OBB model was trained on the LP dataset for 120 epochs, initialized with pre-trained weights. Training used a 960×960 input size, a batch size of 4 (effective size 64 via gradient accumulation), and an automated optimizer (learning rate set to 0.01). Data augmentation included HSV, mosaic (disabled last 10 epochs), and Randaugment. Key metrics were precision, recall, mAP@0.5, and mAP@0.5:0.95. All experiments were run on a single GPU.
2.3. Mathematical Modeling
2.3.1. Identifying Moving and Fixed Ends and Establishing Coordinates
This study used deep learning for rotated rectangle detection to identify landmine bars' posture. For each detected bounding rectangle, its four corners were arranged into a coordinate matrix:
The principal axis orientation of the rotated rectangle was determined by calculating the Euclidean distance between adjacent corner points.
L1 and L2 denote the lengths of two adjacent sides. The longer side was defined as the landmine's principal axis. The axis endpoints were calculated as the midpoints of the two opposing longer sides:
Based on the exercise's biomechanics, this study distinguishes dynamic and static ends by their vertical (Y-axis) position. In the image (origin top-left), the fixed end is typically lower, while the moving end is upper. The discriminant function is:
represents the Y-coordinate. This criterion utilizes the physical constraint that the fixed end's spatial position is relatively stable during the exercise.
A scale calibration factor was introduced to convert pixel to physical coordinates. First, the average bar length was calculated as follows:
Given the actual bar length, the scale factor ss was calculated as:
The final trajectory in the physical coordinate system was:
2.3.2. Mathematical Calculation of Kinematic Indicators
In accordance with the methodology depicted in Figure 2, the kinematic indicators of the moving end relative to the stationary end of the barbell were calculated through mathematical modeling.
First, the real-time angle θ between the barbell and the horizontal plane was calculated. Given the fixed end coordinatesand the moving end coordinates , the angle was computed using the four-quadrant inverse tangent function.
To eliminate angular jumps, a phase unwrapping algorithm was applied:
where satisfies .
The angular velocity ω(t) was computed using the central difference method, following smoothing with a Savitzky-Golay filter:
The angular acceleration α(t) was obtained by differentiating the angular velocity with respect to time:
where Δt=1/fps is the sampling interval.
The tangential linear velocity v(t) was determined based on the product of the angular acceleration α(t) and the barbell length L:
The barbell length L, obtained through calibration, was 2.2 m in this study for the Olympic barbell.
The tangential force F(t) comprises both inertial and gravitational components:
where m denotes the total barbell load, defined as the sum of the barbell's mass and the attached weight plates.
The mechanical power was computed as follows:
2.3.3. Data Preprocessing and Filtering Methods
To ensure the reliability of the kinematic indicators (Velocity, Acceleration) extracted from the raw video coordinate data and to suppress the amplification effect of noise during numerical differentiation, this study adopted a tandem data filtering pipeline, with all signal processing implemented in Python (Using the Scipy library).
First, the raw 2D coordinate data was first smoothed using a Savitzky-Golay filter (window size=9, polynomial order=3). This method performs local polynomial fitting to preserve high-frequency features while minimizing phase distortion from excessive smoothing.
Subsequently, When calculating velocity, filtering was applied pre- and post-differentiation due to noise sensitivity. Input signals (θ(t), y(t)) were smoothed using a Savitzky-Golay filter. The computed v(t) was then processed with a zero-phase Butterworth low-pass filter to eliminate phase delay and ensure accurate peak timing.
Acceleration was derived by numerically differentiating the smoothed velocity signal. To mitigate noise sensitivity, the velocity was pre-filtered with a Savitzky-Golay filter using an enlarged window. The resulting acceleration was then processed with a 6 Hz Butterworth low-pass filter to reduce tremor and measurement noise.
2.3.4. Division of the Concentric Phase
To assess concurrent validity with the GymAware device, the concentric phase recognition algorithm in this study was aligned with the method described in GymAware [11]. It is defined as the movement interval during which the barbell overcomes gravity and moves upward with an acceleration. The identification of the concentric phase must adhere to the following two criteria.
- Direction Criterion: The velocity signal must be positive , ensuring an upward movement direction.
- (Significance Criterion: The velocity magnitude must exceed a 0.5 m/s threshold to filter noise and ensure genuine mechanical output. Points meeting this and the angle criterion were marked as candidates. The algorithm then merged consecutive candidates into intervals. To prevent misclassifying transient fluctuations as valid movements, each interval had to last at least 5 frames (~0.1 s at 50 fps); shorter intervals were discarded as noise.
2.3.5. Values During the Concentric Phase
The peak value within the concentric phase was detected using a maximum filter followed by a smoothing procedure.
Specifically, the algorithm applied a one-dimensional maximum filter with a window size of 5, and then smoothed the output using a Savitzky-Golay filter (denoted as SG()).
The mean value for the concentric phase was calculated using a time-weighted average, as defined by the following formula:
2.4. Agreement Validation Experiment
2.4.1. Sample Size
A priori sample size calculation was performed using G*Power (version 3.1.9.7). The test family "t tests" with the statistical test "Means: Difference between two dependent means (matched pairs)" was selected. Cohen's d was set to 0.4, based on the effects observed in previous studies by Balsalobre-Fernández et al. [12]involving barbell displacement measurement during the back squat with optical cameras and Achermann et al. [13] involving barbell velocity measurement during the snatch using a vision-based method. The significance level (α) was set at 0.05, and the statistical power (1-β) was set at 0.80. The a priori analysis indicated that a sample of 52 paired measurements was required to detect a significant difference.
2.4.2. Participants
24 male collegiate athletes from the School of Physical Education at Yunnan Agricultural University were recruited as participants (age = 21.3 ± 2.2 years, training experience = 3.2 ± 0.8 years). All participants met the following inclusion criteria: (1) no upper or lower body injuries within the past six months; (2) more than two years of strength and conditioning training experience, with a training frequency of more than three sessions per week over the recent three months; (3) familiarity with the landmine press movement; and (4) right-hand dominance.
2.4.3. Experimental Design
Upon arrival at the gym, participants warmed up for 15 minutes standardly, including: jogging, dynamic stretching, and plyometric push ups. After a 3-minute rest, participants performed the landmine press test in a split stance (left leg forward, right leg back, with toes pointing forward) with incremental loads of 20kg, 25kg, 30kg, and 35kg. 3 reps were completed at each load. During the press, participants were required to fully grip the moving end. Press the barbell from the moving end close to the deltoid muscle. If a participant failed to lift a given load, the testing was immediately finished, and no further load increments were applied.
A Sony FDR-AX60 camera recorded the entire landmine press test at 1080p and 50Hz. The camera was fixed in a position providing a direct 90-degree frontal view. Make sure that the moving and fixed ends of the barbell are included in every frame.
A GymAware RS (GymAware, ACT, Australia) collected barbell kinematic data Synchronously. The device was set up according to the instruction manual [11]: fix the Velcro at 15cm from the end of the moving end, fix the sensor to the ground using weight plates, and ensure the cable is perpendicular to the ground. The "Landmine Press (R)" mode was selected for recording. The device was zeroed before each trial. The tests and video recording were both conducted in the indoor gym of Yunnan Agricultural University.
2.5. Statistic Analysis
To assess the agreement between the vision-based method and the GymAware, the following statistical analyses were applied to the paired data synchronously collected by both methods. All statistical analyses were performed using Python 3.12.7 (utilizing the pingouin, scipy, and matplotlib libraries), with the significance level (α) set at 0.05.
2.5.1. Data Preprocessing
Data pairs from the vision-based method and the GymAware measurement of the same landmine press movement, were extracted for subsequent analysis. Data are presented as Mean ± SD.
2.5.2. Statistical Analysis Methods
The Pearson correlation coefficient (r) quantified the linear correlation between the vision-based method and GymAware. Correlation strength was interpreted as [14]: r ≥ 0.9 (very strong), 0.7 ≤ r < 0.9 (strong), 0.5 ≤ r < 0.7 (moderate), 0.3 ≤ r < 0.5 (weak), and r < 0.3 (very weak).
Since both measurement methods might have errors, Deming regression was used to evaluate the systematic differences between them. This method can more accurately calculate the regression slope and intercept, leading to unbiased estimates [15]. Assuming both methods had similar error variance (λ=1), we determined fixed bias by testing if the intercept significantly differed from zero, and proportional bias by testing if the slope significantly differed from one. We reported 95% confidence intervals for both to facilitate statistical inference.
Bland-Altman analysis assessed agreement between methods by plotting differences (vision-based minus GymAware) against their mean [16]. The mean difference with its 95% CI estimated average bias. Limits of Agreement (Mean ± 1.96×SD) defined the range containing 95% of differences, with their 95% CIs calculated. A paired t-test evaluated if a statistically significant mean difference existed.
3. Results
3.1. Results of the Object Detection Model Based on Improved YOLOv8
3.1.1. Model Training Convergence Results
The BAN-YOLOv11m-OBB model underwent complete training for 120 epochs, with a total training duration of 9954 seconds (approximately 2.76 hours). Figure 3 illustrates the progression of the loss functions and evaluation metrics throughout these 120 training epochs. On the training set, the bounding box loss decreased consistently from 3.10 to 0.93, the classification loss declined markedly from 4.09 to 0.45, and the Distribution Focal Loss reduced from 4.09 to 1.37. The validation set loss trends aligned with those of the training set, with the bounding box loss eventually converging to 0.50, the classification loss decreasing to 0.38, and the Distribution Focal Loss stabilizing at 1.65.
3.1.2. Model Detection Performance Results
The Precision-Recall curve of the proposed model on the test set is shown in Figure 4.
The model achieved a mean Average Precision (mAP@0.5) of 0.995, a maximum precision of 1.00, a maximum recall of 1.00, and an area under the precision-recall curve of 0.992.
The normalized confusion matrix for the proposed model is shown in Figure 5.
The model achieved a recall of 1.00 and a precision of 1.00 for the "fixed" category, with a background false detection rate of <0.05 and an overall classification accuracy of >0.98.
3.1.3. Model Robustness
The F1-score–confidence curve is depicted in Figure 6.
The maximum F1-score was 1.00. Furthermore, across a broad confidence threshold range from 0.0 to 0.8, the F1-score consistently remained at or above 0.95, with a remarkably low standard deviation of only 0.02, indicating high stability. The corresponding precision-confidence curve is presented in Figure 7.
The average precision across the entire confidence range was 0.998. The model demonstrated exceptional robustness, with precision maintaining a perfect value of 1.00 in the high-confidence interval (>0.7) and never dropping below 0.985 in the low-to-medium confidence intervals.
3.2. Results of the Agreement Validation Experiment
3.2.1. Kinematic Indicators
Four kinematic indicators (peak velocity, mean velocity, peak power, and mean power) with two measurement methods from a total of 247 landmine press trials were collected. These trials were performed by 24 participants across four different loads (20kg, n=72; 25kg, n=63; 30kg, n=56; 35kg, n=56). Table 1 and Figure 8 shows the values of the kinematic indicators (mean ± SD).
3.2.2. Bland-Altman Analysis
3.2.2. Agreement Analysis
4. Discussion
4.1. Optimization of the Small Object Detection Model
The model maintained robust performance across confidence thresholds, with F1-scores consistently ≥0.95 and a peak of 1. 00. Average precision reached 0.998 overall and 1.00 at high confidence levels. Minor loss fluctuations did not affect final performance, confirming strong reliability for practical deployment. Model performance on new task results are in Figure 11.
The proposed model demonstrated robust performance for barbell detection, achieving a mean Average Precision (mAP@50) of 0.995, with precision and recall rates nearing 1.00 for the barbell's fixed end, thereby confirming its high reliability for practical deployment.
Accurate barbell tracking is fundamental in strength and conditioning, with sensors like Linear Position Transducers (LPT) and Inertial Measurement Units (IMU) serving as established tools for monitoring athletic performance [11]. Concurrently, markerless, non-contact computer vision is emerging as a promising alternative. Prevailing methods, often employing Horizontal Bounding Boxes (HBBs) with models from the YOLO series, have been successfully applied to track large targets like barbell plates in exercises such as the snatch, clean and jerk, and squat [17]. These applications typically involve near-vertical trajectories where detection accuracy has a relatively minor impact on the resultant kinematic parameters.
However, the landmine press exercise studied here presents a greater challenge, as it involves significant barbell rotation. Calculating key kinematic indicators for this angular motion requires precise coordinates of both barbell ends, a task for which traditional HBBs are suboptimal. To address this, we implemented three key optimizations in our YOLO-based framework: 1) Using Oriented Bounding Boxes (OBBs) for precise labeling of the moving and fixed ends to accurately determine the barbell's position and rotation angle; 2) Introducing a PSA (Parallel Spatial Attention) mechanism to enhance critical feature selection; 3) Incorporating an improved C3k2 module to optimize feature fusion and a rapid SPPF module to maintain high computational efficiency. These enhancements enabled the model to adapt to the task's demands, achieving stable convergence and high accuracy without overfitting.
4.2. Agreement and Bias Analysis Between the Two Methods
4.2.1. Analysis of Velocity Indicators
Analysis of 247 landmine press trials across fours loads revealed that velocity indicators (peak and mean) demonstrated high agreement between the two methods. Compared to the GymAware, the vision-based method showed a systematic overestimation.
For peak velocity, the vision-based method showed an extremely strong correlation with GymAware (r=0.91, p<0.001), but with a mean bias of +0.19 m/s, indicating significant systematic overestimation (p<0.001). Similarly, mean velocity also had a strong correlation (r=0.86, p<0.001) and a mean bias of +0.23 m/s (p<0.001).
As load increases, movement velocity naturally decreases, reducing displacement between frames. This results in smaller high-frequency speed fluctuations, leading to smaller errors in differential-based velocity calculations and more stable tracking. This is reflected in the extremely high correlation for mean velocity at 35kg.
However, Bland-Altman analysis consistently revealed systematic overestimation by the vision-based method. This was further confirmed by a non-zero intercept in the Deming regression analysis, indicating a persistent positive bias in velocity measurements
The systematic overestimation by the vision-based method stems from a difference in measured barbell length. GymAware, fixed 15cm from the moving end, measured an effective length of 2.05m. The vision-based calibration yielded 2.20m. Since linear velocity equals angular velocity times radius, the vision-based linear velocity is theoretically 7.3% higher (2.20/2.05=1.073). Empirically, the vision-based method's average peak velocity was 0.19 m/s (≈9.8%) higher than GymAware's, and its average mean velocity was 0.23 m/s (≈18.4%) higher across all loads.
The vision-based method's systematic velocity overestimation (9.8% for peak, 18.4% for mean) exceeded the theoretical 7.3% error from barbell length discrepancy. This originated from fundamental differences in their data pipelines.
The additional peak velocity discrepancy stems from the vision-based filter preserving more high-frequency components to enhance peak detection sensitivity. The larger mean velocity discrepancy arises because vision-based displacement, calculated directly from images, inherently includes the 7.3% proportional error. In contrast, GymAware's LPT system derives displacement by double-integrating filtered acceleration, applying strong low-pass filtering to mitigate integration drift. This process smooths and systematically underestimates true displacement. Bland-Altman analysis supports this, showing mean velocity agreement limits narrow with increasing load. Slower movements reduce sensor integration error, improving convergence between methods. Therefore, the observed velocity discrepancies are a composite result of differences in both physical setup (measurement radius) and algorithmic processing stacks. Applying the vision-based method requires simultaneous consideration of its physical principles and data processing workflow.
4.2.2. Analysis of Power Indicators
Analysis of 247 landmine press trials across all loads indicated high agreement in power indicators (peak and mean) between the two methods. For peak power, a strong positive correlation was observed between the vision-based method and GymAware (r =0.86, p < 0.001). Bland-Altman analysis revealed a mean bias of +18.06 W, suggesting a slight overestimation by the vision-based method. However, this bias was not statistically significant (paired t-test, p = 0.094).
For mean power, a very strong positive correlation was observed between the two methods (r = 0.90, p < 0.001). Bland-Altman analysis indicated a mean bias of –7.63 W, showing a minimal but non-significant underestimation by the vision-based method (paired t-test, p = 0.031).
Agreement for peak power was optimal within the 20–30 kg load range. Across this range, the absolute mean bias values were relatively small (7.3–30.1 W) and all paired t-tests were non-significant (p > 0.05), suggesting the measurements from the two methods can be considered equivalent. However, the 95% Limits of Agreement (LOA) were relatively wide, indicating significant differences in individual tests. This is consistent with the inherent variability of an instantaneous metric like peak power.
At the maximum load of 35 kg, the vision-based method showed a significant overestimation (mean bias = +64.3 W, p = 0.02). Deming regression results across all loads showed slopes close to 1 (0.99–1.20), indicating a very small proportional deviation between methods. Therefore, the overestimation at 35 kg is more likely attributable to an increase in fixed bias, related to zero drift and noise in the GymAware device under heavy loads. GymAware's power calculation is highly dependent on displacement measurement. Under heavy loads, athlete movement and trunk unsteadiness increase barbell trajectory complexity. The decline in motor control leads to zero drift and noise accumulation in the Linear Position Transducer (LPT), causing displacement calculation errors.
In contrast, the vision-based method calculates power based on the relative positions of the fixed and moving ends. This approach demonstrates good stability and can mitigate the drift and noise problems inherent to LPT systems. The improved agreement in mean power with increasing load supports the conclusion that the difference in peak power at 35 kg is likely due to the limitations of the GymAware device under heavy-load conditions.
The agreement for mean power demonstrated a clear trend of progressive improvement with increasing load. The width of the 95% LOA consistently narrowed with greater loads, decreasing significantly from 248 W at 20 kg to 153 W at 35kg. This indicates that at higher loads, the mean power measurements for the landmine press from the two methods are closer. The Deming regression results supported this conclusion. The regression slope progressively improved from 0.77 at 20kg to 1.00 at 30kg and 0.99 at 35kg. It indicated that the proportional deviation decreased with the increase of the loads. At 25kg and 30kg, the measurement bias for mean power was not statistically significant (p > 0.05). Although a significant overestimation was observed at 35kg (p < 0.001, bias +20.2 W), the exceptionally narrow limits of agreement and the very strong correlation (r=0.94) demonstrate that this discrepancy represents a highly consistent and predictable systematic bias, rather than random noise.
4.3. Limitations
This study provides positive evidence for the application of a vision-based method in measuring the kinematics of the landmine press. However, several limitations in the current practice should be acknowledged and addressed in future research.
In the agreement experiment, GymAware was employed as the reference method for comparison. Although GymAware shows good reliability and validity[5], it has inherent limitations for monitoring angular movements like the landmine press. Some potential factors, such as the device's own accuracy and minor vibrations from loose attachments, may introduce errors that are difficult to quantify, which could affect the benchmark for agreement evaluation. Therefore, future studies should adopt a "gold standard" system such as 3D motion capture to validate the reliability and validity of this vision-based method.
Furthermore, the robustness of the current object detection model under varying visual conditions requires further investigation. All data in this study were collected under fixed settings. Future work should test the effectiveness of the approach under different camera angles, lighting conditions, and scenarios where the barbell is partially occluded. Only through such validation can this method be reliably generalized to broader strength and conditioning practice environments.
5. Conclusion
This study developed a CV-based kinematic measurement system for the landmine press with an improved YOLOv8 object detection model and mathematical modeling. The system enables markerless, non-contact measurement of velocity and power indicators during the concentric phase of the movement. The validity of this vision-based method were verified through agreement testing with GymAware under four loads.
The main conclusions are as follows:
The improved YOLOv8-OBB model showed high performance in the small object detection task. By incorporating a polarized self-attention mechanism, an improved C3k2 module, and an optimized SPPF pooling structure, the model significantly enhanced its detection accuracy and robustness for both the moving and fixed ends of the barbell. The model achieved an exceptional mAP@0.5 of 0.995 on the test set, indicating strong generalization capability and stability.
The vision-based method demonstrated high agreement with the GymAware system in measuring velocity and power indicators. Despite a systematic overestimation (primarily attributable to differences in measurement barbell length), the two methods showed strong correlations (r > 0.85) for four indicators. Moreover, the observed bias was predictable and could be effectively corrected using a Deming regression model.
The vision-based method demonstrated superior performance under high-load conditions. As the load increased at 35 kg, the GymAware system exhibited diminished measurement accuracy due to sensor drift and signal noise. In contrast, the vision-based approach maintained high measurement agreement even under heavy loads, owing to the stability of its image coordinate-based calculations.
This study presents a vision-based system that accurately monitors the landmine press exercise, providing practical and affordable access to movement analysis without costly sensors. It is readily applicable in training, coaching, and sports science research.
Author Contributions
Conceptualization, Rui Zhao, Rou Dong and Ran Wang; Methodology, Rui Zhao, Rong Cong and Jianke Yang; Investigation, Rui Zhao, Ruijie Zhou, Kelong Lin, Tongchun Kui; Data curation, Rui Zhao and Ruijie Zhou; Supervision, Rou Dong and Ran Wang; Software, Rong Cong; Resources, Kelong Lin and Tongchun Kui; Validation, Jianke Yang and Ruijie Zhou; Visualization, Rong Cong and Tongchun Kui; Formal analysis, Jiajin Zhang and Rong Cong; Writing – original draft, Rui Zhao; Writing – review & editing, Rou Dong, Ran Wang and Jianke Yang.
Funding
This work was supported by the open project of Yunnan Key Laboratory of Biodiversity Information (BIKF2024-06).
Institutional Review Board Statement
The study was conducted in accordance with the Declaration of Helsinki, and approved by by the Ethics Committee of Shanghai University of Sport (Date.24.10.2024/No. 102772024RT164).
Data Availability Statement
The datasets generated and/or analyzed during the current study are available in the FigShare repository [https://doi.org/10.6084/m9.figshare.30868232].
Conflicts of Interest
No potential conflict of interest was reported by the author(s).
References
- Merlo, R. D., & Rodríguez-Chávez, J. Á. (2021). Post-Activation Performance Enhancement with Bench Press or Landmine on Straight Punch Strength. Revista Ciencia y Tecnología en la Cultura Física, 16, 509-523.
- Omcirk, D., Vetrovsky, T., O’Dea, C., & et al. (2024). Reliability of Three Landmine-Punch-Throw Variations and Their Load–Velocity Relationships Performed with the Dominant and Nondominant Hands. International Journal of Sports Physiology and Performance, 19(8), 765-772. [CrossRef]
- Omcirk, D. (2023) Evaluating Methods of Assessing Force and Velocity during Punching Specific Movements.
- Santana, J. C., Brown, L. E., & Ferrigno, V. A. (2016). The Training Octagon: Training the Anterior and Posterior Serape. Strength and Conditioning Journal, 38(5), 102-110. [CrossRef]
- Oleksy, Ł., Kuchciak, M., Bril, G., & et al. (2023). Intra-Rater and Test–Retest Reliability of Barbell Force, Velocity, and Power during the Landmine Punch Throw Test Assessed by the GymAware Linear Transducer System. Applied Sciences, 13(19), 10875. [CrossRef]
- Gusciglio, B., & Morin, J. B. (2023). Assessing the Key Physical Capabilities in Striking Combat Sports: Reliability and Reproducibility of a New Test. International Journal of Strength and Conditioning, 3(1). [CrossRef]
- Suchomel, T. J., Techmanski, B. S., Kissick, C. R., & Comfort, P. (2023). Reliability, Validity, and Comparison of Barbell Velocity Measurement Devices during the Jump Shrug and Hang High Pull. Journal of Functional Morphology and Kinesiology, 8(1), 35. [CrossRef]
- Zhou, Y., & Zhao, Z. (2025). MPA-YOLO: Steel Surface Defect Detection Based on Improved YOLOv8 Framework. Pattern Recognition, 168, 111897. [CrossRef]
- Ai, X., Xiong, Z., Yuan, J., & Yuan, T. (2025) A Lightweight YOLOv8-Based Model for Tomato Objection and Keypoint Detection. 2025 8th International Symposium on Big Data and Applied Statistics (ISBDAS), IEEE, Guangzhou, China pp. 771-776.
- Liu, D., Zhu, Y., & Liu, R. (2024) MSD-YOLO: An Efficient Algorithm for Small Target Detection. International Conference on Multimedia Modeling, Springer Nature Singapore, Singapore pp. 59-72.
- Jukic, I., King, A., Sousa, C. A., Prnjak, K., & McGuigan, M. R. (2023). Implementing a Velocity-Based Approach to Resistance Training: The Reproducibility and Sensitivity of Different Velocity Monitoring Technologies. Scientific Reports, 13(1), 7152. [CrossRef]
- Balsalobre-Fernández, C., Geiser, G., Krzyszkowski, J., & Kipp, K. (2020). Validity and Reliability of a Computer-Vision-Based Smartphone App for Measuring Barbell Trajectory during the Snatch. Journal of Sports Sciences, 38(6), 710-716. [CrossRef]
- Achermann, B., Oberhofer, K., Gross, M., & Lorenzetti, S. (2022). Pilot Study: Optical Tracking of Barbell Kinematics for Low-Cost Strength Training Performance Monitoring. ISBS Proceedings Archive, 40(1), 9.
- Havlicek, L. L., & Peterson, N. L. (1977). Effect of the Violation of Assumptions upon Significance Levels of the Pearson r. Psychological Bulletin, 84(2), 373. [CrossRef]
- Martin, R. F. (2000). General Deming Regression for Estimating Systematic Bias and Its Confidence Interval in Method-Comparison Studies. Clinical Chemistry, 46(1), 100-104.
- Myles, P. S., & Cui, J. (2007). Using the Bland–Altman Method to Measure Agreement with Repeated Measures. British Journal of Anaesthesia, 99(3), 309-311. [CrossRef]
- Lease, B. A., Lim, K. H., Phang, J. T. S., & Chiam, D. H. (2023) Use of Keypoint-RCNN and YOLOv7 for Capturing Biomechanics and Barbell Trajectory in Weightlifting. TENCON 2023 IEEE Region 10 Conference, IEEE, Chiang Mai, Thailand pp. 1351-1355.
Figure 1.
Improved Yolov8 Architecture Diagram.
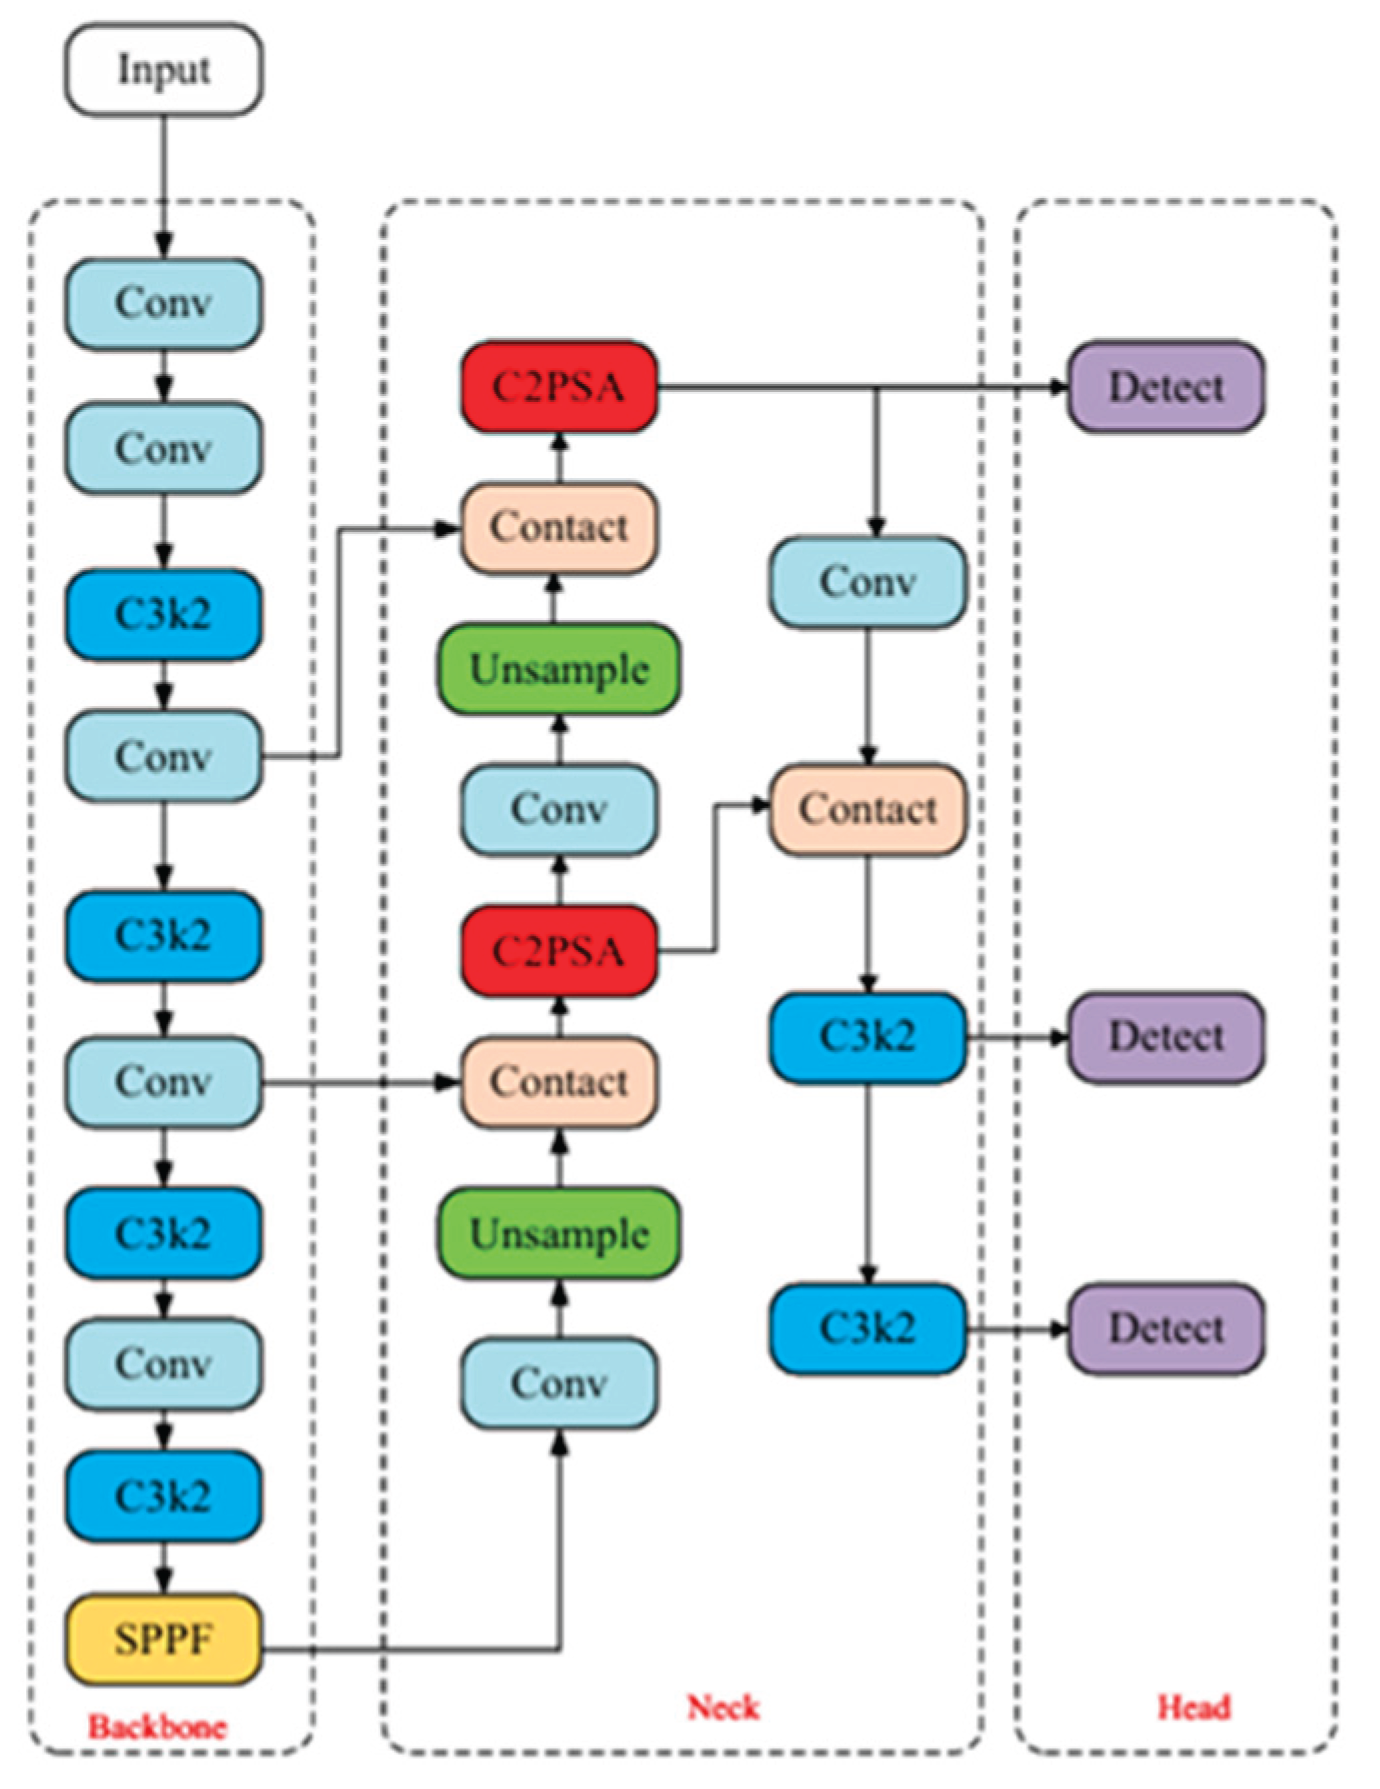
Figure 2.
Mathematical Calculation Methodology for Kinematic Indicators.
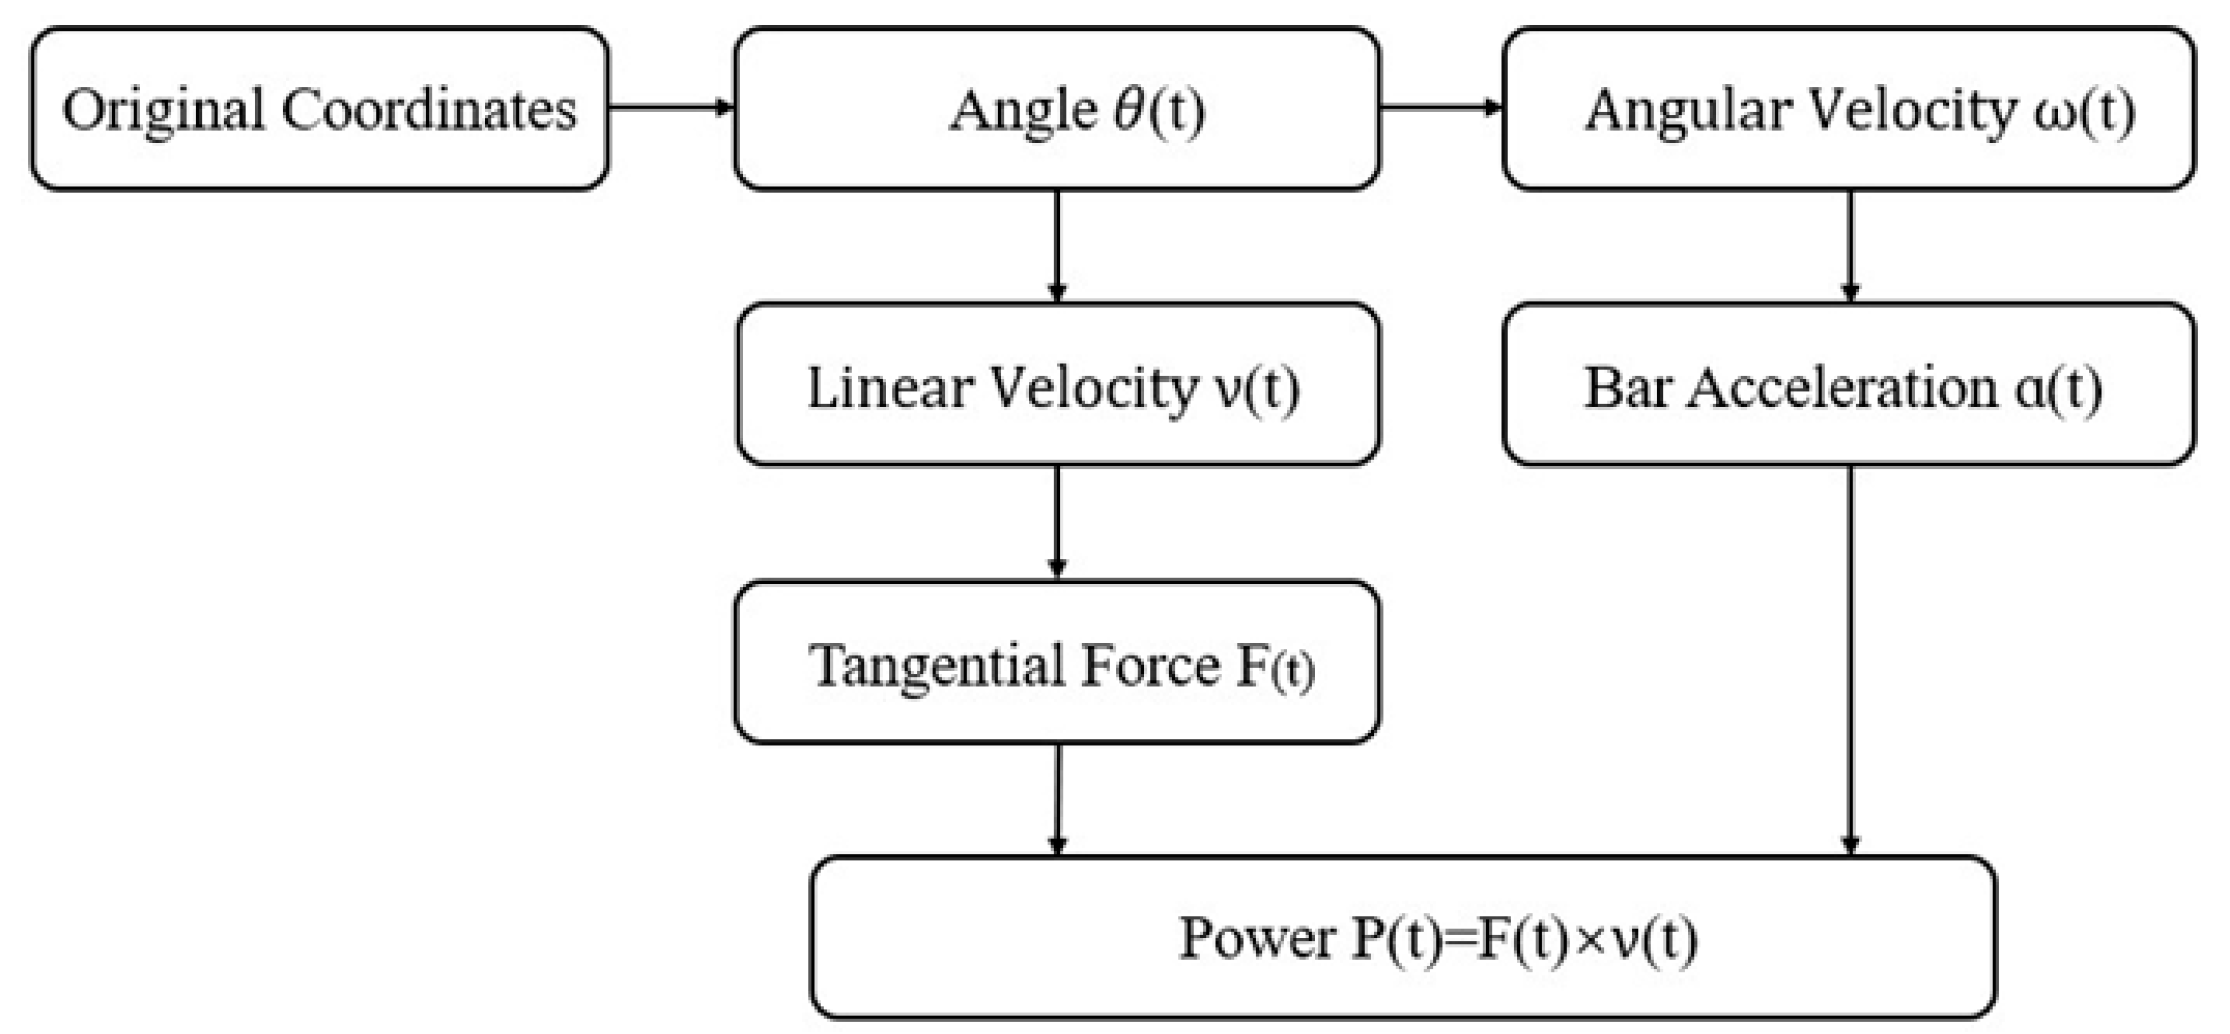
Figure 3.
Training Loss and Evaluation Metrics Curves.
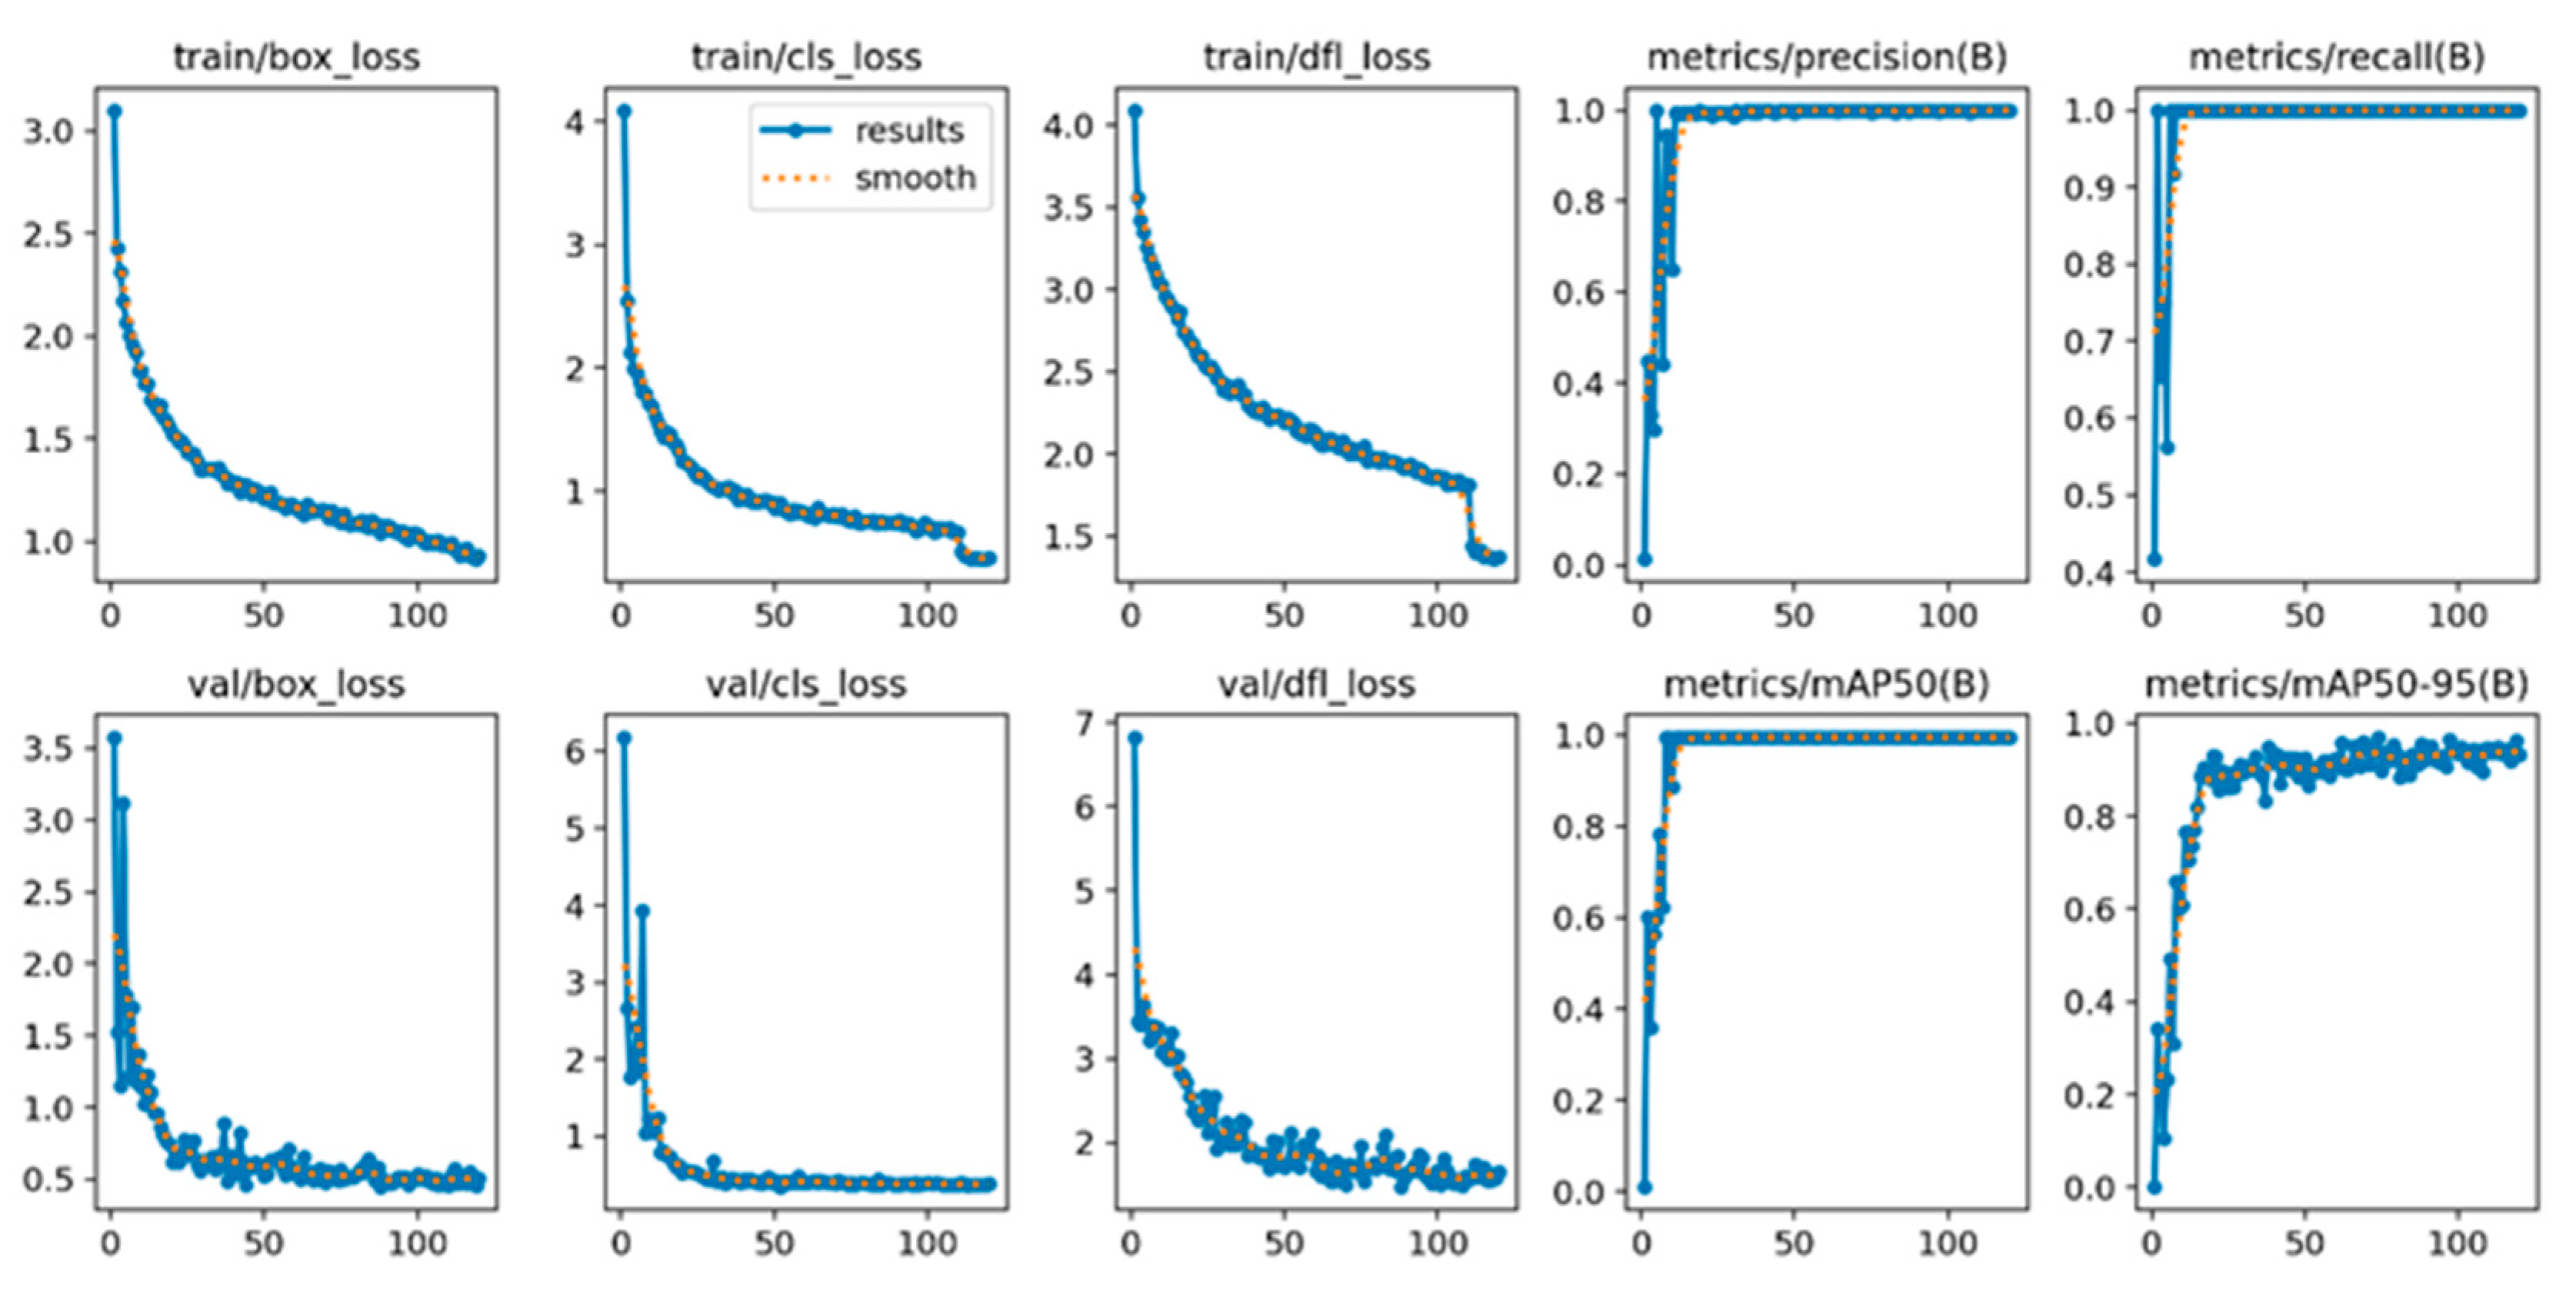
Figure 4.
Precision-Recall Curve.
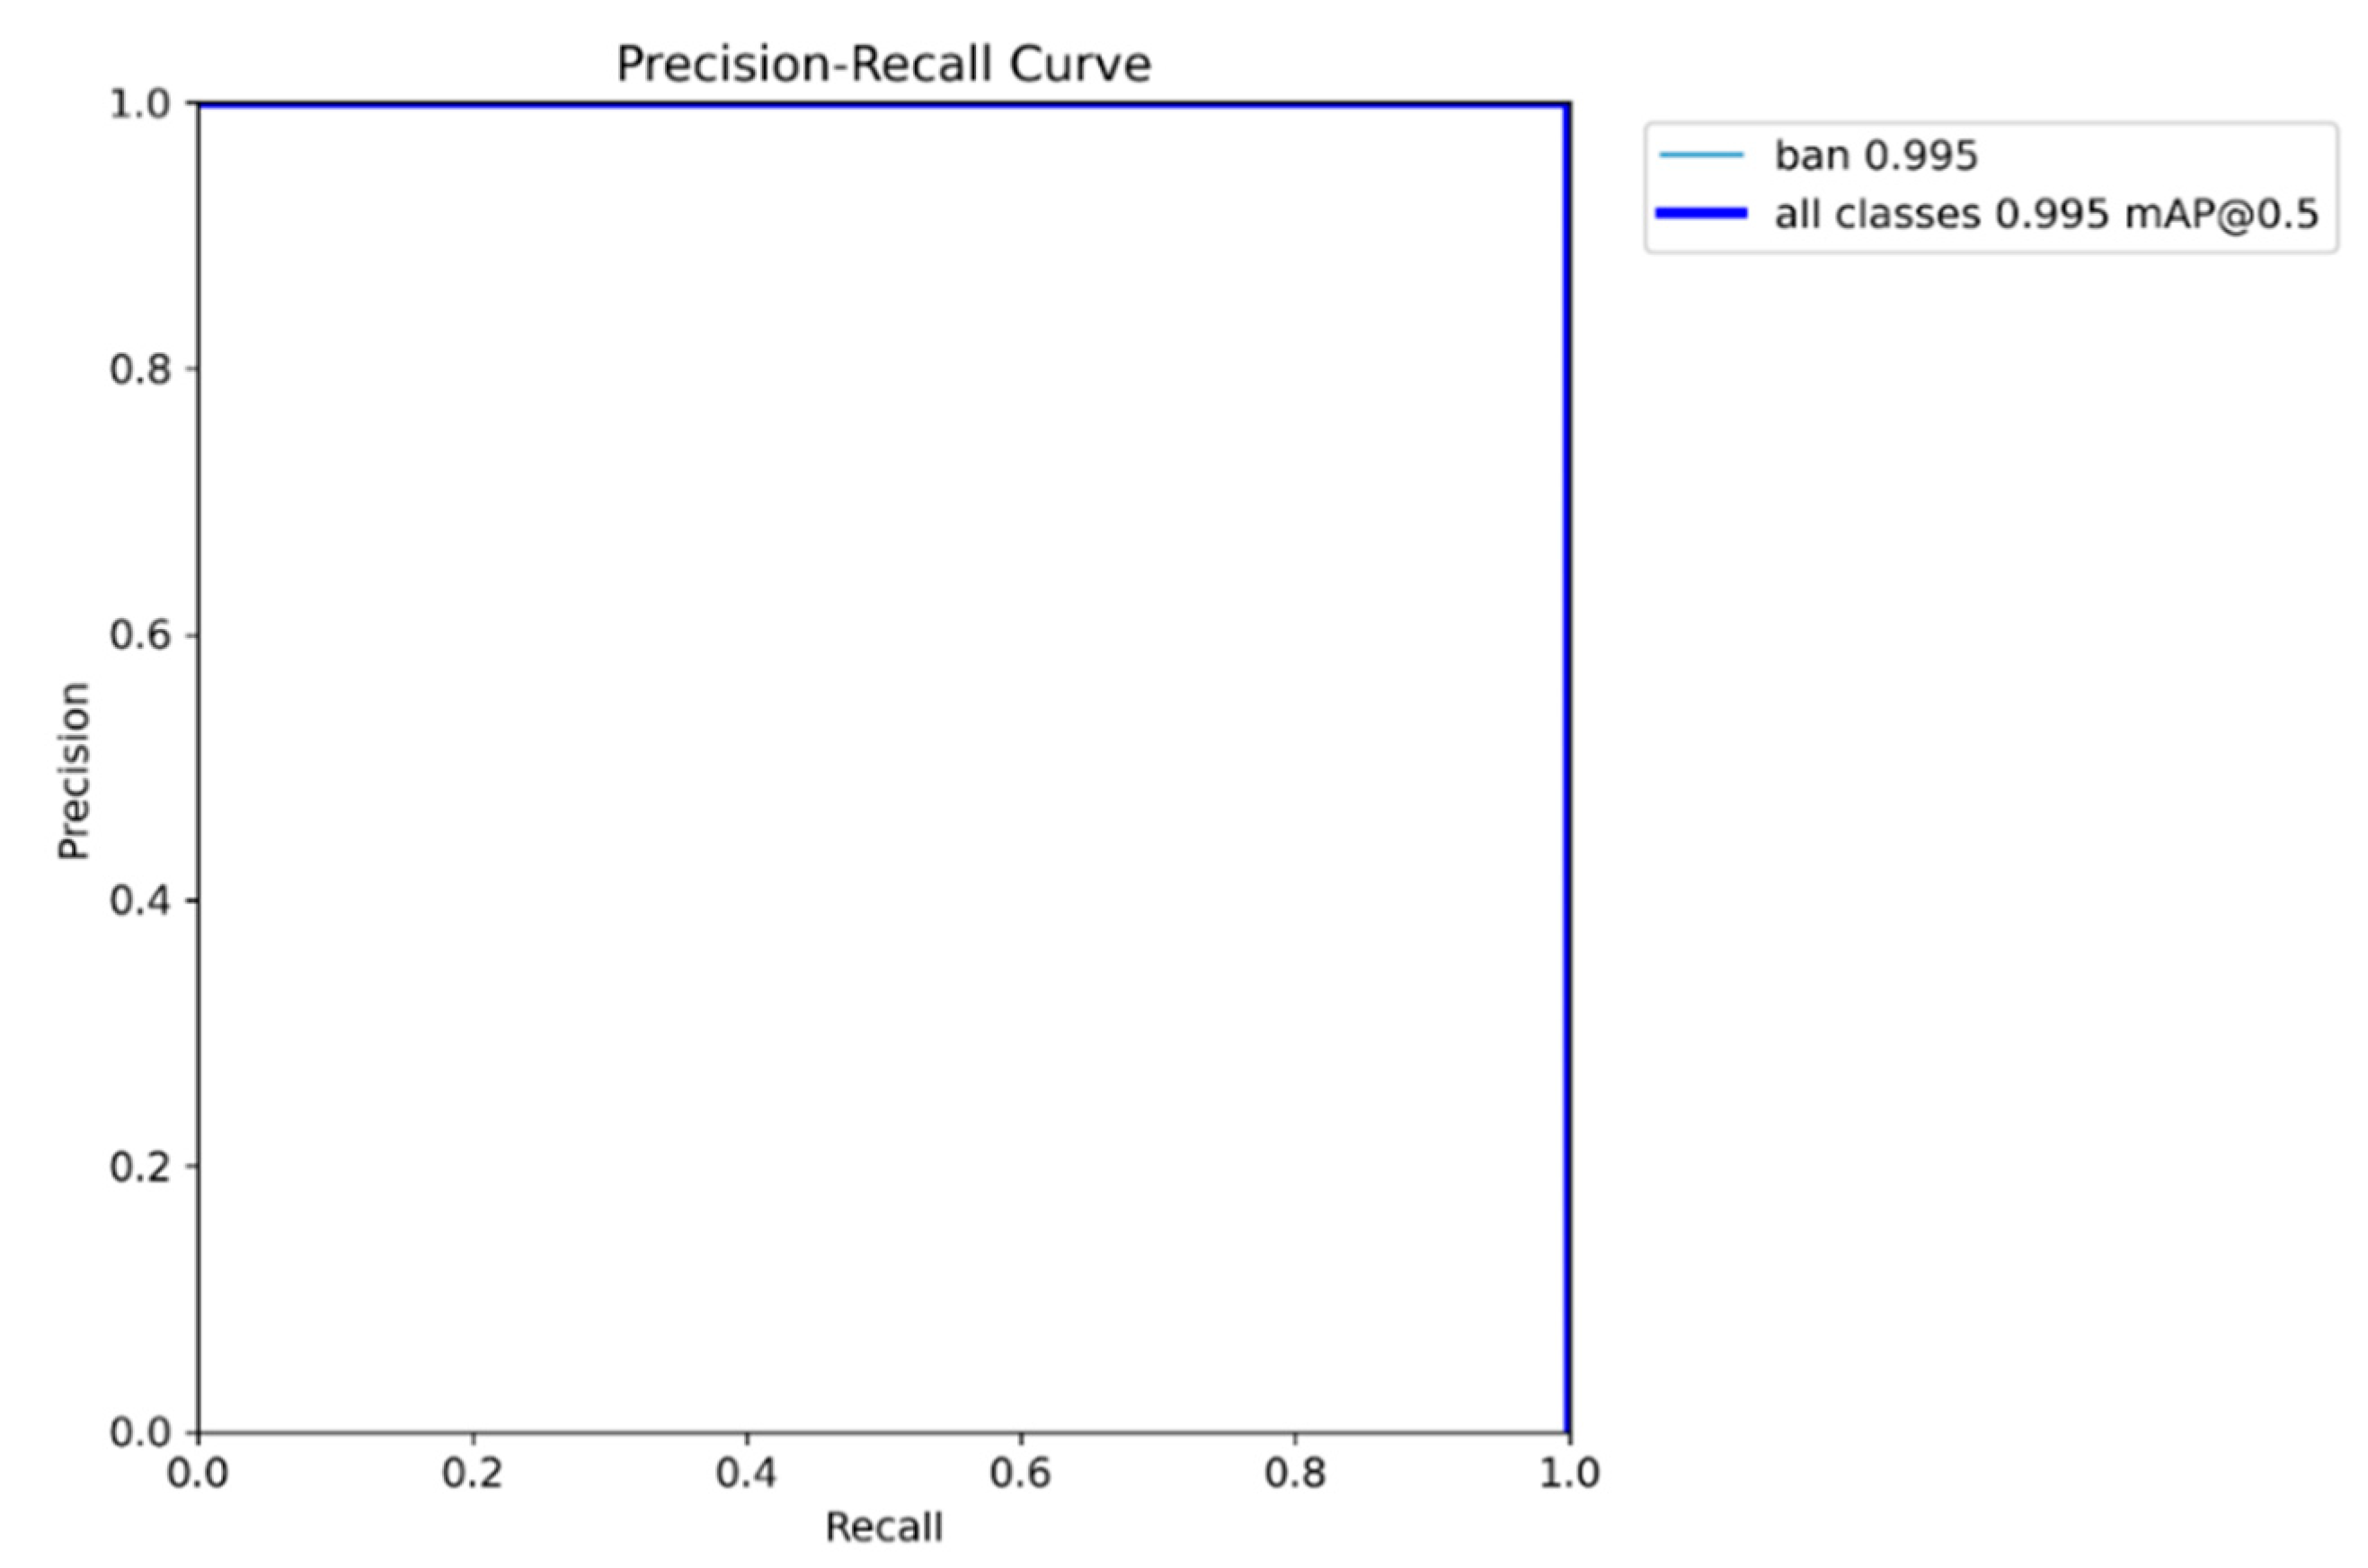
Figure 5.
Confusion Matrix Normalized.
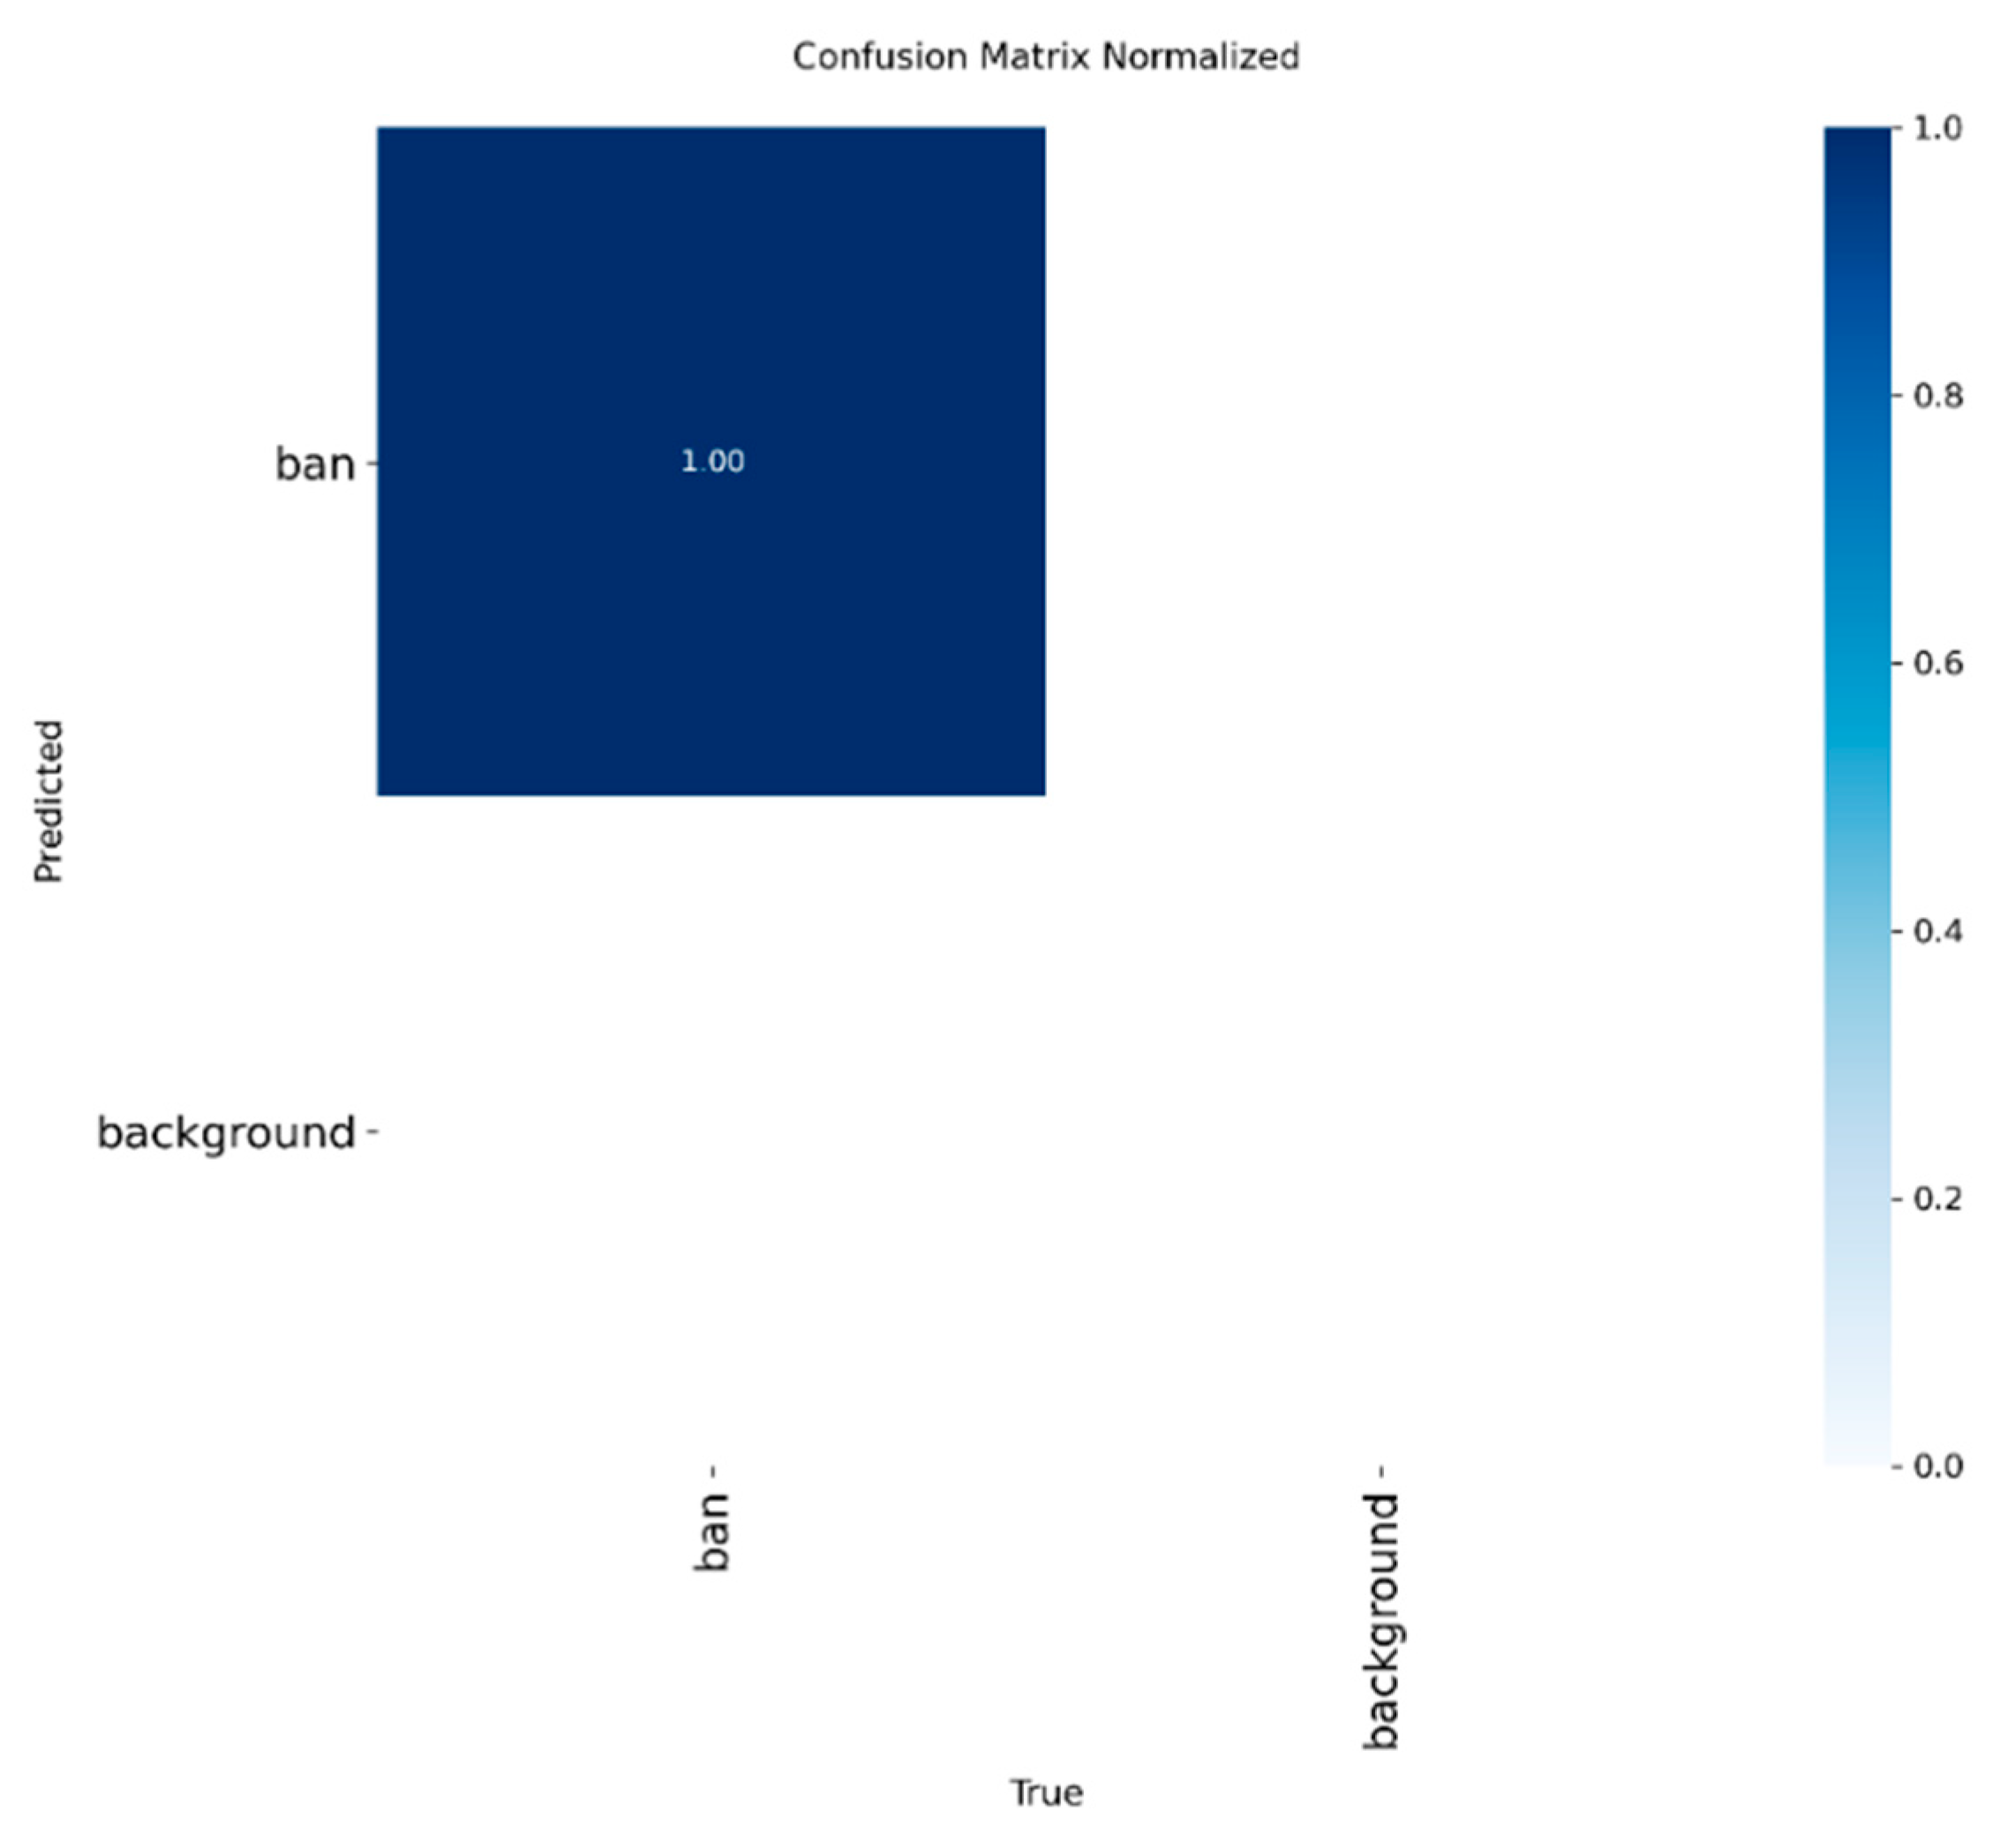
Figure 6.
F1-Confidence Curve.

Figure 7.
Precision-Confidence Curve.
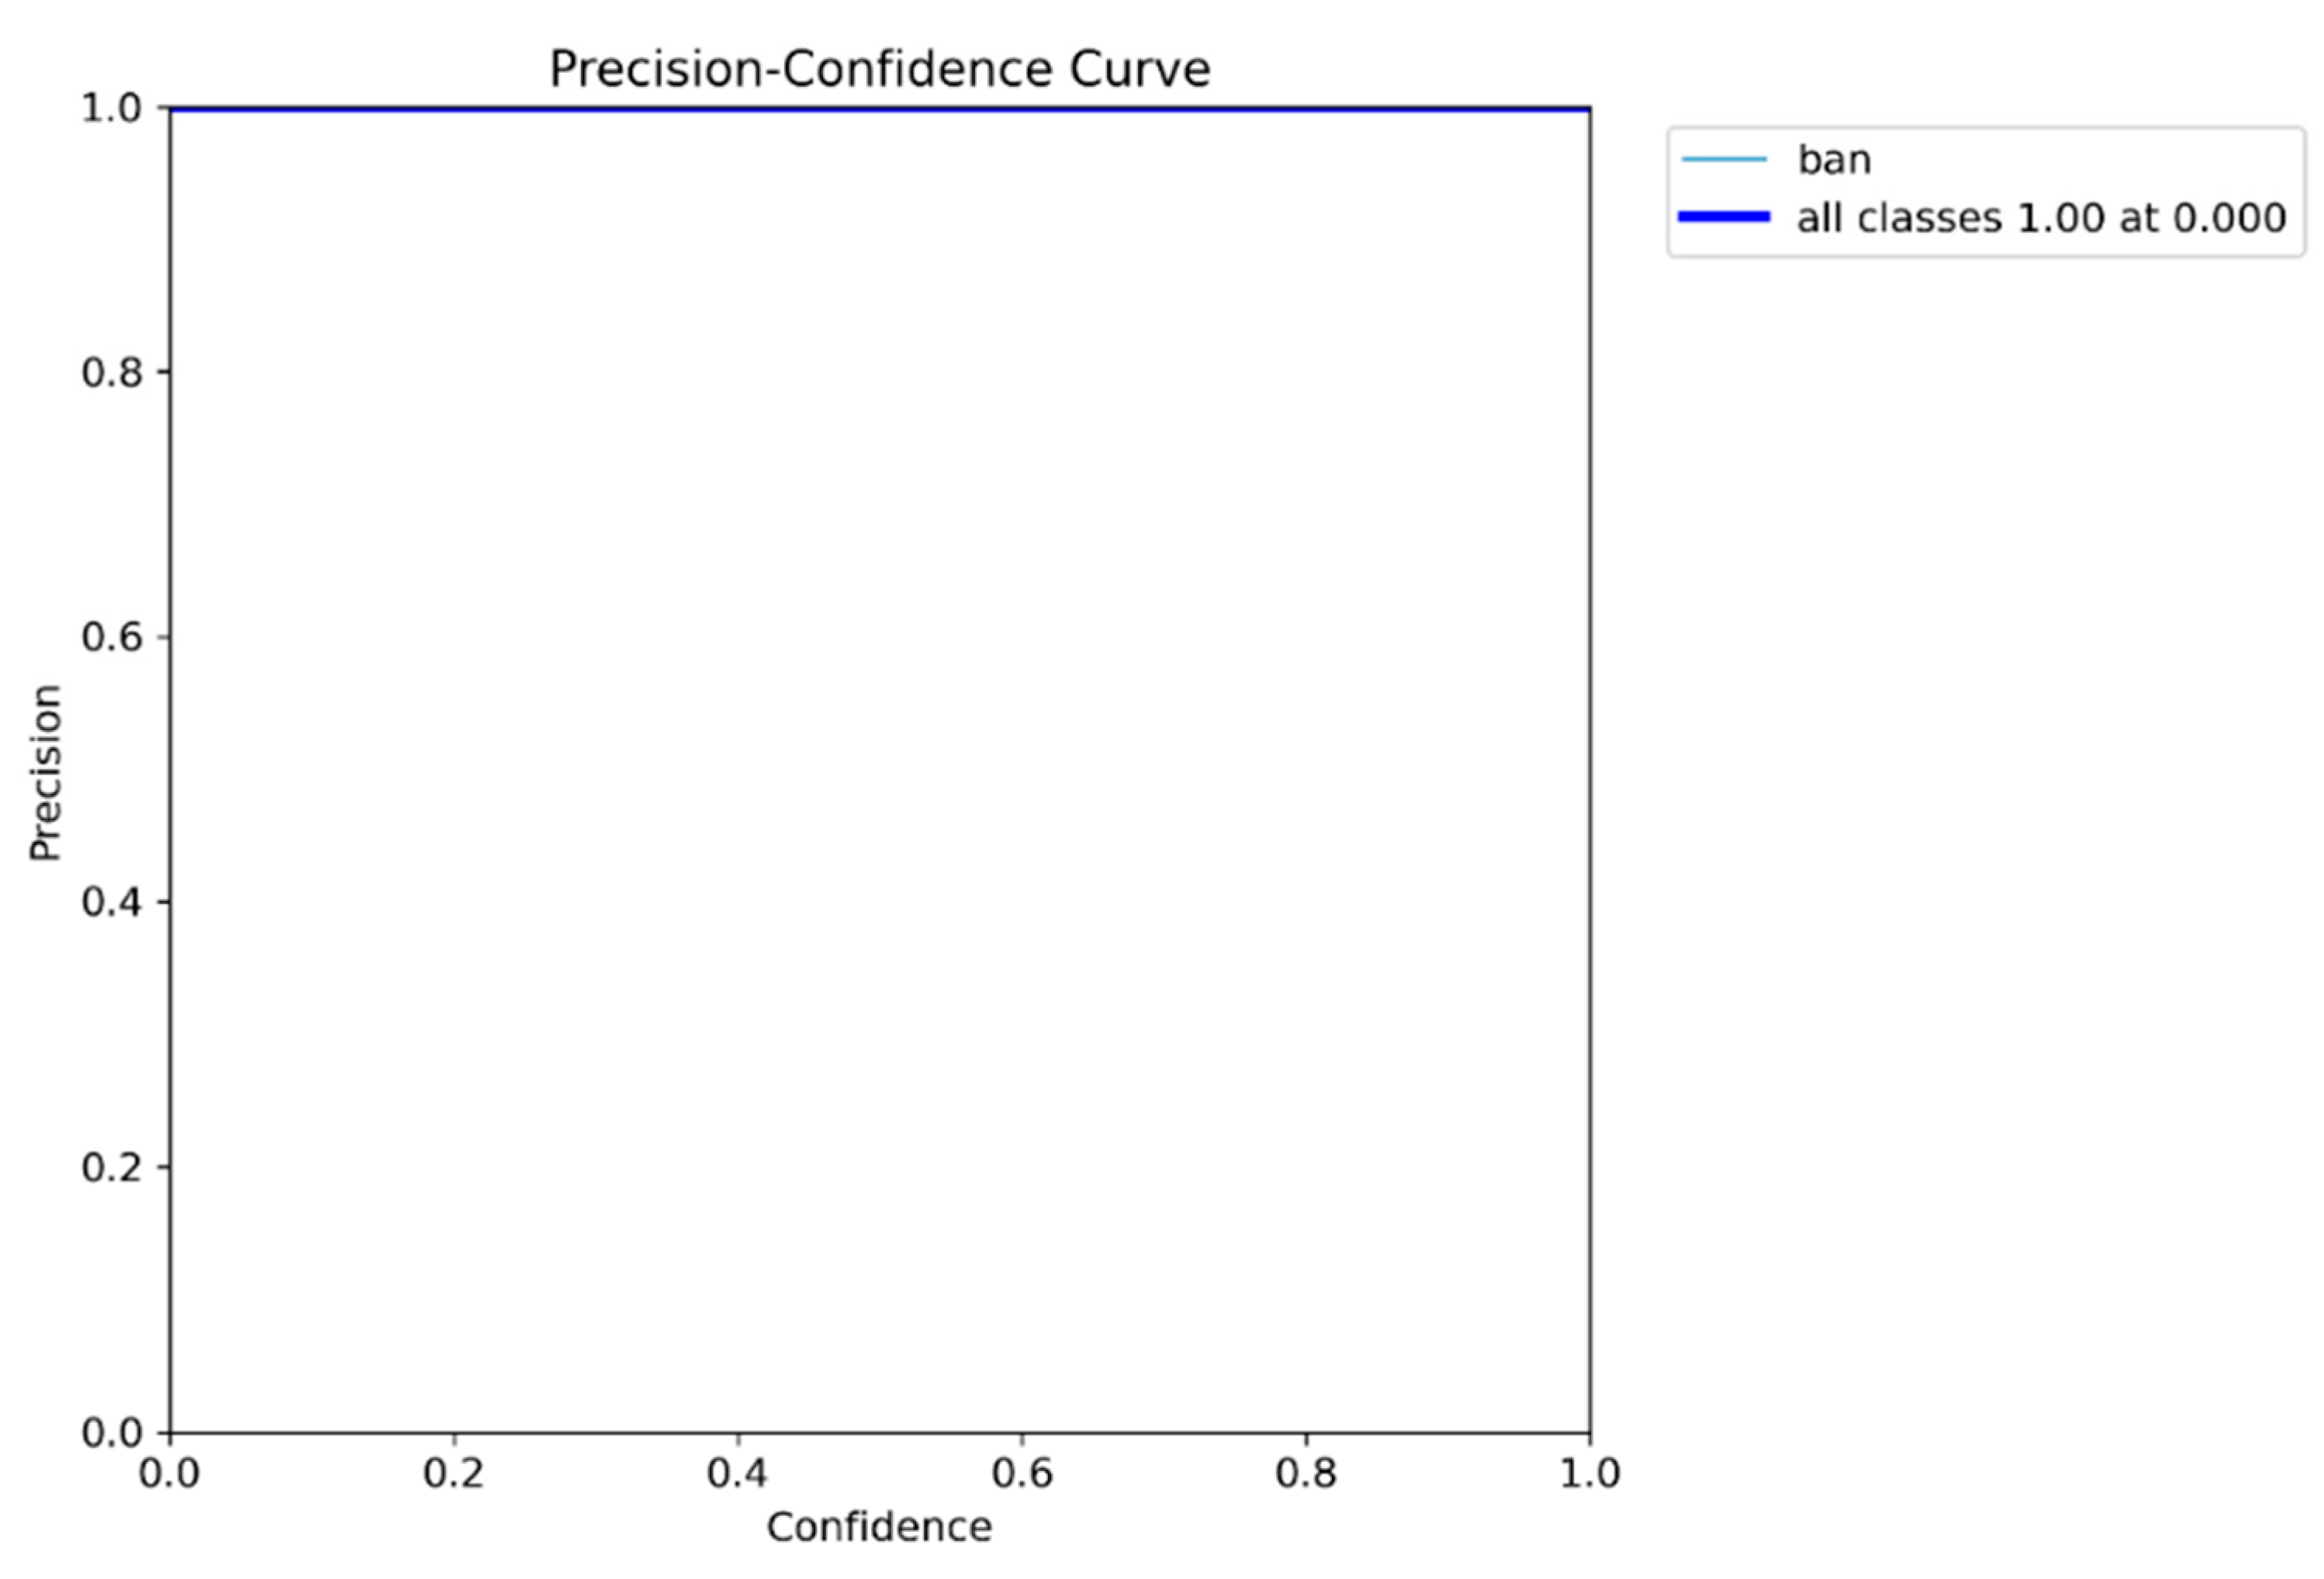
Figure 8.
Four kinematic indicators between the two methods across four loads. (a) peak velocity (b) mean velocity (c) peak power (d) mean power.
Figure 8.
Four kinematic indicators between the two methods across four loads. (a) peak velocity (b) mean velocity (c) peak power (d) mean power.
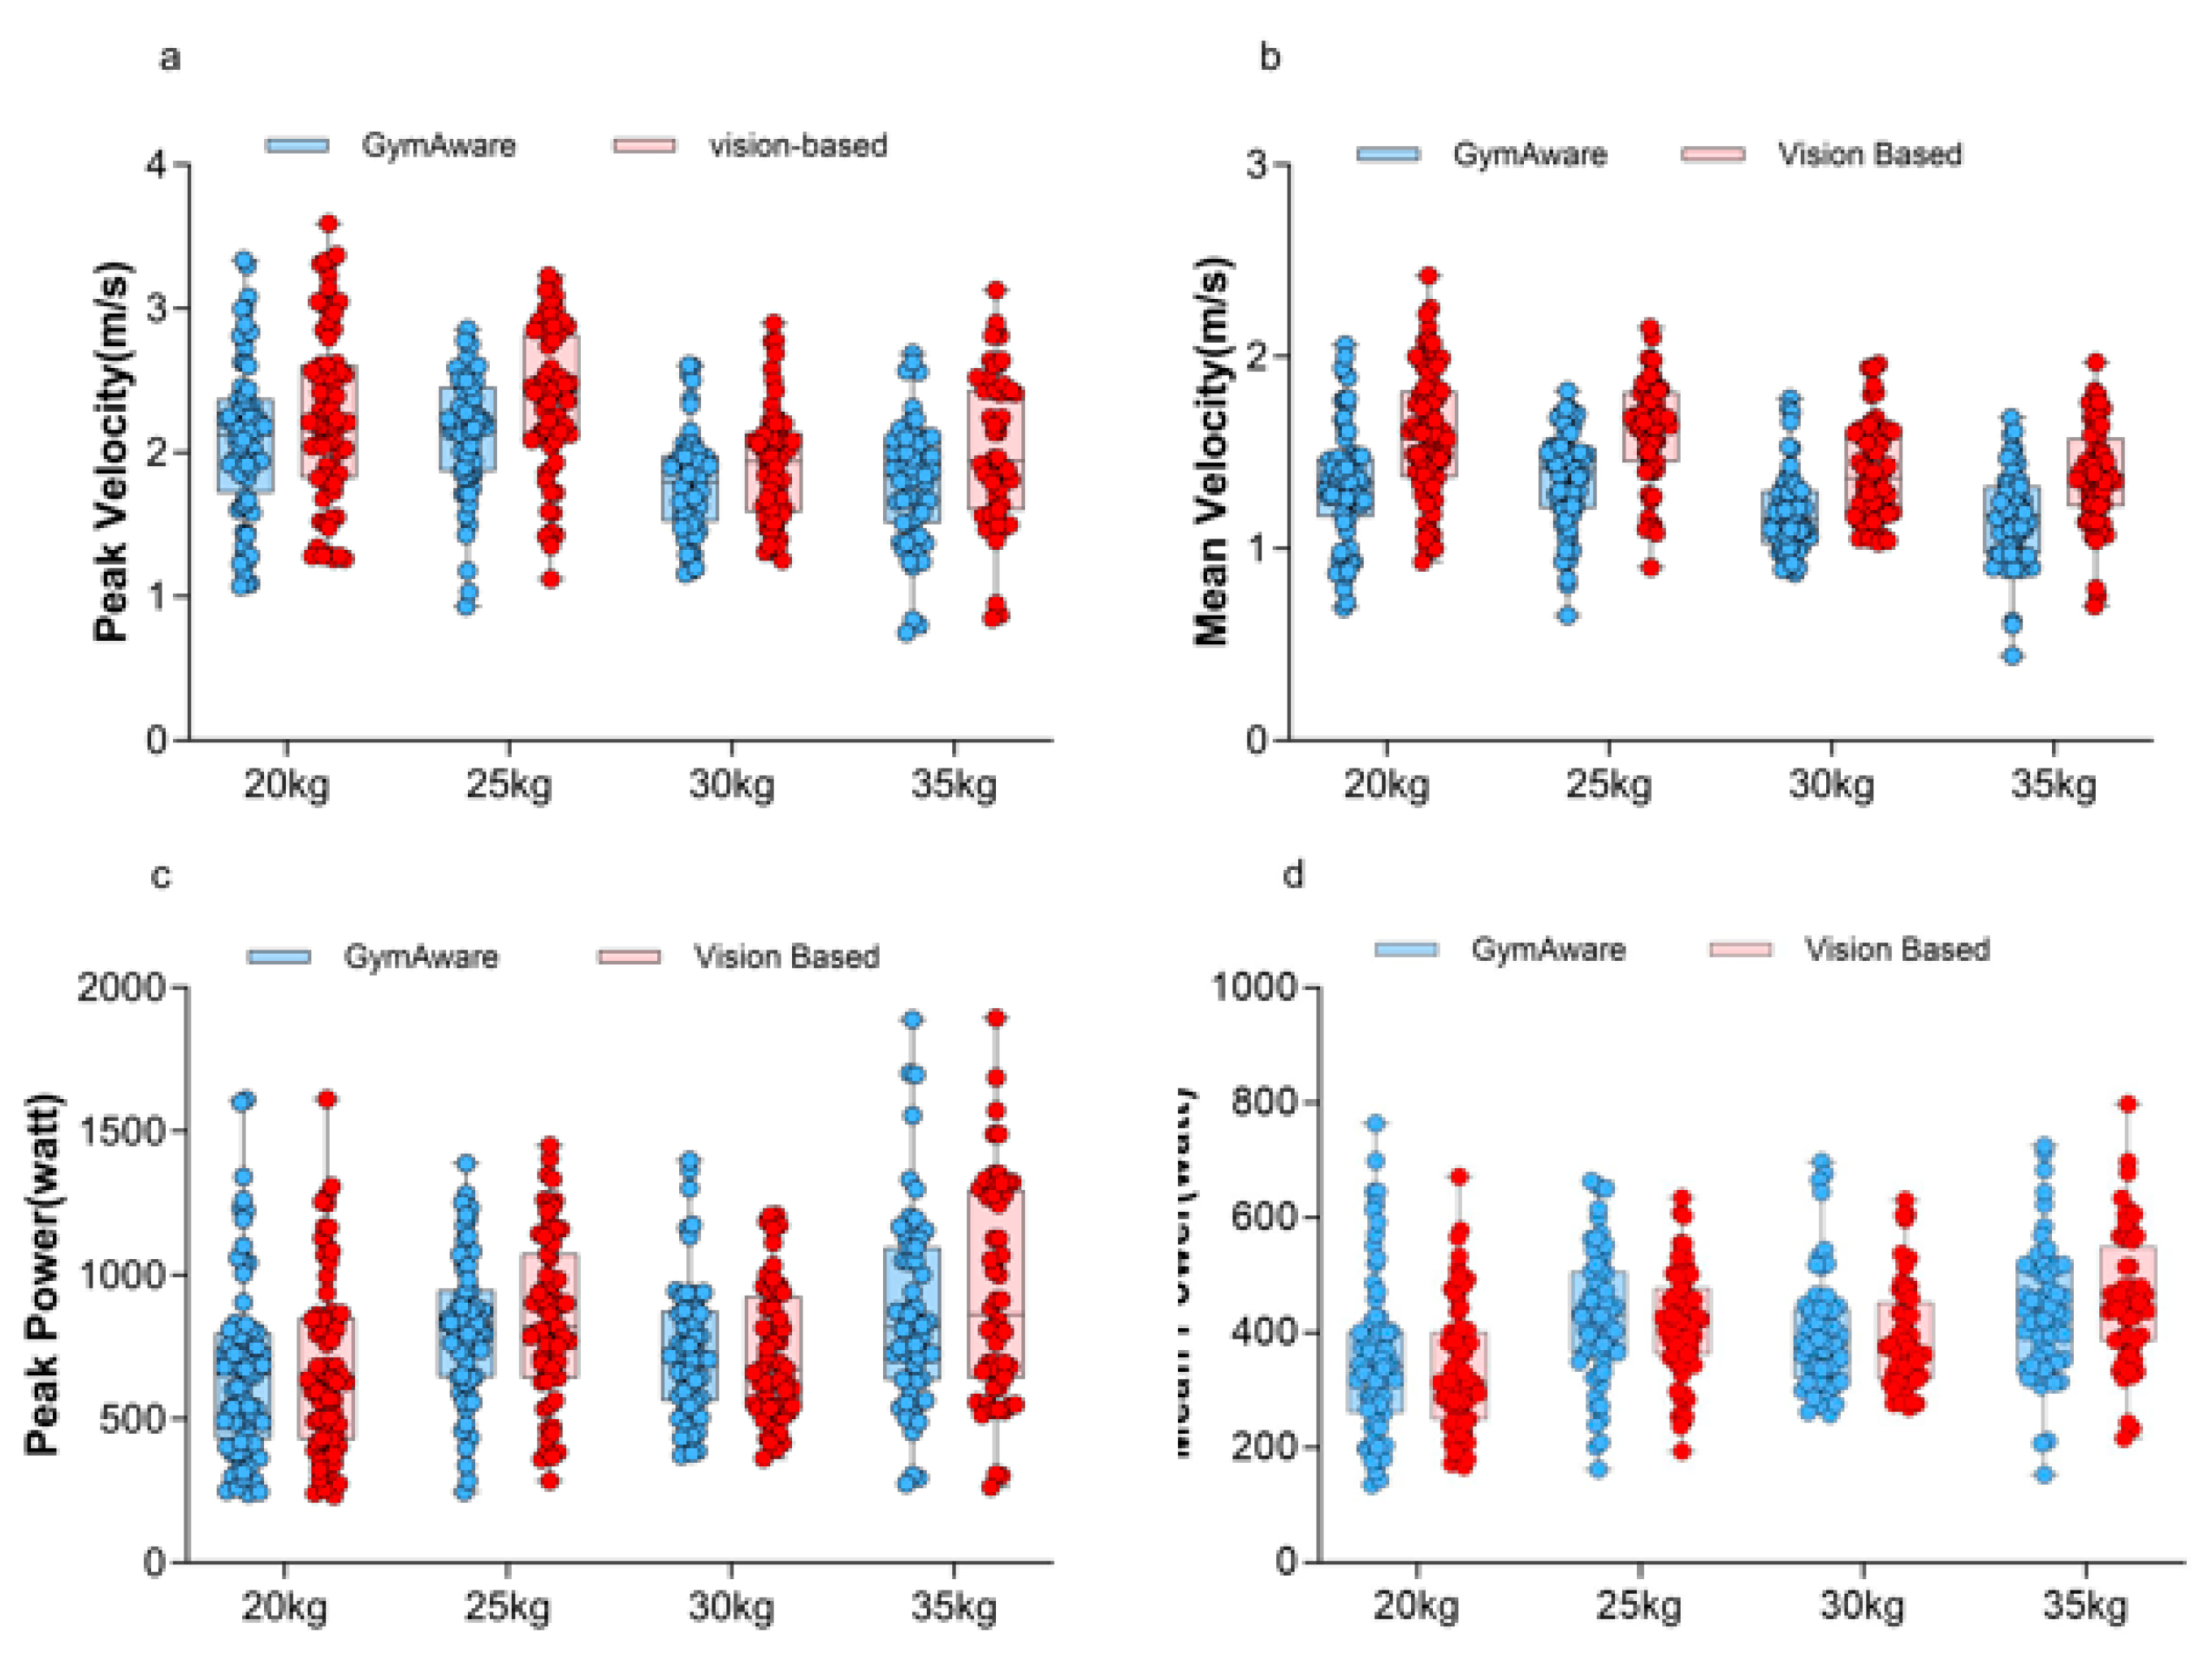
Figure 9.
Bland-Altman between the two methods across four loads. (a) peak velocity (b) mean velocity (c) peak power (d) mean power.
Figure 9.
Bland-Altman between the two methods across four loads. (a) peak velocity (b) mean velocity (c) peak power (d) mean power.
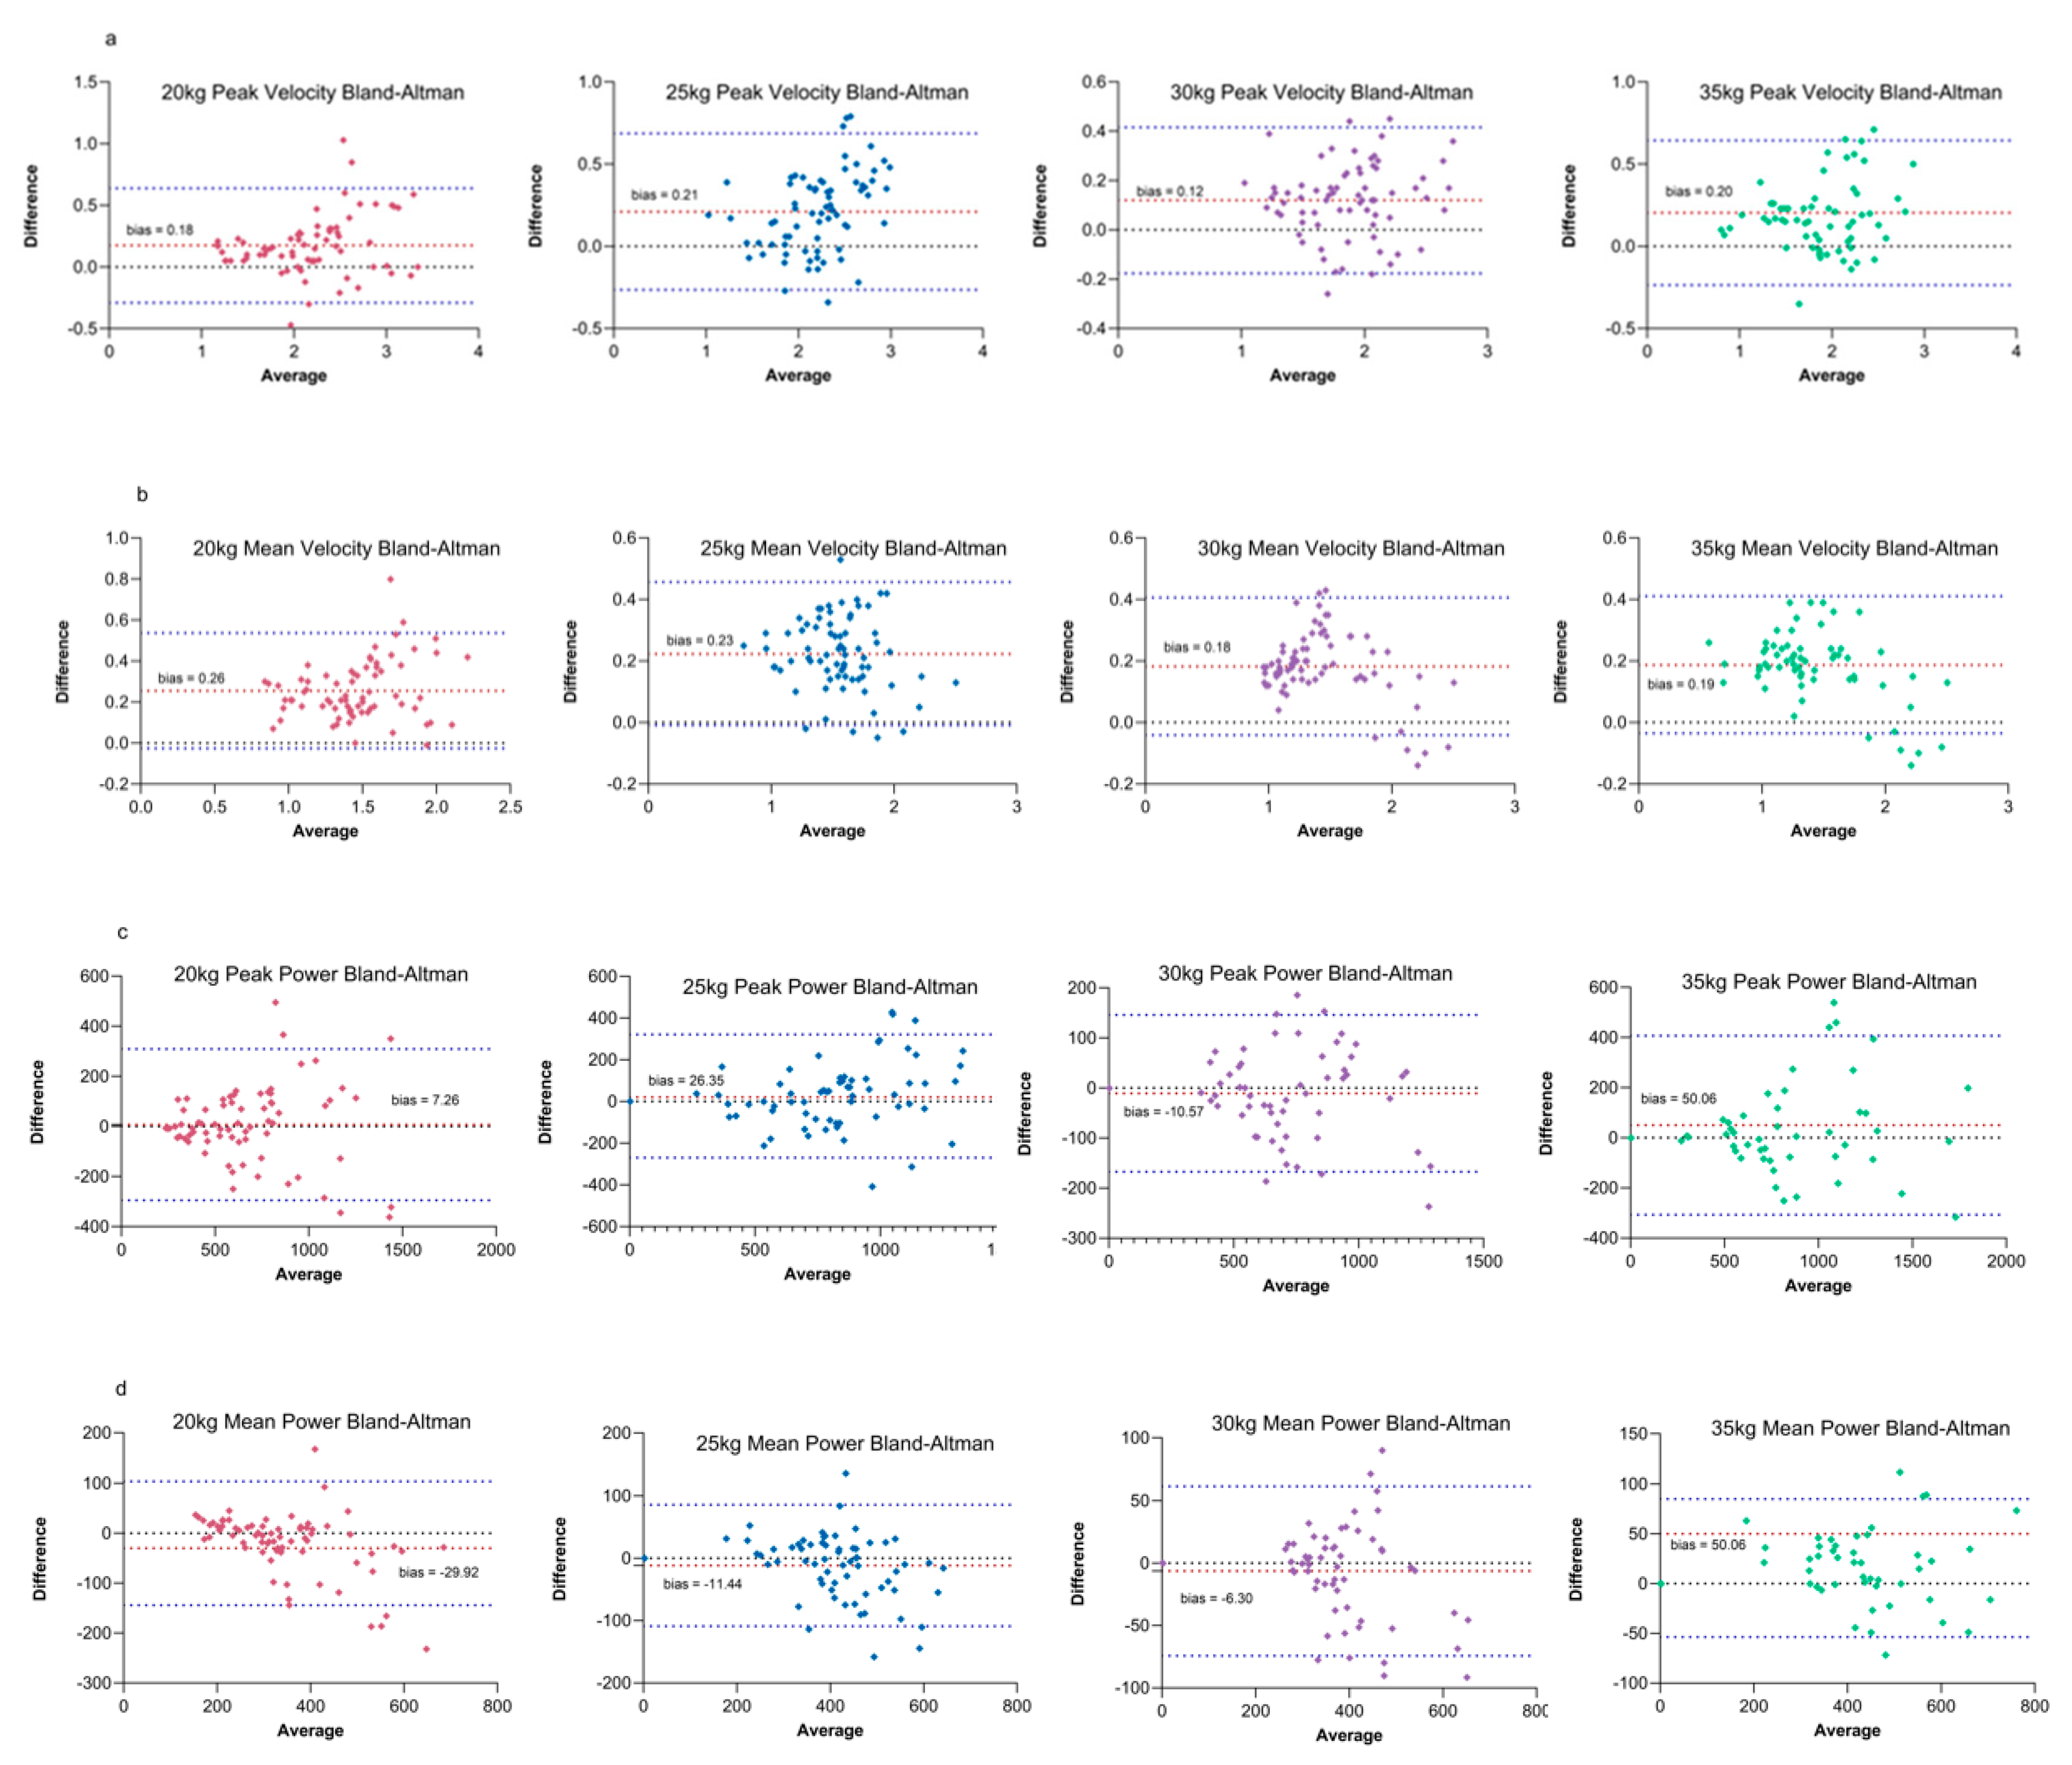
Figure 10.
Correlation between the two methods across four loads. (a) peak velocity (b) mean velocity (c) peak power (d) mean power.
Figure 10.
Correlation between the two methods across four loads. (a) peak velocity (b) mean velocity (c) peak power (d) mean power.
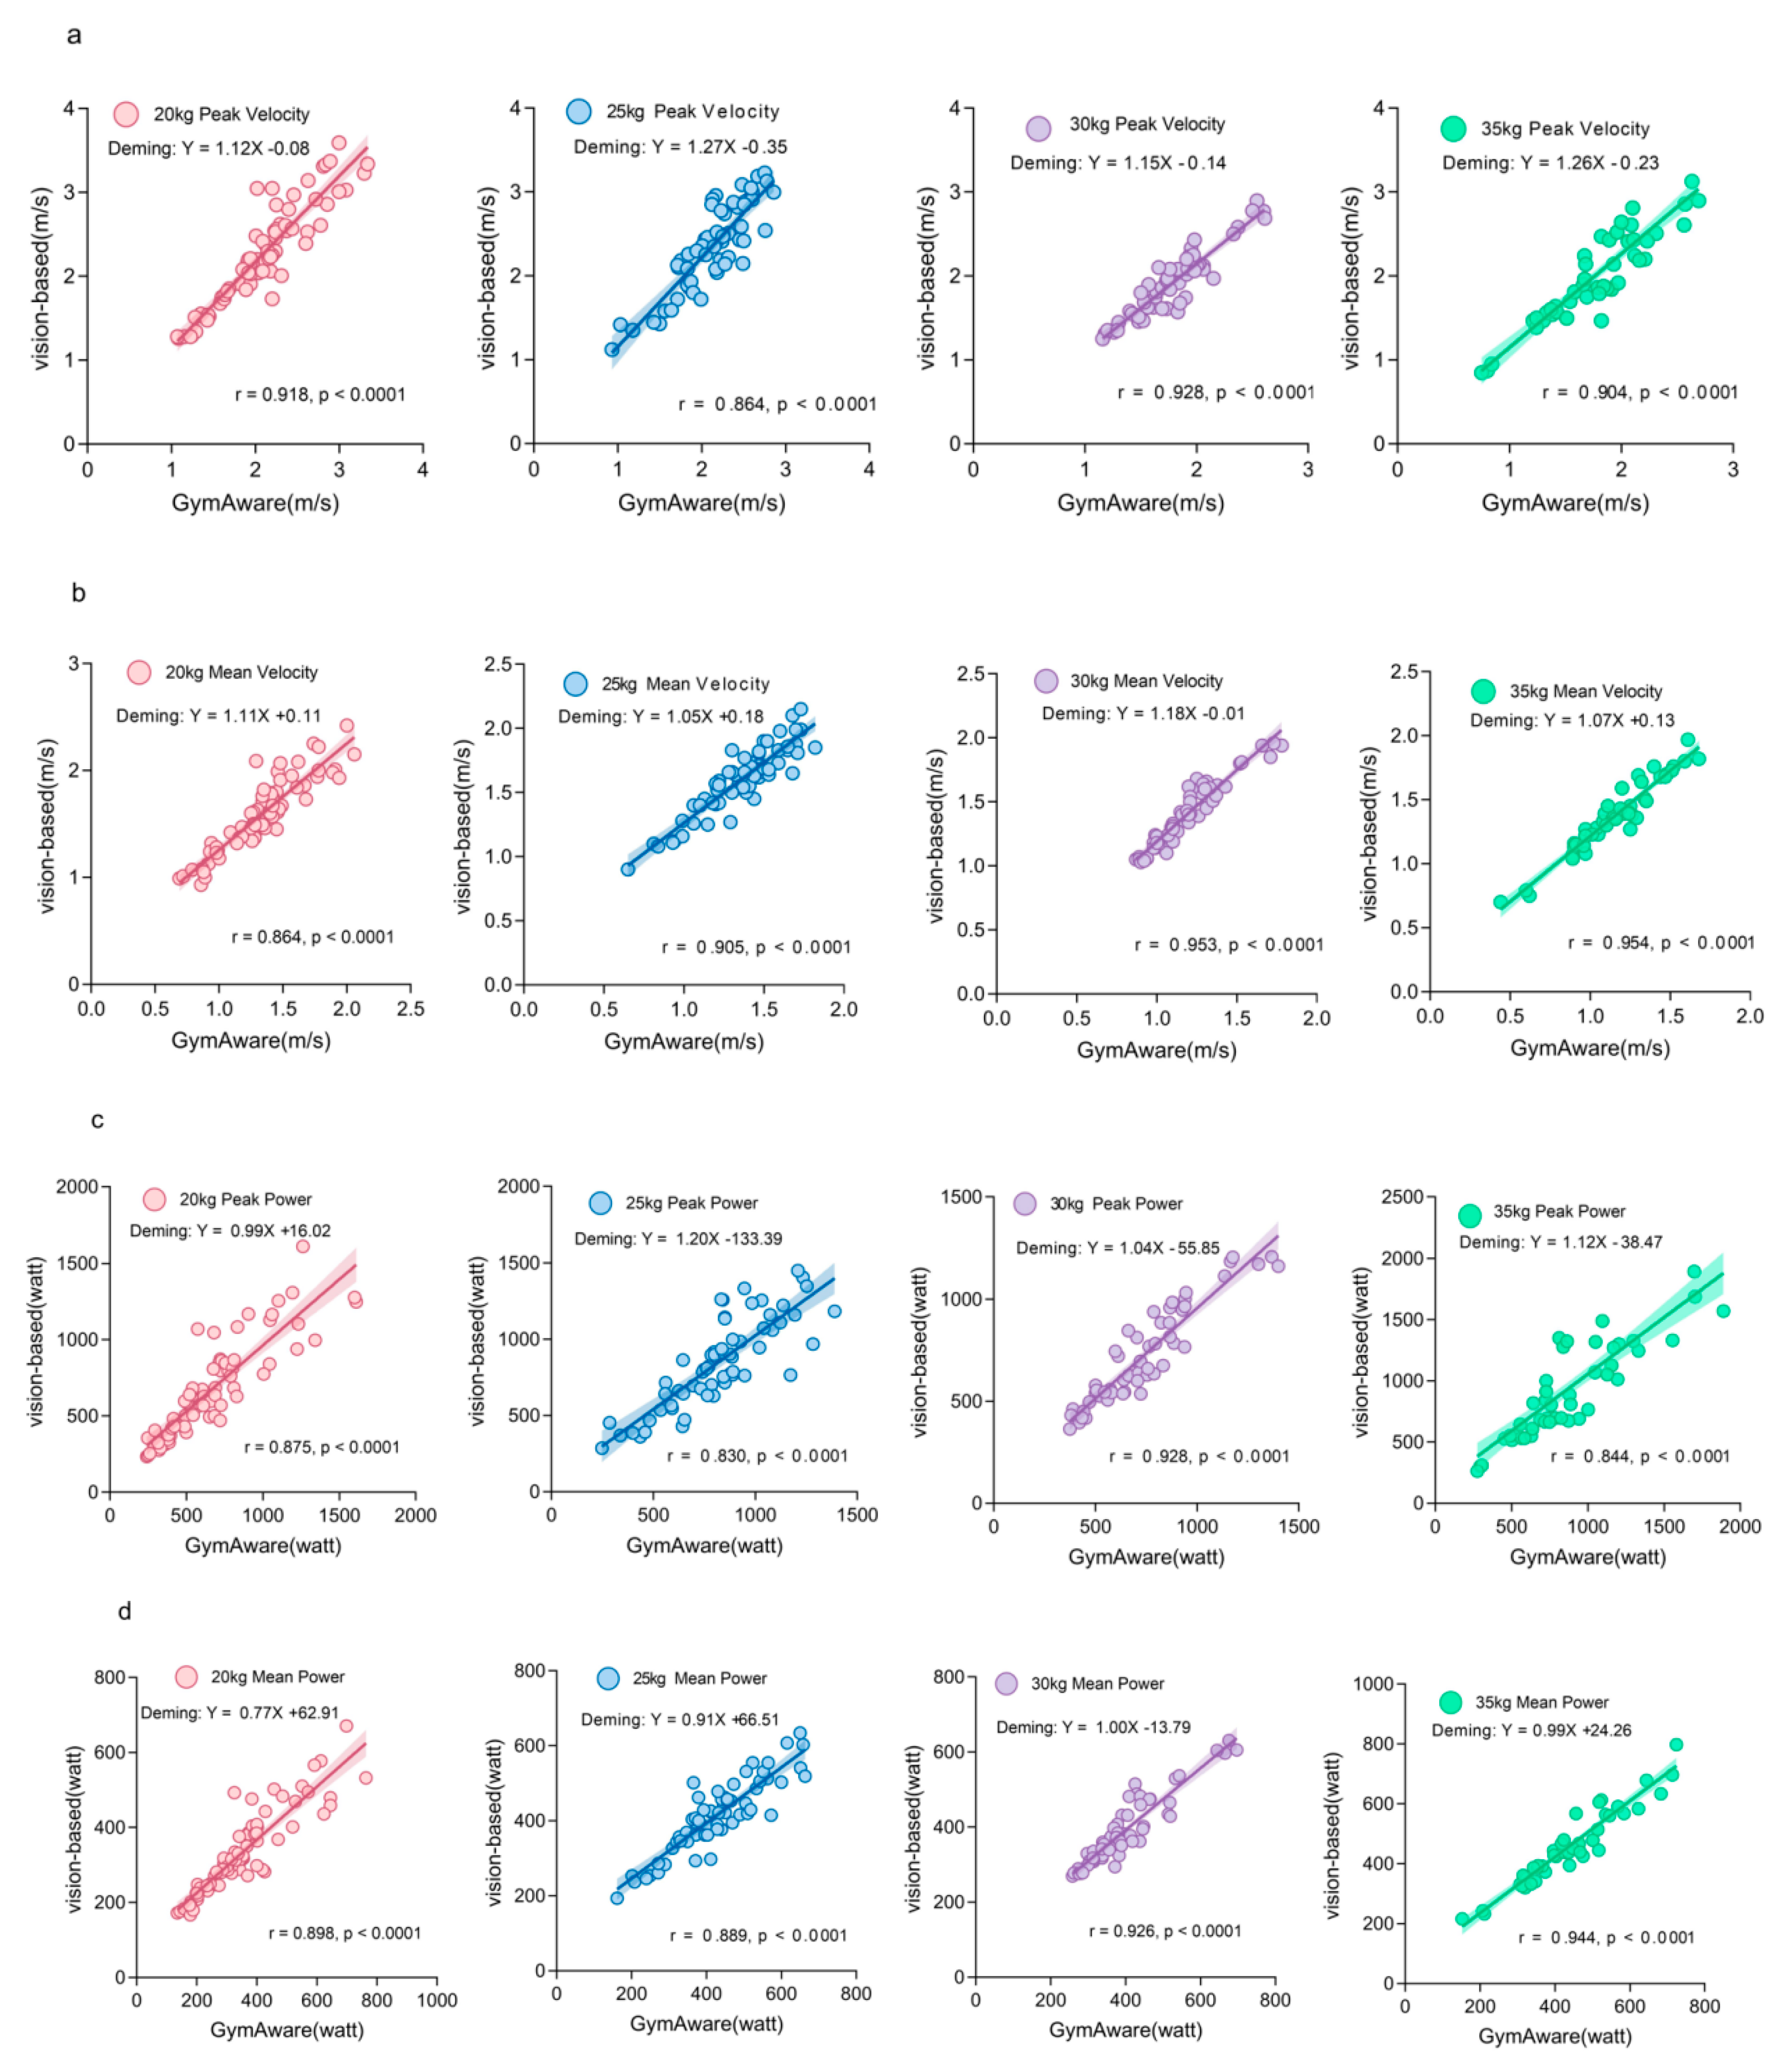
Figure 11.
Model performance on new task detection.
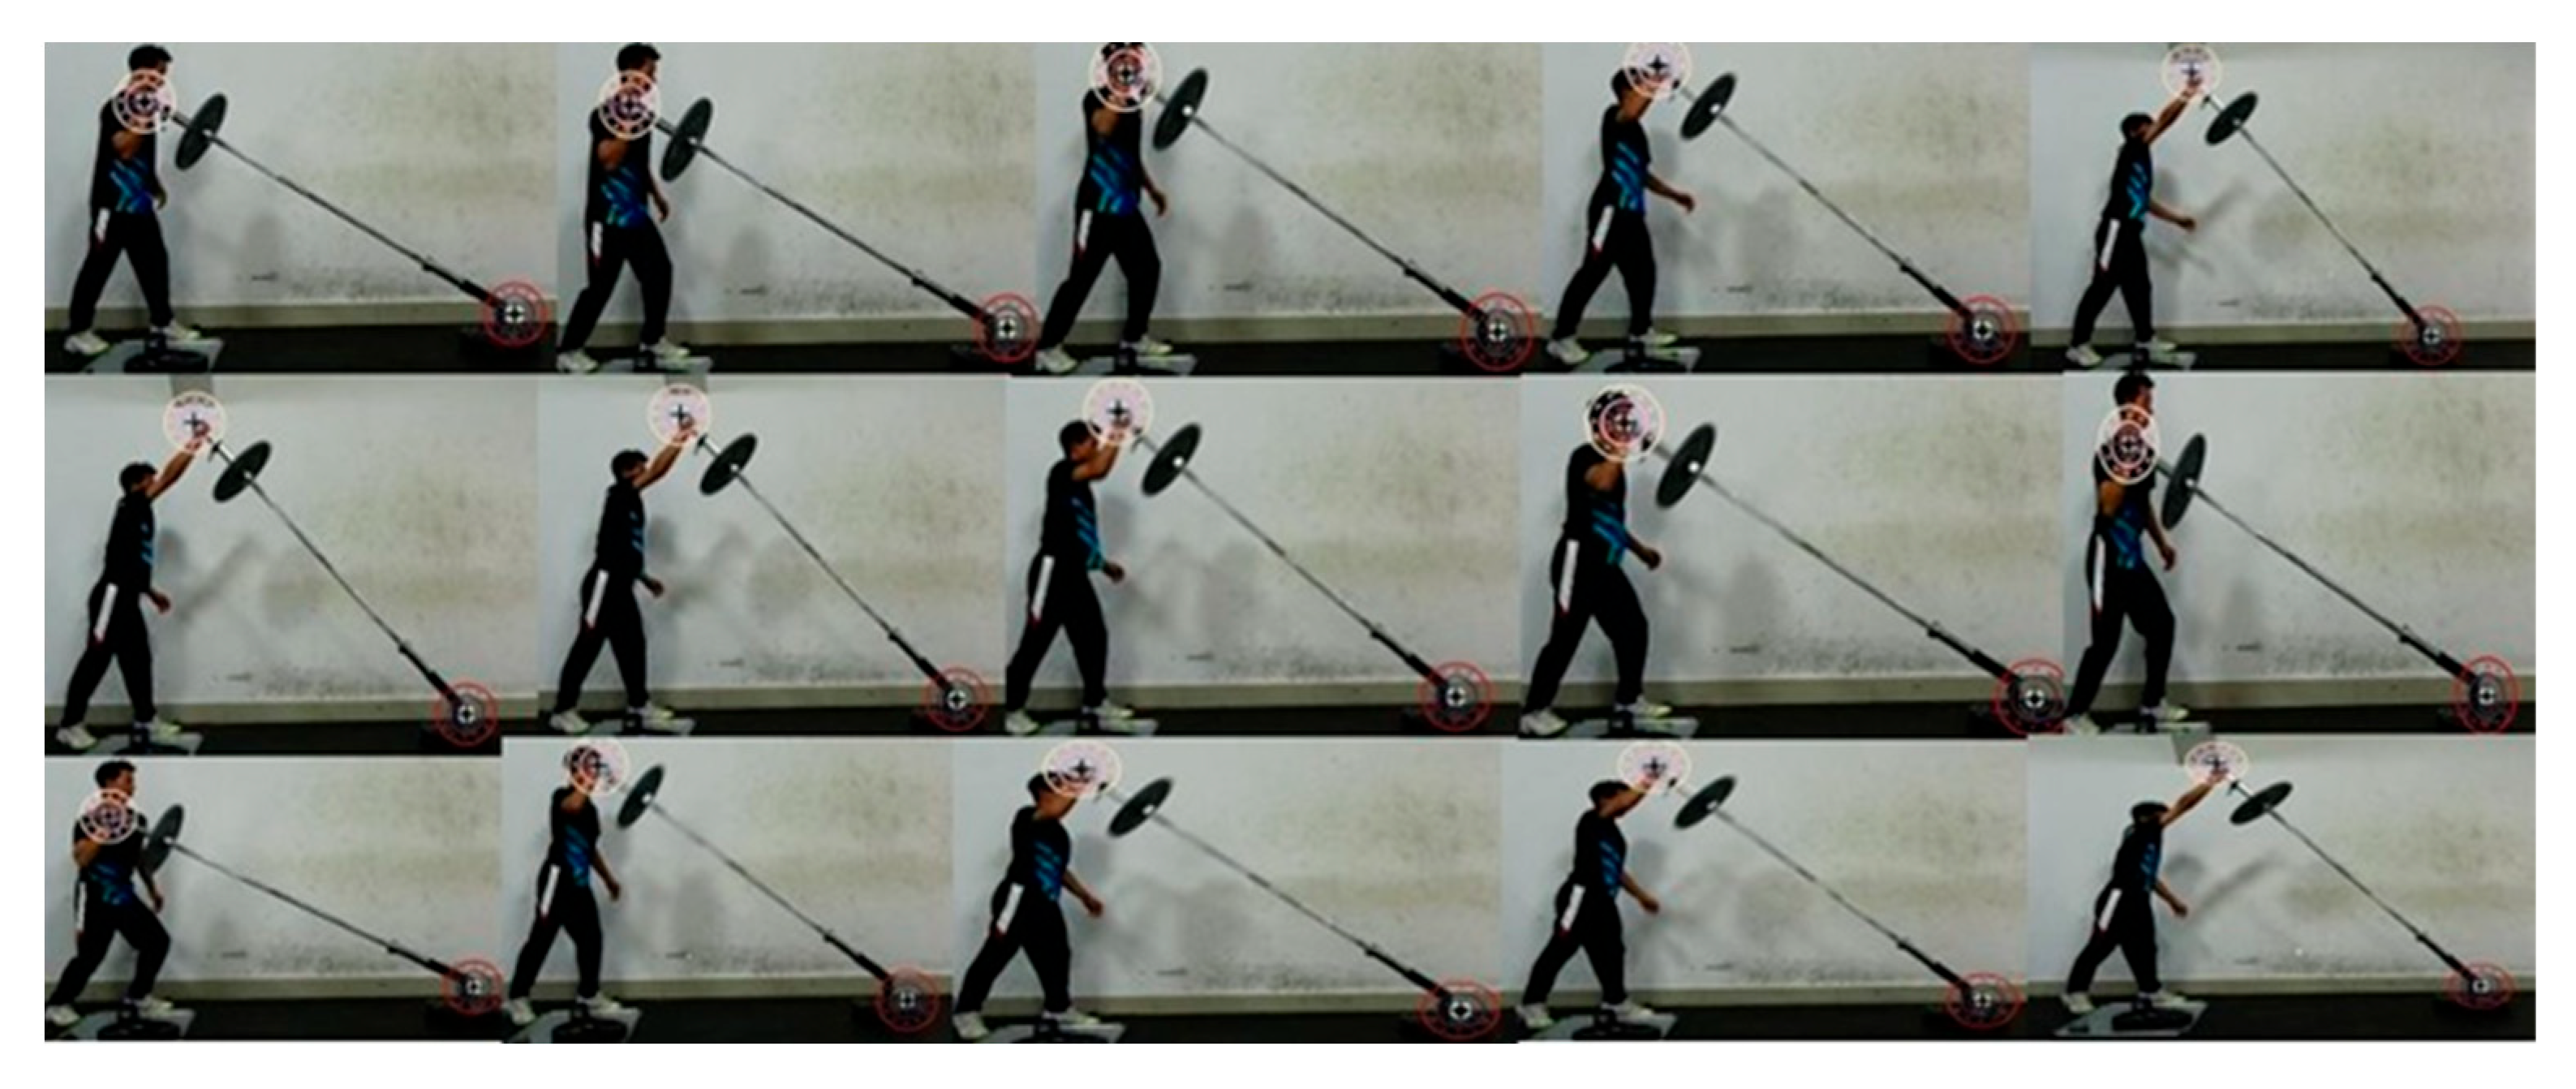

Table 1.
Kinematic indicators (mean ± SD) between the two methods across four loads.
| Load | n | Method | Peak Velocity(m/s) | Mean Velocity(m/s) | Peak Power(m/s) | Mean Power(m/s) |
|---|---|---|---|---|---|---|
| all | 247 | vison-based | 2.16 ± 0.54 | 1.50 ± 0.30 | 789.41 ± 324.67 | 395.01 ± 115.08 |
| GymAware | 1.96 ± 0.47 | 1.27 ± 0.27 | 771.35 ± 299.11 | 402.64 ± 124.50 | ||
| 20kg | 72 | vison-based | 2.27 ± 0.60 | 1.59 ± 0.34 | 678.80 ± 307.05 | 335.91 ± 110.01 |
| GymAware | 2.09 ± 0.54 | 1.33 ± 0.31 | 671.54 ± 310.59 | 355.83 ± 139.64 | ||
| 25kg | 63 | vison-based | 2.36 ± 0.50 | 1.61 ± 0.26 | 849.45 ± 288.61 | 414.39 ± 95.57 |
| GymAware | 2.13 ± 0.41 | 1.36 ± 0.25 | 819.36 ± 248.07 | 427.48 ± 114.82 | ||
| 30kg | 56 | vison-based | 1.92 ± 0.40 | 1.40 ± 0.25 | 715.20 ± 251.24 | 386.54 ± 103.44 |
| GymAware | 1.789 ± 0.36 | 1.19 ± 0.22 | 743.09 ± 243.63 | 400.02 ± 103.37 | ||
| 35kg | 56 | vison-based | 2.03 ± 0.53 | 1.38 ± 0.27 | 938.30 ± 380.04 | 457.65 ± 116.38 |
| GymAware | 1.79 ± 0.43 | 1.16 ± 0.25 | 873.95 ± 345.93 | 437.47 ± 117.41 |
Table 2.
Bland-Altman between the two methods across four loads.
| Load | Kinematic Indicators | Mean Variation | 95% LOA |
|---|---|---|---|
| all | Peak Velocity | 0.19 | -0.25 to 0.64 |
| Mean Velocity | 0.23 | 0.02 to 0.45 | |
| Peak Power | 18.06 | -312.52 to 348.63 | |
| Mean Power | -7.63 | -116.18 to 100.92 | |
| 20kg | Peak Velocity | 0.18 | -0.29 to 0.64 |
| Mean Velocity | 0.26 | -0.03 to 0.54 | |
| Peak Power | 7.26 | -294.99 to 309.52 | |
| Mean Power | -19.92 | -143.92 to 104.07 | |
| 25kg | Peak Velocity | 0.23 | -0.27 to 0.72 |
| Mean Velocity | 0.24 | 0.02 to 0.46 | |
| Peak Power | 30.10 | -285.51 to 345.70 | |
| Mean Power | -13.09 | -116.78 to 90.61 | |
| 30kg | Peak Velocity | 0.13 | -0.17 to 0.43 |
| Mean Velocity | 0.21 | 0.05 to 0.37 | |
| Peak Power | -27.90 | -309.70 to 253.91 | |
| Mean Power | -13.48 | -117.57 to 90.62 | |
| 35kg | Peak Velocity | 0.24 | -0.21 to 0.69 |
| Mean Velocity | 0.22 | 0.07 to 0.38 | |
| Peak Power | 64.35 | -337.25 to 465.94 | |
| Mean Power | 20.18 | -56.30 to 96.66 |
Table 3.
Assessment of agreement between the two methods across different loads.
| Load | Kinematic Indicators | r | p value | Cohen's d | Deming Slope | Deming intercept |
|---|---|---|---|---|---|---|
| all | Peak Velocity | 0.91 | 0.00 | 0.86 | 1.18 | -0.15 |
| Mean Velocity | 0.86 | 0.00 | 2.10 | 1.14 | 0.05 | |
| Peak Power | 0.86 | 0.09 | 0.11 | 1.10 | -59.38 | |
| Mean Power | 0.90 | 0.03 | -0.14 | 0.92 | 26.20 | |
| 20kg | Peak Velocity | 0.92 | 0.00 | 0.74 | 1.12 | -0.08 |
| Mean Velocity | 0.91 | 0.00 | 1.78 | 1.11 | 0.11 | |
| Peak Power | 0.88 | 0.69 | 0.05 | 0.99 | 16.02 | |
| Mean Power | 0.90 | 0.01 | -0.32 | 0.77 | 62.91 | |
| 25kg | Peak Velocity | 0.87 | 0.00 | 0.90 | 1.27 | -0.35 |
| Mean Velocity | 0.91 | 0.00 | 2.16 | 1.05 | 0.18 | |
| Peak Power | 0.83 | 0.14 | 0.19 | 1.20 | -133.39 | |
| Mean Power | 0.89 | 0.05 | -0.25 | 0.81 | 66.51 | |
| 30kg | Peak Velocity | 0.93 | 0.00 | 0.87 | 1.15 | -0.14 |
| Mean Velocity | 0.94 | 0.00 | 2.54 | 1.18 | -0.01 | |
| Peak Power | 0.83 | 0.15 | -0.19 | 1.04 | -55.85 | |
| Mean Power | 0.87 | 0.06 | -0.25 | 1.00 | -13.79 | |
| 35kg | Peak Velocity | 0.90 | 0.00 | 1.04 | 1.26 | -0.23 |
| Mean Velocity | 0.95 | 0.00 | 2.78 | 1.07 | 0.13 | |
| Peak Power | 0.85 | 0.02 | 0.31 | 1.12 | -38.47 | |
| Mean Power | 0.94 | 0.00 | 0.52 | 0.99 | 24.26 |
Disclaimer/Publisher’s Note: The statements, opinions and data contained in all publications are solely those of the individual author(s) and contributor(s) and not of MDPI and/or the editor(s). MDPI and/or the editor(s) disclaim responsibility for any injury to people or property resulting from any ideas, methods, instructions or products referred to in the content. |
© 2025 by the authors. Licensee MDPI, Basel, Switzerland. This article is an open access article distributed under the terms and conditions of the Creative Commons Attribution (CC BY) license (http://creativecommons.org/licenses/by/4.0/).
Copyright: This open access article is published under a Creative Commons CC BY 4.0 license, which permit the free download, distribution, and reuse, provided that the author and preprint are cited in any reuse.


