
Submitted:
27 March 2025
Posted:
28 March 2025
You are already at the latest version
Abstract
The increasing demands in high-performance sports have led to the integration of technological solutions for training optimization. This study aimed to develop and validate an algorithm-based system for analyzing three critical phases in canoe training: initial acceleration, steady-state cruising, and final sprint. Using inertial measurement units (WIMU PRO™) sampling at 10 Hz, we collected performance data from twelve young canoeists at the Mar Menor High-Performance Sports Center. The custom-developed algorithm processed velocity-time data through polynomial fitting and phase detection methods. Results showed distinctive patterns in the acceleration phase, with initial rapid acceleration (5 seconds to stabilization) deteriorating in subsequent trials (9-10 seconds). Athletes maintained consistent stabilized speeds (14.62-14.98 km/h) but required increasing space for stabilization (13.49 to 31.70 meters), with slope values decreasing from 2.58% to 0.74% across trials. Performance deterioration was evident through decreasing maximum speeds (18.58 to 17.30 km/h) and minimum speeds (11.17 to 10.17 km/h) across series. The algorithm successfully identified phase transitions and provided real-time feedback on key performance indicators. This technological approach enables automated detection of training phases and provides quantitative metrics for technique assessment, offering coaches and athletes an objective tool for performance optimization in canoeing.
Keywords:
biomechanics
; sports technology
; performance analysis
; motion tracking
; stroke efficiency
; sports training
1. Introduction
Canoeing, having a history of thousands of years as a means of transportation, has evolved into an extremely competitive Olympic sport that demands high physical conditioning, technical proficiency, and tactical awareness [1]. Modern competitive canoeing encompasses a number of disciplines, including sprint canoeing, slalom, and marathon races, each having different technical and physiological requirements, incorporate in the International Canoe Federation [2]. Sprint canoeing, specifically, has turned into an enormously popular sport since its introduction at the Olympic Games, which requires athletes to exhibit an all-around synthesis of strength, endurance, and technical accuracy [3]. The sport necessitates special anthropometric features and physical abilities, as a number of studies have emphasized the importance of upper body strength, aerobic fitness, and technical proficiency [4,5]. Physiological demands vary greatly across race distances, from explosive power for 200m races to aerobic endurance for the longer distances races, with specific training modalities needed for each one [6].
Key performance indicator (KPI) analysis in the sport of canoeing has conventionally been through a combination of qualitative and quantitative approaches. Qualitative analysis generally involves expert judgment of the pattern and technique of movement with attention to aspects such as paddle entry, pull-through phase, and recovery mechanics [7]. But inherent limitations with subjective evaluation have seen greater focus on quantitative analytical techniques. Contemporary sport canoeing performance measurement integrates several measurable parameters, such as stroke rate, velocity profiles, force characteristics, and biomechanical efficiency metrics [8,9]. Recent research demonstrates that competitive canoeing success is largely reliant on the integration of these parameters, most notably the ability to sustain consistent stroke mechanics and power transmission efficiency across varying stages of the race [10,11]. The ability to accurately measure these parameters has become vital to training optimization and competition strategy development.
The use of emerging technologies has revolutionized performance analysis and training methodology in canoeing. Modern technology applications range from basic video analysis software to complex sensor-based monitoring systems [12]. GPS technology, force measurement systems, and biomechanical analysis equipment have become standard elements in elite training centers [13,14,15]. A point of interest is the recent innovation in the application of Inertial Measurement Units (IMUs) as an effective analysis tool for performance. The devices in question, generally composed of accelerometers, gyroscopes, and magnetometers, present various notable benefits: elevated sampling rates (commonly >100 Hz), the capacity for multi-axial movement recognition, and the functionality to amalgamate data from numerous sensors concurrently [16]. IMUs provide precise measurements of acceleration, angular velocity, and orientation, enabling detailed analysis of paddle movement patterns and body position changes throughout the stroke cycle [17,18].
Specialized signal-processing algorithms for IMU signals have opened up new avenues for movement detection and performance analysis in sports. These algorithms are capable of filtering noise effectively, identifying individual movement patterns, and extracting meaningful performance metrics from dense sensor data. In canoeing, algorithmic processing has enabled automatic identification of stroke phases, assessment of technique consistency, and identification of fatigue-related degradation of technique [19,20]. Advanced signal processing techniques and machine learning algorithms have enhanced our ability to analyze movement patterns in real-time, providing immediate feedback to athletes and coaches. This technological advancement has particularly benefited the analysis of cyclic movements in sports, allowing for more precise quantification of performance parameters and technique variations [21].
Despite these technological advances, there remains a significant gap in our understanding of how to effectively monitor and analyze different training phases in real-time during canoe training sessions. While existing research has examined isolated aspects of canoeing performance, there is limited knowledge about the integrated analysis of multiple performance parameters across different training phases, particularly in real-time conditions. This study aims to address this gap by developing and implementing an algorithm-based system for real-time analysis of three critical training phases in canoeing: the initial acceleration phase, the steady-state cruising phase, and the final sprint phase. We hypothesize that our custom algorithm will effectively identify and analyze these distinct phases, providing valuable insights into technique efficiency and performance variations. Furthermore, we propose that this real-time analysis system will enable more precise and timely adjustments to training protocols, ultimately contributing to enhanced performance optimization in competitive canoeing.
2. Materials and Methods
2.1. Design
This research used a cross-sectional observational design to examine the phases of canoe training aided by technological advancement. The study took place at the Mar Menor High Performance Sports Center "Infanta Cristina" of Los Alcázares (Murcia, Spain), which is a specialized facility for the training and development of high-level athletes. The data were registered during training sessions over the course of two years, with emphasis on the evaluation of three different phases of performance: initial acceleration, steady-state cruising, and final sprint.
2.2. Participants
Young Spanish national team canoeists who were training to be professional athletes to compete in international competitions (European Championships, World Championships, and Olympics) participated in the study. All athletes were actively training at the High-Performance Center under the supervision of the Spanish Canoeing Federation. For consideration, the participants were required to fulfill the following criteria: (1) they must be an active national team member, (2) they must have at least three years of competitive experience, and (3) they must not have any injury that might impair performance.
The sample consisted of 12 athletes (8 males and 4 females; age: 15.7 ± 0.7 years; height: 176.3 ± 7.2 cm; body mass: 72.4 ± 8.3 kg; competitive experience: 5.6 ± 1.8 years). All participants were explained the procedures of the study and provided written in-formed consent before participation. In the case of athletes younger than 18 years, parental consent was also obtained. The research was carried out in accordance with the Declaration of Helsinki and was authorized by the Ethics Committee of the University of Murcia (reference number: 3495/2021).
2.3. Equipment and Data Processing
Data collection was realized using the WIMU PRO™ device (RealTrack Systems, Almeria, Spain). The inertial measurement unit combines various sensors in a lightweight 70g unit of 81x45x16mm. Four 3D accelerometers with various ranges (±16G, ±16G, ±32G, and ±400G) provide thorough detection of movement at varying intensities. Three gyroscopes (two of which are ±2000°/s and one of which is ±4000°/s, both at 1000Hz sampling) measure rotational movement, augmented by a 3D magnetometer (±8 Gauss at 160 Hz) and a barometer (±1200 mbar at 100 Hz).
To enable accurate spatial localization and speed measurements, the device uses GNSS/GPS technology at 10Hz with a UWB positioning system at 18Hz. Data transmission is enabled by various channels such as WiFi 802.11 b/g/n, Bluetooth, ANT+, and USB 2.0, and all data are recorded in an 8GB internal flash memory. The 4-hour battery life of the device enables efficient analysis of training sessions.
Primary data processing was done through SPRO™ software (Version 2023.1, RealTrack Systems, Almería, Spain), which offers large-scale data analysis and the possibility to export raw data for subsequent use of custom-designed algorithms. The analysis process included generic and sport-specific software tools. Generic analysis was done by Microsoft Excel (Version 16.0, Microsoft Corporation, Redmond, USA) and IBM SPSS Statistics (Version 28.0, IBM Corp., Armonk, USA). Custom-made algorithm development and signal processing were done with MATLAB (Version R2023b, MathWorks Inc., Natick, USA).
2.4. Procedures
All testing procedures were conducted across three primary locations, each serving specific research purposes. The primary research center was established at the Faculty of Sports Sciences of the University of Murcia, specifically within the laboratory of the Research Group E0A1-06 BIOVETMED & SPORTSCI in San Javier (Murcia, Spain). This facility served as the main center for data processing and research team meetings, equipped with necessary computational resources and analysis software.
The algorithm development and mathematical analysis were conducted at the Higher Technical School of Engineering of Roads, Canals and Ports and Engineering of the Polytechnic University of Cartagena. This facility provided the necessary technical infrastructure for developing and refining the mathematical algorithms used in the study.
Field testing and data collection were performed at the Sports Technification Center in Los Narejos (Los Alcázares, Murcia, Spain), specifically on the beach area. Testing sessions were conducted under controlled environmental conditions (wind speed <8 km/h, water temperature 18-22°C) to ensure consistency in data collection. Each testing session followed a standardized protocol beginning with a 10-minute device setup period, including calibration and secure placement of the WIMU PRO™ device on the kayak.
Athletes completed a structured 15-minute warm-up protocol, including course familiarization and equipment adjustment. The main testing protocol consisted of three maximal effort trials over 200m, with 10-minute recovery periods between trials. GPS markers were placed at start and finish points to ensure accurate distance measurement. During each trial, continuous recording of position data was maintained, with real-time monitoring of signal quality and a backup recording system for redundancy.
2.5. Signal Processing and Algorithm Development
The analysis of the collected data followed a systematic approach combining signal processing and algorithm implementation. Initial signal processing involved filtering and smoothing of the raw IMU data (10 Hz) through a moving average filter to reduce noise while preserving essential movement patterns, as shown in the comparison between raw and filtered signals in Figure 1A. The algorithm then processed this filtered data to identify the three critical performance phases through automated detection of transition points, illustrated in Figure 1B.
Then, for the algorithm development, we focused on the detection and analysis of three critical phases in canoe performance: initial acceleration, steady-state cruising, and final sprint. The steps that we propose for our own algorithm are the following:
Step 1: Smoothing the signal considering means in subintervals.
for i=1:n
mean(i)=classicalmean(series,x(i),x(i+1));
end
Step 2: Define the cruising speed as the mean of the first speed where the smoothed signal decreases and the two consecutive means.
for i=1:n-1
if mean(i+1)<mean(i)
p1=x(i);
ii=i;
m=(mean(i+2)+mean(i+1)+mean(i))/3;
break;
end
end
cruisingspeed=m;
Step 3: Compute the local maximum and minimum.
for i=ii+3:n-1
if mean(i)<min(mean(i-1),mean(i+1))
minimo(i)=mean(i);
end
if mean(i)>max(mean(i-1),mean(i+1))
maximo(i)=mean(i);
end
end
Step 4: Compute the range as the interval between the absolute maximum and the absolute minimum.
Step 5: Construct the best fit polynomial (in a least-squares sense) for the data in the interval [0, ts ], where ts is the time where the speed is stabilized (Step 2). Compute the average of the slope of the polynomial.
for i=1:p1
xx(i)=i/(lon(1)/(b-a));
yy(i)=series(i);
end
tiempo=xx(p1);
pol=polyfit(xx,yy,s);
if s==1
slope=pol(1);
spacepol=pol(1)*xx(p1)^2/2+pol(2)*xx(p1);
else
slope=2*pol(1)*xx(floor(p1/2))+pol(2);
spacepol=pol(1)*xx(p1)^3/3+pol(2)*xx(p1)^2/2+pol(3)*xx(p1);
end
3. Results
The algorithm successfully analyzed the velocity profiles across three series, providing comprehensive visualizations for each trial. For each series, four distinct analytical representations were generated: a velocity-time profile, a velocity distribution histogram, a polynomial fit analysis, and a space-time relationship plot. These visualizations enabled detailed examination of performance characteristics across different phases of each trial (Figure 2).
The velocity-time profiles (Figure 2A) revealed distinct performance patterns, with Series 1 demonstrating an aggressive acceleration profile and reaching peak velocities more rapidly than subsequent trials. Series 2 and 3 showed more gradual acceleration patterns, with smoother transitions between phases. The velocity distribution histograms (Figure 2B) highlighted variations in speed maintenance, with Series 1 exhibiting the widest distribution of velocities post-stabilization, while Series 2 and 3 showed progressively narrower distributions, suggesting more consistent but generally lower velocity maintenance patterns.
Polynomial fitting analysis of the acceleration phase (Figure 2C) revealed marked differences in performance efficiency between series, with Series 1 demonstrating the steepest acceleration curve, while Series 2 and 3 displayed more gradual polynomial curves. The space-time relationship plots (Figure 2D) further confirmed these patterns, clearly demonstrating the superior acceleration characteristics of Series 1, particularly in the initial phase, whereas Series 2 and 3 showed similar patterns to each other but with notably different profiles from Series 1, especially in the distance required to achieve stabilization.
Analysis of the performance parameters compiled in Table 1 revealed several significant trends across the three series. The stabilized speed showed minimal variation between series (14.98, 14.93, and 14.62 km/h respectively), but the space required to achieve these speeds increased substantially from Series 1 (13.49 meters) to Series 2 and 3 (31.39 and 31.70 meters). The time until stabilized speed followed a similar pattern, with Series 1 requiring only 5 seconds compared to 9 and 10 seconds for Series 2 and 3.
The slope values recorded in Table 1 further quantified these differences, with Series 1 showing a markedly higher slope (2.58%) compared to Series 2 (0.74%) and Series 3 (0.84%). Maximum speeds after stabilization demonstrated a consistent decline across series (18.58, 17.76, and 17.30 km/h), as did minimum speeds (11.17, 10.50, and 10.17 km/h), indicating progressive performance deterioration. The real space measurements closely matched the calculated distances, with only minor discrepancies across all series, validating the accuracy of the algorithmic approach.
4. Discussion
The development and validation of automated analysis systems for sports performance represents a significant advancement in training optimization. This study aimed to create and implement an algorithm-based system for real-time analysis of canoe training phases, specifically focusing on the detection and characterization of initial acceleration, steady-state cruising, and final sprint phases. Our findings demonstrated the algorithm's capability to effectively identify these phases and provide quantitative metrics for performance assessment, offering coaches and athletes objective data for training optimization, which aligns with recent technological trends in water sports monitoring [12,15].
The analysis of the acceleration phase revealed interesting patterns in performance development. Athletes achieved stabilized speeds between 14.62-14.98 km/h, which are higher values than previously reported for elite kayakers [8,10]. The time required to reach stabilized speed varied considerably between series (5-10 seconds), suggesting significant differences in acceleration strategies and fatigue effects across trials. This variability in acceleration profiles might be attributed to different technical approaches or physical capabilities, as suggested by recent biomechanical analyses [9,11]. The importance of this initial phase has been highlighted in previous research, where proper technique during acceleration has been shown to significantly impact overall performance [3,22].
The steady-state phase analysis provided particularly valuable insights into technical consistency. The velocity fluctuations observed between maximum and minimum speeds after stabilization (ranging from 7.41 km/h in Series 1 to 7.13 km/h in Series 3) indicate varying levels of velocity maintenance capability across trials. This finding aligns with research by Gomes et al. [23], who emphasized that successful performance in competitive canoeing relies heavily on the optimization of stroke parameters and efficiency metrics. The progressive decrease in both maximum and minimum speeds across series (from 18.58 to 17.30 km/h for maximum speeds, and from 11.17 to 10.17 km/h for minimum speeds) suggests a systematic impact of fatigue on performance [22,24].
The slope analysis during the acceleration phase revealed significant variations between series (from 2.58% in Series 1 to 0.74-0.84% in Series 2 and 3), introducing a novel metric for evaluating acceleration efficiency. This parameter, calculated through polynomial fitting, offers a more sophisticated understanding of acceleration patterns compared to traditional time-based metrics [17,19]. The marked difference in slope values between the first and subsequent series suggests a substantial impact of fatigue on acceleration capability, potentially reflecting changes in technical execution and power output [25,26].
Performance deterioration across series was particularly evident in the increasing space required to achieve stabilized speed (from 13.49 meters in Series 1 to over 31 meters in Series 2 and 3). This degradation in performance aligns with previous research on fatigue effects in elite canoeists [27,28]. The relationship between higher cruising speeds and poorer final sprint performance has also been documented in recent studies [8,10], suggesting the need for specific training interventions focused on maintaining power output throughout the entire performance [6].
The implementation of IMU-based analysis provides several advantages over traditional assessment methods, as highlighted by recent technological developments [16,18]. The high sampling frequency and multi-axial movement detection capabilities allow for more precise quantification of performance parameters, representing a significant advancement from traditional video analysis methods [15,29]. Our approach of combining velocity-time profiles, distribution histograms, polynomial fitting, and space-time relationships provides a comprehensive framework for performance analysis that captures both macro and micro aspects of technique execution.
Several limitations should be considered when interpreting these results. First, the relatively small sample size (n=12), although typical for elite sport research, may limit the generalizability of findings. Second, environmental conditions, while controlled, could still influence performance parameters. Future research should focus on expanding the sample size, incorporating different skill levels, and investigating the algorithm's applicability across various environmental conditions. Additionally, longitudinal studies examining the relationship between these performance metrics and competition outcomes would provide valuable insights into the predictive validity of the analysis system. The integration of machine learning approaches could further enhance the algorithm's capabilities in pattern recognition and performance prediction.
5. Conclusions
This study demonstrated the effectiveness of a novel algorithm-based system for analyzing three critical phases of canoe performance in real-time. Our analysis revealed significant performance patterns across multiple trials: rapid initial acceleration in Series 1 (5 seconds to stabilization) compared to longer durations in subsequent trials (9-10 seconds), consistent stabilized speeds (14.62-14.98 km/h) but increasing space requirements for stabilization (13.49 to 31.70 meters), and clear performance deterioration evidenced by decreasing maximum speeds (18.58 to 17.30 km/h) and minimum speeds (11.17 to 10.17 km/h). The marked differences in acceleration efficiency, quantified through slope analysis (2.58% to 0.74%), provided novel insights into technique deterioration across trials.
These findings have several practical applications for coaches and athletes. The real-time analysis of acceleration profiles enables immediate feedback on technique efficiency, while the quantification of space required for stabilization offers a new metric for assessing training adaptations. The comprehensive analysis of velocity maintenance through maximum and minimum speed tracking provides objective measures for evaluating technical consistency and fatigue resistance. This technological approach represents a significant advancement in canoe training methodology, providing coaches and athletes with objective data for performance optimization and training periodization.
Author Contributions
Conceptualization, S.A. and S.B.; methodology, S.A., S.B. and C.D.G.-C.; software, S.A. and S.B.; validation, C.D.G.-C., M.G.-L. and J.P.-O.; formal analysis, S.A., S.B. and C.D.G.-C.; investigation, C.D.G.-C. and M.G.-L.; resources, J.P.-O. and M.G.-L.; data curation, C.D.G.-C.; writing—original draft preparation, S.A. and S.B.; writing—review and editing, C.D.G.-C., M.G.-L. and J.P.-O.; visualization, S.A. and C.D.G.-C.; supervision, M.G.-L. and J.P.-O.; project administration, J.P.-O.; funding acquisition, J.P.-O. All authors have read and agreed to the published version of the manuscript.
Funding
This research has not received external funding and is linked to the doctoral thesis of Sergio Amat Plata.
Data Availability Statement
The raw data supporting the conclusions of this article will be made available by the authors on request.
Conflicts of Interest
The authors declare no conflicts of interest. The funders had no role in the design of the study; in the collection, analyses, or interpretation of data; in the writing of the manuscript; or in the decision to publish the results.
References
- Messias, L.H.D.; Reis, I.G.M.D.; Bielik, V.; Garbuio, A.L.P.; Gobatto, C.A.; Manchado-Gobatto, F.B. Association Between Mechanical, Physiological, and Technical Parameters With Canoe Slalom Performance: A Systematic Review. Front. Physiol. 2021, 12. [Google Scholar] [CrossRef] [PubMed]
- International Canoe Federation (ICF) Disciplines of Canoeing. Available online: https://www.canoeicf.com/es/home (accessed on 5 February 2025).
- López-Plaza, D.; Alacid, F.; Muyor, J.M.; López-Miñarro, P.Á. Sprint Kayaking and Canoeing Performance Prediction Based on the Relationship between Maturity Status, Anthropometry and Physical Fitness in Young Elite Paddlers. J. Sports Sci. 2017, 35, 1083–1090. [Google Scholar] [CrossRef] [PubMed]
- Hamano, S.; Ochi, E.; Tsuchiya, Y.; Muramatsu, E.; Suzukawa, K.; Igawa, S. Relationship between Performance Test and Body Composition/Physical Strength Characteristic in Sprint Canoe and Kayak Paddlers. Open Access J. Sports Med. 2015, 6, 191–199. [Google Scholar] [CrossRef]
- McKean, M.R.; Burkett, B.J. The Influence of Upper-Body Strength on Flat-Water Sprint Kayak Performance in Elite Athletes. Int. J. Sports Physiol. Perform. 2014, 9, 707–714. [Google Scholar] [CrossRef] [PubMed]
- Hunter, M.; Curinier, S. Training for Canoeing. In Handbook of Sports Medicine and Science; John Wiley & Sons, Ltd, 2019; pp. 71–90 ISBN 978-1-119-09719-8.
- Wainwright, B. Biomechanics and Equipment (Sprint and Slalom): A Review of Scientifically Confirmed Information. In Handbook of Sports Medicine and Science; John Wiley & Sons, Ltd, 2019; pp. 12–39 ISBN 978-1-119-09719-8.
- Goreham, J.A.; Miller, K.B.; Frayne, R.J.; Ladouceur, M. Pacing Strategies and Relationships between Speed and Stroke Parameters for Elite Sprint Kayakers in Single Boats. J. Sports Sci. 2021, 39, 2211–2218. [Google Scholar] [CrossRef]
- Gomes, B.B.; Ramos, N.V.; Conceição, F.; Sanders, R.; Vaz, M.; Vilas-Boas, J.P. Paddling Time Parameters and Paddling Efficiency with the Increase in Stroke Rate in Kayaking. Sports Biomech. 2022, 21, 1303–1311. [Google Scholar] [CrossRef]
- Pickett, C.W.; Abbiss, C.; Zois, J.; Blazevich, A.J. Pacing and Stroke Kinematics in 200-m Kayak Racing. J. Sports Sci. 2021, 39, 1096–1104. [Google Scholar] [CrossRef]
- McDonnell, L.K.; Hume, P.A.; Nolte, V. A Deterministic Model Based on Evidence for the Associations between Kinematic Variables and Sprint Kayak Performance. Sports Biomech. 2013, 12, 205–220. [Google Scholar] [CrossRef]
- Cruz, M.I.; Sarmento, H.; Amaro, A.M.; Roseiro, L.; Gomes, B.B. Advancements in Performance Monitoring: A Systematic Review of Sensor Technologies in Rowing and Canoeing Biomechanics. Sports 2024, 12, 254. [Google Scholar] [CrossRef]
- Romagnoli, C.; Boatto, P.; Campoli, F.; Caprioli, L.; Delgado, D.; Edriss, S.; Frontuto, C.; Lanotte, N.; Annino, G.; Padua, E.; et al. Monitoring of Kinetic Parameters in Sprint Canoeing Performance. In Proceedings of the Engineering Methodologies for Medicine and Sports; Montanari, R., Richetta, M., Febbi, M., Staderini, E.M., Eds.; Springer Nature Switzerland: Cham, 2024; pp. 710–724.
- Macdermid, P.W.; Coppelmans, A.; Cochrane, D. The Validity and Reliability of a Global Navigation Satellite System in Canoe Slalom. Biomechanics 2022, 2, 20–29. [Google Scholar] [CrossRef]
- Bonaiuto, V.; Gatta, G.; Romagnoli, C.; Boatto, P.; Lanotte, N.; Annino, G. A Pilot Study on the E-Kayak System: A Wireless DAQ Suited for Performance Analysis in Flatwater Sprint Kayaks. Sensors 2020, 20, 542. [Google Scholar] [CrossRef] [PubMed]
- Gómez-Carmona, C.D.; Pino-Ortega, J.; Rico-González, M. Microelectromechanical Systems. In The Use of Applied Technology in Team Sport; Routledge, 2021; pp. 52–73.
- Fernandes, R.A.; Alacid, F.; Gomes, A.B.; Gomes, B.B. Validation of a Global Positioning System with Accelerometer for Canoe/Kayak Sprint Kinematic Analysis. Sports Biomech. 2024, 23, 2168–2179. [Google Scholar] [CrossRef] [PubMed]
- Liu, L.; Qiu, S.; Wang, Z.; Li, J.; Wang, J. Canoeing Motion Tracking and Analysis via Multi-Sensors Fusion. Sensors 2020, 20, 2110. [Google Scholar] [CrossRef] [PubMed]
- Liu, L.; Wang, H.-H.; Qiu, S.; Zhang, Y.-C.; Hao, Z.-D. Paddle Stroke Analysis for Kayakers Using Wearable Technologies. Sensors 2021, 21, 914. [Google Scholar] [CrossRef]
- Wang, Z.; Wang, J.; Zhao, H.; Yang, N.; Fortino, G. CanoeSense: Monitoring Canoe Sprint Motion Using Wearable Sensors. In Proceedings of the 2016 IEEE International Conference on Systems, Man, and Cybernetics (SMC); October 2016; pp. 000644–000649.
- Klitgaard, K.K.; Hauge, C.; Oliveira, A.S.; Heinen, F. A Kinematic Comparison of On-Ergometer and on-Water Kayaking. Eur. J. Sport Sci. 2021, 21, 1375–1384. [Google Scholar] [CrossRef]
- Vaquero-Cristóbal, R.; Alacid, F.; López-Plaza, D.; Muyor, J.M.; López-Miñarro, P.A. Kinematic Variables Evolution During a 200-m Maximum Test in Young Paddlers. J. Hum. Kinet. 2013, 38, 15–22. [Google Scholar] [CrossRef]
- Gomes, B.B.; Ramos, N.V.; Conceição, F.A.V.; Sanders, R.H.; Vaz, M.A.P.; Vilas-Boas, J.P. Paddling Force Profiles at Different Stroke Rates in Elite Sprint Kayaking. J. Appl. Biomech. 2015, 31, 258–263. [Google Scholar] [CrossRef]
- Bjerkefors, A.; Tarassova, O.; Rosén, J.S.; Zakaria, P.; Arndt, A. Three-Dimensional Kinematic Analysis and Power Output of Elite Flat-Water Kayakers. Sports Biomech. 2018, 17, 414–427. [Google Scholar] [CrossRef]
- Zahálka, F.; Malỳ, T.; Malá, L.; Doktor, M.; Větrovskỳ, J. Kinematic Analysis of Canoe Stroke and Its Changes during Different Types of Paddling Pace–Case Study. J. Hum. Kinet. 2011, 29, 25. [Google Scholar] [CrossRef]
- Wassinger, C.A.; Myers, J.B.; Sell, T.C.; Oyama, S.; Rubenstein, E.N.; Lephart, S.M. Scapulohumeral Kinematic Assessment of the Forward Kayak Stroke in Experienced Whitewater Kayakers. Sports Biomech. 2011, 10, 98–109. [Google Scholar] [CrossRef]
- Borges, T.O.; Bullock, N.; Aitken, D.; Cox, G.R.; Coutts, A.J. Metabolic Cost of Paddling on Different Commercially Available Kayak Ergometers. Int. J. Sports Physiol. Perform. 2020, 15, 1189–1192. [Google Scholar] [CrossRef] [PubMed]
- Rosdahl, H.; Calbet, J.; Sheel, A.W.; Boushel, R. Physiology of Canoeing. In Handbook of Sports Medicine and Science; McKenzie, D., Berglund, B., Eds.; Wiley, 2019; pp. 47–61 ISBN 978-1-119-09720-4.
- Croft, H.; Ribeiro, D.C. Developing and Applying a Tri-Axial Accelerometer Sensor for Measuring Real Time Kayak Cadence. Procedia Eng. 2013, 60, 16–21. [Google Scholar] [CrossRef]
Figure 1.
Signal processing stages in canoe performance analysis. A) Comparison between raw velocity data (grey line) and filtered signal (black line) demonstrating noise reduction. B) Phase detection analysis with identified cruising speed threshold (dashed line). Data collected using WIMU PRO™ device at 10 Hz sampling frequency.
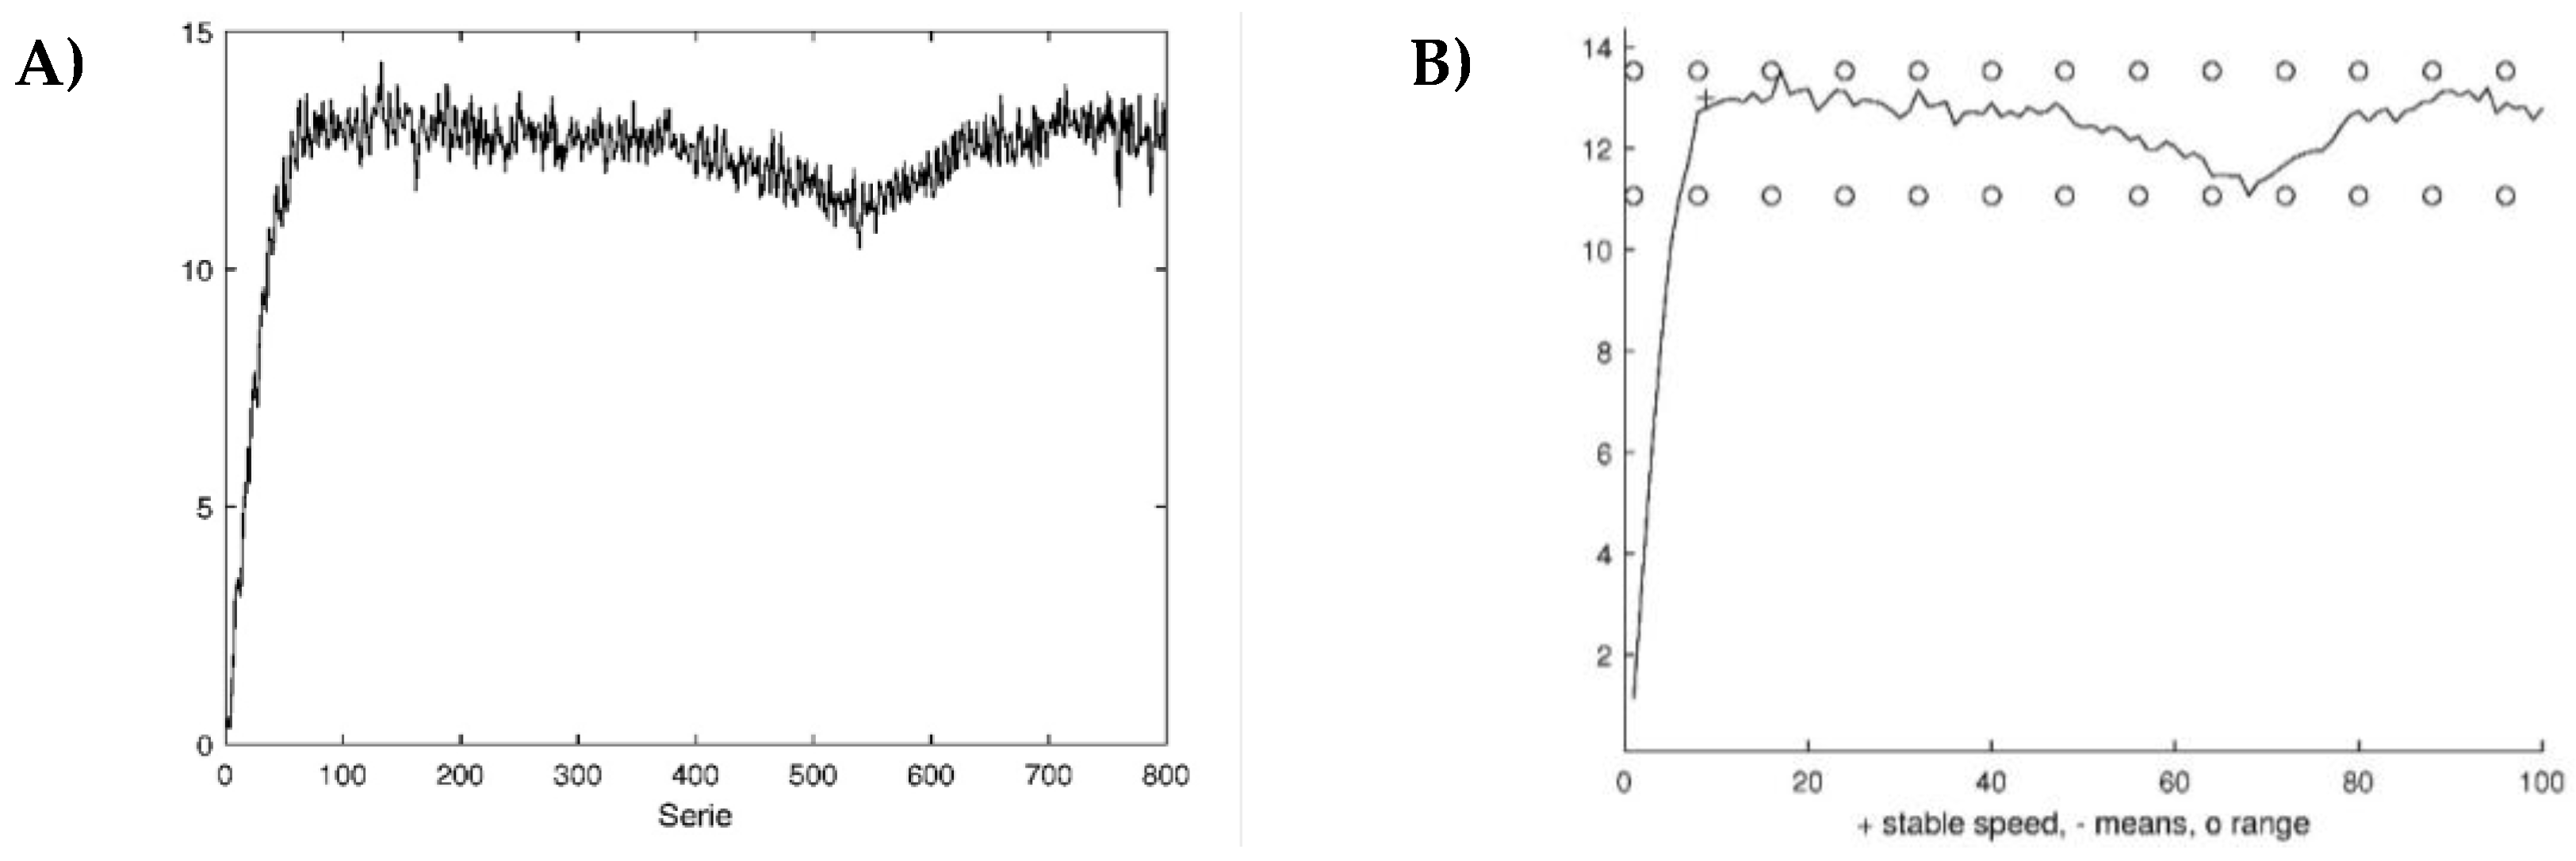
Figure 2.
Visual representation of performance analysis for each canoe trial showing four complementary analyses: velocity-time profile (A), velocity distribution histogram (B), polynomial fitting of the acceleration phase (C), and space-time relationship (D). Data presented demonstrates the characteristic patterns analyzed through the custom algorithm.
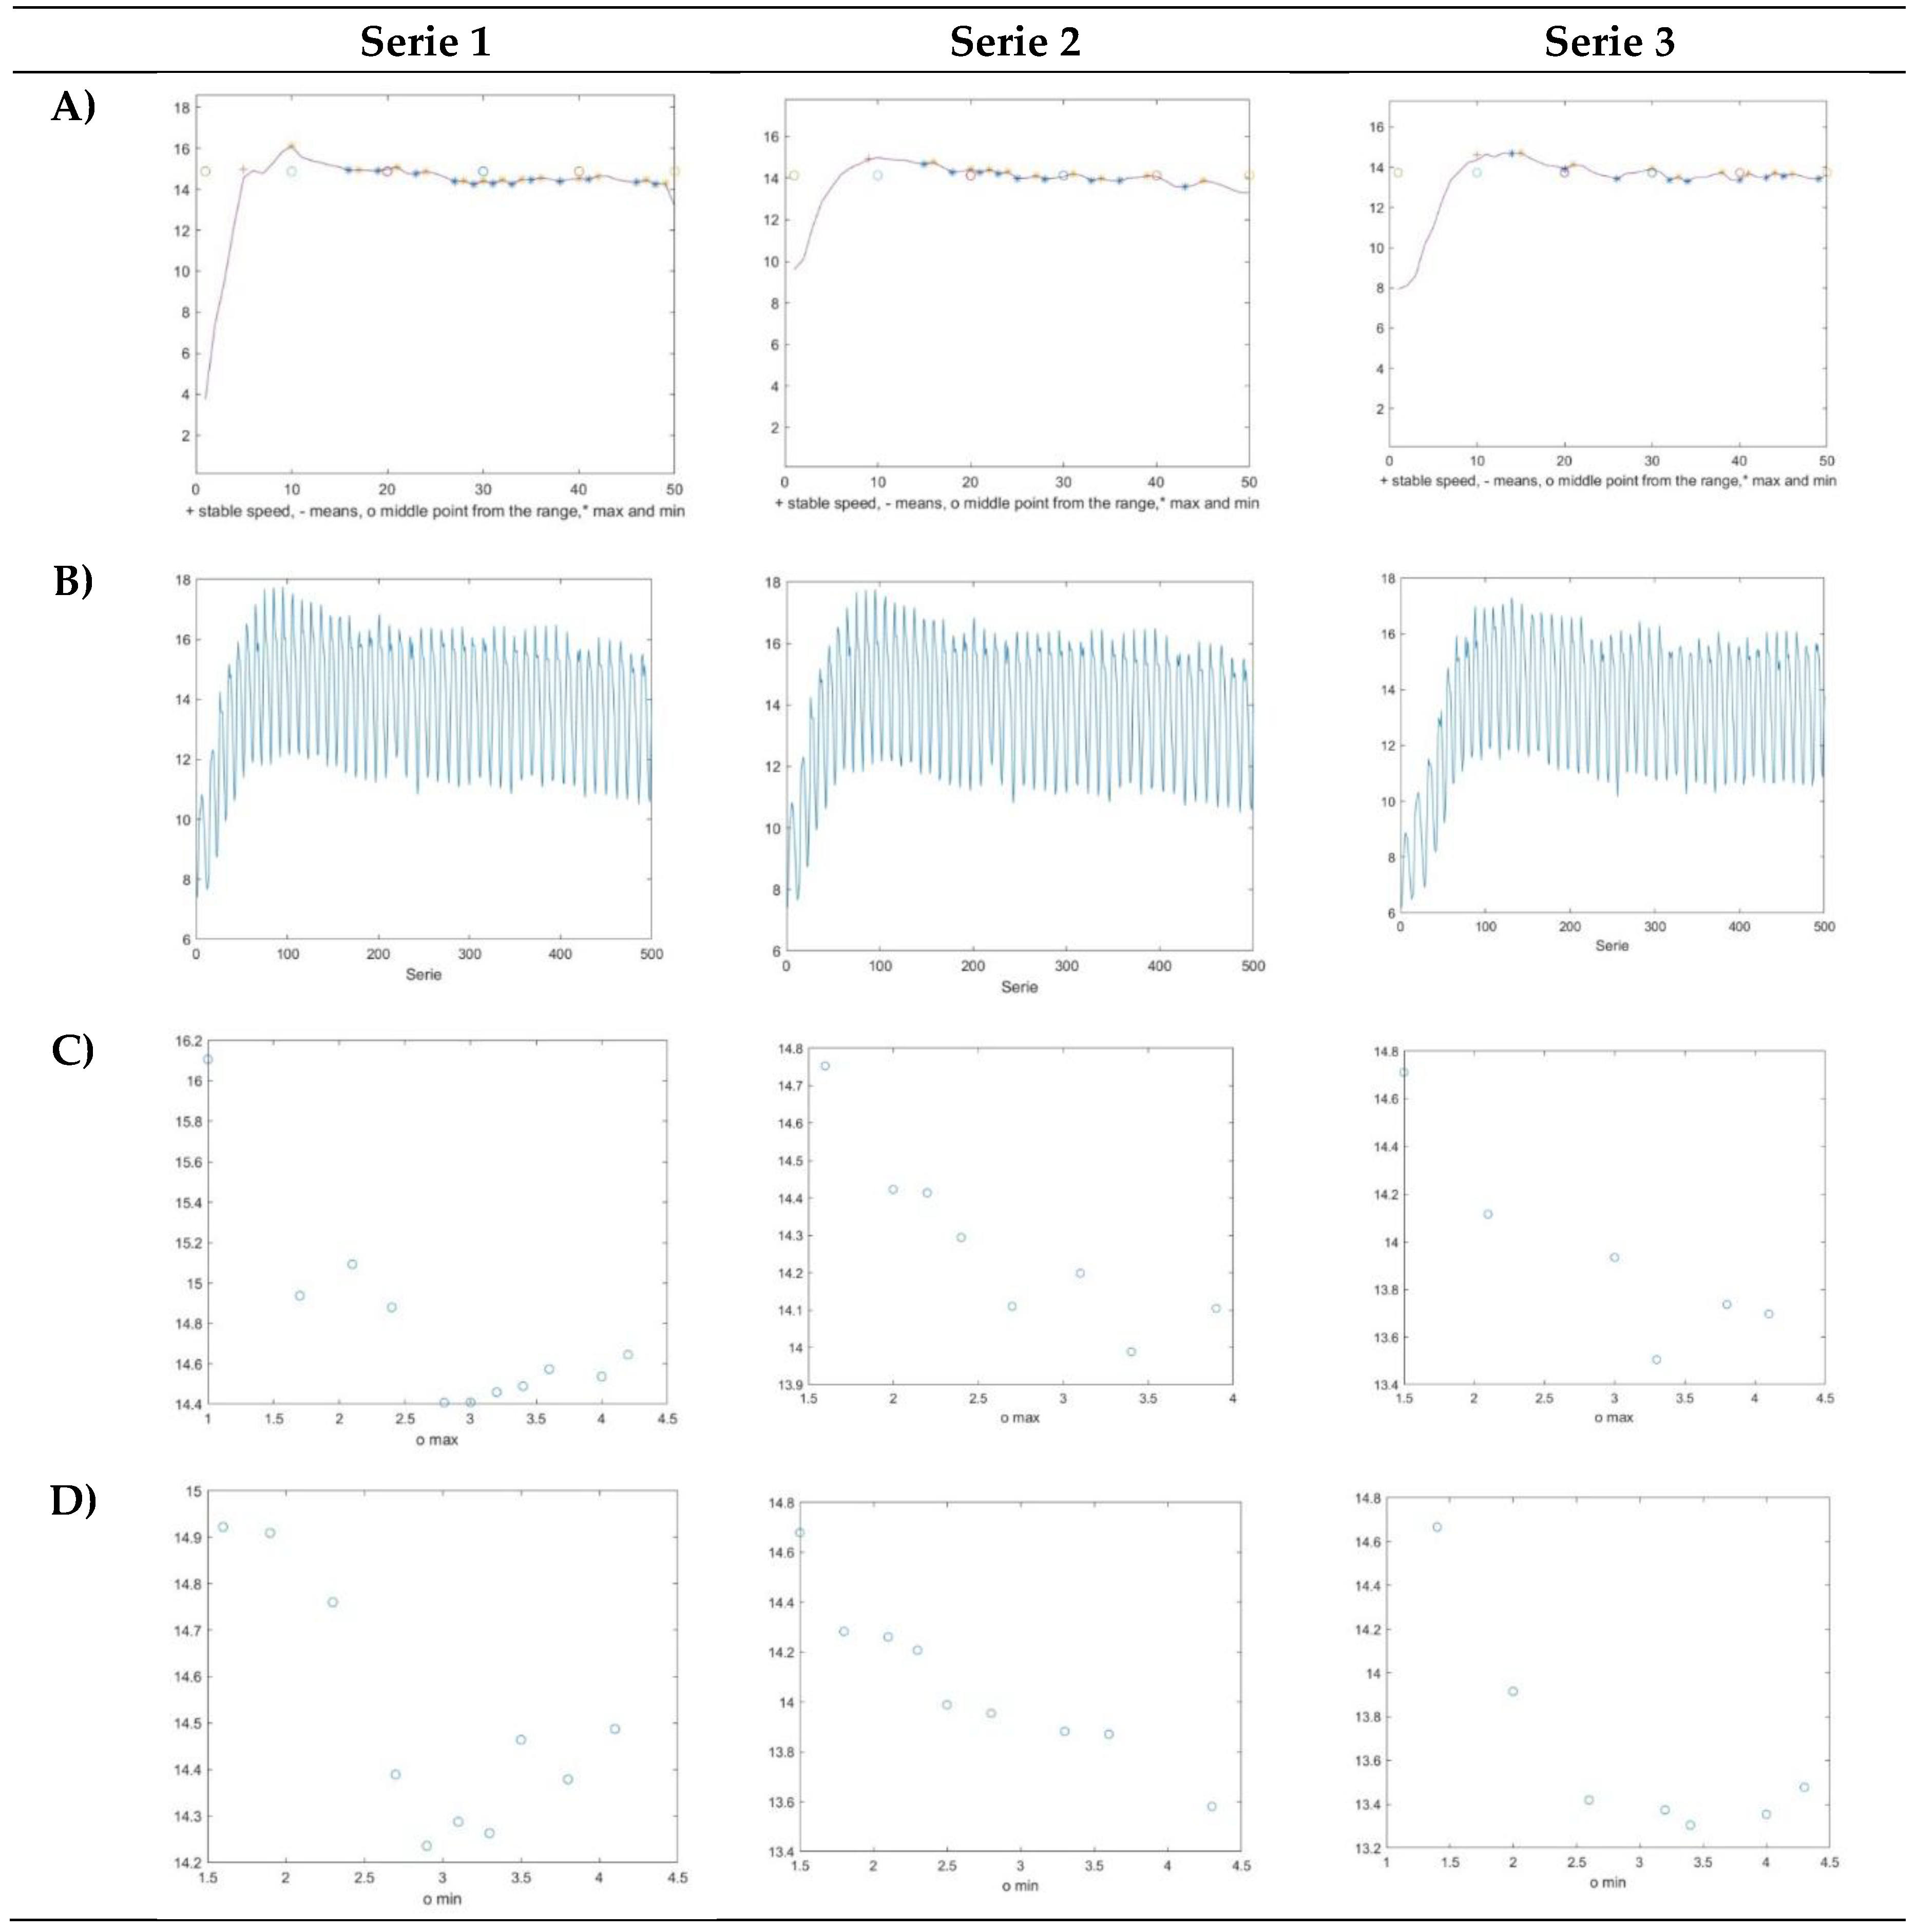

Table 1.
Performance parameters across three series of canoe training analysis.
| Series | 1 | 2 | 3 |
|---|---|---|---|
| Stabilized Speed (SS) (km/h) | 14.98 | 14.93 | 14.62 |
| Space until SS (meters) | 13.49 | 31.39 | 31.70 |
| Real space until SS (meters) | 13.85 | 32.44 | 31.87 |
| Time until SS (seconds) | 5.00 | 9.00 | 10.00 |
| Slope until SS (%) | 2.58 | 0.74 | 0.84 |
| Maximum speed after SS (km/h) | 18.58 | 17.76 | 17.30 |
| Minimum speed after SS (km/h) | 11.17 | 10.50 | 10.17 |
Disclaimer/Publisher’s Note: The statements, opinions and data contained in all publications are solely those of the individual author(s) and contributor(s) and not of MDPI and/or the editor(s). MDPI and/or the editor(s) disclaim responsibility for any injury to people or property resulting from any ideas, methods, instructions or products referred to in the content. |
© 2025 by the authors. Licensee MDPI, Basel, Switzerland. This article is an open access article distributed under the terms and conditions of the Creative Commons Attribution (CC BY) license (http://creativecommons.org/licenses/by/4.0/).
Copyright: This open access article is published under a Creative Commons CC BY 4.0 license, which permit the free download, distribution, and reuse, provided that the author and preprint are cited in any reuse.


