Preprint
Article

This version is not peer-reviewed.

Preparation of Various Glycoside Hydrolase Enzyme Extracts from Durvillaea antarctica and Evaluation of the Neuroprotective Efficacy

  † These authors contributed equally to this work.

A peer-reviewed article of this preprint also exists.

Submitted:

26 December 2025

Posted:

26 December 2025

You are already at the latest version

Abstract

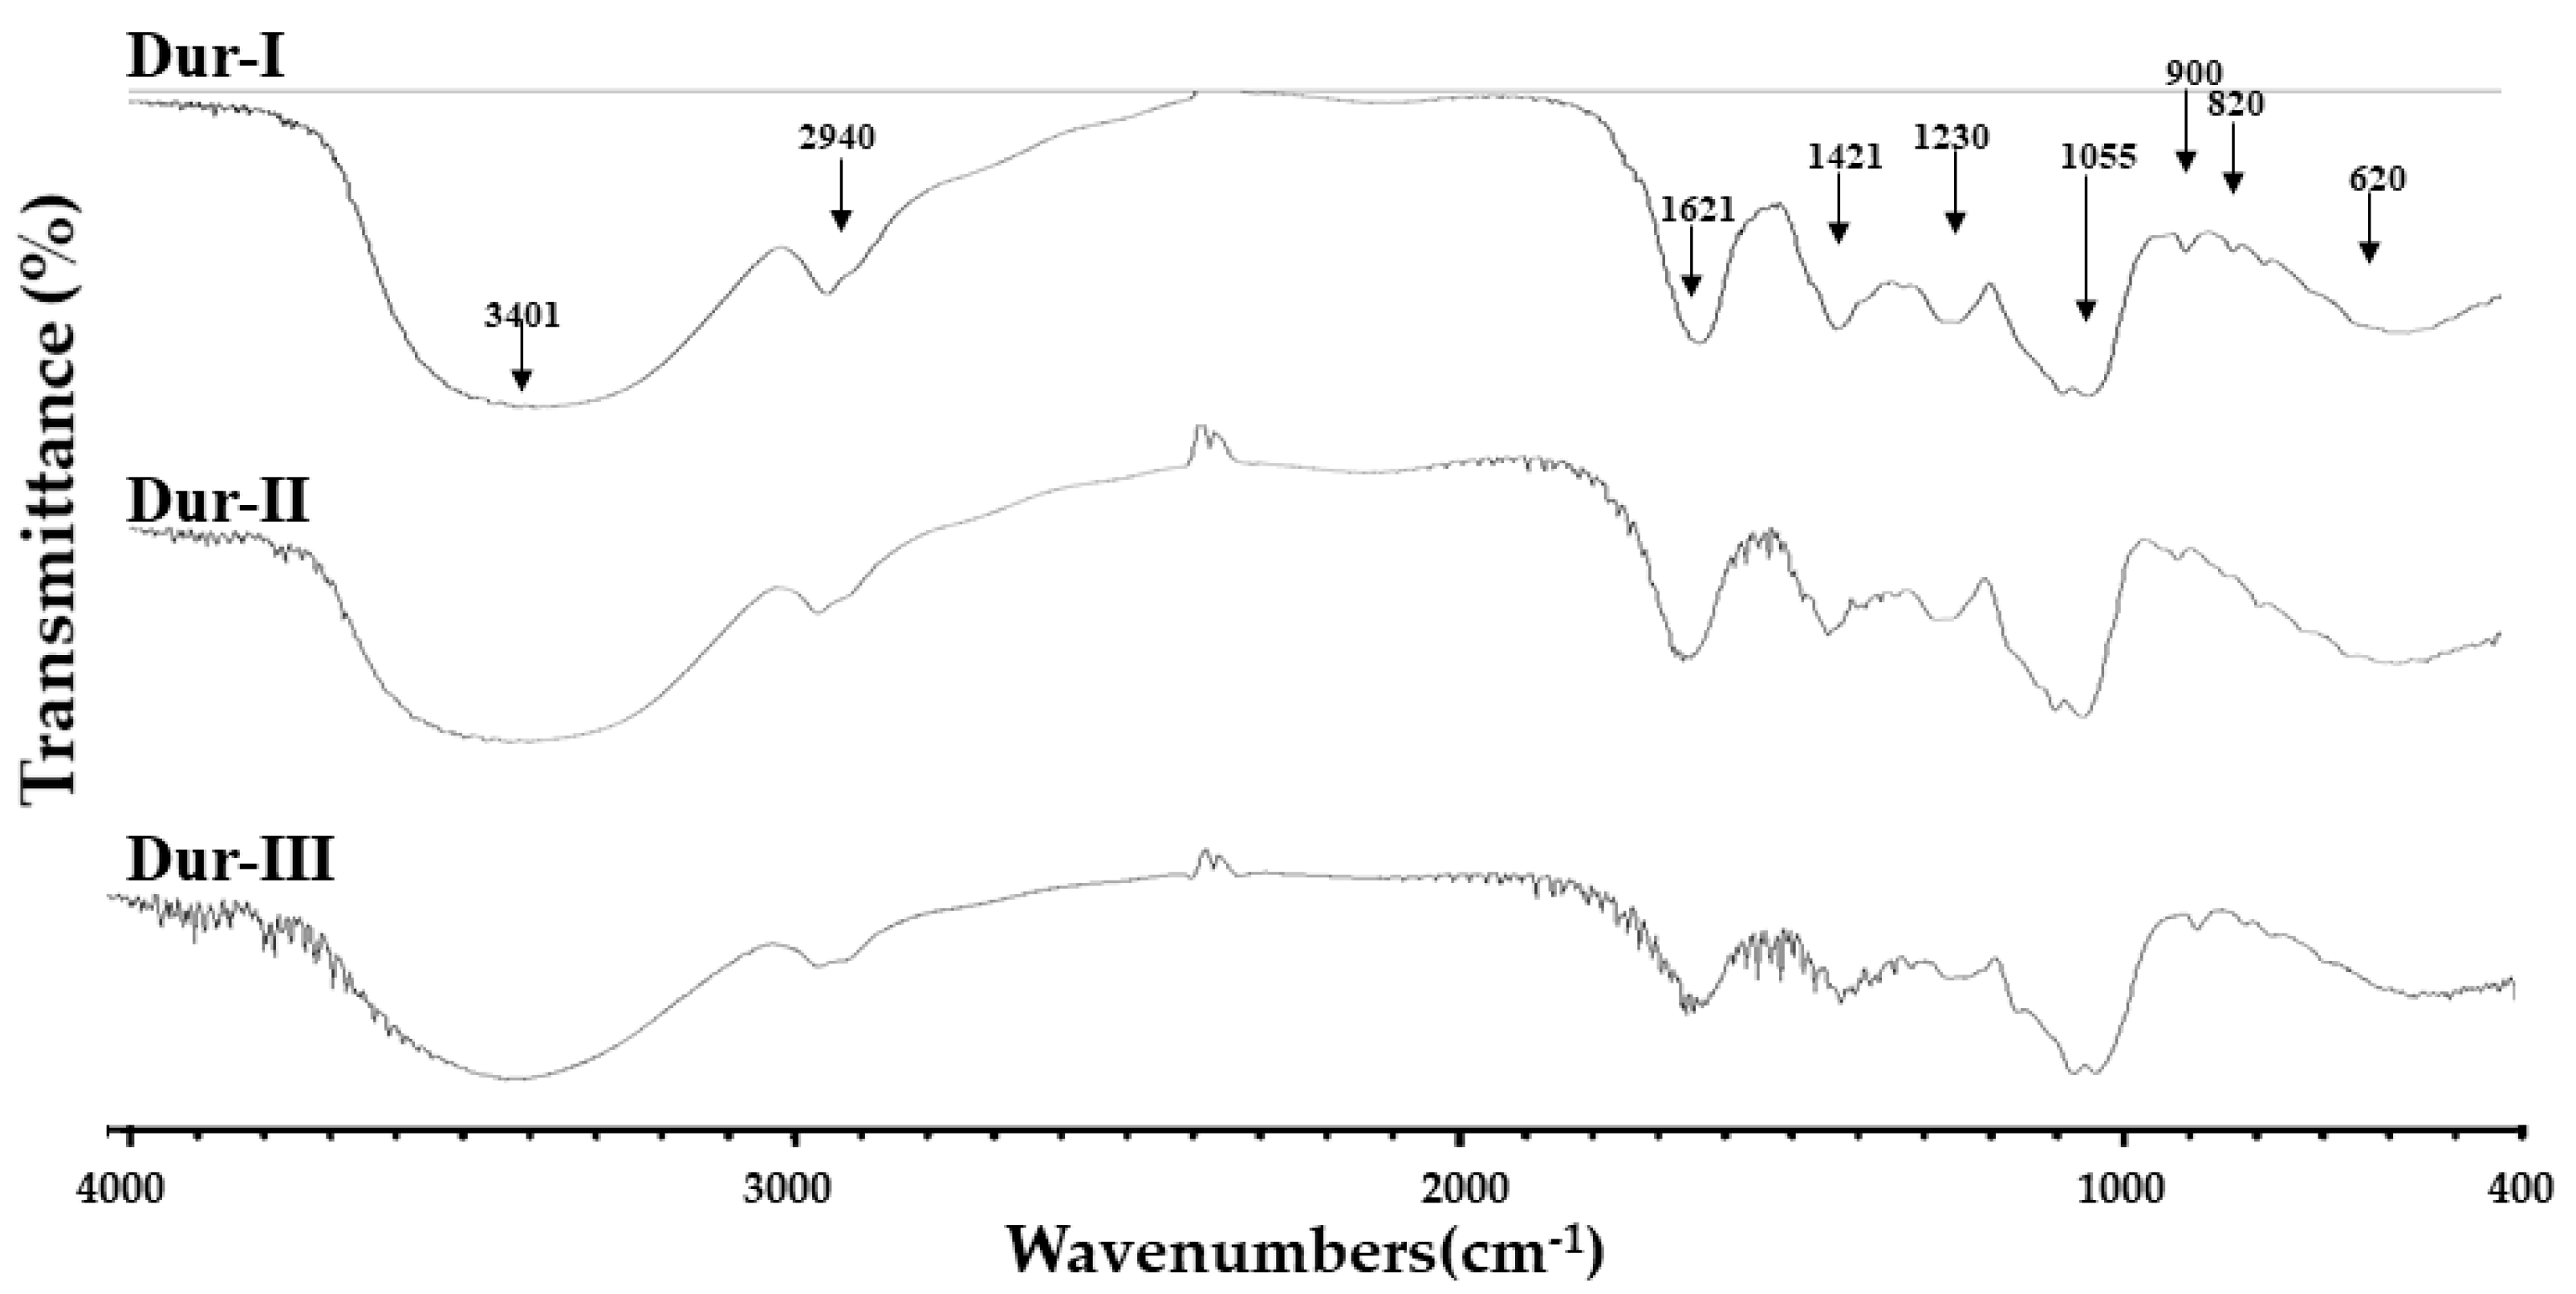
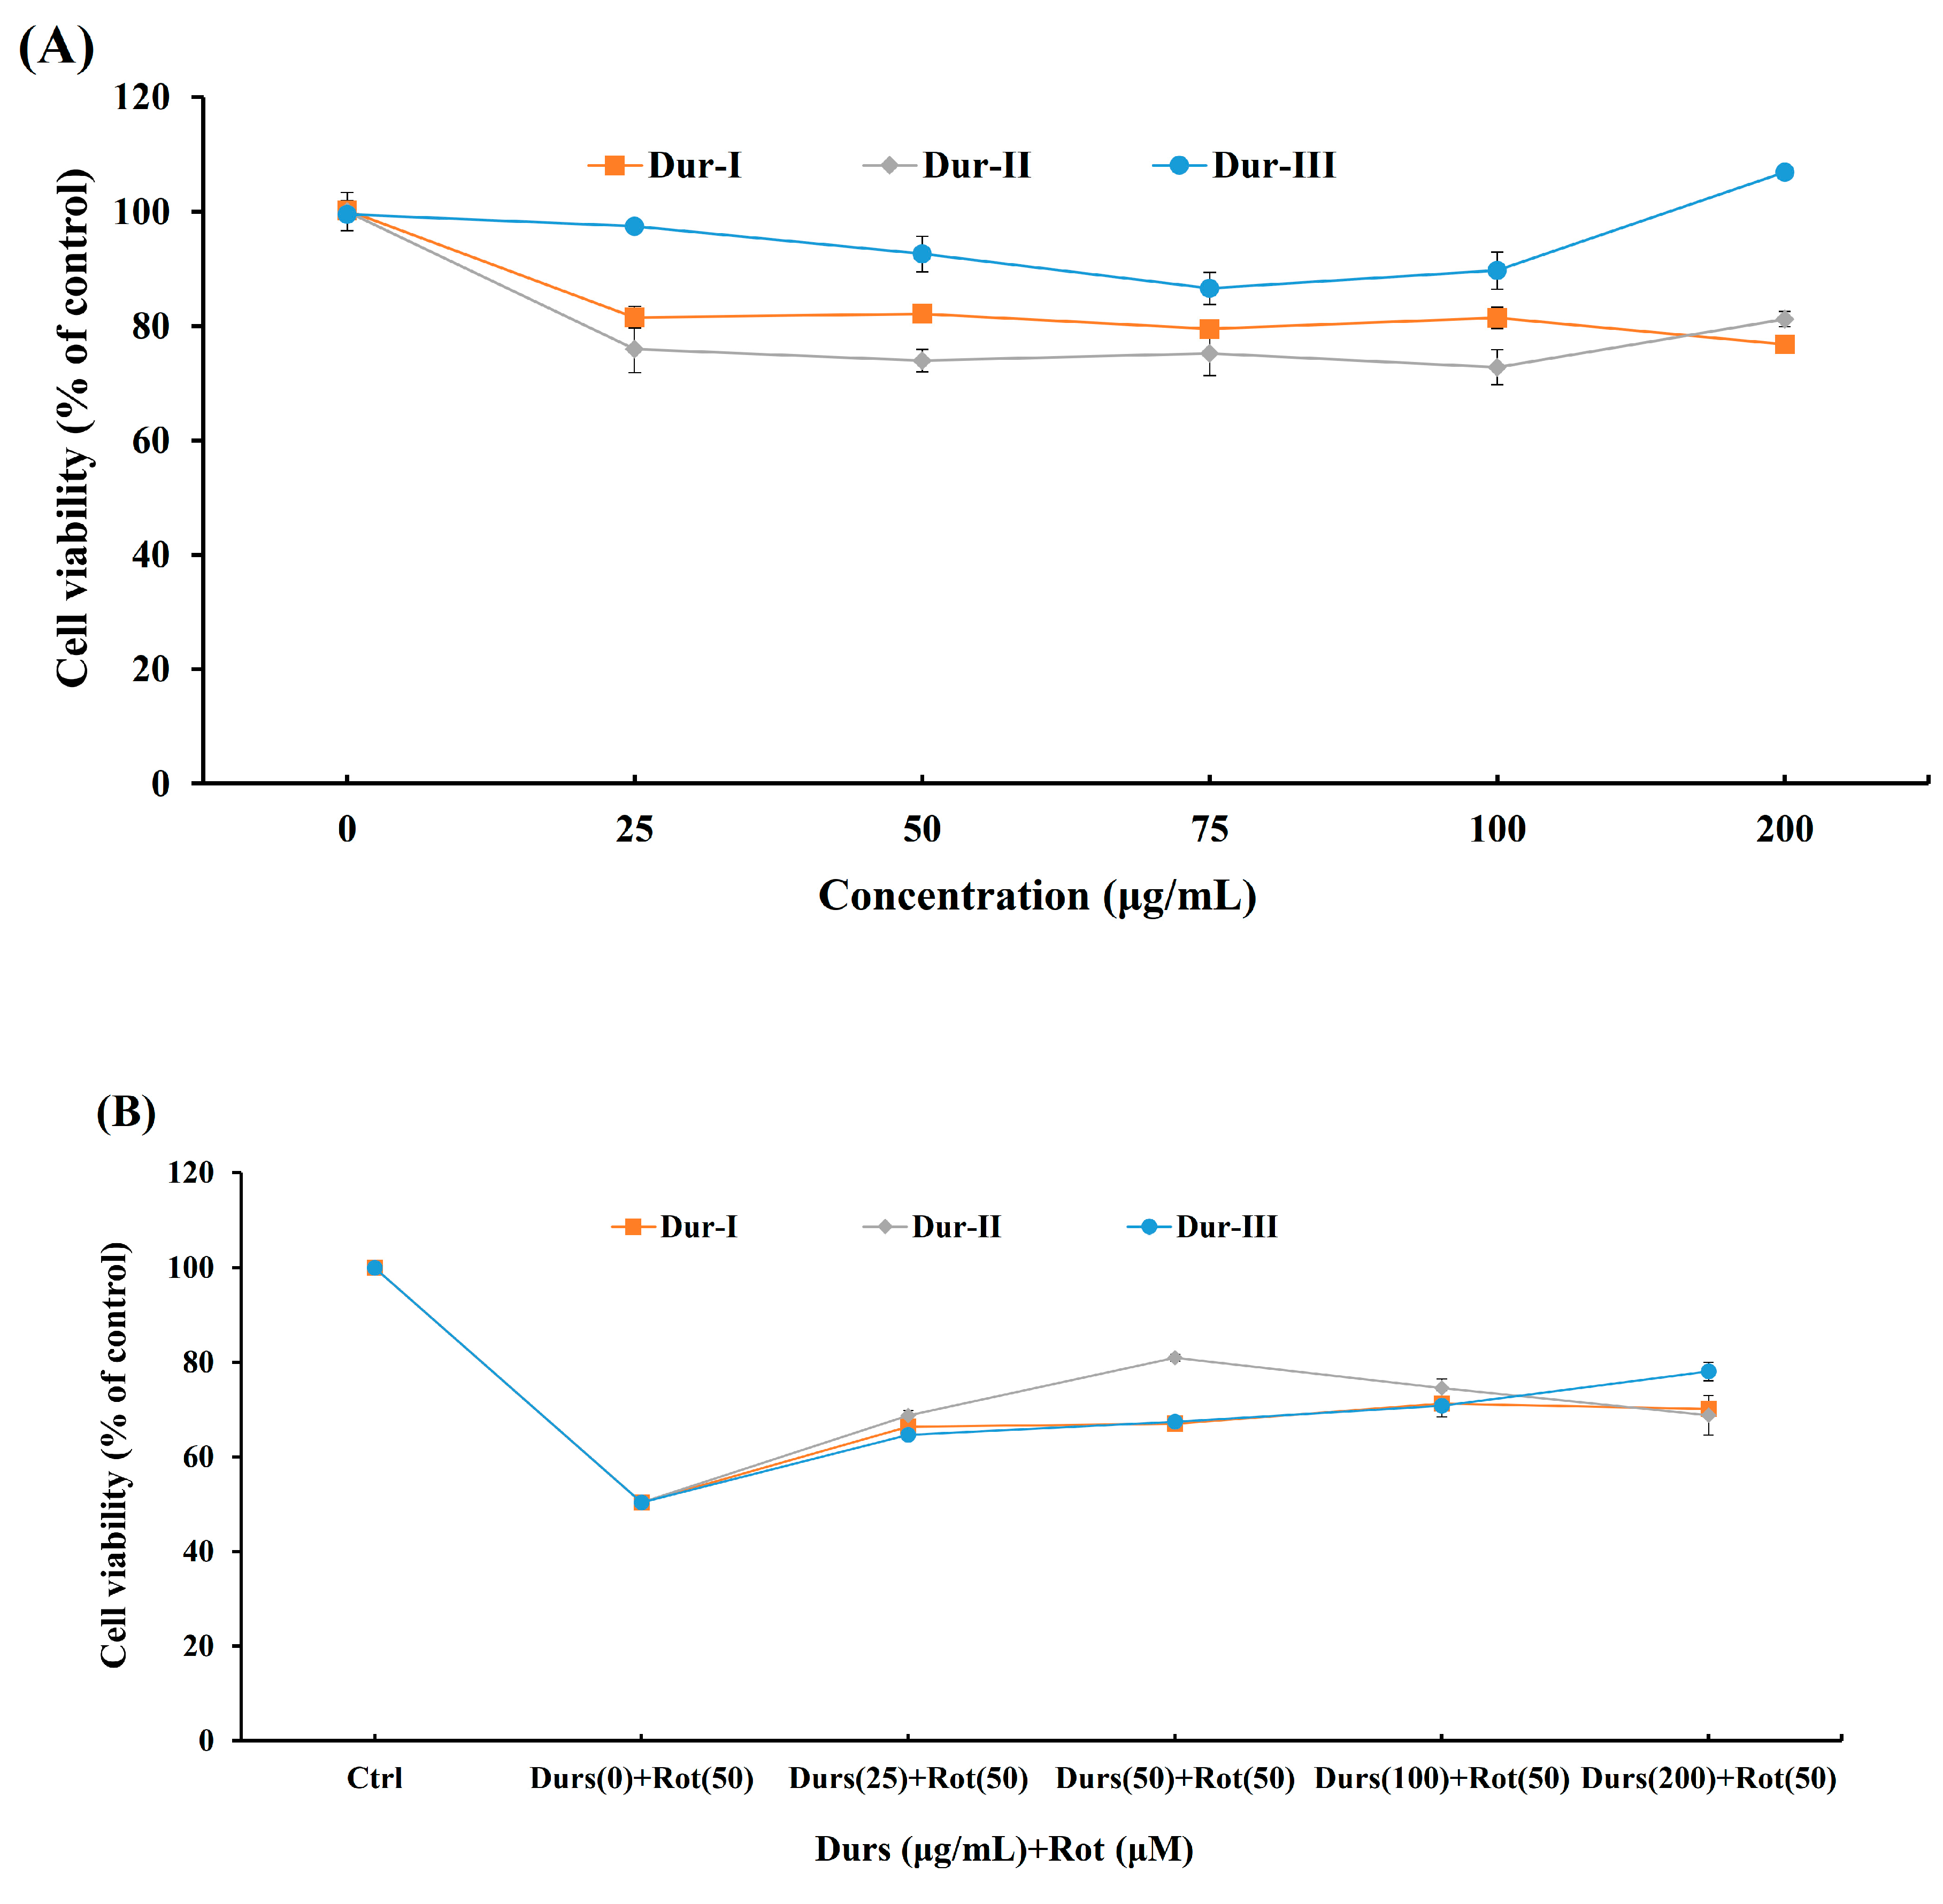
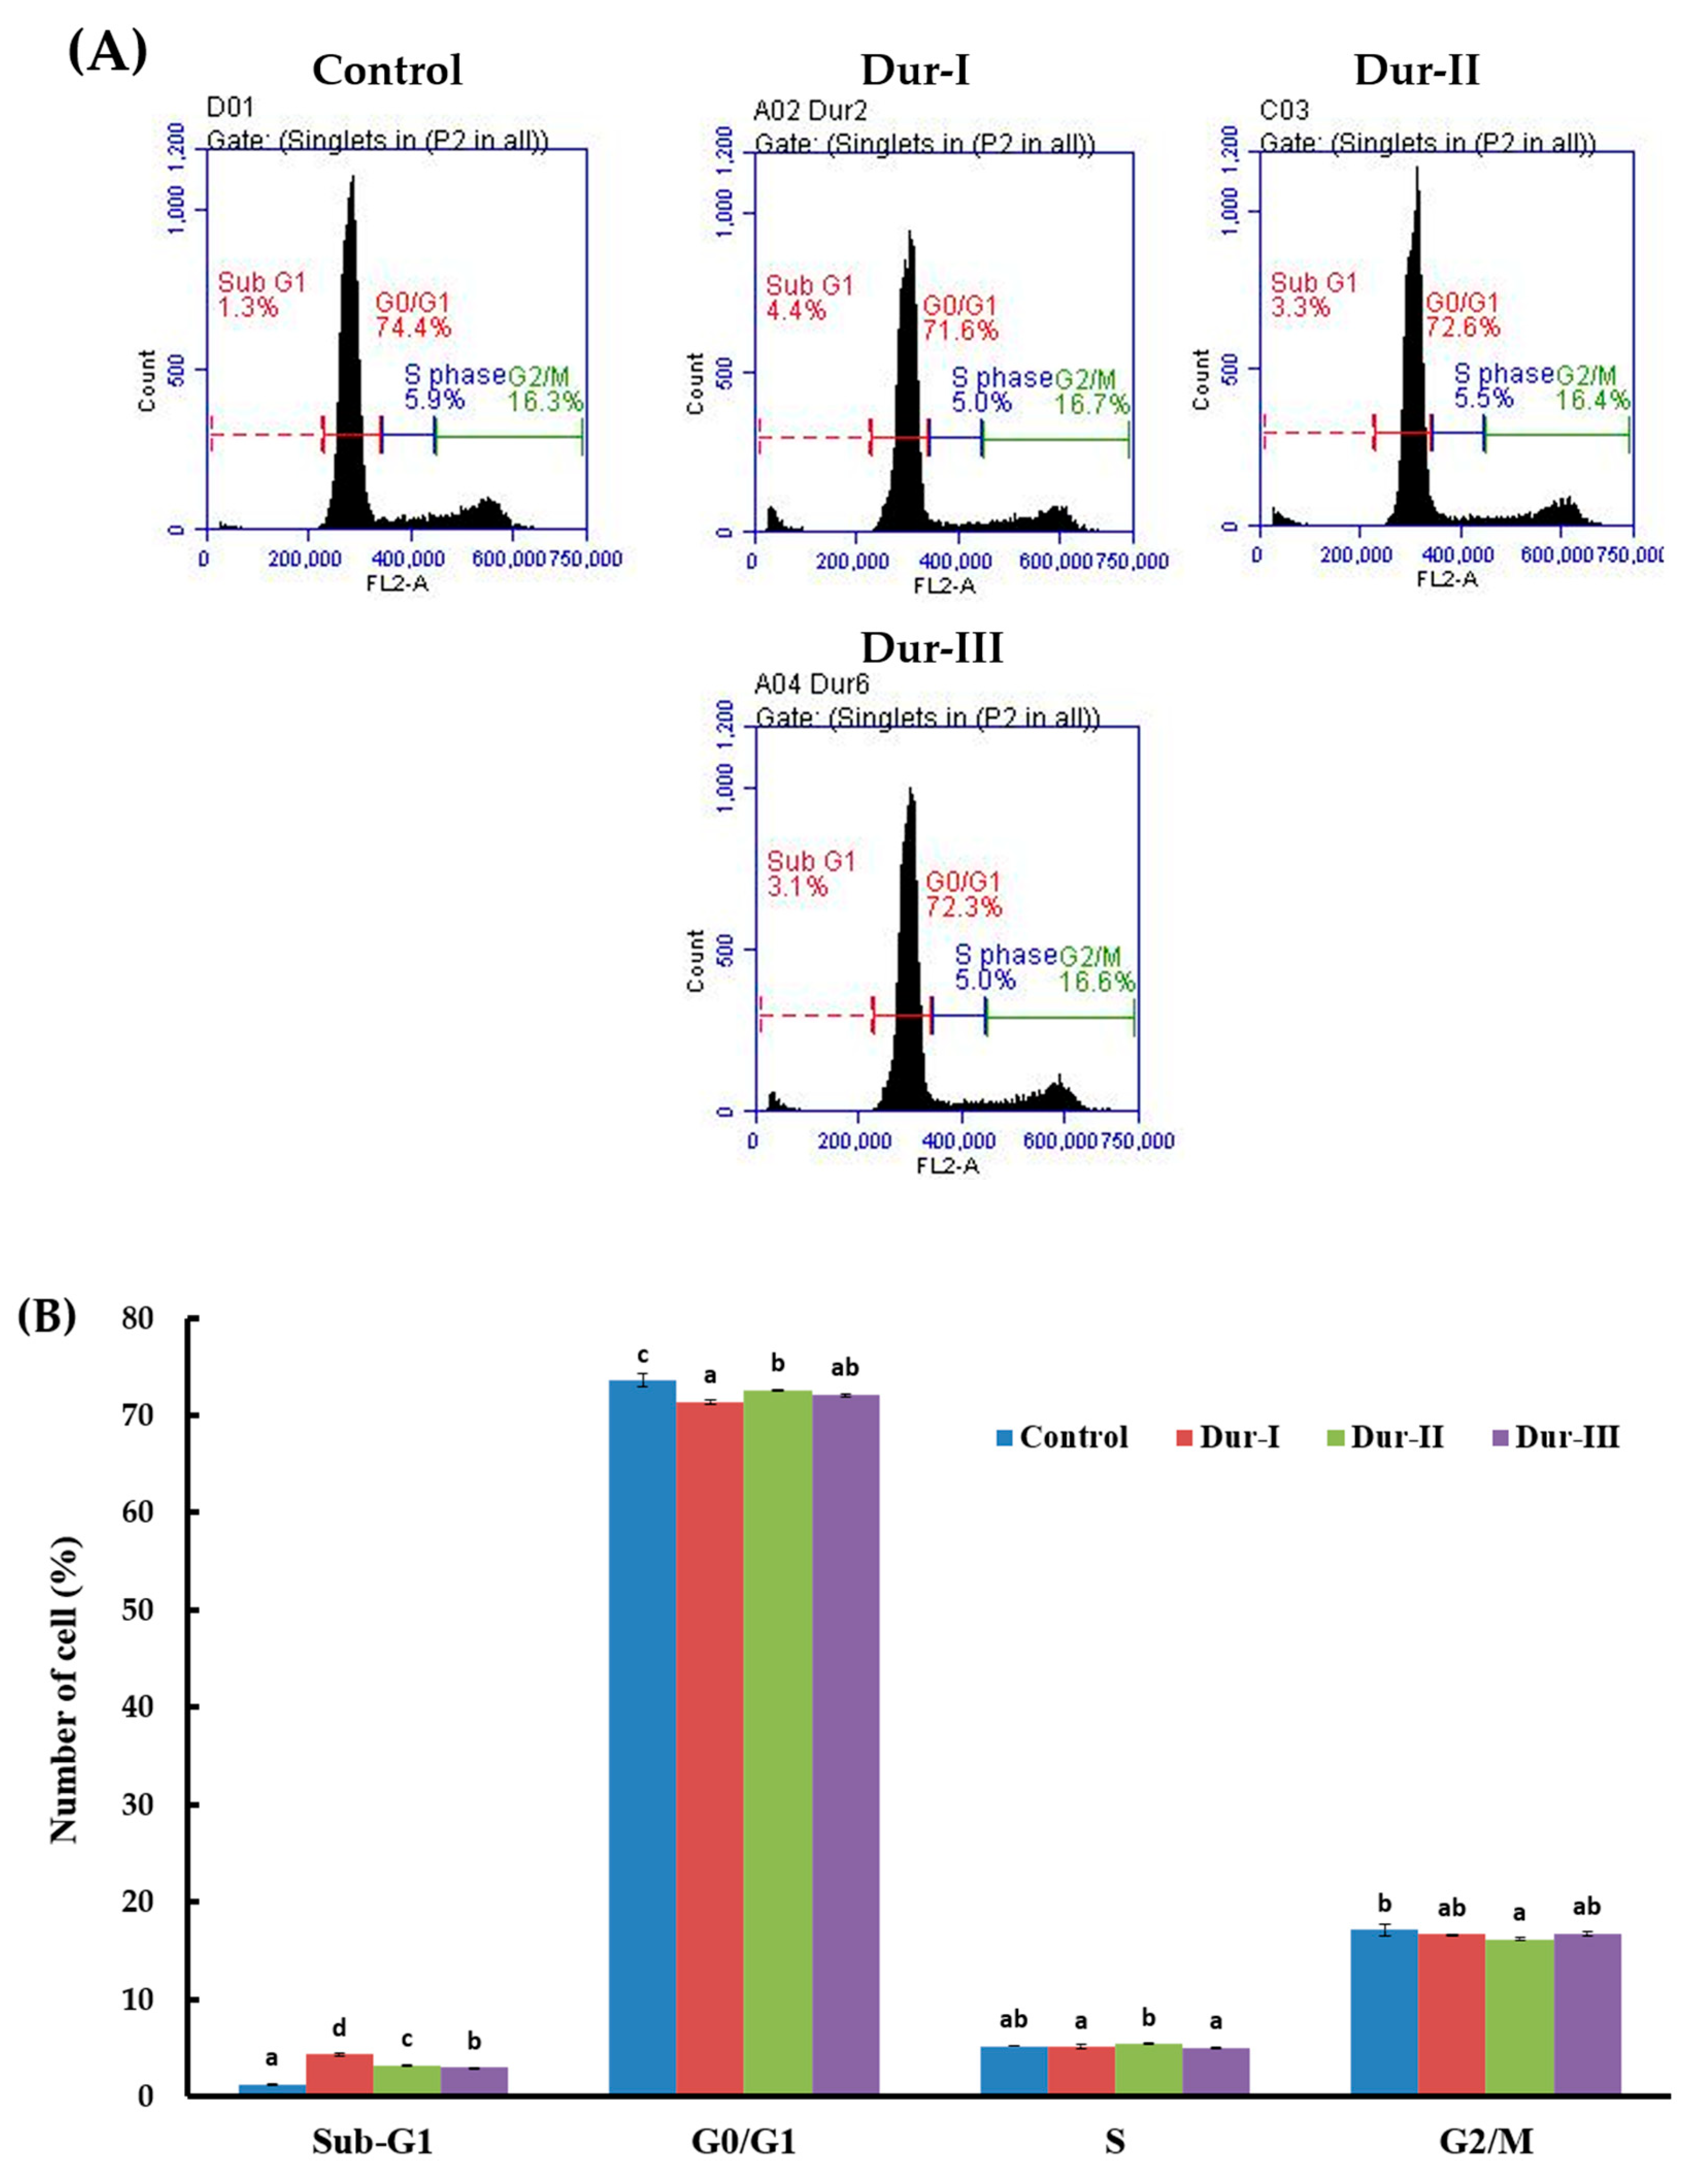
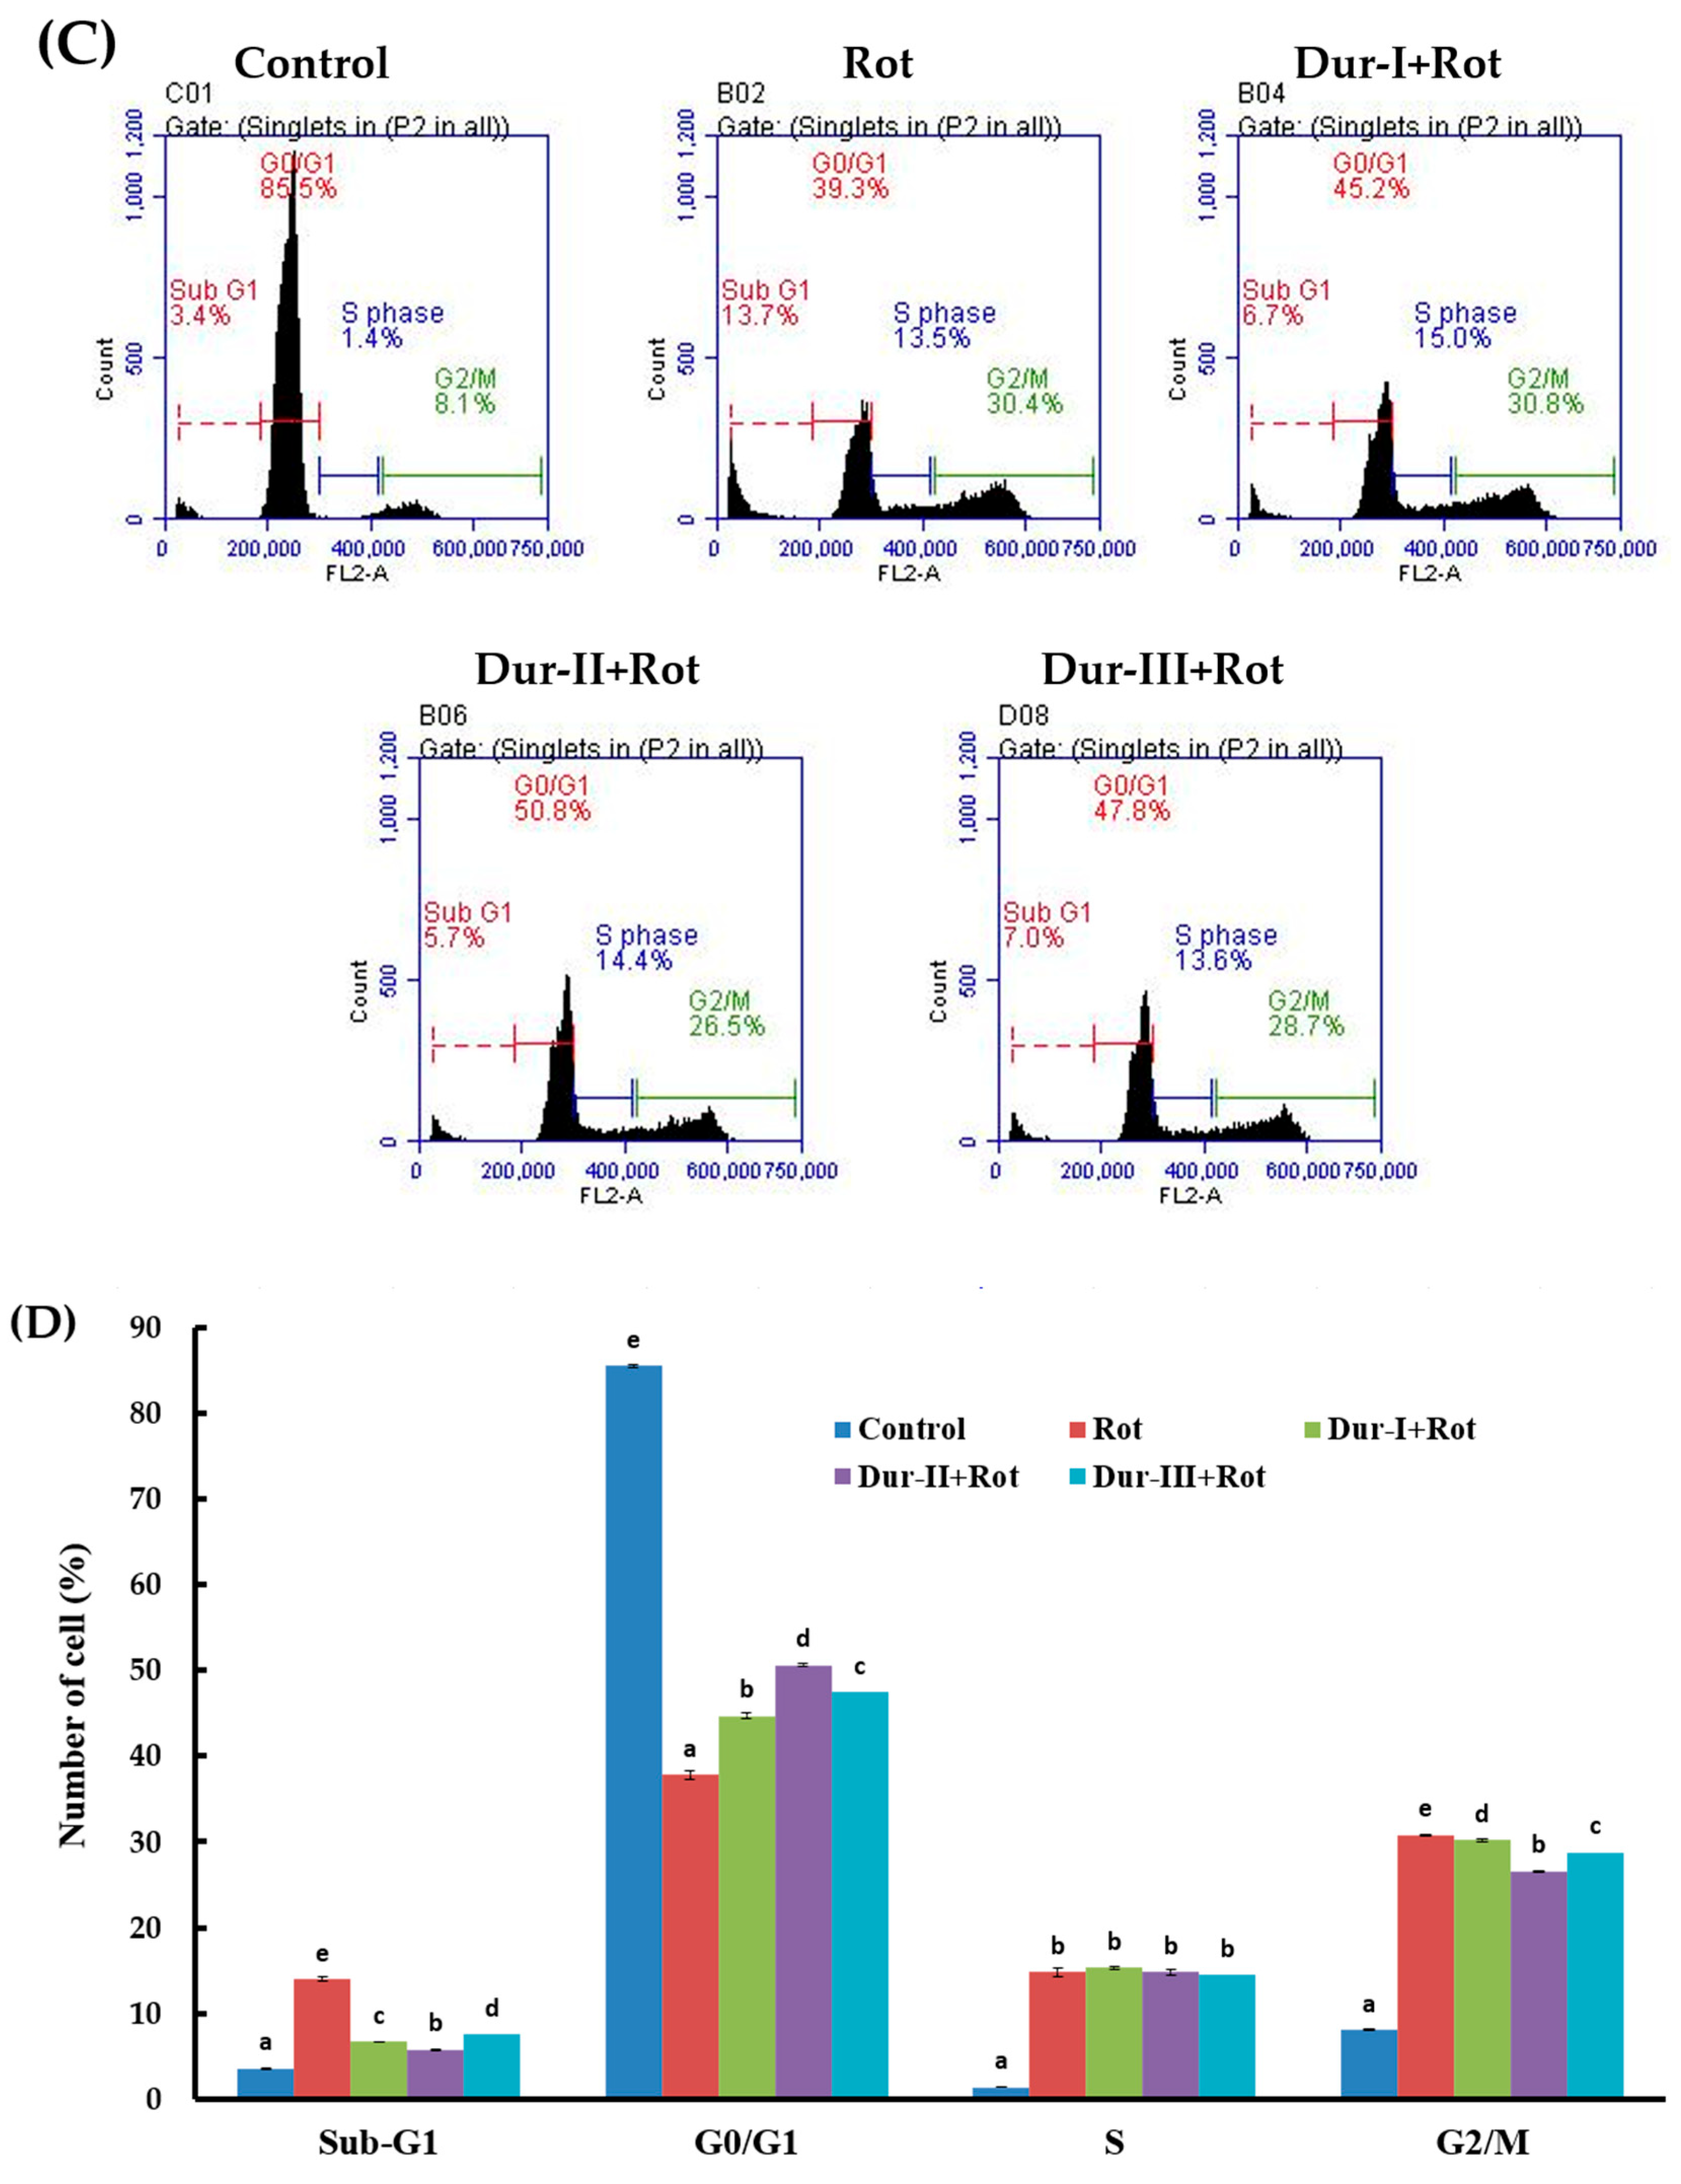
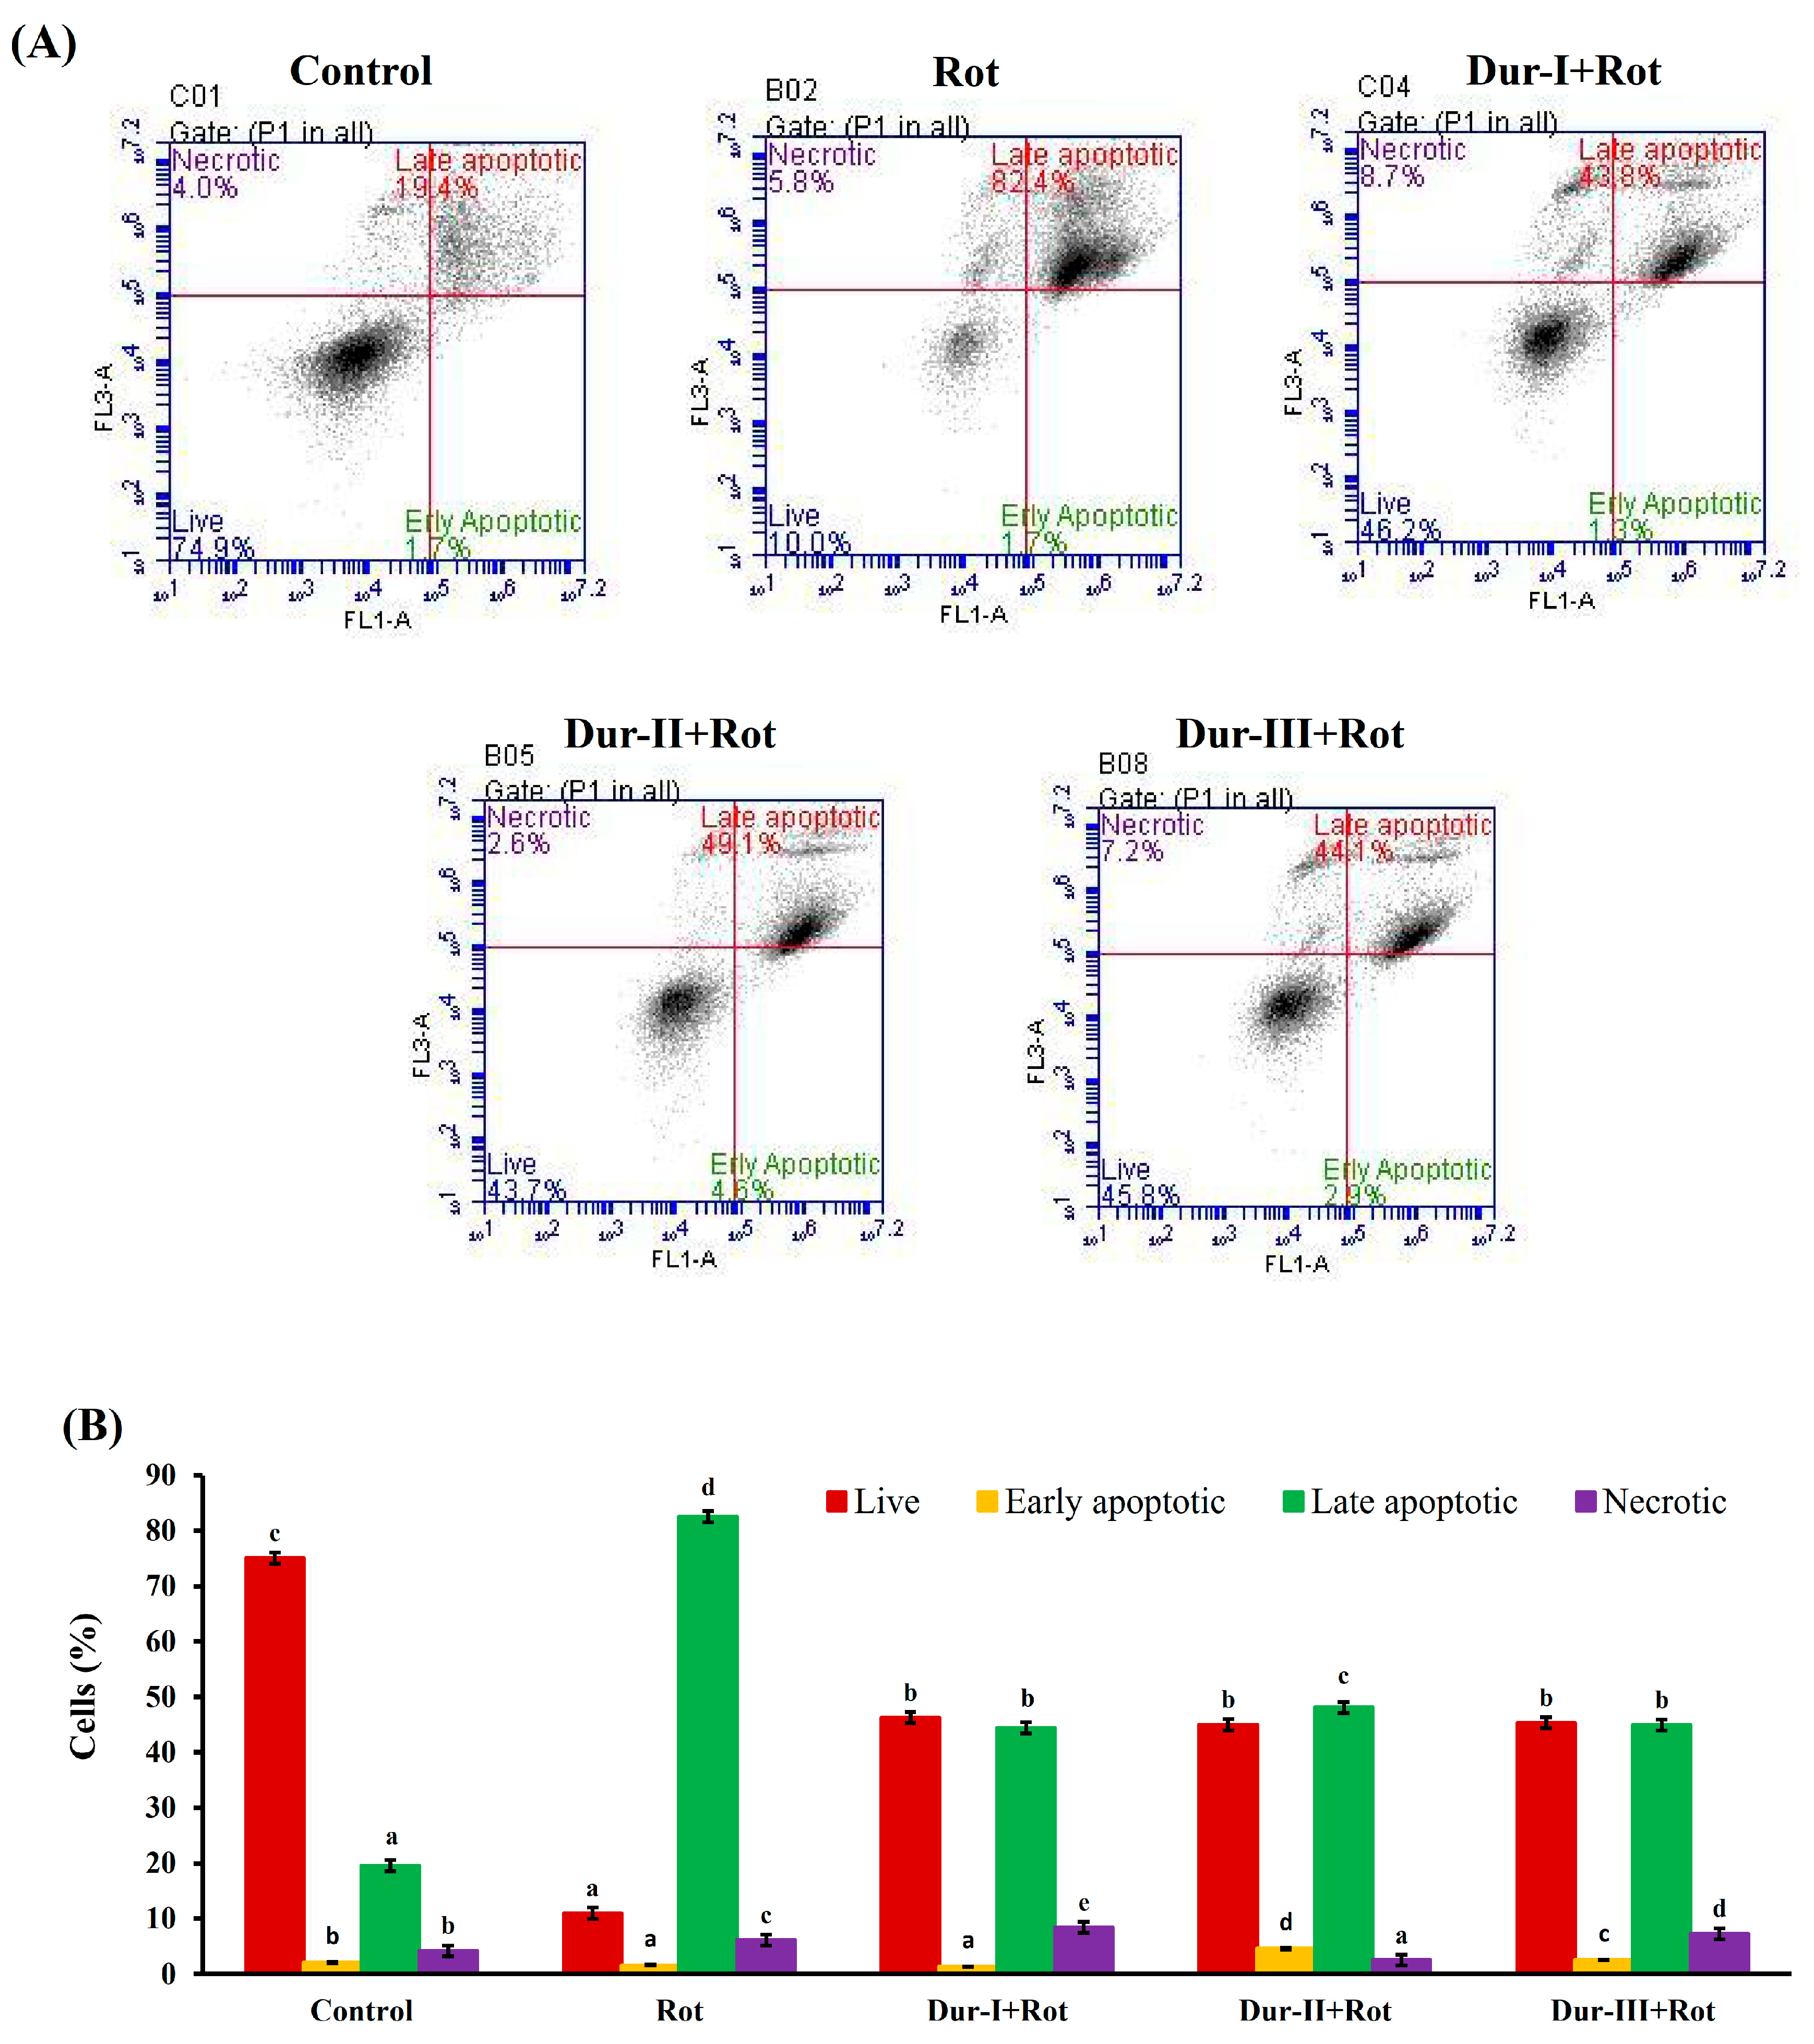
In this study, three distinct hydrolysates which designated Dur-I, Dur-II, and Dur-III, were generated from extrusion-pretreated Durvillaea antarctica biomass by applying viscozyme, cellulase, and α-amylase, respectively. Dur-III had a higher proportion of low-molecular-weight polysaccharides as compared to Dur-I and Dur-II. Chemical composition determination and FTIR analyses revealed that Dur-I, Dur-II, and Dur-III contained fucose-containing sulfated polysaccharides. To investigate neuroprotective properties of Dur-I, Dur-II, and Dur-III, rotenone (Rot) was added to SH-SY5Y cells that had been pretreated with Dur-I/II/III. Here, flow cytometry was employed to assess changes in mitochondrial membrane potential (MMP), Bcl-2 expression, cytochrome c release, caspase-9, -8, and -3 activation, as well as DNA fragmentation. The protective effect of Dur-I/II/III pretreatment of SH-SY5Y cells on the Rot-induced death process was further investigated using cell cycle and annexin V-fluorescein isothiocyanate (FITC) / PI (propidium iodide) double staining analyses. The results reveal that the Rot-induced apoptotic factors were all recovered by the pretreatment of Dur-I/II/III. Moreover, cell cycle and annexin V-FITC/PI double staining analyses also indicated that Dur-I/II/III were capable of protecting SH-SY5Y cells from Rot-induced cytotoxicity. Therefore, these Dur extracts are considered as good candidates for the prevention and treatment of neurodegeneration induced by oxidative stress.

Keywords: 
;  ;  ;  ;  ;  

1. Introduction

The incidence of neurodegenerative disorders, including Alzheimer’s disease (AD) and Parkinson’s disease (PD), continues to rise. Both AD and PD are associated with neuronal injury, leading to impaired memory and cognition or motor dysfunction. These conditions are believed to be driven, in part, by elevated oxidative stress and the resulting free radical-induced cellular damage [1]. A growing body of evidence indicates that cell damage caused by oxidative stress contributes not only to normal aging but also to the development of AD and PD [2]. Neurodegeneration is also a condition of the brain that encounters abundant death of neurons. There is clear evidence that several forms of cell death contribute to the pathology of neurodegenerative diseases. Apoptosis, necrosis, necroptosis, and both autophagic and mitophagic cell death can occur concurrently in the degenerating brain. Among these pathways, neuronal apoptosis has been the most extensively investigated [3,4]. Studies also showed that the autophagic proteins having potential role in the occurrence of neurodegeneration [5]. Because neuronal death involves multiple coordinated pathways, gaining a deeper understanding of these mechanisms is vital for developing therapeutic strategies. Another potential approach is to strengthen the body’s natural defenses against oxidative stress through dietary or pharmacological antioxidants. Therefore, identifying natural compounds that can neutralize free radicals and protect neurons from oxidative injury, while causing minimal side effects, remains an urgent priority.
Marine algae and seaweeds have gained significant attention for their nutritional value and diverse biological activities. They form an important part of traditional diets in many coastal regions, especially in Asia, and have long been incorporated into folk medicine. Brown seaweeds are rich in cell-wall polysaccharides such as fucoidans, cellulose, and alginic acids. These seaweed-derived polysaccharides demonstrate notable antioxidant, anticancer, anti-inflammatory, and immunomodulatory effects; however, their efficacy can be influenced by factors such as molecular weight, glycosidic linkage patterns, solubility, spatial structure, and backbone configuration [6]. These biological activities can be improved through different molecular modification approaches, which are generally grouped into physical, chemical, and biological methods. Physical modification typically reduces the molecular weight of polysaccharides by disrupting glucosidic chains through techniques such as ultrasonic treatment, radiation, or microwave-induced denaturation [7,8,9]. These high-energy treatments break glucosidic bonds, converting them into smaller oligomers and monomers. Chemical modification involves the introduction of functional moieties—including sulfate, phosphate, selenium, iron, and alkyl groups—onto polysaccharide backbones, thereby significantly improving their aqueous solubility and enhancing their biological activities. [10]. The biological approach relies on enzymatic hydrolysis to modify polysaccharides by cleaving glycosidic bonds. Compared with the other two methods, enzymatic treatment offers greater precision, higher efficiency, strong specificity, improved yield, and the ability to generate new bioactive compounds with minimal side effects. Recent research has also shown that enzyme-assisted extraction can enhance the bioactivity of cell wall materials [11,12].
Viscozyme is a commercial multi-enzyme complex widely applied in industrial biotechnology for processing plant-based materials. It is mainly produced by Aspergillus species and contains several carbohydrases such as arabanase, cellulase, β-glucanase, hemicellulase, and xylanase, which act synergistically to degrade various plant polysaccharides. The enzyme complex operates optimally at pH 3.3–5.5 and temperatures between 25–55 °C. In food and feed industries, Viscozyme enhances the extraction and clarification of plant-derived products [13]. It reduces viscosity, increases juice yield in fruit and vegetable processing, and improves the availability of nutrients by hydrolyzing cell wall components. Its use in cereal processing helps release bound starch and sugars, even facilitating further fermentation processes [14]. In biofuel and biorefinery sectors, Viscozyme is employed to boost hydrolysis of lignocellulosic biomass. When combined with other enzymatic systems such as Cellic® CTec2 (Cellic), it improves glucose and xylose yield from pretreated rice straw, achieving up to 87 % cellulose conversion. Such applications are key in producing second-generation biofuels and supporting a circular bioeconomy [15]. Cellulase and α-amylase are both enzymes belonging to the glycoside hydrolase family. Cellulase is widely found in organisms in nature, including bacteria, fungi, and animals. The cellulase used in industrial production typically originates from fungi, with the most common sources being Trichoderma, Aspergillus, and Penicillium species. Cellulase refers to a group of enzymes responsible for the hydrolysis of β-1,4-glucosidic bonds in cellulose, and is therefore generally a complex enzyme system. Cellulases are commonly classified into three categories: C1 enzymes, CX enzymes, and β-glucosidases [16]. α-amylase is widely distributed in animals (e.g., saliva, pancreas), plants (e.g., barley, sweet potatoes), and microorganisms. The enzymes from microorganisms are typically secreted. This enzyme requires Ca²⁺ as a cofactor, which also serves as a stabilizing factor. It acts on both amylose (linear starch) and amylopectin (branched starch), randomly cleaving α-1,4-glycosidic bonds. The enzyme's activity results in a sharp decrease in the viscosity of the substrate solution and a disappearance of the iodine-staining reaction. The primary product from the hydrolysis of amylose is maltose, while maltotriose and a small amount of glucose are also produced. In contrast, when amylopectin is hydrolyzed, in addition to maltose and glucose, α-limit dextrin with α-1,6 bonds is also formed. The typical hydrolysis limit for glucose is 35-50%. However, some bacterial amylases can reach up to 70% hydrolysis, leading to the liberation of glucose [17]. Both cellulase and α-amylase are commonly used hydrolytic enzymes in the food industry. Preliminary research from our laboratory has shown that enzyme-assisted hydrolysis for polysaccharide extraction offers advantages such as high yield, low production cost, and ease of purification, making it a promising method for large-scale applications. In this study, viscozyme, cellulase and α-amylase were employed for the hydrolytic extraction of D. antarctica polysaccharides.
Rotenone (Rot) is a naturally occurring pesticide that selectively inhibits mitochondrial respiratory chain Complex I (NADH dehydrogenase), producing mitochondrial dysfunction and increased reactive oxygen species (ROS) [18]. Rot can be used to create in vitro models of mitochondrial-driven neuronal injury (e.g., in SH-SY5Y, primary neurons) so candidate neuroprotective compounds can be tested for prevention or reversal of rotenone-induced toxicity (e.g., ATP loss, mitochondrial membrane depolarization, ROS, cell death) [19]. This work builds on our earlier study [11]. In the present investigation, D. antarctica, a brown seaweed, was first subjected to an extrusion process to disrupt the cell wall structure. The pretreated material was then hydrolyzed with three enzymes, viscozyme, cellulase, and α-amylase, under consistent conditions to enable comparison of the physicochemical characteristics and biological activities of the resulting hydrolysates. Functional groups in the hydrolyzed products were examined using FTIR and NMR. Additional analyses, including chemical composition, monosaccharide profiling, and molecular weight determination, were carried out using various assays and HPLC. The neuroprotective effects of the hydrolysates were also evaluated in SH-SY5Y cells. To the best of our knowledge, no prior studies have examined whether hydrolysis products derived from extrusion-pretreated D. antarctica can counteract rotenone-induced toxicity in SH-SY5Y cells. Furthermore, this study explores the potential of these products as natural chemopreventive agents for neurodegenerative disorders, particularly Parkinson’s disease.

2. Results and Discussion

2.1. Preparation of Enzyme Extracts (Dur-I, Dur-II, and Dur-III) from Extrusion-Pretreated D. antarctica and Physicochemical Characteristics of Dur-I, Dur-II, and Dur-III

In this study, dried and milled D. antarctica biomass was subjected to an extrusion-pretreatment procedure to disrupt the cell wall matrix prior to enzymatic hydrolysis. Subsequent hydrolysis with viscozyme, cellulase, or α-amylase produced three enzyme assisted extraction-derived extracts, designated Dur-I, Dur-II, and Dur-III. The processing parameters for extrusion-pretreatment and enzymatic hydrolysis are summarized in Table 1. The extraction yields of Dur-I, Dur-II, and Dur-III were 41.3 ± 2.3%, 45.5 ± 3.0%, and 44.2 ± 0.8%, respectively, indicating slightly higher yields for Dur-II and Dur-III compared with Dur-I, although the differences were not substantial. In preliminary tests, non-extruded samples yielded 38.4 ± 1.1%, 43.0 ± 0.2%, and 41.4 ± 0.6% for Dur-I, Dur-II, and Dur-III, respectively. Collectively, these findings demonstrate that extrusion-pretreatment enhances the extractability of bioactive components from D. antarctica. Table 2 presents the physicochemical characteristics of Dur-I, Dur-II, and Dur-III. Size-exclusion chromatography (SEC) revealed distinct molecular weight distributions for each extract (see Table 2 and Figure S1). In all three extracts, two main peaks appeared. For Dur-I, a high-MW peak at ~201.4 kDa accounted for ~96.8% of the total area, while a low-MW peak at ~10.9 kDa corresponded to ~3.2%. Dur-II exhibited a high-MW peak at ~213.5 kDa (approximately 99.9%) and a minor low-MW peak at ~15.6 kDa (approximately 0.1%). In contrast, Dur-III showed a substantially different profile: the high-MW fraction centered at ~170.5 kDa accounted for approximately 46.7%, whereas the low-MW fraction at ~3.68 kDa represented about 54.3%. These results imply that the enzymes employed target different cleavage sites, and that the hydrolysis leading to Dur-III produces a greater proportion of oligosaccharides (approximately 3.7 kDa) compared to Dur-I and Dur-II. The pronounced shift to low-MW species in Dur-III is consistent with prior observations that enzymatic treatments can generate significant low-molecular-weight fractions in seaweed-derived polysaccharide extracts. For example, in polysaccharides from Laminaria japonica, two high-performance size exclusion chromatography (HPSEC) peaks were reported after alginate lyase, cellulase, or combination of alginate lyase 102C300C and cellulase enzymatic hydrolysis [20]. These findings reinforce the notion that enzyme selection and processing protocol critically influence the molecular weight profile of seaweed extracts. In the present study, the prevalence of low-MW oligomers in Dur-III may have implications for bioactivity and downstream functionality, and it warrants further investigation.
Table 2 also summarizes the chemical composition and monosaccharide profiles of Dur-I, Dur-II, and Dur-III, including total sugar, fucose, sulfate, uronic acid, alginic acid, polyphenols, and protein contents. The measured total sugar contents were 43.8 ± 0.2% (Dur-I), 36.9 ± 0.4% (Dur-II), and 73.7 ± 0.3% (Dur-III). Fucose represented 14.6 ± 0.5%, 15.8 ± 0.5%, and 22.5 ± 0.5% of Dur-I, Dur-II, and Dur-III, respectively. Overall, Dur-III contained markedly higher proportions of both total carbohydrate and fucose than Dur-I and Dur-II. These differences likely reflect the distinct hydrolytic specificities of the enzymes applied, which not only alter molecular-weight distributions but can also enrich or deplete particular monosaccharide fractions (for example, by generating oligosaccharides enriched in fucose). The compositional shifts observed here are consistent with previous reports showing that enzyme selection and depolymerization conditions strongly influence the monosaccharide composition of brown-algal polysaccharide preparations, with consequences for bioavailability and biological activity [21]. The sulfate contents measured in Dur-I, Dur-II and Dur-III were 38.1 ± 0.0%, 41.9 ± 0.0%, and 25.6 ± 0.0%, respectively. Uronic acid comprised 15.6 ± 0.2% (Dur-I), 15.6 ± 0.3% (Dur-II), and 18.2 ± 0.4% (Dur-III), while alginic acid accounted for 4.54 ± 0.15%, 4.59 ± 0.70%, and 6.78 ± 0.56%, respectively. The polyphenol contents were comparatively low (0.39 ± 0.02%, 0.33 ± 0.00%, and 0.36 ± 0.06%), and protein content remained below ~1.2% across all extracts (0.93 ± 0.03%, 1.13 ± 0.05%, and 1.03 ± 0.00% for Dur-I, Dur-II, and Dur-III, respectively). Overall, Dur-II exhibited the highest sulfate content, whereas Dur-III had the largest proportions of uronic acid and alginic acid. Table 2 also lists the monosaccharide profiles of Dur-I, Dur-II and Dur-III. Briefly, Dur-I was dominated by fucose, rhamnose, galacturonic acid and xylose, whereas Dur-II contained primarily fucose, rhamnose, glucose and xylose. Dur-III showed a mixture in which fucose, rhamnose, galacturonic acid, glucose and xylose were the major constituents. Collectively, these results indicate clear compositional differences among the three extracts. Such variation in monosaccharide composition and shift the relative abundance of chemical constituents (sulfate, uronic acids, alginate backbone), and together with the distinct molecular-weight distributions reported above, implies that Dur-I, Dur-II and Dur-III are likely to possess different physicochemical behaviors (e.g., solubility, viscosity, and chain conformation) and may therefore exhibit divergent biological activities. Recent studies have shown that enzyme choice and processing conditions strongly influence both MW distribution and monosaccharide/functional-group composition of algal polysaccharide preparations, with downstream effects on functional properties and bioactivity [22,23,24,25].

2.2. Elucidation of Structural Characterization of Dur-I, Dur-II, and Dur-III by FTIR and NMR Techniques

Structural characterization of Dur-I, Dur-II, and Dur-III was carried out using FTIR and NMR methods. As shown in Figure 1, all three extracts exhibited an absorption band at 3401 cm⁻¹ and a band near 2940 cm⁻¹, which correspond to O–H / H₂O stretching and C–H stretching in pyranoid rings (or at C-6 positions of fucose/galactose residues), respectively, which features commonly observed in fucoidan-type polysaccharides [26,27,28]. In the fingerprint region (1800–600 cm⁻¹), absorption peaks around 1621 and 1421 cm⁻¹ were detected, likely reflecting H₂O scissoring vibrations and in-plane ring C–H, C–O–H, and C–O–C deformations associated with polysaccharide backbones [26,27,29]. The bands at ~1230 and ~1055 cm⁻¹ are consistent with asymmetric S=O stretching (sulfate ester) and C–O–C stretching of the glycosidic linkages [26,27,30]. The band at 900 cm⁻¹ was associated with C1–H bending vibrations in β-anomeric units, likely originating from galactose [31]. Additionally, a peak near 820 cm⁻¹, often attributed to C–O–S bending vibrations of sulfate substitutions, supports the presence of sulfated sugar residues in all extracts [32,33,34]. The band raised at 620 cm⁻¹ may be attributed to symmetric O=S=O deformation [31]. Taken together, the FTIR data confirm that Dur-I, Dur-II and Dur-III share the general spectral features characteristic of sulfated, fucose-rich polysaccharides (e.g. “fucoidan-like” materials). However, the spectra of the three extracts are very similar, and no major differences in band positions or overall profile were evident, suggesting that despite differences in molecular weight distribution and monosaccharide composition, and the overall backbone chemistry and functional-group pattern remain broadly comparable. Such observations align with recent structural studies on brown-algal polysaccharides, which report that while variations in molecular weight or sulfate content may influence bioactivity, the core spectral fingerprint (OH, C–H, glycosidic link, sulfate) remains relatively conserved across differently processed extracts.
Figure S2A shows the ¹H NMR spectra of Dur-I, Dur-II, and Dur-III. The signal at 4.13 ppm (4[H]) suggests the presence of 3-linked α-L-fucose [29]. Peaks at 4.07 and 3.95 ppm (6[H] and 6′[H]) indicate a (1-6)-β-D-linked galactan [35]. The signals at 3.78 ppm and 3.72 ppm may reflect 4-linked β-D-galactose (3[H]) and 2,3-linked α-β-mannose (4[H]), respectively [29]. The signals in the region 3.3–3.6 ppm likely correspond to ring protons (H-2 through H-5) of fucopyranose or other sugar residues (e.g., hexoses or uronic acids), including those adjacent to glycosidic linkages or sulfate/acetyl substituents [36]. Meanwhile, the weak resonances at~2.71 and ~2.87 ppm may reflect minor components or modifications, such as residual acetyl groups, non-sugar impurities (e.g., amino acid residues) or protons on carbons adjacent to sulfate esters or uronic acid moieties [37]. The resonances observed at ca. 1.23–1.32 ppm can be attributed to the C-6 methyl protons (–CH₃) of the 6-deoxy-sugar unit L-fucose, which is characteristic of fucoidan and confirmed in recent spectral studies [36,38]. Overall, the ¹H-NMR profile supports the presence of a fucose-rich sulfated polysaccharide backbone across all three extracts, with subtle differences possibly attributable to variations in substitution patterns, composition (e.g., inclusion of uronic acids or hexose units), or processing history. In the 13C-NMR spectra of Dur-I, Dur-II and Dur-III (Figure S2B), the resonances were assigned as follows. Resonances in the 80–65 ppm region are characteristic of carbohydrate ring carbons (C-2 to C-5) of pyranose residues and typically include signals arising from sulfated or otherwise substituted ring carbons, which are shifted downfield relative to non-substituted carbons; therefore, peaks in this range are best interpreted as the ring C-2–C-5 carbons of fucopyranosyl, galactopyranosyl, or uronic-acid residues and likely include contributions from positions bearing sulfate esters [39,40]. The signal at 62.88 ppm is consistent with a C-6 (CH₂OH) carbon of hexopyranose units (e.g., glucose, galactose) or with the C-6 of substituted galactose/galacturonic acid residues; such CH₂ carbons typically appear near 60–63 ppm in polysaccharide spectra and serve as markers for the presence of hexose residues or hexose side-chains [41,42]. The resonance observed at 20.32 ppm in Dur-III is indicative of the methyl carbon of an acetyl group (–COCH₃), suggesting the occurrence of O- or N-acetylation within the sample. Typically, acetyl methyl carbons in polysaccharides are detected in the 20–23 ppm region, and their presence is commonly reported in the coextraction of fucoidans or in partially acetylated fucoidans [39,42]. Finally, the resonance at 15.54 ppm corresponds well to the C-6 methyl carbon of L-fucose (–CH₃); fucose C-6 methyl carbons are typically observed around 15–17 ppm and are diagnostic for fucose-rich sulfated polysaccharides (fucoidans). The presence of this signal therefore corroborates the high fucose content reported for Dur-I/II/III [40,41]. HSQC (heteronuclear single quantum coherence), a two-dimensional NMR spectrum, correlates proton chemical shifts (¹H) with the chemical shifts of a directly bonded heteronucleus (commonly ¹³C). That means each cross-peak locates a specific H–C pair, which greatly helps assign which proton belongs to which carbon in a molecule [43]. Figure S2C depicts the HSQC spectra of Dur-I, Dur-II, and Dur-III. Basically, two major clusters can be found (as shown in red rectangular). The HSQC spectra of Dur-I, Dur-II, and Dur-III reveal clear differences in the heteronuclear correlation patterns that reflect variations in their glycosidic linkages and sulfation profiles. All three extracts display dense clusters of cross-peaks within the typical carbohydrate region (δH 3.2–5.2 ppm / δC 60–105 ppm), consistent with the presence of fucose, rhamnose, and galactose-derived residues. However, Dur-III exhibits a more dispersed set of correlations, particularly between δH 4.5–5.1 ppm and δC 95–103 ppm, indicating a higher proportion of anomeric protons and suggesting a more heterogeneous mixture of oligosaccharide fragments, which is consistent with its lower molecular weight fraction. Dur-I and Dur-II show more compact anomeric clusters, implying a higher degree of structural uniformity. In addition, Dur-III presents stronger correlations in the δC 65–75 ppm region paired with δH 3.4–4.2 ppm, which are characteristic of C2/C4-sulfated fucose residues, whereas Dur-II displays slightly intensified correlations near δC ~80 ppm, possibly reflecting substituted C3 positions. The subtle variations in cross-peak distribution therefore suggest that enzyme-specific hydrolysis generated distinct linkage patterns and sulfation motifs across the three extracts, supporting the hypothesis that Dur-III contains more extensively cleaved oligosaccharides compared with Dur-I and Dur-II. Collectively, both Dur-I and Dur-II show comparatively compact anomeric clusters and fewer dispersed cross-peaks, consistent with higher-molecular-weight fractions dominated by repeating fucose-rich sequences and fewer distinct oligomeric end-groups. Dur-II, which had the highest measured sulfate content, shows subtle intensification of correlations near δC ~80 ppm, a region frequently associated with sulfation at C-3 (or stereoelectronic effects from adjacent substitutions). This pattern suggests enzyme-dependent preferences for cleavage sites and positions of sulfate retention or enrichment. In addition, Dur-III displays a broader and more dispersed distribution of anomeric correlations (δH ~4.5–5.1 ppm / δC ~95–103 ppm) and more intense cross-peaks in the δC 65–75 ppm / δH 3.4–4.2 ppm region. These observations may show the information of increased heterogeneity of anomeric linkages (more distinct anomeric environments) and a higher occurrence of sulfation at positions that shift ring carbons into the 65–75 ppm window (for example, 2-O or 4-O sulfation on fucose). These features indicate that the enzyme treatment used to produce Dur-III yields more extensively cleaved and sulfate-rich on fucose oligosaccharides. Given the inherent structural heterogeneity and conformational complexity of polysaccharides, additional complementary analytical techniques are often required to achieve unambiguous structural elucidation. In summary, these spectroscopic signatures reconcile with the following compositional information: Dur-III’s high total sugar and fucose percentages and elevated proportion of low-MW species (SEC) are reflected in its dispersed HSQC pattern and stronger low-MW-related correlations, whereas Dur-I and Dur-II preserve larger, more uniform polymeric regions. The higher sulfate content in Dur-II corresponds to HSQC shifts consistent with substitution at specific ring carbons. Such correlations between SEC, compositional analysis, FTIR and 2D NMR are well described in recent studies, which emphasize that molecular-weight, sulfation degree and substitution position jointly determine NMR chemical-shift patterns and biofunctional potential [39,44].

2.3. Dur-I, Dur-II, and Dur-III attenuated Rotenone-Induced Apoptosis in SH-SY5Y Neuronal Cells

Protective effects of Dur-I, Dur-II, and Dur-III against rotenone-induced apoptosis in SH-SY5Y cells. Dur-I, Dur-II, and Dur-III attenuated rotenone-induced apoptosis in SH-SY5Y neuronal cells Recent studies have demonstrated that undifferentiated SH-SY5Y cells retain an immature, neuroblast-like phenotype and exhibit low or inconsistent expression of dopaminergic markers, thereby limiting their utility for directly modeling dopaminergic neuronal pathology without prior differentiation. Although differentiation protocols, typically involving retinoic acid, alone or in combination with neurotrophic factors, can enhance dopaminergic features such as tyrosine hydroxylase and dopamine transporter expression, these procedures are often time-consuming and experimentally complex. Nevertheless, SH-SY5Y cells remain a widely utilized and cost-effective in vitro model for studies of neurotoxicity and neuroprotection [45,46]. Accordingly, the present study employed undifferentiated SH-SY5Y cells to evaluate the cytoprotective activities of Dur-I, Dur-II, and Dur-III against rotenone-induced apoptosis within an established rotenone neurotoxicity paradigm. Accumulating evidence indicates that neuronal apoptosis is a key pathological event following metabolic stress or neurotoxic injury and contributes substantially to the progression of both acute and chronic neurodegenerative disorders in the adult brain [47]. In this study, cell viability was assessed using the MTT assay to determine the cytotoxic profiles of Dur-I, Dur-II, and Dur-III in SH-SY5Y cells across a concentration range of 0–200 μg/mL, as well as the cytotoxic effect of 50 μM rotenone (Rot). In addition, the protective potential of Dur-I, Dur-II, and Dur-III against Rot-induced cytotoxicity was evaluated by examining their ability to restore cell viability following Rot exposure. As shown in Figure 2A, Dur-III exhibited the lowest cytotoxicity across the tested concentrations, followed by Dur-I and Dur-II; nevertheless, none of the polysaccharide fractions reduced cell viability below approximately 80%, indicating minimal cytotoxic effects. Consistent with previous reports, treatment with 50 μM Rot resulted in approximately 50% cell death (Figure 2B) [48]. Notably, pretreatment with Dur-I, Dur-II, or Dur-III (25–200 μg/mL, 24 h) significantly mitigated Rot-induced cytotoxicity, demonstrating that Dur I/II/III conferred measurable protection against Rot-triggered cytotoxicity in SH-SY5Y cells.
To further elucidate the protective effects of the Dur I/II/III against Rot-induced neuronal apoptosis, several mechanistic assays were performed using flow cytometry. These analyses encompassed the measurement of mitochondrial membrane potential (MMP), examination of Bcl-2 protein regulation, evaluation of cytochrome c release, determination of caspase-9, -8, and -3 activation, and quantification of DNA fragmentation, as the results were presented in Table 3 and Figure S3. Accumulating evidence indicates that mitochondrial dysfunction, particularly the opening of the mitochondrial permeability transition pore (mPTP) and impairment of mitochondrial ATP-sensitive potassium (mitoK ATP) channels, plays a pivotal role in the initiation of programmed cell death [49]. Irreversible mPTP opening disrupts mitochondrial homeostasis, leading to ATP depletion and the onset of apoptosis [50]. Because maintenance of MMP is essential for ATP synthesis and overall cellular homeostasis [51], the loss of MMP represents a hallmark of early apoptosis and is closely associated with downstream caspase activation [52]. MMP was assessed using the tetramethylrhodamine ethyl ester (TMRE) assay. TMRE is a cationic, lipophilic dye that accumulates within polarized mitochondria in proportion to membrane potential. Depolarization reduces TMRE accumulation and consequently decreases fluorescence intensity, making TMRE a reliable indicator of mitochondrial integrity and function [53]. As TMRE enters the cell, it interacts with fluorescent proteins and other intracellular components, leading to the emission of fluorescence. When the membrane potential decreases, TMRE accumulates within the cell, resulting in an increased fluorescence signal. In contrast, a rise in membrane potential causes TMRE to be expelled, leading to weaker fluorescence [54]. Therefore, measuring TMRE accumulation in mitochondria provides an effective indicator of mitochondrial function. In the present study, exposure of SH-SY5Y cells to 50 µM Rot markedly increased the proportion of low-TMRE cells (Table 3), reflecting substantial MMP loss. This shift corresponded to a reduction in the fraction of high-TMRE cells, consistent with mitochondrial depolarization. Importantly, pretreatment with Dur-I, Dur-II, or Dur-III (200 µg/mL, 24 h) significantly mitigated the Rot-induced decline in TMRE fluorescence, indicating preservation of MMP. Collectively, these results demonstrate that the Dur I/II/III effectively protect SH-SY5Y cells from Rot-mediated mitochondrial dysfunction, thereby attenuating early apoptotic signaling. Bcl-2 is a key anti-apoptotic member of the B-cell lymphoma-2 (Bcl-2) protein family and plays an essential role in preserving mitochondrial integrity. Previous studies have shown that Bcl-2 prevents mitochondrial membrane potential (MMP) depolarization and delays the activation of downstream apoptotic effectors, including the release of cytochrome c, apoptosis-inducing factor (AIF), and Smac/Diablo [55]. Conversely, downregulation of Bcl-2 facilitates the progression of mitochondrial-mediated apoptosis. As summarized in Table 3, exposure of SH-SY5Y cells to 50 µM Rot for 24 h markedly decreased Bcl-2 expression compared with untreated controls. However, pretreatment with 200 µg/mL of Dur-I, Dur-II, or Dur-III significantly restored Bcl-2 levels (p < 0.05), indicating that the Dur I/II/III mitigated Rot-induced suppression of this anti-apoptotic protein. Among the three samples, Dur-II exhibited the strongest protective effect on Bcl-2 expression, followed by Dur-III and Dur-I. Previous studies have shown that the loss of mitochondrial membrane potential (MMP) induces matrix condensation and exposes cytochrome c to the intermembrane space, thereby facilitating its release into the cytosol and initiating apoptotic signaling cascades [56]. In the present study, the effect of Rot on cytochrome c release in SH-SY5Y cells was evaluated. Exposure to 50 µM Rot for 24 h markedly reduced the proportion of high-fluorescence cells from 55.6% ± 1.2% (control) to 19.2% ± 0.5%, indicating substantial mitochondrial cytochrome c release (Table 3). In contrast, pretreatment with Dur-I, Dur-II, or Dur-III significantly increased the proportion of high-fluorescence cells to 39.3% ± 2.2%, 50.2% ± 0.9%, and 35.9% ± 2.0%, respectively (p < 0.05), demonstrating attenuation of Rot-induced cytochrome c release. Among the three extracts, Dur-II exerted the strongest protective effect, followed by Dur-I and Dur-III. Consistent with the mitochondrial apoptotic pathway, the release of cytochrome c enables apoptosome formation, which subsequently activates downstream caspases that execute apoptosis [57]. The present study also evaluated the effects of Dur I/II/III on the activation status of caspase-9, caspase-8, and caspase-3 in SH-SY5Y cells. As shown in Table 3, exposure to 50 µM Rot for 24 h markedly increased the levels of active caspase-9, -8, and -3 compared with untreated control cells, indicating robust activation of the apoptotic pathways. In contrast, pretreatment with 200 µg/mL of Dur-I, Dur-II, or Dur-III significantly reduced Rot-induced caspase activation (p < 0.05), demonstrating that the Dur I/II/III effectively suppressed the initiation and execution phases of apoptosis. Caspase-3, a principal executioner caspase activated by both the intrinsic (mitochondrial) and extrinsic (death-receptor) pathways, cleaves nuclear and cytosolic substrates (e.g., ICAD/DFF45), thereby enabling CAD-mediated DNA fragmentation and producing the characteristic internucleosomal ‘ladder’ of late apoptosis [58]. To further assess apoptosis progression, DNA fragmentation was quantified using a TUNEL assay. As shown in Table 3, the proportion of high-fluorescence (TUNEL-positive) cells significantly increased from 43.0% ± 0.4% (control) to 69.2% ± 0.6% following 24 h exposure to 50 µM Rot, confirming substantial DNA fragmentation. Pretreatment with Dur extracts attenuated this effect, reducing the TUNEL-positive population to 59.2% ± 3.1%, 63.0% ± 0.6%, and 48.6% ± 0.9% for Dur-I, Dur-II, and Dur-III, respectively (p < 0.05). Among the three extracts, Dur-III conferred the strongest protection, followed by Dur-I and Dur-II. Collectively, these findings indicate that Dur I/II/III mitigate Rot-induced apoptosis in SH-SY5Y cells by suppressing caspase activation and preventing downstream DNA fragmentation.
During propidium iodide (PI) staining, flow cytometric analysis enables the identification of apoptotic cells and cells exhibiting nuclear fragmentation, which are typically characterized as a sub-G1 population [59]. To further examine the baseline regulatory effects of Dur-I/II/III on cell death under physiological conditions, we assessed the cell-cycle distribution in cells treated with Dur I/II/III alone, without Rot exposure. As shown in Figure 3(A) and 3(B), treatment with Dur-I, Dur-II, or Dur-III at 200 µg/mL for 48 h resulted in a slight increase in the proportion of sub-G1 cells compared with the untreated control, whereas the distributions of other phases (G0/G1, S, and G2/M) remained largely unchanged. These findings indicate that Dur I/II/III exhibit minimal cytotoxicity toward SH-SY5Y cells and help maintain cellular survival signaling under basal conditions. As shown in Figure 3(C) and 3(D), analysis of DNA content revealed that treatment of SH-SY5Y cells with 50 µM Rot induced a significant increase in the proportion of cells with sub-G1 DNA content (14.0% ± 0.22%) compared with untreated cells (3.53% ± 0.13%) (p < 0.05). Pretreatment with 200 µg/mL Dur-I, Dur-II, or Dur-III and then treatment with 50 µM Rot significantly reduced the apoptotic sub-G1 populations to 6.70% ± 0.00%, 5.80% ± 0.08%, and 7.50% ± 0.08%, respectively (p < 0.05). Overall, Dur-II exhibited the strongest protective effect, followed by Dur-I and Dur-III. These findings indicate that Rot exposure markedly increases the percentage of sub-G1 cells, reflecting enhanced DNA fragmentation and apoptosis. Moreover, Dur-I/II/III pretreatment significantly attenuated the Rot-induced sub-G1 accumulation, suggesting that Dur-I/II/III confer protective effects against neuronal damage in SH-SY5Y cells. Moreover, treatment of SH-SY5Y cells with 50 µM Rot resulted in a pronounced arrest or delay in entry into the G2/M phase, increasing the G2/M population to 30.8% ± 0.05% compared with untreated cells (8.07% ± 0.05%) (Figure 3D). Pretreatment with 200 µg/mL Dur-I, Dur-II, or Dur-III and then treatment with 50 µM Rot attenuated this G2/M accumulation, reducing the G2/M populations to 30.2% ± 0.17%, 26.6% ± 0.09%, and 28.8% ± 0.29%, respectively. These results suggest that Dur-I/II/III mitigate Rot-induced cell-cycle arrest and growth inhibition in SH-SY5Y cells. Overall, Dur-II exhibited the strongest rescue effect, followed by Dur-III and Dur-I. An additional apoptosis assessment was performed using Annexin V-FITC and PI double staining. Early apoptosis is marked by the disruption of plasma membrane asymmetry, leading to the translocation of phosphatidylserine (PS) residues from the inner to the outer leaflet of the membrane [60]. Annexin V binds strongly and specifically to exposed PS, making Annexin V staining a dependable method for detecting early apoptotic events. In contrast, PI enters only non-viable cells, allowing clear distinction among viable, early apoptotic, late apoptotic, and necrotic populations. Viable cells exhibit no staining with either Annexin V-FITC or propidium iodide (PI); early apoptotic cells are Annexin V-FITC-positive and PI-negative; late apoptotic cells are positive for both Annexin V-FITC and PI; whereas necrotic cells are Annexin V-FITC-negative and PI-positive. [59]. As shown in Figure 4, exposure of SH-SY5Y cells to 50 µM Rot for 24 h markedly increased the proportion of late apoptotic cells to 82.5% ± 0.5%, accompanied by a substantial reduction in viable cells to 11.0% ± 0.2%, compared with the control group (19.5% ± 0.3% and 75.1% ± 0.6%, respectively). Pretreatment with 200 µg/mL Dur-I, Dur-II, or Dur-III and then treatment with 50 µM Rot significantly reduced late apoptotic populations to 44.4% ± 0.2%, 48.1% ± 0.7%, and 44.9% ± 0.7%, respectively. Correspondingly, the proportion of viable cells increased to 46.2% ± 0.5%, 45.0% ± 0.9%, and 45.3% ± 0.5% in the Dur-I, Dur-II, and Dur-III groups. These findings clearly demonstrate that Dur I/II/III provide substantial protection against Rot-induced apoptosis in SH-SY5Y cells, particularly by reducing late apoptotic cell death.

3. Materials and Methods

3.1. Materials

A specimen of D. antarctica was obtained from a local grocery market in Kaohsiung City, Taiwan. The sample was oven-dried and stored in sealed plastic containers at 4 °C prior to further use. Analytical standards, including L-fucose, L-rhamnose, D-glucuronic acid, D-galacturonic acid, D-glucose, D-galactose, and D-xylose, as well as chemical reagents such as sodium carbonate, rotenone, potassium sulfate, potassium bromide (KBr), potassium persulfate, sodium sulfite, dextrans (1, 12, 50, 150, and 670 kDa), trypsin/EDTA, MTT, Bradford reagent, and dimethyl sulfoxide (DMSO), were purchased from Sigma-Aldrich (St. Louis, MO, USA). Enzymes, including viscozyme, cellulase, and α-amylase, were also obtained from Sigma-Aldrich. Cell culture reagents, namely RPMI-1640 medium, fetal bovine serum, penicillin, and streptomycin, were supplied by Gibco Laboratories (Grand Island, NY, USA). Trifluoroacetic acid (TFA) was procured from Panreac (Barcelona, Spain). Fluorescent probes, including tetramethylrhodamine ethyl ester (TMRE) and FITC-conjugated anti-Bcl-2 antibodies, were obtained from Molecular Probes (Invitrogen, Carlsbad, CA, USA). All other biochemical and immunological reagents used in this study were of analytical grade and purchased from Sigma-Aldrich unless otherwise specified.

3.2. Extrusion Method

Extrusion processing was carried out using a laboratory-scale single-screw extruder (Tsung Hsing Co. Ltd., Kaohsiung, Taiwan) with a screw diameter of 74 mm and a length-to-diameter (L/D) ratio of 3.07:1, fitted with a rounded die of 5 mm diameter. Prior to extrusion, the raw D. antarctica material was conditioned to a moisture content of 35%. The extrusion parameters were set as follows: a feed rate of 10.4 kg h⁻¹, a barrel temperature of 115 °C, and a screw rotation speed of 360 rpm. Upon completion of extrusion, the processed material was dried at 55 °C for 30 min, allowed to cool to ambient temperature, and subsequently milled into powder. The resulting product was sealed in aluminum bags and stored at 4 °C until further use in enzymatic extraction experiments.

3.3. Seaweed Extraction by Enzymes

The enzymatic extraction was performed following previously described procedures [11,61] with slight modifications. In brief, 1 g of dried D. antarctica was suspended in 100 mL of double-distilled water (ddH₂O) adjusted to pH 6.0. Enzymatic hydrolysis was initiated by the addition of either viscozyme (100 μL, ≥100 FBGU g⁻¹), cellulase (100 mg, approximately 0.8 U mg⁻¹ solid), or α-amylase (100 mg, ≥5 U mg⁻¹ solid). The reaction mixtures were incubated at 40 °C for 17 h under continuous agitation at 250 rpm. Following hydrolysis, the suspensions were centrifuged at 8,000 rpm for 30 min at 4 °C, and the supernatants were filtered through 0.45 μm PVDF membranes to remove residual insoluble material. The resulting filtrates were frozen at −80 °C, lyophilized, and the obtained powders were stored at −20 °C until further analysis. Extraction yield was calculated according to the following equation:
Extraction yield (%) = (gA / gB) × 100
where gA is the dry weight of the recovered extract and gB is the dry weight of the original sample.

3.4. Molecular Weight Analysis

The molecular weight distribution of the polysaccharides was assessed following the procedure described by Yang [59]. Column calibration was performed using a series of dextran standards with molecular weights of 1, 12, 50, 150, and 670 kDa.

3.5. Chemical Methods

Total sugar content was determined using the phenol-sulfuric acid colorimetric method, with galactose employed as the calibration standard. Fucose concentration was quantified according to a previously reported procedure [11], using L-fucose for standard curve generation. Uronic acid content was measured by a colorimetric assay using D-galacturonic acid as the reference compound [11]. Alginate levels were evaluated following an established analytical protocol [11]. Total polyphenols were quantified using the Folin-Ciocalteu assay, with gallic acid as the standard. Sulfate content was assessed by acid hydrolysis of the samples in 1 N HCl at 105 °C for 5 h, followed by determination of sulfate ions using an ion chromatography system (Dionex ICS-1500, Thermo Scientific) equipped with an IonPac AS9-HC analytical column (4 × 250 mm). The chromatographic analysis was performed at 30 °C with a flow rate of 1.0 mL min⁻¹, employing 9 mM Na₂CO₃ as the eluent, and potassium sulfate (K₂SO₄) as the external standard. Protein concentration was determined using the Bradford method, with bovine serum albumin (BSA) as the reference standard.

3.6. Analysis of Monosaccharide Composition

The monosaccharide composition was measured using aforementioned protocol [11], using l-fucose, l-rhamnose, d-glucuronic acid, D-galacturonic acid d-glucose, d-galactose, and d-xylose as the standards.

3.7. FTIR Spectroscopy

FTIR analysis was carried out following the procedure described by Shih [11]. Briefly, the sample was blended with KBr at a 1:50 ratio (w/w) and ground thoroughly until the particle size was below 2.5 μm. Transparent KBr pellets were then produced by pressing the mixture at 500 kg/cm² under vacuum. Spectra were recorded using an FT-730 spectrometer (Horiba, Kyoto, Japan) over the range of 400 to 4000 cm⁻¹. A KBr pellet without sample served as the background control.

3.8. Nuclear Magnetic Resonance (NMR) Spectroscopy

The extracts were initially dissolved in 99.9% deuterium oxide (D2O) directly within NMR tubes for subsequent analysis. Nuclear magnetic resonance (NMR) spectra were acquired using a Varian VNMRS-700 spectrometer (Varian, Lexington, USA) to investigate the structural characteristics of polysaccharides. The proton chemical shift was expressed in ppm.

3.9. Cell Culture

The human dopaminergic neuroblastoma cell line SH-SY5Y (ATCC® CRL-2266™) was obtained from the Food Industry Research and Development Institute (Hsinchu, Taiwan). Cells were cultured in RPMI 1640 medium supplemented with 10% fetal bovine serum (FBS), penicillin (100 U mL⁻¹), and streptomycin (100 µg mL⁻¹). The cultures were maintained at 37 °C in a humidified incubator under an atmosphere of 5% CO₂ and 95% air. The culture medium was replaced every 48–72 h.

3.10. Cell Viability Analysis

Cell viability was evaluated using the MTT colorimetric assay. Briefly, cells were seeded into 96-well plates at a density of 1 × 10⁵ cells mL⁻¹ and allowed to reach approximately 80% confluence. The cells were then treated with extracts at various concentrations for the indicated time periods. After treatment, MTT solution (final concentration, 0.1 mg mL⁻¹) was added to each well and incubated for 2 h to allow the formation of formazan crystals. Subsequently, dimethyl sulfoxide (DMSO) was added to solubilize the formazan and lyse the cells. Cell viability was calculated as a percentage relative to the untreated control according to Equation (2).
C e l l   v i a b i l i t y   % = A T / A C × 100
AT is the absorbance at 570 nm in the test, and AC is the absorbance at 570 nm for the control.

3.11. Flow Cytometry-Based Analyses

The SH-SY5Y cells with a cell density 4 × 10⁴ cells/mL were cultured without (cells were in serum-free medium, as a control) and with 200 μg/mL Dur-I, Dur-II, and Dur-III (cells were in serum-free medium) for 24 h, and then the cells were added with Rot (50 μM) for 24 h, and thereafter the cells were collected for flow cytometer-based analysis as the described protocols: (1) For the MMP analysis, the cells were labeled with tetramethylrhodamine ethyl ester (TMRE) (100 nM). (2) For the Bcl-2 expression analysis, the cells were labeled with FITC-anti-Bcl-2 antibody (1:25, v/v). (3) A 1:10 (v/v) FITC-anti-cytochrome c antibody was applied to label the cell preparations for the cytochrome c release experiment. (4) The cells were labeled with FITC-LEHD-FMK solution for caspase-9 detection, FITC-IETD-FMK solution for caspase-8 detection, and FITC-DEVD-FMK solution for caspase-3 detection, respectively. (5) For the DNA fragmentation assay, apoptotic cells were labeled with bromodeoxyuridine (BrdU) and subsequently incubated with a FITC-conjugated anti-BrdU antibody for 30 min at room temperature in the dark. (6) For cell-cycle analysis, cells were stained with propidium iodide (PI; 50 µg/mL) and RNase A (25 µg/mL) at 37 °C for 15 min. (7) For the Annexin V–FITC/PI assay, cells were double-stained with Annexin V-FITC (1:20, v/v) and PI (1:20, v/v). Following staining, flow-cytometric analyses were performed using a BD Accuri C6 flow cytometer (San Jose, CA, USA), with a minimum of 10,000 events acquired per sample. Data acquisition and analysis were conducted using BD Accuri C6 software.

3.12. Statistical Analysis

All experiments were performed in triplicate, and data are expressed as the mean ± standard deviation. Statistical analyses were conducted using SPSS software. Differences among groups were evaluated by one-way analysis of variance (ANOVA), followed by Duncan’s multiple range test. A p value of < 0.05 was considered statistically significant.

4. Conclusions

In this study, three Durvillaea antarctica extracts (Dur-I, Dur-II, and Dur-III) were generated from extrusion-pretreated biomass using distinct enzymatic extraction approaches, resulting in marked differences in chemical composition, molecular weight distribution, and structural features. Functional evaluations revealed that all three Dur extracts conferred significant protection against rotenone (Rot)-induced apoptotic injury in SH-SY5Y cells. This cytoprotective effect was evidenced by the maintenance of mitochondrial membrane potential (MMP), increased expression of the anti-apoptotic protein Bcl-2, inhibition of cytochrome c release, and suppression of caspase-9, -8, and -3 activation. Additionally, the extracts mitigated DNA fragmentation, modulated cell-cycle progression, and significantly reduced apoptotic cell populations, as determined by Annexin V-FITC/PI double-staining analysis. Although SH-SY5Y cells are extensively utilized as a neuronal-like in vitro model, their intrinsic heterogeneity and lack of a definitive dopaminergic phenotype in the undifferentiated state represent important limitations. Therefore, to more comprehensively delineate the molecular mechanisms underlying the neuroprotective effects of Dur-I, Dur-II, and Dur-III, future investigations warrant to employ differentiated SH-SY5Y cells and/or relevant in vivo models. Collectively, the present findings indicate that these Dur extracts exert robust cytoprotective effects under oxidative stress conditions and highlight their potential as promising neuroprotective agents for the prevention of oxidative stress–associated neurological disorders.

Supplementary Materials

The following supporting information can be downloaded at: Preprints.org, Figure S1: Size exclusion chromatographic profiles for Dur-I, Dur-II, and Dur-III. Dextrans with molecular weights 1, 12, 50, 150, and 670 kDa were utilized as the standards; Figure S2: NMR spectra for Dur-I, Dur-II, and Dur-III. (A) 1H spectra. (B) 13C spectra. (C) HSQC spectra. The characteristic peaks are labeled; Figure S3: Effects of Dur-I, Dur-II, and Dur-III treatment and Rot treatment with or without Dur-I, Dur-II, and Dur-III (200 μg/mL) pretreatment on the apoptotic factors of SH-SY5Y cells. (A) Low mitochondrial membrane potential; (B) Level of Bcl-2; (C) Release of cytochrome c; (D) Caspase-9 activity; (E) Caspase-8 activity; (F) Caspase-3 activity; (G) DNA fragmentation.

Author Contributions

Wei-Cheng Hsiao: Conceptualization. Tien-Chiu Wu: Data curation and Writing-Original draft preparation. Yong-Han Hong: Visualization and Investigation. Mei-Chun Lin: Formal analysis and Methodology. Yi-Wen Chiu: Software, Investigation, and Validation. Chieh Kao: Software and Writing- Original draft preparation. Chun-Yung Huang: Supervision, Funding acquisition, and Writing- Reviewing and Editing. All authors have read and agreed to the published version of the manuscript.

Funding

This research was funded by Yuan’s General Hospital, Taiwan, grant number YUAN-IACR-25-01 to Wei-Cheng Hsiao. This work was supported by grants from the Kaohsiung Medical University Hospital (KMUH112-M201) to Tien-Chiu Wu. This work was supported by the National Science and Technology Council, Taiwan [grant number NSTC 113-2221-E-992-008-], [grant number NSTC 114-2918-I-992-003], and [grant number NSTC 114-2221-E-992-020-MY3], which were awarded to Chun-Yung Huang. This research was also supported by the Ministry of Agriculture, Taiwan, under grant number 114AS-1.6.2-AS-24, which was awarded to Chun-Yung Huang.

Data Availability Statement

Data available on request from the authors.

Conflicts of Interest

The authors declare that there are no conflicts of interest.

Abbreviations

The following abbreviations are used in this manuscript:
MMP Mitochondrial membrane potential
FITC Fluorescein isothiocyanate
PI Propidium iodide
AD Alzheimer’s disease
PD Parkinson’s disease
ROS Reactive oxygen species
SEC Size-exclusion chromatography
HPSEC High-performance size exclusion chromatography
HSQC Heteronuclear single quantum coherence
Rot Rotenone
mPTP Mitochondrial permeability transition pore
mitoK ATP Mitochondrial ATP-sensitive potassium
TMRE Tetramethylrhodamine ethyl ester
Bcl-2 B-cell lymphoma-2
AIF Apoptosis-inducing factor
TUNEL Terminal deoxynucleotidyl transferase dUTP nick end labeling
PS Phosphatidylserine
BSA Bovine serum albumin
KBr Potassium bromide
TFA Trifluoroacetic acid
NMR Nuclear magnetic resonance
FTIR Fourier transform infrared spectroscopy

References

  1. Li, H.; Wang, N.; Mao, X. Incidental vs. engineered nanoparticles in Alzheimer’s and Parkinson’s disease: Pathological pathways and therapeutic interventions. Nano Res. 2025, 18. [CrossRef]
  2. Olufunmilayo, E.O.; Gerke-Duncan, M.B.; Holsinger, R.M.D. Oxidative Stress and Antioxidants in Neurodegenerative Disorders. Antioxidants 2023, 12, 517. [CrossRef]
  3. Goel, P.; Chakrabarti, S.; Goel, K.; Bhutani, K.; Chopra, T.; Bali, S. Neuronal cell death mechanisms in Alzheimer’s disease: An insight. Front. Mol. Neurosci. 2022, 15, 937133. [CrossRef]
  4. Kumari, S.; Dhapola, R.; Sharma, P.; Paidlewar, M.; Vellingiri, B.; Medhi, B.; HariKrishnaReddy, D. Unravelling neuronal death mechanisms: The role of cytokines and chemokines in immune imbalance in Alzheimer’s disease progression. Ageing Res. Rev. 2025, 112, 102883. [CrossRef]
  5. Li, Y.-Y.; Qin, Z.-H.; Sheng, R. The Multiple Roles of Autophagy in Neural Function and Diseases. Neurosci. Bull. 2023, 40, 363–382. [CrossRef]
  6. Zhou, Q.-L.; Wang, Z.; Chen, W.-T.; Liu, X.-F.; Cheong, K.-L.; Zou, Y.-X.; Zhong, S.-Y.; Li, R. The structural characteristics, biological activities and mechanisms of bioactive brown seaweed polysaccharides: A review. J. Funct. Foods 2024, 119. [CrossRef]
  7. Wu, J.; Wang, H.; Liu, Y.; Xu, B.; Du, B.; Yang, Y. Effect of Ultrasonic Irradiation on the Physicochemical and Structural Properties of Laminaria japonica Polysaccharides and Their Performance in Biological Activities. Molecules 2022, 28, 8. [CrossRef]
  8. Matsuzaki, K.; Tatsumi, D.; Sugiyama, T.; Hiraoka, M.; Igura, N.; Tsubaki, S. Accelerating Sulfated Polysaccharides Extraction from Fast-Growing Ulva Green Seaweed by Frequency-Controlled Microwaves. ACS Omega 2024, 9, 29896–29903. [CrossRef]
  9. Otero, P.; Carpena, M.; Garcia-Oliveira, P.; Echave, J.; Soria-Lopez, A.; Garcia-Perez, P.; Fraga-Corral, M.; Cao, H.; Nie, S.; Xiao, J.; et al. Seaweed polysaccharides: Emerging extraction technologies, chemical modifications and bioactive properties. Crit. Rev. Food Sci. Nutr. 2021, 63, 1901–1929. [CrossRef]
  10. Alfinaikh, R.S.; Alamry, K.A.; Hussein, M.A. Sustainable and biocompatible hybrid materials-based sulfated polysaccharides for biomedical applications: a review. RSC Adv. 2025, 15, 4708–4767. [CrossRef]
  11. Shih, M.-K.; Hou, C.-Y.; Dong, C.-D.; Patel, A.K.; Tsai, Y.-H.; Lin, M.-C.; Xu, Z.-Y.; Perumal, P.K.; Kuo, C.-H.; Huang, C.-Y. Production and Characterization of Durvillaea antarctica Enzyme Extract for Antioxidant and Anti-Metabolic Syndrome Effects. Catalysts 2022, 12, 1284. [CrossRef]
  12. Sanjeewa, K.A.; Herath, K.; Kim, Y.-S.; Jeon, Y.-J.; Kim, S.-K. Enzyme-assisted extraction of bioactive compounds from seaweeds and microalgae. TrAC Trends Anal. Chem. 2023, 167. [CrossRef]
  13. Jiang, G.; Ameer, K.; Ramachandraiah, K.; Feng, X.; Tan, C.; Cai, N. Effects of synergistic application of Viscozyme L–wet ball milling on structural, physicochemical and functional properties of insoluble dietary fiber from ginseng residue. LWT 2024, 209. [CrossRef]
  14. Thanh, H.D.T.; Nguyen, T.T. High gravity enzymatic hydrolysis of non–gelatinized starch from black - purple rice. Vietnam. J. Sci. Technol. 2023, 61, 787–797. [CrossRef]
  15. Silva, G.H.; Flores-Alarcón, M.A.; Durán, L.M.; Roberto, I.C. Enzyme supplementation as a strategy for enhancing the cellulose and hemicellulose conversion yields at high solids content of pretreated rice straw. Process. Biochem. 2025, 157, 207–215. [CrossRef]
  16. Zhang, Z.; Xing, J.; Li, X.; Lu, X.; Liu, G.; Qu, Y.; Zhao, J. Review of research progress on the production of cellulase from filamentous fungi. Int. J. Biol. Macromol. 2024, 277, 134539. [CrossRef]
  17. Sahu, P.K.; Singh, R.; Shrivastava, M.; Darjee, S.; Mageshwaran, V.; Phurailtpam, L.; Rohatgi, B. Microbial production of α-amylase from agro-waste: An approach towards biorefinery and bio-economy. Energy Nexus 2024, 14. [CrossRef]
  18. Worth, A.J.; Basu, S.S.; Snyder, N.W.; Mesaros, C.; Blair, I.A. Inhibition of Neuronal Cell Mitochondrial Complex I with Rotenone Increases Lipid β-Oxidation, Supporting Acetyl-Coenzyme A Levels. J. Biol. Chem. 2014, 289, 26895–26903. [CrossRef]
  19. Ganguly, U.; Bir, A.; Chakrabarti, S. Cytotoxicity of mitochondrial Complex I inhibitor rotenone: A complex interplay of cell death pathways. Bioenerg. Commun. 2022, 2022, 14-14.
  20. Fu, X.; Zhan, Y.; Li, N.; Yu, D.; Gao, W.; Gu, Z.; Zhu, L.; Li, R.; Zhu, C. Enzymatic Preparation of Low-Molecular-Weight Laminaria japonica Polysaccharides and Evaluation of Its Effect on Modulating Intestinal Microbiota in High-Fat-Diet-Fed Mice. Front. Bioeng. Biotechnol. 2022, 9, 820892. [CrossRef]
  21. Jayawardena, T.U.; Nagahawatta, D.P.; Fernando, I.P.S.; Kim, Y.-T.; Kim, J.-S.; Kim, W.-S.; Lee, J.S.; Jeon, Y.-J. A Review on Fucoidan Structure, Extraction Techniques, and Its Role as an Immunomodulatory Agent. Mar. Drugs 2022, 20, 755. [CrossRef]
  22. Akter, A.; Alam Sobuj, M.K.; Islam, S.; Chakroborty, K.; Tasnim, N.; Ayon, M.H.; Hossain, F.; Rafiquzzaman, S. Seaweed polysaccharides: Sources, structure and biomedical applications with special emphasis on antiviral potentials. Futur. Foods 2024, 10. [CrossRef]
  23. Baltrusch, K.; Torres, M.D.; Domínguez, H. Characterization, ultrafiltration, depolymerization and gel formulation of ulvans extracted via a novel ultrasound-enzyme assisted method. Ultrason. Sonochemistry 2024, 111, 107072. [CrossRef]
  24. Barzkar, N.; Rungsardthong, V.; Jahromi, S.T.; Laraib, Q.; Das, R.; Babich, O.; Sukhikh, S. A recent update on fucoidonase: source, Isolation methods and its enzymatic activity. Front. Mar. Sci. 2023, 10. [CrossRef]
  25. Zhang, S.; Chen, L.; Shang, N.; Wu, K.; Liao, W. Recent Advances in the Structure, Extraction, and Biological Activity of Sargassum fusiforme Polysaccharides. Mar. Drugs 2025, 23, 98. [CrossRef]
  26. Movasaghi, Z.; Rehman, S.; Rehman, I.U. Fourier Transform Infrared (FTIR) Spectroscopy of Biological Tissues. Appl. Spectrosc. Rev. 2008, 43, 134–179. [CrossRef]
  27. Shao, P.; Pei, Y.P.; Fang, Z.X.; Sun, P.L. Effects of partial desulfation on antioxidant and inhibition of DLD cancer cell of Ulva fasciata polysaccharide. Int. J. Biol. Macromol. 2014, 65, 307–313. [CrossRef]
  28. Soto-Vásquez, M.R.; Alvarado-García, P.A.A.; Youssef, F.S.; Ashour, M.L.; Bogari, H.A.; Elhady, S.S. FTIR Characterization of Sulfated Polysaccharides Obtained from Macrocystis integrifolia Algae and Verification of Their Antiangiogenic and Immunomodulatory Potency In Vitro and In Vivo. Mar. Drugs 2022, 21, 36. [CrossRef]
  29. Palanisamy, S.; Vinosha, M.; Marudhupandi, T.; Rajasekar, P.; Prabhu, N.M. Isolation of fucoidan from Sargassum polycystum brown algae: Structural characterization, in vitro antioxidant and anticancer activity. Int. J. Biol. Macromol. 2017, 102, 405–412. [CrossRef]
  30. Chen, S.; Sathuvan, M.; Zhang, X.; Zhang, W.; Tang, S.; Liu, Y.; Cheong, K.-L. Characterization of polysaccharides from different species of brown seaweed using saccharide mapping and chromatographic analysis. BMC Chem. 2021, 15, 1–11. [CrossRef]
  31. Synytsya, A.; Bleha, R.; Synytsya, A.; Pohl, R.; Hayashi, K.; Yoshinaga, K.; Nakano, T.; Hayashi, T. Mekabu fucoidan: Structural complexity and defensive effects against avian influenza A viruses. Carbohydr. Polym. 2014, 111, 633–644. [CrossRef]
  32. Ammar, H.H.; Lajili, S.; Ben Said, R.; Le Cerf, D.; Bouraoui, A.; Majdoub, H. Physico-chemical characterization and pharmacological evaluation of sulfated polysaccharides from three species of Mediterranean brown algae of the genus Cystoseira. DARU J. Pharm. Sci. 2015, 23, 1–8. [CrossRef]
  33. Amin, M.N.G.; Mischnick, P.; Rosenau, T.; Böhmdorfer, S. Refined linkage analysis of the sulphated marine polysaccharide fucoidan of Cladosiphon okamuranus with a focus on fucose. Carbohydr. Polym. 2024, 342. [CrossRef]
  34. Vijayabaskar, P.; Vaseela, N.; Thirumaran, G. Potential antibacterial and antioxidant properties of a sulfated polysaccharide from the brown marine algae Sargassum swartzii. Chin. J. Nat. Med. 2012, 10, 421–428. [CrossRef]
  35. Immanuel, G.; Sivagnanavelmurugan, M.; Marudhupandi, T.; Radhakrishnan, S.; Palavesam, A. The effect of fucoidan from brown seaweed Sargassum wightii on WSSV resistance and immune activity in shrimp Penaeus monodon (Fab). Fish Shellfish. Immunol. 2012, 32, 551–564. [CrossRef]
  36. Mensah, E.O.; Kanwugu, O.N.; Panda, P.K.; Adadi, P. Marine fucoidans: Structural, extraction, biological activities and their applications in the food industry. Food Hydrocoll. 2023, 142. [CrossRef]
  37. Usoltseva, R.V.; Zueva, A.O.; Malyarenko, O.S.; Anastyuk, S.D.; Moiseenko, O.P.; Isakov, V.V.; Kusaykin, M.I.; Jia, A.; Ermakova, S.P. Structure and Metabolically Oriented Efficacy of Fucoidan from Brown Alga Sargassum muticum in the Model of Colony Formation of Melanoma and Breast Cancer Cells. Mar. Drugs 2023, 21, 486. [CrossRef]
  38. Castro-Riquelme, C.L.; Maldonado, E.A.L. Multifunctional Characterization of Fucoidan: Structural Insights and Efficient Removal of Toxic Metal Ions. J. Res. Updat. Polym. Sci. 2025, 14, 54–61. [CrossRef]
  39. Ohmes, J.; Mikkelsen, M.D.; Nguyen, T.T.; Tran, V.H.N.; Meier, S.; Nielsen, M.S.; Ding, M.; Seekamp, A.; Meyer, A.S.; Fuchs, S. Depolymerization of fucoidan with endo-fucoidanase changes bioactivity in processes relevant for bone regeneration. Carbohydr. Polym. 2022, 286, 119286. [CrossRef]
  40. Dhahri, M. Cystoseira myrica: from beach-cast seaweed to fucoidan with antioxidant and anticoagulant capacity. Front. Mar. Sci. 2023, 10, 1327408. [CrossRef]
  41. Sichert, A.; Le Gall, S.; Klau, L.J.; Laillet, B.; Rogniaux, H.; Aachmann, F.L.; Hehemann, J.-H. Ion-exchange purification and structural characterization of five sulfated fucoidans from brown algae. Glycobiology 2020, 31, 352–357. [CrossRef]
  42. Saravana, P.S.; Karuppusamy, S.; Rai, D.K.; Wanigasekara, J.; Curtin, J.; Tiwari, B.K. Elimination of Ethanol for the Production of Fucoidans from Brown Seaweeds: Characterization and Bioactivities. Mar. Drugs 2024, 22, 493. [CrossRef]
  43. Ferrante, L.; Rajpoot, K.; Jeeves, M.; Ludwig, C. Automated analysis for multiplet identification from ultra-high resolution 2D-1H, 13C-HSQC NMR spectra. Wellcome Open Res. 2023, 7, 262.
  44. Kirsten, N.; Ohmes, J.; Mikkelsen, M.D.; Nguyen, T.T.; Blümel, M.; Wang, F.; Tasdemir, D.; Seekamp, A.; Meyer, A.S.; Fuchs, S. Impact of Enzymatically Extracted High Molecular Weight Fucoidan on Lipopolysaccharide-Induced Endothelial Activation and Leukocyte Adhesion. Mar. Drugs 2023, 21, 339. [CrossRef]
  45. Yong, S.J.; Veerakumarasivam, A.; Teoh, S.L.; Lim, W.L.; Chew, J. Lactoferrin Protects Against Rotenone-Induced Toxicity in Dopaminergic SH-SY5Y Cells through the Modulation of Apoptotic-Associated Pathways. J. Mol. Neurosci. 2024, 74, 1–18. [CrossRef]
  46. Kaya, Z.B.; Santiago-Padilla, V.; Lim, M.; Boschen, S.L.; Atilla, P.; McLean, P.J. Optimizing SH-SY5Y cell culture: exploring the beneficial effects of an alternative media supplement on cell proliferation and viability. Sci. Rep. 2024, 14, 1–11. [CrossRef]
  47. Guo, D.; Liu, Z.; Zhou, J.; Ke, C.; Li, D. Significance of Programmed Cell Death Pathways in Neurodegenerative Diseases. Int. J. Mol. Sci. 2024, 25, 9947. [CrossRef]
  48. Han, X.; Han, B.; Zhao, Y.; Li, G.; Wang, T.; He, J.; Du, W.; Cao, X.; Gan, J.; Wang, Z.; et al. Rosmarinic Acid Attenuates Rotenone-Induced Neurotoxicity in SH-SY5Y Parkinson’s Disease Cell Model through Abl Inhibition. Nutrients 2022, 14, 3508. [CrossRef]
  49. Kent, A.C.; El Baradie, K.B.Y.; Hamrick, M.W. Targeting the Mitochondrial Permeability Transition Pore to Prevent Age-Associated Cell Damage and Neurodegeneration. Oxidative Med. Cell. Longev. 2021, 2021. [CrossRef]
  50. Bernardi, P.; Gerle, C.; Halestrap, A.P.; Jonas, E.A.; Karch, J.; Mnatsakanyan, N.; Pavlov, E.; Sheu, S.-S.; Soukas, A.A. Identity, structure, and function of the mitochondrial permeability transition pore: controversies, consensus, recent advances, and future directions. Cell Death Differ. 2023, 30, 1869–1885. [CrossRef]
  51. Gottschalk, B.; Koshenov, Z.; Malli, R.; Graier, W.F. Implications of mitochondrial membrane potential gradients on signaling and ATP production analyzed by correlative multi-parameter microscopy. Sci. Rep. 2024, 14, 1–12. [CrossRef]
  52. Dadsena, S.; Jenner, A.; García-Sáez, A.J. Mitochondrial outer membrane permeabilization at the single molecule level. Cell. Mol. Life Sci. 2021, 78, 3777–3790. [CrossRef]
  53. Vianello, C.; Bello, F.D.; Shin, S.H.; Schiavon, S.; Bean, C.; Rebelo, A.P.M.; Knedlík, T.; Esfahani, E.N.; Costiniti, V.; Lacruz, R.S.; et al. High-Throughput Microscopy Analysis of Mitochondrial Membrane Potential in 2D and 3D Models. Cells 2023, 12, 1089. [CrossRef]
  54. Huang, C.-Y.; Kuo, C.-H.; Chen, P.-W. Compressional-Puffing Pretreatment Enhances Neuroprotective Effects of Fucoidans from the Brown Seaweed Sargassum hemiphyllum on 6-Hydroxydopamine-Induced Apoptosis in SH-SY5Y Cells. Molecules 2017, 23, 78. [CrossRef]
  55. Mitra, S.; Rauf, A.; Sutradhar, H.; Sadaf, S.; Hossain, J.; Soma, M.A.; Bin Emran, T.; Ahmad, B.; Aljohani, A.S.; Al Abdulmonem, W.; et al. Potential candidates from marine and terrestrial resources targeting mitochondrial inhibition: Insights from the molecular approach. Comp. Biochem. Physiol. Part C: Toxicol. Pharmacol. 2022, 264, 109509. [CrossRef]
  56. Nguyen, T.T.; Wei, S.; Nguyen, T.H.; Jo, Y.; Zhang, Y.; Park, W.; Gariani, K.; Oh, C.-M.; Kim, H.H.; Ha, K.-T.; et al. Mitochondria-associated programmed cell death as a therapeutic target for age-related disease. Exp. Mol. Med. 2023, 55, 1595–1619. [CrossRef]
  57. Nguyen, T.T.M.; Gillet, G.; Popgeorgiev, N. Caspases in the Developing Central Nervous System: Apoptosis and Beyond. Front. Cell Dev. Biol. 2021, 9, 702404. [CrossRef]
  58. Araya, L.E.; Soni, I.V.; Hardy, J.A.; Julien, O. Deorphanizing Caspase-3 and Caspase-9 Substrates In and Out of Apoptosis with Deep Substrate Profiling. ACS Chem. Biol. 2021, 16, 2280–2296. [CrossRef]
  59. Yang, W.-N.; Chen, P.-W.; Huang, C.-Y. Compositional Characteristics and In Vitro Evaluations of Antioxidant and Neuroprotective Properties of Crude Extracts of Fucoidan Prepared from Compressional Puffing-Pretreated Sargassum crassifolium. Mar. Drugs 2017, 15, 183. [CrossRef]
  60. Costigan, A.; Hollville, E.; Martin, S.J. Discriminating Between Apoptosis, Necrosis, Necroptosis, and Ferroptosis by Microscopy and Flow Cytometry. Curr. Protoc. 2023, 3, e951. [CrossRef]
  61. Olivares-Molina, A.; Fernández, K. Comparison of different extraction techniques for obtaining extracts from brown seaweeds and their potential effects as angiotensin I-converting enzyme (ACE) inhibitors. J. Appl. Phycol. 2016, 28, 1295–1302. [CrossRef]
Figure 1. FTIR spectra of Dur-I, Dur-II, and Dur-III, highlighting absorption bands at 3401, 2940, 1621, 1421, 1230, 1055, 900, 820, and 620 cm⁻¹. .
Preprints 191591 g001
Figure 2. (A) SH-SY5Y cells treated with different concentrations of Dur-I, Dur-II, and Dur-III (0, 25, 50, 75, 100, and 200 μg/mL) for 48 h; (B) SH-SY5Y cells treated with different concentrations of Dur-I, Dur-II, and Dur-III (0, 25, 50, 100, and 200 μg/mL) for 24 h prior to the addition of Rot (rotenone) 50 μM to the culture medium for 24 h, and the cell viability was assessed by the MTT assay.
Preprints 191591 g002
Figure 3. Effects of Dur-I, Dur-II, and Dur-III, as well as rotenone (Rot) with or without pretreatment using these hydrolysates, on the cell cycle distribution of SH-SY5Y cells. (A) SH-SY5Y cells were exposed to Dur-I, Dur-II, or Dur-III (200 μg/mL) for 48 h, followed by cell cycle analysis. (B) The bar chart summarizes data from three independent flow cytometry assays, presenting the percentages of cells in the sub-G1, G0/G1, S, and G2/M phases for each treatment, analyzed using BD Accuri C6 software. (C) SH-SY5Y cells were pretreated with Dur-I, Dur-II, or Dur-III (200 μg/mL) for 24 h and then treated with Rot (50 μM) for an additional 24 h before cell cycle evaluation. (D) The corresponding bar chart presents results from three independent experiments, showing phase distribution under each condition, analyzed with BD Accuri C6 software. Data are expressed as mean ± SD (n = 3). For each cell cycle phase, bars marked with the same letter do not differ significantly (p < 0.05). .
Preprints 191591 g003aPreprints 191591 g003b
Figure 4. Effects of Rot treatment, with or without Dur-I, Dur-II, or Dur-III pretreatment, on annexin V-FITC/PI-labeled SH-SY5Y cells. (A) SH-SY5Y cells were pretreated with Dur-I, Dur-II, or Dur-III (200 μg/mL) for 24 h, followed by exposure to Rot (50 μM) for an additional 24 h. Annexin V-FITC/PI fluorescence patterns were then evaluated. (B) The accompanying bar graph shows the proportions of viable, early apoptotic, late apoptotic, and necrotic cells, based on three independent flow cytometry experiments analyzed using BD Accuri C6 software. Data are presented as mean ± SD (n = 3). Bars labeled with different letters differ significantly at p < 0.05.
Preprints 191591 g004
Table 1. Hydrolysis conditions and extraction yields of the enzymatically produced hydrolysates (Dur-I, Dur-II, and Dur-III) derived from D. antarctica.
Variables of Hydrolysis Dur-I Dur-II Dur-III
Variables for extrusion-pretreatment Feed moisture content: 35%, feed rate: 10.4 kg/h, barrel temperature: 115 °C, screw speed: 360 rpm, rounded die with 5 mm opening
Enzymes Viscozyme Cellulase α-Amylase
Hydrolysis conditions pH 6.0, 40 °C, 17 h pH 6.0, 40 °C, 17 h pH 6.0, 40 °C, 17 h
Extraction yield Dur-I Dur-II Dur-III
Extraction yield (%) 41.3±2.3 1, a 45.5±3.0 a 44.2±0.8 a
1 Values are presented as mean ± SD (n = 3). Different letters within the same row indicate significant differences at p < 0.05.
Table 2. Physicochemical analyses for Dur-I, Dur-II, and Dur-III.
Molecular weight Dur-I Dur-II Dur-III
Peak 1 (MW (kDa) / Peak area (%)) 201.4/ 96.8 213.5/ 99.9 170.5 /46.7
Peak 2 (MW (kDa) / Peak area (%)) 10.9 /3.2 15.6 / 0.1 3.68 / 54.3
Chemical composition Dur-I Dur-II Dur-III
Total sugar (%) 1 43.8 ± 0.2 b 36.9 ± 0.4 a 73.7 ± 0.3 c
Fucose (%) 1 14.6 ± 0.5 a 15.8 ± 0.5 b 22.5 ± 0.5 c
Sulfate (%) 1 38.1 ± 0.0 b 41.9 ± 0.0 c 25.6 ± 0.0 a
Uronic acid (%) 1 15.6 ± 0.2 a 15.6 ± 0.3 a 18.2 ± 0.4 b
Alginic acid (%) 1 4.54 ± 0.15 a 4.59 ± 0.70 a 6.78 ± 0.56 b
Polyphenols (%) 1 0.39 ± 0.02 a 0.33 ± 0.00 a 0.36 ± 0.06 a
Proteins (%) 1 0.93 ± 0.03 a 1.13 ± 0.05 c 1.03 ± 0.00 b
Monosaccharide composition (molar ratio) Dur-I Dur-II Dur-III
Fucose 1 1 1
Rhamnose 2.08 1.85 1.56
Glucuronic acid 0.06 0.06 0.04
Galacturonic acid 0.32 0.03 0.30
Glucose 0.01 1.10 0.95
Galactose 0.02 0.01 0.00
Xylose 0.17 0.10 0.18
1 The percentage of total sugars, fucose, sulfate, uronic acid, alginic acid, polyphenols, and protein were calculated as (g per g of dry sample) × 100. Values are expressed as mean ± SD (n = 3). Different letters within a row (a, b, c) indicate significant differences at p < 0.05.
Table 3. Expressions of mitochondria-dependent apoptotic factors in Rot-, Dur-I-, Dur-II-, and Dur-III-treated SH-SY5Y cells.
Factors Control Rot Dur-I+Rot Dur-II+Rot Dur-III+Rot
Low mitochondrial membrane potential (%) 1 9.43 ± 0.12 a 27.2 ± 0.2 c 20.0 ± 0.4 b 19.6 ± 0.5 b 19.8 ± 0.1 b
Level of Bcl-2 (%) 1 87.7 ± 0.6 e 65.2 ± 0.7 a 69.3 ± 0.3 b 73.5 ± 0.4 d 71.4 ± 0.4 c
Release of cytochrome c (%) 1 55.6 ± 1.2 e 19.2 ± 0.5 a 39.3 ± 2.2 c 50.2 ± 0.9 d 35.9 ± 2.0 b
Caspase-9 activity (%) 1 31.3 ± 0.2 a 63.8 ± 0.7 d 49.6 ± 0.5 b 51.4 ± 1.2 c 50.7 ± 0.1 bc
Caspase-8 activity (%) 1 35.8 ± 0.9 a 67.5 ± 2.3 d 51.6 ± 0.4 b 37.7 ± 1.1 a 61.9 ± 0.7 c
Caspase-3 activity (%) 1 32.0 ± 0.1 a 67.3 ± 0.6 d 50.8 ± 0.5 b 54.1 ± 1.2 c 52.0 ± 0.1 b
DNA fragmentation (%) 1 43.0 ± 0.4 a 69.2 ± 0.6 e 59.2 ± 3.1 c 63.0 ± 0.6 d 48.6 ± 0.9 b
1 All experiments were conducted in triplicate. Different letters within the same row indicate significant differences at p < 0.05.
Disclaimer/Publisher’s Note: The statements, opinions and data contained in all publications are solely those of the individual author(s) and contributor(s) and not of MDPI and/or the editor(s). MDPI and/or the editor(s) disclaim responsibility for any injury to people or property resulting from any ideas, methods, instructions or products referred to in the content.
Copyright: This open access article is published under a Creative Commons CC BY 4.0 license, which permit the free download, distribution, and reuse, provided that the author and preprint are cited in any reuse.
Prerpints.org logo

Preprints.org is a free preprint server supported by MDPI in Basel, Switzerland.

Subscribe

Disclaimer

Terms of Use

Privacy Policy

Privacy Settings

© 2026 MDPI (Basel, Switzerland) unless otherwise stated