
Submitted:
25 December 2025
Posted:
26 December 2025
You are already at the latest version
Abstract
Traditional ChIP-seq analysis is essential for identifying transcription factor (TF) binding sites, but it is constrained by its linear view of the genome. How TF-bound regions interact with distant genomic loci within the three-dimensional (3D) chromatin architecture often remains unclear, limiting our ability to interpret enhancer-promoter communication and long-range gene regulation. To address these limitations, we developed ChIP-SP, an R package that integrates ChIP-seq data with Hi-C chromatin loop interactions, enabling the study of TF-mediated regulatory regions within a 3D genomic context. In this study, we evaluated ChIP-SP using the androgen receptor (AR) as a model TF in LNCaP prostate cancer cells. By focusing on AR ChIP-seq peaks that participate in chromatin looping and examining a 25 kb radius around each peak in 3D genomic space, ChIP-SP identified 1,499 AR-spatially regulated genes, and many of them were confirmed to be androgen-responsive. We similarly applied ChIP-SP to glucocorticoid receptor (GR) ChIP-seq data in A549 lung cancer cells and successfully identified GR-spatially regulated genes. These results demonstrate that ChIP-SP extends traditional ChIP-seq annotation into a multidimensional framework and enables the construction of a spatial cistrome for transcription factors. The tool is flexible, customizable, and holds strong potential for uncovering novel regulatory target genes, particularly in cancer biology.
Keywords:
ChIP-SP
; three-dimensional genome organization
; chromatin looping
; transcription factor
; androgen receptor
; glucocorticoid receptor
1. Introduction
The new high-throughput sequencing technologies have revolutionized our understanding of biological systems at various molecular levels. Genomics, transcriptomics, proteomics, metabolomics, and other omics data have provided comprehensive insights into the complicated interactions in human health and diseases [1,2]. Transcriptional regulation is the fundamental process that controls gene expression, and transcription factors (TFs) binding to its recognized DNA sequences is essential to initiate transcription through RNA polymerase II recruitment [3,4,5]. This process can be regulated by various factors including cell upstream signaling, chromatin accessibility, epigenetic modifications, and three-dimensional chromatin structure [6,7,8,9]. Chromatin immunoprecipitation sequencing (ChIP-seq) [10,11] is a powerful technique used to study TF chromatin binding and its downstream target genes, and it has advanced our understanding of TF-promoter interaction and gene regulation [12]. However, ChIP-seq has limitations, for instance, sequencing is commonly generated using short read platforms and the results are then processed with quality controls, adaptor trimming, alignment, and duplicates removal. The aligned segments are read by MACS which uses the dynamic Poisson distribution to capture the local differences against control experiments [13]. The traditional peak calling for ChIP-seq experiment with MACS calculation is limited to the upstream and downstream sequence coverage in 2 dimensions. Although users can personally adjust the coverage range of the peak in the ChIPpeakAnno [14], the chromatin-chromatin interactions formed by looping are not predictable for specific genomic loci. This limitation becomes more pronounced when enhancers and promoters have long-distance contacts.
TFs regulate gene expression by binding to enhancer and promoter elements and promoting enhancer-promoter communication through chromatin looping, which is critical for transcriptional activation. Chromatin loop boundaries stabilize these interactions and enrich transcriptional activation signals, such as chromatin remodelers and histone-modifying enzymes, many through liquid-liquid phase separation, creating a mutually conducive environment for transcription[15,16,17]. Chromatin architecture shapes the local transcriptional landscape by organizing the genome into topologically associated domains (TADs) that facilitate or restrict gene expression. Previous studies have demonstrated that TADs are closely linked to gene regulation, serving as structural units that influence enhancer-promoter interactions and transcriptional activity[18,19,20]. Because mapping the three-dimensional organization of chromatin using chromatin conformation capture (3C) or high-throughput chromatin conformation capture (Hi-C) provides information on genome spatial organization[21,22,23,24], we believe that the integration of TF binding with features such as chromatin architecture, hierarchical chromosomal structures, TADs, and long-range chromatin interactions could improve annotation accuracy and offer a more comprehensive understanding of gene regulation in three dimensions.
To address this, we developed a bioinformatics tool named ChIP-SP and tested it using the androgen receptor (AR) and glucocorticoid receptor (GR) as the model TFs. AR ChIP-seq and Hi-C data were generated in LNCaP prostate cancer cells. In addition, publicly available GR ChIP-seq, Hi-C, and RNA-seq datasets from A549 cells were analyzed. These datasets were integrated to identify chromatin loops and genes spatially regulated by these TFs. This study demonstrates that ChIP-SP extends ChIP-seq annotation into a multi-dimensional framework, enabling the construction of the spatial cistrome of TFs.
2. Materials and Methods
2.1. Cell Lines and Culture
LNCaP cells were cultured in RPMI 1640 medium (Gibco, Thermo Fisher Scientific, Waltham, MA, USA) supplemented with 10% fetal bovine serum (FBS; Gibco, Thermo Fisher Scientific) and 1% penicillin-streptomycin. For hormone treatment, LNCaP cells were cultured in medium containing charcoal-stripped FBS for 24 h, followed by treatment with 1 nM R1881, 10 µM darolutamide, or vehicle control (dimethyl sulfoxide, DMSO) for an additional 24 h prior to harvest. A549 cells were cultured in Dulbecco’s Modified Eagle Medium (DMEM; Gibco) supplemented with 10% FBS and 1% penicillin-streptomycin. For hormone treatment, A549 cells were treated with 100 nM dexamethasone for 0 or 4 h prior to harvest. All cells were maintained at 37 °C in a humidified incubator with 5% CO2. Mycoplasma contamination testing was performed every six months.
2.2. Hi-C and ChIP-Seq Data Generation and Processing
Hi-C libraries were prepared using the Arima Genomics Hi-C kit and sequenced on an Illumina platform. Both Juicer-Hi-C and Run-Hi-C were used for the chimeric sequencing alignment and interaction matrix generations [25] (https://pypi.org/project/runHiC/). Juicer-Hi-C generates a .hic file while run-hic generates a mcool file. These files were used in the Mustache loop calling algorithm [26]. The loop calling results were stored in folders with the suffix “HiC.xls”. The ChIP-seq data were directly downloaded from GEO, and the bam file was used for MACS2 peak calling. The raw Hi-C contact matrices were normalized under the Juicer pipeline with VC_SQRT normalization (square root of vanilla coverage) [25]. All the Hi-C data were visualized by WashU Epigenome Browser [27]. In parallel, ChIP-seq reads were aligned to the human reference genome (hg38) using Bowtie2. Transcription factor binding sites were identified with MACS2, which generated BED files containing genomic coordinates and statistical confidence values for each peak. These peak calls provided the set of high-confidence transcription factor binding sites used for integration with Hi-C data.
2.3. Ranking the Output of Hypothetical Peaks Using Confident Score
The output from MACS2 is a BED file with Peak pileup values, fold enrichment and p values. Some of the data missed p value and fold enrichment in the database. The most common output statistics from Mustache is the FDR which indicates the significance of the loop called.
Here we calculate the confident score (Score) based on pileup values and FDR values with the following formula:
2.4. ChIP-SP Integration Workflow
ChIP-SP integrates ChIP-seq peaks with Hi-C chromatin loops by identifying peaks that overlap one loop anchor and assigning the partner anchor as a spatially linked regulatory region. Because Hi-C does not resolve precise contact points, the full interacting bins (BIN1 and BIN2) are considered potential sites of TF influence. ChIP-SP outputs BED files of spatially associated regions and hypothetical TF effect sites, which were used for downstream genomic annotation, visualization of chromatin interactions, and integration with RNA-seq data.
2.5. GitHub Link and R Package Installation
remotes::install_github("Lattesnow/ChIP_SP")
2.6. User Instructions
After processing the Hi-C and ChIP-seq data using the software outlined in Figure 2D, ensure that the ChIP-seq from MACS2 and Hi-C data files from Mustache are labeled as *ChIP.xls and *Hi-C.xls, respectively, and saved in the same directory. Then run Step1_concatenate_multiple_excels.R which merges all the Hi-C outputs including the loop calling at the different resolutions from different replicated Hi-C experiments (Users may alternatively run the mergeHiCLoops() function provided by the ChIPSP package in R). Run the Step2_ChIP_SP_R_RankingScore.R code within this directory (Or run chipSPLink() provided by the ChIPSP package). The output will be an Excel table in BED format, which can be directly utilized for downstream ChIP-seq annotation analysis (Step3_ChIP_SP_Gene_annotation_ChIPpeakAnno_ UCSC. R [14] and Step4_ChIP_SP_Gene_annotation_Pathwayanalysis_UCSC.R). To visualize the output of KEGG and ChEA, we first input our genes in https://maayanlab.cloud/Enrichr/ and run the output from enrichR with Step5_ChIP_SP_Gene_annotation_KEGG_ChEA_UCSC. R [28]. Then use package clusterGVis (https://github.com/junjunlab/ClusterGVis) to draw the heatmap with the input data from bulk RNA-seq (Step5_ClusterGVis_ChIP_SP_Loop.R).
2.7. RT-qPCR Assay
Following treatment, total RNA was extracted using the RNeasy Plus Mini Kit (Qiagen, Hilden, Germany; Cat# 74034) and quantified using a Synergy Neo2 microplate reader (BioTek Instruments, Winooski, VT, USA). For each sample, 1 µg of total RNA was reverse transcribed using the iScript cDNA Synthesis Kit (Bio-Rad Laboratories, Hercules, CA, USA). The resulting cDNA was used for quantitative PCR analysis with PerfeCTa SYBR Green SuperMix (QuantaBio, Beverly, MA, USA; Cat# 95113-012) on an ABI 7500 Fast Real-Time PCR System (Applied Biosystems, Foster City, CA, USA). Relative expression levels of target genes were normalized to the internal control gene β-actin. Primers were synthesized by Sigma-Aldrich (St. Louis, MO, USA), and primer sequences are listed in Table S1.
3. Results
3.1. ChIP-SP Working Model and Workflow
Chromatin is organized into three-dimensional loop structures, yet conventional ChIP-seq annotation relies on linear genomic proximity and does not account for chromatin interactions, limiting accurate identification of transcription factor (TF) target genes. As a result, distally regulated genes, including those separated by large genomic distances or located on different chromosomes, are often missed. Chromatin looping can bring such distal genes into close spatial proximity with TF binding sites through interactions mediated by TFs, coactivators, cohesin, or intrinsic chromatin architecture (Figure 1A). In this scenario, genes that are far away in linear distance may be still spatially close to the TF binding sites and potentially influenced by TF activity.
To identify these spatial regulatory effects that cannot be captured by ChIP-seq alone, we integrate chromatin structure data with TF binding peaks and define “hypothetical TF effect sites” as genomic regions that show robust spatial interactions with a TF-bound locus (Figure 1A). These sites reflect interaction probabilities measured by Hi-C, which represent population-averaged chromatin contacts rather than fixed structures in individual cells. Incorporating these spatial interaction patterns enables more accurate annotation of TF-regulated genes in a three-dimensional context. We refer to this integrative analysis as “ChIP-SP”, with the goal of overcoming the limitations of linear annotation and improving the identification of TF-regulated genes.
Figure 1B lists the workflow of ChIP-SP. Hi-C was performed and the data were processed with Juicer or Run-Hi-C for alignment [25]. The alignment output was further analyzed with Mustache, a loop-calling software that generates chromatin interaction files containing start and end coordinates for each interaction. Simultaneously, ChIP-seq data were processed using Bowtie2 for alignment and MACS2 for peak calling, which produced a BED file listing the chromosome, start, and end coordinates of the peaks. ChIP-SP integrates these data by identifying ChIP-seq peaks within chromatin interaction regions and mapping them to corresponding regions identified in the Hi-C data. This process produces a set of “hypothetical TF effect sites” that represent distal genomic regions brought into proximity with TF-bound loci through chromatin folding. Because Hi-C does not define the precise nucleotide-level contact point, ChIP-SP maps TF association to the full interaction bins, ensuring that spatially relevant regulatory regions are retained.
This integration enabled ChIP-SP to systematically capture both proximal and distal TF-associated regions. By linking ChIP-seq peaks to loop-connected genomic loci, the pipeline identifies candidate regulatory targets that traditional linear annotation would overlook. The resulting BED files produced by ChIP-SP serve as the basis for downstream analyses, including genomic annotation, visualization, and integration with transcriptomic changes.
3.2. ChIP-SP Enhances Three-Dimensional Annotation for AR ChIP-Seq
To evaluate ChIP-SP, we used our sequencing datasets from hormone-responsive LNCaP prostate cancer cells treated with vehicle (DMSO), synthetic androgen receptor (AR) agonist R1881, or the AR antagonist darolutamide (Daro) [29]. This model provides well-characterized AR-dependent transcriptional responses and chromatin looping dynamics, making it suitable for assessing whether ChIP-SP can identify spatially regulated AR target genes. Hi-C data (GEO: GSE269644) enabled construction of chromatin interaction maps, AR ChIP-seq (GSE249435) defined AR binding sites, and RNA-seq (GSE249436) was used to determine whether genes identified by ChIP-SP showed corresponding androgen-responsive transcriptional changes.
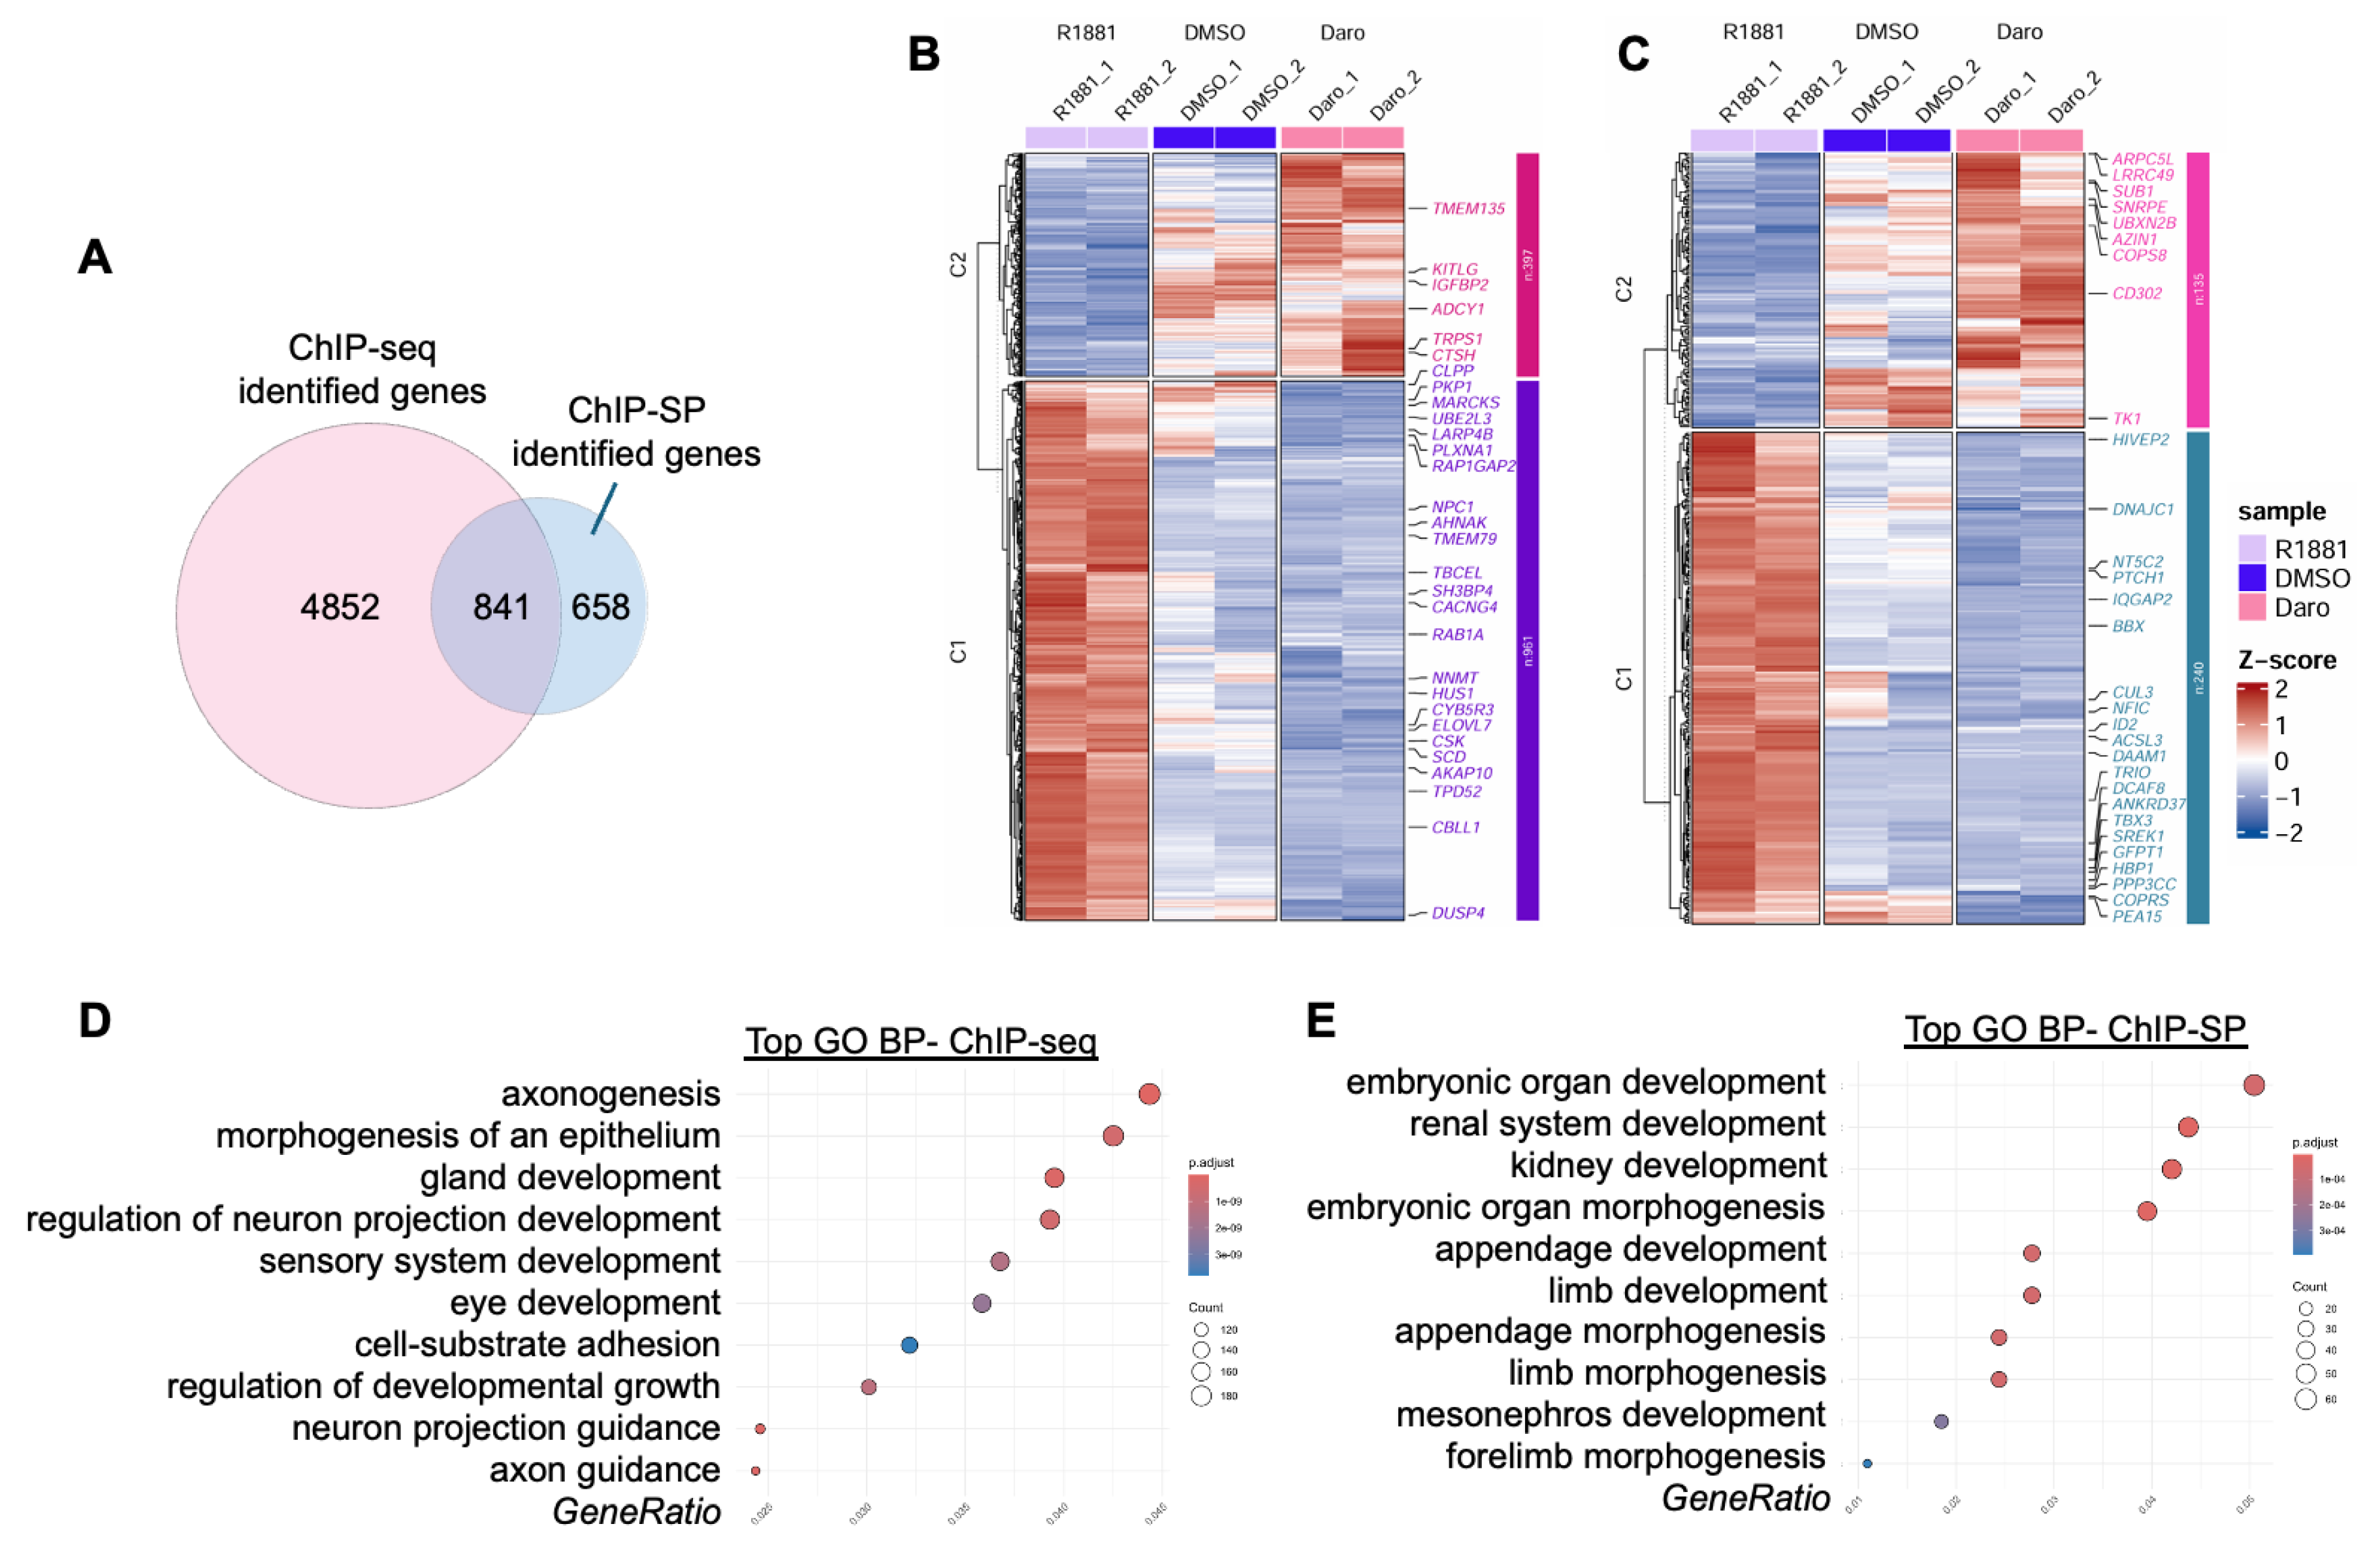
Using the AR ChIP-seq dataset, we first performed traditional linear annotation by assigning AR binding sites to genes within 5 kb upstream or downstream of each peak, identifying 5,693 AR-associated genes in LNCaP cells. We then applied ChIP-SP to determine whether spatially regulated AR targets could be detected beyond those identified by linear proximity. Hi-C data from R1881-treated LNCaP cells were processed with Juicer and Mustache at 5 kb, 10 kb, and 25 kb resolutions, yielding 11,223, 10,938, and 3,761 chromatin loops, respectively. Integration of chromatin loop architecture with AR ChIP-seq binding profiles revealed 1,998 AR-chromatin interaction zones, spanning 3,823 chromatin loci, which were subsequently associated with 1,499 candidate spatially associated AR target genes (Table S2). Comparison between approaches showed that 841 genes were shared, while 658 genes were uniquely identified by ChIP-SP, suggesting that these spatially regulated genes would likely be missed by traditional annotation despite potential functional importance.
To evaluate the biological relevance of these spatially associated genes, we analyzed RNA-seq expression changes and found that 375 of them were upregulated upon R1881 treatment. Pathway analysis revealed that genes identified by traditional ChIP-seq were enriched in neuronal projection, axon guidance, and cell-substrate adhesion pathways, which have been reported as part of AR-dependent epithelial organization, cell polarity, and tumor-microenvironment interactions in prostate cancer rather than true neuronal lineage commitment [30]. These pathways likely reflect cis-regulatory AR activity that supports differentiated luminal epithelial functions.
In contrast, AR spatially regulated genes identified by ChIP-SP are enriched in embryonic organ and renal developmental pathways. In prostate cancer cells, this may reflect a reuse of developmental transcriptional modules to maintain tissue-specific identity and function. AR is known to rely heavily on distal enhancers and super-enhancers to sustain lineage-defining transcriptional programs in prostate cancer [31,32], and such long-range regulation is consistent with chromatin looping-mediated control revealed by ChIP-SP.
Figure 2.
Distinct transcriptional and functional profiles of AR directly and spatially regulated genes. (A) Venn diagram showing the overlap between genes identified by AR ChIP-seq (direct AR binding) and those identified by ChIP-SP (spatial AR regulation). Numbers indicate the total genes uniquely or commonly identified by each approach. (B) Heatmap of RNA-seq expression profiles for genes identified by AR ChIP-seq across R1881-, DMSO-, and darolutamide-treated conditions. Genes are hierarchically clustered, and expression values are shown as Z-scores. Representative genes from each cluster are indicated. (C) Heatmap of RNA-seq expression profiles for AR spatially regulated genes identified by ChIP-SP under the same treatment conditions. (D-E) Gene Ontology (GO) enrichment analysis of AR directly regulated genes (D) and AR spatially regulated genes (E). Bubble plots display significantly enriched biological processes.
We performed ChIP-X enrichment analysis (ChEA-ChIP) to compare the transcriptional regulatory landscapes associated with AR target genes identified by conventional ChIP-seq and by ChIP-SP. Both gene sets showed strong enrichment for AR ChIP-seq signatures, confirming AR dependence (Figure S2); however, ChIP-seq targets were primarily associated with AR-centric regulators such as PIAS1 and FOXM1, whereas ChIP-SP-defined spatially regulated genes were enriched for a broader set of regulators, including SMAD2/3, P300, and SMARCA4. These results suggest that spatial AR regulation occurs within more complex chromatin environments that integrate multiple transcriptional and chromatin-remodeling inputs, further demonstrating the additional regulatory information captured by ChIP-SP.
3.3. ChIP-SP Reveals Spatial Regulation of Specific AR Target Genes
Next, we examined spatially regulated AR target genes in more detail. KRT8 is an androgen-responsive gene, although no direct AR binding has been previously detected at its promoter [33]. KRT8 encodes a cytokeratin expressed in luminal epithelial cells of the prostate and is widely used as a marker of luminal differentiation in prostate cancer [34]. ChIP-SP analysis revealed AR binding at the boundary of a TAD that is detected in both vehicle and R1881-treated LNCaP cells. The KRT8 gene is positioned at the opposite boundary of the loop, and its promoter is spatially proximal to a strong AR binding site located approximately 900 kb away, supporting long-range AR-mediated regulation (Figure 3A).
We next investigated MAF, a gene implicated in prostate cancer progression that is strongly induced by androgen exposure but lacks detectable AR binding at its promoter. AR ChIP-seq identified a robust androgen-responsive binding site near a TAD boundary that exhibited marked signal enhancement following R1881 treatment (Figure 3B). Again, the MAF gene locates on the opposite side of this boundary, suggesting that chromatin looping brings AR into proximity to the MAF locus to enable transcriptional activation through three-dimensional genome organization.
Figure 3C summarizes the chromatin loops associated with the KRT8 and MAF loci. We further validated the expression of KRT8 and MAF by RT-qPCR, which showed that both genes were upregulated following R1881 treatment (Figure 3D). These results provide additional support that KRT8 and MAF are regulated through AR-mediated spatial interactions across chromatin loop boundaries.
A similar regulatory pattern was observed at the loci of N-myc downregulated gene-1 (NDRG1) and ERBB receptor feedback inhibitor 1 (ERRFI1). Androgen-responsive AR binding sites were identified at regions located over 100 kb (NDRG1) and 200 kb (ERRFI1) upstream of their respective promoter regions. RNA-seq analysis (Table S3) and RT-qPCR (Figs. S2C-D) both revealed that both NDRG1 and ERRFI1 exhibit solid transcriptional responses to R1881 treatment. These findings support the notion that both genes are distally regulated by AR through long-range chromatin interactions, as illustrated in Figure S2A and Figure S2B.
NDRG1 has been associated with poor prognosis in prostate cancer and has been shown to inhibit AR function through multiple mechanisms, including upregulation of c-Jun, downregulation of c-Jun phosphorylation, suppression of PI3K/AKT signaling, and enhanced association between AR and HSP90 [35]. ERRFI1, initially characterized as an ERBB signaling inhibitor, has more recently been implicated in prostate cancer progression, where it appears to suppress cell senescence induced by supraphysiological androgen levels (SAL) [36].
3.4. Validation of Glucocorticoid Receptor Spatial Regulation Using ChIP-SP in A549 Cells
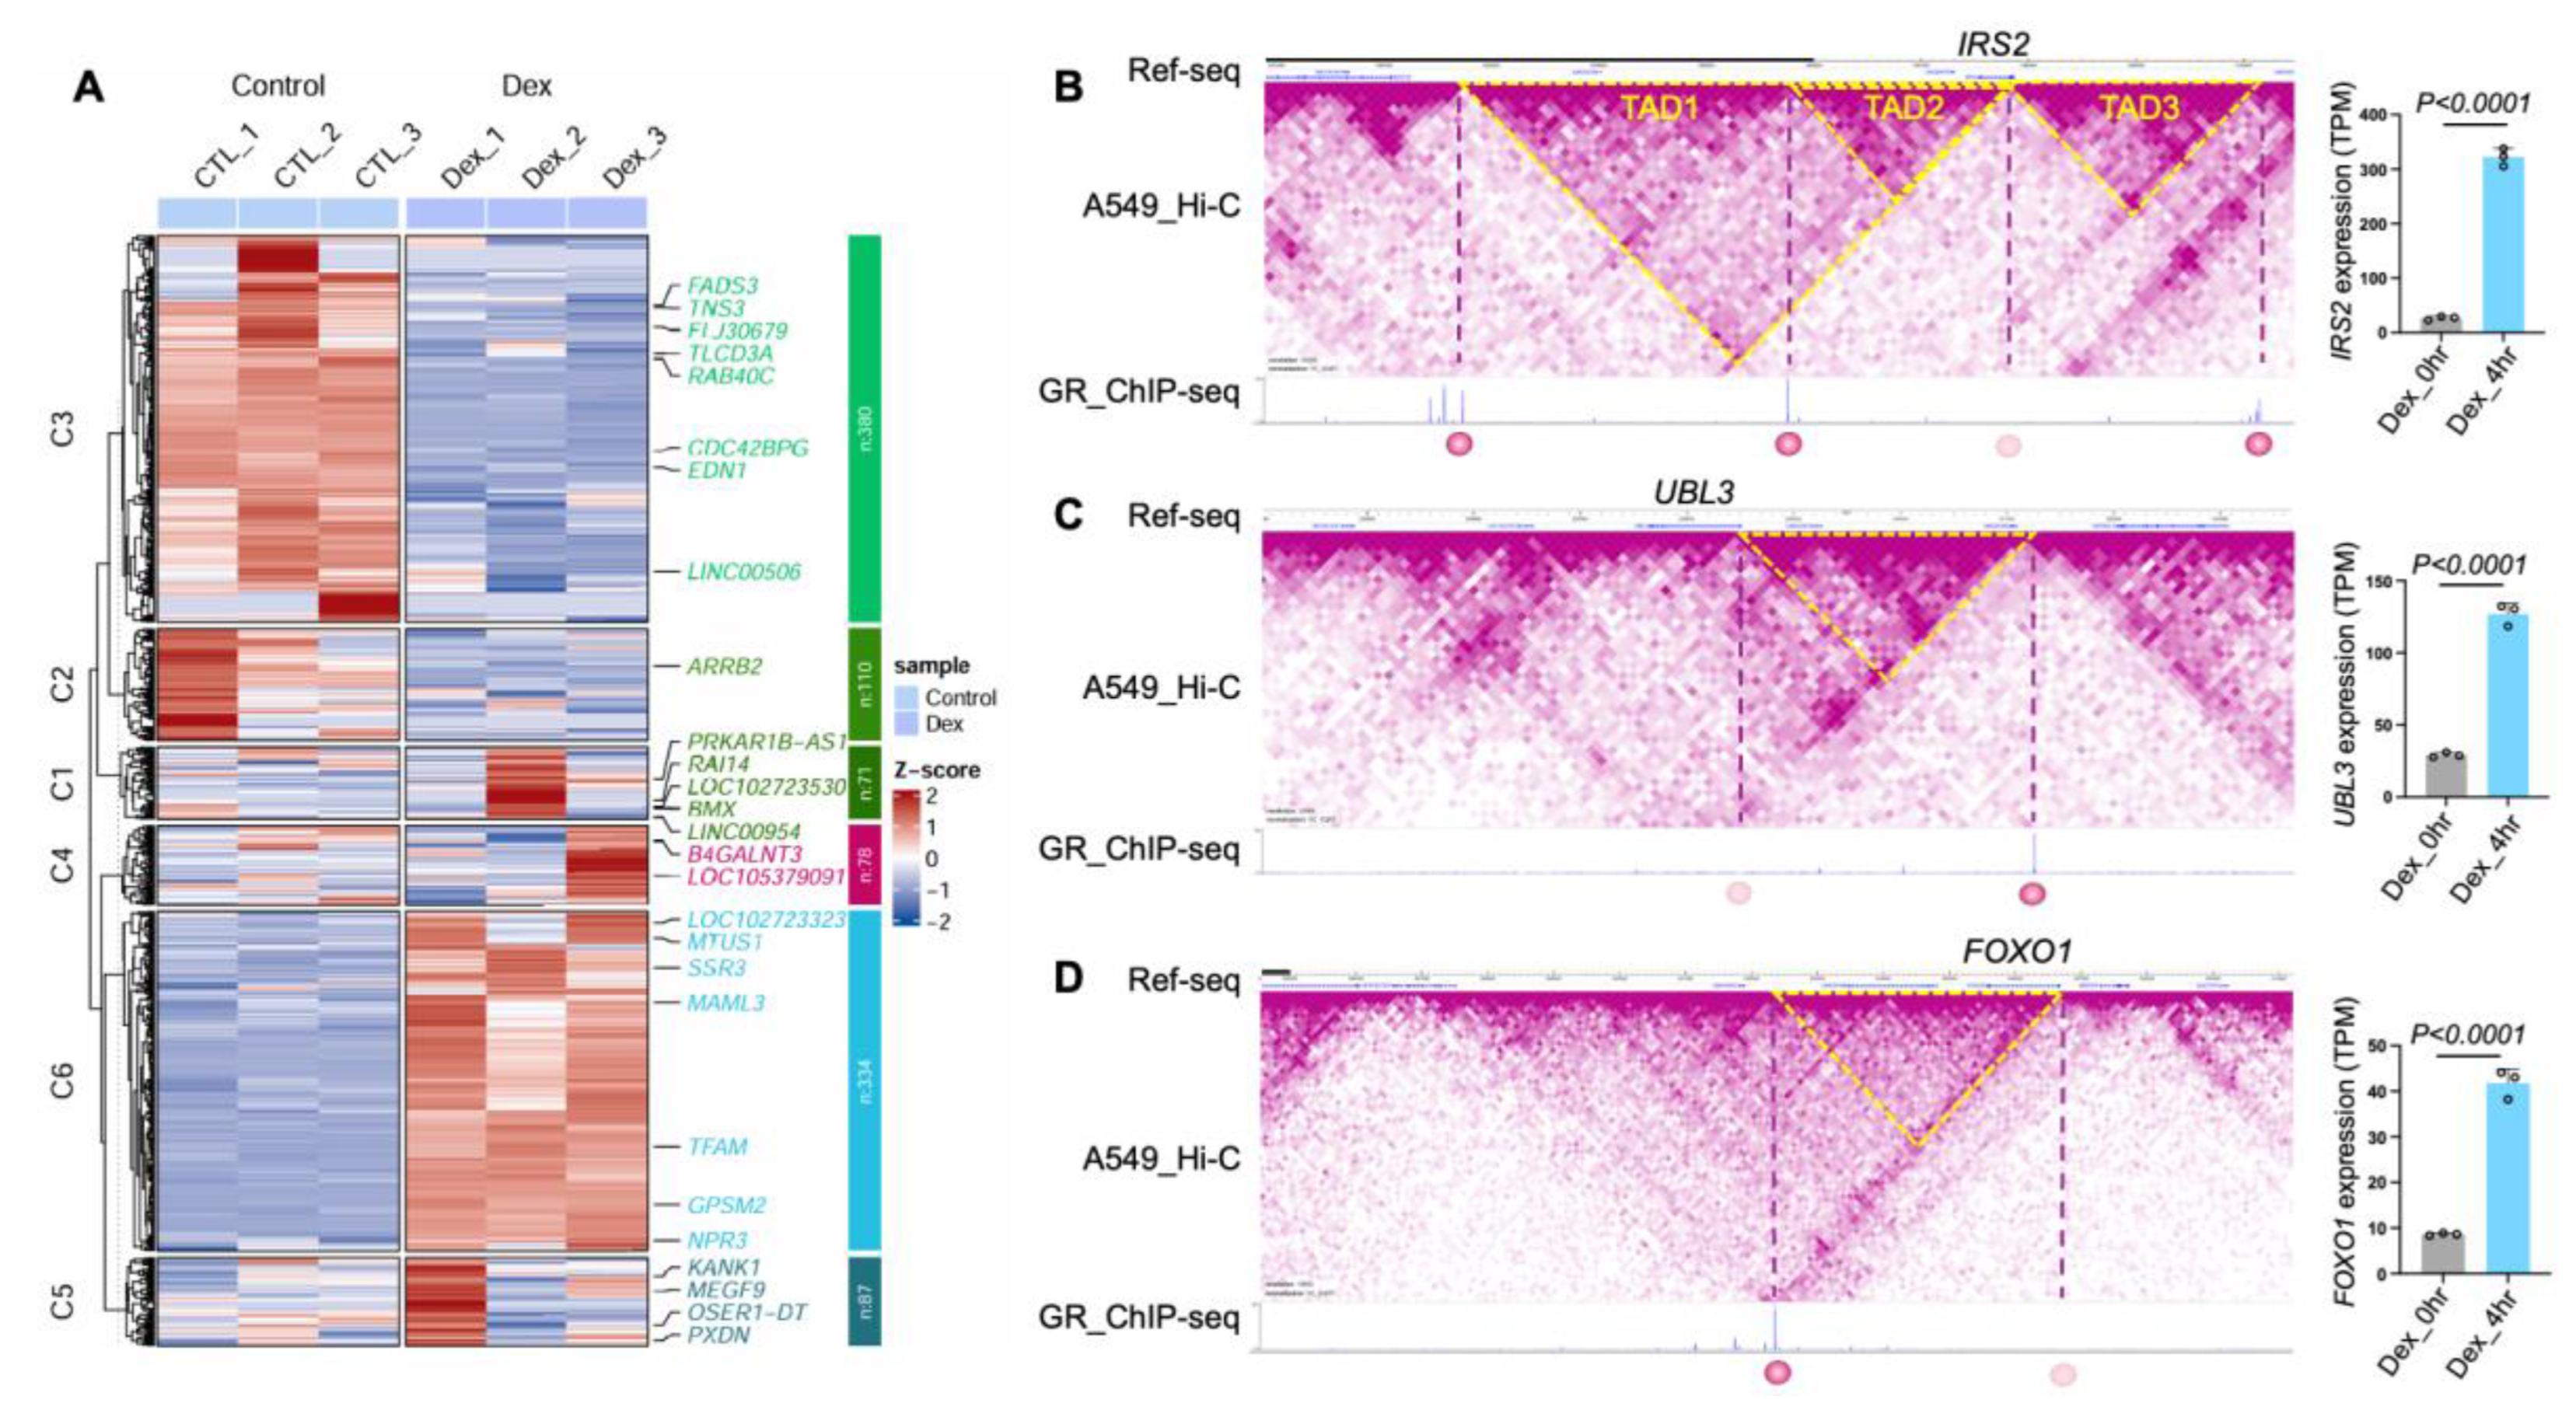
After validating ChIP-SP with our lab-generated data, we applied it to publicly available genomic datasets to evaluate its broader applicability. We analyzed high-quality Hi-C, ChIP-seq, and RNA-seq datasets on GR signaling from Dr. Tim Reddy’s lab, which provide a well-controlled system for assessing ligand-dependent GR transcriptional regulation. In these experiments, A549 cells were treated with 100 nM dexamethasone for 0 or 4 hours, followed by Hi-C (GSE92804) and GR ChIP-seq (GSE91313) analyses. Hi-C data were processed using the Mustache loop-calling algorithm. Corresponding RNA-seq datasets (GSE177887 and GSE91243), generated after 0- or 4-hour treatment with 100 nM dexamethasone, were used to assess transcriptional changes [37].
ChIP-SP analysis revealed genes regulated by GR through long-range chromatin interactions. The majority of genes identified by ChIP-SP were differentially expressed in the RNA-seq data (Figure 4A), with green and blue clusters representing genes downregulated or upregulated following dexamethasone treatment, respectively. For example, IRS2, which lacks a GR binding site within 1 Mb of its gene locus, is brought into proximity with GR binding peaks through multiple chromatin loops (Figure 4B). Similar spatial regulatory mechanisms were observed for UBL3 (Figure 4C) and FOXO1 (Figure 4D), where chromatin looping connects GR binding sites to their promoters. RNA-seq analysis showed increased transcript per million (TPM) levels of IRS2, UBL3, and FOXO1 upon GR activation, which was further validated by RT-qPCR (Figure S3).
The identification of IRS2, UBL3, and FOXO1 as spatially regulated GR targets links long-range chromatin interactions to well-established glucocorticoid-responsive pathways involved in metabolism, stress response, and cellular adaptation to dexamethasone. Together, these results support the broader applicability of ChIP-SP for identifying transcription factor target genes within a three-dimensional genomic context.
4. Discussion
Accurate annotation of TF target genes remains a challenge in cancer genomics, largely because conventional ChIP-seq analysis relies on linear genome proximity and does not account for higher-order chromatin organization. In this study, we introduce ChIP-SP, a bioinformatics framework that integrates TF ChIP-seq with three-dimensional chromatin interaction data to enable systematic identification of spatially regulated target genes. By incorporating chromatin looping information, ChIP-SP extends TF annotation into a spatial context and provides a more comprehensive representation of transcriptional regulatory networks. Using the AR and GR as model TFs, we demonstrate that ChIP-SP identifies a distinct class of TF-regulated genes that are missed by conventional ChIP-seq annotation. These spatially regulated targets are brought into proximity with TF binding sites through chromatin loops and show robust transcriptional responses to ligand stimulation.
In comparison to Hi-ChIP, a technique that merges Hi-C and ChIP-seq, ChIP-SP overcomes key limitations associated with antibody-dependent biases in Hi-ChIP. Variations in antibody binding affinities, elution efficiency during washing steps, and uneven enrichment of chromatin regions in ChIP experiments can introduce artifacts. Using Hi-C data as a foundation eliminates these biases, ensuring a more reliable representation of intrinsic chromatin structures and interactions.
In addition, ChIP-SP provides high flexibility. It has potential to integrate a single Hi-C dataset with multiple ChIP-seq datasets, enabling the simultaneous analysis of various TFs or chromatin modifications within the same chromatin context. This capability not only reduces the need for multiple Hi-C experiments but also facilitates the identification of overlapping or distinct spatial regulatory mechanisms across different TFs. Moreover, the tool supports user-defined parameters, such as resolution settings, loop-calling thresholds, and binding site proximity, allowing researchers to tailor analyses to specific experimental designs and datasets. This combination of integrative functionality, multi-scale analysis, and customizable parameters makes ChIP-SP a versatile tool for exploring the complexities of chromatin-mediated gene regulation and its broad applicability in genomic research.
Beyond technical improvements, ChIP-SP provides mechanistic insight into transcriptional regulation by revealing how chromatin looping links distal transcription factor binding sites to target gene promoters. These spatially regulated genes, such as KRT8, MAF, NDRG1, IRS2, and FOXO1, play diverse roles in prostate cancer biology, including epithelial identity, signaling integration, and tumor progression. By systematically identifying such interactions, ChIP-SP enables prioritizing functionally relevant genes and indicates that chromatin architecture may serve as a potential therapeutic target in cancer.
While ChIP-SP provides a powerful framework for inferring spatial regulatory relationships, experimental validation of individual chromatin interactions remains challenging. In principle, targeted perturbation of specific interaction sites using CRISPR-Cas9-based genome editing could be used to disrupt distal regulatory elements and directly assess their effects on chromatin organization and target gene expression. However, current Hi-C-based approaches lack sufficient resolution to unambiguously define precise interaction breakpoints, and individual interaction bins often encompass multiple genomic loci. Consequently, selectively disrupting a single, well-defined chromatin contact is technically difficult, limiting direct wet-lab validation of ChIP-SP-predicted interactions.
From our perspective, the advancement of sequencing technologies, coupled with the exponential growth of publicly available Hi-C datasets, has opened new avenues for exploring the relationship between 3D genome organization and gene regulation [38]. For future studies, ChIP-SP has potential to enhance the interpretation of findings from genomic studies, such as GWAS. Many genomic mutations identified in GWAS are in non-coding regions and possibly influence the expression of spatially proximal genes rather than nearby ones. By integrating multiple genomic and epigenetic datasets, ChIP-SP may bridge this gap by mapping these mutations to their functional regulatory targets through chromatin interactions.
5. Conclusions
ChIP-SP integrates TF ChIP-seq data with three-dimensional chromatin interaction information to identify spatially regulated target genes beyond linear genome annotation. Applications of AR and GR signaling demonstrate ChIP-SP’s general applicability and biological relevance. ChIP-SP provides a practical framework for studying transcriptional regulation in cancer within a three-dimensional genomic context.
Supplementary Materials
Figure S1: ChEA-ChIP enrichment analysis of AR directly and spatially regulated genes; Figure S2: ChIP-SP identifies long-range AR regulation of NDRG1 and ERRFI1; Figure S3: RT-qPCR analysis to validate IRS2, UBL3, and FOXO1 expression in A549 cells treated with dexamethasone. Table S1: DNA primers used in RT-qPCR experiments; Table S2: ChIP-SP output table of ranked spatially regulated AR target genes; Table S3: AR-regulated genes identified by comparing androgen receptor antagonist (Darolutamide) versus agonist (R1881) treatments.
Author Contributions
Conceptualization, T.Z., Q.F.; methodology, T.Z., Q.F., K.S, H.H., N.L.; data curation and analysis, T.Z., K.S., H.H.; writing, Q.F., T.Z.; All authors have read and agreed to the published version of the manuscript.
Funding
This research received no external funding.
Institutional Review Board Statement
Not applicable.
Informed Consent Statement
Not applicable.
Data Availability Statement
The AR ChIP-seq, RNA-seq, and Hi-C data presented in these studies are available through GEO datasets with access numbers: GSE249435, GSE249436, and GSE269644.
Acknowledgments
We thank other current and former members of the Feng lab for advice and helpful discussions.
Conflicts of Interest
The authors declare no conflicts of interest.
References
- O'Connor, L.M.; O'Connor, B.A.; Lim, S.B.; Zeng, J.; Lo, C.H. Integrative multi-omics and systems bioinformatics in translational neuroscience: A data mining perspective. J Pharm Anal 2023, 13, 836-850. [CrossRef]
- Dai, X.; Shen, L. Advances and Trends in Omics Technology Development. Frontiers in Medicine 2022, Volume 9 - 2022. [CrossRef]
- Richter, W.F.; Nayak, S.; Iwasa, J.; Taatjes, D.J. The Mediator complex as a master regulator of transcription by RNA polymerase II. Nat Rev Mol Cell Biol 2022, 23, 732-749. [CrossRef]
- Nikolov, D.B.; Burley, S.K. RNA polymerase II transcription initiation: a structural view. Proc Natl Acad Sci U S A 1997, 94, 15-22. [CrossRef]
- Hahn, S.; Young, E.T. Transcriptional regulation in Saccharomyces cerevisiae: transcription factor regulation and function, mechanisms of initiation, and roles of activators and coactivators. Genetics 2011, 189, 705-736. [CrossRef]
- Lee, T.I.; Young, R.A. Transcriptional regulation and its misregulation in disease. Cell 2013, 152, 1237-1251. [CrossRef]
- Brewster, R.C.; Weinert, F.M.; Garcia, H.G.; Song, D.; Rydenfelt, M.; Phillips, R. The transcription factor titration effect dictates level of gene expression. Cell 2014, 156, 1312-1323. [CrossRef]
- Kiani, K.; Sanford, E.M.; Goyal, Y.; Raj, A. Changes in chromatin accessibility are not concordant with transcriptional changes for single-factor perturbations. Mol Syst Biol 2022, 18, e10979. [CrossRef]
- Muto, Y.; Wilson, P.C.; Ledru, N.; Wu, H.; Dimke, H.; Waikar, S.S.; Humphreys, B.D. Single cell transcriptional and chromatin accessibility profiling redefine cellular heterogeneity in the adult human kidney. Nature Communications 2021, 12, 2190. [CrossRef]
- Park, P.J. ChIP–seq: advantages and challenges of a maturing technology. Nature Reviews Genetics 2009, 10, 669-680. [CrossRef]
- Mazina, M.Y.; Vorobyeva, N.E. Chromatin Modifiers in Transcriptional Regulation: New Findings and Prospects. Acta Naturae 2021, 13, 16-30. [CrossRef]
- Wang, Z.; Gerstein, M.; Snyder, M. RNA-Seq: a revolutionary tool for transcriptomics. Nature Reviews Genetics 2009, 10, 57-63. [CrossRef]
- Zhang, Y.; Liu, T.; Meyer, C.A.; Eeckhoute, J.; Johnson, D.S.; Bernstein, B.E.; Nusbaum, C.; Myers, R.M.; Brown, M.; Li, W.; et al. Model-based Analysis of ChIP-Seq (MACS). Genome Biology 2008, 9, R137. [CrossRef]
- Zhu, L.J.; Gazin, C.; Lawson, N.D.; Pagès, H.; Lin, S.M.; Lapointe, D.S.; Green, M.R. ChIPpeakAnno: a Bioconductor package to annotate ChIP-seq and ChIP-chip data. BMC Bioinformatics 2010, 11, 237. [CrossRef]
- Zhou, T.; Feng, Q. Androgen receptor signaling and spatial chromatin organization in castration-resistant prostate cancer. Front Med (Lausanne) 2022, 9, 924087. [CrossRef]
- Naes, G.; Storesund, J.O.; Udayakumar, P.D.; Ledsaak, M.; Gabrielsen, O.S. Dissecting the transactivation domain (tAD) of the transcription factor c-Myb to assess recent models of tAD function. FEBS Open Bio 2020, 10, 2329-2342. [CrossRef]
- Wang, J.; Yu, H.; Ma, Q.; Zeng, P.; Wu, D.; Hou, Y.; Liu, X.; Jia, L.; Sun, J.; Chen, Y.; et al. Phase separation of OCT4 controls TAD reorganization to promote cell fate transitions. Cell Stem Cell 2021, 28, 1868-1883.e1811. [CrossRef]
- Sartorelli, V.; Puri, P.L. Shaping Gene Expression by Landscaping Chromatin Architecture: Lessons from a Master. Mol Cell 2018, 71, 375-388. [CrossRef]
- Rajderkar, S.; Barozzi, I.; Zhu, Y.; Hu, R.; Zhang, Y.; Li, B.; Alcaina Caro, A.; Fukuda-Yuzawa, Y.; Kelman, G.; Akeza, A.; et al. Topologically associating domain boundaries are required for normal genome function. Communications Biology 2023, 6, 435. [CrossRef]
- Zhou, T.; Nguyen, S.; Wu, J.; He, B.; Feng, Q. LncRNA LOC730101 Promotes Darolutamide Resistance in Prostate Cancer by Suppressing miR-1-3p. Cancers 2024, 16, 2594.
- Dixon, J.R.; Selvaraj, S.; Yue, F.; Kim, A.; Li, Y.; Shen, Y.; Hu, M.; Liu, J.S.; Ren, B. Topological domains in mammalian genomes identified by analysis of chromatin interactions. Nature 2012, 485, 376-380. [CrossRef]
- Ron, G.; Globerson, Y.; Moran, D.; Kaplan, T. Promoter-enhancer interactions identified from Hi-C data using probabilistic models and hierarchical topological domains. Nat Commun 2017, 8, 2237. [CrossRef]
- Lin, D.; Xu, W.; Hong, P.; Wu, C.; Zhang, Z.; Zhang, S.; Xing, L.; Yang, B.; Zhou, W.; Xiao, Q.; et al. Decoding the spatial chromatin organization and dynamic epigenetic landscapes of macrophage cells during differentiation and immune activation. Nature Communications 2022, 13, 5857. [CrossRef]
- Dixon, J.R.; Jung, I.; Selvaraj, S.; Shen, Y.; Antosiewicz-Bourget, J.E.; Lee, A.Y.; Ye, Z.; Kim, A.; Rajagopal, N.; Xie, W.; et al. Chromatin architecture reorganization during stem cell differentiation. Nature 2015, 518, 331-336. [CrossRef]
- Durand, N.C.; Shamim, M.S.; Machol, I.; Rao, S.S.; Huntley, M.H.; Lander, E.S.; Aiden, E.L. Juicer Provides a One-Click System for Analyzing Loop-Resolution Hi-C Experiments. Cell Syst 2016, 3, 95-98. [CrossRef]
- Roayaei Ardakany, A.; Gezer, H.T.; Lonardi, S.; Ay, F. Mustache: multi-scale detection of chromatin loops from Hi-C and Micro-C maps using scale-space representation. Genome Biology 2020, 21, 256. [CrossRef]
- Li, D.; Purushotham, D.; Harrison, J.K.; Hsu, S.; Zhuo, X.; Fan, C.; Liu, S.; Xu, V.; Chen, S.; Xu, J.; et al. WashU Epigenome Browser update 2022. Nucleic Acids Research 2022, 50, W774-W781. [CrossRef]
- Lachmann, A.; Xu, H.; Krishnan, J.; Berger, S.I.; Mazloom, A.R.; Ma'ayan, A. ChEA: transcription factor regulation inferred from integrating genome-wide ChIP-X experiments. Bioinformatics 2010, 26, 2438-2444. [CrossRef]
- Zhou, T.; Yu, C.; Han, Y.; He, B.; Feng, Q. GATA2 up-regulation restores androgen receptor chromatin association and advances darolutamide resistance in prostate cancer. Genes Dis 2025, 12, 101508. [CrossRef]
- Li, L.; Cho, K.H.; Yu, X.; Cheng, S. Systematic multi-omics investigation of androgen receptor driven gene expression and epigenetics changes in prostate cancer. Comput Biol Med 2025, 189, 110000. [CrossRef]
- Ozturan, D.; Morova, T.; Lack, N.A. Androgen Receptor-Mediated Transcription in Prostate Cancer. Cells 2022, 11. [CrossRef]
- Stelloo, S.; Bergman, A.M.; Zwart, W. Androgen receptor enhancer usage and the chromatin regulatory landscape in human prostate cancers. Endocr Relat Cancer 2019, 26, R267-R285. [CrossRef]
- Jin, H.-J.; Kim, J.; Yu, J. Androgen receptor genomic regulation. Translational Andrology and Urology 2013, 2, 158-177.
- Song, H.; Weinstein, H.N.W.; Allegakoen, P.; Wadsworth, M.H.; Xie, J.; Yang, H.; Castro, E.A.; Lu, K.L.; Stohr, B.A.; Feng, F.Y.; et al. Single-cell analysis of human primary prostate cancer reveals the heterogeneity of tumor-associated epithelial cell states. Nature Communications 2022, 13, 141. [CrossRef]
- Lim, S.C.; Geleta, B.; Maleki, S.; Richardson, D.R.; Kovačević, Ž. The metastasis suppressor NDRG1 directly regulates androgen receptor signaling in prostate cancer. J Biol Chem 2021, 297, 101414. [CrossRef]
- Schomann, T.; Mirzakhani, K.; Kallenbach, J.; Lu, J.; Rasa, S.M.M.; Neri, F.; Baniahmad, A. Androgen-Induced MIG6 Regulates Phosphorylation of Retinoblastoma Protein and AKT to Counteract Non-Genomic AR Signaling in Prostate Cancer Cells. Biomolecules 2022, 12. [CrossRef]
- McDowell, I.C.; Barrera, A.; D'Ippolito, A.M.; Vockley, C.M.; Hong, L.K.; Leichter, S.M.; Bartelt, L.C.; Majoros, W.H.; Song, L.; Safi, A.; et al. Glucocorticoid receptor recruits to enhancers and drives activation by motif-directed binding. Genome Res 2018, 28, 1272-1284. [CrossRef]
- Dekker, J.; Belmont, A.S.; Guttman, M.; Leshyk, V.O.; Lis, J.T.; Lomvardas, S.; Mirny, L.A.; O’Shea, C.C.; Park, P.J.; Ren, B.; et al. The 4D nucleome project. Nature 2017, 549, 219-226. [CrossRef]
Figure 1.
Schematic overview of the ChIP-SP analysis pipeline for identifying spatially regulated TF targets. (A) Chromatin looping, mediated by transcription factors, coactivators, cohesin, or intrinsic chromatin architecture, can bring distant genes into close spatial proximity with TF binding sites despite large linear separation. Genomic regions that exhibit strong spatial interactions with TF-bound loci are defined as “hypothetical TF effect sites,” which differ from conventional TF binding sites identified by ChIP-seq. By incorporating chromatin interaction information, ChIP-SP enables the identification of TF-regulated genes within a three-dimensional genomic context (labelled in green). (B) Chromatin loops were identified from Hi-C data using Juicer-Hi-C or Run-Hi-C followed by Mustache loop calling. In parallel, transcription factor binding sites were obtained from ChIP-seq data using Bowtie2 alignment and MACS peak calling. Hi-C loops and ChIP-seq peaks were integrated by ChIP-SP to identify spatially associated regulatory interactions, which were annotated using ChIPseeker and ChIPpeakAnno.
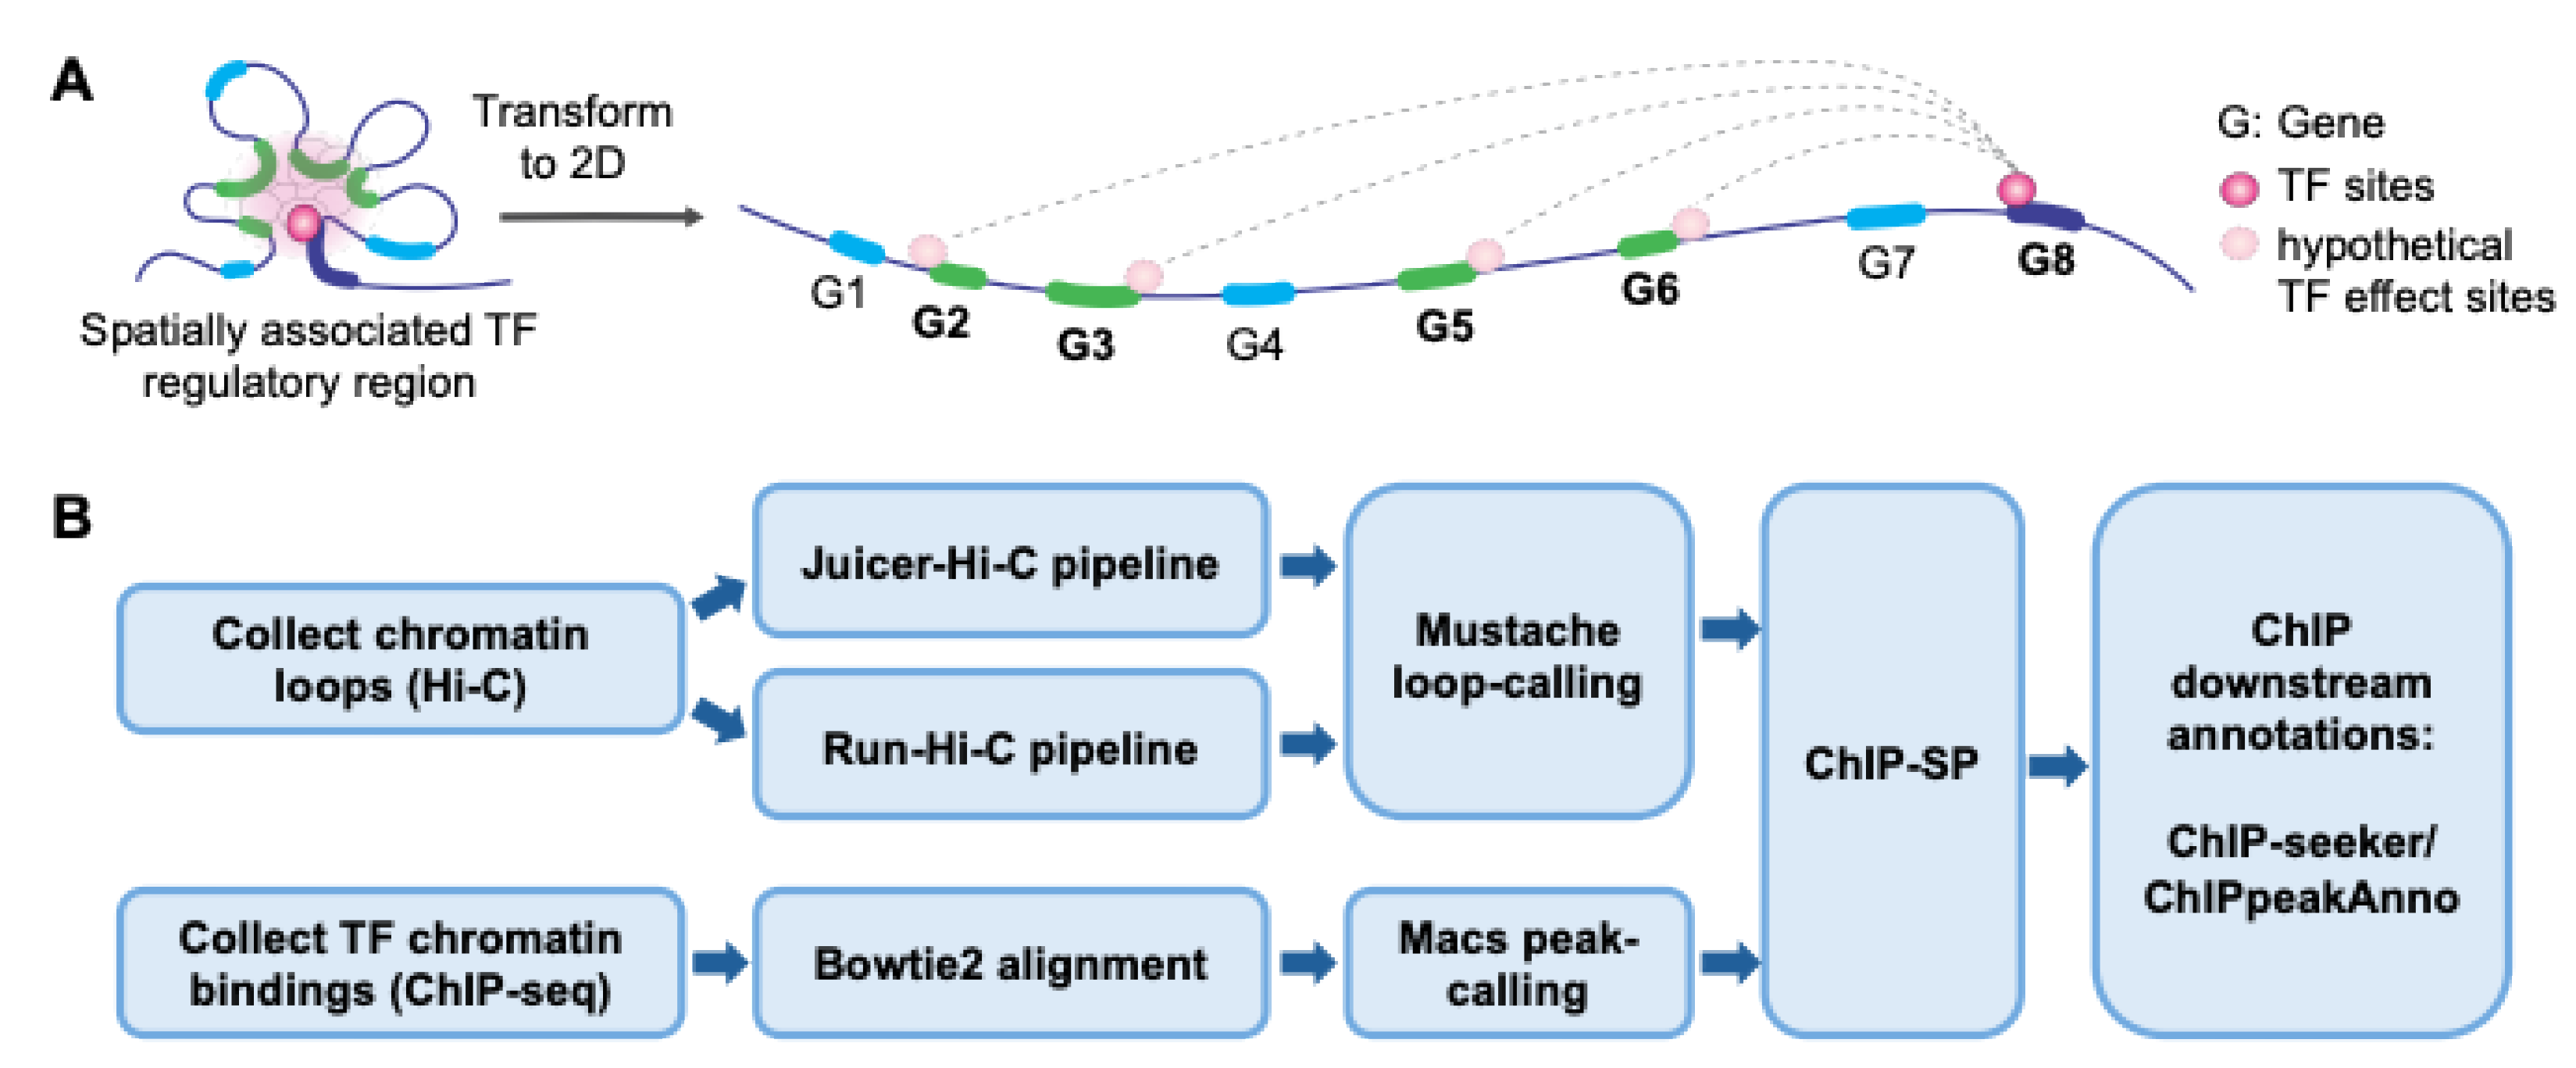
Figure 3.
ChIP-SP identifies AR spatially regulated genes. (A) Hi-C contact map and AR ChIP-seq signal at the KRT8 locus. Yellow dashed lines indicate topologically associating domain (TAD) boundaries, and purple dashed vertical lines mark chromatin interaction sites identified by ChIP-SP. AR binding sites and hypothetical AR effect sites are denoted by solid and dotted circles, respectively. The KRT8 promoter is positioned on the opposite side of the chromatin loop from the AR binding site. (B) Hi-C contact map and AR ChIP-seq signal at the MAF locus, shown with the same annotations as in (A). An androgen-responsive AR binding site is brought into close spatial proximity with the MAF promoter through long-range chromatin looping. (C) Summary table of chromatin loop coordinates linking AR binding sites to the KRT8 and MAF gene loci identified by ChIP-SP. (D-E) RT-qPCR analysis of KRT8 and MAF expression in LNCaP cells treated with DMSO or the AR agonist R1881. Data are presented as mean ± SEM. Statistical significance was determined by unpaired two-tailed Student’s t test. n = 3 biological replicates.
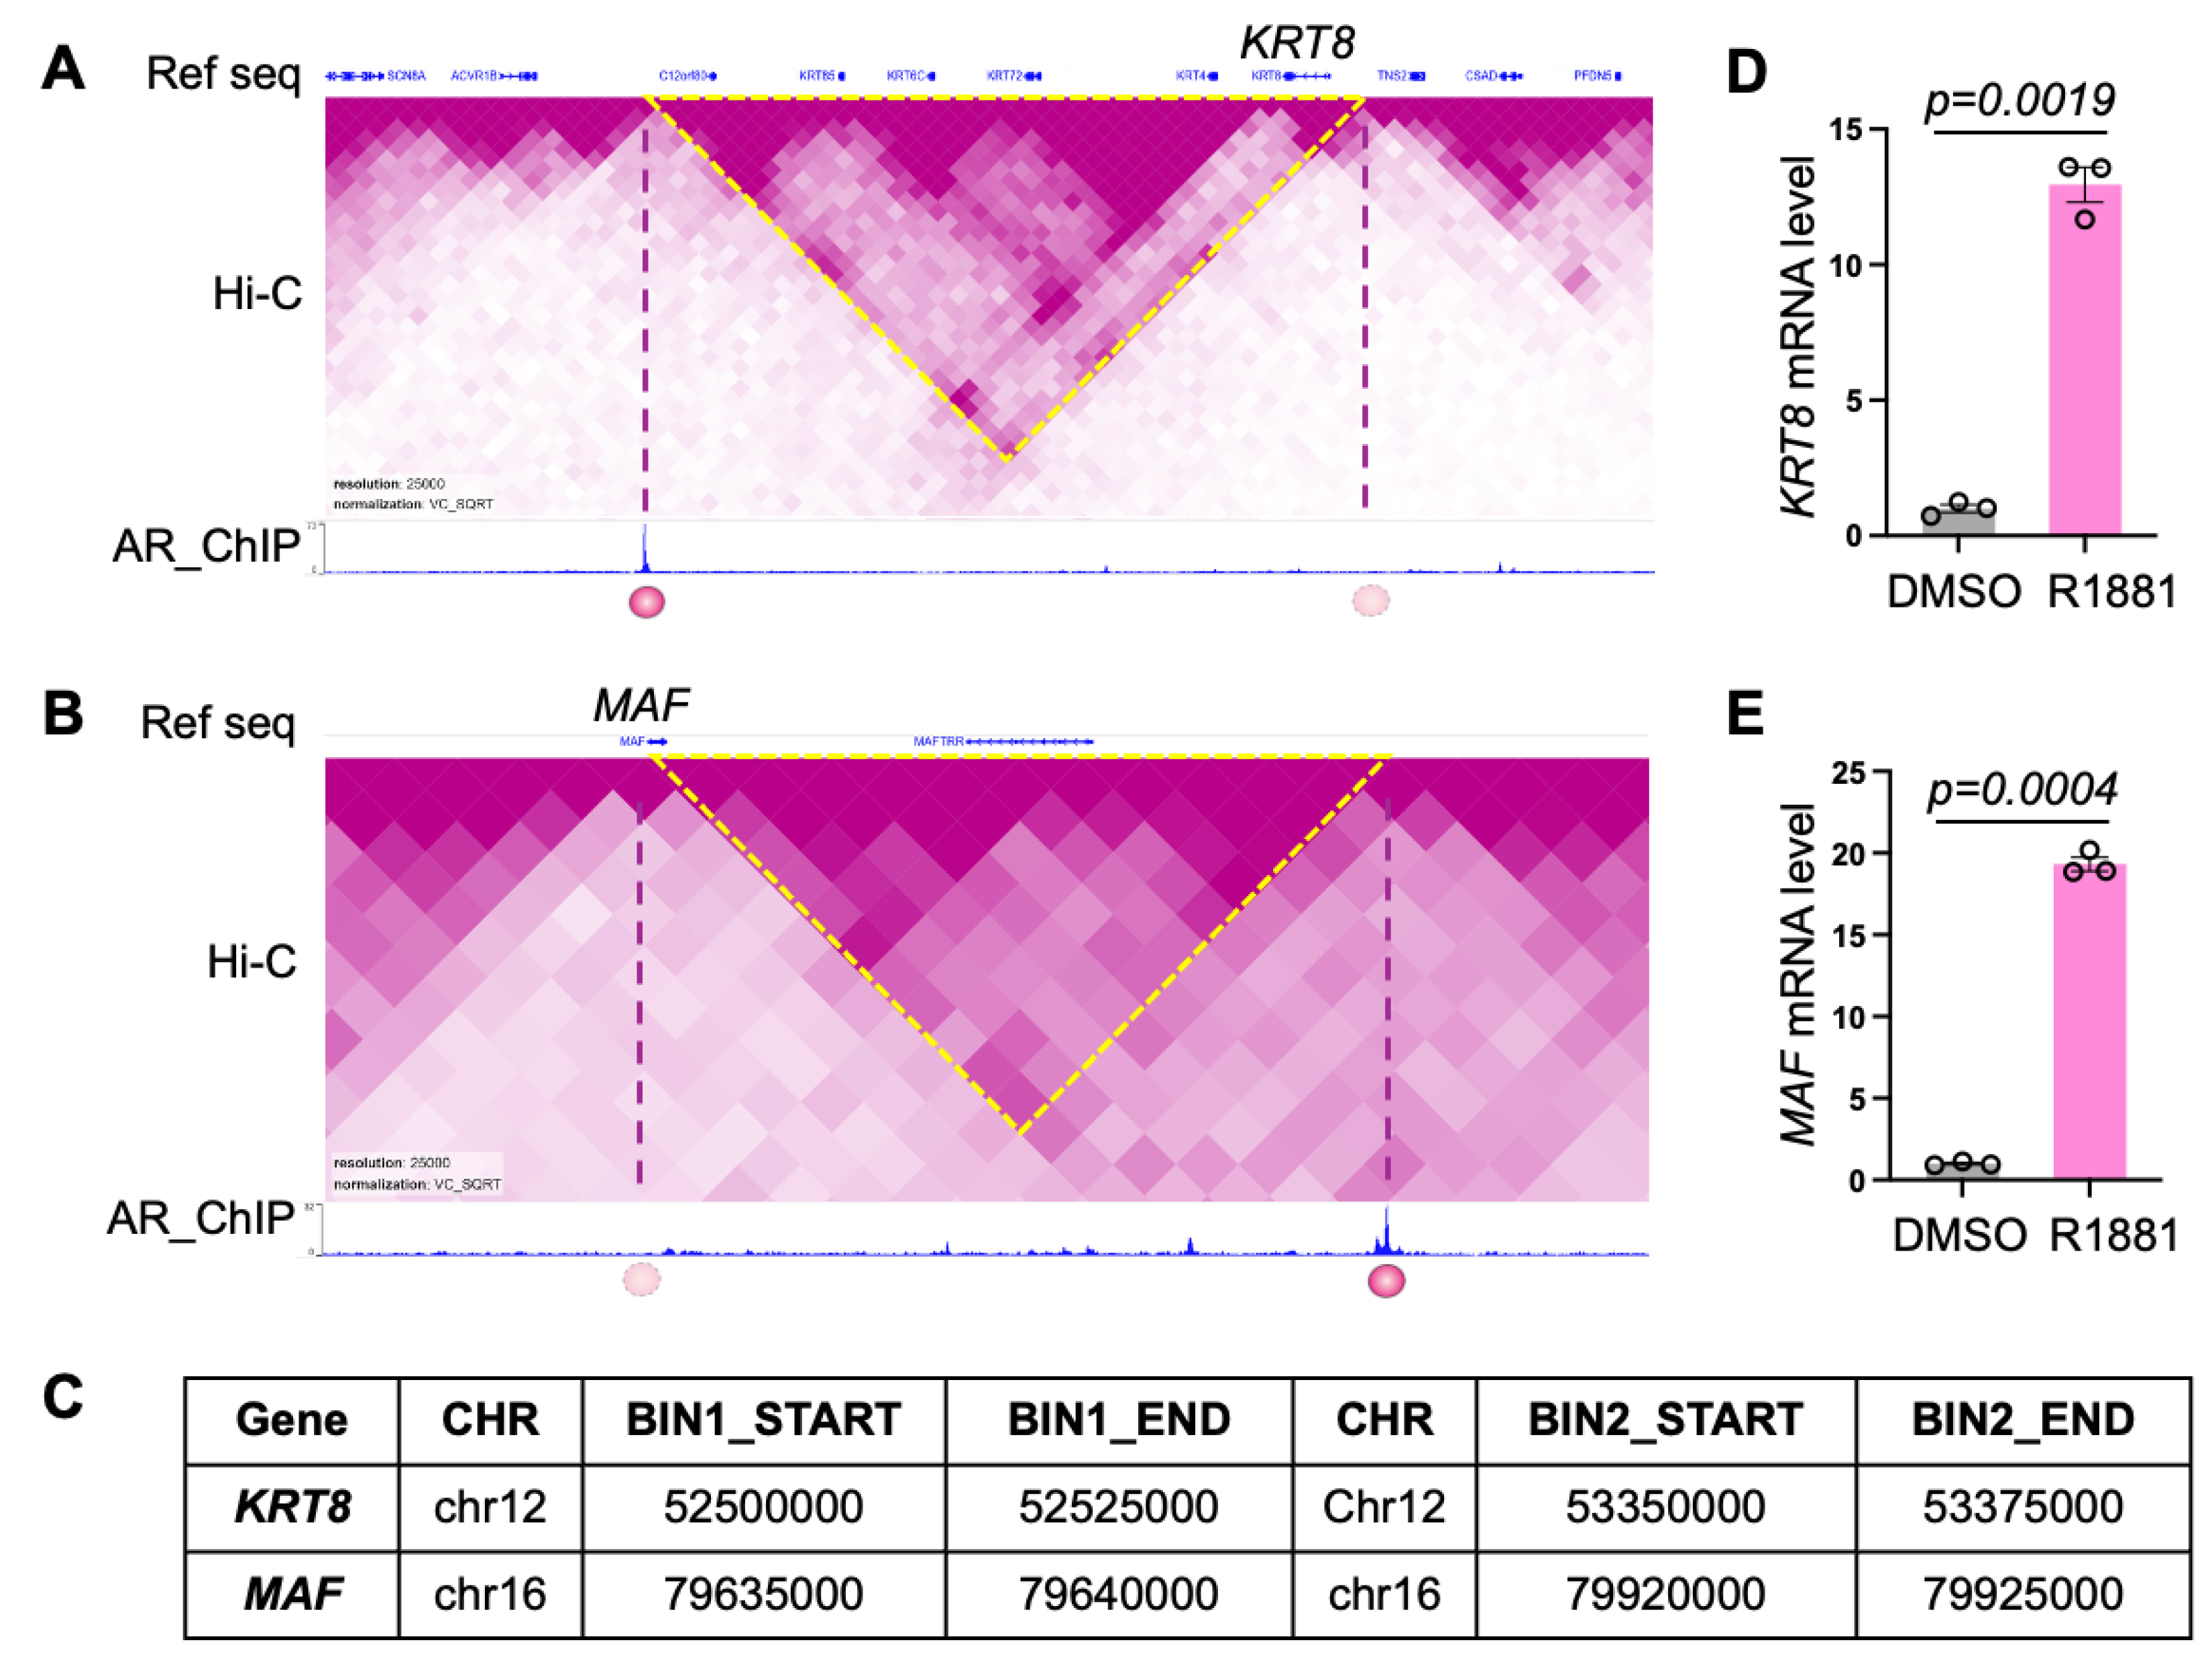
Figure 4.
ChIP-SP identifies GR spatially regulated genes. (A) Heatmap of differentially expressed genes in A549 cells treated with 100 nM dexamethasone (Dex) for 0 or 4 h. Genes identified as GR spatially regulated by ChIP-SP were hierarchically clustered based on RNA-seq expression patterns. (B-D) Hi-C contact maps and GR ChIP-seq signals at the IRS2 (B), UBL3 (C), and FOXO1 (D) loci. Yellow dashed lines indicate TAD boundaries, and purple dashed vertical lines denote chromatin interaction sites identified by ChIP-SP. Solid and dotted circles mark GR binding sites and hypothetical GR effect sites, respectively. Bar plots show RNA-seq expression levels (TPM) at 0 and 4 h Dex treatment.
Disclaimer/Publisher’s Note: The statements, opinions and data contained in all publications are solely those of the individual author(s) and contributor(s) and not of MDPI and/or the editor(s). MDPI and/or the editor(s) disclaim responsibility for any injury to people or property resulting from any ideas, methods, instructions or products referred to in the content. |
© 2025 by the authors. Licensee MDPI, Basel, Switzerland. This article is an open access article distributed under the terms and conditions of the Creative Commons Attribution (CC BY) license (http://creativecommons.org/licenses/by/4.0/).
Copyright: This open access article is published under a Creative Commons CC BY 4.0 license, which permit the free download, distribution, and reuse, provided that the author and preprint are cited in any reuse.


