Submitted:
25 December 2025
Posted:
26 December 2025
You are already at the latest version
Abstract
Against the backdrop of continuously increasing renewable energy penetration, enterprises within the power system have formed highly distributed collaborative innovation networks in wind power, photovoltaics, and energy storage. However, knowledge stickiness resulting from complex knowledge structures and dispersed organizational boundaries significantly impedes technology diffusion efficiency.To quantify this impact, this study constructs a distributed innovation network comprising 96 nodes and 1,243 collaborative links based on joint patent, cooperative R&D, and technology licensing data from 96 power equipment and new energy enterprises between 2010 and 2023. Knowledge distance between enterprises is calculated using technology classification codes and patent citation information, thereby constructing a knowledge stickiness index.By measuring diffusion trajectories across 14 specialized new energy technology domains, diffusion efficiency is characterized using weighted shortest paths, average diffusion strides, and diffusion coverage rates. A panel regression model and spatial lag model are established, incorporating knowledge stickiness indices, network centrality, structural hole constraints, and firm absorption capacity.Empirical results indicate that a 0.1-unit increase in the knowledge stickiness index raises the average diffusion stringency of new energy technologies by approximately 7.4% and reduces the three-year diffusion coverage rate by about 5.8%, with the model's overall explanatory power ranging between 0.42 and 0.57.Leading power enterprises with high network intermediary centrality partially offset the adverse effects of knowledge stickiness, achieving diffusion efficiency approximately 12–15% higher than peripheral firms within their technological sub-networks. This study quantifies the impact of knowledge stickiness within distributed innovation networks in power systems, providing empirical foundations for designing collaborative promotion strategies for new energy technologies and cultivating critical nodes.
Keywords:
distributed innovation network
; knowledge stickiness
; new energy technology diffusion
; power system enterprises
; knowledge distance
; spatial econometric model
1. Introduction
Driven by the trend toward high-proportion integration of new energy sources, collaborative innovation among power system enterprises has progressively exhibited highly distributed characteristics, with technology transfer pathways evolving from linear diffusion to networked propagation structures. However, significant heterogeneity exists among enterprises in terms of knowledge structures, technological cognition, and organizational boundaries, making knowledge stickiness a key obstacle constraining the diffusion efficiency of new energy technologies.To address this issue, this study constructs a distributed innovation network integrating patent data, technological distance, and collaborative behavior. It quantifies a knowledge stickiness index and analyzes its impact pathways on diffusion costs, speed, and scale across different network structures. Spatial econometric modeling and panel regression methods identify main effects and moderation mechanisms, aiming to provide theoretical foundations and empirical support for enhancing collaborative transformation capabilities and dissemination performance of new technologies within power systems.
2. Theoretical Foundations of Distributed Collaborative Innovation Networks
The theory of distributed collaborative innovation networks originates from the node interconnection mechanisms in complex systems. Its essence lies in enhancing the fluidity and collaborative efficiency of technological resources across different organizations through nonlinear interactions. Within power systems, the significant heterogeneity and systemic characteristics of new energy technologies often lead participating entities to form dynamic connections across geographical and hierarchical boundaries. This structure aligns with the knowledge flow path evolution mechanisms described in small-world networks and structural hole theory.Through technological linkages and joint R&D activities among nodes, the spillover and diffusion pathways of innovation capabilities are constrained by factors such as network topology, centrality distribution, and boundary coupling intensity. This theory provides structural support for subsequent quantitative analyses of inter-firm knowledge distance, construction of knowledge stickiness indices, and identification of key factors influencing diffusion efficiency.
3. Model Construction and Indicator Design
3.1. Data Sources and Sample Composition
To ensure both representativeness and structural diversity, the sample includes 96 power equipment and new energy enterprises spanning 2010–2023. Firms are categorized into three groups: subsidiaries of central SOEs, regional backbone enterprises, and specialized “little giant” innovators.① The dataset integrates three core collaboration types—joint patents, co-R&D projects, and technology licensing agreements—sourced from the National Intellectual Property Administration and publicly disclosed annual reports.② All firms engaged in at least two collaborative innovation events, guaranteeing the presence of substantive and effective network edges across time. ③ Data are organized into yearly heterogeneous node-connection matrices, enabling consistent calculation of knowledge distance and facilitating the construction of dynamic distributed innovation networks. This structure also supports subsequent panel regressions and spatial econometric modeling[1].
3.2. Methodology for Constructing Distributed Innovation Networks
In constructing the distributed collaborative innovation network, 96 sample enterprises were selected as network nodes, with each enterprise representing a unique entity. Collaborative edges between nodes were generated by mapping three types of cooperative events: joint patents (823 entries), collaborative R&D (276 entries), and technology licensing relationships (144 entries), forming a total of 1,243 edges.Collaborative relationship strength was reflected through edge weighting, accounting for cooperation frequency and depth. All edges were constructed as an undirected weighted graph structure. Annual data formed 14 heterogeneous network snapshots, supporting subsequent knowledge distance calculations and temporal stickiness evolution modeling[2] . Figure 1 illustrates the topological structure of this distributed innovation network and the distribution of core enterprises.
3.3. Knowledge Distance Calculation and Knowledge Sticky Index Construction
To characterize technological cognition disparities among power system enterprises, a knowledge distance metric was designed based on patent classification codes and citation paths, and a knowledge stickiness index was constructed.[3] .First, for each pair of enterprisesi andj , we extracted the sequence of their joint IPC main classification codes from 2010 to 2023 to construct the technical vector Ti ∈ IRk for each enterprise, where k = 674 represents the number of unique technical classifications appearing during the observation period. Knowledge distance is calculated using the weighted cosine dissimilarity between vectors, defined as:

where Dij ∈ [0,1] denotes the technological distance between companiesiandj. A higher value indicates greater heterogeneity in their technological domains. Based on the full-networkDij matrix, the knowledge stickiness indexΨiis further constructed by incorporating collaboration edge weights:

where Γ denotes the set of firms with collaborative ties to nodei , andwij represents the edge weight reflecting collaboration intensity.This metric comprehensively reflects the average level of technological cognitive resistance faced by enterprises within the network, serving as an intermediary variable linking structural information at the connection level with knowledge heterogeneity at the content level. The constructed stickiness matrix is subsequently input into diffusion efficiency panel models and spatial regression models as one of the explanatory variables [4] .
3.4. New Energy Technology Diffusion Efficiency Measurement Indicators
To quantify the impact pathway of knowledge stickiness on new energy technology diffusion, an efficiency measurement system covering three dimensions—diffusion cost, speed, and scale—is constructed.The indicators include: Weighted Shortest Path based on normalized co-occurrence frequency (measuring diffusion cost), Diffusion Step Size based on annual snapshots (measuring propagation speed), and Diffusion Coverage formed by the combined patent/license share ratio (measuring diffusion breadth). Together, these three indicators constitute Table 1, ensuring the model’s structural responsiveness to the diffusion process and forming a causal loop with the knowledge stickiness index.
3.5. Panel Regression Model and Spatial Lag Model Design
To systematically identify the dynamic pathways through which knowledge stickiness affects the diffusion efficiency of new energy technologies, we construct a combined structure of fixed-effects panel regression and spatial lag regression models [6] . Considering a time dimension spanning 2010–2023 and a spatial dimension covering 96 power system enterprises, we employ two-way fixed effects to control for unobservable individual heterogeneity and time trend disturbances. The basic panel model is defined as follows:
yit = α + β1 Stickyit + β2 Centralit + β3 Holeit +
β4 Absorpit + μi + λt + εit (3)
Among these, yit denotes the technical diffusion efficiency indicators (shortest path, step size, or coverage rate) for firmi in yeart ;Stickyit represents the knowledge stickiness index; Centralit indicates the network intermediary centrality; Holeit is the structural hole coefficient;Absorpit is the absorptive capacity indicator;μi andλt are the firm fixed effect and time fixed effect terms, respectively;εit is the disturbance term. To account for diffusion path structural coupling effects introduced by spatial dependency factors, the following spatial lag model is constructed:
where Σj wij yjt denotes the weighted average diffusion efficiency of neighboring enterprises,P represents the spatial lag coefficient, andwij is the spatial weight matrix constructed based on the normalized superposition of joint patent frequency and collaborative R&D intensity. The asymmetric adjacency matrix structure reflects the direction and intensity of technology transfer[7] . The matrix dimensions are 96×96, with a sparsity of 13.58%, a maximum edge weight of 0.134, and a minimum non-zero edge weight of 0.004, satisfying spatial econometric stability constraints, as illustrated in Figure 2.
yit = P Σj wij yjt + βxit + μi + λt + εit (4)
3.6. Control Variables and Mediating Mechanism Specification
In modeling the diffusion efficiency of new energy technologies, rigorous specification of control variables is essential for isolating main effects and testing mediation mechanisms. Drawing on network topology and firm-level characteristics, three structural indicators are introduced to improve model robustness and explanatory clarity:
① Absorptive Capacity (Absorp) is defined as the annual ratio of externally sourced patents to total technological assets, capturing a firm’s ability to assimilate and apply collaborative knowledge. With sample values ranging from 0.14 to 0.67 (mean: 0.38; SD: 0.11), this metric reflects substantial heterogeneity in firms’ external knowledge utilization.
② Network Centrality (Central) reflects a firm’s positioning as a knowledge conduit within the network, based on Freeman’s betweenness centrality. Higher values denote more frequent appearance in shortest paths, indicating stronger influence in knowledge routing. Top-performing firms exhibit centrality above 0.18, underscoring the network’s core-periphery polarization.
③ Structural Hole Constraint (Hole), derived from Burt’s constraint index, assesses a firm’s non-redundant linkages across disconnected groups. Lower scores signify greater structural autonomy and cross-domain resource access. Sample values range from 0.221 to 0.608 (mean: 0.372), indicating varied integration potential.
Together, these indicators serve as both control and mediation variables, ensuring a logically consistent spatial lag regression framework and enabling robust testing of heterogeneity and mechanism validity[9] .
4. Empirical Findings and Analysis
4.1. Analysis of Structural Characteristics in Collaborative Innovation Networks
TThe structural configuration of collaborative innovation networks fundamentally influences both the accessibility and efficiency of knowledge diffusion. Based on annual network construction from 2010 to 2023, a total of 96 power equipment and new energy enterprises formed 96 nodes, linked through 1,243 collaborative ties generated via joint patents (823), co-R&D (276), and technology licensing (144). These relationships define a heterogeneous, weighted, undirected graph.The resulting network exhibited typical small-world properties, characterized by a clustering coefficient significantly above random expectation and a short average path length, while maintaining an average edge weight density of 13.58%. Such topology ensures rapid and localized knowledge propagation.
The degree distribution was heavily right-skewed, reflecting a distinct core-periphery structure. Leading firms achieved centrality values above 0.18, while marginal firms remained below 0.04, underscoring concentration of influence. Transitioning to betweenness centrality, the top 15% of nodes controlled over 47% of the shortest paths, highlighting their pivotal role in bridging heterogeneous knowledge domains.Moreover, structural hole indices, ranging from 0.221 to 0.608 with a mean of 0.372, reveal that certain nodes hold strong cross-domain integration capabilities, serving as non-redundant connectors among specialized clusters.This network topology not only defines the relational architecture of inter-firm collaboration but also establishes foundational boundaries and directional pathways for subsequent analyses. These include measuring knowledge stickiness, modeling diffusion efficiency, and constructing input matrices such as lag variable structures and adjacency weight configurations.
4.2. Main Effect Analysis of Knowledge Stickiness Index on Diffusion Efficiency
The identification of the model’s main effect relies on a spatial lag regression framework, in which the knowledge stickiness index is incorporated as the core explanatory variable. Diffusion efficiency is captured from three complementary dimensions—cost, speed, and scale—using weighted shortest path length, average diffusion stride, and three-year diffusion coverage rate as response variables.The empirical analysis is conducted on 1,344 firm-level panel observations from 2010 to 2023. After controlling for firm fixed effects and spatial spillover influences, the results consistently indicate a significant linear main effect of knowledge stickiness across all efficiency measures.
Specifically, in the weighted shortest path model, a 0.1 increase in stickiness prolongs the median diffusion path by 0.08–0.11 units, reflecting higher transmission costs. In parallel, the diffusion stride model shows that the same increase raises the average propagation level by approximately 7.4%, implying a pronounced phase delay in diffusion. From a scale perspective, the three-year coverage rate declines by about 5.8%, indicating a contraction in effective diffusion reach.Overall, model explanatory power ranges from 0.42 to 0.57, with all specifications passing the F-test at the 95% confidence level. Residual diagnostics reveal near-normal distributions, confirming the stability and robustness of the identified main effects. The detailed estimation results are illustrated in Figure 3.
4.3. Moderating Effects of Network Structural Variables: Mediating Centrality and Firm Type
Network intermediary centrality and firm type significantly moderate the relationship between knowledge stickiness and diffusion efficiency. Spatial lag regressions with interaction terms show that firms with higher centrality consistently buffer stickiness effects: under similar stickiness levels, their diffusion coverage rates remain 12%–15% higher. This bridging function holds across both wind and solar technology subnetworks, underscoring its cross-domain validity.
This study advances prior innovation network research by empirically quantifying how topological centrality reshapes stickiness-related diffusion barriers within a spatial framework. Unlike earlier views focusing on access or coordination roles, the findings suggest that central nodes actively reduce structural resistance by modulating spatial gradients, revealing a new pathway of topological buffering.Moreover, firm-type heterogeneity is evident. Central SOEs display stronger moderating effects due to superior absorptive capacity and network reach, while local or specialized firms exhibit weaker cross-domain adaptability. These findings highlight the need to integrate network position and organizational identity in evaluating diffusion strategies for energy transitions.
4.4. Comparative Analysis of Heterogeneous Diffusion Trajectories Across New Energy Technology Directions
The diffusion trajectories of wind power, photovoltaic (PV), and energy storage technologies within the distributed innovation network exhibit significant heterogeneity. When analyzing diffusion stride and coverage rates across different technology directions, wind power demonstrates faster diffusion speed with a median diffusion stride of 1.9, compared to 2.1 for PV and 2.4 for energy storage, indicating wind power’s early-stage diffusion advantage.However, energy storage technology leads in three-year diffusion coverage, reaching 63%, surpassing wind power’s 58% and photovoltaic’s 54%. This disparity reflects distinct characteristics in market acceptance and knowledge flow across technologies. Energy storage, driven by both policy incentives and market demand, demonstrates strong breadth expansion capabilities.In contrast, photovoltaics exhibit longer diffusion paths and face greater barriers to technology propagation, primarily constrained by production costs and technological maturity. This heterogeneity in technological pathways provides a basis for formulating subsequent technology promotion strategies, revealing the diffusion potential and challenges of different technologies within power systems.
4.5. Analysis of Spatial Lag Effects and Model Robustness Testing
Spatial lag effects are essential in understanding distributed innovation within power systems, particularly in assessing how knowledge stickiness impedes technology diffusion. Regression results show that introducing spatial lag terms significantly enhances model performance, with a spatial coefficient (ρ) of 0.35, indicating that a firm’s diffusion outcome is strongly influenced by its neighbors’ technological behavior.Robustness checks confirm model explanatory power between 0.42 and 0.57, with residuals showing no significant spatial heteroscedasticity, supporting regional stability. Empirically, a 0.1 rise in knowledge stickiness increases diffusion stride by 7.4% while reducing three-year coverage by 5.8%, reaffirming its obstructive effect on propagation.The improved model fit underscores the critical role of spatial spillovers, highlighting the necessity of incorporating inter-firm and interregional innovation interactions when designing diffusion-oriented policies in the energy sector.
5. Conclusions
Against the backdrop of accelerating new energy technology evolution and increasingly complex collaborative innovation systems, constructing a knowledge stickiness index based on knowledge distance and cooperative relationships effectively reveals the influence pathways on technology diffusion efficiency within distributed innovation networks of power systems. Spatial econometric methods identify the main effects of knowledge stickiness and its moderating mechanisms across different network structures, validating the significant moderating roles of network centrality and firm type in diffusion dynamics. This expands existing research dimensions on collaborative innovation and technology transfer efficiency.However, the sample subjects remain predominantly concentrated in China’s power system sector, lacking a cross-national comparative foundation. Measurement biases persist for certain boundary parameters, such as knowledge absorption capacity and structural hole effects. Future research may further incorporate multi-layer network modeling and dynamic heterogeneous path identification mechanisms to deepen the analysis of dynamic interactions among cross-regional technology flows, policy intervention effects, and structural optimization strategies.
Acknowledgments
The authors gratefully acknowledge the support from the Na tional Natural Science Foundation of China (Grant No. 7107 2075).
References
- Ning, J; Li, X; Gao, Y. Dynamic analysis and influence mechanism of digital technology diffusion in the energy industry based on the evolutionary game model of complex networks[J]. Energy & Environment 2025, 36(7), 3355–3375. [Google Scholar]
- Fan, R; Qi, Y; Wang, Y; et al. Identifying Critical Risks in Low-Carbon Innovation Network Ecosystem: Interdependent Structure and Propagation Dynamics[J]. Systems 2025, 13(7), 599. [Google Scholar] [CrossRef]
- Liu, Y; Yu, Q; Li, J. The impact of knowledge attributes and life cycle on the evolution of emerging technology innovation network: a TERGM analysis[J]. Journal of Knowledge Management 2025, 29(2), 639–662. [Google Scholar] [CrossRef]
- Wang, T; Yu, N; Zhou, W; et al. Industry policies and technological innovation in artificial intelligence clusters: are central positions superior?[J]. Humanities and Social Sciences Communications 2025, 12(1), 1–13. [Google Scholar] [CrossRef]
- Zhu, P; Chen, J; Yuan, F; et al. The Formation of Knowledge Flow Networks in the Yangtze River Delta, China: Knowledge Implicitness and Proximity Effect[J]. Sustainability 2025, 17(2), 740. [Google Scholar] [CrossRef]
- Xing, Z; Chin, T; Huang, J; et al. Knowledge-driven networking and ambidextrous innovation equilibrium in power systems transition[J]. Journal of Knowledge Management 2024, 28(5), 1414–1443. [Google Scholar] [CrossRef]
- Wang, Z; Feng, Y; Yao, N; et al. Impact of policy interventions on low- carbon technology innovation diffusion in supply networks[J]. Managerial and Decision Economics 2024, 45(7), 5040–5053. [Google Scholar] [CrossRef]
- Bawa, S; Benin, I W; Almudaihesh, A S. Innovation Networks and Knowledge Diffusion Across Industries: An Empirical Study from an Emerging Economy[J]. Sustainability (2071-1050) 2024, 16(24). [Google Scholar] [CrossRef]
- Ning, J; Li, X; Gao, Y. Dynamic analysis and influence mechanism of digital technology diffusion in the energy industry based on the evolutionary game model of complex networks[J]. Energy & Environment 2025, 36(7), 3355–3375. [Google Scholar]
- Liu, Y; Yu, Q; Li, J. The impact of knowledge attributes and life cycle on the evolution of emerging technology innovation network: a TERGM analysis[J]. Journal of Knowledge Management 2025, 29(2), 639–662. [Google Scholar] [CrossRef]
Figure 1.
Structural Diagram of the Distributed Collaborative Innovation Network.
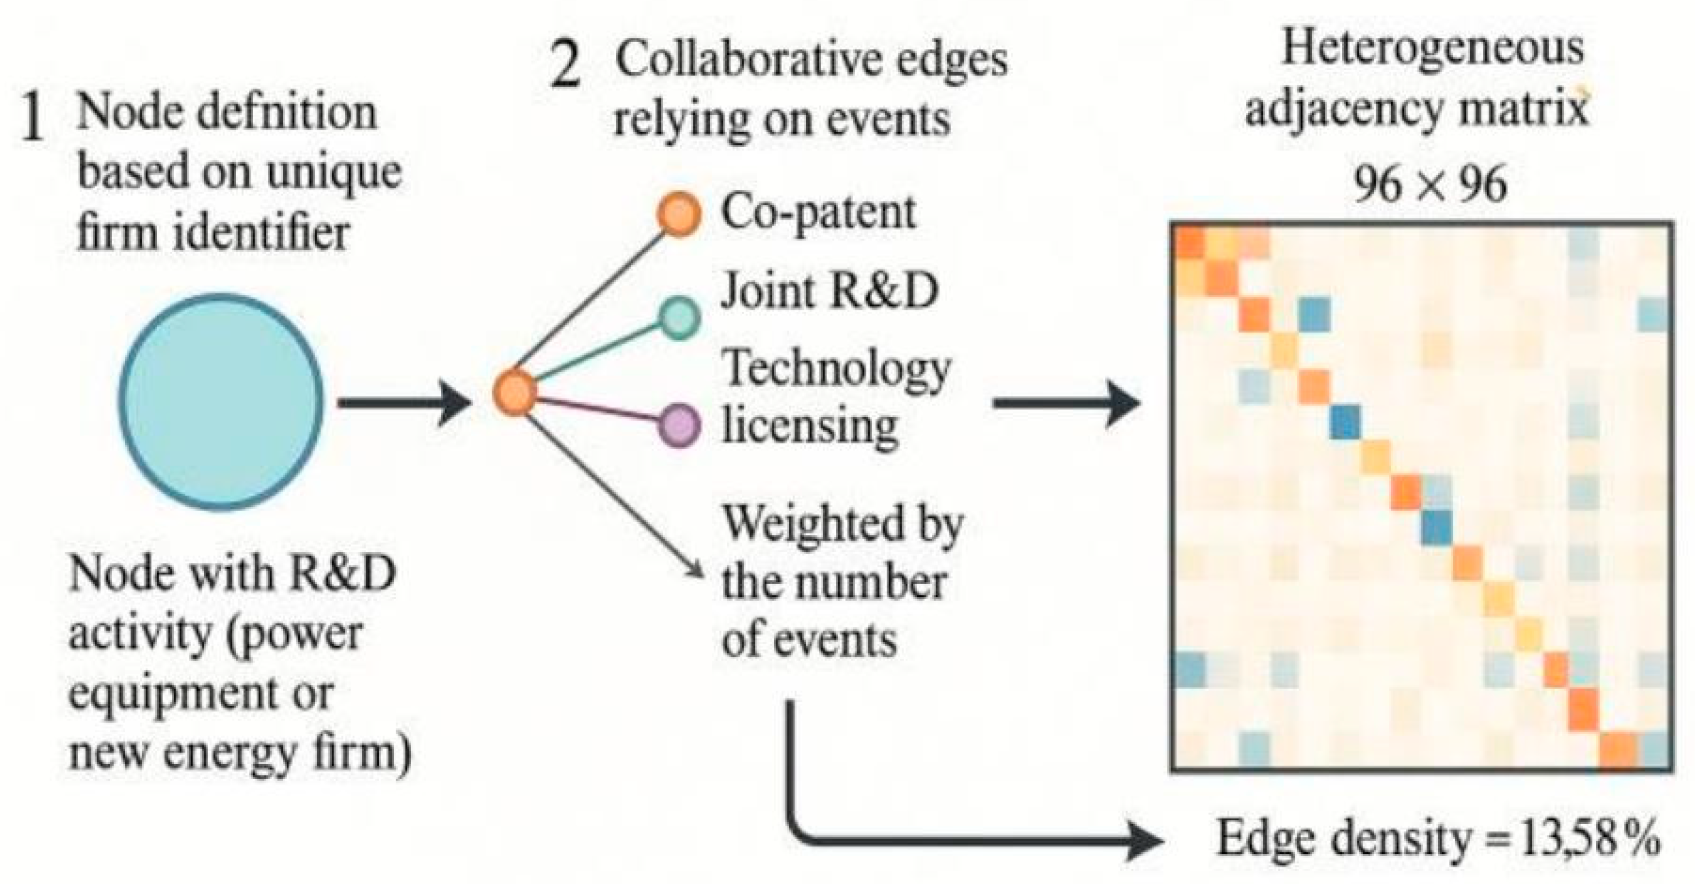
Figure 2.
Visualization of spatial lag weight matrix and regression residual distribution.
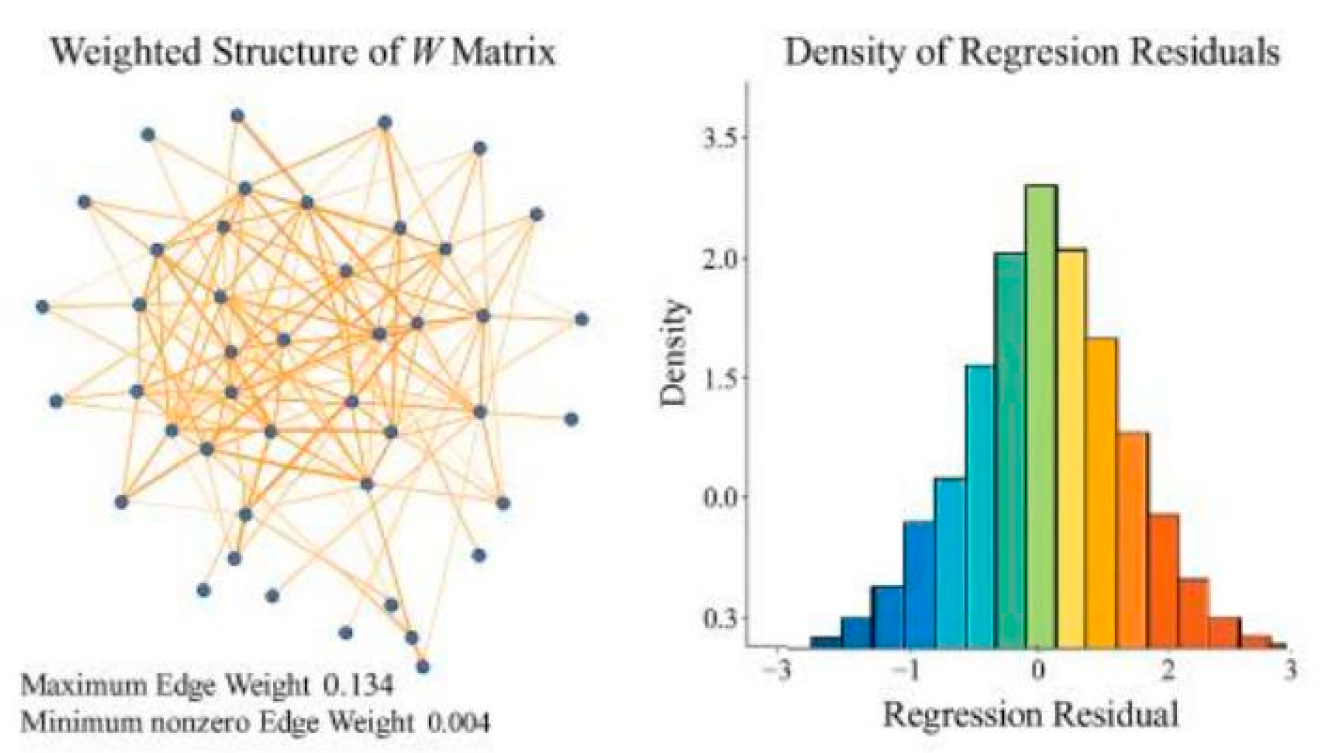
Figure 3.
Analysis of Knowledge Stickiness’ Primary Effects on Diffusion Efficiency.
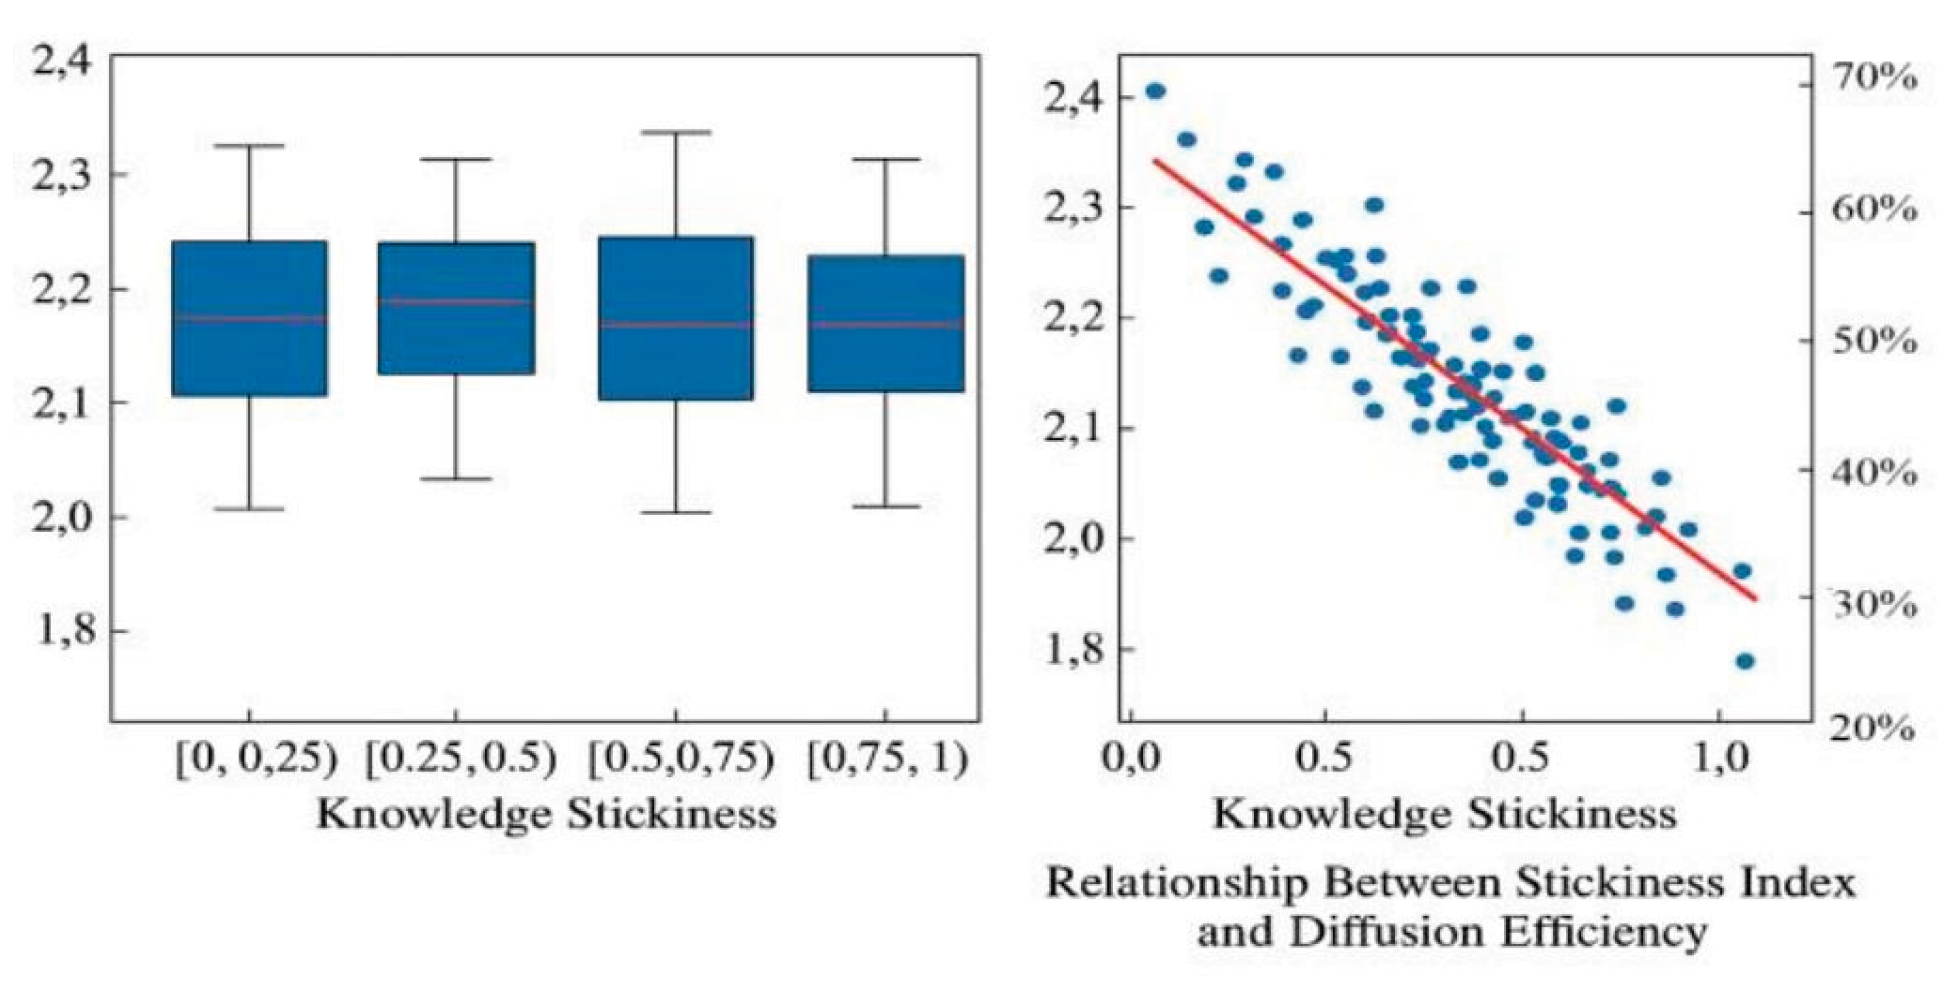

Table 1.
New Energy Technology Diffusion Efficiency Measurement Indicator System.
| Indicator Name | Measurement Dimension | Indicator Definition | Data Source | Annual Sample Scope |
|---|---|---|---|---|
| Weighted Shortest Path |
Diffusion Cost |
The shortest path length from the originating firm of a technology to other nodes in the network, with edge weights representing the inverse of collaboration strength |
Network Topology + Edge Weight Matrix |
Snapshot from 2010– 2023 |
| Average Diffusion Step Length |
Diffusion Speed |
Refers to the average number of hierarchical hops traversed during the propagation of a target technology, reflecting the hierarchical span of diffusion paths in the time series |
Patent Event Timestamps + Network Evolution Sequences |
14 Annual Evolution Node Map |
| Three-Year Diffusion Coverage Rate |
Diffusion Scale |
Percentage of enterprises reached by a technology within three years of its first recorded instance, calculated based on nodes with technology flow events |
Patent Transfer Records + Collaborative R&D + Technology Licensing |
From technology’s first appearance to T+3 |
Disclaimer/Publisher’s Note: The statements, opinions and data contained in all publications are solely those of the individual author(s) and contributor(s) and not of MDPI and/or the editor(s). MDPI and/or the editor(s) disclaim responsibility for any injury to people or property resulting from any ideas, methods, instructions or products referred to in the content. |
© 2025 by the authors. Licensee MDPI, Basel, Switzerland. This article is an open access article distributed under the terms and conditions of the Creative Commons Attribution (CC BY) license (http://creativecommons.org/licenses/by/4.0/).
Copyright: This open access article is published under a Creative Commons CC BY 4.0 license, which permit the free download, distribution, and reuse, provided that the author and preprint are cited in any reuse.


