Submitted:
25 December 2025
Posted:
26 December 2025
You are already at the latest version
Abstract
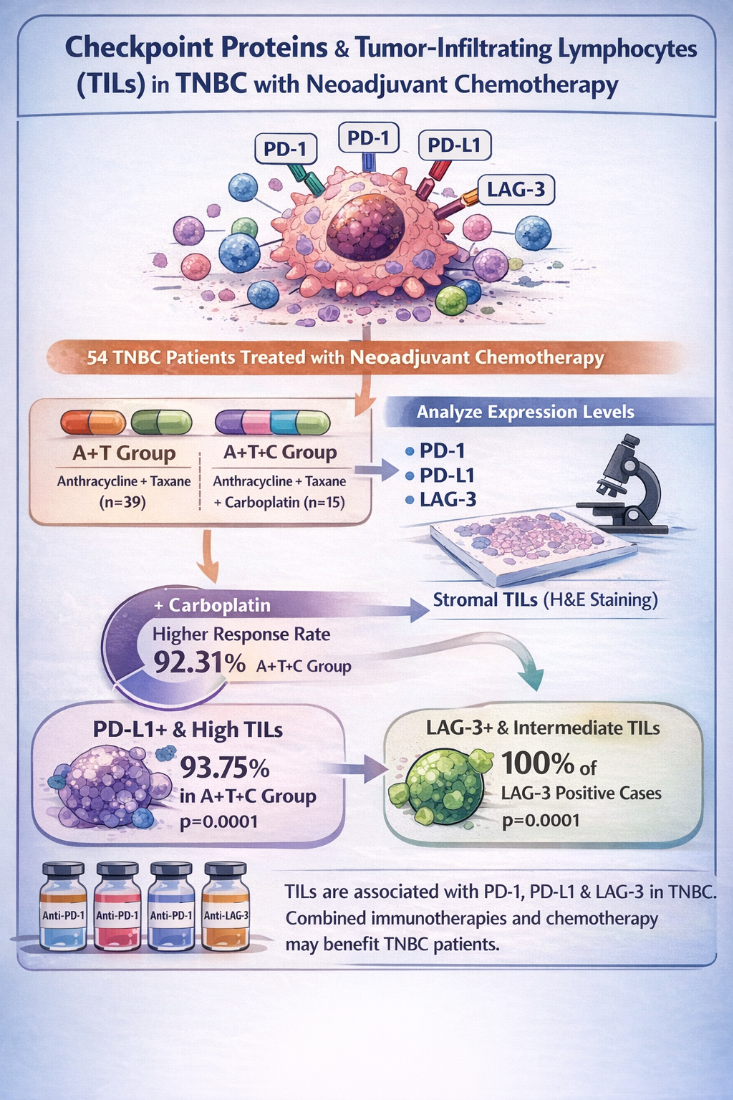
Background: Stromal tumor-infiltrating lymphocytes (TILs) are currently being considered as a prognostic factor in triple-negative breast cancer (TNBC); however, their association with the tumor immune microenvironment remains unclear. To address this knowledge gap, we aimed to evaluate the expression and association of Programmed cell death-1 (PD-1), its ligand programmed cell death ligand-1 (PD-L1) and lymphocyte activation gene-3 (LAG-3) checkpoint proteins with TILs in TNBC patients treated with neoadjuvant chemotherapy (NACT).
Methods: Patients (n=54; aged 24-45 years) were classified into two groups: thirty-nine received anthracycline-containing taxane- (A+T group) and fifteen received anthracycline/taxane /carboplatin (A+T+C group) in combinations. Immunohistochemistry (IHC) to evaluate PD-1, PD-L1 and LAG-3 expression. Stromal TIL were assessed using hematoxylin and eosin (H&E)-stained sections from TNBC patient biopsies obtained after NACT.
Results: Among the 54 TNBC patient biopsies, PD-L1 positivity on tumor cells was observed in twenty patients (66.67%) and was significantly associated with a larger tumor size (p=0.036).
However, The carboplatin-based NACT regimen demonstrated a higher clinical response rate (92.31%), with significant tumor size reduction in thirty-nine patients. In the same group, PD-L1-positive tumor cells showed significant association (p-value=0.0001) in fifteen patients with high TILs (93.75%). There were intermediate levels of TILs among nineteen patients (100%) with LAG-3-positive immune cells and only ten patients (25.64%) had high TIL levels (p-value=0.0001).
Conclusion: TILs are the most reliable immune markers and are significantly associated with PD-1, PD-L1 and LAG-3 in carboplatin based NACT treated group of TNBC patients. Anti-PD-1/PD-L1 and anti-LAG-3 therapy alone or in combination with chemotherapy may be promising treatments for a subset of TNBC patients.
Keywords:
programmed cell death-1
; programmed cell death ligand-1
; lymphocyte activation gene-3
; tumor-infiltrating lymphocytes
; triple-negative breast cancer
1. Introduction
Breast cancer (BC) in women is an extremely heterogeneous disease. It has a high mortality and incidence rate among all cancers in 2020 [1] Triple-negative breast cancer (TNBC) is the most aggressive subtype of BC and accounts for about 10–15% of all diagnosed breast cancer. The overall survival of TNBC patients is worse with a high risk of distant relapse in the first 3 to 5 years [2].
Tumor-infiltrating lymphocytes (TILs) are a vital component of the cellular anticancer immune response and are present in the tumor microenvironment. Their role is widely established in intratumor and stromal areas as a favorable prognostic factor in both adjuvant and neoadjuvant chemotherapy (NACT) especially in tumors with high proliferative activity such as TNBC [3,4].
In the last few decades, NACT for breast cancer treatment has increased and is now becoming a backbone modality in clinical practice worldwide. However, a reduction in tumor size is beneficial for assessing the response to NACT but many cancer patients fail to benefit from treatment and clinicians are unable to predict patient response to a given regimen. Therefore, it is crucial that we explore biomarkers for predicting patient response. Previous studies have revealed that high levels of TILs are correlated with better long-term and short-term prognosis of TNBC patients and could represent an important predictive factor for therapeutic response after NACT [5,6].
A growing body of research has revealed that treatment of malignancies specifically, immunotherapy has been highly successful by blocking the immune checkpoint receptor ‘programmed cell death-1’ (PD-1) and its ligands PD-L1. Both PD-1 and PD-L1 are expressed on immune cells and cancer cells, respectively and when PD-1 binds to PD-L1, immune cells are exhausted and their ability to target the cancer cells is affected . Although several studies have shown promising efficacy of anti–PD-1 or anti–PDL1 immunotherapy in different cancers including TNBC [7,8,9,10].
Additionally, previous study has shown that TILs are a source of other immune markers, such as PD-L1 [11]. However, it is noted that despite the clinical significance of anti–PD-1/PD-L1 therapy, resistance to this therapy remains a daunting challenge [12] , highlighting the importance of further research on other immune checkpoint and their association with TILs to permit more patients to benefit from immunotherapy. Resistance to the therapy involves the changing of phenotypes in cancer cells and/or in the tumor microenvironment.
Lymphocyte activating gene 3 (LAG-3) or CD 223 is another important checkpoint that is clinically targeted; and belongs to the immunoglobulin superfamily. It is an immune checkpoint target and is expressed on B cells, TILs, dendritic cells’ membranes and natural killer cells [13]. Furthermore, it has been shown that LAG-3 inhibits T-cell activation, homeostasis and proliferation, and may have synergistic effects with PD-1/PD-L1 [14,15].
The immune response to the tumor varies according to the clinicopathological characteristics of the patient and there is no clear answer to the question that which blockage will be more beneficial for which NACT regimen. However, studies aimed at clarifying the association of TILs with PD-1, PD-L1 and LAG3 expressions after NACT in TNBC patients with clinicopathological factors are lacking. In this study, we investigated Immun checkpoint proteins expression in TNBC patients by immunohistochemistry (IHC) and analyzed its relationship with TILs, to assess its prognostic value and impact on the clinical response of TNBC patients after NACT.
2. Materials and Methods
2.1. Study Design, Setting and Subjects
In this cross-sectional study, n=54 consecutive female (aged 24-45 years) patients who were diagnosed with TNBC (defined TNBC as when IHC for ER, PR, and HER-2 were negative) with and without metastases at Ziauddin Hospital and Jinnah Postgraduate Medical Centre (JPMC) between January 2021-July 2022 were included. All the TNBC patients underwent surgery following NACT. To determine the clinical tumor stages and nodal status, a standard bilateral mammography and ultrasound imaging of the breast prior to the start of NACT were used [16]. Patients who had a history of other malignant tumors and did not complete NAC were excluded.
2.2. NACT Regimen
All patients included in our study received at least four cycles of NACT regimens and were classified into two groups: anthracycline-containing, taxane- (A+T group) and anthracycline/taxane/carboplatin (A+T+C group) combinations. The tumor resection specimens obtained after surgery following NACT were subjected to detailed gross examination and the size of the tumor was measured using calipers.
All research was performed in accordance with the Declaration of Helsinki and with relevant guidelines/regulations. Informed consent was obtained from all the participants and their legal guardians. The study was approved by the Research Ethics Committee (ERC) of Ziauddin University (Reference code:1730120SMBIO).
2.3. Criteria for NACT Response
All patients’ responses were assessed clinically using RECIST (Response Evaluation Criteria in Solid Tumor) by mammography and breast ultrasonography [17]. Clinical response was assessed after four cycles of chemotherapy (A+T and A+T+C) and at the end of the treatment. Complete response (CR) was classified as primary tumor disappearance, partial response (PR) as a decrease in tumor size of at least 30% of the initial lesion, progressive disease (PD) as an increase in tumor size of at least 20% and stable disease (SD) as not classified as partial or progressive.
2.4. Histopathological Evaluation of Tumor-Infiltrating Lymphocytes (TIL)
Tissue specimens were collected during surgical resection after NACT and paraffin embedded tissue blocks were prepared. Analysis of stromal Tumor-infiltrating lymphocytes (TILs) was performed on a 4µm section by an experienced two pathologist. All tissues were fixed in 10% buffered formalin, paraffin-embedded and Hematoxylin–eosin-stained (H&E) sections were reviewed to confirm the histological diagnosis according to the World Health Organization (WHO) criteria using a light microscope at × 100–200 magnification. Histopathological assessment of the predictive factor TILs was evaluated by the international consensus recommendations and the known clinically relevant morphological features of inflammatory infiltrates in TNBC cancer [18,19].
https://www.tilsinbreastcancer.org/what-are-tils/). Area of necrosis and technical artifacts were avoided. The TILs levels were evaluated as percentages and three predefined categories were used: Low TIL scores of 0-10%, intermediate 11-40% and high TIL > 40%.
2.5. Immunohistochemical Evaluation of PD-1, PD-L1 and LAG3
Tissue sections (4-μm thick) were deparaffinized in xylene and rehydrated in an alcohol gradient. Antigen retrieval was performed in citrate buffer (pH 6.0) in a regular microwave at 95°C for 30 minutes. Endogenous peroxidase activity was blocked with 3% hydrogen peroxidase; then the slides were preincubated with 5% BSA blocking solution for 5 min and incubated overnight with the primary antibodies. Primary antibody against PD-1 (1:100 dilution; Monoclonal antibody (J121), Invitrogen), PD-L1 (1:100 dilution; polyclonal antibody, Invitrogen), and for LAG-3 (1:100 dilution; CD223 polyclonal antibody, Invitrogen) were used. Washed with PBS then incubated with HRP-secondary antibody (EnVision FLEX DAKO) for 45 min. DAB was added as a substrate for 10 min followed by washing and staining with hematoxylin. The sections were mounted. Immunecheckpoint protein expression was evaluated in immune cells (IC) and tumor cells (TC) separately. However, scored for IC- positivity was evaluated as the percentage of invasive tumor area covered by stained immune cells (lymphocytes, granulocytes,macrophages and dendritic cells). The tumor proportion score (TPS ) was determined as the number of immunecheckpoint protein expression on tumor cells divided by the total number of viable TC, multiplied by 100 [20,21]. All the stains were analyzed independently by two histopathologists.
2.6. Statistical Analysis
Fisher’s exact test was used to evaluate the association between categorized variables. We compared the size of the tumor by paired t test and p-values less than 0.05 were considered to be statistically significant. Fisher’s exact test was used to determine if there were any statistically significant differences between for the A+T and A+T+C groups.
3. Results
3.1. Clinical and Pathological Findings
Among the 54 TNBC female patients, the age ranges were 24-40 years (37 patients; 68.51%) and 41-45 years (17 patients; 31.48%), however, the mean age of the patients was 36.13 ± 6.18 years. The clinicopathological characteristics of the TNBC patients are shown in Table 1.
Before NACT, twenty-nine (53.70%) TNBC patients had cT3. However, after NACT, the tumor size reached ypT2 in 35 (64.81%), ypT1 7(12.96) and ypT3 in 3 (5.56%) of the patients. Lymph node stages ypN0 was detected 7 (12.96%), ypN1 in 44 (81.48%), ypN2 in 1 (1.86%) and ypN3 in 2(3.70) patients. All the patients had infiltrating ductal carcinoma (IDC) 54 (100%) and were grade III 42(77.77%). Modified radical mastectomy (MRM) was the primary surgical treatment in 50 patients (92.59%), followed by breast conservative surgery (7.40%). In addition, no family history was recorded in 50 patients (92.59%). Fifteen (27.78%) TNBC patients received anthracycline-containing taxane (A+T) and thirty-nine (77.22%) received anthracycline/taxane /carboplatin (A+T+C).
3.2. Clinical Response
The response to NACT showed promising results, according to Table 2, among the thirty-nine patients in the A+T+C group, 10 (25.64%) had clinical complete response, 26 (66.67%) had partial remission, two patients (5.13%) had stable disease, and one (2.56%) had progressive disease. The rate of response was observed higher (92.31%) in the A+T+C group compared with the A+T group. However, a significant decrease in tumor size (2.67 cm) was also observed in the A+T+C group as shown in Table 3.
3.3. Assessment of Stromal TIL in TNBC Patients and Their Association with Clinicopathological Parameters
TILs were observed in 54 TNBC patients at varying percentages and were most frequently detectable in stromal compartments (Figure 1. A1-A2, B1-B2 & C1-C2). The associations of TILs with clinicopathological parameters are summarized in Table 4. In the present study, we found a statistically significant association between TILs level and higher tumor grade (p-value=0.049). However, high level TILs were found in 16 TNBC patients (53.33%), while 10 had intermediate TILs level (33.33%) and only 4 patients had low level TILs (13.33%) with tumor size T3. On the other hand, we did not observe any significant associations between TILs and age (p-value=0.536), tumor subtype (p-value=0.581), histologic grade (p-value=0.536), N stage (0.538) and metastasis (p-value=0.499).
3.4. Immunohistochemical Staining of PD1 and PD-L1 and Their Association with Clinicopathological Parameters
The associations of PD-L1- and PD-1 positive expression (Figure 2. A1-A4 & B1-B4) on tumor cells (TC) and immune cells (IC) with clinicopathologic features were investigated (Table 5). The TC of the twenty-three younger patients (aged 24-40 years) who were PD-L1 positive (62%) (p-value=0.563). Tumor cells in twenty patients showed PD-L1 positive expression (66.67%) was significantly associated with a larger tumor size (p-value=0.036).
Twenty-six (aged 24-40 years) patients showed positive PD-1 expression (70.27%) on IC (p-value=0.912). We have also found PD-1 expression (93.33%) on IC in twenty-eight patients which was significantly associated with a T3 larger tumor size (p-value=0.073). However, no significant results were observed of PD-L1 and PD-1 in A+T and A+T+C treated groups.
3.5. Assessment of Stromal TIL on PD-L1 and PD-1 Positive Cells
PD-L1-positive tumor cells showed high TIL (100%) in seven patients of A+T treated group out of fifteen (p-value=0.005). In A+T+C treated group, PD-L1-positive tumor cells showed significant result (p-value=0.0001) in fifteen patients out of thirty-nine with high TIL (93.75%), however, eleven patients (57.89%) have intermediate TILs levels. Only seven patients (43.75%) had high TILs in PD-1 positive tumor cells (Table 5).
3.6. Immunohistochemical Staining of LAG-3 and Its Association with Clinicopathological Parameters
Among 54 TNBC patients, twenty-nine had positive (78.38%) LAG-3 expression (Figure 2 C1-C4) on IC and TC (18.92%) which was not statistically considered significant in both age groups. We did not observe any significant association between LAG-3 expressions with histologic type (p-value=0.308), clinical stage (p-value=0.849), lymph node (p-value=0.375) and metastasis. Lymph node, tonsil and ovary tissues were used as positive control for PD-1, PD-L1 and LAG-3 expression as shown in supplementary Figure S1.
3.7. Assessment of Stromal TILs LAG-3 Positive Cells
However, significantly (p-value=0.0001) positive LAG-3 immune cells showed intermediate levels of TILs in nineteen patients (100%) of A+T+C treated group out of thirty-nine and only ten patients (25.64%) were shown high TIL level. Only in six patients (83.71%), LAG-3 positive expression immune cells were showed high level of TILs (p-value=0.050) in the A+T treated group (Table 6).
4. Discussion
Studies on immune checkpoint proteins in breast cancer have increased their clinical importance and can improve patient management algorithms in recent years. In the tumor microenvironment (TME) which includes tumor cells and immune cells, PD-1, PD-L1 and LAG-3 are resistant to antitumor therapy [22].
Despite developments in this evolving field, very few immune markers have been investigated as therapeutic targets in TNBC. Our study is the first of its kind which has evaluated three immune checkpoint proteins in relation with TILs and clinicopathological features in a subset of TNBC patients who received NACT.
Based on the RECIST criteria, our study demonstrated the effectiveness of carboplatin based neo-adjuvant regimen and an overall good clinical response of 92.3% (complete + partial) was observed with a decrease in tumor size (2.67 cm) in the A+T+C group.
Similarly, Loibl, et al [23] showed that carboplatin effectively improved the rate of pathological complete response (pCR) in TNBC patients. Prihantono [24] reported an overall response rate (complete and partial) 93.33% in seventy TNBC patients which aligns closely with our findings. Kunnuru et al reported good clinical and pathological response (78%) in 15% TNBC patients [25].
It is known that PD-L1 is expressed on cancer cells within tumors, enhancing anti-PD-L1/PD-1 treatment efficacy and could be a biomarker for identifying patients who are likely to respond to immune checkpoint blockade therapy [26].
There are few controversies in the literature regarding the therapeutic response of TILs as a clinical predictor of response to neoadjuvant therapy among breast cancer types [27,28]. However, some studies have shown that the tumor response rate to NACT associated with better long-term survival in patients with high TILs such as HER2 positive and TNBC patients [29].
However, there is a still lack of information regarding TILs counts on PD-L1 positive cells after NACT which could be good clinical predictors. We obtained statistically significant results in twenty of the fifty-four patients, PD-L1 positive expression (66.67%) on TC was significantly associated with a larger tumor size (p-value=0.036), unfortunately, there were no significant differences found between two treatment groups.
In the A+T+C treated group, fifteen PD-L1 positive expression patients (93.75%) were categorized by high level TILs on tumor cells (p-value=0.0001). The presence of PD-L1 expressing cancer cells within tumors with high TIL could be an important predictor of the response to immune checkpoint blockade therapy. Previous studies have shown conflicting results regarding the relationship between PD-L1 expression and prognosis. Tumor cell PD-L1 expression was associated with poor prognosis in breast cancer patients while PD-L1 mRNA was associated with better prognosis [30,31].
In contrast, Berckelaer [32] and his group reported 1.9% PD-L1 expression in tumor cells which was very rare, while in TILs the expression was much higher (43%). Amin et al [33] found PD-L1 expression and large tumor size in a younger age group (≤50 years) . However, we also detected PD-L1 expression on the TC in 66.67% of the twenty patients and significant results (p-value=0.036) were found with larger tumor size.
Previously, it was reported that PD-L1 expression in TIL was a poor prognostic factor in TNBC [34]. Interestingly, Mittendorf EA et al investigated higher PD-L1 expression in TNBC group as compared to non-TNBC for the first time, however intratumoral CD8+ T cells were more likely to be found in the PD-L1-positive group [35]. Similar studies also confirmed that PD-L1 was associated with high TILs in the TNBC subtype and improved the patients’ outcomes [36,37]. The relationship between PD-L1 expression and anticancer immunity is also unknown, Beckers et al. first noted that PD-L1 was expressed at a higher level of TIL in TNBC than hormone receptor-positive breast cancer patients [37]. Oner and his group [38]. confirmed that the percentage of PD-L1 expression on lymphocyte tumor was highly correlated (p-value= 0.0001). Schalper et al. showed that breast cancer patients with high PD-L1 expression on ICs had a better prognosis [31].
Our study also revealed a significantly (p-value= 0.001) intermediate level of TILs (100%) and a high TILs level 43.75% in positive PD-1 expression in the A+T+C treated group and 93.33% of patients were significantly associated with a larger tumor size (p-value=0.073). Ren and his group also reported higher TIL PD1protein expression and an association with longer survival in a TNBC patients [39]. Generally, these findings may confirm that PD-1 induces TIL-mediated antitumor inflammatory response rather than tumor immune evasion.
These controversies indicate that evaluations of TILs and PD-1/PD-L1 expression in TNBC patients and correlations with other coinhibitory checkpoint proteins are still needed. In this respect, the analyses performed in the present study associated TILs with the LAG-3 immune checkpoint in TNBC patients after NACT which has not been addressed in previous studies. The present study showed LAG-3 positive expression with high levels of TILs (25.64%) in ten A+T+C treated immune cells patients (p-value=0.0001) while in the same group, nineteen patients had intermediate TIL levels (100%). However, statistically significant (p-value=0.05) results showed in the A+T treated group for only six immune cells with high TIL (85.71%). Thus, we demonstrated that LAG-3 positive TILs were present in both NACT treatment groups and their presence in the tumor microenvironment tended to be associated with good prognosis and may benefit from immunomodulatory drugs in TNBC patients.
Previously, Bottai et al reported that in approximately 15% of TNBC patients, LAG-3 and PD-1 were simultaneously expressed on TILs [40]. A study by Wang et al investigated that in pre-neoadjuvant chemotherapy specimens, LAG-3 expression in TNBC was significantly correlated with pathological complete response; however, post-neoadjuvant chemotherapy specimens showed high expression of LAG-3 and had a significant effect on nodal status [41].
Recently in cancer patients, Lag-3 targeted therapy is a new member of the therapeutic arsenal and Relatlimab, an anti-LAG-3 monoclonal antibody, has been approved by the FDA in combination with PD-1 inhibitors [42].
One of the limitations of our study was that there were few numbers of patients and long term follow up could not be performed to predict the influence of immune checkpoins proteins in free and overall survivals of the patients. However, the TNBC patients received standardized treatment after enrollment. A further limitation of our study is that perform immunohistochemical evaluations of TIL, PDL-1, PD-1 and LAG-3 biomarkers expression in TNBC biopsies before NACT which can predict the pathological complete response in TNBC patients.
Conclusion
This study explored the status of TILs in TNBC patients who received NACT and their associations with clinicopathological parameters. Our findings also showed that TILs are the most reliable immune markers associated with PD-1, PD-L1 and LAG-3 immune checkpoint protein expressions especially in patients receiving carboplatin based NACT. Combining the evaluation of TILs and PD-1, PD-L1 and LAG-3 expression in the TNBC microenvironment may further refine the prognostication and may serve as an additional pathological parameter. Anti-PD-1/PD-L1 therapy alone or combined with chemotherapy may be a promising treatment for a subset of patients with TNBC.
Supplementary Materials
The following supporting information can be downloaded at the website of this paper posted on Preprints.org. Figure S1: Positive and negative control of PD-1, PD-L1, and LAG-3 at 200X : (A) PD-1 Positive Control; (B) Negative Control (Lymph node); (C) PD-L1 Positive Control; (D) Negative Control (Tonsil); (E) LAG-3 Positive Control; (F) Negative Control (Ovary); Scale bar; 100 µm.
Funding
This research was funded by Higher Education Commission (HEC), Karachi Pakistan grant (Reference no. 20-11952/NRPU/RGM/R&D/HEC).
Author contributions
Conception/design: SM won a research grant from the Higher Education Commission (HEC), Karachi Pakistan, Provision of study material or patients: GH diagnosed cases and provided TNBC biopsies and supported in assembly of data, MS; Performed the experiments, MS, SS AH & SM; Data analysis and interpretation. SM; Manuscript writing: BW, AH & JP; manuscript review, all authors approved the final draft of the manuscript.
Data availability
The data that support the findings of this study are available in the article and in the supplementary materials. Further inquiries can be directed to the corresponding author.
Acknowledgment
This research was funded by Higher Education Commission (HEC), Karachi Pakistan grant (Reference no. 20-11952/NRPU/RGM/R&D/HEC). There is no any persons or third-party services were involved in the research or manuscript preparation who are not listed as an author.
Declarations
Ethics approval
This study conforms to the ethical guidelines of the Declaration of Helsinki. The study protocol was reviewed and approved by Research Ethics Committee (ERC) of Ziauddin University (Reference code:1730120SMBIO).
Informed consents
Informed consent was obtained from all the participants and their legal guardians.
Competing interests
All authors declare no potential conflicts of interest.
References
- Sung, H.; Ferlay, J.; Siegel, R.L.; Laversanne, M.; Soerjomataram, I.; Jemal, A.; et al. Global cancer statistics 2020: GLOBOCAN estimates of incidence and mortality worldwide for 36 cancers in 185 countries. CA Cancer J Clin. 2021, 71, 209–249. [Google Scholar] [CrossRef]
- Foulkes, W.D.; Smith, I.E.; Reis-Filho, J.S. Triple-negative breast cancer. N Engl J Med. 2010, 363, 1938–48. [Google Scholar] [CrossRef]
- Mao, Y.; Qu, Q.; Chen, X.; Huang, O.; Wu, J.; Shen, K. The prognostic value of tumor-infiltrating lymphocytes in breast cancer: a systematic review and meta-analysis. PloS one. 2016, 11, e0152500. [Google Scholar] [CrossRef]
- Teijido, P.G.; Cabal, M.L.; Fernández, I.P.; Pérez, Y.F. Tumor-infiltrating lymphocytes in triple negative breast cancer: the future of immune targeting. Clin Med Insights Oncol. 2016, 10, CMO–S34540. [Google Scholar]
- Gao, G.; Wang, Z.; Qu, X.; Zhang, Z. Prognostic value of tumor-infiltrating lymphocytes in patients with triple-negative breast cancer: a systematic review and meta-analysis. BMC cancer 2020, 20, 179. [Google Scholar] [CrossRef]
- Gao, Z.H.; Li, C.X.; Liu, M.; Jiang, J.Y. Predictive and prognostic role of tumour-infiltrating lymphocytes in breast cancer patients with different molecular subtypes: a meta-analysis. BMC Cancer 2020, 20, 1150. [Google Scholar] [CrossRef]
- Eno, J. Immunotherapy through the years. J Adv Pract Oncol. 2017, 8, 747. [Google Scholar]
- 8; Powles, T.; Eder, J.P.; Fine, G.D.; Braiteh, F.S.; Loriot, Y.; Cruz, C.; et al. MPDL3280A (anti-PD-L1) treatment leads to clinical activity in metastatic bladder cancer. Nature 2014, 515, 558–562. [Google Scholar]
- Rizvi, NA.; Mazières, J.; Planchard, D.; Stinchcombe, T.E.; Dy, G.K.; Antonia, S.J.; et al. Activity and safety of nivolumab, an anti-PD-1 immune checkpoint inhibitor, for patients with advanced, refractory squamous non-small-cell lung cancer (CheckMate 063): a phase 2, single arm trial. Lancet Oncol. 2015, 16, 257–265. [Google Scholar] [CrossRef] [PubMed]
- Yang, T.; Li, W.; Huang, T.; Zhou, J. Immunotherapy Targeting PD-1/PD-L1 in Early-Stage Triple-Negative Breast Cancer. J Pers Med. 2023, 13, 526. [Google Scholar] [CrossRef] [PubMed]
- Gonzalez-Ericsson, P.I.; Stovgaard, E.S.; Sua, L.F.; Reisenbichler, E.; Kos, Z.; Carter, J.M.; et al. International Immuno-Oncology Biomarker Working Group. The path to a better biomarker: application of a risk management framework for the implementation of PD-L1 and TILs as immuno-oncology biomarkers in breast cancer clinical trials and daily practice. J Pathol. 2020, 250, 667–684. [Google Scholar] [CrossRef]
- Zhao, X.; Subramanian, S. Intrinsic Resistance of Solid Tumors to Immune Checkpoint Blockade Therapy Resistance to Immune Checkpoint Blockade Therapy. Cancer Res. 2017, 77, 817–822. [Google Scholar] [CrossRef]
- Kisielow, M.; Kisielow, J.; Capoferri-Sollami, G.; Karjalainen, K. Expression of lymphocyte activation gene 3 (LAG-3) on B cells is induced by T cells. Eur J Immunol. 2005, 35, 2081–2088. [Google Scholar] [CrossRef] [PubMed]
- Andrews, L.P.; Marciscano, A.E.; Drake, C.G.; Vignali, D.A.A. LAG 3 (CD 223) as a cancer immunotherapy target. Immunol Rev. 2017, 276, 80–96. [Google Scholar] [CrossRef]
- Takaya, S.; Saito, H.; Ikeguchi, M. Upregulation of immune checkpoint molecules, PD-1 and LAG-3, on CD4+ and CD8+ T cells after gastric cancer surgery. Yonago Acta Med. 2015, 58, 39. [Google Scholar]
- 16; Thomassin-Naggara, I.; Tardivon, A.; Chopier, J. Standardized diagnosis and reporting of breast cancer. Diagn Interv Imaging. 2014, 95, 759–766. [Google Scholar]
- Kazuhiro, K.; Yasuo, M.; Toshiko, Y.; Soichi, O.; Tomoko, H.; Koichiro, Y. Assessment of tumor response to neoadjuvant chemotherapy in patients with breast cancer using MRI and FDG-PET/CT-RECIST 1.1 vs. PERCIST 1.0. Nagoya J Med Sci. 2018, 80, 183–197. [Google Scholar]
- Salgado, R.; Denkert, C.; Demaria, S.; Sirtaine, N.; Klauschen, F.; Pruneri, G.; et al. The evaluation of tumor-infiltrating lymphocytes (TILs) in breast cancer: recommendations by an International TILs Working Group 2014. 2014. Ann Oncol. 2015, 26, 259–71. [Google Scholar] [CrossRef] [PubMed]
- Dieci, M.V.; Radosevic-Robin, N.; Fineberg, S.; van den Eynden, G.; Ternes, N.; Penault-Llorca, F.; et al. Update on tumor-infiltrating lymphocytes (TILs) in breast cancer, including recommendations to assess TILs in residual disease after neoadjuvant therapy and in carcinoma in situ: A report of the International Immuno-Oncology Biomarker Working Group on Breast Cancer. Semin Cancer Biol. 2018, 52, 16–25. [Google Scholar]
- Vennapusa, B.; Baker, B.; owanetz, M.; Boone, J.; Menzl, I.; Bruey, J.M.; et al. Development of a PD-L1 complementary diagnostic immunohistochemistry assay (SP142) for atezolizumab. Appl Immunohistochem Mol Morphol 2019, 27, 92e100. [Google Scholar] [CrossRef]
- Kulangara, K.; Zhang, N.; Corigliano, E.; Guerrero, L.; Waldroup, S.; Jaiswal, D.; et al. Clinical utility of the combined positive score for programmed death ligand-1 expression and the approval of pembrolizumab for treatment of gastric cancer. Arch Pathol Lab Med 2019, 143, 330e7. [Google Scholar] [CrossRef]
- Huang, R.Y.; Francois, A.; McGray, A.R.; Miliotto, A.; Odunsi, K. Compensatory upregulation of PD-1, LAG-3, and CTLA-4 limits the efficacy of single-agent checkpoint blockade in metastatic ovarian cancer. Oncoimmunology 2017, 6, e1249561. [Google Scholar] [CrossRef]
- Loibl, S.; Weber, K.E.; Timms, K.M.; Elkin, E.P.; Hahnen, E.; Fasching, P.A.; et al. Survival analysis of carboplatin added to an anthracycline/taxane-based neoadjuvant chemotherapy and HRD score as predictor of response-final results from GeparSixto. Ann Oncol. 2018, 1, 2341–2347. [Google Scholar] [CrossRef]
- Prihantono; Faruk, M. Neoadjuvant chemotherapy response, disease-free survival, and overall survival of breast cancer in a single institution. Surg Open Sci. 2023, 15, 19–25. [Google Scholar] [CrossRef]
- Kunnuru, S.K.R.; Thiyagarajan, M.; Daniel, J.M.; Singh, K. B. A Study on Clinical and Pathological Responses to Neoadjuvant Chemotherapy in Breast Carcinoma. Breast Cancer. 2020, 12, 259–266. [Google Scholar] [CrossRef] [PubMed]
- Teng, M.W.; Ngiow, S.F.; Ribas, A.; Smyth, M.J. Classifying cancers based on T-cell infiltration and PD-L1. Cancer Res. 2015, 75, 2139–2145. [Google Scholar] [CrossRef] [PubMed]
- Denkert, C.; Von. Minckwitz, G.; Darb-Esfahani, S.; Lederer, B.; Heppner, B.I.; Weber, K.E.; et al. Tumour-infiltrating lymphocytes and prognosis in different subtypes of breast cancer: A pooled analysis of 3771 patients treated with neoadjuvant therapy. Lancet Oncol. 2018, 19, 40–50. [Google Scholar] [CrossRef]
- Stanton, S.E; Adams, S.; Disis, M.L. Variation in the incidence and magnitude of tumor-infiltrating lymphocytes in breast cancer subtypes: A systematic review. JAMA Oncol. 2016, 2, 1354–1360. [Google Scholar] [CrossRef]
- Karn, T.; Jiang, T.; Hatzis, C.; Sänger, N.; El-Balat, A.; Rody, A.; et al. Association between genomic metrics and immune infiltration in triple-negative breast cancer. JAMA Oncol. 2019, 3, 1707–1711. [Google Scholar] [CrossRef]
- Muenst, S.; Schaerli, A.R.; Gao, F.; Däster, S.; Trella, E.; Droeser, R.A.; et al. Expression of programmed death ligand 1 (PD-L1) is associated with poor prognosis in human breast cancer. Breast Cancer Res Treat. 2014, 146, 15–24. [Google Scholar] [CrossRef] [PubMed]
- Schalper, K.A.; Velcheti, V.; Carvajal, D.; Wimberly, H.; Brown, J.; Pusztai, L.; et al. In Situ Tumor PD-L1 mRNA Expression Is Associated with Increased TILs and Better Outcome in Breast Carcinomas PD-L1 mRNA Positivity and Outcome in Breast Cancer. Clin Cancer Res. 2014, 20, 2773–2782. [Google Scholar] [CrossRef]
- Berckelaer, C.V.; Rypens, C.; van Dam, P.; Pouillon, L.; Parizel, M.; Schats, K.A.; et al. Infiltrating stromal immune cells in inflammatory breast cancer are associated with an improved outcome and increased PD-L1 expression. Breast Cancer Res. 2019, 21, 1–12. [Google Scholar] [CrossRef]
- Amin, N.H.; Abou-Bakr, A.A.; Eissa, S.; Nassar, H.R.; Eissa, T.S.; Mohamed, G. Expression of PD-L1 in Early-Stage Invasive Breast Carcinoma and Its Relation to Tumor-Infiltrating Lymphocytes. Asian Pac J Cancer Prev. 2022, 23, 1091. [Google Scholar] [CrossRef] [PubMed]
- Wang, X.; Liu, Y. PD-L1 expression in tumor infiltrated lymphocytes predicts survival in triple-negative breast cancer. Pathol Res Pract. 2019, 216, 152802. [Google Scholar] [CrossRef]
- Mittendorf, E.A.; Philips, A.V.; Meric-Bernstam, F.; Qiao, N.; Wu, Y.; Harrington, S.; et al. PD-L1 expression in triple-negative breast cancer. Cancer Immunol Res. 2014, 2, 361–370. [Google Scholar] [CrossRef]
- Alkhayyal, N.; Elemam, N.M.; Hussein, A.; Magdub, S.; Jundi, M.; Maghazachi, A.A.; et al. Expression of immune checkpoint (PD-L1 and IDO) and tumour-infiltrating lymphocytes in breast cancer. Heliyon 2022, 8, e10482. [Google Scholar] [CrossRef]
- Beckers, R.K.; Selinger, C.I.; Vilain, R.; Madore, J.; Wilmott, Js.; Harvey, K.; et al. Programmed death ligand 1 expression in triple-negative breast cancer is associated with tumour-infiltrating lymphocytes and improved outcome. Histopathology 2016, 69, 25–34. [Google Scholar] [CrossRef]
- 38; Oner, G.; Önder, S.; Karatay, H.; Ak, N.; Tükenmez, M.; Müslümanoğlu, M.; et al. Clinical impact of PD-L1 expression in triple-negative breast cancer patients with residual tumor burden after neoadjuvant chemotherapy. World J Surg Oncol. 2021, 19, 264. [Google Scholar]
- Ren, X.; Wu, H.; Lu, J.; Zhang, Y.; Luo, Y.; Xu, Q.; et al. PD1 protein expression in tumor infiltrated lymphocytes rather than PDL1 in tumor cells predicts survival in triple-negative breast cancer. Cancer Biol. Ther. 2018, 19, 373–380. [Google Scholar] [CrossRef] [PubMed]
- Bottai, G.; Carlotta, R.; Agnese, L.; Tommaso, L.D.; Tinterri, C.; Torrisi, R.; et al. An immune stratification reveals a subset of PD-1/LAG-3 double-positive triple-negative breast cancers. Breast Cancer Res. 2016, 18, 1–10. [Google Scholar] [CrossRef] [PubMed]
- Wang, Y.; Tieying, D.; Qijia, X.; Zhao, H.; Qin, L.; Zhang, Q. Lymphocyte-Activation Gene-3 Expression and Prognostic Value in Neoadjuvant-Treated Triple-Negative Breast Cancer. J Breast Cancer 2018, 21, 124–133. [Google Scholar] [CrossRef] [PubMed]
- Ibrahim, R.; Saleh, K.; Chahine, C.; Khoury, R.; Khalife, N.; Le Cesne, A. LAG-3 Inhibitors: Novel Immune Checkpoint Inhibitors Changing the Landscape of Immunotherapy. Biomedicines 2023, 11, 1878. [Google Scholar] [CrossRef] [PubMed]
Figure 1.
Evaluation of stromal tumor infiltrating lymphocytes (TILs) in TNBC: Stromal TIL (TILs) evaluation area was analyzed at 100x and 200x magnification. Representative H & E-stained images showing three different stromal TILs levels: A1 and A2: Low level (0-10%), B1 and B2: Intermediate level (11-40%), arrow indicates the distribution of the tumor area. C1 and C2: high level (>40%); Scale bar 100 µm.
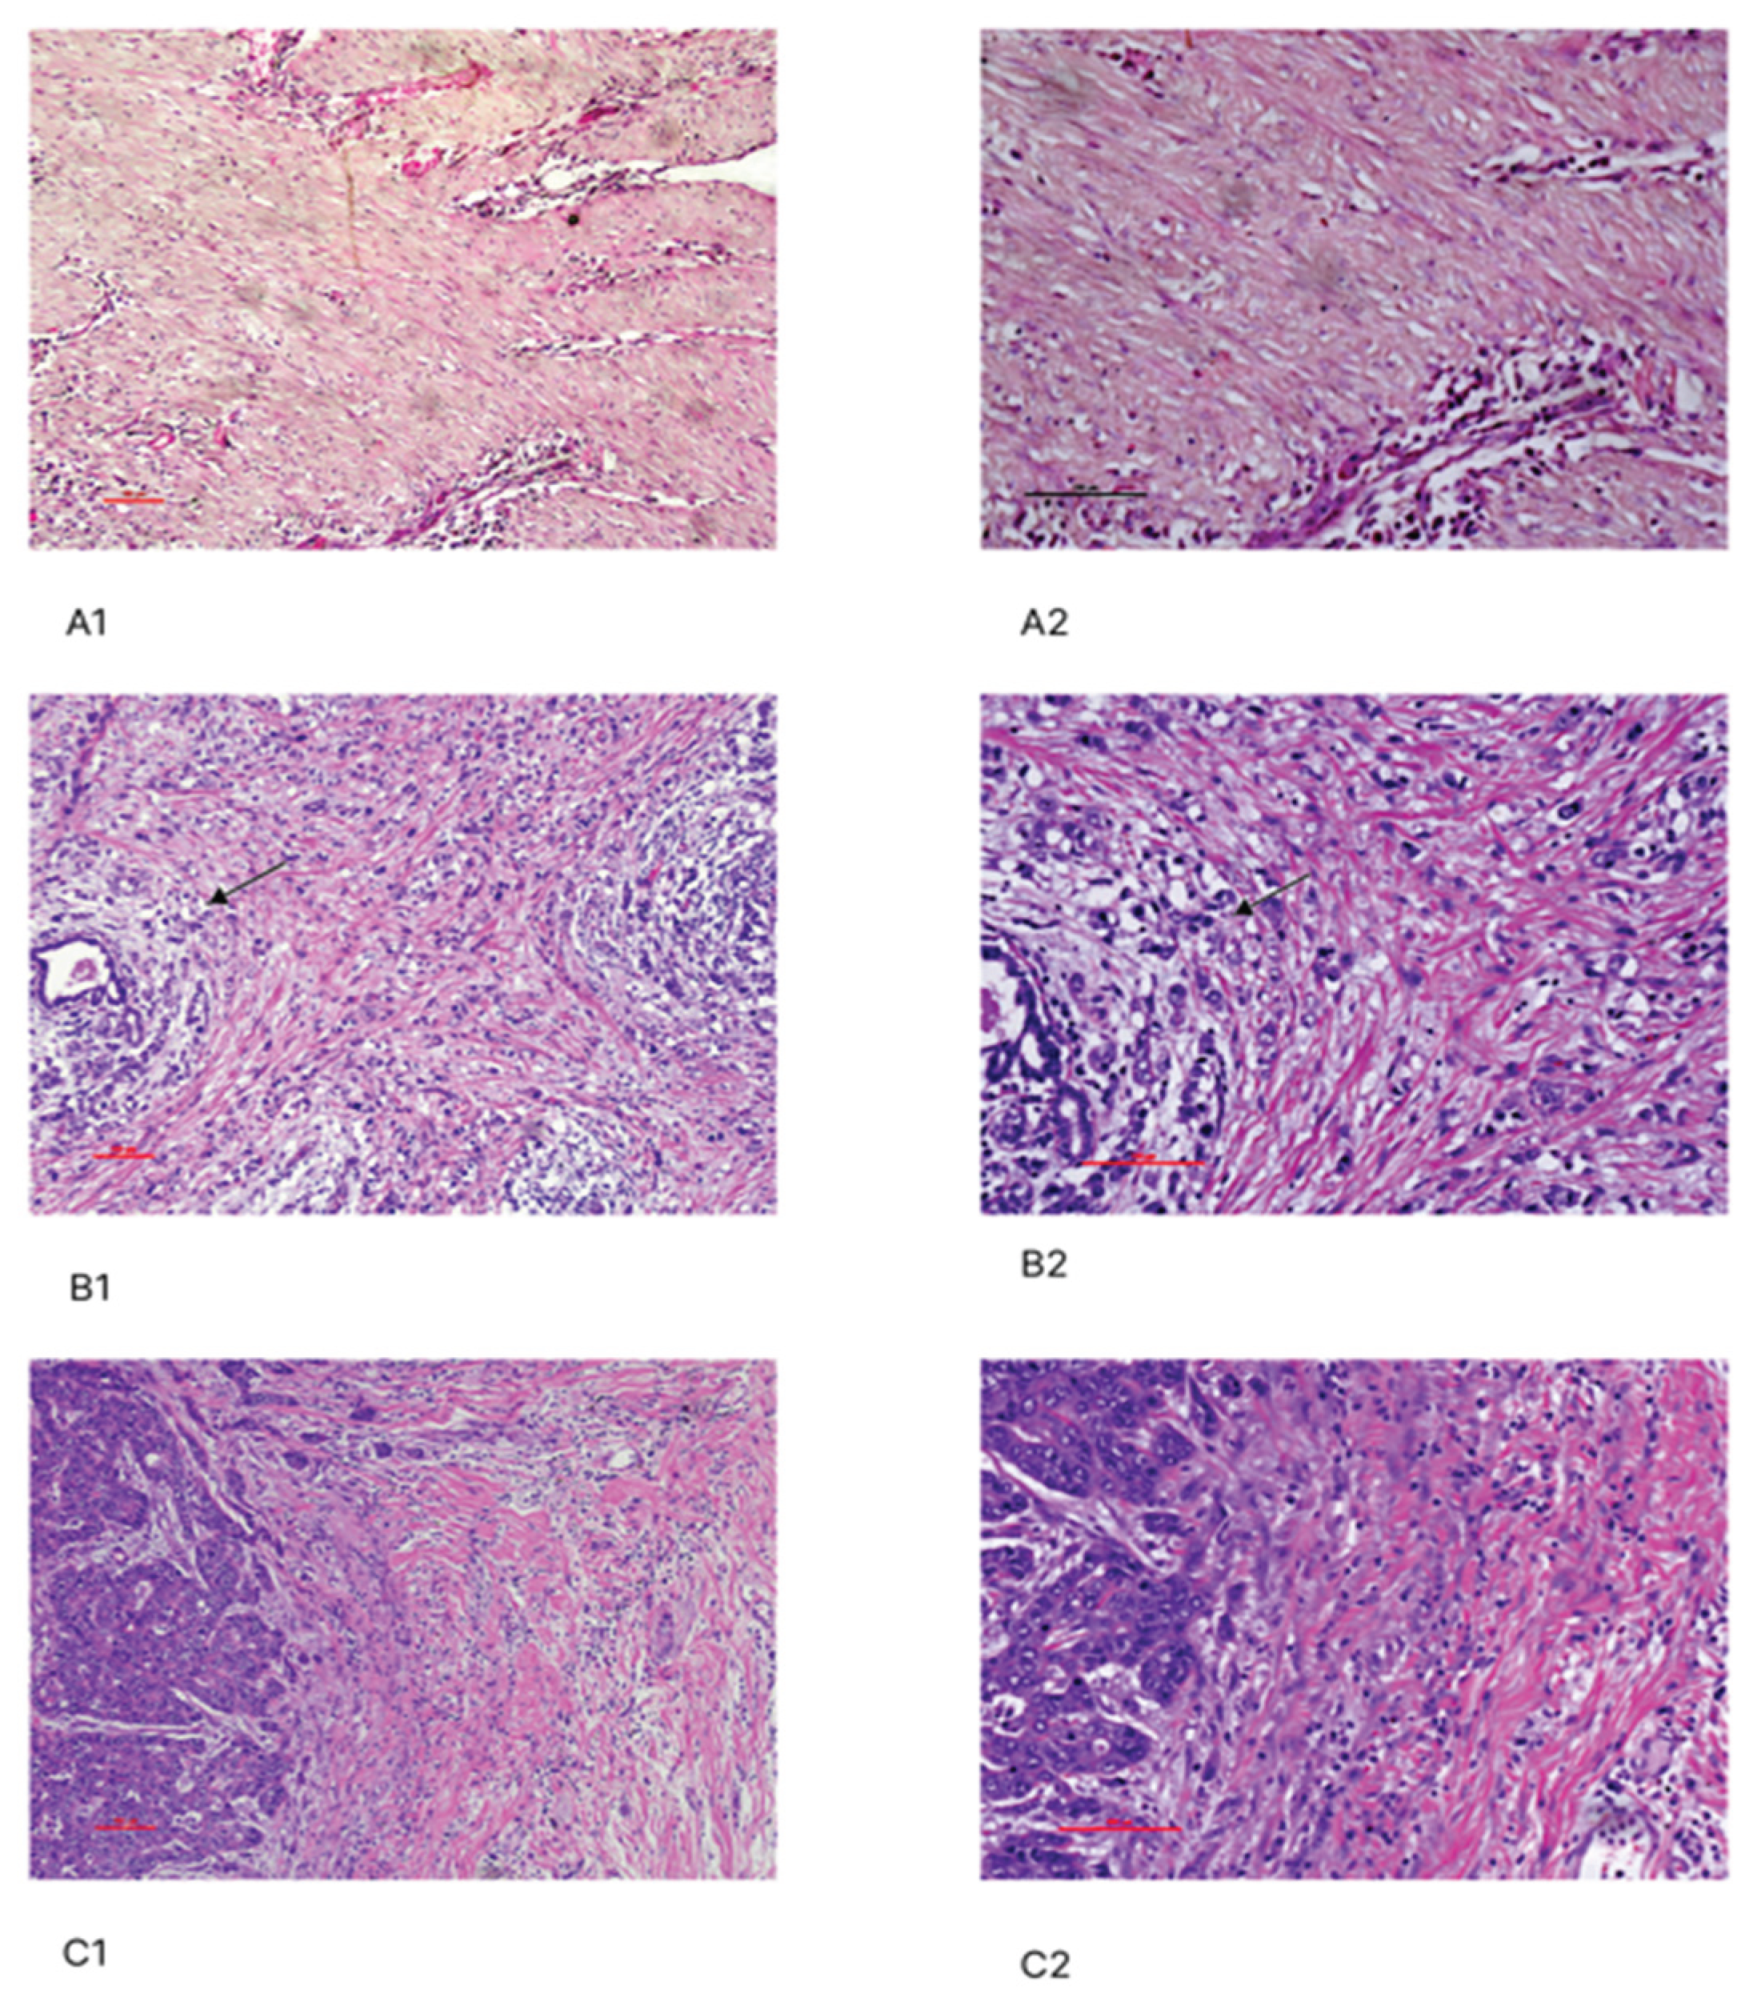
Figure 2.
Immunohistochemical features of PD-1, PD-L1 and LAG-3 at 100X and 200X: PD-L1: A1 &A2. Tumor cells; A3 &A4. Immune cells; PD-1: B1 & B2. Tumor cells; B3 & B4. Immune cells; LAG-3: C1 & C2. Immune cells; C3 & C4. Tumor cells; Scale bar; 100 µm.
Figure 2.
Immunohistochemical features of PD-1, PD-L1 and LAG-3 at 100X and 200X: PD-L1: A1 &A2. Tumor cells; A3 &A4. Immune cells; PD-1: B1 & B2. Tumor cells; B3 & B4. Immune cells; LAG-3: C1 & C2. Immune cells; C3 & C4. Tumor cells; Scale bar; 100 µm.
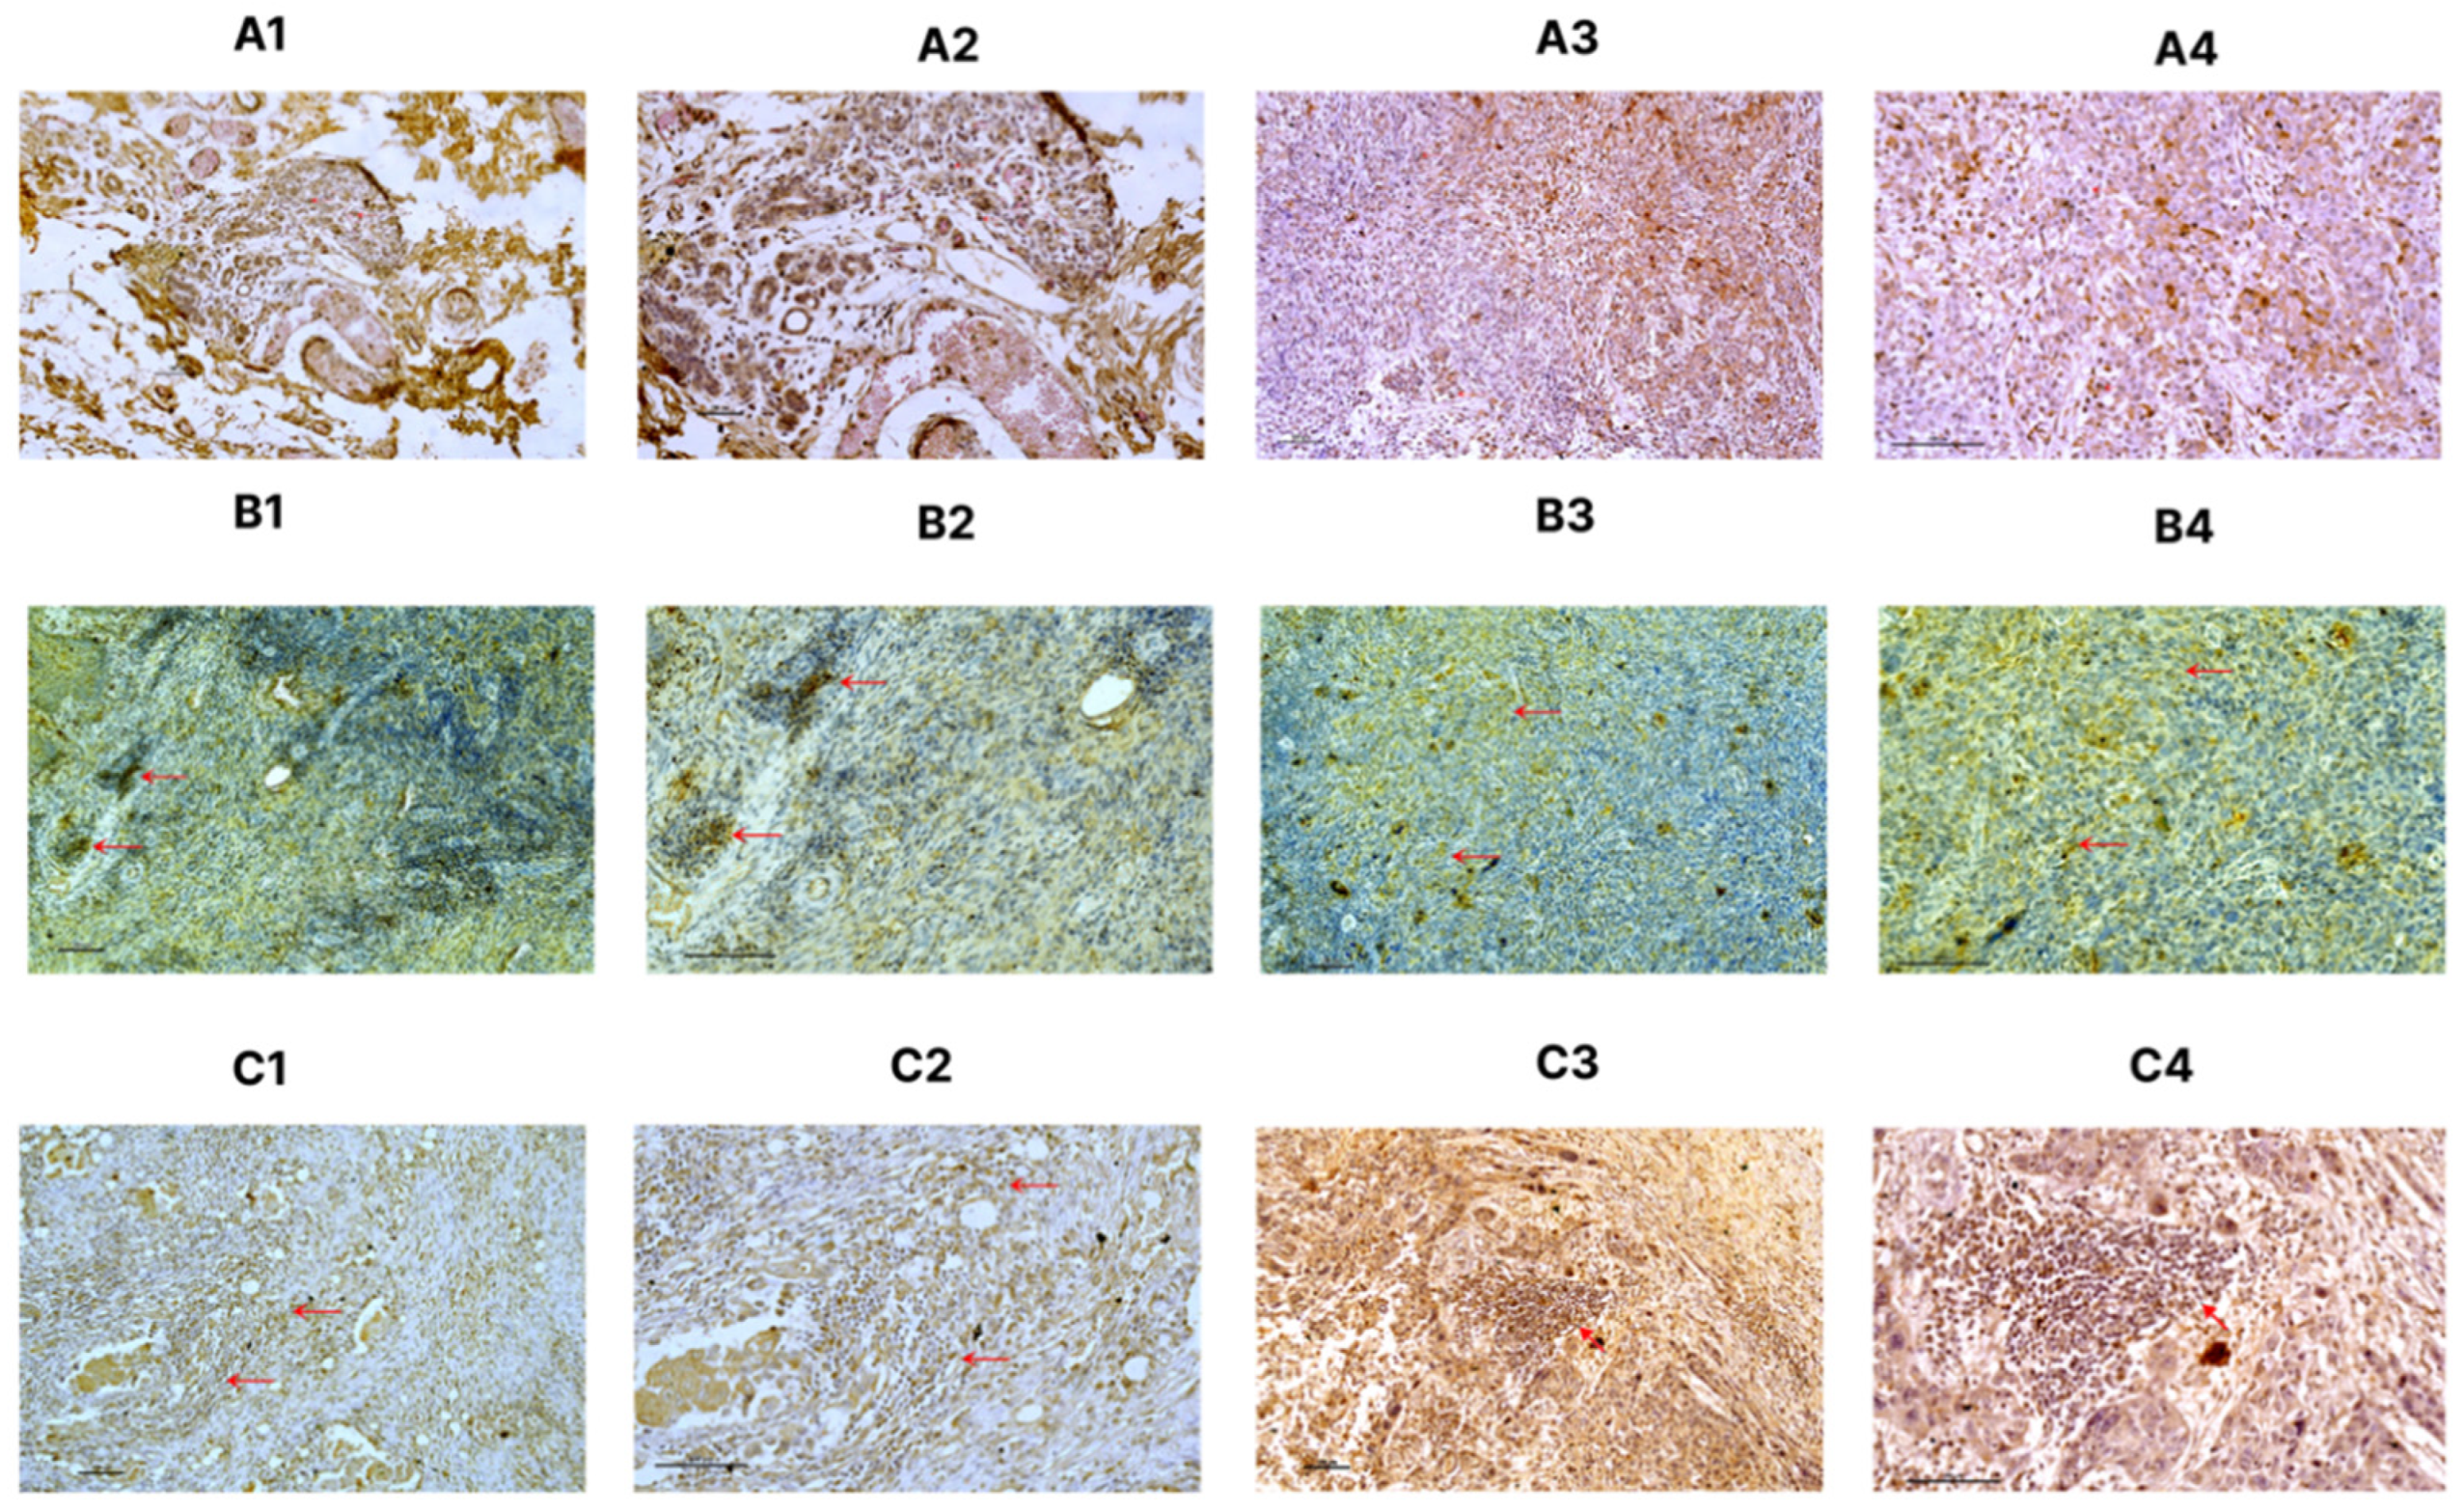

Table 1.
Baseline characteristics of TNBC patients.
| Characteristics |
N=54 (%) |
| Average age (Years) | |
| 24- 40 | 37(68.51) |
| 41 - 45 | 17(31.48) |
| T prior to NACT | |
| cT1 | 1(1.86) |
| cT2 | 18(33.33) |
| cT3 | 29(53.70) |
| cT4 | 6(11.11) |
| N prior to NACT | |
| cN0 | 5(9.25) |
| cN1 | 43(79.6) |
| cN2 | 4(7.40) |
| cN3 | 2(3.7) |
| T Stage after surgery | |
| ypT0 | 9(16.67) |
| ypT1 | 07(12.96) |
| ypT2 | 35(64.81) |
| ypT3 | 3(5.56) |
| N Stage after surgery | |
| ypN0 | 7(12.96) |
| ypN1 | 44(81.48) |
| ypN2 | 1(1.86) |
| ypN3 | 2(3.70) |
| M Stage | |
| M0 | 51(94.44) |
| M1 | 3(5.55) |
| Tumor subtype | |
| IDC | 54(100) |
| Histological grade | |
| I | 1(1.85) |
| II | 11(20.37) |
| III | 42(77.77) |
| Surgery | |
| MRM | 50(92.59) |
| BCS | 4(7.40) |
| Family History | |
| Yes | 4(7.40) |
| No | 50(92.59) |
| NACT group | |
| A+T | 15(27.78) |
| A+T+C | 39(77.22) |
TNBC; triple-negative breast cancer, IDC; infiltrating ductal carcinoma, MRM; modified radical mastectomy, BCS; breast conservative surgery, NACT; Neoadjuvant Chemotherapy, A+T; anthracycline-containing, taxane-, A+T+C; anthracycline/taxane /carboplatin, data expressed number (percentage).
Table 2.
Clinical response to neoadjuvant therapy.
| NACT regimen | N |
RECIST Evaluation |
Frequency (%) |
Response (%) |
p-Value |
| A +T | 15 | CR | 1(6.67%) | Positive (60) |
0.01* |
| PR | 8(53.33%) | ||||
| SD | 2(13.33%) | Negative (40) |
|||
| PD | 4(26.67%) | ||||
| A+T+C | 39 | CR | 10(25.64%) | Positive (92.31) |
0.01* |
| PR | 26(66.67%) | ||||
| SD | 2(5.13%) | Negative (7.69) |
|||
| PD | 1(2.56%) |
CR: complete response; PR: partial response; SD; Stable Disease, PD; Progressive Disease, NAC: Neoadjuvant chemotherapy, A+T; anthracycline-containing, taxane-, A+T+C; anthracycline/taxane /carboplatin, RECIST; Response Evaluation Criteria In Solid Tumor. *P-values indicate statistical significance.
Table 3.
Comparison of the tumor size before and after NACT.
| NACT regimen |
Tumor size (cm) before NACT Mean ±SD |
Tumor size (cm) after NACT Mean ±SD |
Mean difference of size after NACT |
p- Value |
| A +T | 4.76±1.28 | 3.56±1.53 | 1.2 | 0.001* |
| A+T+C | 5.2±1.43 | 2.53±1.65 | 2.67 | 0.001* |
NACT: Neoadjuvant chemotherapy Therapy, A+T; anthracycline-containing, taxane-, A+T+C; anthracycline/taxane /carboplatin, RECIST; Response Evaluation Criteria In Solid Tumor, *P-values indicate statistical significance.
Table 4.
Associations of TILs with clinicopathological characteristics of TNBC patients.
| Characteristics | TILs | |||
| Low | Intermediate | High | p-Value | |
| N (%) | N (%) | N (%) | ||
|
Age Years | ||||
| 24 - 40 | 6(16.21) | 15(40.54) | 16(43.24) | 0.536 |
| 41 - 45 | 1(5.88) | 9(52.94) | 7(41.18) | |
| Tumor Subtype | ||||
| IDC | 9(16.66) | 23(42.59) | 22(40.74) | 0.613 |
| Histological grade | ||||
| I | 0(0) | 0(0) | 1(100) | 0.536 |
| II | 0(0) | 3(27.27) | 8(72.73) | |
| III | 7(16.67) | 18(42.86) | 17(40.48) | |
| T Stage | ||||
| T1 | 0(0) | 0(0) | 1(100) | 0.049* |
| T2 | 0(0) | 5(41.67) | 7(58.33) | |
| T3 | 4(13.33) | 10(33.33) | 16(53.33) | |
| T4 | 1(9.09) | 6(54.55) | 4(36.36) | |
| N Stage | ||||
| N0 | 0(0) | 3(42.86) | 4(57.14) | 0.538 |
| N1 | 6(13.64) | 16(36.36) | 22(50) | |
| N2 | 0(0) | 1(100) | 0(0) | |
| N3 | 1(50) | 0(0) | 1(50) | |
| M Stage | ||||
| M0 | 6(11.76) | 23(45.09) | 22(43.13) | 0.499 |
| M1 | 1(33.33) | 1(33.33) | 1(33.33) | |
TNBC; triple-negative breast cancer, IDC; infiltrating ductal carcinoma, data are expressed number (percentage). Bold* p values indicate statistical significance.
Table 5.
Associations of PD-1 and PD-L1 expression with the clinicopathological parameters of TNBC patients.
Table 5.
Associations of PD-1 and PD-L1 expression with the clinicopathological parameters of TNBC patients.
|
CHARACTE- RISTICS |
PD-L1_TC | PD-L1_IC | PD-1_TC | PD-1_IC | ||||||||
| Negative | Positive | p Value | Negative | Positive | P Value | Negative | Positive | P Value | Negative | Positive | p- Value | |
| N (%) | N (%) | N (%) | N (%) | N (%) | N (%) | N (%) | N (%) | |||||
| AGE (YEARS) | ||||||||||||
| 24 - 40 | 14 (37.84) | 23 (62.16) |
0.563 |
28 (75.68) | 9 (24.32) |
0.745 |
20 (54.05) | 17 (45.95) |
0.56 |
11 (29.73) | 26 (70.27) | 0.912 |
| 41 - 45 | 8 (47.06) | 9 (52.94) | 12 (70.59) | 5 (29.41) | 11 (64.71) | 6(35.29) | 5 (29.41) | 12 (70.59) | ||||
| TUMOR SUBTYPE | ||||||||||||
| IDC | 21 (38.88) | 33 (61.11) | 1.00 | 37 (68.51) | 17 (31.48) | 1.00 | 39 (72.22) | 15 (27.77) | 1.00 | 9 (16.66) | 45 (83.33) | 1.00 |
| HISTOLOGICAL GRADE | ||||||||||||
| I | 0 (0) | 1(100) |
0.849 |
0 (0) | 1(100) |
0.359 |
0 (0) | 1 (100) |
0.227 |
1 (100) | 0 (0) | 0.174 |
| II | 4 (36.36) | 7 (63.63) | 5 (45.45) | 6(54.54) | 8 (72.73) | 3 (27.27) | 2 (18.18) | 9 (81.82) | ||||
| III | 18 (42.85) | 24 (57.14) | 32 (76.19) | 10 (23.80) | 34 (80.95) | 8 (19.05) | 6 (14.28) | 36 (85.71) | ||||
| T STAGE | ||||||||||||
| T1 | 0 (0) | 1(100) | 0.036* | 1(100) | 0 (0) | 0.203 | 1 (100) | 0 (0) | 0.928 | 0 (0) | 1 (100) | 0.073 |
| T2 | 9 (75) | 3 (25) | 11 (91.67) | 1 (8.33) | 10 (83.33) | 2 (16.67) | 2 (16.66) | 10 (83.33) | ||||
| T3 | 10 (33.33) | 20 (66.67) | 22 (73.33) | 8 (26.67) | 23 (76.66) | 7 (23.33) | 2 (6.66) | 28 (93.33) | ||||
| T4 | 3 (27.27) | 8(72.72) | 6 (54.54) | 5 (45.45) | 2(18.18) | 9(81.81) | 4 (36.36) | 7 (63.63) | ||||
| N STAGE | ||||||||||||
| N0 | 1 (14.29) | 6 (85.71) |
0.375 |
5 (71.42) | 2 (28.57) |
0.864 |
4 (57.14) | 3 (42.85) | 1.00 | 0 (0) | 7 (100) | 0.381 |
| N1 | 20 (45.45) | 24 (54.55) | 31 (70.45) | 13 (29.55) | 33 (75) | 11 (25) | 8 (18.18) | 36 (81.81) | ||||
| N2 | 0 (0) | 1(100) | 1(100) | 0 (0) | 1 (100) | 0 (0) | 0 (0) | 1 (100) | ||||
| N3 | 1 (50) | 1 (50) | 2 (100) | 0 (0) | 2 (100) | 0 (0) | 1 (50) | 1 (50) | ||||
| METASTASIS | ||||||||||||
| M0 | 21 (41.18) | 30 (58.82) | 1.00 | 37 (72.55) | 14 (27.45) | 0.56 | 39 (76.47) | 12 (24) | 1.00 | 8 (15.69) | 43 (84.31) | 0.428 |
| M1 | 1 (33.33) | 2 (66.67) | 3 (100) | 0 (0) | 3 (100) | 0 (0%) | 1 (33.33) | 2 (66.67) | ||||
| NACT | ||||||||||||
| A+T (N=15) | 6(40) | 9 (60) | 0.598 | 12(80) | 3(20) | 0.404 | 10(66.66) | 5(33.33) | 0.560 | 1 (6.66) | 14 (93.33) | 0.483 |
| A+T+C (N=39) | 16 (41.03) | 23 (58.97) | 28(71.79) | 11(28.21) | 30(76.92) | 9(23.08) | 6 (15.38) | 33(84.61) | ||||
|
TIL A+T (N=15) | ||||||||||||
| LOW | 3(100) | 0(0) |
0.005* |
3(100) | 0(0) |
1.000 |
2(66.67) | 1(33.33) |
0.385 |
2(66.67) | 1(33.33) |
0.103 |
| INTERMEDIATE | 3(60) | 2(40) | 4(80) | 1(20) | 5(100) | 0(0) | 0(0) | 5(100) | ||||
| HIGH | 0(0) | 7(100) | 5(71.43) | 2(28.57) | 5(71.43)28. | 2(57.57) | 1(14.29) | 6(85.71) | ||||
|
TIL A+T+C (N=39) | ||||||||||||
| LOW | 4(100) | 0(0) |
0.0001* |
4(100) | 0(0) |
0.412 |
2(50) | 2(50) |
0.001* |
2(50) | 2(50) |
0.123 |
| INTERMEDIATE | 11(57.89) | 8(42.11) | 14(73.68) | 5(26.32) | 19(100) | 0(0) | 3(15.79 | 16(84.21) | ||||
| HIGH | 1(6.25) | 15(93.75) | 10(62.50) | 6(37.5) | 9(56.25) | 7(43.75) | 1(6.25) | 15(93.75) | ||||
TNBC; triple-negative breast cancer, TC; tumor cell, IC; Immune cells; IDC; infiltrating ductal carcinoma, NACT; Neoadjuvant Chemotherapy, A+T; anthracycline-containing, taxane-, A+T+C; anthracycline/taxane /carboplatin, data expressed number (percentage). Bold* p-values indicate statistical significance.
Table 6.
Association of LAG-3 expression with clinicopathological parameters of TNBC patients.
| CHARACTERISTICS | TC | IC | ||||
| Negative | Positive | p Value | Negative | Positive | p-Value | |
| N (%) | N (%) | N (%) | N (%) | |||
| AGE (YEARS) | ||||||
| 24 - 40 | 30 (81,08) | 7 (18.92) | 1 | 8 (21.62) | 29 (78.38) |
0.244 |
| 41 - 45 | 13 (76.47) | 4 (23.53) | 1 (5.88) | 16 (94.12) | ||
| TUMOR SUBTYPE | ||||||
| IDC | 30 (55.55) | 24 (44.44) | 0.157 | 17 (31.48) | 37 (68.51) | 0.356 |
| HISTOLOGICAL GRADE | ||||||
| I | 1 (100) | 0 (0) | 0.503 | 0 (0) | 1 (100) | 0.542 |
| II | 5 (45.45) | 6 (54.55) | 3 (27.27) | 8 (73.73) | ||
| III | 25 (59.52) | 17 (40.48) | 14 (33.33) | 28 (66.67) | ||
| T STAGE | ||||||
| T1 | 0 (0) | 1 (100) |
0.444 |
0 (0) | 1 (100) | 0.721 |
| T 2 | 6 (50) | 6 (50) | 4 (33) | 8 (67) | ||
| T 3 | 17 (56.67) | 13 (43.33) | 10 (33) | 20 (67) | ||
| T 4 | 8 (72.73) | 3 (27.27) | 2 (27) | 9 (73) | ||
| N STAGE | ||||||
| N0 | 5 (71.43) | 2 (28.57) |
0.809 |
1 (14.29) | 6 (85.71) |
0.633 |
| N1 | 24 (54.55) | 20 (45.45) | 15 (34.09) | 29 (65.91) | ||
| N2 | 1 (100) | 0 (0) | 0 (0) | 1 (100) | ||
| N3 | 1 (50) | 1 (50) | 1 (50) | 1 (50) | ||
| METASTASIS | ||||||
| M0 | 29 (56.86) | 22 (43.14) | 1 | 16 (31.37) | 35 (68.63) | 0.891 |
| M1 | 2 (66.67) | 1 (33.33) | 1 (33.33) | 2 (66.67) | ||
| NACT | ||||||
| A+T (N=15) | 7(46.67) | 8(53.33) | 0.247 | 5(33.33) | 10(66.67) | 0.550 |
| A+T+C (N=39) | 24(61.54) | 15(38.46) | 12(30.77) | 27(69.23) | ||
|
TIL A+T (N=15) |
||||||
| LOW | 2(66.67) | 1(33.33) | 0.510 | 3(100) | 0(0) | 0.050* |
| INTERMEDIATE | 3(60) | 2(40) | 1(20) | 4(80) | ||
| HIGH | 2(28.57) | 5(71.43) | 1(14.29) | 6(85.71) | ||
|
TIL A+T+C (N=39) | ||||||
| LOW | 1( 2.56) | 3 (7.69 ) | 0.403 | 4(100) | 0(0) | 0.0001* |
| INTERMEDIATE | 14(35.89) | 5(12.82) | 0(0) | 19(100) | ||
| HIGH | 4(10.25 ) | 12(30.76 ) | 6(15.38) | 10(25.64) | ||
TNBC; triple-negative breast cancer, TC; tumor cell, IC; Immune cells; IDC; infiltrating ductal carcinoma, NACT; Neoadjuvant Chemotherapy, A+T; anthracycline-containing, taxane-, A+T+C; anthracycline/taxane /carboplatin, data expressed number (percentage). Bold* p values indicate statistical significance.
Disclaimer/Publisher’s Note: The statements, opinions and data contained in all publications are solely those of the individual author(s) and contributor(s) and not of MDPI and/or the editor(s). MDPI and/or the editor(s) disclaim responsibility for any injury to people or property resulting from any ideas, methods, instructions or products referred to in the content. |
© 2025 by the authors. Licensee MDPI, Basel, Switzerland. This article is an open access article distributed under the terms and conditions of the Creative Commons Attribution (CC BY) license (http://creativecommons.org/licenses/by/4.0/).
Copyright: This open access article is published under a Creative Commons CC BY 4.0 license, which permit the free download, distribution, and reuse, provided that the author and preprint are cited in any reuse.


