
Submitted:
26 February 2024
Posted:
27 February 2024
You are already at the latest version
Abstract
Tumor infiltrating lymphocytes (TILs) are an emerging biomarker predictive of response to immunotherapy across a spectrum of solid organ malignancies. The characterization of TILs in gastric cancer (GC) treated with contemporary, multiagent neoadjuvant chemotherapy (NAC) is understudied. In this retrospective investigation, we analyzed the degree of infiltration, phenotype, and spatial distribution of TILs via immunohistochemistry within resected GC specimens treated with or without NAC at a Western center. We hypothesized that NAC executes immunostimulatory roles evidenced by an increased number of anti-tumor TILs in the tumor microenvironment. We found significantly elevated levels of conventional and memory CD8+ T cells, and total TILs (CD4+, CD8+, Treg, B cells) within chemotherapy-treated tumors compared to chemotherapy-naïve specimens. We also revealed important associations between survival and pathologic response with enhanced TIL infiltration. Taken together, our findings advocate for an immunostimulatory role of chemotherpy and underscore the potential synergistic effect of combining chemotherapy with immunotherapy in resectable gastric cancer.
Keywords:
gastric cancer
; tumor infiltrating lymphocytes
; neoadjuvant therapy
; immunotherapy
Introduction
Gastric cancer (GC) is among the most common and aggressive gastrointestinal (GI) cancers worldwide.1,2 While accounting for only 1.5% of new cancer diagnoses in the United States, nearly half of patients present with advanced disease.3 Although perioperative chemotherapy regimens have evolved and garnered modest improvements in OS when administered in the neoadjuvant setting, 5-year survival in advanced GC remains less than 40%.4 Thus, the need for improved anti-tumor therapies for gastric cancer is paramount.
Immunotherapy, specifically immune checkpoint blockade (ICB), has revolutionized the care of several solid organ malignancies such as cutaneous melanoma, non-small cell lung cancer (NSCLC), and renal cell carcinoma.5−8 Recent randomized control trial (RCT) data has established adjuvant ICB therapy in resected stage II/III esophageal cancer as standard of care in light of significantly prolonged disease-free survival with immunotherapy.9 While consensus guidelines currently recommend ICB immunotherapy in unresectable or metastatic GC that harbor established biomarkers predictive of response to immunotherapy, its utility for potentially resectable GC tumors warrants further investigation.10
It is well known that the degree and phenotype of tumor infiltrating lymphocytes (TILs) is a prognostic marker for response to ICB.11−14 In triple negative breast cancer and NSCLC, higher cytotoxic T cells (CD8+ T cells) demonstrate higher rates of overall response to ICBs along with improved progression-free and overall survival (PFS, OS, respectively) compared to those with lower CD8+ T cells.15,16 It is also known that conventional chemotherapeutic agents such as anthracyclines and platinum-based agents, the latter of which are frequently used to treat GC, can favorably alter the tumor microenvironment (TME) by inducing immunogenicity and synergizing the anti-tumor effect of host immunostimulatory agents.17,18
The effect of contemporary multiagent chemotherapy on the degree of infiltration, phenotypes, and spatial distribution of TILs in potentially resectable GC is not well defined. The current body of work lacks analysis of memory immune cell subtypes and consideration of spatial (intratumoral versus stromal) TIL distributions.17,19,20 Furthermore, most studies that do report on GC are from Asia, which is known to have distinct disease biology treated with different chemotherapeutic regimens than in the West.21 Considering these differences, we sought to characterize the density and infiltrative patterns of conventional and memory TIL subtypes of GC treated with or without chemotherapy at a Western academic referral center. We hypothesized that chemotherapy favorably alters the TME of GC leading to increased levels of anti-tumor TILs.
Methods
Patient Cohort
After obtaining institutional review board consent, all adult patients with biopsy proven diagnosis of gastric adenocarcinoma who ultimately underwent a resection with curative intent from 2012-2020, either endoscopic or surgical, at our institution and had available formalin fixed, paraffin embedded (FFPE) tissue samples for histologic analysis were included in this study. A retrospective review of a prospectively maintained, clinically oriented database of patients was conducted. Review of the patient electronic health record was performed for missing data. After patients were identified, additional FFPE slides were requested from areas of invasive tumor at least 2 mm in diameter. Slides were reviewed during creation, and the areas of invasive disease were determined by a board-certified gastrointestinal pathologist (author JK).
Definitions and Immunologic Profile Characterization
TIL populations were characterized by multiplex immunohistochemistry (IHC) staining of associated cell surface (CD, cluster of differentiation) or intranuclear markers using the Vectra-7-tumor infiltrating lymphocyte kit (PerkinElmer, Waltham, MA). The included TILs and markers are as follows: B cells/CD220+, CD8 T cells/CD8+, CD4 T cells/CD4+, T regulatory (Treg) cells/forkhead box P3 (FOXP3)+, CD8 memory T cells/CD8+/CD45RO+, CD4 memory T cells/CD4+/CD45RO+, memory Treg cells/CD4+/FOXP3+/CD45RO+, memory B cells/CD220+/CD45RO+, epithelial malignant cell/pan cytokeratin. TIL density was defined as the number of above stained immune cells per mm2 designated within tumor or stroma regions of the tissue section. Total TILs were defined as the sum of CD4+, CD8+, Treg, and B cells. Categorical assignment of high and low TIL density was determined by the median value from the overall cohort. Clinical and pathologic staging of GC tumors were based on the latest National Comprehensive Cancer Network (NCCN) guidelines.10
To characterize the immunologic profile of GC tumors, we also analyzed EBV status, mismatch repair (MMR) protein expression, and tumor cell PD-L1. EBV status was determined by in situ hybridization (iSH) detection of EBV-encoded small RNA (EBER)-positive tumor cells (ARUP Laboratories, Salt Lake City, UT). Assessment of mismatch repair (MMR) protein expression was performed via immunohistochemistry (IHC) analysis of MLH1, PSM2, MSH2, and MSH6 proteins (Leica; Wetzlar, Germany); deficiency (dMMR) was defined as loss of >95% of any one of the protein expressions in tumor cells. Programmed Death-Ligand 1 (PD-L1) expression was measured via the Combined Positivity Score (CPS), defined as the number of positive PD-L1 stained cells via IHC divided by the total number of tumor cells multiplied by 100; values greater than 1 were considered positive expression (Leica; Wetzlar, Germany).
Multiplex Immunohistochemistry
IHC was performed using an autostainer and then slides reviewed using image processing software following a previously employed protocol22: Vectra 3.0 Automated Quantitative Pathology Imaging System (PerkinElmer) was used with the Bond RX autostainer (Leica). Slides were deparaffinized, heat treated in epitope retrieval solution 2 (ER2) antigen retrieval buffer for 20 minutes at 93 C (Leica), blocked in antibody (Ab) Diluent (PerkinElmer), incubated for 30 min with the primary antibody, 10 minutes with horseradish peroxidase-conjugated secondary polymer (anti-mouse/anti-rabbit, Perkin Elmer), and 10 minutes with horseradish peroxidase-reactive OPAL fluorescent reagents (Perkin Elmer). Slides were washed between staining steps with Bond Wash (Leica) and stripped between each round of staining with heat treatment in antigen retrieval buffer. After the final staining round, the slides were heat-treated in antigen retrieval buffer, stained with spectral 4′,6-diamidino-2-phenylindole (PerkinElmer), and cover slipped with Prolong Diamond mounting media (ThermoFisher; Waltham, MA). Whole slide scans were collected using the 10× objective at a resolution of 1.0 μm. Then 10 regions of interest identified by a gastrointestinal subspecialty trained board-certified pathologist (author JK) were scanned for multispectral imaging with the 20× objective at a resolution of 0.5 μm. The multispectral images were analyzed with inForm software (PerkinElmer) to unmix adjacent fluorochromes; subtract autofluorescence; segment the tissue into tumor regions and stroma; segment the cells into nuclear, cytoplasmic, and membrane compartments; and to phenotype the cells according to cell marker expression.
Statistical Analysis
Parametric and nonparametric data are presented as means with standard deviations and medians with interquartile range, respectively. Categorical variables are expressed as absolute and relative frequencies (count and number). Categorical variables were compared using Chi-squared test; for continuous variables, parametric data was analyzed via Student’s T test and non-parametric data with Mann-Whitney U test. Comparison of more than two groups of non-parametric data was performed via Wilcoxon sign-ranked test. Kaplan-Meier survival curves were generated to estimate time-to-event analyses for OS and RFS. All statistical analyses were performed in IBM SPSS version 28.0 (IBM, Chicago, IL, USA). Figures were constructed with SPSS or GraphPad Prism (version 10.0.0 for Windows, GraphPad Software, Boston, Massachusetts USA). Quantification of IHC staining of MMR, PD-L1, and TIL densities was completed with inform Imaging Analysis Software (Akoya Biosciences, Marlborough, MA, USA). Statistical significance was considered p≤0.05.
Results
Patient Cohort
Demographic and clinicopathologic variables of the entire patient cohort and stratified by receipt of NAC are displayed in Table 1. Eighty patients were identified, 68 of which pathologic specimens suitable for histologic analysis. Most patients were male (59%, n=40), of Caucasian race (67%, n=46), with a mean age of 63 years at the time of diagnosis (range 28-87 yrs, SD +/-15 yrs). All tumors were adenocarcinoma in origin. In the total cohort, most patients harbored clinical stage T3 tumors (52%, n=35) and node negative disease (N0 57%, n=39). Nearly 75% of patients received NAC (n=50), the most common regimen being combination folinic acid, fluorouracil, and oxaliplatin (FOLFOX, 38%, n=26). Neoadjuvant radiation was given to four percent of patients (n=3). Surgical resection consisted of total gastrectomy or subtotal gastrectomy in 93% of patients (n=63), the remaining 7% underwent endoscopic resection (n=5). Half of the cohort received adjuvant chemotherapy (52%, n=35).
Demographic and Clinicopathologic Characteristics of Upfront Surgery & NAC Cohorts
Patients who received NAC were significantly more likely to have clinically larger tumors and node positive disease resulting in higher overall clinical stage (Table 1). Of the overall study cohort, 84% of patients (n=57) met the current NCCN recommendations to receive preoperative chemotherapy (≥T2N0-3); of these patients, 19% did not receive NAT (n=11) most commonly due to patient preference (55%, n=6) in the setting of cT2N0 disease. In the ≥cT2N0-3 cohort, those who received NAC were more likely to have positive node disease, proximal tumor location, and poor histologic grade.
TIL and Molecular Profiles of Upfront Surgery & NAC Cohorts
The intratumoral and stromal TIL phenotypes/densities and molecular profiles of the study cohort are detailed in Table 2, Figure 1. In the overall cohort, patients who received NAC had significantly higher intratumoral conventional CD8+ T cells (14.3 vs. 5.1, p=0.024) and total TILs (summation of CD4+, CD8+, Treg, B cells; 19.3 vs. 7.9; p=0.047). There were no significant differences in TIL densities in the tumor stroma between the two groups. The prevalence of EBV positive, dMMR, and PD-L1 positive status was not different between the upfront surgery and NAC groups.
In the subset of patients with ≥cT2N0-3 disease, conventionalCD8+ T cells (14.2 vs. 3.6, and total conventional TILs (18.8 vs. 6.7, p=0.041) continued to be significantly upregulated in the tumor tissue of those who underwent NAC. Additionally, in this select cohort, intratumoral memory CD8+ T cells (2.0 vs. 0.7, p=0.050) and total memory TILs (0.2 vs. 0.05, p=0.048) were increased in tumors treated with NAC. Again, no differences in TIL densities in the stromal component nor molecular phenotypes (EBV, MMR, PD-L1 positivity) was appreciated between the two cohorts. Although the CD8+ T cell to Treg ratio was substantially increased in tumor tissue of patients who received NAC, the difference only trended toward statistical significance (25.5 vs. 7.5, p=0.079).
TIL density & Oncologic Outcomes
The median follow-up time in the overall cohort was 43 months (range 30-65 mos) with death occurring in nearly half the overall cohort (47.1%, n=32) and distant recurrence in over a third of patients (36.8%, n=25). Peritoneal dissemination was the most common form of metastasis (11/25, n=11). In both the overall and ≥cT2N0-3 cohorts, various high (defined as upper half from median value) TIL populations in the stromal but not intratumorally were associated with significantly longer OS and RFS. Figure 2 and Supplemental Figures S1 and S2 display the statistically significant Kaplan-Meier curves stratified by TIL phenotype with associated log-rank analyses estimating median survival for OS and RFS.
TIL density & Pathologic Response
Most patients who underwent NAC demonstrated a poor pathologic response to preoperative treatment (chemotherapy response score 1) (Table 1). There were no differences in response by chemotherapy regimen. No significant associations were observed between high/low TIL categories and pathologic response based on the median cutoff values; however, we found that the top quartile of densities of intratumoral CD8+ T cells (OR 4.976; CI 1.166-21.242; p=0.030) and total TILs (OR 6.667; CI 1.269-35.035; p=0.025) were associated with were significantly associated with higher rates of near complete and moderate response (chemotherapy response score 3 and 2, respectively) compared to poor response. Similarly, stromal CD8+ conventional T cells (OR 11.812; IC 1.3254-103.038; p=0.025), CD8+ memory T cells (OR 14.0; CI 1.615-121.369; p=0.017), total TILs (OR 5.625; CI 1.062-29.799; p=0.042), and total memory TILs (OR 14.0; CI 1.615-121.369; p=0.017) were more likely to be associated with improved pathologic response.
Discussion
In the present investigation, we compared TIL phenotypes and infiltrative patterns in resected GC specimens from patients who did and did not undergo NAC. We hypothesized that among our cohort of patients treated at a Western academic center, NAC-treated tumors would demonstrate higher TIL densities in the TME compared to non-NAC counterparts. We found that in both the overall cohort and among those recommended to receive NAC (≥cT2N0-3), tumors from NAC recipients demonstrated significantly increased intratumoral, but not stromal, TILs compared to patients foregoing NAC. Furthermore, we observed improved OS, RFS, and pathologic response in patients with high compared to low TIL infiltration who received NAC.
Based on the results of recent RCTs, the application of immunotherapy in GC has been limited to unresectable or metastatic disease harboring specific immunotherapy-responsive molecular phenotypes e.g. PD-L1 positive, MSI-H, TMB-H.7,22,23 The results of such trials have raised the potential that ICB therapy could be beneficial for resectable GC. The only published report from a phase III RCT utilizing combined chemotherapy plus ICB versus chemotherapy plus placebo for locally advanced GC/gastroesophageal junction (GEJ) tumors did not show a statistical difference in event-free survival at a median follow-up of nearly fifty months but did demonstrate a significant improvement in pathologic complete response with combination chemotherapy and ICB.24 Recently, the phase III CheckMate-577 trial in resected esophageal/GEJ tumors reported significantly longer disease-free survival in patients treated with adjuvant nivolumab compared to placebo.9 Notably, these improved outcomes occurred independently of PD-L1 status, a finding that highlights alternative prognostic biomarkers predictive of response to immunotherapy. One such biomarker may be the degree of anti-tumor TIL infiltration within the TME.13,25 Higher intratumoral and stromal TIL infiltrate, particularly cytotoxic CD8+ T cells, have been associated with longer survival and higher rates of pathologic response after ICB therapy compared to those with lower TIL infiltrate in advanced solid organ tumors.11,13,16,26 Therefore, identifying mechanisms to increase tumor-targeting TIL populations into the TME may facilitate immunotherapy in resectable GC.
The use of NAC has become standard of care for localized GC.27,28 Mounting evidence suggests that while conventional chemotherapeutic agents play various immunosuppressive roles, they may also induce substantial immunogenicity and immunostimulation against malignancy by producing tumor-derived neoantigens, improving cytotoxic T cell recognition of tumor cells, and upregulating damage associated molecular patterns (DAMPs) and cell surface molecules recruiting effector cells to the TME.17,29 However, the data demonstrating the impact of contemporary, multiagent chemotherapy on the degree and phenotypes of TILs in GC is lacking. Thus, we aimed to analyze the TIL composition in GC tumors treated with and without NAC.
We found that postoperative GC specimens treated with NAC demonstrated significantly increased densities of intratumoral TILs compared to those that did not undergo NAC. In the overall cohort which included patients with overall clinical stage I-III disease, CD8+ conventional T cells and total TILs were substantially elevated in NAC-exposed tumors. For those whom NAC is recommended per NCCN guidelines (clinical stage ≥T2N0-3), the upregulation of TILs was even more widespread as both conventional and memory subtypes of CD8+ T cells and total TILs were increased within the tumor tissue. Notably, we did not appreciate differences in stromal TIL densities between the two groups although both conventional CD4+ and CD8+ T cells were at least two-fold greater in NAC cohort. Our observations that anti-tumor TILs are increased after NAC is consistent with present literature in a range of epithelial carcinomas including breast, non-small cell lung cancer, colorectal and ovarian.30−34 Our findings also corroborate that of Yu et al., who reported increased CD4+ and CD8+ T cell populations in Asian patients after receiving a combination of preoperative 5-FU, platinum-based agent, with or without taxane and gastrectomy.19 Unlike Xing et al. and Hu et al., we did not appreciate a significant difference in intratumoral or stromal Treg cells, which may be secondary to known differences in Western versus Asian gastric cancer biology and differences in NAC regimens.20,35
Notably, to our knowledge, we are the first to report the relationship between increased memory T cell infiltration and receipt of NAC in GC. Memory subtypes are known to play important roles in executing durable anti-tumor response.36 Furthermore, recent preclinical data suggests that neoantigen stimulation of CD4+ T cells can facilitate generation of specialized memory CD4+ T cells that be utilized in adoptive T cell immunotherapy to prime effector CD8+ T cells in mitigating metastasis.37 Lastly, both clinical and preclinical studies have shown that response to ICB is positively related to the proportion of memory T cells, suggesting the importance of memory phenotypes to mediating host immune response.38,39 Taken together, we show that memory T cell subtypes are higher in NAC-treated tumors, which may portend improved tumor control with IT.
In addition to enhanced TIL infiltration in NAC-exposed specimens, we identified associations between high TIL phenotypes and improved OS and RFS in patients who received NAC. Interestingly, despite observing statistically significant higher densities of intratumoral TILs between NAC and upfront surgery cohorts, survival associations were only related to high stromal rather than intratumoral TILs. These findings support existing literature citing similar associations with higher stromal TILs and improved RFS in breast and ovarian carcinomas.11,19,31,40 Further, stromal TILs, particularly CD8+ T cells, are proposed to be a stronger prognostic biomarker of the response to ICBs and survival than intratumoral TILs as reported by a meta-analysis including 2559 patients with a variety of solid organ tumors treated with immune checkpoint inhibitors.11 Potential explanations for this finding may be that the intratumoral TILs, while increased, may be over-exposed to tumor rendering them to an inactive, “exhausted” phenotype.41 Additionally, active cytotoxic cells at the tumor periphery or invasive margin may be more proximal to antagonizing the aggressive metabolic and immune re-programming occurring at the tumor borders, thus critical to controlling tumor growth and dissemination.42 To this point, higher stromal TILs in the primary tumor site have been shown to correlate with decreased metastatic burden, which is consistent with our associations between improved RFS with increased stromal TIL populations.36,43 Notably, we also observed improved pathologic response to preoperative chemotherapy in a select subset of patients with the highest quartile of intratumoral and stromal infiltrating immune cells, supporting previous work demonstrating similar results in other NAC-treated carcinomas.44−46 Nevertheless, given that distant metastases are the primary mode of failure for gastric cancer, there are evidently a multitude of mechanisms driving tumor immune evasion and progression that may be independent of the TILs that are associated with the primary tumor.47
While this study adds novel perspective to the immune landscape of resectable GC after NAC in Western patients, our results should be considered in the context of its limitations. As a retrospective, single center endeavor, it is constrained by inherent selection bias, small sample size, and heterogeneity in data collection/reporting. Additionally, we recognize our TIL and immunologic profile characterization is far from exhaustive, yet we aimed to bridge gaps according to prior literature. In our spatial TIL analysis, while we added novelty in differentiating intratumoral and stromal TILs, we did not assess TILs specifically confined to the tumor invasive margin, a metric that has risen to certain prognostic value. Due to the retrospective, clinically-oriented nature of this study, we are not able to fully explain the relationships between intratumoral and stromal TILs with long-term oncologic outcomes. Lastly, while a strength of this study is the in-depth nature of our analysis of TILs in the TME of Western GC, our results may not be fully translatable to GC at-large considering that GC arising in Asia is known to be biologically distinct. Given these limitations, future work should be dedicated to prospective, protocol-based analysis further detailing specific TILs such as granzyme B CD8+ T cells, effector and central memory T cells, natural killer cells, and those of the “exhausted” phenotype.
Conclusions
The immune TME of GC is highly heterogenous. Identifying mechanisms to facilitate novel therapeutics, i.e. immunotherapy, in effort to improve outcomes in GC is paramount. In this investigation, we observed that resected GC treated with NAC boast higher intratumoral TILs, namely conventional CD8+ and total TILs, compared to tumors undergoing upfront surgery across all clinical stages of localized disease. Importantly, we also established that memory subtypes are upregulated in a subset of higher stage patients who meet consensus criteria for NAC. Further, we highlight the prognostic value of stromal rather than intratumoral TILs for GC undergoing NAC. Together, our novel findings affirm the need for further investigation into the complex interplay between the TME, TILs, chemo- and immunotherapy.
Supplementary Materials
The following supporting information can be downloaded at the website of this paper posted on Preprints.org.
Author Contributions
Conceptualization, Elliott Yee, Jeffrey Kaplan, Sachin Wani, Sunnie Kim, Martin McCarter and Camille Stewart; Data curation, Elliott Yee, Danielle Gilbert, Sachin Wani and Martin McCarter; Formal analysis, Elliott Yee, Danielle Gilbert and Camille Stewart; Investigation, Sunnie Kim; Methodology, Elliott Yee, Jeffrey Kaplan, Sachin Wani, Sunnie Kim, Martin McCarter and Camille Stewart; Resources, Camille Stewart; Supervision, Camille Stewart; Validation, Jeffrey Kaplan; Writing – original draft, Elliott Yee; Writing – review & editing, Danielle Gilbert, Jeffrey Kaplan, Sunnie Kim, Martin McCarter and Camille Stewart.
Funding
This work was supported by the Academic Enrichment Fund Seed Grant Fund (University of Colorado, Department of Surgery) (CS), the Paul R. O’Hara II Seed Grant Fund (University of Colorado Cancer Center) (CS), Early-Stage Surgeon Scientist Program NIH - NCI, P30CA046934 (CS).
Ethical statement/consent
The University of Colorado Institutional Review Board (COMIRB) deemed this study exempt from IRB review given the retrospective nature of this study. Informed consent was given by patients to collect specimens as part of their routine medical care at the University of Colorado, Anschutz Medical Campus.
Acknowledgments
We would like to thank the University of Colorado, Human Immune Monitoring Shared Resource (HIMSR) for their invaluable assistance in performing and analyzing multiplex immunohistochemical staining.
Disclosure/Conflicts of Interest
None of the listed authors have any relevant financial disclosures.
References
- de Martel C, Forman D, Plummer M. Gastric cancer: epidemiology and risk factors. Gastroenterol. Clin. N. Am. 2013, 42, 219–40. [CrossRef]
- Rawla P, Barsouk A. Epidemiology of gastric cancer: global trends, risk factors and prevention. Prz. Gastroenterol. 2019, 14, 26–38. [CrossRef]
- Morgan E, Arnold M, Camargo MC, et al. The current and future incidence and mortality of gastric cancer in 185 countries, 2020-40: A population-based modelling study. EClinicalMedicine 2022, 47, 101404. [CrossRef] [PubMed]
- Society AC. Cancer Facts & Figures 2024. Stomach Cancer Survival Rates. American Cancer Society. Available online: https://www.cancer.org/cancer/types/stomach-cancer/detection-diagnosis-staging/survival-rates.html (accessed on 31 January 2024).
- Motzer RJ, Tannir NM, McDermott DF, et al. Nivolumab plus Ipilimumab versus Sunitinib in Advanced Renal-Cell Carcinoma. N. Engl. J. Med. 2018, 378, 1277–1290. [CrossRef] [PubMed]
- Herbst RS, Baas P, Kim DW, et al. Pembrolizumab versus docetaxel for previously treated, PD-L1-positive, advanced non-small-cell lung cancer (KEYNOTE-010): a randomised controlled trial. Lancet 2016, 387, 1540–1550. [CrossRef] [PubMed]
- Bang YJ, Kang YK, Catenacci DV, et al. Pembrolizumab alone or in combination with chemotherapy as first-line therapy for patients with advanced gastric or gastroesophageal junction adenocarcinoma: results from the phase II nonrandomized KEYNOTE-059 study. Gastric Cancer 2019, 22, 828–837. [CrossRef] [PubMed]
- Borghaei H, Paz-Ares L, Horn L, et al. Nivolumab versus Docetaxel in Advanced Nonsquamous Non-Small-Cell Lung Cancer. N. Engl. J. Med. 2015, 373, 1627–39. [CrossRef]
- Kelly RJ, Ajani JA, Kuzdzal J, et al. Adjuvant Nivolumab in Resected Esophageal or Gastroesophageal Junction Cancer. N. Engl. J. Med. 2021, 384, 1191–1203. [CrossRef]
- NCCN Clinical Practice guidelines in Oncology: Gastric Cancer. NCCN Guidelines, (Version 1). 2023.
- Li F, Li C, Cai X, et al. The association between CD8+ tumor-infiltrating lymphocytes and the clinical outcome of cancer immunotherapy: A systematic review and meta-analysis. EClinicalMedicine 2021, 41, 101134. [CrossRef]
- Loupakis F, Depetris I, Biason P, et al. Prediction of Benefit from Checkpoint Inhibitors in Mismatch Repair Deficient Metastatic Colorectal Cancer: Role of Tumor Infiltrating Lymphocytes. Oncologist 2020, 25, 481–487. [CrossRef]
- Paijens ST, Vledder A, de Bruyn M, Nijman HW. Tumor-infiltrating lymphocytes in the immunotherapy era. Cell Mol. Immunol. 2021, 18, 842–859. [CrossRef]
- Uryvaev A, Passhak M, Hershkovits D, Sabo E, Bar-Sela G. The role of tumor-infiltrating lymphocytes (TILs) as a predictive biomarker of response to anti-PD1 therapy in patients with metastatic non-small cell lung cancer or metastatic melanoma. Med. Oncol. 2018, 35, 25. [CrossRef]
- Emens LA, Cruz C, Eder JP, et al. Long-term Clinical Outcomes and Biomarker Analyses of Atezolizumab Therapy for Patients With Metastatic Triple-Negative Breast Cancer: A Phase 1 Study. JAMA Oncol. 2019, 5, 74–82. [CrossRef]
- Hurkmans DP, Kuipers ME, Smit J, et al. Tumor mutational load, CD8(+) T cells, expression of PD-L1 and HLA class I to guide immunotherapy decisions in NSCLC patients. Cancer Immunol. Immunother. 2020, 69, 771–777. [CrossRef]
- Wang Y, Gao P, Hao Z, et al. The effect of neoadjuvant chemotherapy on the tumor immune microenvironment in gastrointestinal tumors. Front. Oncol. 2022, 12, 1054598. [CrossRef]
- Merlano MC, Denaro N, Galizia D, et al. How Chemotherapy Affects the Tumor Immune Microenvironment: A Narrative Review. Biomedicines 2022, 10. [CrossRef]
- Yu X, Zhang Z, Wang Z, Wu P, Qiu F, Huang J. Prognostic and predictive value of tumor-infiltrating lymphocytes in breast cancer: a systematic review and meta-analysis. Clin. Transl. Oncol. 2016, 18, 497–506. [CrossRef]
- Xing X, Shi J, Jia Y, et al. Effect of neoadjuvant chemotherapy on the immune microenvironment in gastric cancer as determined by multiplex immunofluorescence and T cell receptor repertoire analysis. J. Immunother Cancer 2022, 10. [CrossRef]
- Joshi SS, Badgwell BD. Current treatment and recent progress in gastric cancer. CA Cancer J. Clin. 2021, 71, 264–279. [CrossRef]
- Fuchs CS, Ozguroglu M, Bang YJ, et al. Pembrolizumab versus paclitaxel for previously treated PD-L1-positive advanced gastric or gastroesophageal junction cancer: 2-year update of the randomized phase 3 KEYNOTE-061 trial. Gastric. Cancer. 2022, 25, 197–206. [CrossRef]
- Marabelle A, Le DT, Ascierto PA, et al. Efficacy of Pembrolizumab in Patients With Noncolorectal High Microsatellite Instability/Mismatch Repair-Deficient Cancer: Results From the Phase II KEYNOTE-158 Study. J. Clin. Oncol. 2020, 38, 1–10. [CrossRef]
- Shitara K, Rha SY, Wyrwicz LS, et al. Neoadjuvant and adjuvant pembrolizumab plus chemotherapy in locally advanced gastric or gastro-oesophageal cancer (KEYNOTE-585): an interim analysis of the multicentre, double-blind, randomised phase 3 study. Lancet Oncol. 2024, 25, 212–224. [CrossRef]
- Presti D, Dall’Olio FG, Besse B, Ribeiro JM, Di Meglio A, Soldato D. Tumor infiltrating lymphocytes (TILs) as a predictive biomarker of response to checkpoint blockers in solid tumors: A systematic review. Crit. Rev. Oncol. Hematol. 2022, 177, 103773. [CrossRef]
- Iwahori K, Uenami T, Yano Y, et al. Peripheral T cell cytotoxicity predicts the efficacy of anti-PD-1 therapy for advanced non-small cell lung cancer patients. Sci. Rep. 2022, 12, 17461. [CrossRef]
- Al-Batran SE, Hofheinz RD, Pauligk C, et al. Histopathological regression after neoadjuvant docetaxel, oxaliplatin, fluorouracil, and leucovorin versus epirubicin, cisplatin, and fluorouracil or capecitabine in patients with resectable gastric or gastro-oesophageal junction adenocarcinoma (FLOT4-AIO): results from the phase 2 part of a multicentre, open-label, randomised phase 2/3 trial. Lancet Oncol. 2016, 17, 1697–1708. [CrossRef]
- Ychou M, Boige V, Pignon JP, et al. Perioperative chemotherapy compared with surgery alone for resectable gastroesophageal adenocarcinoma: an FNCLCC and FFCD multicenter phase III trial. J. Clin. Oncol. 2011, 29, 1715–21. [CrossRef] [PubMed]
- Wei Q, Xu Q, Yuan X, et al. Immunological impact of chemotherapy on the tumor microenvironment in gastric cancer. J. Surg. Oncol. 2021, 123, 1708–1715. [CrossRef]
- Garcia-Martinez E, Gil GL, Benito AC, et al. Tumor-infiltrating immune cell profiles and their change after neoadjuvant chemotherapy predict response and prognosis of breast cancer. Breast Cancer Res. 2014, 16, 488. [CrossRef] [PubMed]
- James FR, Jiminez-Linan M, Alsop J, et al. Association between tumour infiltrating lymphocytes, histotype and clinical outcome in epithelial ovarian cancer. BMC Cancer. 2017, 17, 657. [CrossRef]
- Jary M, Liu WW, Yan D, et al. Immune microenvironment in patients with mismatch-repair-proficient oligometastatic colorectal cancer exposed to chemotherapy: the randomized MIROX GERCOR cohort study. Mol. Oncol. 2022, 16, 2260–2273. [CrossRef]
- Qi J, Liu X, Yan P, et al. Analysis of Immune Landscape Reveals Prognostic Significance of Cytotoxic CD4(+) T Cells in the Central Region of pMMR CRC. Front. Oncol. 2021, 11, 724232. [CrossRef] [PubMed]
- Gaudreau PO, Negrao MV, Mitchell KG, et al. Neoadjuvant Chemotherapy Increases Cytotoxic T Cell, Tissue Resident Memory T Cell, and B Cell Infiltration in Resectable NSCLC. J. Thorac. Oncol. 2021, 16, 127–139. [CrossRef] [PubMed]
- Hu M, Li K, Maskey N, et al. Decreased intratumoral Foxp3 Tregs and increased dendritic cell density by neoadjuvant chemotherapy associated with favorable prognosis in advanced gastric cancer. Int. J. Clin. Exp. Pathol. 2014, 7, 4685–94.
- Pages F, Berger A, Camus M, et al. Effector memory T cells, early metastasis, and survival in colorectal cancer. N. Engl. J. Med. 2005, 353, 2654–66. [CrossRef] [PubMed]
- Brightman SE, Becker A, Thota RR, et al. Neoantigen-specific stem cell memory-like CD4(+) T cells mediate CD8(+) T cell-dependent immunotherapy of MHC class II-negative solid tumors. Nat. Immunol. 2023, 24, 1345–1357. [CrossRef]
- Huang Q, Wu X, Wang Z, et al. The primordial differentiation of tumor-specific memory CD8(+) T cells as bona fide responders to PD-1/PD-L1 blockade in draining lymph nodes. Cell 2022, 185, 4049–4066. [CrossRef]
- Zuazo M, Arasanz H, Fernandez-Hinojal G, et al. Functional systemic CD4 immunity is required for clinical responses to PD-L1/PD-1 blockade therapy. EMBO Mol. Med. 2019, 11, e10293. [CrossRef]
- Perez EA, Ballman KV, Tenner KS, et al. Association of Stromal Tumor-Infiltrating Lymphocytes With Recurrence-Free Survival in the N9831 Adjuvant Trial in Patients With Early-Stage HER2-Positive Breast Cancer. JAMA Oncol. 2016, 2, 56–64. [CrossRef]
- Chen L, Gibbons DL, Goswami S, et al. Metastasis is regulated via microRNA-200/ZEB1 axis control of tumour cell PD-L1 expression and intratumoral immunosuppression. Nat. Commun. 2014, 5, 5241. [CrossRef]
- Sun XF, Zhang H. Clinicopathological significance of stromal variables: angiogenesis, lymphangiogenesis, inflammatory infiltration, MMP and PINCH in colorectal carcinomas. Mol. Cancer 2006, 5, 43. [CrossRef]
- Guo S, Deng CX. Effect of Stromal Cells in Tumor Microenvironment on Metastasis Initiation. Int. J. Biol. Sci. 2018, 14, 2083–2093. [CrossRef] [PubMed]
- Zhu Y, Tzoras E, Matikas A, et al. Expression patterns and prognostic implications of tumor-infiltrating lymphocytes dynamics in early breast cancer patients receiving neoadjuvant therapy: A systematic review and meta-analysis. Front. Oncol. 2022, 12, 999843. [CrossRef]
- Liu H, Zhang T, Ye J, et al. Tumor-infiltrating lymphocytes predict response to chemotherapy in patients with advance non-small cell lung cancer. Cancer Immunol. Immunother. 2012, 61, 1849–56. [CrossRef]
- Kong JCH, Guerra GR, Millen RM, et al. Tumor-Infiltrating Lymphocyte Function Predicts Response to Neoadjuvant Chemoradiotherapy in Locally Advanced Rectal Cancer. JCO Precis Oncol. 2018, 2, 1–15. [CrossRef]
- Sirody J, Kaji AH, Hari DM, Chen KT. Patterns of gastric cancer metastasis in the United States. Am. J. Surg. 2022, 224, 445–448. [CrossRef] [PubMed]
Figure 1.
Scatter plot of tumor infiltrating lymphocyte (TIL) densities in ≥cT2N0-3 disease stratified by receipt of neoadjuvant chemotherapy (NAC) and tissue location (intratumoral vs. stromal). Conv, conventional; mem, memory; Treg, T regulatory. Black line represents median with error bars for 95% confidence interval. *Statistical significance p<0.05.
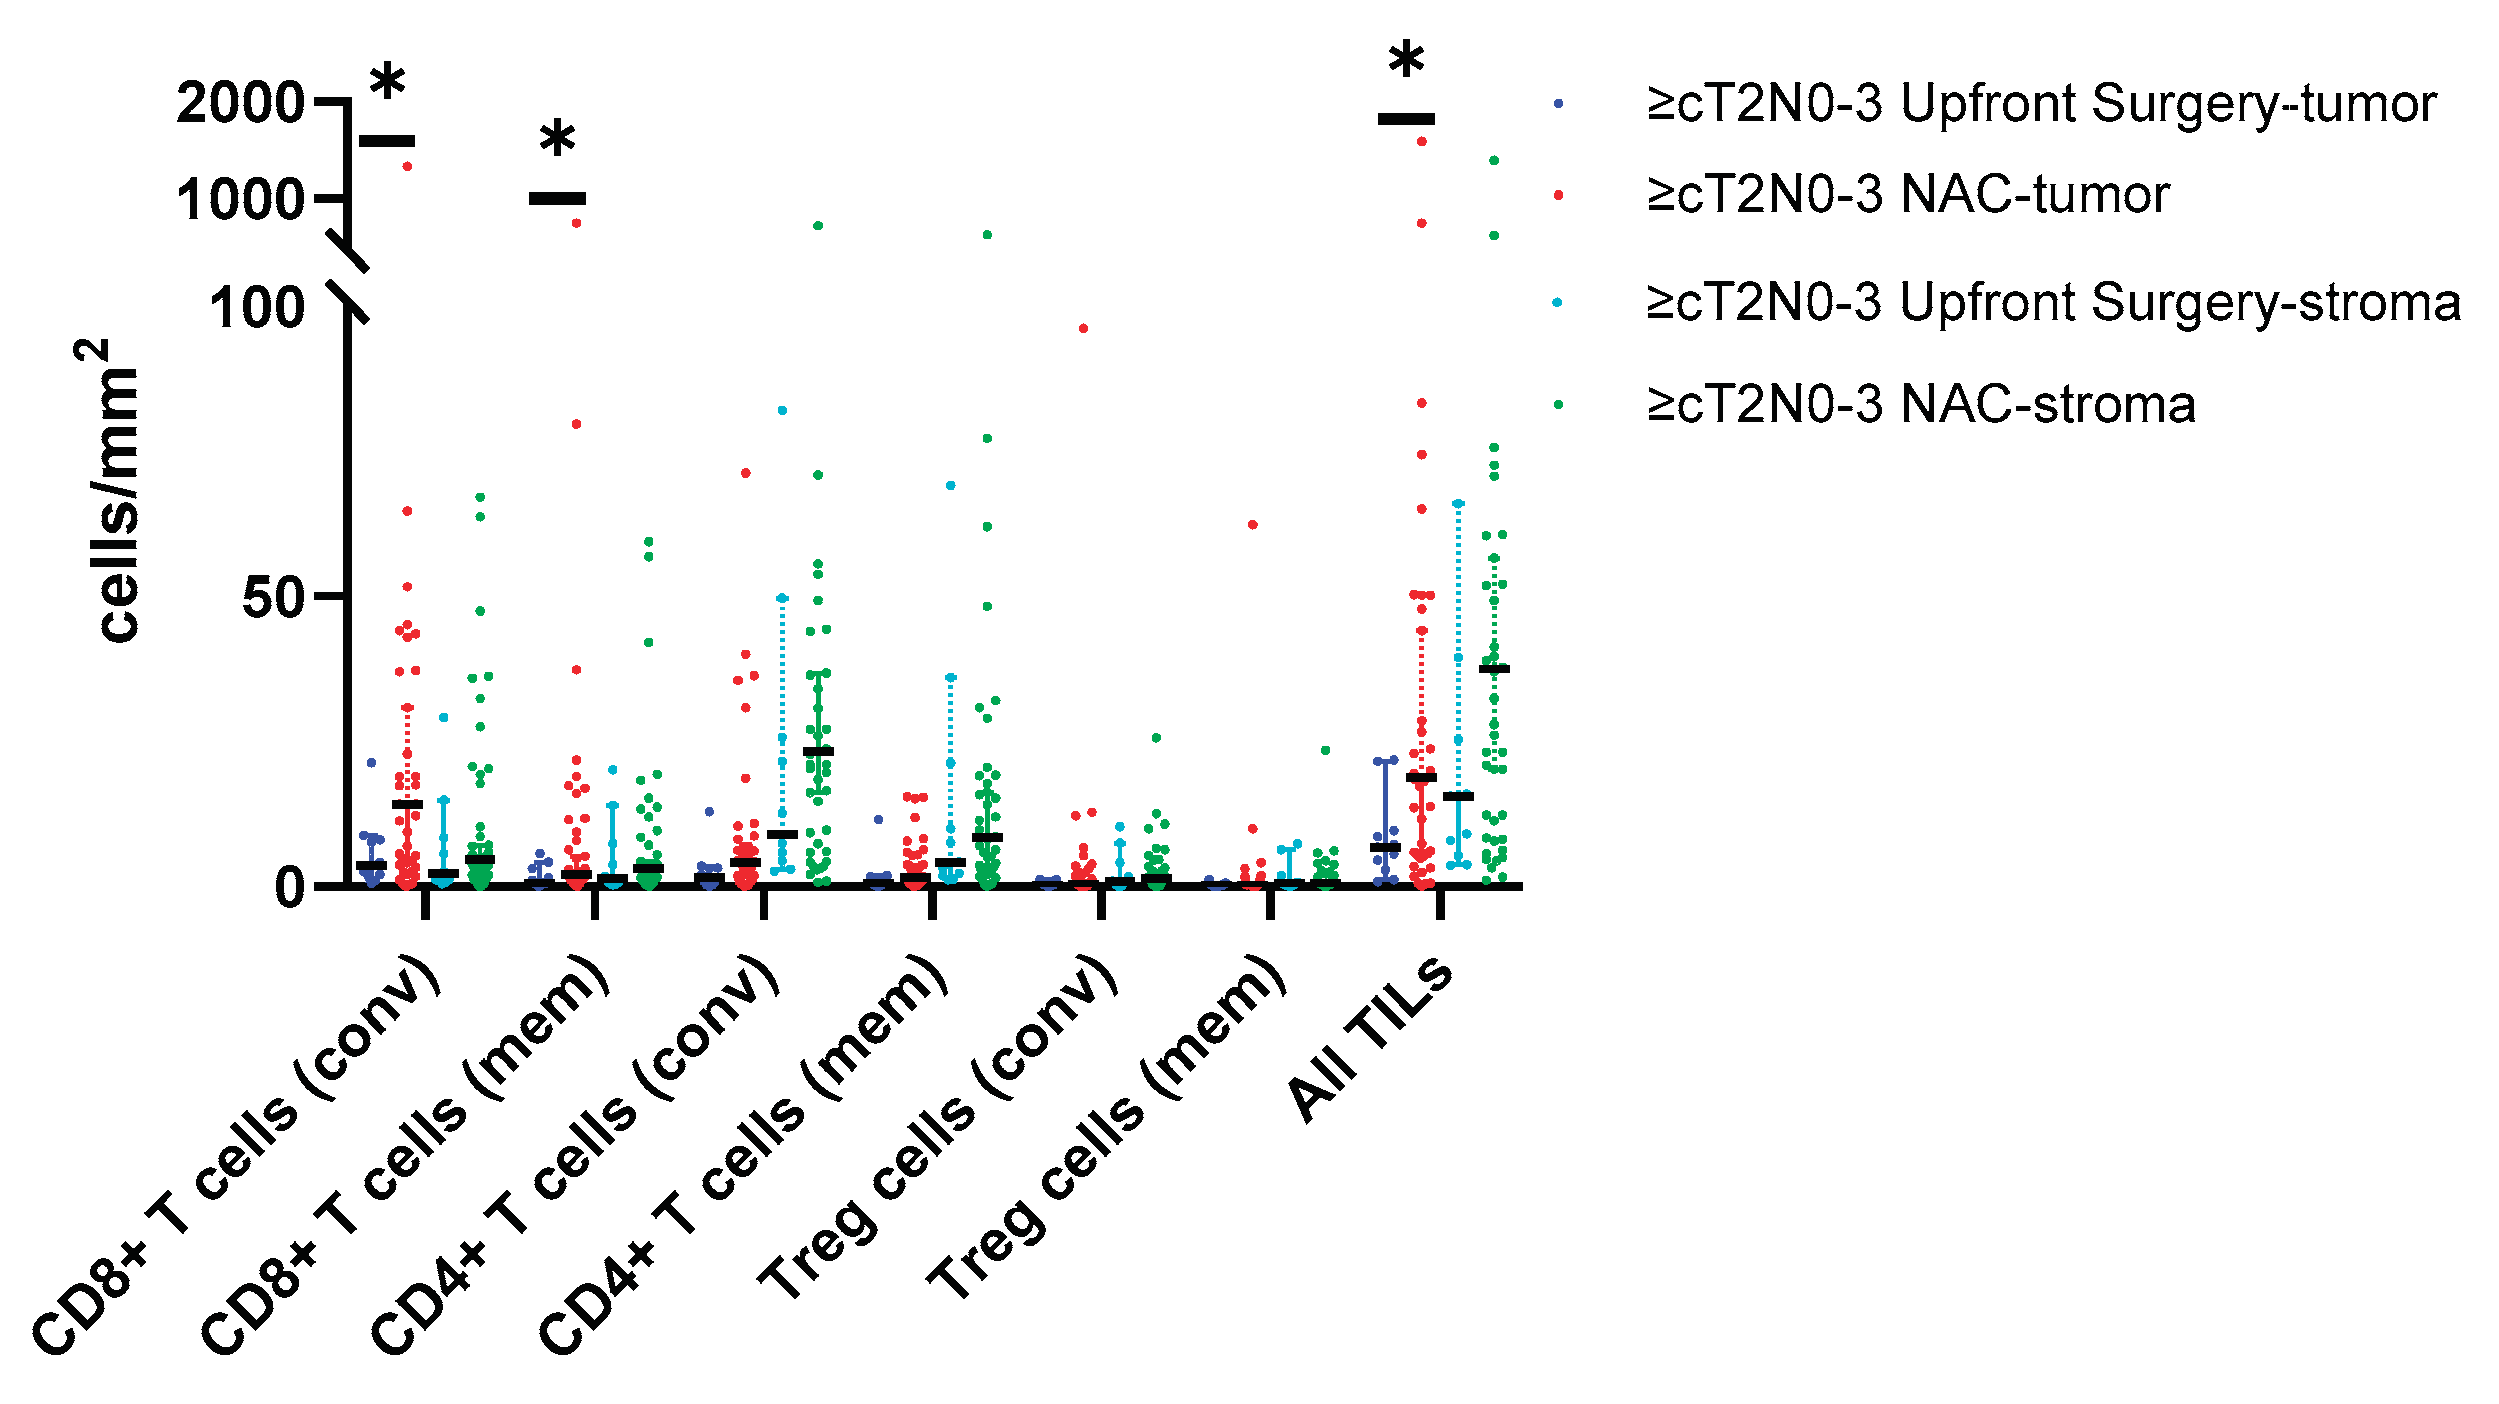
Figure 2.
a-f. Kaplan-Meier survival curves with log-rank tests demonstrating longer (a) overall survival and (b-f) recurrence free survival with high vs. low stromal TILs in patients with ≥cT2N0-3 disease treated with NAC. Median survival follows in parentheses. (a) low (29.0 mos) versus high (NR, not reached) CD4+ T cells; p=0.019 (b) low (14.0 mos) versus high (NR) CD8+ memory T cells p=0.005 (c) low (14.0 mos) versus high (NR) CD4+ T cells; p=0.002 (d) low (20.0 mos) versus high (NR) CD4+ memory T cells; p=0.010 (e) low (14.0 mos) versus high (NR) T regulatory cells; p=0.001 (f) low (20.0 mos) versus high (NR) total TILs; p=0.011.
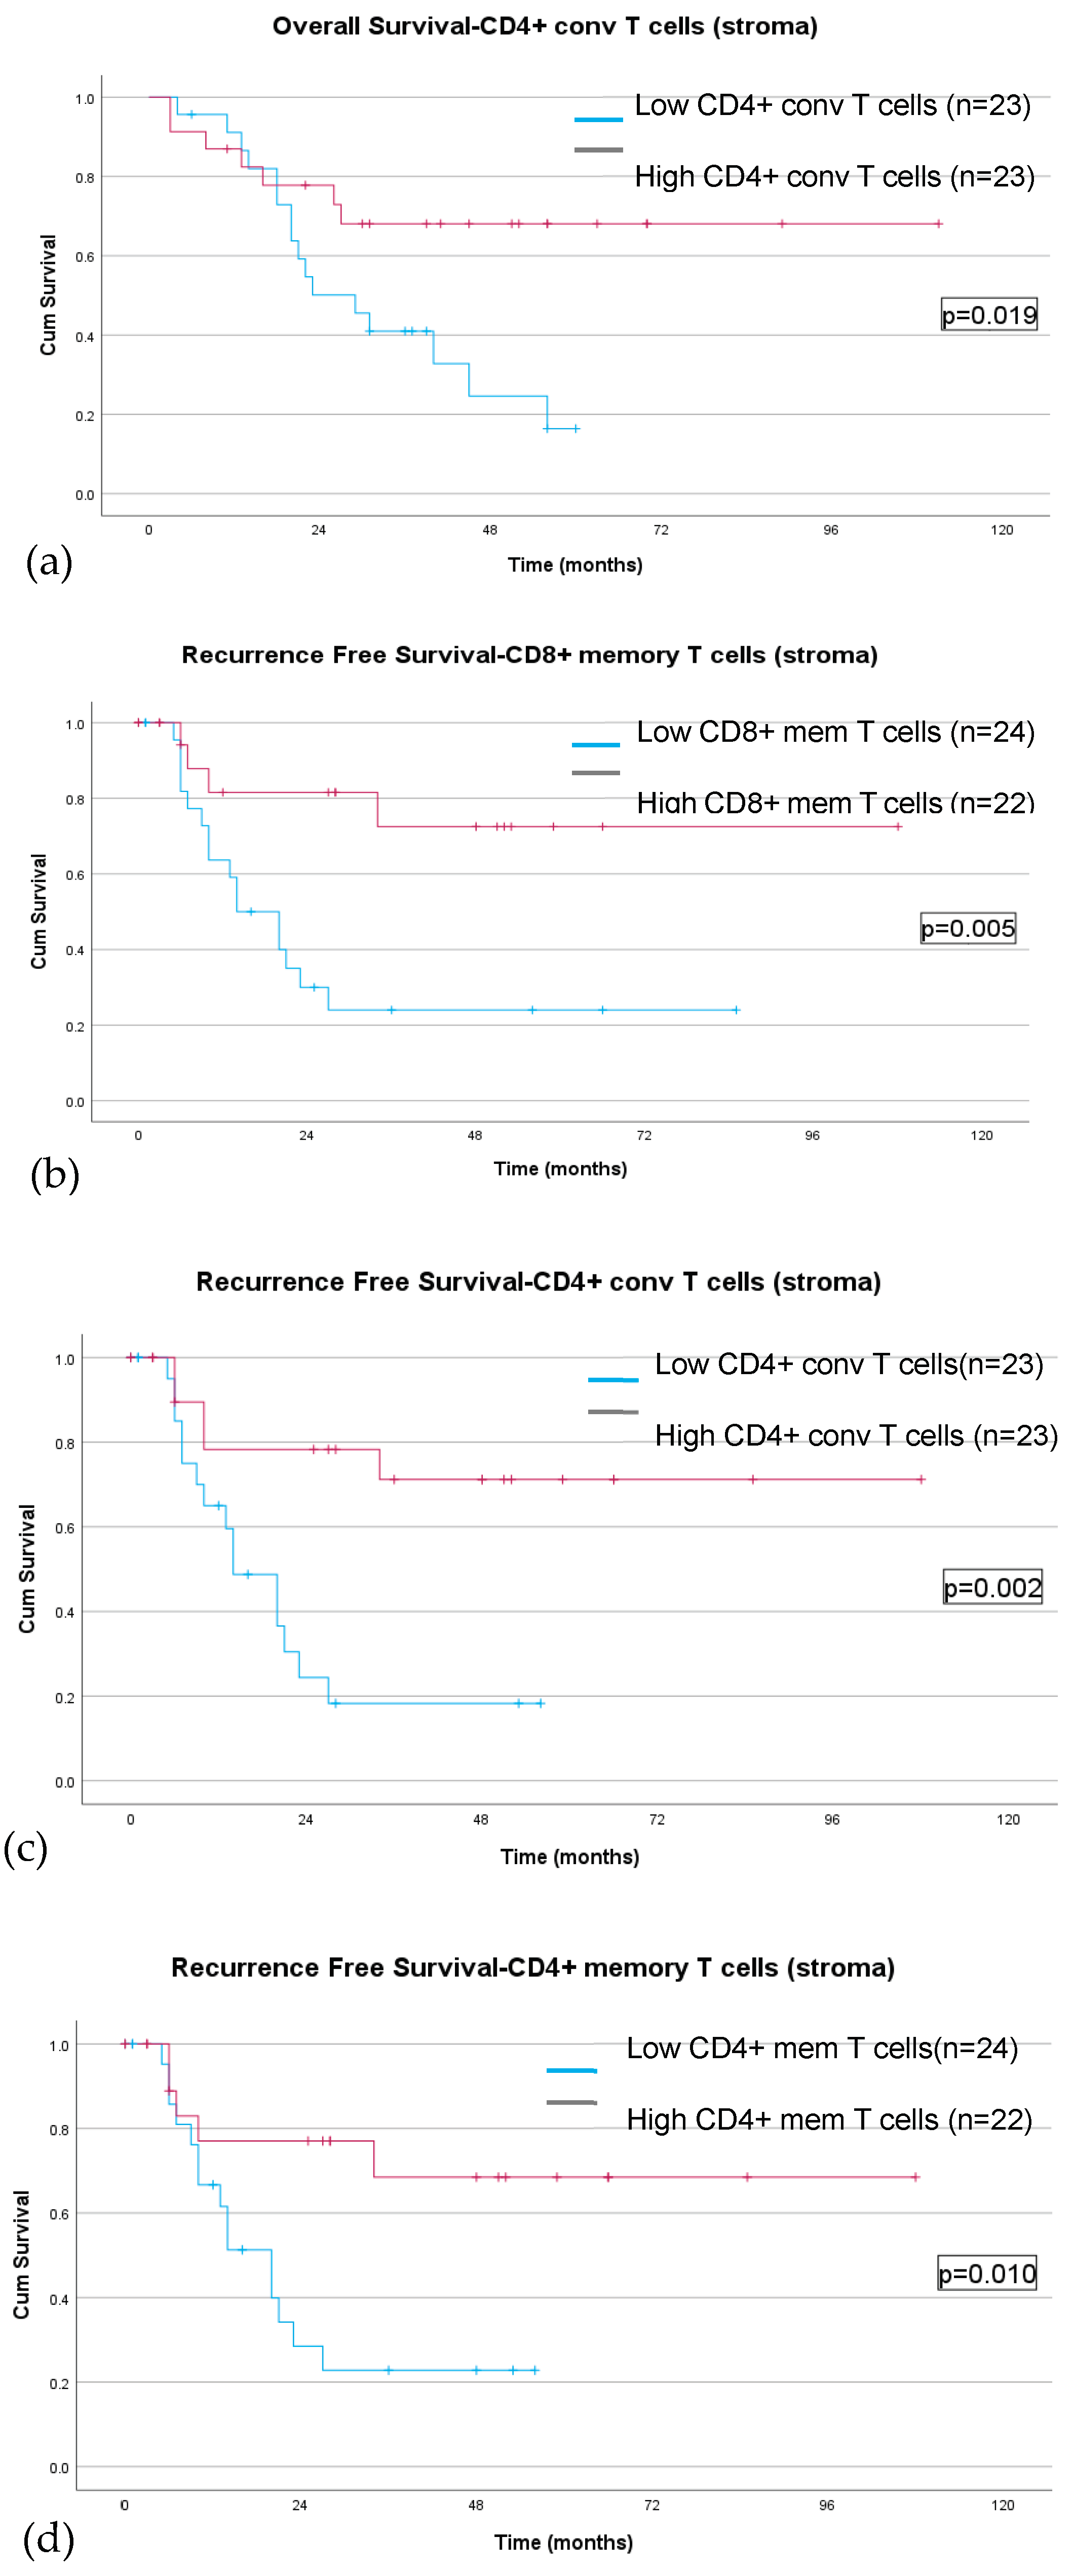
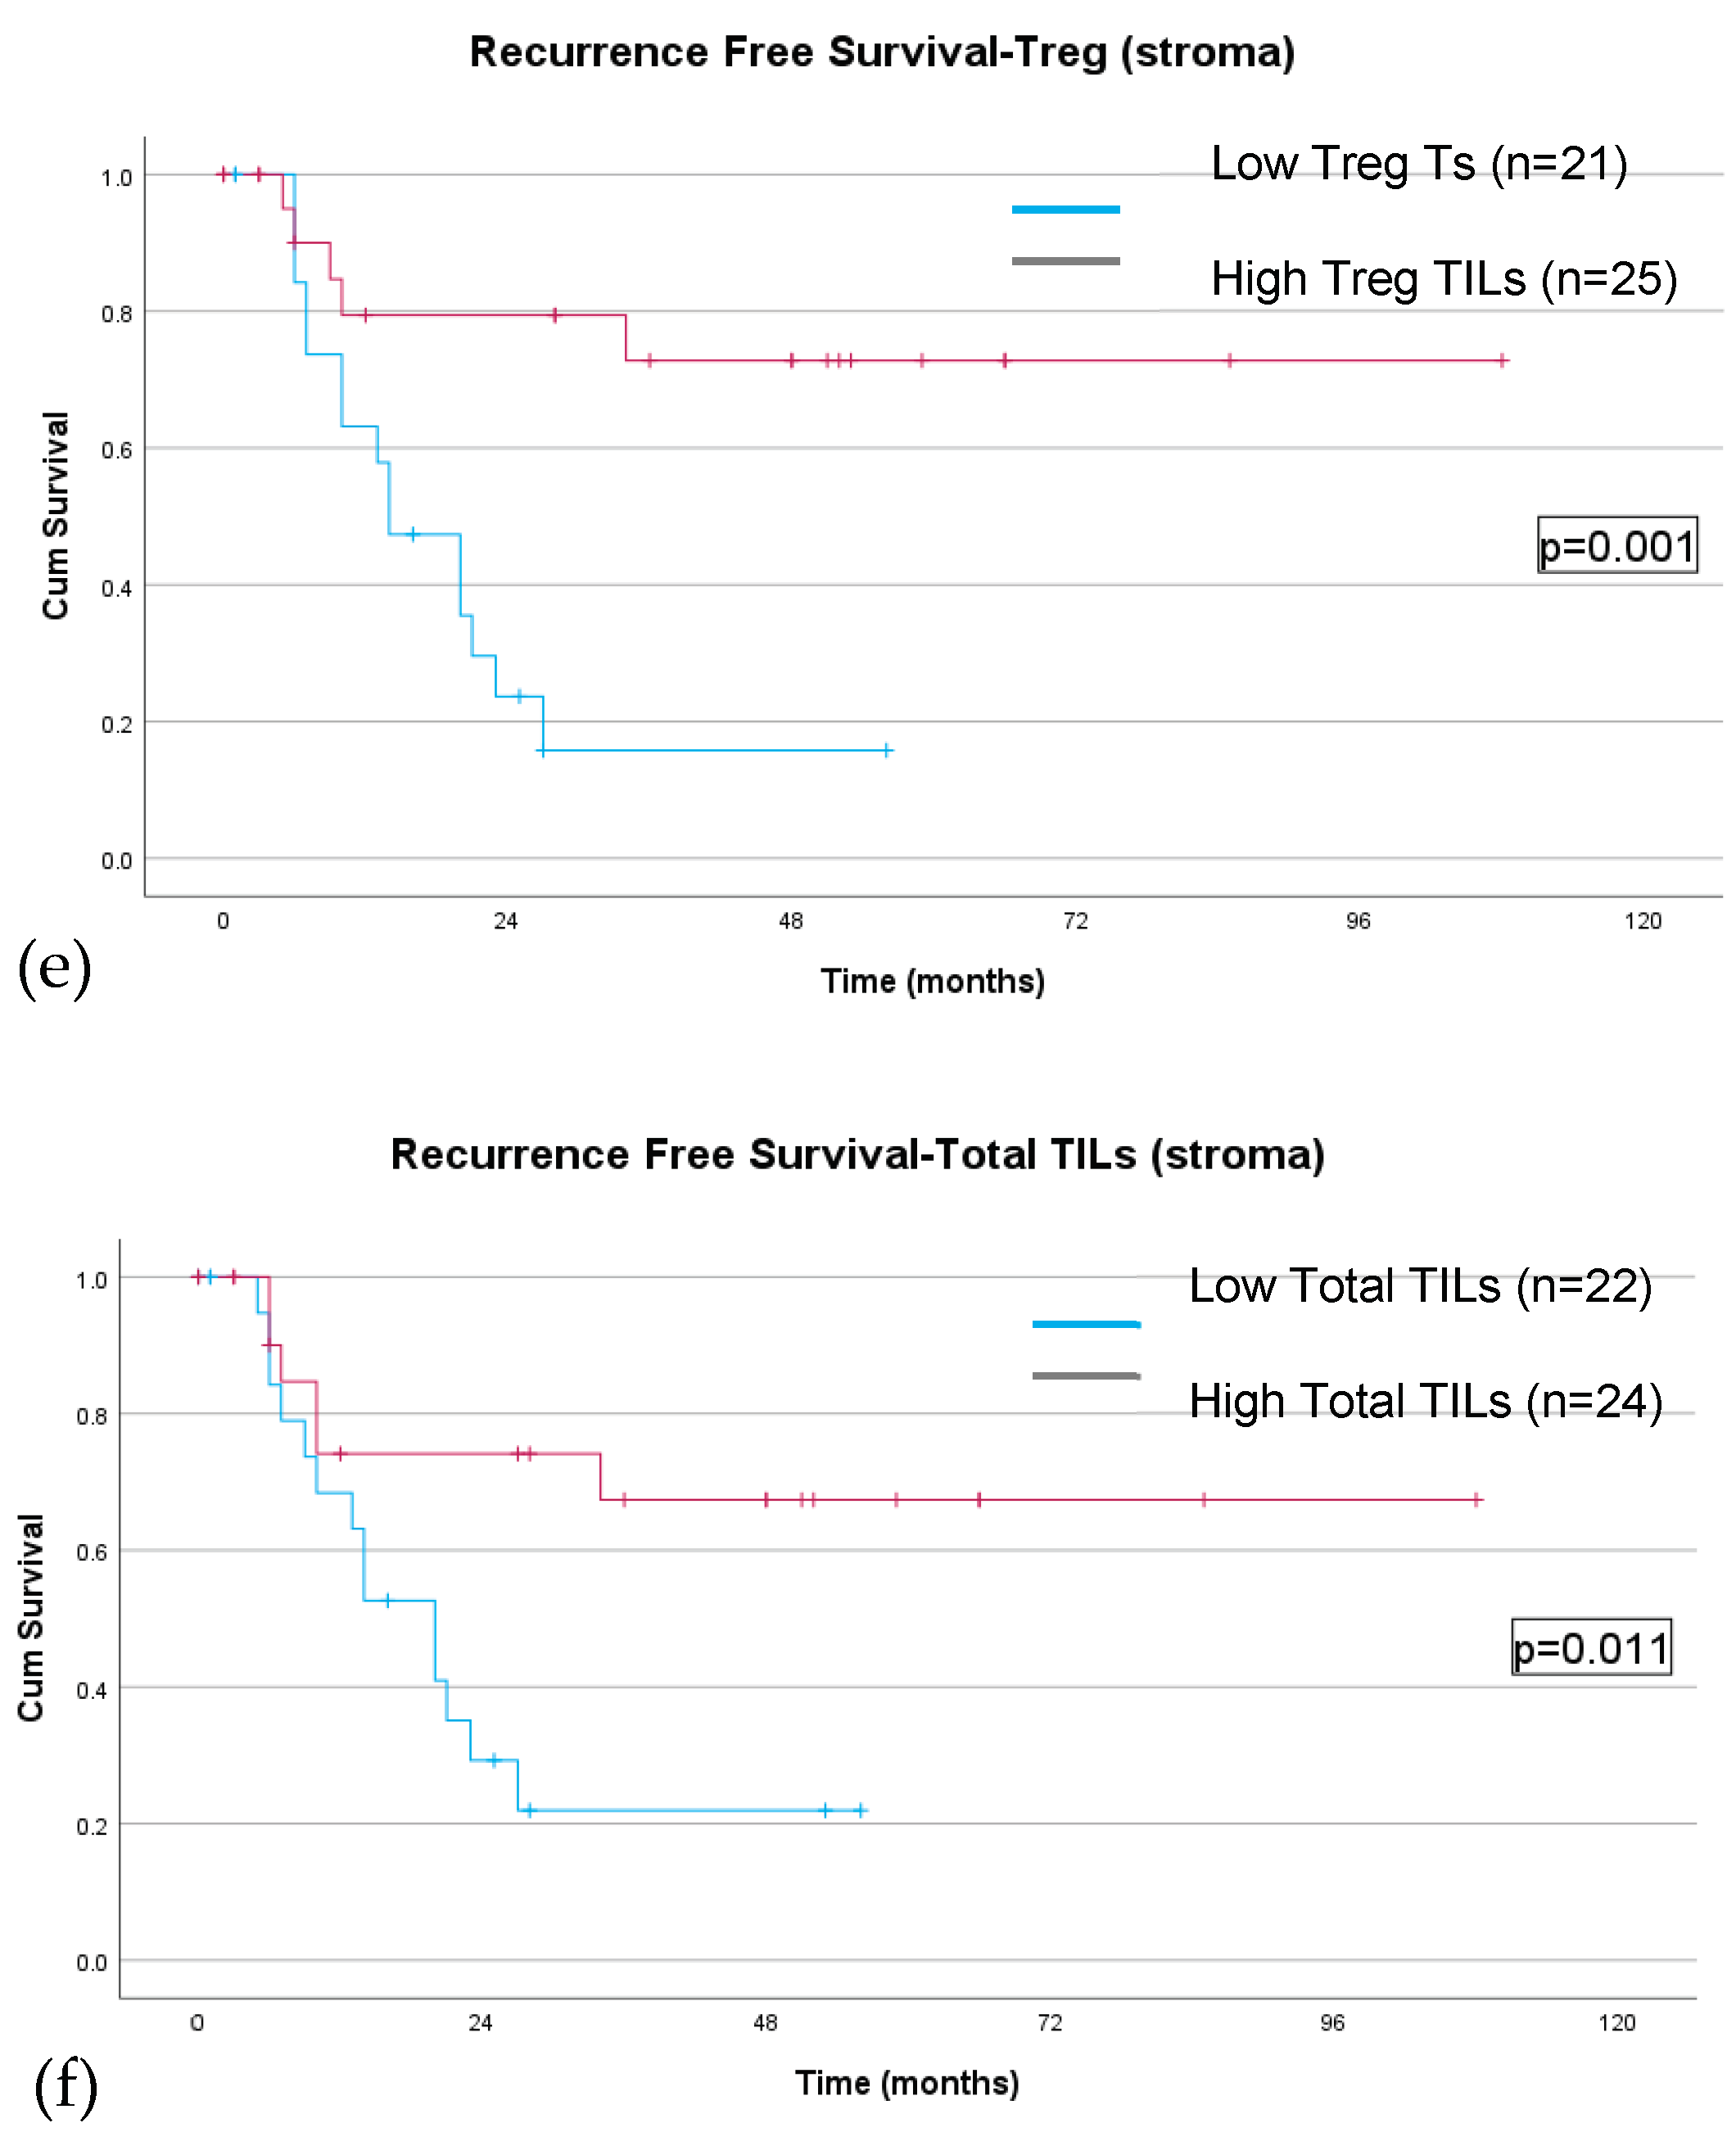

Table 1.
Demographic and clinicopathologic characteristics of the overall cohort and of patients with ≥cT2N0-3 disease stratified by receipt of neoadjuvant chemotherapy (NAC). EMR, endoscopic mucosal dissection; ESD, endoscopic submucosal dissection; CRS, chemotherapy response score; US, upfront surgery.
| Characteristic |
Overall cohort (n=68) |
Upfront Surgery (n=18) |
NAC (n=50) |
p value |
≥cT2N0-3 US (n=11) |
≥cT2N0-3 NAC (n=46) |
p value |
| Demographic characteristics | |||||||
| Sex, n (%) Male Female |
40 (58.8) 28 (41.2) |
8 (44.4) 10 (55.6) |
32 (64.0) 18 (36.0) |
0.148 |
7 (63.6) 4 (36.4) |
30 (65.2) 16 (34.8) |
0.921 |
| Age at diagnosis, mean (SD) | 62.8 (53.3, 73.3) | 64.6 (+/-18.0) | 65.5 (+/-13.5) | 0.531 | 69.8 (+/-16.6) | 63.0 (+/-13.4) | 0.156 |
| Race, n (%) White Black/African American Asian American Indian/Alaskan native Other |
46 (67.6) 6 (8.8) 8 (11.8) 1 (1.5) 7 (10.3) |
13 (72.2) 1 (5.6) 2 (11.1) - 2 (11.1) |
33 (66.0) 5 (10.0) 6 (12.0) 1 (2.0) 5 (10.0) |
0.944 |
7 (63.6) 1 (9.1) 1 (9.1) - 2 (18.2) |
31 (67.4) 4 (8.7) 6 (13.0) - 5 (10.9) |
0.944 |
| Clinicopathologic characteristics | |||||||
| Clinical T stage, n (%) T1a T1b T2 T3 T4 T4a T4b Missing |
3 (4.4) 7(10.3) 12 (17.6) 35 (51.5) 1 (1.5) 7 (10.3) 2 (2.9) 1 (1.5) |
2 (11.1) 5 (27.8) 7 (38.9) 3 (16.7) - - 1 (5.6) - |
1 (2.0) 2 (4.0) 5 (10.0) 32 (64.0) 1 (2.0) 7 (14.0) 1 (2.0) 1 (2.0) |
<0.001 |
- - 7 (63.6) 3 (75.0) - - 1 (9.1) - |
- - 5 (10.9) 32 (69.6) 1 (2.2) 7 (15.2) 1 (2.2) - |
<0.001 |
| Clinical N stage, n (%) N0 N1-2 Missing |
39 (57.4) 28 (41.2) 1 (1.5) |
16 (88.9) 2 (11.1) - |
23 (46.9) 26 (52.0) 1 (2.1) |
0.002 |
9 (81.8) 2 (18.2) - |
20 (43.5) 25 (54.3) 1 (2.2) |
0.026 |
| Overall clinical stage, n (%) Stage I Stage II Stage III Stage Iva Missing |
19 (27.9) 21 (30.9) 25 (36.8) 67 (98.5) 1 (1.5) |
14 (77.8) 2 (11.1) 1 (5.6) 1 (5.6) |
5 (10.2) 19 (38.0) 24 (48.0) 1 (2.0) 1 (2.0) |
<0.001 |
7 (63.6) 2 (18.2) 1 (9.1) 1 (9.1) - |
3 (6.5) 18 (39.1) 24 (52.2) 1 (2.2) - |
<0.001 |
| Tumor location, n (%) Distal Proximal Linitis plastica Undefined |
45 (66.2) 18 (26.5) 4 (5.9) 1 (1.5) |
15 (75.0) 2 (10.0) - 1 (5.0) |
30 (60.0) 16 (32.0) 4 (8.0) - |
0.091 |
10 (90.9) - - 1 (9.1) |
26 (56.5) 16 (34.8) 4 (8.7) - |
0.034 |
| Histologic subtype, n (%) Intestinal Diffuse/Signet-ring Mixed Neuroendocrine |
24 (35.3) 39 (57.4) 3 (4.4) 2 (2.9) |
9 (50.0) 8 (44.4) - 1 (5.6) |
15 (30.0) 31 (62.0) 3 (6.0) 1 (2.0) |
0.277 |
7 (63.6) 4 (36.4) - - |
15 (32.6) 28 (60.9) 2 (4.3) 1 (2.2) |
0.275 |
| Preoperative and intraoperative characteristics | |||||||
| Neoadjuvant regimen, n (%) Other FOLFOX FLOT |
17 (25.0) 25 (36.8) 6 (8.8) |
- - - |
- - - |
- |
- - - |
17 (37.0) 23 (50.0) 6 (13.0) |
- |
| Rounds of chemotherapy | 3.89 (+/-1.7) | - | - | - | 4.0 (3.0-4.0) | - | |
| Neoadjuvant radiation, n (%) No Yes |
65 (95.6) 3 (4.4) |
- - |
45 (93.8) 3 (6.3) |
0.288 |
11 (100) |
43 (93.5) 3 (6.5) |
0.288 |
| Type of resection, n (%) Partial gastrectomy Total gastrectomy EMR/ESD* |
40 (58.8) 23 (33.8) 5 (7.3) |
9 (50.0) 5 (27.8) 4 (20.0) |
31 (62.0) 18 (36.0) 1 (2.0) |
0.019 |
7 (63.6) 3 (27.3) 1 (9.1) |
28 (60.9) 17 (37.0) 1 (2.2) |
0.482 |
| Pathologic tumor characteristics | |||||||
| Pathologic overall stage, n (%) Stage I Stage II Stage III Stage IV |
21 (30.9) 20 (29.4) 20 (29.4) 7 (10.3) |
11 (61.1) 1 (5.6) 5 (27.8) 1 (5.6) |
10 (20.0) 19 (38.0) 15 (30.0) 6 (12.0) |
0.006 |
4 (36.4) 1 (9.1) 5 (45.5) 1 (9.1) |
9 (19.6) 18 (39.1) 15 (32.6) 4 (8.7) |
0.270 |
| Clinical to pathologic stage change, n (%) No change Downstage Upstage Missing |
35 (51.5) 17 (25.0) 15 (22.1) 1 (1.5) |
13 (72.2) 1 (5.6) 4 (22.2) - |
22 (44.0) 16 (32.0) 11 (22.0) 1 (2.0) |
0.058 |
6 (54.5) 1 (9.1) 4 (36.4) - |
21 (45.7) 16 (34.8) 9 (19.6) - |
0.201 |
| Histologic subtype, n (%) Intestinal Diffuse/signet-ring Mixed Neuroendocrine |
24 (35.3) 39 (57.4) 3 (4.4) 2 (2.9) |
9 (45.0) 10 (50.0) 1 (5.0) |
15 (31.3) 29 (60.4) 3 (6.3) 1 (2.1) |
0.443 |
7 (63.6) 4 (36.4) - - |
15 (32.6) 28 (60.9) 2 (4.3) 1 (2.2) |
0.275 |
| Histologic differentiation, n (%) Poor Poor-moderate Moderate Mod to well Well |
42 (61.8) 5 (7.4) 17 (25.0) 1 (1.5) 3 (4.4) |
7 (38.9) 2 (11.1) 6 (33.3) 1 (5.6) 2 (11.1) |
35 (70.0) 3 (6.0) 11 (22.0) - 1 (2.0) |
0.075 |
3 (27.3) 2 (18.2) 5 (45.5) 1 (9.1) - |
31 (67.4) 3 (6.5) 11 (23.9) - 1 (2.2) |
0.047 |
| Margin status, n (%) R0 R1 R2 |
58 (85.3) 10 (14.7) - |
18 (100) - - |
40 (80.0) 10 (20.0) - |
0.040 |
11 (100) - |
37 (80.4) 9 (19.6) - |
0.040 |
| Treatment effect, n (%) Minimal residual disease (CRS 3) Moderate response (CRS 2) Poor response (CRS 1) Unknown |
4 (8.0) 21 (42.0) 22 (44.0) 3 (6.0) |
- |
4 (8.0) 21 (42.0) 22 (44.0) 3 (6.0) |
- |
- |
4 (8.7) 20 (43.5) 19 (41.3) 3 (6.5) |
- |
Table 2.
Molecular phenotype and tumor infiltrating lymphocyte densities in the overall cohort (left) and in patients with ≥cT2N0-3 disease (right) stratified by location (intratumoral and stromal) and receipt of NAC. US, upfront surgery.
Table 2.
Molecular phenotype and tumor infiltrating lymphocyte densities in the overall cohort (left) and in patients with ≥cT2N0-3 disease (right) stratified by location (intratumoral and stromal) and receipt of NAC. US, upfront surgery.
| Molecular phenotype & tumor infiltrating lymphocyte profiles | |||||||
|
Overall cohort (n=68) |
Upfront Surgery (n=18) |
NAC (n=50) |
p value |
≥cT2N0-3 US (n=11) |
≥cT2N0-3 NAC (n=46) |
p value | |
| EBV status, n (%) Negative Positive |
65 (95.6) 3 (4.4) |
18 (100) - |
47 (94.0) 3 (6.0) |
0.288 |
11 (100) - |
43 (93.5) 3 (6.5) |
0.384 |
| MMR, n (%) Proficient Deficient |
60 (88.2) 8 (11.8) |
17 (94.4) 1 (5.6) |
43 (86.0) 7 (14.0) |
0.340 |
10 (90.9) 1 (9.1) |
40 (87.0) 6 (13.0) |
0.720 |
| PD-L1 status, n (%) Negative Positive |
41 (60.3) 27 (39.7) |
11 (61.1) 7 (38.9) |
30 (60.0) 20 (40.0) |
0.934 |
7 (63.6) 4 (36.4) |
27 (58.7) 19 (41.3) |
0.764 |
| Tumor infiltrating lymphocytes densities – intratumoral | |||||||
| CD8+ T cells, cells/mm2 Conventional (CD8+) Memory (CD8+/CD45RO+) |
8.6 (3.4, 37.1) 1.8 (0.8, 9.0) |
5.1 (2.1, 8.5) 1.0 (0.6, 4.8) |
14.25 (4.3, 43.7) 2.3 (1.1, 10.8) |
0.024 0.119 |
3.6 (2.0, 8.1) 0.7 (0.4, 3.1) |
14.2 (4.0, 43.7) 2.0 (1.0, 11.6) |
0.019 0.050 |
| CD4+ T cells, cells/mm2 Conventional (CD4+) Memory (CD4+/CD45RO+) |
3.4 (0.8, 8.0) 1.6 (0.4, 5.0) |
1.7 (0.6, 5.7) 0.8 (0.3, 3.3) |
4.5 (0.8, 9.2) 2.1 (0.6, 5.6) |
0.182 0.254 |
1.5 (0.3, 3.2) 0.6 (0.2, 1.7) |
4.2 (0.9, 8.3) 1.6 (0.5, 5.4) |
0.089 0.119 |
| Treg cells, cells/mm2 Conventional (CD4+/FOXP3+) Memory (CD4+/CD45RO+) |
0.4 (0.1, 1.7) 0.2 (0.04, 1.7) |
0.5 (0.04, 1.5) 0.2 (0.02, 1.2) |
0.4 (0.1, 1.9) 0.2 (0.04, 0.9) |
0.671 0.950 |
0.3 (0.1, 1.1) 0.1 (0.04, 0.4) |
0.4 (0.1, 1.9) 0.2 (0.03, 0.8) |
0.442 0.754 |
| B cells, cells/mm2 Conventional (CD220+) Memory (CD220+/CD45RO+) |
0.02 (0.003, 0.15) 0 |
0.01 (0.01, 0.09) 0 |
0.04 (0.0, 0.16) 0 |
0.550 |
0.01 (0.0, 0.01) 0.0 |
0.03 (0.0, 0.16) 0.0 |
0.088 |
| All TIL (CD8+, CD4+, B cell) | 13.6 (5.5, 49.6) | 7.9 (4.1, 15.4) | 19.3 (5.6, 53.9) | 0.047 | 6.7 (2.8, 9.6) | 18.8 (5.4, 53.9) | 0.041 |
| ALL memory TILs | 0.3 (0.03, 2.3) | 0.11 (0.01, 0.49) | 0.28 (0.05, 3.48) | 0.098 | 0.05 (0.01, 0.3) | 0.2 (0.04, 3.1) | 0.048 |
| CD8:Treg ratio | 23.2 (6.6, 3.4) | 7.8 (3.7, 53.3) | 25.5 (12.4, 54.6) | 0.123 | 7.5 (3.1, 29.5) | 25.5 (7.0, 55.2) | 0.079 |
| Tumor infiltrating lymphocytes densities – stromal | |||||||
| CD8+ T cells, cells/mm2 Conventional (CD8+) Memory (CD8+/CD45RO+) |
4.9 (1.6, 19.0) 3.3 (1.0, 11.6) |
6.4 (1.2, 21.4) 4.4 (0.9, 13.8) |
4.6 (1.8, 18.1) 3.1 (1.0, 8.8) |
0.597 0.396 |
2.3 (1.1, 8.4) 1.45 (0.6, 7.3) |
4.6 (1.9, 19.6) 3.1 (1.0, 10.2) |
0.203 0.385 |
| CD4+ T cells, cells/mm2 Conventional (CD4+) Memory (CD4+/CD45RO+) |
23.2 (6.3, 53.1) 9.7 (2.4, 29.0) |
23.6 (7.1, 73.7) 11.1 (3.0, 40.1) |
23.2 (6.0, 50.4) 8.4 (2.3, 21.0) |
0.906 0.359 |
8.9 (4.5, 21.2) 4.2 (1.8, 21.2) |
23.2 (7.0, 54.2) 8.4 (2.6, 22.7) |
0.143 0.454 |
| Treg cells, cells/mm2 Conventional (CD4+/FOXP3+) Memory (CD4+/CD45RO+) |
1.3 (0.2, 3.4) 0.5 (0.1, 1.8) |
1.0 (0.5, 4.9) 0.6 (0.2, 1.7) |
1.4 (0.2, 2.8) 0.5 (0.1, 1.3) |
0.592 0.254 |
0.8 (0.2, 4.1) 0.5 (0.1, 1.8) |
1.4 (0.2, 3.3) 0.5 (0.1, 1.7) |
0.716 0.952 |
| B cells, cells/mm2 Conventional (CD220+) Memory (CD220+/CD45RO+) |
1.2 (04, 6.7) 0.1 (0.02, 1.2) |
1.3 (0.6, 10.0) 0.2 (0.02, 1.7) |
0.9 (0.3, 5.6) 0.1 (0.2, 0.6) |
0.294 0.555 |
0.9 (0.2, 1.3) 0.3 (0.02, 0.3) |
1.1 (0.3, 6.6) 0.1 (0.02, 0.9) |
0.379 0.201 |
| All TIL (CD8+, CD4+, B cell) | 36.1 (8.6, 74.9) | 31.0 (8.7, 97.8) | 37.4 (8.3, 71.1) | 0.889 | 15.6 (5.3, 39.4) | 37.4 (10.6, 73.3) | 0.110 |
| CD8:Treg ratio | 3.6 (2.3, 10.3) | 3.4 (1.4, 16.2) | 3.6 (2.4, 9.6) | 0.479 | 2.3 (1.2, 4.8) | 3.6 (2.3, 9.6) | 0.152 |
Disclaimer/Publisher’s Note: The statements, opinions and data contained in all publications are solely those of the individual author(s) and contributor(s) and not of MDPI and/or the editor(s). MDPI and/or the editor(s) disclaim responsibility for any injury to people or property resulting from any ideas, methods, instructions or products referred to in the content. |
© 2024 by the authors. Licensee MDPI, Basel, Switzerland. This article is an open access article distributed under the terms and conditions of the Creative Commons Attribution (CC BY) license (http://creativecommons.org/licenses/by/4.0/).
Copyright: This open access article is published under a Creative Commons CC BY 4.0 license, which permit the free download, distribution, and reuse, provided that the author and preprint are cited in any reuse.


