
Submitted:
24 December 2025
Posted:
25 December 2025
You are already at the latest version
Abstract
In this work, we evaluate the efficiency of a DNA purification protocol from gynecological samples using locally synthesized Fe₃O₄@SiO₂ magnetic microparticles and a low-cost, guanidinium thiocyanate (GITC)-free lysis buffer. The microparticles were characterized by SEM, EDS, FTIR, and magnetic measurements, confirming the formation of compact silica-coated aggregates with suitable magnetic responsiveness for rapid and complete capture. Using this material in combination with a simple, GITC-free lysis buffer, we achieved DNA extraction yields comparable to those obtained with standard methods based in chaotropic salts. The purified DNA showed high compatibility with molecular assays for the detection of Chlamydia trachomatis, Ureaplasma urealyticum, Mycoplasma hominis, and human papilloma virus. Clinical validation demonstrated excellent diagnostic performance, with only a few discrepancies observed in samples near the detection threshold of qPCR, a limitation shared with commercial kits. Overall, the method represents a low-cost, safe, and sustainable alternative for routine clinical and epidemiological applications, compared to those methods based on cha-otropic salts buffers. Furthermore, it reduces reliance on imported commercial consuma-bles and minimizes the handling of hazardous reagents.
Keywords:
magnetic microparticles
; DNA extraction
; GITC-free lysis
; molecular diagnostics
; PCR
; Chlamydia trachomatis
; Ureaplasma urealyticum
; Mycoplasma hominis
; HPV detection
; gynecological samples
1. Introduction
Female genital tract infections caused by Chlamydia trachomatis, Ureaplasma urealyticum, Mycoplasma hominis, and Human Papillomavirus (HPV) represent a major public health concern due to their high prevalence, frequent asymptomatic presentation, and the severe complications they can cause when left undetected or untreated [1,2,3]. HPV is the primary etiological agent of cervical cancer, one of the leading causes of cancer-related deaths among women worldwide [4], whereas infections by C. trachomatis, U. urealyticum and M. hhominis, are associated with pelvic inflammatory disease, infertility, and other reproductive disorders [5]. Given these risks, routine screening for these pathogens is recommended during women’s annual check-ups. Early and accurate detection of these pathogens by molecular methods is essential to improve clinical outcomes and therapeutic effectiveness.
Molecular diagnostic techniques such as PCR, qPCR, nested PCR, or isothermal amplification are widely employed for the detection of viral and bacterial pathogens. These methods offer higher sensitivity and specificity than conventional microbiological techniques but rely critically on the efficient purification of nucleic acids from clinical samples. Among the different purification strategies, magnetic bead–based systems have demonstrated excellent performance, reproducibility, and compatibility with automation [6]. These systems selectively capture and isolate high-quality DNA or RNA while removing contaminants that could interfere with amplification reactions. Nevertheless, commercial magnetic bead kits are often expensive and subject to importation difficulties in many countries, limiting their routine use in diagnostic laboratories. Moreover, most protocols for these magnetic particles include a lysis step with guanidine thiocyanate (GITC) at high concentration (around 4M), a reagent which is both expensive and potentially toxic [7,8].
The development of locally produced magnetic microparticles and alternative purification protocols thus represents a valuable strategy to reduce costs, ensure reagent availability, and strengthen technological independence in molecular diagnostics. In this work, we evaluate the efficiency of a DNA purification protocol from gynecological samples using locally synthesized magnetic microparticles and a low-cost, GITC-free lysis buffer. The proposed method demonstrates high purification performance and compatibility with molecular assays for the detection of C. trachomatis, U. urealyticum, M. hominis, and HPV, supporting its potential as an affordable and sustainable alternative for clinical and epidemiological diagnostic applications.
2. Materials and Methods
2.1. Synthesis of Magnetite (Fe₃O₄) Nanoparticles
Magnetite nanoparticles were synthesized by a co-precipitation method. A 1 L glass flask equipped with magnetic stirring was placed in a glycerin bath at 60 °C. A solution of 8.8 g of FeCl₃·6H₂O previously dissolved in 100 mL of distilled water was added, followed by 3 g of FeCl₂·4H₂O dissolved in 50 mL of distilled water. The mixture was stirred for 10 min under constant temperature at room temperature. Subsequently, 15 mL of NH₄OH ((25% w/v) were added dropwise to the reaction mixture, and the suspension was maintained under magnetic stirring for an additional 30 min to allow complete precipitation of Fe₃O₄. The resulting precipitate was magnetically separated and washed three times with distilled water to remove unreacted ions and residual ammonia. The total yield of magnetite was approximately 3 g.
2.2. Silica Coating with Tetraethyl Orthosilicate (TEOS)
The silica coating was performed on 3 g of the synthesized magnetite nanoparticles. The nanoparticles were first washed twice with 150 mL of ethanol and then sonicated for 15 min to ensure good dispersion. The coating reaction was carried out in a 7 L glass reactor equipped with a heating mantle, mechanical stirring, a dropping funnel, and a reflux condenser. This reactor configuration allows precise temperature control and scalability, facilitating potential large-scale production for high-demand diagnostic applications.
The sonicated magnetic suspension was transferred to the reactor containing 4.275 L of ethanol. Then, 99 mL of ammonium hydroxide (25% w/v) were added, and the mixture was heated to 80 °C under continuous stirring. Once the temperature stabilized, 49 mL of tetraethyl orthosilicate (TEOS) was added dropwise. The reaction was maintained for 30 min, after which 660 mL of distilled water was added, and stirring was continued for 4 h to complete the hydrolysis and condensation processes. The obtained silica-coated magnetic particles were separated magnetically and washed twice with distilled water and ethanol to remove residual reagents.
2.3. Physicochemical Characterization
The physicochemical properties of the synthesized particles were investigated through morphological, compositional, magnetic, and spectroscopic analyses. Scanning electron microscopy (SEM) and energy-dispersive X-ray spectroscopy (EDS) were performed using a HELIOS 5 PFIB CXe DualBeam system at the Laboratório de Amostras Microscópicas (LAM, LNLS-CNPEM). SEM imaging provided high-resolution information on particle morphology and surface topography, while EDS was used to confirm the elemental composition and the presence of silica surrounding the magnetic cores.
Topographical features of MNPs@SiO₂ were analyzed by atomic force microscopy (AFM) using an NT-MDT SMENA Solver-PRO operated in tapping mode. To prepare the sample for AFM analysis, the nanoparticle dispersion was diluted to avoid tip overloading and to ensure the deposition of isolated micro-aggregates suitable for reliable topographical imaging. The stock suspension was subjected to a two-step dilution procedure, yielding a final dilution factor of 1:1250. A small aliquot of this diluted dispersion was drop-cast onto freshly cleaved mica substrates, followed by ambient drying and subsequent mechanical-vacuum desiccation for 10 minutes to remove residual moisture prior to imaging. AFM measurements were performed using standard semicontact silicon cantilevers (NSG20 series, NT-MDT) with a nominal spring constant of ~28–91 N·m⁻¹, a resonance frequency in the range of 260–630 kHz, and a typical tip radius of ~10 nm. This preparation protocol ensured sufficiently low surface coverage to prevent tip saturation while maintaining representative particle morphology for nanoscale characterization
The total concentrations of MNPs@SiO₂ in the colloidal suspensions (w/v) were estimated from the dry mass of the samples. The iron concentration was determined using the thiocyanate method [9]. Briefly, samples (MNPs and MNPs@SiO₂) were digested with 1:3 mixture of HNO₃ and HCl to oxidize and dissolve all iron species. After dilution to a fixed volume, an excess of KSCN was added to form the intensely red Fe(III)–thiocyanate complexes, predominantly [Fe(SCN)₆]³⁻. The Fe(III) concentration was quantified by measuring the absorbance at 480 nm using a Shimadzu UV-2600 spectrophotometer. A calibration curve was constructed using known amounts of high-purity metallic iron (purity confirmed by Mössbauer spectroscopy) processed under the same digestion conditions. The SiO₂ content in the composite particles was then estimated as the difference between the total mass (dry weight) and the Fe₃O₄ content determined via UV–Vis and was independently corroborated by vibrating-sample magnetometry (VSM) and magnetic-force measurements.
Additionally, particle size was determined from microscopic observations. For this purpose, a drop of ferrofluid with a concentration of 10 mg/L was dried on a microscope slide and observed using a Leica DM IL LED 1000 microscope equipped with a Nikon D3100 camera. The images obtained were analyzed using ImageJ software [10]. Elliptical shapes were manually drawn around more than 200 particles, and the mean radius of each particle was collected. The mean value and standard deviation were obtained from this dataset, and the particle-size histogram was subsequently fitted with a log-normal function using an ad-hoc Python script. The hydrodynamic size of the samples was measured by dynamic light scattering (DLS) with a Malvern Zetasizer Nano series equipment. Measurements were carried out on aqueous dispersions at room temperature after appropriate dilution to avoid multiple scattering effects. The sample was vortexed for 30 s to ensure homogeneous dispersion. The ζ-potential was also measured by DLS using electrophoretic light scattering, under the same experimental conditions, to evaluate the surface charge and colloidal stability of the systems. At least three measurements were carried out for both size and ζ-potential.
The magnetic behavior of both MNPs and MNPs@SiO₂ was investigated using a Lake Shore 7400 vibrating sample magnetometer (VSM). To assess the magnetic capture efficiency of MNPs and MNPs@SiO₂, we quantified the magnetic force they exert when exposed to a static magnetic field. For this purpose, a Nd₂Fe₁₄B permanent magnet (cylindrical, 10 mm in diameter and 12 mm in height, N52 grade identical to those used in manual purification racks) was placed on an analytical balance (RADWAG PS 1000/C/2) and its weight was tared. A microtube (Eppendorf) containing the nanoparticle dispersion was then positioned at different, precisely controlled distances above the magnet, centered with respect to its axis, without making physical contact with either the magnet or the balance. The magnetic interaction between the particles and the magnet generates an upward force on the magnet, which is recorded by the balance as a negative apparent weight. This apparent mass change is directly related to the magnetic force acting on the particles and thus allowed us to evaluate how the force varies with the sample-magnet separation, and was used as an indicator of their recovery (capture) efficiency.
The surface chemical composition and functional groups were analyzed by Fourier-transform infrared spectroscopy (FTIR). FTIR spectra were recorded at room temperature on an Agilent Cary 660 FTIR instrument equipped with an MCT B detector at the IMBUIA beamline of the fourth-generation storage ring Sirius, at the Brazilian Synchrotron Light Laboratory (LNLS, Campinas, Brazil). Spectra of the solid samples were measured in KBr pellets, collected in the 4000–400 cm−1 region with a spectral resolution of 16 cm−1. For each measurement, a total of 128 scans were accumulated. The presence of characteristic Si–O–Si stretching bands confirmed the successful coating of magnetite with silica, while Fe–O vibrations in the low-frequency region were associated with the magnetite core.
2.4. Drosophila Melanogaster Strain
Fly stocks were maintained at 18 °C on standard Drosophila melanogaster culture medium (Cornmeal 80 g/L, sucrose 100 g/L, Brewer’s yeast 40 g/L, Agar 10 g/L, Propionic acid 3 mL/L and Nipagin 1% w/v). For experiments, flies strains were raised at 25 °C on the same standard medium [11]. The y¹ w¹¹¹⁸; P(PTT-GB) hme31 BCB05282 fly line was obtained from the Bloomington Drosophila Stock Center.
2.5. Cell Culture
HeLa cell monolayers (ATCC® CCL-2™) were grown in flasks containing Dulbecco’s Modified Eagle-Medium (DMEM) supplemented with and antibiotic–antimycotic mixture (100X, Gibco) and 10% fetal bovine serum (FBS from Natocor). Cells were harvested using 1% trypsin-EDTA in PBS (Phosphate Buffered Saline) and incubated at 37 °C with a 5% CO2 in the air atmosphere. Cells were counted in a Neubauer chamber, resuspended in DMEM and transferred to an Eppendorf tube obtaining a final total cell number of 5 × 10⁵ or 1x10⁶.
2.6. Purification Protocols
HeLa cells were harvested by centrifugation (5 × 10⁵ or 1 × 10⁶ cells), the supernatant was discarded, and the pellet was directly lysed using 200 µL of lysis buffer Livak (0.08 M NaCl, 0.024 M Tris-HCl pH 6.5, 0.0085 M EDTA, 3% w/v Sarkosyl), or GITC (4 M GITC, 0.05 M Tris-HCl pH 6.5, 0.02 M EDTA, 3% w/v Sarkosyl). For D. melanogaster, three whole flies were homogenized in 200 µL of lysis buffer prior to incubation. HeLa samples were incubated for 10 min at room temperature, whereas fly homogenates were incubated for 40 min at 55 °C with agitation (600 rpm).
Following lysis, 400 µL of isopropanol and 40 µL of magnetic nanoparticles (10 mg/mL) were added, mixed, and incubated for 5 min. The tubes were placed on a magnetic rack, washed with 150 µL isopropanol and subsequently with 200 µL of 80% ethanol (with an optional second ethanol wash), dried (~30 min), and nucleic acids were eluted in 50 µL of sterile water.
Two types of biological samples were collected for diagnostic analysis: cervical brushings and vaginal swabs. The swab tip was rubbed against the inner wall of a 1.5 mL microcentrifuge tube containing 500 µL of phosphate-buffered saline (PBS) to release the cellular material. DNA extraction was performed using two different methods to allow direct comparison across protocols.
For the manual extraction protocol, each sample (125 µL) was incubated for 10 min with 250 µL of lysis buffer (0.08 M NaCl, 0.024 M Tris-HCl pH 6.5, 0.0085 M EDTA, and 3% w/v Sarkosyl). Then, 400 µL of isopropanol and 40 µL of magnetic nanoparticles (MNPs, 10 mg/mL) were added. After a 5 min incubation, the tubes were placed on a magnetic rack, the supernatant was discarded, and the particles were washed with 150 µL of isopropanol. This step was repeated using 200 µL of 80% ethanol, and an optional third wash with ethanol was performed. The nanoparticles were allowed to dry (approximately 30 min, until they turned opaque), resuspended in 50 µL of HPLC-grade water, incubated for 5 min, and the supernatant containing the eluted DNA was collected.
For comparative analysis, nucleic acids from the same clinical samples were also extracted using the Nucleic Acid Extraction Kit (Mole Bioscience) on the Auto-Pure 32A Nucleic Acid Purification system (ALLSHENG). This commercial workflow was included as an established reference method to assess the performance of the magnetic particles-based protocol. Extractions were performed using the manufacturer’s standard automated program, enabling a methodological comparison based on sample-matched outputs, despite inherent differences in reagent composition and instrument-specific operational parameters between protocols.
2.7. Molecular Detection Assays
Molecular detection of Human Papillomavirus (HPV), Chlamydia trachomatis, Ureaplasma urealyticum, and Mycoplasma hominis DNA was performed using internally validated assays routinely applied in the clinical diagnostic workflow of LDM. HPV DNA was detected by nested end-point PCR using a GeneAmp™ PCR System 9700 (Thermo Fisher Scientific, USA). Amplification products were resolved by 2% agarose gel electrophoresis and visualized under UV illumination following GelRed® nucleic acid staining (Biotium) to confirm the presence of HPV-specific amplicons. Positive and negative controls were included in each run. Additionally, amplification of an endogenous human gene was performed for each sample to rule out DNA extraction failure or PCR inhibition.
Detection of C. trachomatis, U. urealyticum, and M. hominis was carried out using real-time PCR assays on an Accurate 96 Real-Time PCR System (DLAB, China). Each assay included appropriate positive and negative controls, as well as an endogenous internal control to assess sample adequacy and extraction efficiency. A cycle threshold (Ct) value ≤35 was considered indicative of a positive result.
2.8. Ethical Considerations
Cervical brushing and vaginal swab specimens included in this study were collected as part of routine clinical practice and were accompanied by the corresponding medical orders requesting the detection of microorganisms under investigation. Upon receipt, samples were registered in the LDM (Laboratorio de Diagnóstico Molecular) laboratory information management system and subsequently anonymized, being identifiable solely by a unique protocol number. No analyses beyond those explicitly requested in the medical orders were performed. Due to the anonymized nature of the samples and the absence of additional or experimental procedures, informed consent from patients and approval by an institutional ethics committee were not required.
2.9. Statistical Methods
DNA concentrations obtained during purification were compared between pairs of buffers, pH levels, and experimental protocols using two-sample t-tests (p ≤ 0.05). Using GraphPad prism 8 software. The sensitivity and specificity of the proposed diagnostic method were calculated according to the approach described by Altman et al. 1994 [12,13]. to assess its accuracy in detecting true positive and true negative cases. Agreement between the two diagnostic methods was further evaluated using Cohen’s kappa coefficient (κ), calculated as κ=(Po−Pe)/(1−Pe) , where Po is the relative observed, Pe is the hypothetical probability of chance agreement, and PoP_oPo is the observed agreement and PeP_ePe is the expected agreement by chance. κ values were interpreted as follows: <0, “poor”; 0–0.20, “slight”; 0.21–0.40, “fair”; 0.41–0.60, “moderate”; 0.61–0.80, “substantial”; and 0.81–1.00, “almost perfect” [14,15]. Cohen’s kappa was reported with 95% confidence intervals, and p < 0.05 was considered statistically significant. These analyses were performed using Minitab 19 software.
3. Results
3.1. SEM, EDS and AFM Analysis
SEM observations revealed that the synthesized material forms compact micro-sized aggregates composed of smaller primary nanoparticles. Figure 1 shows a representative microparticle with a roughly spheroidal morphology and a highly textured surface, consistent with the clustering of silica-coated magnetite nanoparticles. The surface appears heterogeneous, with submicrometric granularity typical of TEOS-derived silica shells surrounding magnetite cores.
Elemental analysis performed by EDS at the selected point confirms the presence of Fe, O, and Si, in agreement with the expected Fe₃O₄@SiO₂ core–shell structure. The spectrum shows Fe and O signals associated with the magnetite phase and a clear Si signal corresponding to the silica coating. The intense Au peaks arise from the metallic gold layer used to coat the substrate and do not originate from the sample. The relative elemental composition obtained at the analysis point (23.0 wt% Fe, 12.9 wt% O, 6.9 wt% Si) is consistent with silica-coated iron oxide microparticles.
Atomic Force Microscopy (AFM) was performed to gain further insight into the surface morphology and vertical dimensions of the silica-coated magnetic nanoparticles (MNPs@SiO₂). Figures a–d show representative AFM height images together with the corresponding line profiles. Figure 2a displays an AFM scan of multiple MNPs@SiO₂ aggregates distributed over the substrate. The particles exhibit a rounded, clustered morphology, consistent with the micrometric agglomerates observed by SEM. Two horizontal line sections (Profiles 1 and 2) were extracted from this image, and their corresponding height profiles are shown in 2b. The profiles reveal pronounced vertical features, with maximum heights of approximately 350–500 nm, confirming the presence of compact, multilayered aggregates. Lateral dimensions derived from the AFM scans fall within the 1–3 µm range, depending on the selected particle. A higher-magnification AFM image of an individual microparticle is shown in 2c, where the heterogeneous and rough surface texture becomes more evident. The height profile taken along the indicated horizontal line (Figure 2d) shows a maximum vertical height of about 350 nm, together with fluctuations that reflect the irregular surface topology of the aggregate. Overall, the AFM analysis corroborates the SEM observations, demonstrating that the MNPs@SiO₂ form stable micro-sized aggregates composed of densely packed nanoparticles, exhibiting significant vertical roughness and non-uniform surface morphology.
3.2. DLS and Microscopy Results
Particle size was determined through microscopic observations, where a dried drop of the sample is depicted. Using ImageJ software, 200 particles were manually outlined with ellipses. The resulting histogram, illustrating the distribution of particle sizes, is presented in Figure 3a. The diameter used corresponds to that of a circle with the same area as the manually drawn ellipses around each particle. A log-normal distribution was fitted to the data, yielding a mean diameter of 1.65 μm with a standard deviation of 0.29 μm. Dynamic light scattering (DLS) measurements revealed a bimodal particle size distribution when represented as intensity versus hydrodynamic diameter. Two distinct particle populations were identified, with a dominant high-intensity peak centered at 1808 ± 949 nm and a second, lower-intensity population centered at 238 ± 91 nm. The presence of two well-defined size populations indicates sample heterogeneity, and therefore, the Z-average value was not considered representative of the system. Instead, the characteristic sizes associated with each intensity peak were used to describe the particle size distribution. A representative plot of an individual measurement is shown in Figure 3b. Microscopic analysis showed particles predominantly in the micrometer size range, with a log-normal distribution characterized by a mean diameter of 1.65 ± 0.29 μm. This size range is comparable to the main population detected by DLS, which exhibited a dominant intensity-weighted peak centered at 1808 ± 949 nm. Although the absolute values differ slightly, the overlap between these ranges suggests that both techniques are capturing the same major particle population. Furthermore, DLS revealed an additional smaller-size population centered at 238 ± 91 nm, which was not evident in the microscopic analysis. This smaller population may remain unresolved in microscopy due to optical resolution limits, the limited number of analyzed particles, and the analysis of dried samples. Moreover, the discrepancy between the two techniques can be attributed to the fact that DLS measures the hydrodynamic diameter of particles in suspension, while microscopy provides a two-dimensional projection of the physical size after drying, which may be influenced by aggregation or morphological changes. On the other hand, the ζ-potential of the particle dispersion was measured to be −40.1 ± 0.7 mV.
3.3. Magnetic Properties
Hysteresis loops were recorded at room temperature under applied magnetic fields up to 19 kOe (see Figure 4 (left)). The MNPs@SiO₂ exhibited a sigmoidal magnetization curve characteristic of superparamagnetic-like behavior with negligible coercivity. Fitting the magnetization curve with a lognormal distribution of magnetic moments and a Langevin-type response yielded a weighted mean magnetic moment of (36 ± 1) × 10³ Bohr magnetons and a saturation magnetization of 41(1) and 66(1) emu g⁻¹ per mass of MNPs@SiO₂ and per mas of Fe₃O₄ respectively. These values are consistent with magnetite-based core–shell microparticles retaining strong magnetic responsiveness after silica coating, and the ratio between both magnetization values indicates that the SiO₂ shell represents approximately 38 wt% of the total mass.
The magnetic force measurement as a function of sample-magnet distance is shown in Figure 4 (right). The results, expressed as magnetic force per unit weight (dimensionless), show a rapid decay with distance. A value greater than unity ensures reliable particle capture by the magnet; for the present microparticles, this condition is fulfilled up to a distance of 12 mm. This capture range is considerably larger than the typical working region highlighted in the figure (up to ~6 mm), confirming the suitability of these microparticles for efficient magnetic extraction during nucleic acid purification.
3.4. FT-IR Characterization
Figure 5 displays the FTIR spectra of the MNPs and MNPs@SiO2 samples for better comparison. The most intense absorption in the IR spectrum of MNPs appears as a wide band at 571.3 cm-1, and is assigned to the ν Fe–O vibrational mode. The presence of characteristic Si–O–Si stretching band at 1089.0 cm-1 as seen on the MNPs@SiO2 FTIR spectra confirmed the successful coating of magnetite with silica. The second most intense feature in the IR spectrum appears at 1196.6 cm-1, and can be assigned, along with the unresolved shoulder at lower wavenumbers, 957.4 cm-1, and the absorption at 463.1 cm-1 to the Si-O-Si bending modes [16,17,18].
3.5. Nucleid Acid Purification
3.5.1. Optimization of a Purification Workflow with Non-Pathogenic Samples
To evaluate the performance of MNP@SiO₂ for DNA extraction, we applied the protocol to insect tissues from D. melanogaster and HeLa cell cultures. The method involves sample solubilization, DNA binding to MNPs, wash steps with isopropanol and ethanol, and resuspension of the purified DNA. Different conditions were tested to optimize extraction efficiency, including variations in buffer composition, pH, temperature, and washing steps (Figure 6).
To establish a safer and more cost-effective workflow for DNA purification using magnetic nanoparticles, we first evaluated whether an alternative lysis buffer could replace the conventional GITC-based formulation [19,20,21]. Although GITC is widely used due to its strong chaotropic properties, the Livak buffer offers advantages in terms of reduced toxicity and lower cost. When both buffers were compared using HeLa cells as the starting material, DNA yields did not significantly differ between the two conditions (Figure 6A). This comparable performance supported the subsequent use of the Livak buffer for the further optimization steps.
Given that buffer properties can influence nucleic acid extraction efficiency, we next evaluated whether adjusting the pH of the Livak formulation would affect DNA recovery. DNA yields were significantly higher when Livak was adjusted to pH 6.5 compared with pH 7.5 (Figure 6B), indicating that mildly acidic conditions favor DNA extraction. Based on this improvement, Livak pH 6.5 was selected for downstream analyses. We then examined the influence of incubation temperature on DNA binding to magnetic nanoparticles, using D. melanogaster samples as a second biological matrix. Incubation at room temperature (25 °C) resulted in the highest DNA recovery, whereas substantially lower yields were obtained at 55 °C and 90 °C (Figure 6C). Although the mechanism underlying this temperature dependence remains unclear, these results indicate that maintaining binding reactions at moderate temperatures maximizes DNA adsorption to the magnetic matrix. Consequently, room-temperature incubation was incorporated into the optimized workflow. Finally, we refined the washing procedure, which initially involved resuspending the nanoparticles, placing the tube on a magnet, and immediately discarding the supernatant. In the optimized protocol, after resuspension and magnetic separation, we ensured that the washing solvent (isopropanol or 80% ethanol) thoroughly rinsed the entire inner surface of the tube prior to removing the supernatant. This modification, assessed in HeLa samples, led to a substantial increase in DNA recovery (Figure 6D), consistent with the idea that improved solvent contact reduces residual contaminants while avoiding premature removal of material adhering to tube walls. Together, these results define a simplified and optimized workflow that improves DNA purification efficiency while relying on less hazardous reagents and minimal procedural modifications.
To validate the applicability of the optimized workflow in a clinically relevant matrix, we next tested extraction performance in cervicovaginal samples, the target material for molecular diagnosis of gynecological infections. As an initial assessment, we compared the performance of the Livak buffer with that of GITC. Endpoint PCR for HPV detection yielded clear positive amplification bands across the eight patient samples for both extraction conditions, while the negative control showed no amplification and both positive controls produced the expected bands (Figure 7). These results confirm that the Livak buffer performs robustly in this matrix and supports its use for further development of the proposed DNA purification protocol.
3.5.2. Nucleic Acid Purification Assay for HPV PCR Diagnostics
In this study, 33 clinical samples underwent HPV detection analysis employing two distinct extraction methodologies: a manual magnetic particles-based approach (our method) and a commercially available automated extraction kit (Mole Bioscience Co., Ltd, Taizhou, China). The comparative analysis revealed that three samples yielded negative results across both methodologies, while an additional four samples produced negative outcomes exclusively when processed via the manual extraction protocol. One sample exhibited a discordant result, testing positive through our method but negative with the commercial system. The majority of samples (n = 22) demonstrated positive HPV detection using both extraction approaches (Figure 8). Agreement between the two diagnostic methods was further evaluated using Cohen’s kappa coefficient, which yielded a value of K = 0.608, indicating moderate concordance between the two workflows.
The sensitivity of the method was 86.6%, indicating robust detection of positive samples, while specificity was 87.5%. We hypothesize that the samples undetected by our method but detected by the LDM protocol contained low concentrations of pathogen DNA, which hindered their detection. Similarly, the sample detected by our method but not by LDM may also have had low pathogen DNA concentrations, resulting in detection by one method but not the other. Further analysis of these samples using a third independent method would be necessary to better evaluate discrepancies.
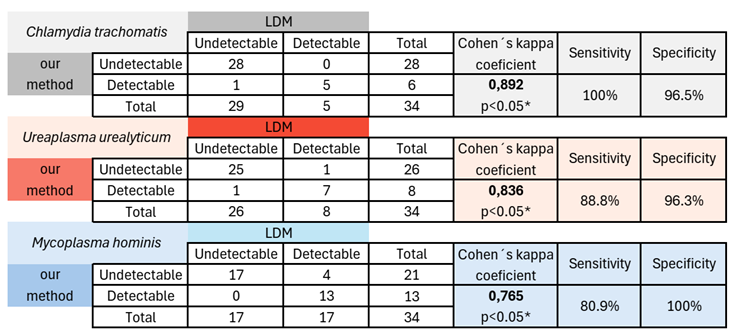
3.5.3. Sample Purification for CUM Diagnostic Real-Time PCR
A total of 34 clinical samples were analyzed for C. trachomatis, U. urealyticum and M. hominis, comparing the manual extraction method with the automated Mole kit. Each microorganism was detected by RT-PCR in separate reactions, using FAM-labeled probes for C. trachomatis (including a GAP internal control) and M. hominis, and a Cy5-labeled probe for U. urealyticum. A common Cycle threshold (Ct) cutoff of 35 was applied to all assays.The internal control was detected with a 100% coincidence.
Figure 9 shows the relationship between Ct values obtained with both extraction methods. Most data points clustered near the identity line, indicating good agreement between the manual and automated procedures. Samples that were undetectable by both methods (Ct ≥ 40) were assigned a Ct value of 40 and are represented by the black triangle (n= 69, 28 C. trachomatis, 26 U. urealyticum and 15 M. hominis). Our method showed performance comparable to the LDM, yielding slightly lower Ct values in most samples, which suggests more efficient nucleic acid recovery and similar or higher detection efficiency. For samples near the detection limit, with Ct values close to 35 for M. hominis, slightly higher Ct values were observed with our method; however, such samples are typically challenging for most assays and usually lack clinical relevance.
Table 1 summarizes the correlation for both methods. The highest agreement was observed for C. trachomatis, with a Cohen’s kappa coefficient of 0.892. Sensitivity was 100%, and specificity was 96.5%. For U. urealyticum, the values were k = 0.836, sensitivity = 88.8%, and specificity = 96.3%; for M. hominis, k = 0.765, sensitivity = 80.9%, and specificity = 100%. However, the four samples that were undetectable by our method and detectable by LDM for M. hominis had Ct values close to the cutoff, and interestingly, two of them had previously been reported as undetectable by LDM as well (see Supplementary Table 1).
Moreover, the two samples that were detected as positive by our method but reported as negative by LDM (one of C. trachomatis and one of U. urealyticum) should have been evaluated using a third method. Although this additional evaluation was not performed, notably, both of these two samples had previously been reported as detectable by LDM (Table S1), indicating a discrepancy near the detection limit. Therefore, we believe that the results obtained by our method are valid, as in most cases these correspond to samples with high Ct values near the detection cutoff, where clinical relevance is typically limited or variable.
Overall, the method developed here showed substantial correlation with LDM for the three pathogens - C. trachomatis, U. urealyticum and M. hominis - supporting its use as a reliable and cost-effective alternative for molecular diagnosis.
4. Discussion
The combined morphological, structural, and magnetic characterization provides a coherent picture of the Fe₃O₄@SiO₂ microparticles and their suitability for nucleic acid purification workflows. SEM and AFM analyses show that the material forms compact micro-sized aggregates composed of densely packed primary nanoparticles, exhibiting pronounced surface roughness and heterogeneous topography. Such microstructures are advantageous for magnetic extraction, as the increased particle size enhances magnetic responsiveness while the nanometric surface texture may improve wettability and increase the effective surface area available for nucleic acid absorption. The presence of Fe, Si, and O in EDS measurements, together with the characteristic Si–O–Si stretching and bending modes in the FTIR spectra, confirms the formation of a continuous silica shell surrounding the magnetite core. The attenuation of the Fe–O band in the coated material further supports efficient encapsulation, which is essential for chemical stability under the chaotropic conditions typically used in purification protocols. The particle size measured by microscopic analysis (1.6 µm) and by DLS (1.8 µm) is in close agreement, indicating good consistency between image-based and ensemble-averaged techniques. This characteristic size is consistent with controlled TEOS-driven aggregation processes, yielding beads that are sufficiently large to enable rapid magnetic capture while remaining small enough to remain well suspended during mixing. AFM images further suggest a possible anisotropic morphology of the nanoparticle aggregates, as the measured heights are systematically lower than the lateral diameters inferred from microscopy and DLS for the higher-intensity population. In parallel, the ζ-potential of particle dispersion was measured to be −40.1 ± 0.7 mV, indicating a high surface charge and the presence of strong electrostatic repulsive interactions between particles. Such absolute ζ-potential values, typically exceeding ±30 mV, are widely associated with enhanced colloidal stability and a reduced tendency toward uncontrolled aggregation [22]. Accordingly, these results suggest that the micro-sized aggregates are stable in suspension under the experimental conditions.
Magnetic measurements reveal superparamagnetic-like behavior with negligible coercivity and a high magnetic moment per aggregate, indicating that the particles retain strong magnetic responsiveness despite a substantial silica fraction. The saturation magnetization values suggest that the silica shell constitutes approximately 38 wt% of the total mass, in good agreement with expectations for TEOS-derived coatings. Importantly, the magnetic force–distance analysis demonstrates efficient capture up to 12 mm, exceeding the operational distances of standard magnetic racks and confirming the reliability of these microparticles for high-efficiency nucleic acid recovery. Taken together, these results show that the synthesized Fe₃O₄@SiO₂ microparticles combine appropriate morphology, chemical functionality, and magnetic performance, making them highly suitable for use in solid-phase nucleic acid purification.
The results obtained using the nonpathogenic matrices HeLa and D. melanogaster demonstrate that the Livak buffer performs equivalently to the GITC-containing buffer in terms of DNA purification yield. This finding is particularly significant given that the most commonly used nucleic acid extraction methods rely on GITC, phenol, and chloroform [7,8], an approach that, coupled with nucleic acid binding to silica gel [23] or cellulose [24,25], has been widely implemented in commercial workflows. However, the high toxicity of GITC raises substantial safety and environmental concerns, particularly in large-scale or high-throughput settings. These considerations underscore the need for rapid, simple, and environmentally sustainable extraction strategies capable of producing nucleic acid samples suitable for large-scale diagnostic applications, such as the method proposed in this study.
Diagnostic testing on gynecological samples yielded very high sensitivity and specificity for both HPV and CUM detection. However, a few false-negative results were observed; as noted above, most of these were very close to the detection limit. Indeed, a third independent test with the reference method (LDM) resulted negative. In particular, establishing the cutoff in real-time PCR diagnostics can be challenging, as high Ct values (Ct > 40) carry an increased risk of false-positive results [26] and most commercial kits share this limitation. Therefore, this issue cannot be attributed solely to the extraction method and is likely due to a combination of factors, particularly in samples containing low concentrations of pathogen genetic material.
In conclusion, the developed method is convenient for the detection of female genital pathogens and reduce cost and environmental impact respect to chaotropic-salts based methods. It showed good performance for detecting C. trachomatis, U. urealyticum, M. hominis, and Human Papillomavirus, although its specificity was lower for Human Papillomavirus detection.
5. Conclusions
In this study, we optimized a DNA extraction method for female genital human samples to ensure the recovery of sufficient nucleic acid quantities and quality for downstream molecular diagnostics. The improved workflow enabled reliable detection of HPV by endpoint PCR as well as identification of C. trachomatis, U. urealyticum and M. hominis through real-time PCR, demonstrating its suitability for routine molecular assays targeting clinically relevant pathogens.
The nanoparticle-based methodology described here enhances sustainability by minimizing the need for costly buffers and reagents. The buffer used in this approach contains only simple salts and excludes toxic chemicals such GITC, one of the most employed chaotropic agents for nucleic acid extraction, thereby improving both affordability and safety. In addition, this method does not require sophisticated equipment and could be readily automated, while the nanoparticle-based approach can be adapted for local production in small laboratories from low- and middle-income countries, and further tailored for other sample types and pathogens.
Supplementary Materials
The following supporting information can be downloaded at the website of this paper posted on Preprints.org.
Author Contributions
Conceptualization, C.O., C.L., L.P., C.G, S.O., P.M.Z. and C.R.T.; methodology, L.P., C.O., C.L., E.D.S. and L.J.; validation, E.D.S., L.J., C.O., M.I., C.T. and A.M.; formal analysis, C.O., C.L., P.M.Z. and C.R.T.; investigation, C.O., C.L., E.D.S., L.J., M.I., C.T., A.M., K.S.R, P.L.S. and P.M.Z.; resources, C.G., S.O., P.M.Z. and C.R.T.; ; writing—original draft preparation, C.O., C.L. and C.R.T.; writing—review and editing, C.G., L.J., S.O., P.M.Z. and P.L.S.; supervision, L.P., C.L, C.R.T., S.O. and P.M.Z.; project administration, C.R.T.; funding acquisition, C.G. and C.R.T. All authors have read and agreed to the published version of the manuscript.”.
Funding
This work was supported by the Fondo de Innovación Tecnológica de Buenos Aires (FITBA 2024-231A), the National Scientific and Technical Research Council (CONICET, grant PIP 11220210100751CO), the National Agency for the Promotion of Research, Technological Development and Innovation (Agencia I+D+I, grant PICT-2020-SERIEA-00865), the Universidad Nacional de La Plata (UNLP, grant 11/X953), and the Brazilian Synchrotron Light Laboratory (LNLS) through financial support associated with Proposal IMBUIA-Micro-20241605.
Institutional Review Board Statement
Ethical review and approval were waived for this study because it involved the use of fully anonymized human samples obtained during routine diagnostic procedures. The samples were provided by the Molecular Diagnostic Laboratory for method validation purposes only. The researchers had no access to patient-identifying information, and the results generated in this study were not used for clinical decision-making nor reported back to the patients.
Informed Consent Statement
Patient consent was waived because the study exclusively used fully anonymized human samples obtained during routine diagnostic procedures. No identifiable personal data were available to the researchers, and no additional procedures or interactions with the patients were performed.
Data Availability Statement
The data supporting the findings of this study are available within the article and its Supplementary Materials. All data are fully anonymized, and no information that could identify individual patients is included.
Acknowledgments
The authors acknowledge the Province of Buenos Aires for the financial support that enabled the execution of this study. The authors also thank the staff of the Laboratório de Amostras Microscópicas (LAM) for their valuable technical assistance.
Conflicts of Interest
The authors declare no conflicts of interest. The funders had no role in the design of the study; in the collection, analyses, or interpretation of data; in the writing of the manuscript; or in the decision to publish the results.
References
- Sameni, F.; Hajiarab, T.; Bayat, S.; Ahmadi, M.; van Belkum, A.; Dadashi, A.; Goudarzi, M.; Dadashi, M. Global mapping of sexually transmitted Chlamydia trachomatis disease: a systematic review and meta-analysis. BMC Infect Dis 2025, 25, 1383. [Google Scholar] [CrossRef]
- Christofolini, D.M.; Leuzzi, L.; Mafra, F.A.; Rodart, I.; Kayaki, E.A.; Bianco, B.; Barbosa, C.P. Prevalence of cases of Mycoplasma hominis, Mycoplasma genitalium, Ureaplasma urealyticum and Chlamydia trachomatis in women with no gynecologic complaints. Reprod Med Biol. 2012, 11, 201–205. [Google Scholar] [CrossRef] [PubMed]
- Forman, D.; de Martel, C.; Lacey, C.J.; Soerjomataram, I.; Lortet-Tieulent, J.; Bruni, L.; Vignat, J.; Ferlay, J.; Bray, F.; Plummer, M.; Franceschi, S. Global Burden of Human Papillomavirus and Related Diseases. Vaccine 2012, 30, F12–F23. [Google Scholar] [CrossRef]
- de Martel, C.; Georges, D.; Bray, F.; Ferlay, J.; Clifford, G.M. Global burden of cancer attributable to infections in 2018: a worldwide incidence analysis. Lancet Glob Health 2020, 8, e180–e190. [Google Scholar] [CrossRef]
- Paira, D.A.; Molina, G.; Tissera, A.D.; Olivera, C.; Molina, R.I.; Motrich, R.D. Results from a large cross-sectional study assessing Chlamydia trachomatis, Ureaplasma spp. and Mycoplasma hominis urogenital infections in patients with primary infertility. Sci Rep. 2021, 11, 13655. [Google Scholar] [CrossRef] [PubMed]
- Bai, M.; Li, Y.; Gao, Q.; Lv, Z.; Fu, F.; Liang, G.; Ma, F.; Feng, J. Comparison of boiling versus magnetic bead techniques in nucleic acid extraction for human papillomavirus detection: evidence based 17,179 cases. Virol J. 2025, 22, 373. [Google Scholar] [CrossRef] [PubMed]
- Mullegama, S.V.; Alberti, M.O.; Au, C.; Li, Y.; Toy, T.; Tomasian, V.; Xian, R.R. Nucleic Acid Extraction from Human Biological Samples. Methods Mol Biol 2019, 1897, 359–383. [Google Scholar] [CrossRef]
- Chomczynski, P.; Sacchi, N. Single-step method of RNA isolation by acid guanidinium thiocyanate-phenol-chloroform extraction. Anal. Biochem. 1987, 162, 156–159. [Google Scholar] [CrossRef]
- Vogel, A.I. Vogel’s Textbook of Quantitative Chemical Analysis, 5th Edition; Jeffery, G.H., Bassett, J., Mendham, J., Denney, R.C., Eds.; Longman Scientific and Technical: Harlow, Essex, England, 1989; pp. 690–691. [Google Scholar]
- Schneider, C.A.; Rasband, W.S.; Eliceiri, K.W. NIH Image to ImageJ: 25 years of image analysis. Nat. Methods 2012, 9(7), 671–675. [Google Scholar] [CrossRef]
- Ashburner, M. Drosophila. A Laboratory Manual; Cold Spring Harbor Laboratory Press: Cold Spring Harbor, NY, USA, 1989. [Google Scholar]
- Altman, D.G.; Bland, J.M. Diagnostic tests. 1: Sensitivity and specificity. BMJ 1994, 308, 1552. [Google Scholar] [CrossRef]
- Pita Fernandez, S.; Pértegas Díaz, S. Pruebas diagnósticas: sensibilidad y especificidad. Cad Aten Primaria 2023, 10, 120–124. [Google Scholar]
- Li, M.; Yu, T. Methodological issues on evaluating agreement between two detection methods by Cohen’s kappa analysis. Parasites vectors 2022, 15, 270. [Google Scholar] [CrossRef]
- Conger, A.J. Kappa and Rater Accuracy: Paradigms and Parameters. Educ. Psychol. Meas. 2017, 77, 1019–1047. [Google Scholar] [CrossRef]
- Yang, H.; Zhang, J.; Liu, Y.; Wang, L.; Bai, L.; Yang, L.; Wei, D.; Wang, W.; Niu, Y.; Chen, H. Rapid removal of anionic dye from water by poly (ionic liquid)-modified magnetic nanoparticles. J. Mol. Liq. 2019, 284, 383–392. [Google Scholar] [CrossRef]
- Singh, H.; Kachore, A.; Aggarwal, V.; Bala, E.; Saima; Kumar, R.; Kumar, P.; Verma, P. K. Magnetically Separable and Reusable Fe3O4 Nanoparticles for Reduction of Nitroarenes in Water. ChemistrySelect 2025, 10, e202501004. [Google Scholar] [CrossRef]
- Zarabadipour, M.; Soleimani, M.; Afshar, M. G. Application of functionalized Fe3O4@SiO2 nanoparticles as an adsorbent for heavy metal removal. Results Chem. 2025, 17, 102514. [Google Scholar] [CrossRef]
- Rodriguez Torres, C.; Juncal, L.; de Sousa, M.E.; Vázquez Robaina, O.; Capriotti, N.; Salcedo Rodriguez, K.; Barrera LLanes, N.; Mela, N.; Layana, C.; Bracco, L.; Malito, J.P.; Mendoza Zélis, P.; Ons, S. Magnetic nanoparticles for purification of biomolecules: challenges and opportunities. scirevfew 2023, 2(3), 39–51. [Google Scholar]
- Capriotti, N.; Amorós Morales, L.C.; de Sousa, E.; Juncal, L.; Pidre, M.L.; Traverso, L.; López, M.F.; Ferelli, M.L.; Lavorato, G.; Lillo, C.; Vazquez Robaina, O.; Mele, N.; Vericat, C.; Schilardi, P.; Cabrera, A.F.; Stewart, S.; Fonticelli, M.H.; Mendoza Zéliz, P.; Ons, S.; Romanowski, V.; Rodríguez Torres, C. Silica-coated magnetic particles for efficient RNA extraction for SARS-CoV-2 detection. Heliyon 2024, 10, e25377. [Google Scholar] [CrossRef]
- Oberacker, P.; Stepper, P.; Bond, D. M.; Höhn, S.; Focken, J.; Meyer, V.; Schelle, L.; Sugrue, V. J.; Jeunen, G. J.; Moser, T.; Hore, S. R.; von Meyenn, F.; Hipp, K.; Hore, T. A.; Jurkowski, T. P. Bio-On-Magnetic-Beads (BOMB): Open platform for high-throughput nucleic acid extraction and manipulation. PLoS biology 2019, 17, e3000107. [Google Scholar] [CrossRef]
- Pochapski, D. J.; Carvalho dos Santos, C.; Leite, G. W.; Pulcinelli, S. H.; Santilli, C. V. Zeta potential and colloidal stability predictions for inorganic nanoparticle dispersions: Effects of experimental conditions and electrokinetic models on the interpretation of results. Langmuir 2021, 37, 13379–13389. [Google Scholar] [CrossRef]
- Boom, R.; Sol, J.; Salimans, M.; Cansen, C.; Wertheim-van Pillen, P.; Van der Norad, J. Rapid and simple method for purification of nucleic acids. J. Clin. Microbiol. 1990, 28, 495–5033. [Google Scholar] [CrossRef] [PubMed]
- Barber, R. The chromatographic separation of ribonucleic acids. Biochim. Biophys. Acta 1966, 114, 422–424. [Google Scholar] [CrossRef] [PubMed]
- Franklin, R.M. Purification and properties of the replicative intermediate of the RNA bacteriophage R17. Proc. Natl. Acad. Sci. U.S.A 1966, 55, 1504–1511. [Google Scholar] [CrossRef]
- Gaudin, A.; Hénin, N.; Gardette, M.; Bébéar, C.; Pereyre, S. Clinical evaluation of two commercial PCR kits for the detection of nonviral sexually transmitted infections. J Med Microbiol. 2025, 26 74, 002037. [Google Scholar] [CrossRef] [PubMed]
Figure 1.
SEM micrograph of a representative silica-coated magnetite microparticle, showing a compact aggregate of submicron primary nanoparticles. The corresponding EDS spectrum (Spectrum 2) confirms the presence of Fe, O, and Si, consistent with a Fe₃O₄@SiO₂ core–shell structure. The intense Au peaks originate from the gold-coated substrate used for SEM imaging and are not part of the sample composition.
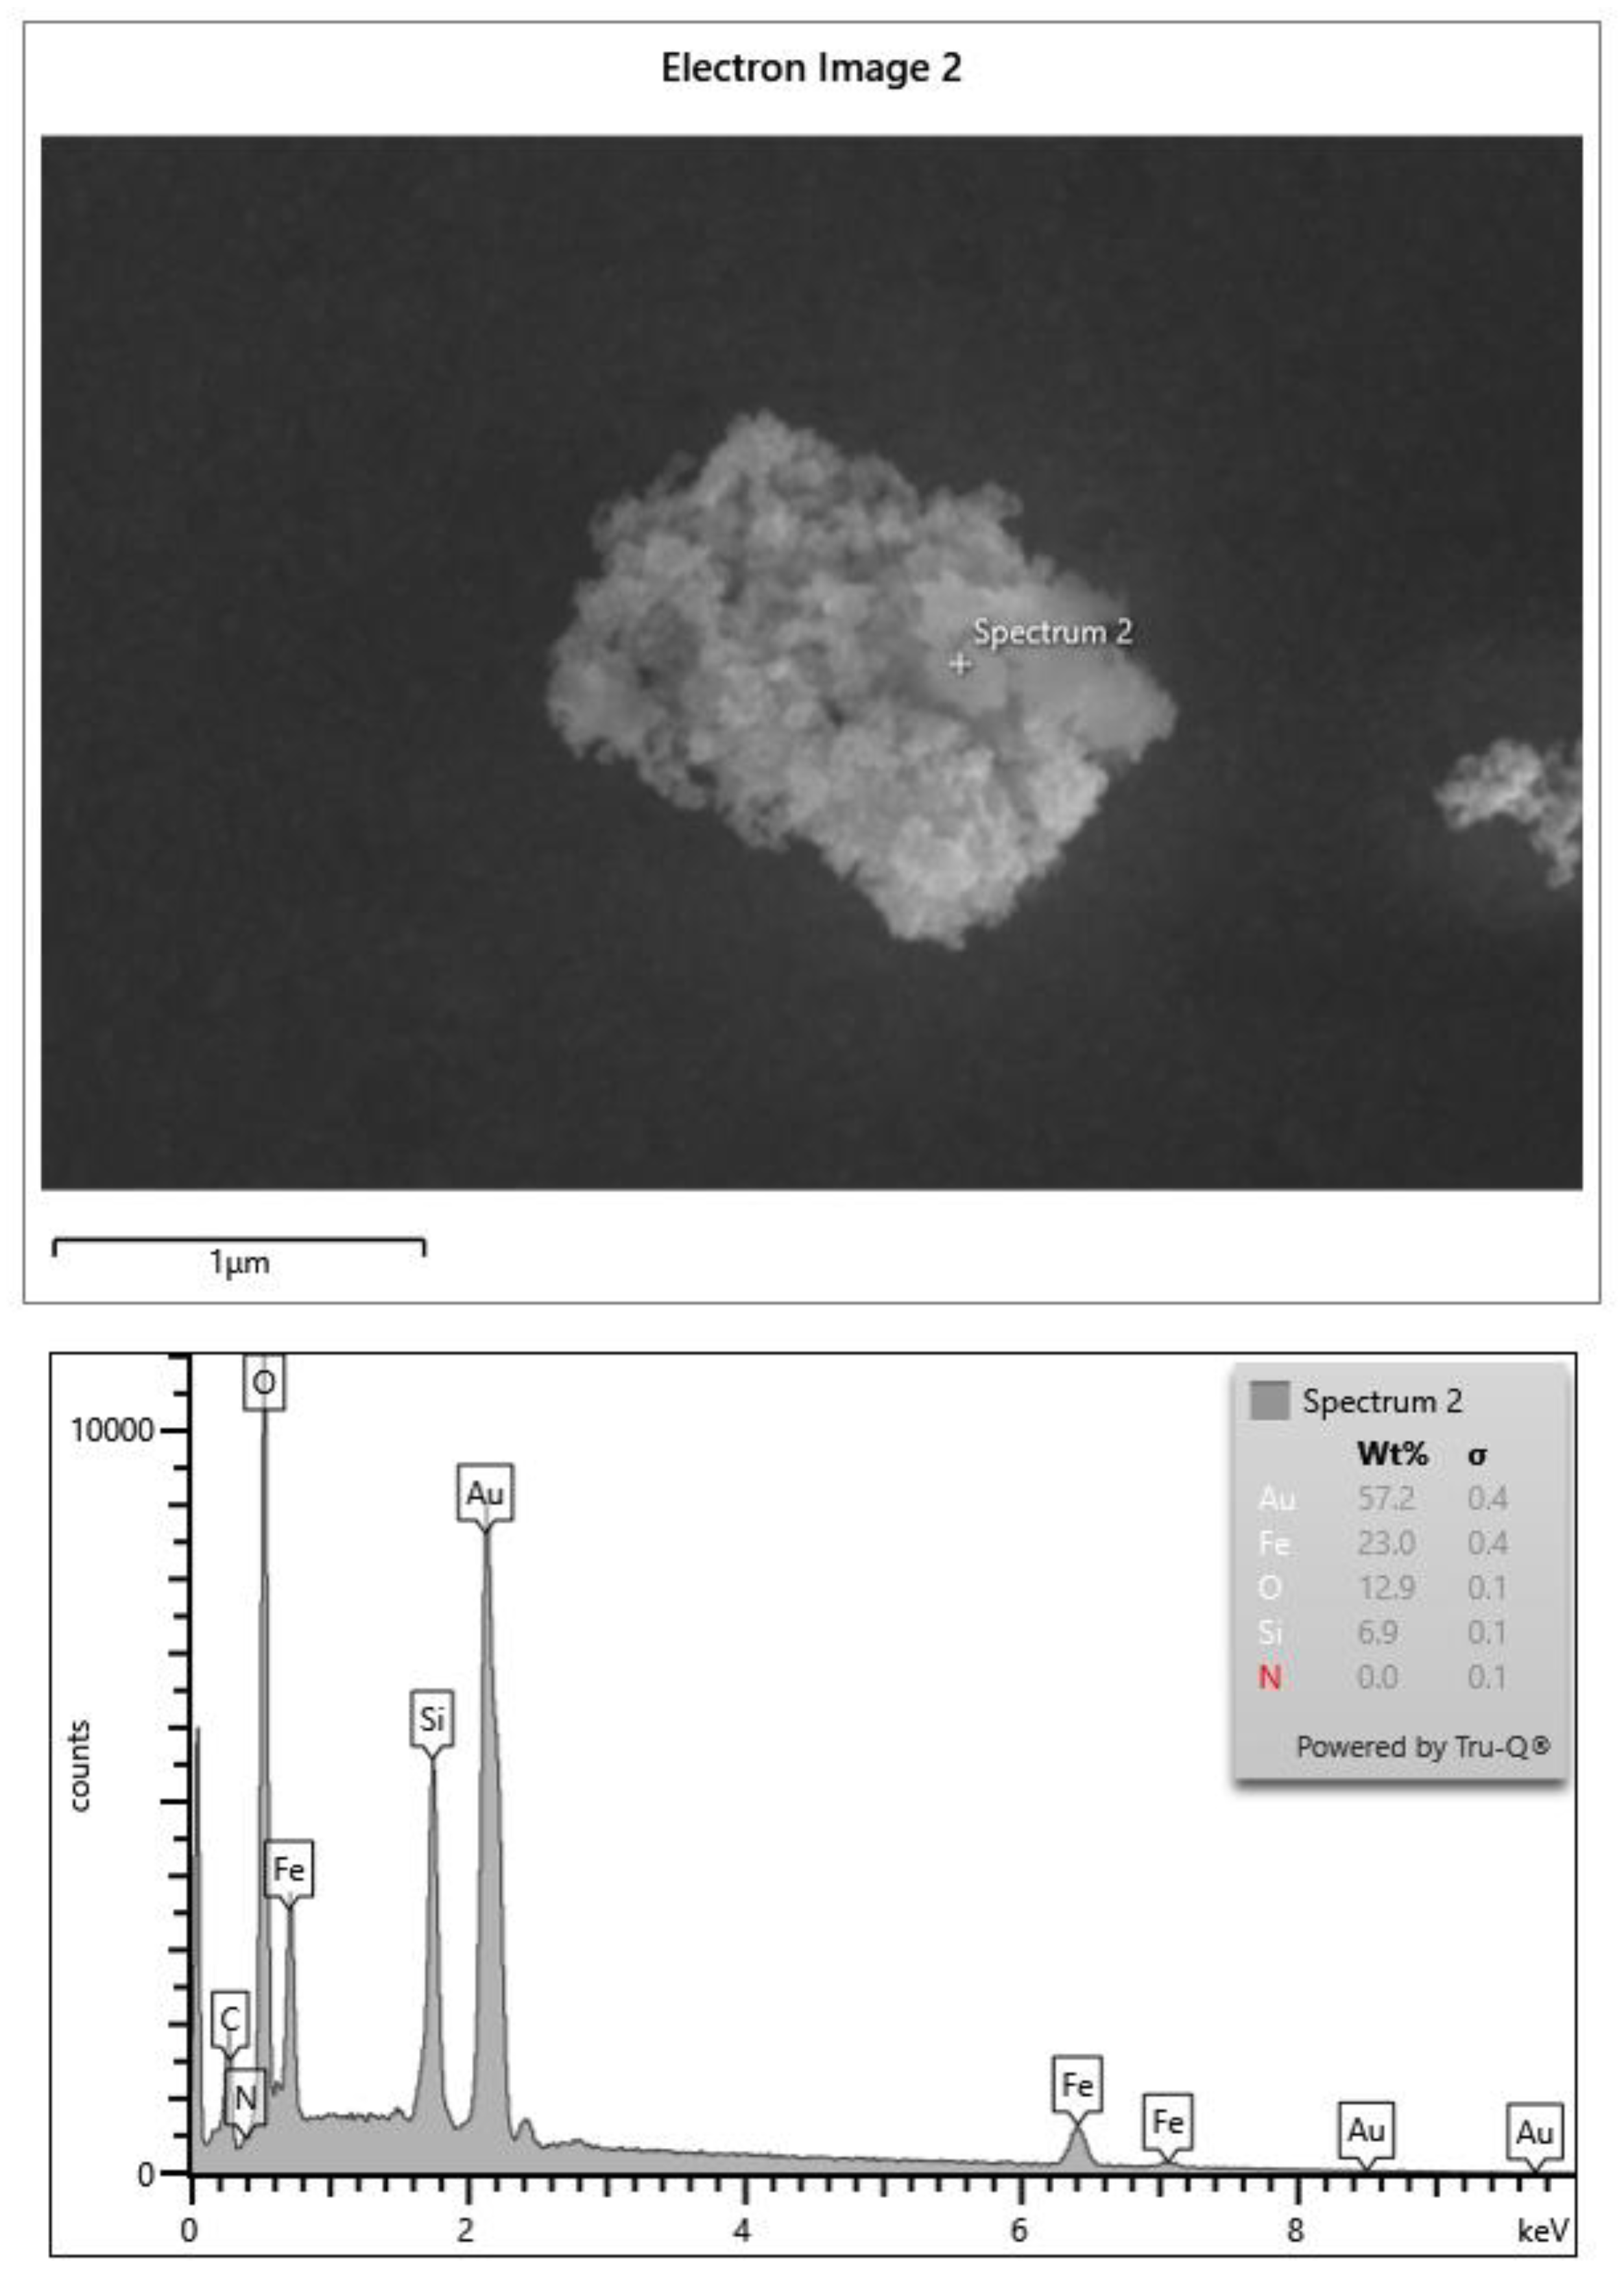
Figure 2.
Atomic Force Microscopy (AFM) characterization of MNPs@SiO₂. (a) AFM height image showing multiple silica-coated magnetic nanoparticle aggregates distributed over the substrate. (b) Height profiles extracted along the lines indicated in (a), revealing maximum vertical dimensions of ~350–500 nm. (c) High-magnification AFM image of an individual microparticle, highlighting its irregular and rough surface. (d) Corresponding height profile for the line marked in (c), showing a vertical height of ~350 nm. Together, the images confirm the formation of compact micron-sized aggregates with heterogeneous surface topography.
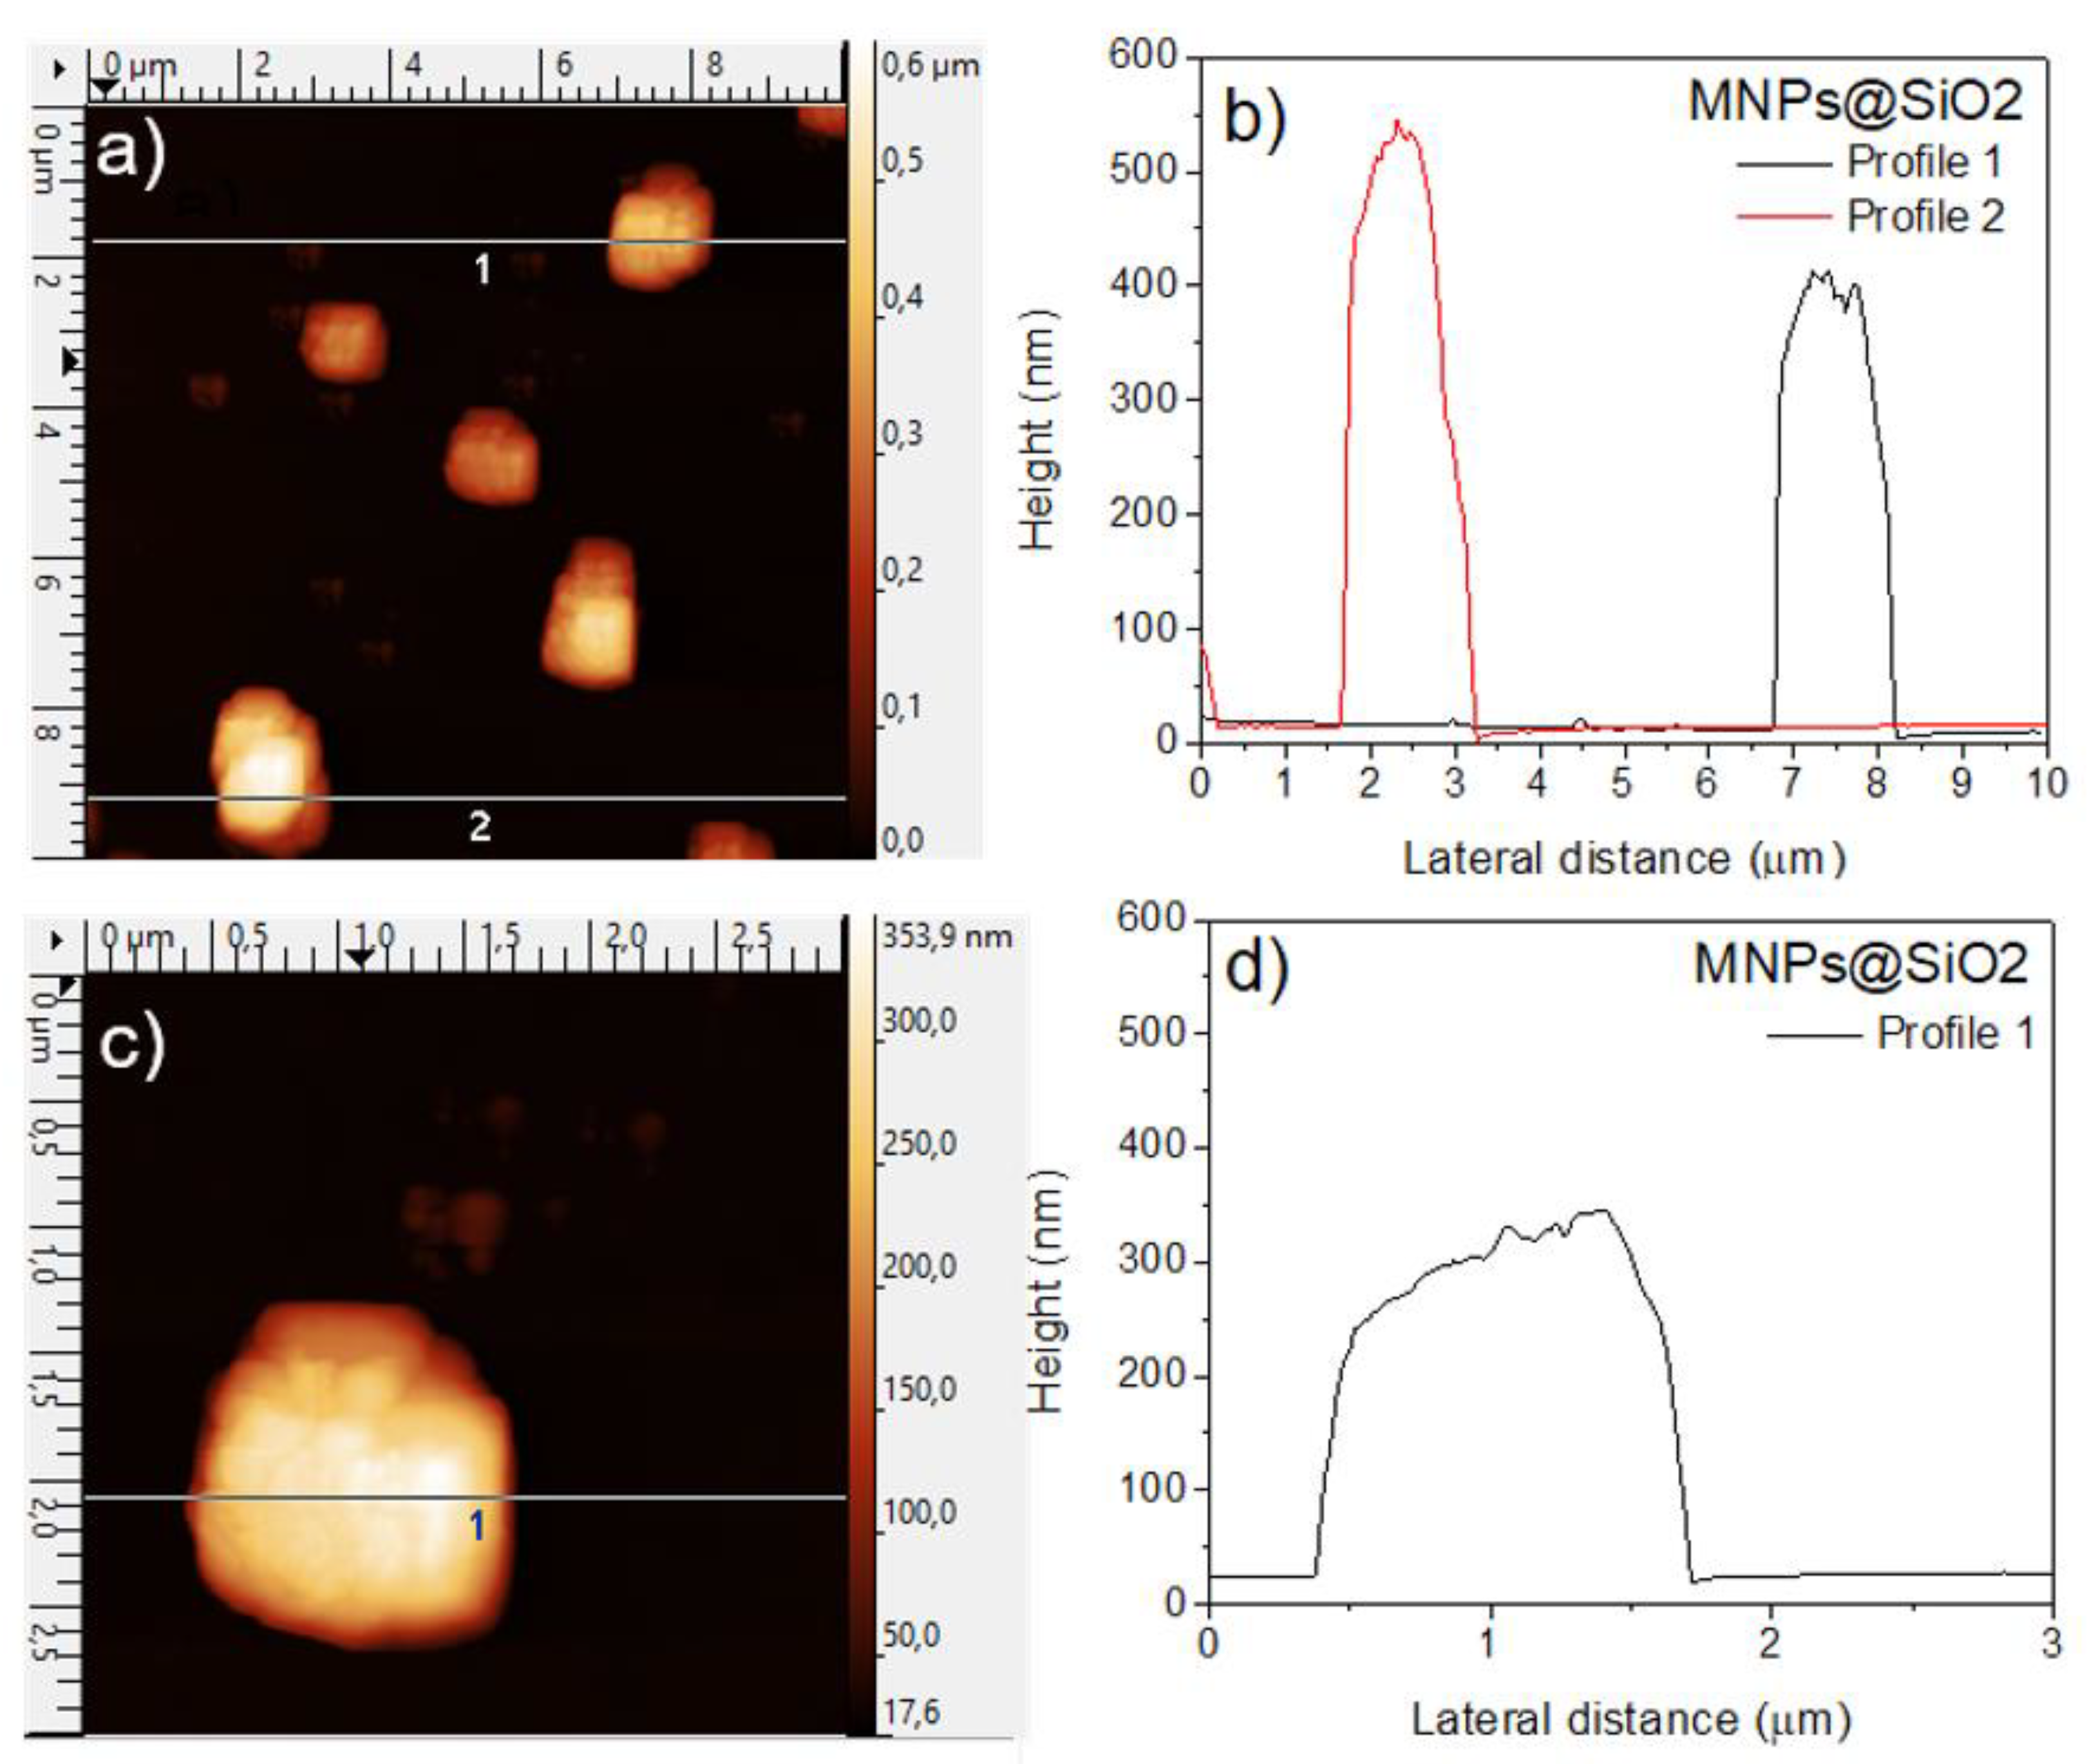
Figure 3.
(a) Histogram of particle diameters obtained from manual measurements of 200 particles using ImageJ. The solid line represents the log-normal fit to the data, yielding a mean diameter of 1.65 μm and a standard deviation of 0.29 μm. The distribution reflects the characteristic size dispersion of the sample. (b) Representative Intensity versus Hydrodynamic diameter for a single DLS measurement. Notice that the values for both populations presented in the text correspond to the mean of 6 measurements.
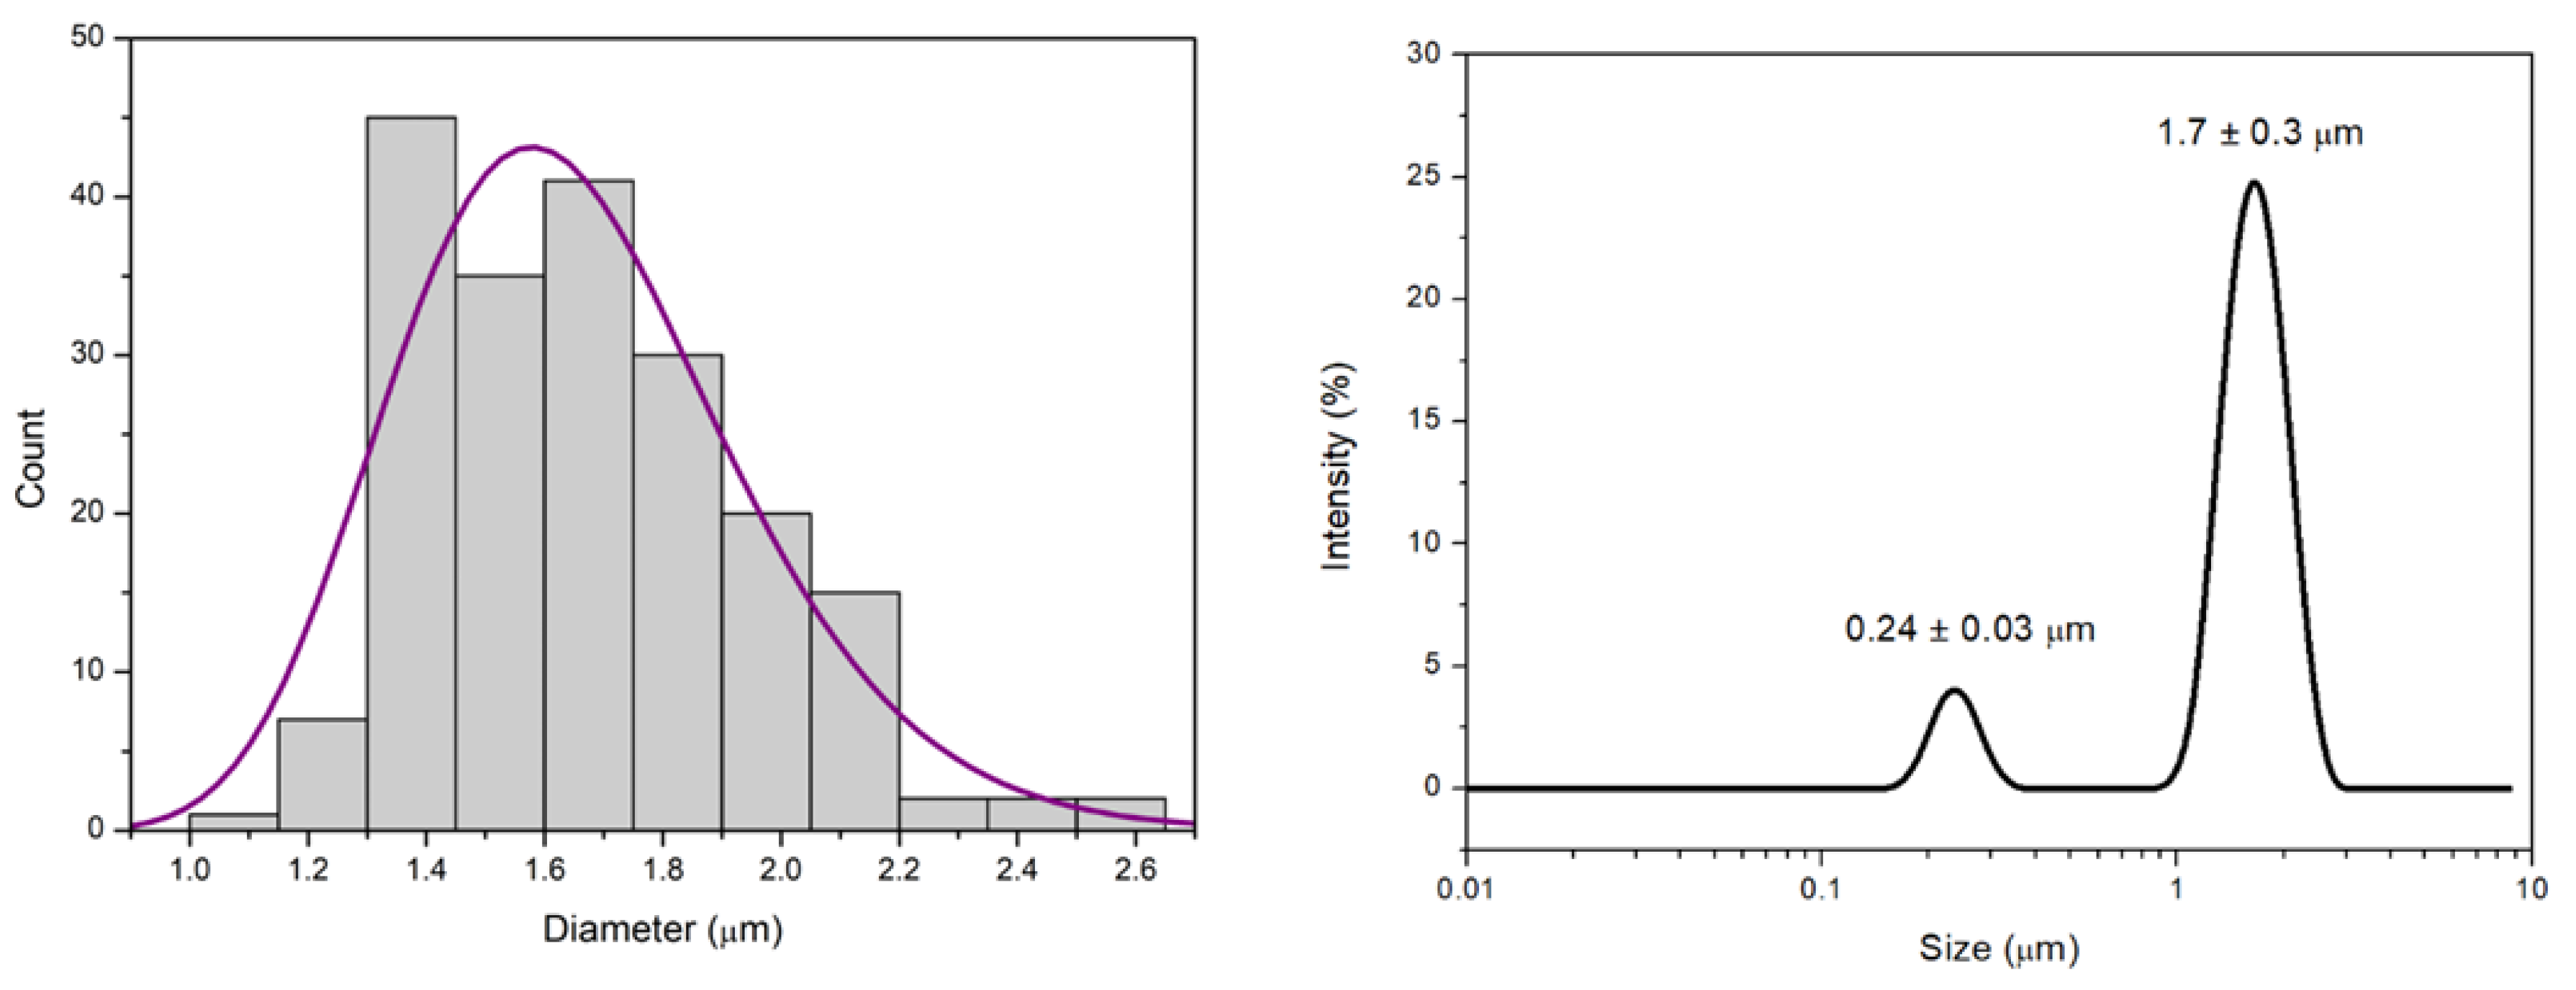
Figure 4.
(Left) Room-temperature hysteresis loop of an aqueous suspension of MNPs@SiO₂ measured using a VSM. The red curve represents the fit using a lognormal distribution of magnetic moments with a Langevin-type response, yielding a weighted mean magnetic moment of (36 ± 1) × 10³ μB and a saturation magnetization of 41(1) emu g⁻¹ (per mass of MNPs@SiO₂). (Right) Magnetic force per unit weight as a function of the distance to a Nd₂Fe₁₄B permanent magnet (N52). The shaded region indicates the range of sample-magnet separations typically used in manual purification processes.
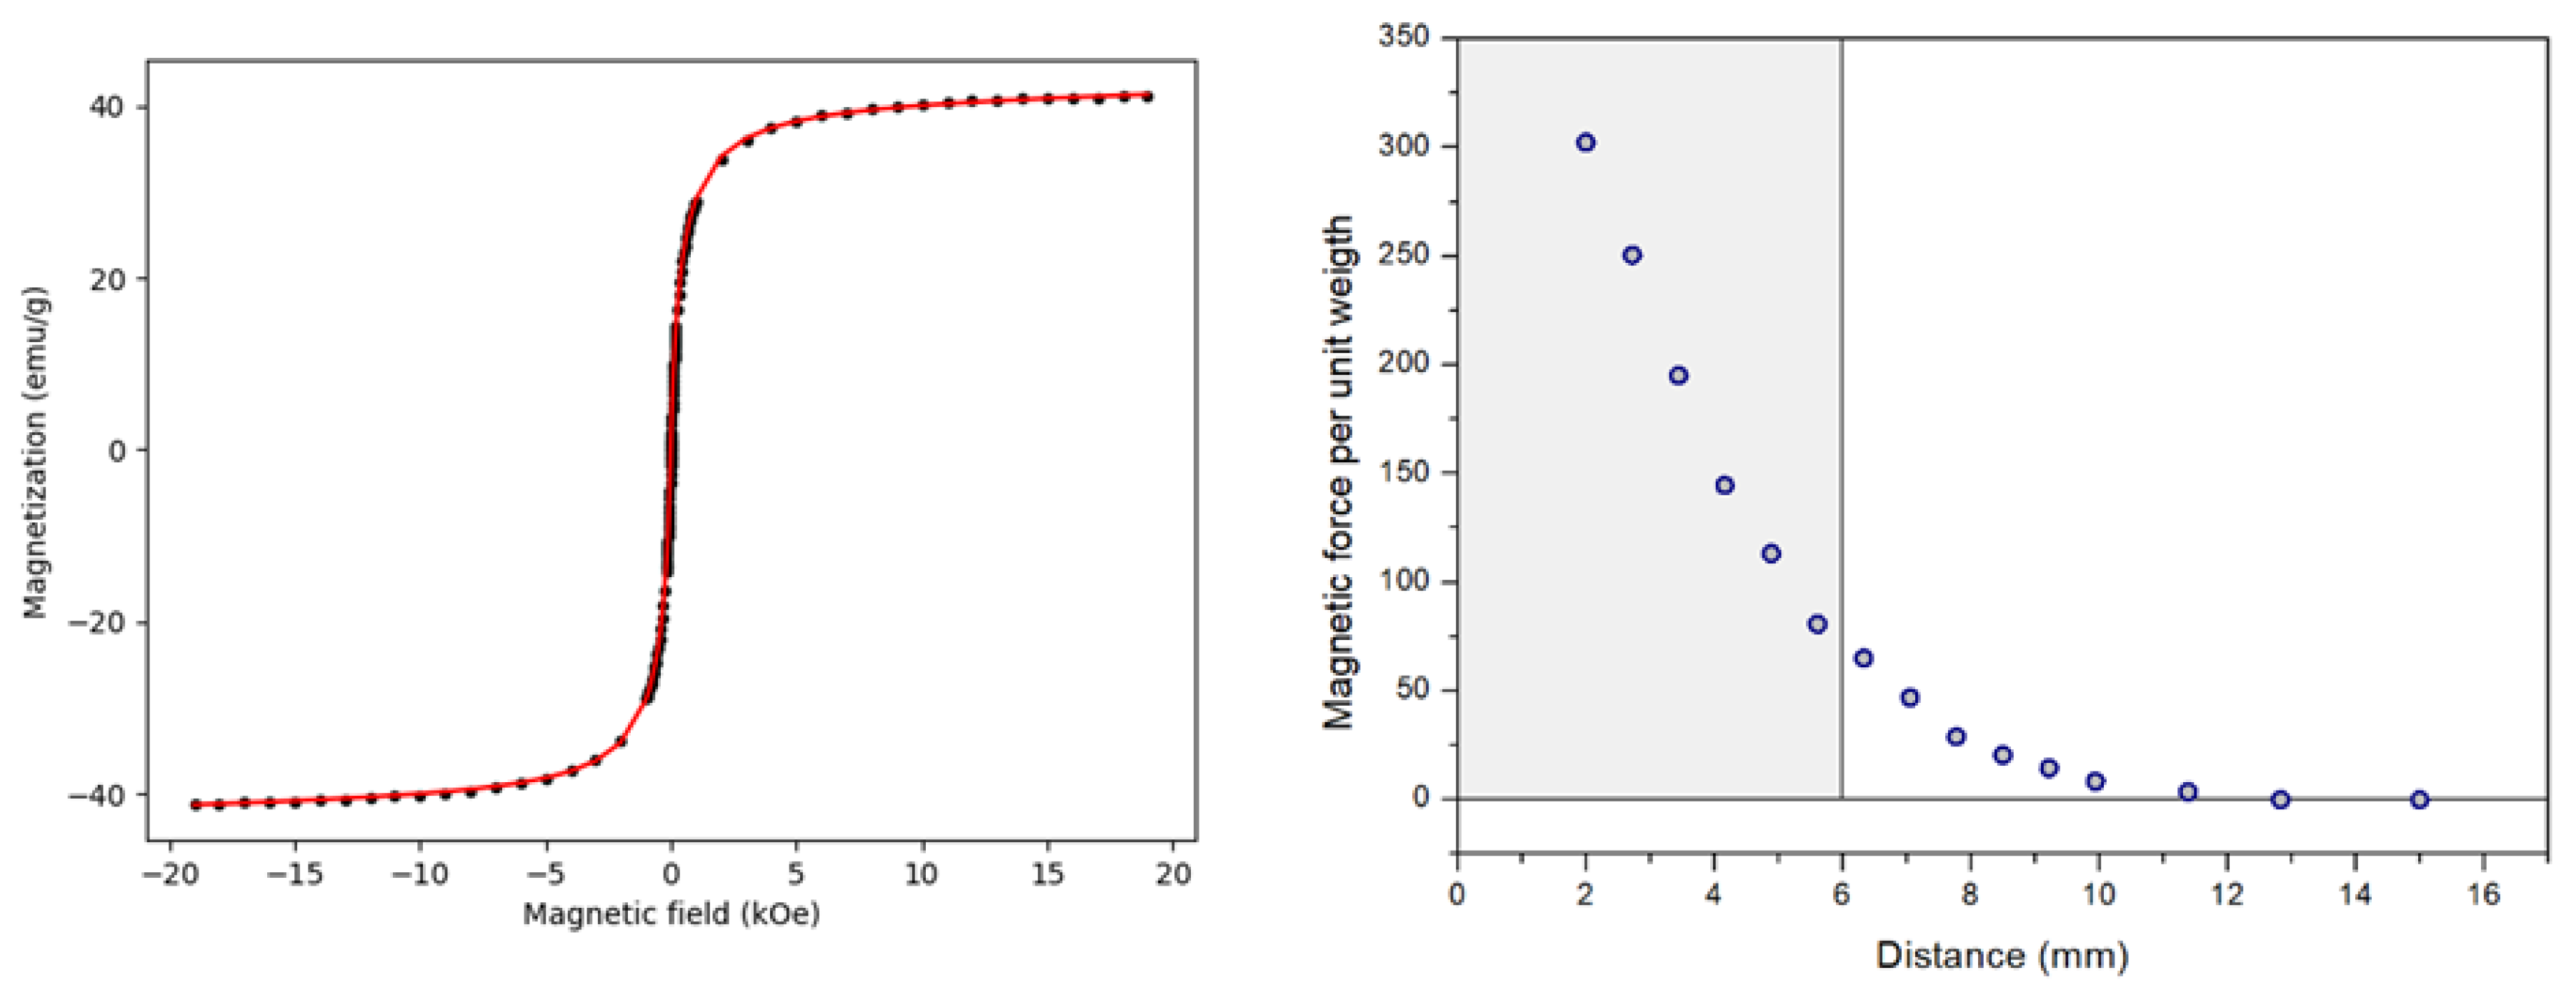
Figure 5.
FTIR spectra of MNPs (red trace) and MNPs@SiO2 (blue trace) samples measured in KBr pellets, collected in the 4000–400 cm−1 region.
Figure 5.
FTIR spectra of MNPs (red trace) and MNPs@SiO2 (blue trace) samples measured in KBr pellets, collected in the 4000–400 cm−1 region.
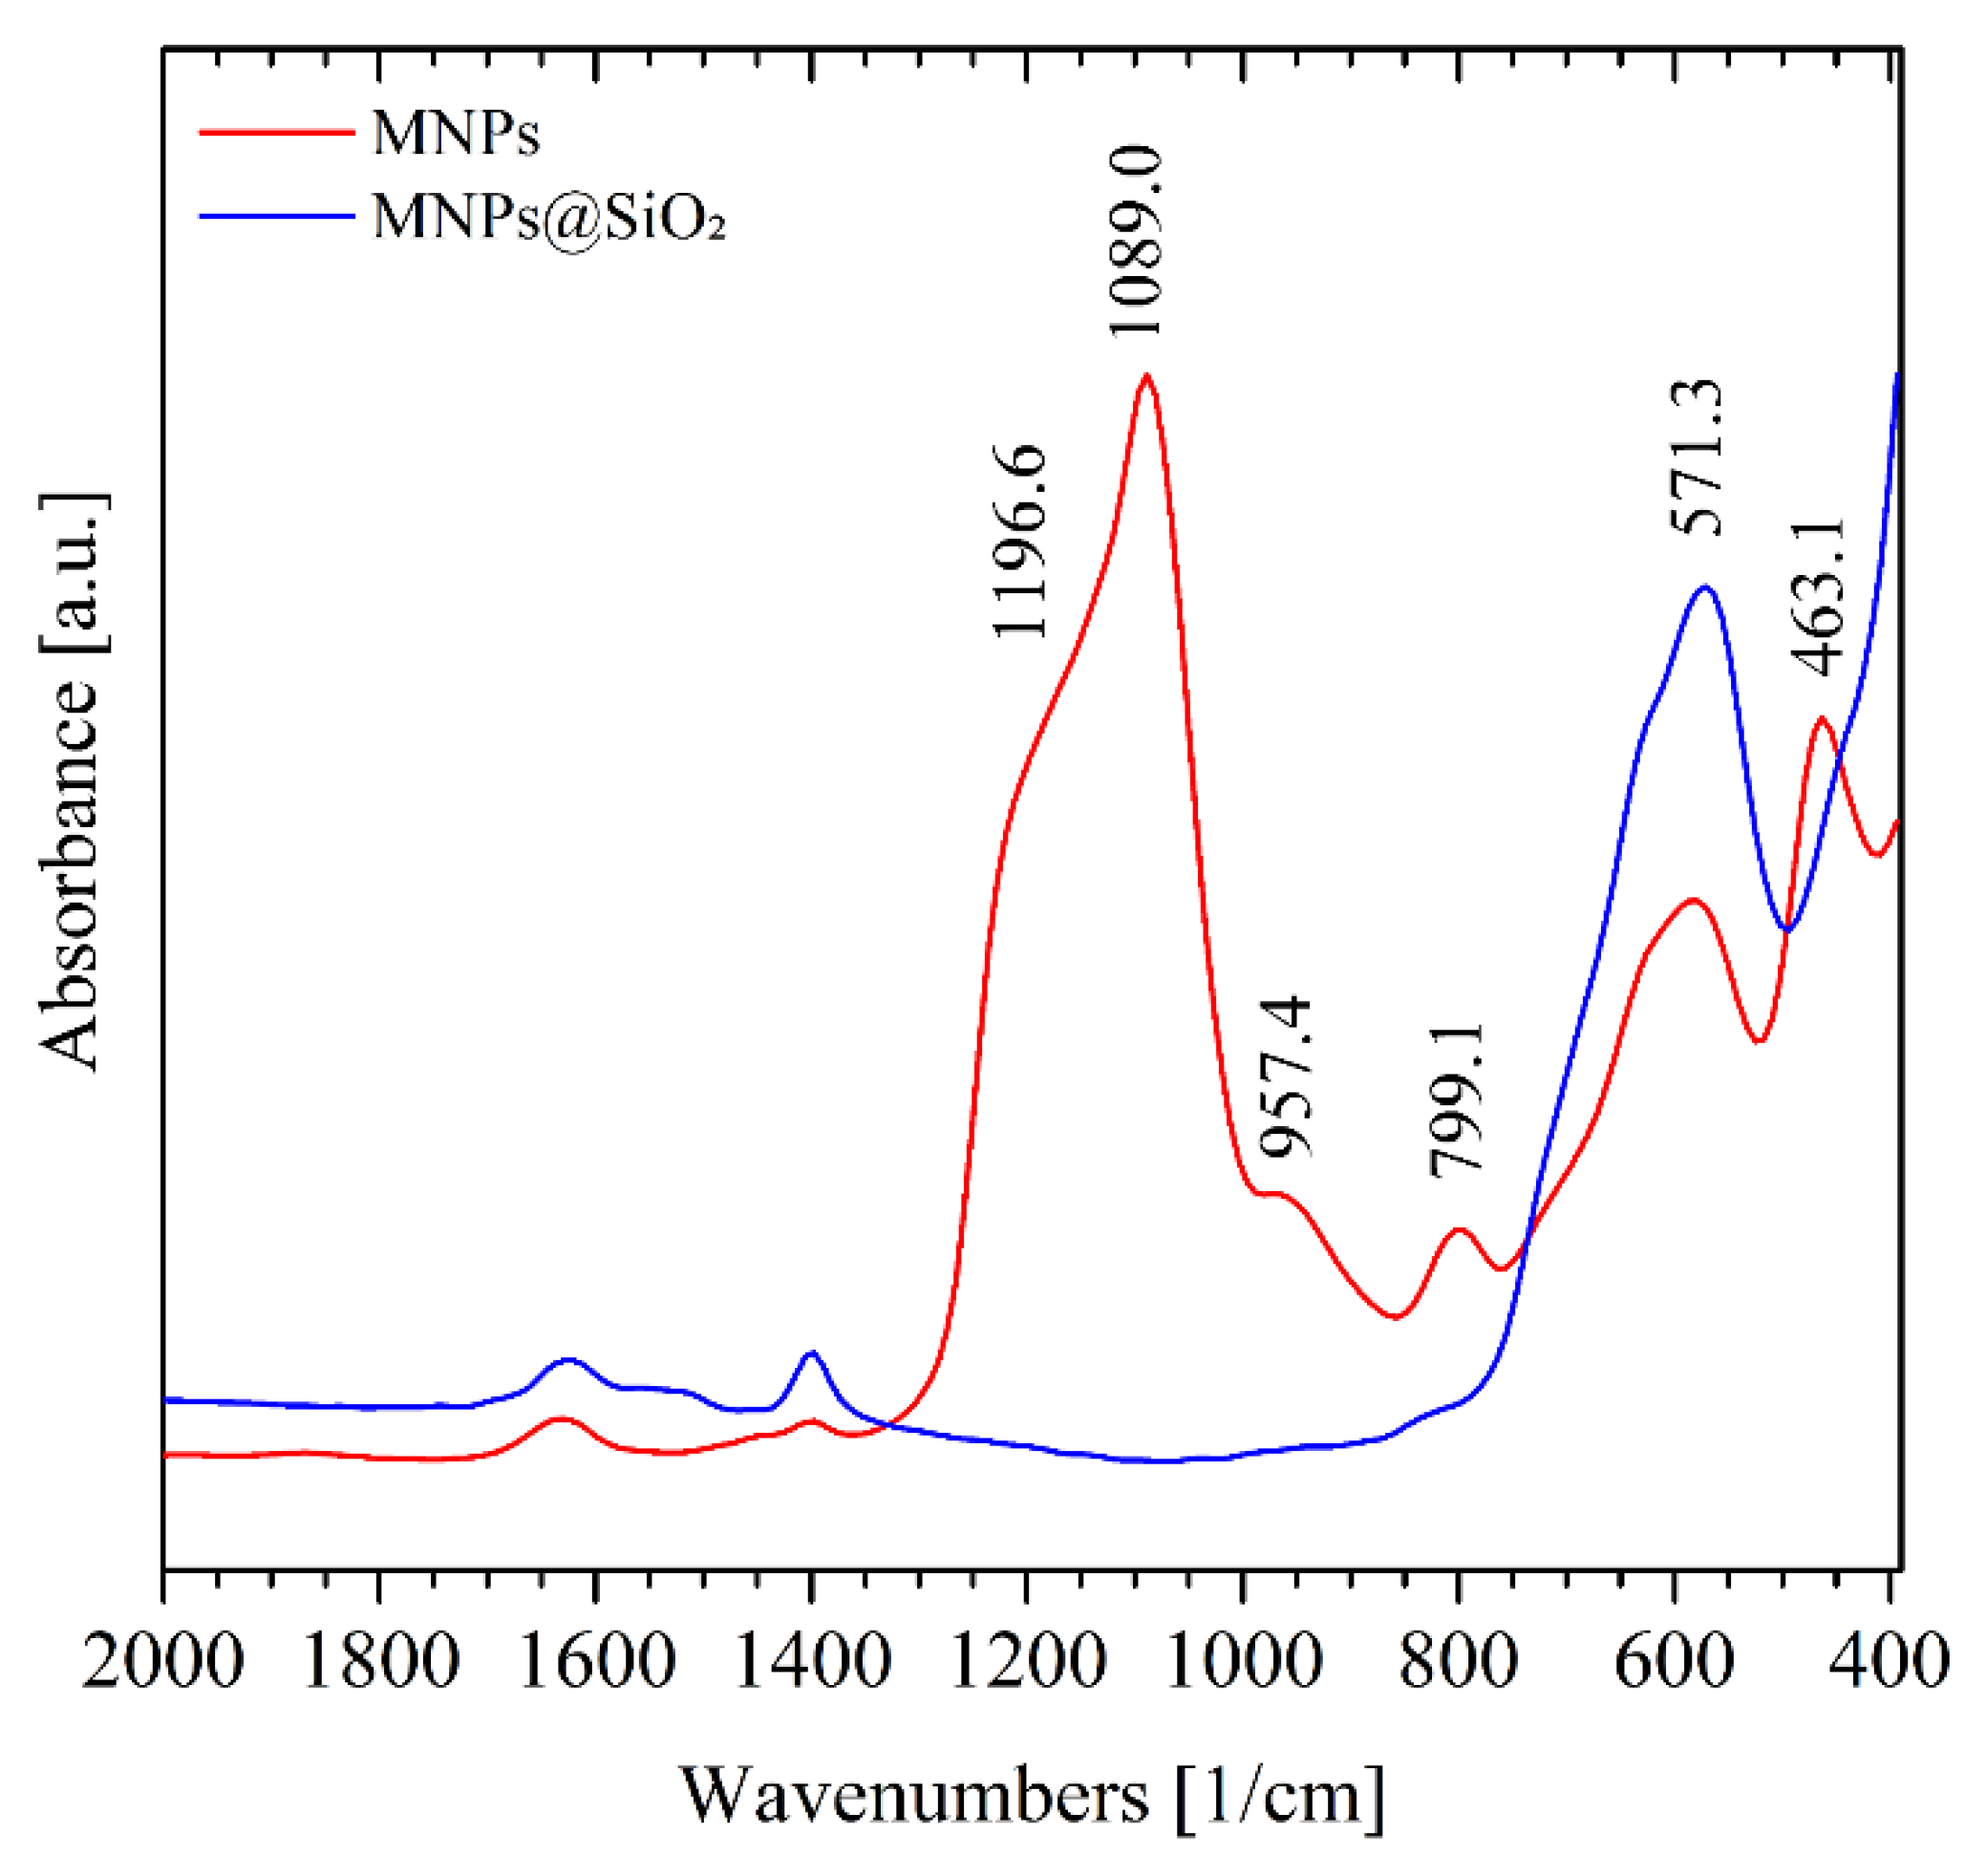
Figure 6.
DNA yields across tested purification conditions. HeLa cells and Drosophila melanogaster tissue were used as starting matrices for DNA purification; DNA concentrations were quantified by NanoDrop. (A,B,D) Results from HeLa-derived purifications. (A) Comparison between two lysis buffers (GITC vs. Livak). (B) Effect of Livak buffer pH on DNA recovery (pH 6.5 vs. pH 7.5). (C) DNA yield from D. melanogaster samples after incubation at different temperatures during the binding step (25 °C, 55 °C, and 90 °C). (D) DNA concentrations from purifications comparing the original and optimized washing procedures. Statistical significance is indicated as ****p < 0.0001 and ***p < 0.001.
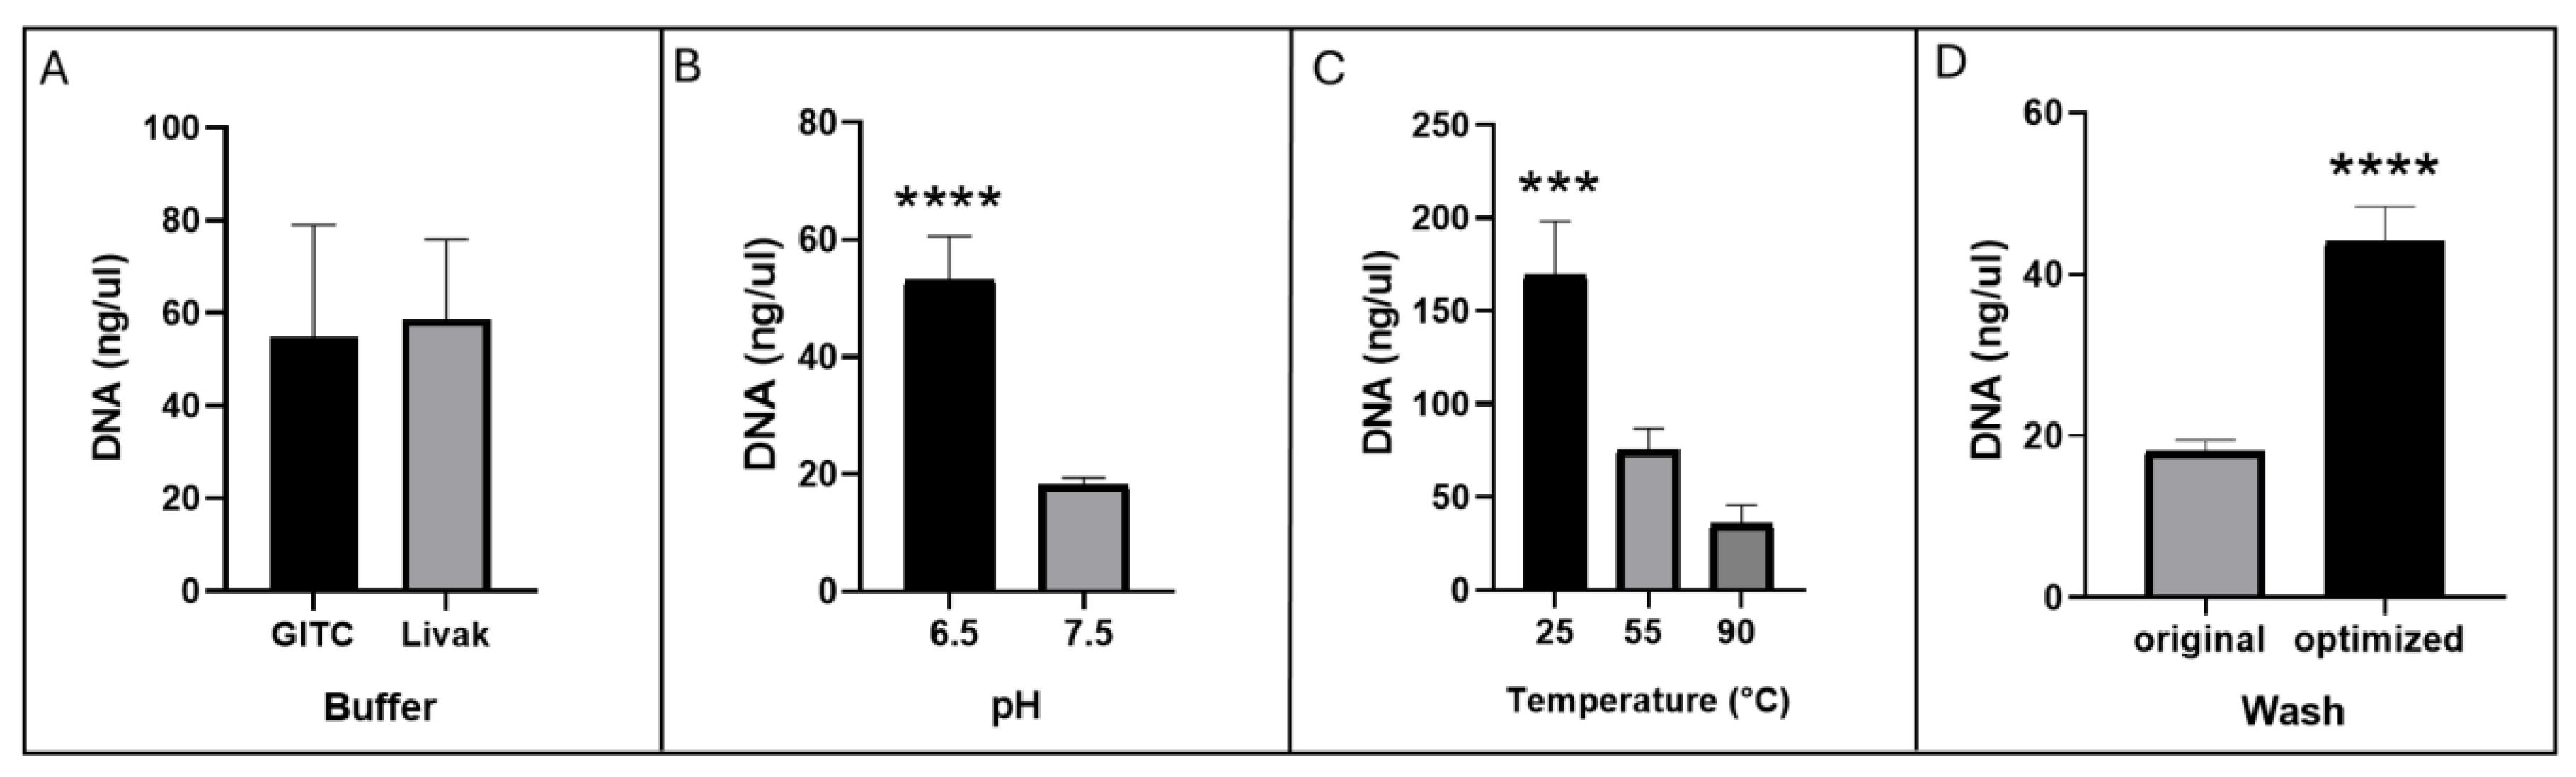
Figure 7.
Agarose gel electrophoresis showing PCR amplification products from eight vaginal swab samples processed with either the Livak or the GITC extraction buffer. A clear HPV-positive band is observed in several samples from both extraction buffers. No amplification is detected in the negative control (–), while both positive controls (+) display the expected band, confirming assay performance.
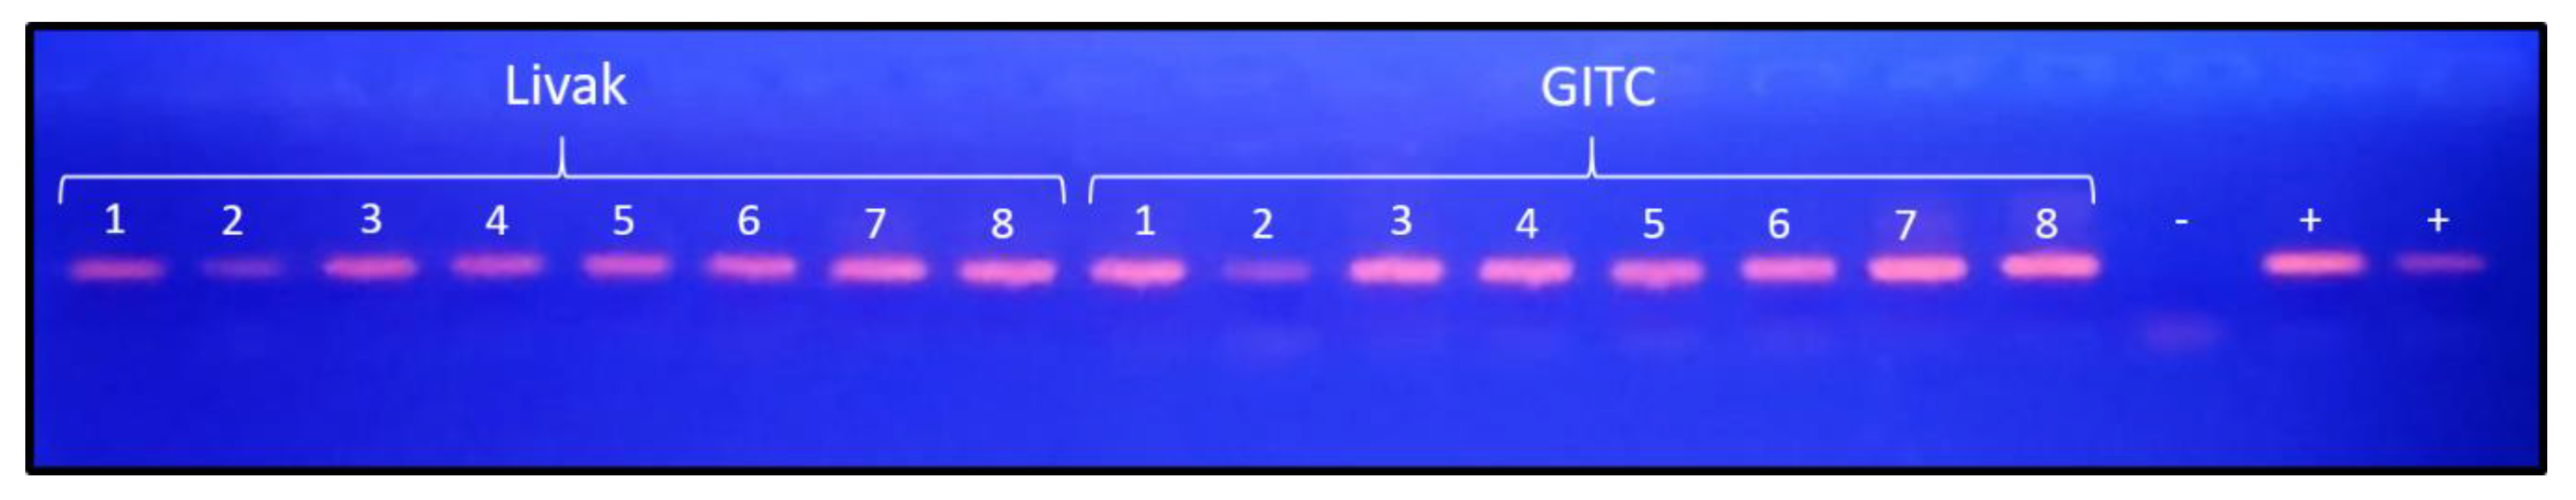
Figure 8.
Results obtained using the two nucleic acid purification methods. Our method (manual magnetic-bead method) and LDM (automated method using the commercial Mole kit). HPV detection was performed by endpoint PCR, and products were visualized on a 2% agarose gel. ‘Green’ indicates the presence of a band and ‘Red’ indicates the absence of a band. The table shows the correlation values between the evaluated methods, along with their corresponding sensitivity and specificity. Correlation coefficients indicate the degree of agreement between methods, while sensitivity and specificity reflect the performance of each method in correctly identifying positive and negative samples, respectively.
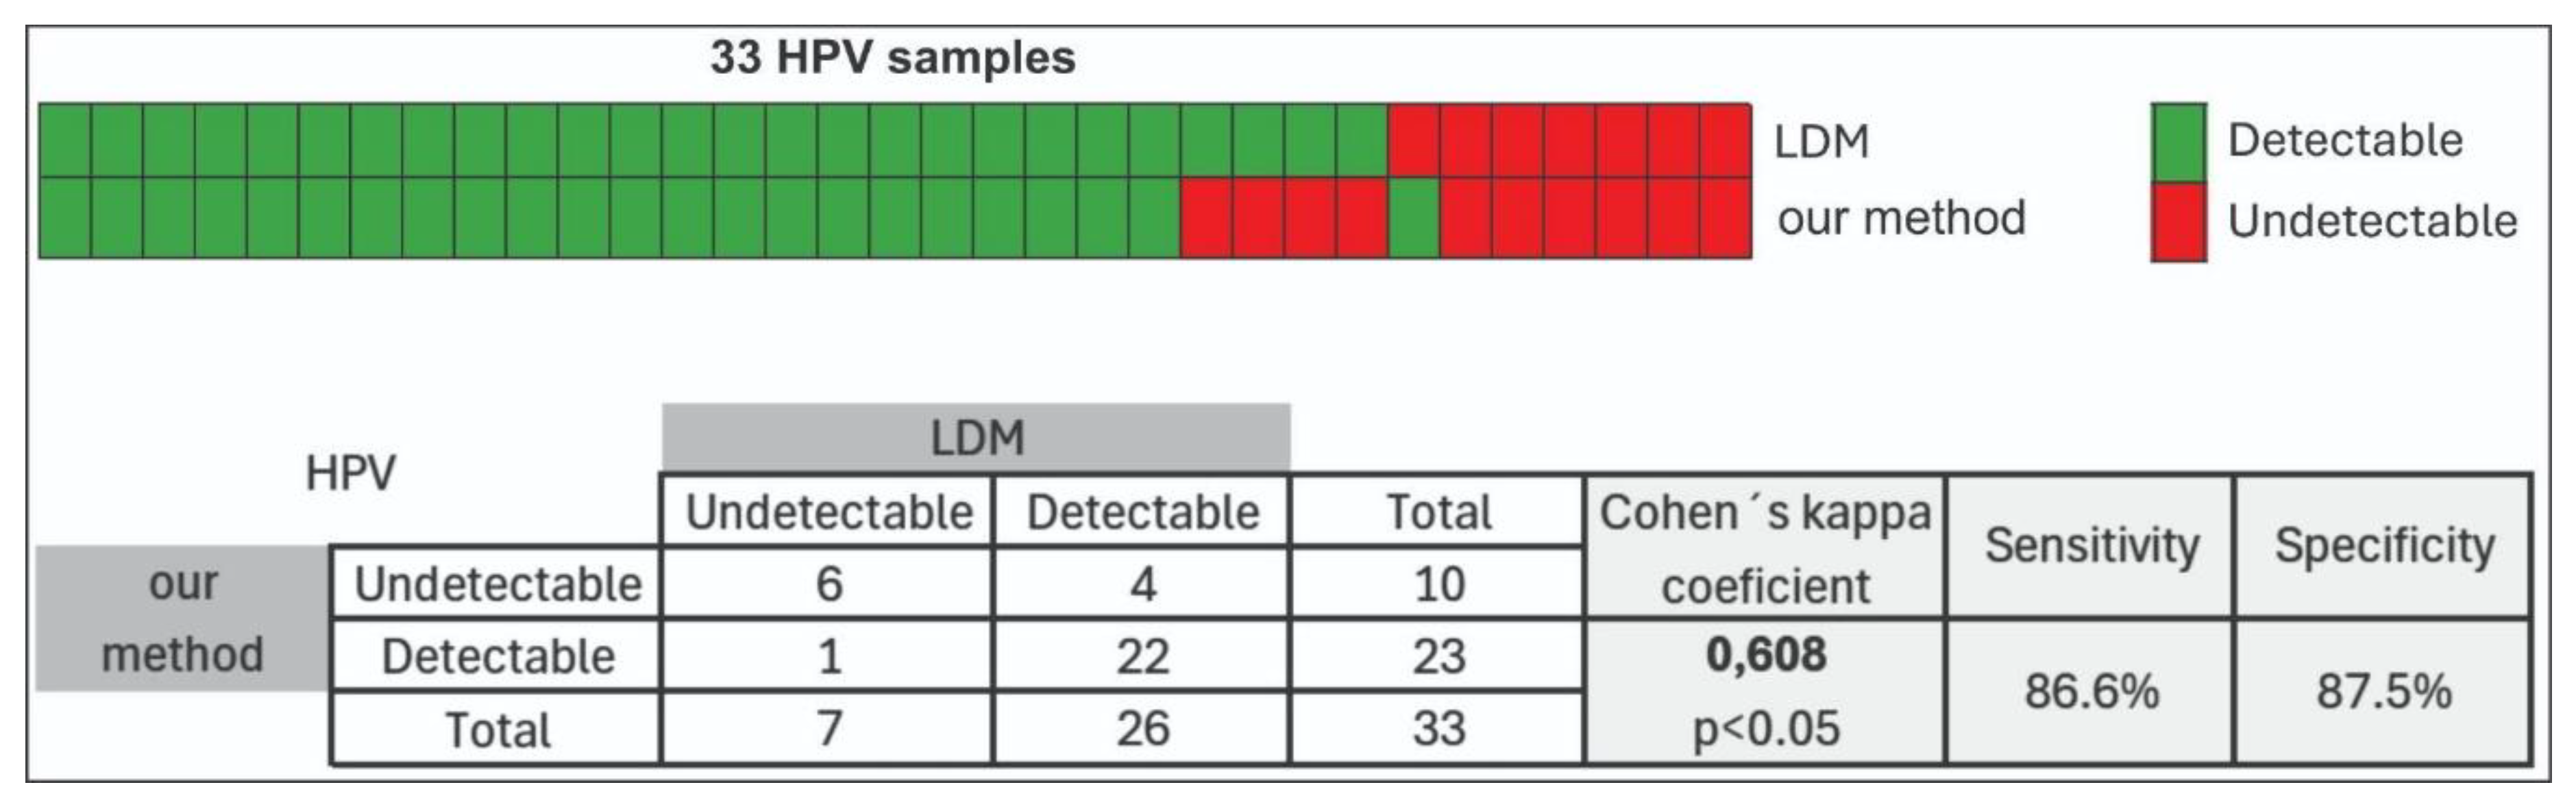
Figure 9.
Scatter plot comparing Ct values obtained with the automated Mole extraction kit (x-axis) and our manual method (y-axis) for the detection of C. trachomatis, U. urealyticum and M. hominis by RT-PCR. A total of 34 clinical samples were analyzed in three separate reactions, using FAM-labeled probes for C. trachomatis and M. hominis, and a Cy5-labeled probe for U. urealyticum. Each point represents an individual sample: black squares (C. trachomatis), red squares (U. urealyticum) and blue squares (M. hominis). Samples undetectable by both extraction methods were assigned a Ct value of 40 and are represented by the black triangle (n= 69, 28 Chlamydia, 26 Ureaplasma and 15 Mycoplasma). The diagonal dashed line indicates identical Ct values between methods, and the vertical and horizontal dashed lines represent the Ct cutoff of 35 used for all assays.
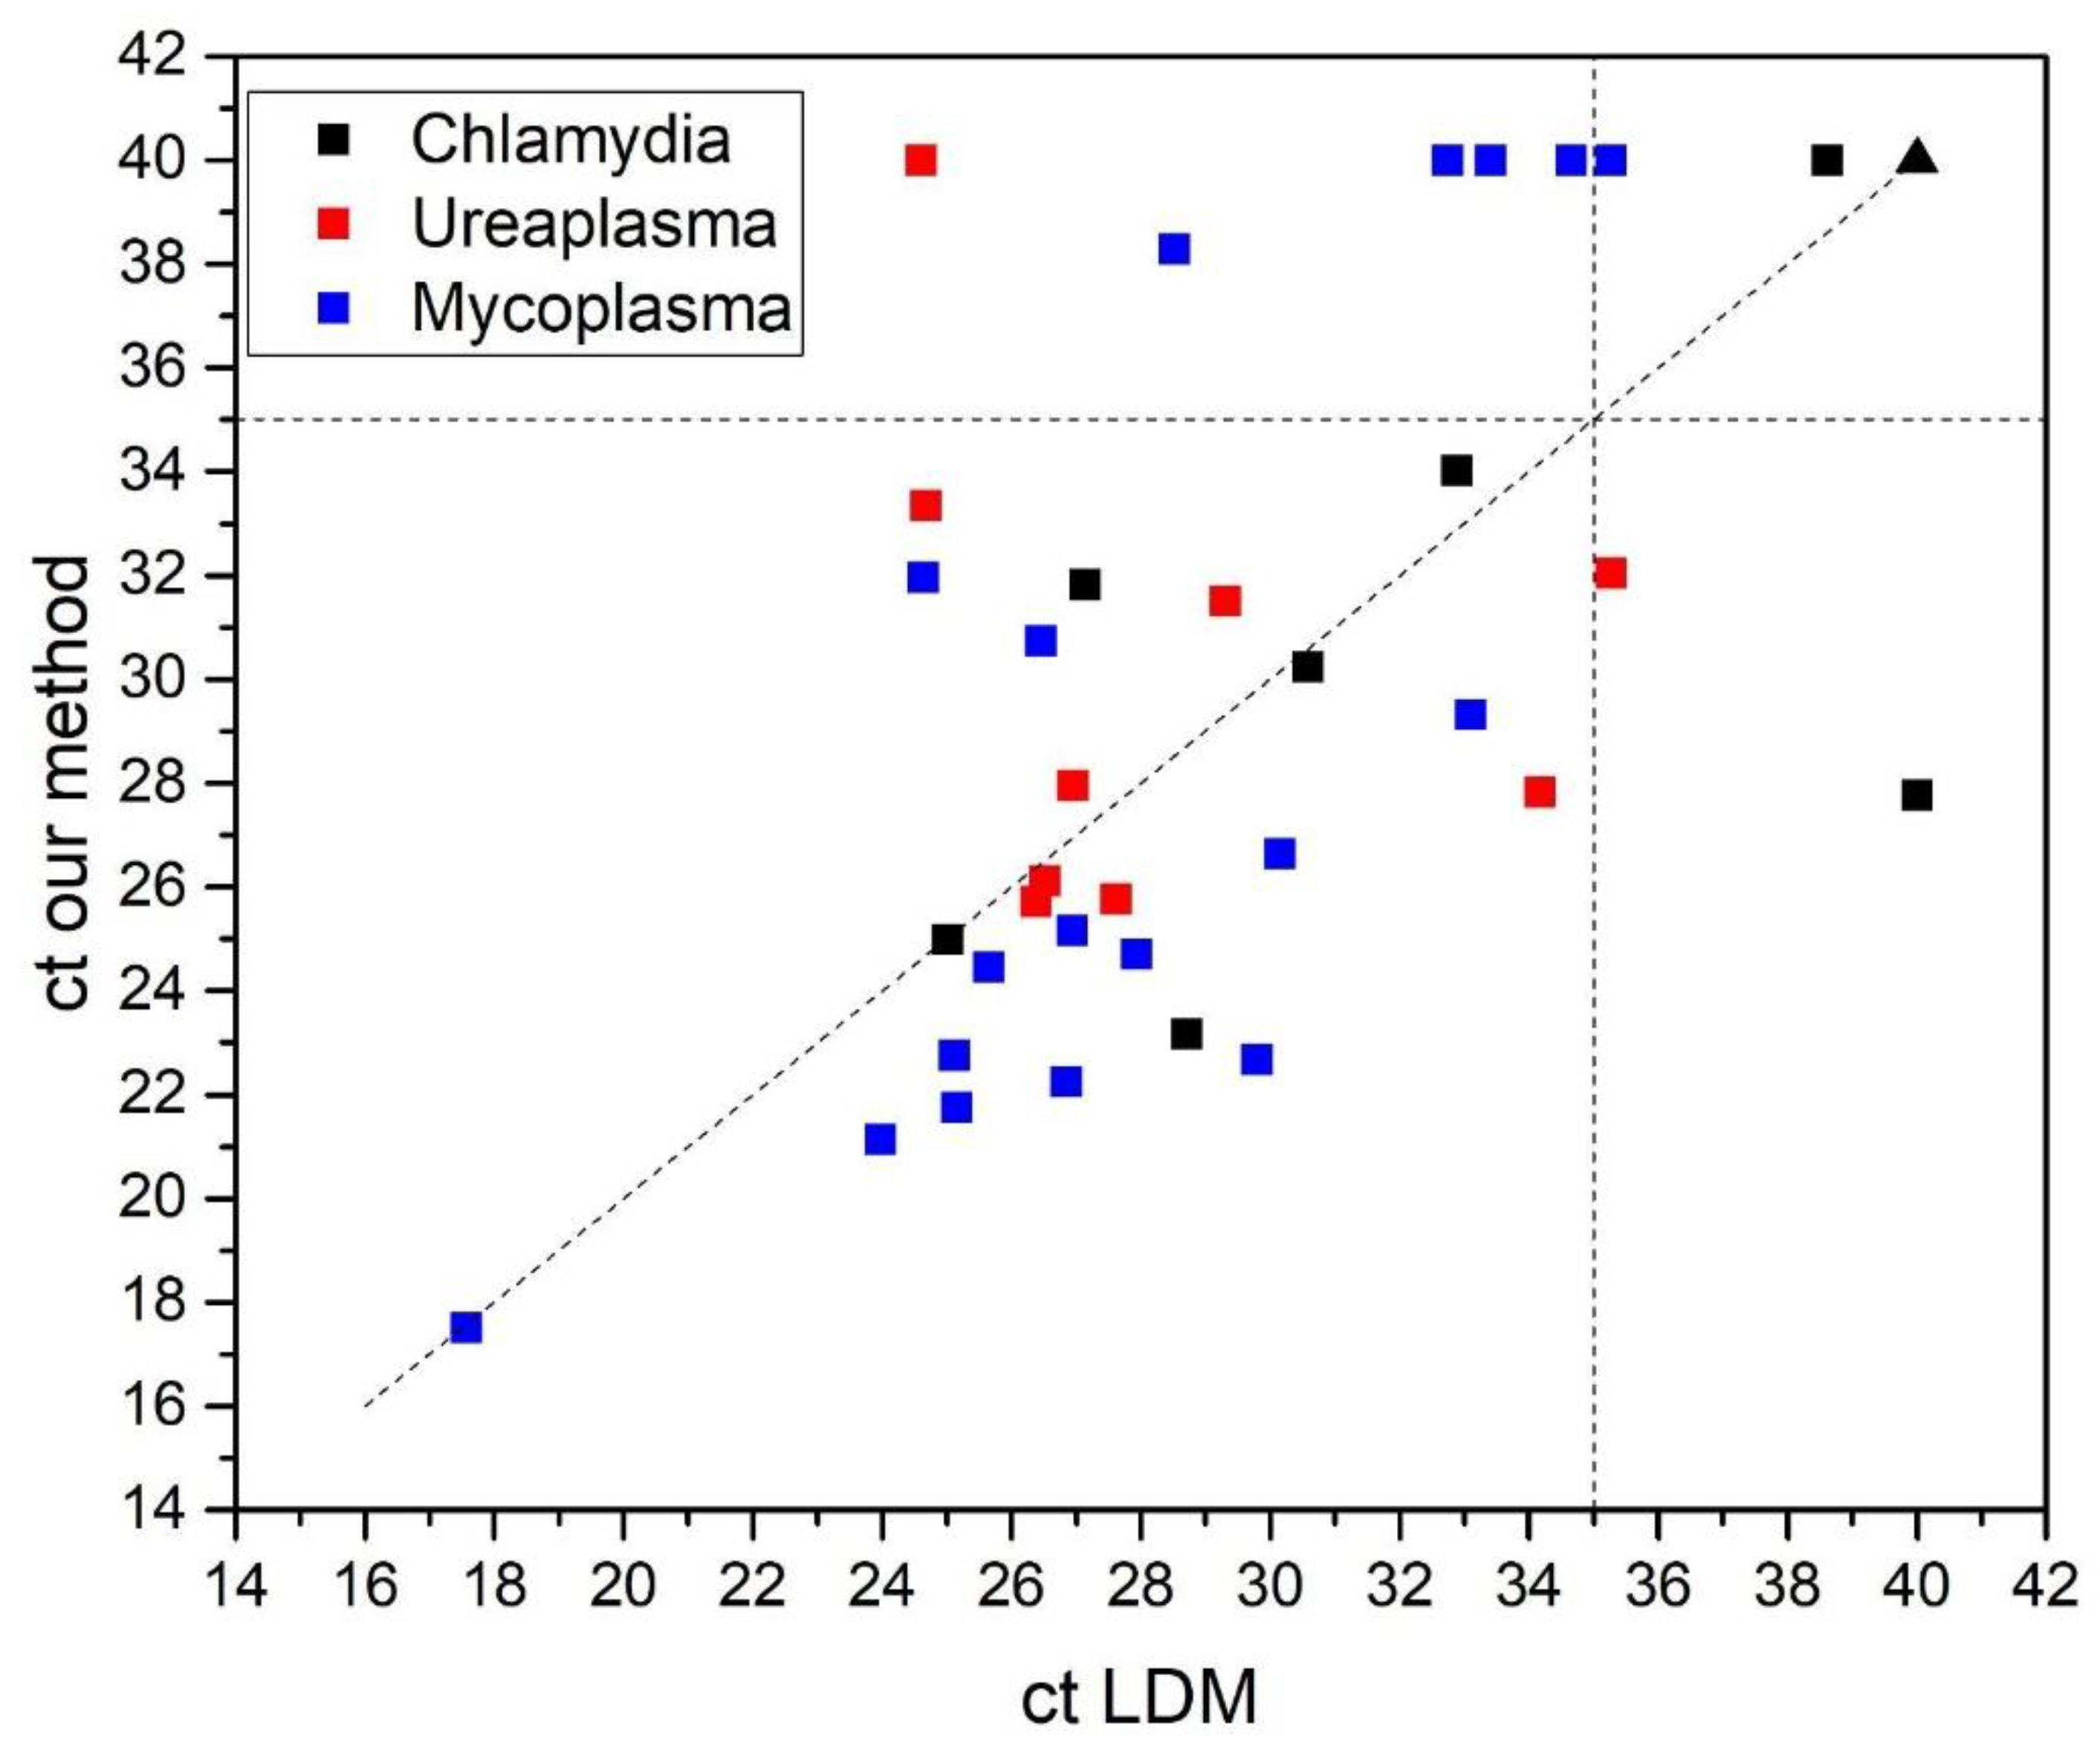

Table 1.
Diagnostic performance of our method for C. trachomatis, U. urealyticum and M. hominis detection. This table summarizes the concordance between our method and the reference method, showing the number of positive and negative results for each approach, as well as the calculated sensitivity and specificity. Concordance values indicate the level of agreement between methods, while sensitivity and specificity reflect the ability of our method to correctly identify positive and negative samples, respectively. * Indicates a p - value close to “0”, so with high significance.
 |
Disclaimer/Publisher’s Note: The statements, opinions and data contained in all publications are solely those of the individual author(s) and contributor(s) and not of MDPI and/or the editor(s). MDPI and/or the editor(s) disclaim responsibility for any injury to people or property resulting from any ideas, methods, instructions or products referred to in the content. |
© 2025 by the authors. Licensee MDPI, Basel, Switzerland. This article is an open access article distributed under the terms and conditions of the Creative Commons Attribution (CC BY) license (http://creativecommons.org/licenses/by/4.0/).
Copyright: This open access article is published under a Creative Commons CC BY 4.0 license, which permit the free download, distribution, and reuse, provided that the author and preprint are cited in any reuse.


