1. Introduction
In recent decades, cephalopod fisheries globally expand and are viewed and exploited as alternatives to many depleted conventional finfish fisheries[
1]. The marked rise in cephalopod landings has contributed to the relative stability and high level of global marine fisheries. Correspondingly, fishing pressure on cephalopod populations has increased, and catches have leveled off to 3.6 million tones in 2018 from a peak of 4.9 million tones in 2014 [
2]. This makes identifying the population structure of the commercial species crucial, since population is the basic biological unit considered when evaluating ecosystem conservation and managing fishery resource [
3]. However, cephalopod has unique life history characteristics, such as short lifespan, high natural mortality and turnover rate, and diversified habitat [
4]. These characteristics make them can quickly adapt to environmental changes, thereby gaining a competitive advantage and filling the niche of other biological populations, and also resulting in relatively complex populations [
5]. Consequently, it becomes imperative to integrate diverse stock identification techniques. Moreover, the extensive oceanic migrations of nektonic squids, which traverse multiple oceanic ecosystems during their movements, pose a further complication in harmonizing operational and biological management approaches for effective population governance.
Todarodes pacificus (Cephalopoda: Ommastrephidae), is distributed in the northwest Pacific between 20 and 60°N. It is one of the earliest developed and utilized species worldwide, and largely exploited by Asia-Pacific countries including China, Japan, and Korea [
6]. At present, the research on
T. pacificus mainly focuses on resource abundance and its assessment, basic biology, genetic diversity of prefectural-level populations, and the spatio-temporal distribution of fish farms [
7]. The species has three cohorts with different peak spawning seasons: summer, autumn and winter. The three cohorts have different distribution, migration route, spawning areas and resource dynamic. Long-term abundance variability and its relationship with environmental changes has been evaluated, which contribute to better management [
8]. However, due to the complex migration route, different cohorts of
T. pacificus mix in some fishing ground, and then stock composition need be evaluated, namely cohort discrimination method needed. Furthermore, as an important part of population, biological knowledge on the stock in the East China Sea and Yellow Sea is quite lacking, and cohort composition is urgently required to provide comprehensive knowledge on the population structure of
T. pacificus.
Because of challenging in identifying squid stocks, wider range of tools to investigate stock structure become available and a multidisciplinary approach combining several tools can be helpful. Molecular genetic markers are versatile tools for researching the genetic diversity of marine organisms and uncovering phylogenetic relationships [
9]. At present, mitochondrial DNA (mtDNA) and nuclear DNA (nuDNA) markers, two common molecular markers, play important roles in revealing the genetic structure and dynamics of a population [
10]. Mitochondrial DNA markers are widely used in population genetics studies of cephalopods [
11]. Nuclear genes can provide more genetic information about organisms and are equally effective in detecting a populations genetic structure [
12]. In addition, statolith is also an effective tool for studying population structure, because it has a stable shape and contains important biological and ecological information of cephalopods [
13]. Because its outline varies predictably with developmental temperature, diet and depth, geometric analysis of statolith outlines discriminates among conspecifics originating from disparate habitats and thereby illuminates both ecological behaviour and demographic subdivision in oceanic squid [
9].
To obtain deeper insights into population diversity and genetic structure, jointly analysing molecular markers alongside statolith data analysis offers a more comprehensive perspective unattainable through either dataset alone [
14]. In this study, the genetic diversity of
T. pacificus and the statolith shape was analyzed to identify the stock structure, the aim was to: 1) better understand the migration patterns and gene flow of
T. pacificus; 2) examine the morphological differences in statoliths caused by different spawning seasons (summer and autumn), providing better classification criteria and better understanding of the dynamics of cephalopod resources in China’s seas.
2. Materials and Methods
2.1. Sample Collection and Processing
Between 2019 and 2024,
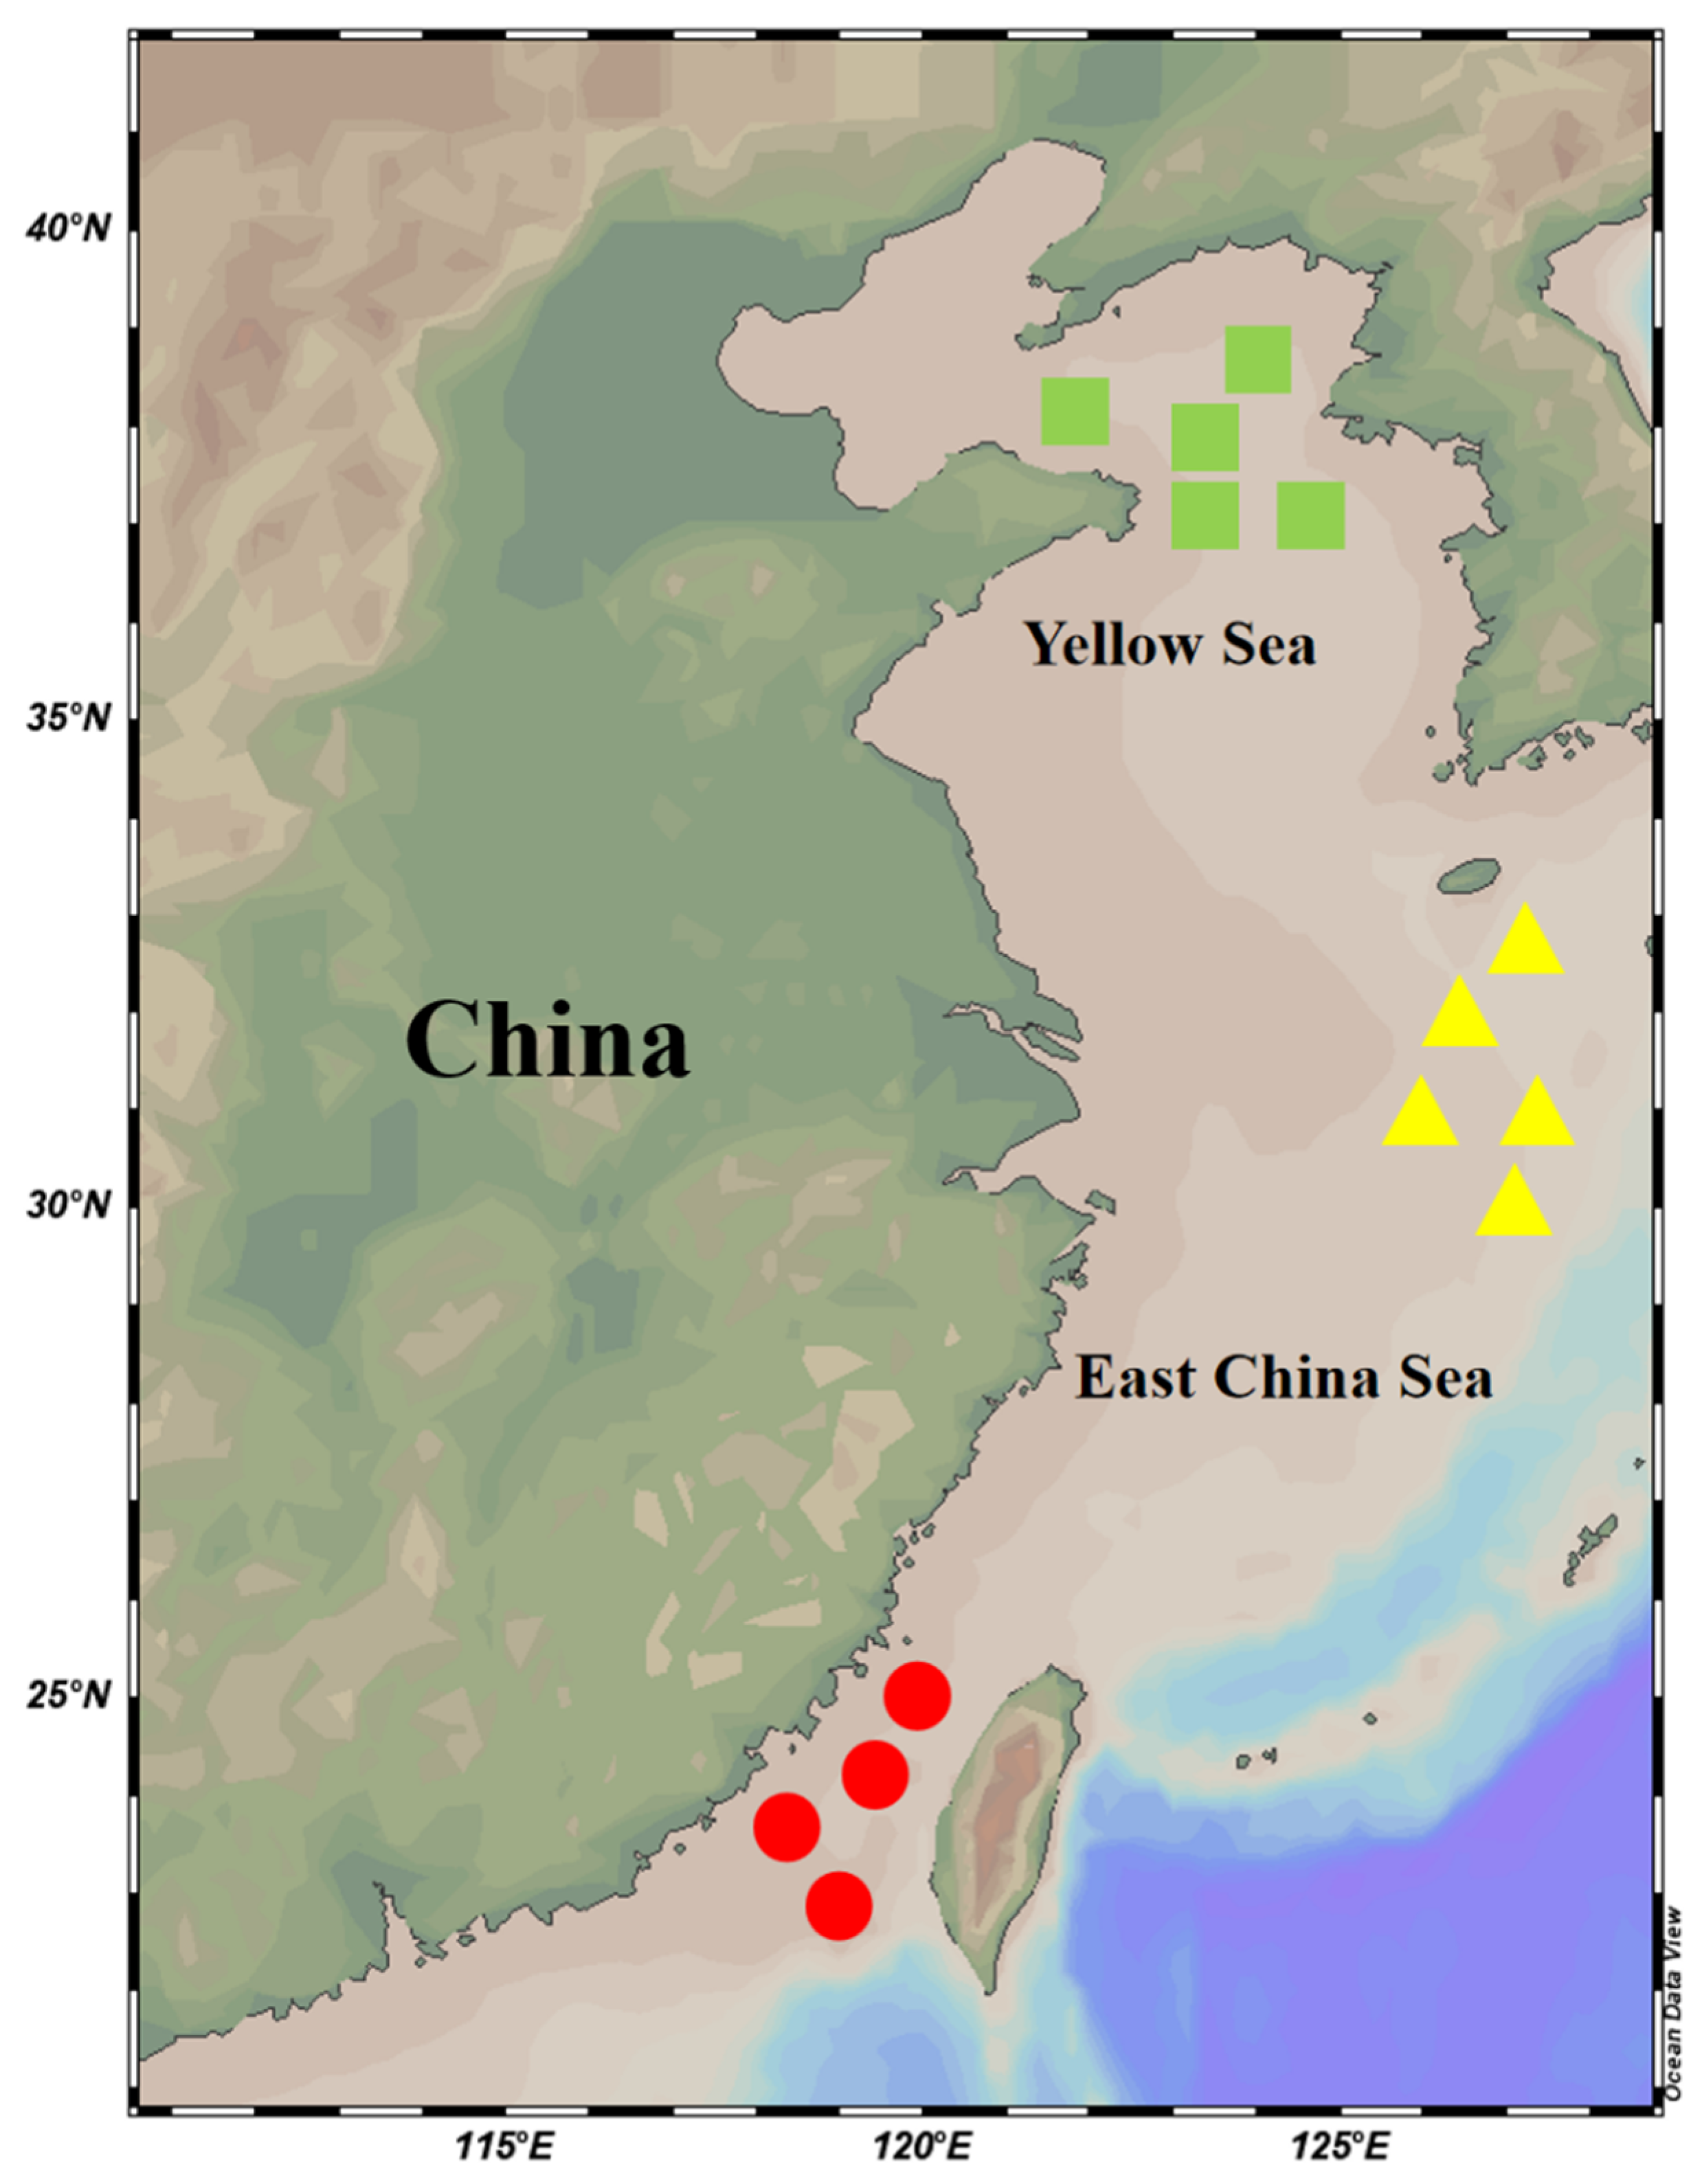
T. pacificus specimens were acquired across three sectors of the China Seas: the northern Yellow Sea, the northern East China Sea, and the southern East China Sea (
Table 1;
Figure 1). The samples were obtained from local fishermen and were immediately placed on ice and transferred to the laboratory.
Mantle muscle specimens were ethanol-preserved (100%) and maintained at -30 °C for genetic analysis. For each squid, the dorsal mantle length (DML, mm) and body weight (BW, 0.1g) were measured, and gonad development stages were visually assessed [
9]. Squid statoliths were extracted, cleaned with an ultrasonic cleaner, dried, and stored in centrifuge tubes for further analysis.
2.2. Analysis of Otolith Age Identification
Statolith was embedded in epoxy resin (Buehler, Epothin) on a glass slide with posterior side up. After hardening, the posterior side was hand ground with alternating fine waterproof sandpapers (Buehler, 600 to 4000 grits) until fully exposure of nucleus, and then polished with 0.3μm aluminium powder [
15]. For larger statolith, the grinding direction should be adjusted during grinding process to avoid over ground in the dorsal dome.
The polished statoliths were photographed under an optical microscope (×200 magnification) using a microscope system (OLYMPUS BX53 and DP74) (
Figure S1). For each statolith the total number of increments was counted from the hatch ring to the margin of dorsal dome. The age of specimens was determined by counting all dark rings. An experienced reader counted the increments three times, with a one - month gap between each count. When the differences in increment counts were under 10%, the average of the three counts was used to estimate daily age. The hatch time for each individual was found by subtracting the daily age from the capture date, and specimens were then assigned to a cohort.
2.3. DNA Extraction and PCR Amplification
Total genomic DNA was extracted using following the CTAB protocol refined by Winnepenninckx and colleagues [
16]. The target genes were amplified by PCR using primers, whose sequences are catalogued in Appendix 1 (
Table S1). The amplification of target genes was reacted in a volume of 25 µL: 1 µL of 100 ng/µL DNA template, 1 µL of each 10 µM/µL primer, 12.5 µL of 2 × Taq Master Mix, and 9.5 µL water. The PCR cycle was 95℃ for 5 min, followed by 35 cycles of 95℃ for 10 s, 55℃ for 20 s, 72℃ for 30 s, and a final 72℃ for 5 min extension. The products were detected by 1.5% agarose gel electrophoresis and sent to Sangon Biotech (Shanghai, China) for sequencing.
2.4. Sequencing Analysis
2.4.1. Population Genetics
For sequence assembly and alignment of Todarodes pacificus genetic data, SeqMan v.7.2 [
17] from the DNASTAR package and MEGA v.11 [
18] were used. MEGA v.11 [
18] also calculated the average base composition, variable site count, and genetic distances for all sequences. The DnaSP v 6.1 [
19] software computed genetic diversity indices and inferred population demographic history via mismatch distribution plots for all
T. pacificus populations and lineages. The haplotype network maps were constructed with Popart v.1.7 [
20] and then manually adjusted. The genetic differentiation indices (Fst) can explore the level of genetic differentiation among populations. An Analysis of Molecular Variance (AMOVA) [
21] with the Kimura-2-parameters model, and neutrality tests, Tajima’s D [
22] and Fu’s Fs tests [
23] , were determined with the Arlequin 3.5 [
24].
2.4.2. Phylogenetic Relationship
Phylogenetic inference relied on four datasets: the first three datasets consisted of haplotype sequences of COI, 16S and ODH genes, and a fourth in which the same markers were concatenated per specimen via PhyloSuite v1.2.2 [
25]. Optimal nucleotide substitution models were identified with ModelFinder [
26] under the Bayesian Information Criterion. Maximum-likelihood phylogenies were inferred in IQ-TREE v1.6.12 [
27] and Bayesian topologies in MrBayes v3.2 [
28]. Finally, FigTree v1.4.4 (
http://tree.bio.ed.ac.uk/software/figtree, accessed on 10 June 2024) was used to edit and visualize the ML and BI trees.
2.4.3. Statolith Shape Sampling and Statistical Analysis
To mitigate the potential impact of individual developmental variations on statolith morphology, a selection process was implemented, focusing solely on mature specimens (at Stages III, IV, and V) with body lengths falling within a specified, suitable range. These were then earmarked for subsequent morphological examination of their statoliths [
29]. Prior research has highlighted the near-identical microstructural characteristics exhibited by the left and right statoliths. Consequently, for the purposes of photography and image analysis, one statolith was randomly chosen from each paired set [
30]. The statoliths were arranged on a matte black substrate and imaged through a Nikon SMZ 18 stereomicroscope coupled to a digital camera. Leveraging the “shapeR” package [
31] for the analysis of statolith images, the contours of sampled statoliths were extracted. Subsequently, shape data was visualized and generated, with the contours being converted into 45 normalized elliptical Fourier coefficients. This particular package facilitated the measurement of statolith length, width, and area, as well as the computation of Sw/Sl (the ratio of statolith width to length) and the standard statolith area (Ssa = 1000 × (statolith area/DML²)). Species discriminant analysis was performed utilizing version 4.7 of the Random Forest (RF) package in R, with the out-of-bag (OOB) evaluation employed to gauge the accuracy of the random forest algorithm [
32].
3. Results
3.1. Genetic Analysis
A total of 117 COI sequences, 110 16S sequences and 113 ODH partial sequences of
T. pacificus were obtained (
Table 2). Across all three genes, thymine consistently dominated the nucleotide profile, producing a pronounced AT skew (A + T > G + C). The ODH sequences exhibited the highest proportion of variable sites and the highest degree of variation (20.58%), whereas mitochondrial 16S was the most conserved (0.88%). The mitochondrial gene sequences showed low levels of variation compared to the nuclear gene.
Across the two cohorts of
T. pacificus, 18 COI haplotypes, 6 16S haplotypes and 21 ODH haplotypes were defined. Based on the ODH and COI genes, the haplotype diversity and nucleotide diversity of all individuals were generally high (ODH:0.6010 and 0.0053; COI:0.4560 and 0.0013), whereas the 16S sequences displayed low haplotype diversity and low nucleotide diversity. The analysis of the three genes basically revealed that the autumn cohort had higher nucleotide diversity, while the summer cohort had lower haplotype diversity (
Table 3).
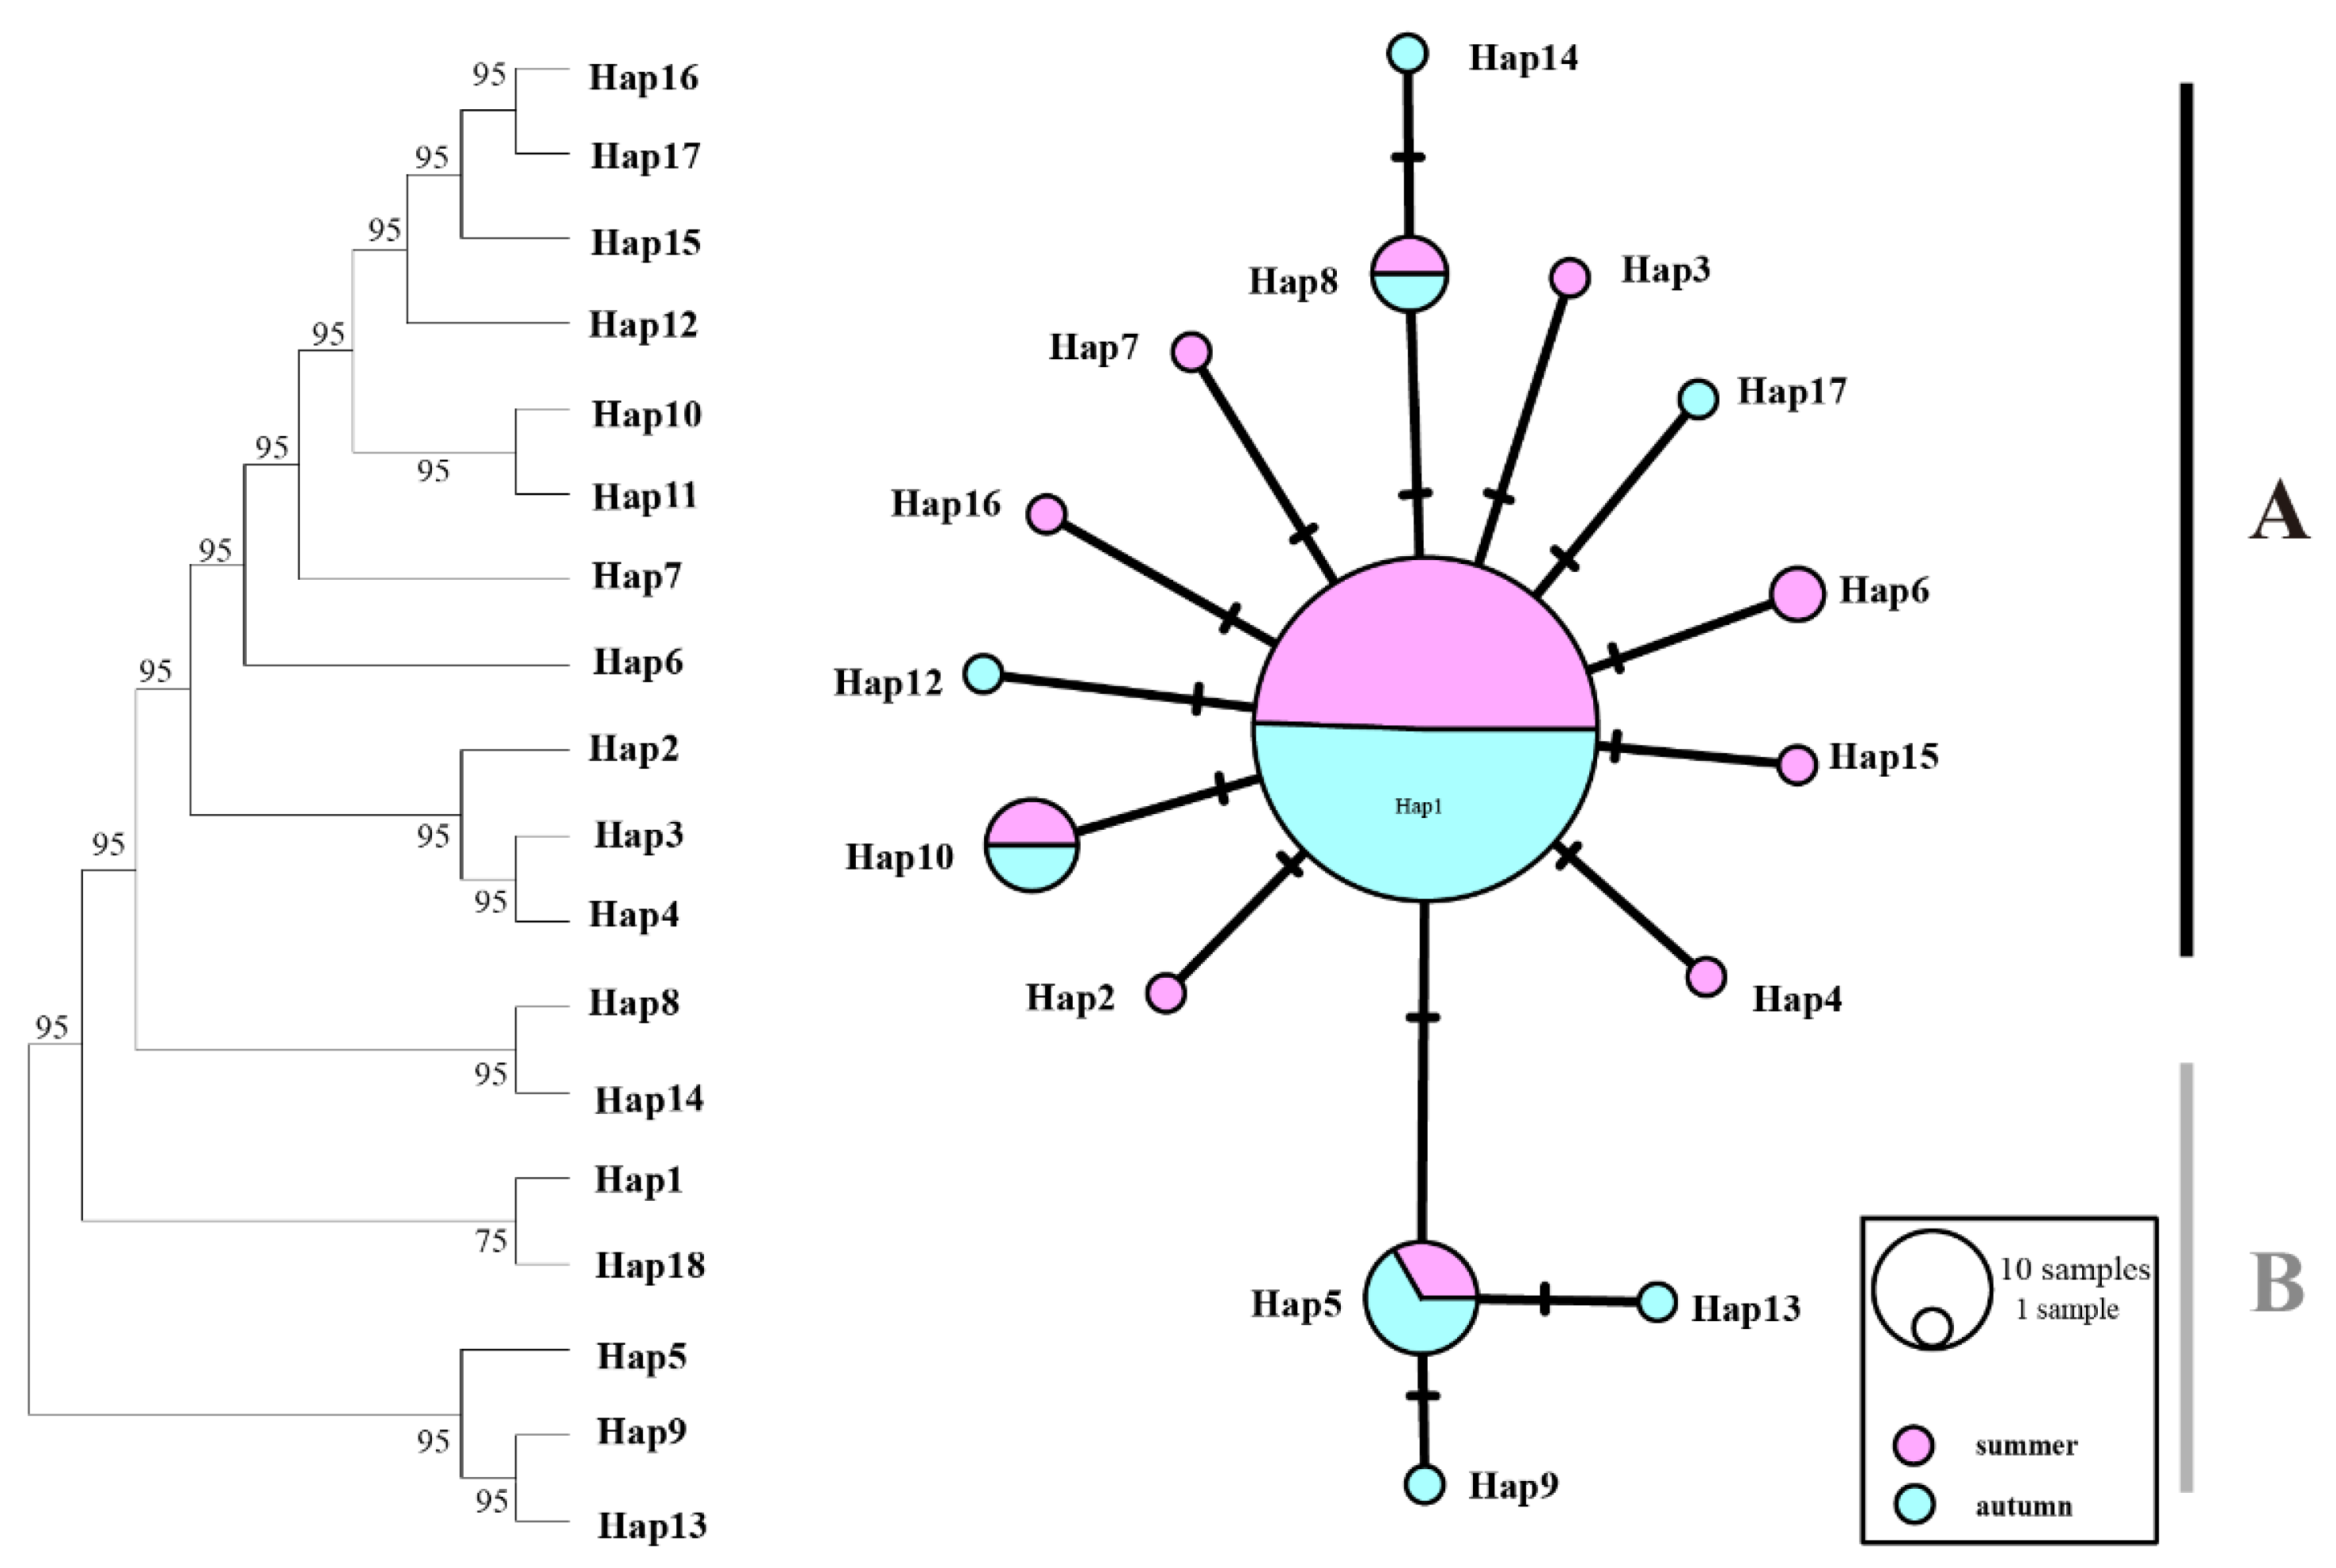
The 18 haplotypes of COI sequences were 3 shared haplotypes and 15 unique haplotypes. These haplotypes formed a star-shaped network centered around Hap1, respectively, with Hap1, Hap5, Hap8, and Hap10 being identified as shared haplotypes, with deletion variants also detected (
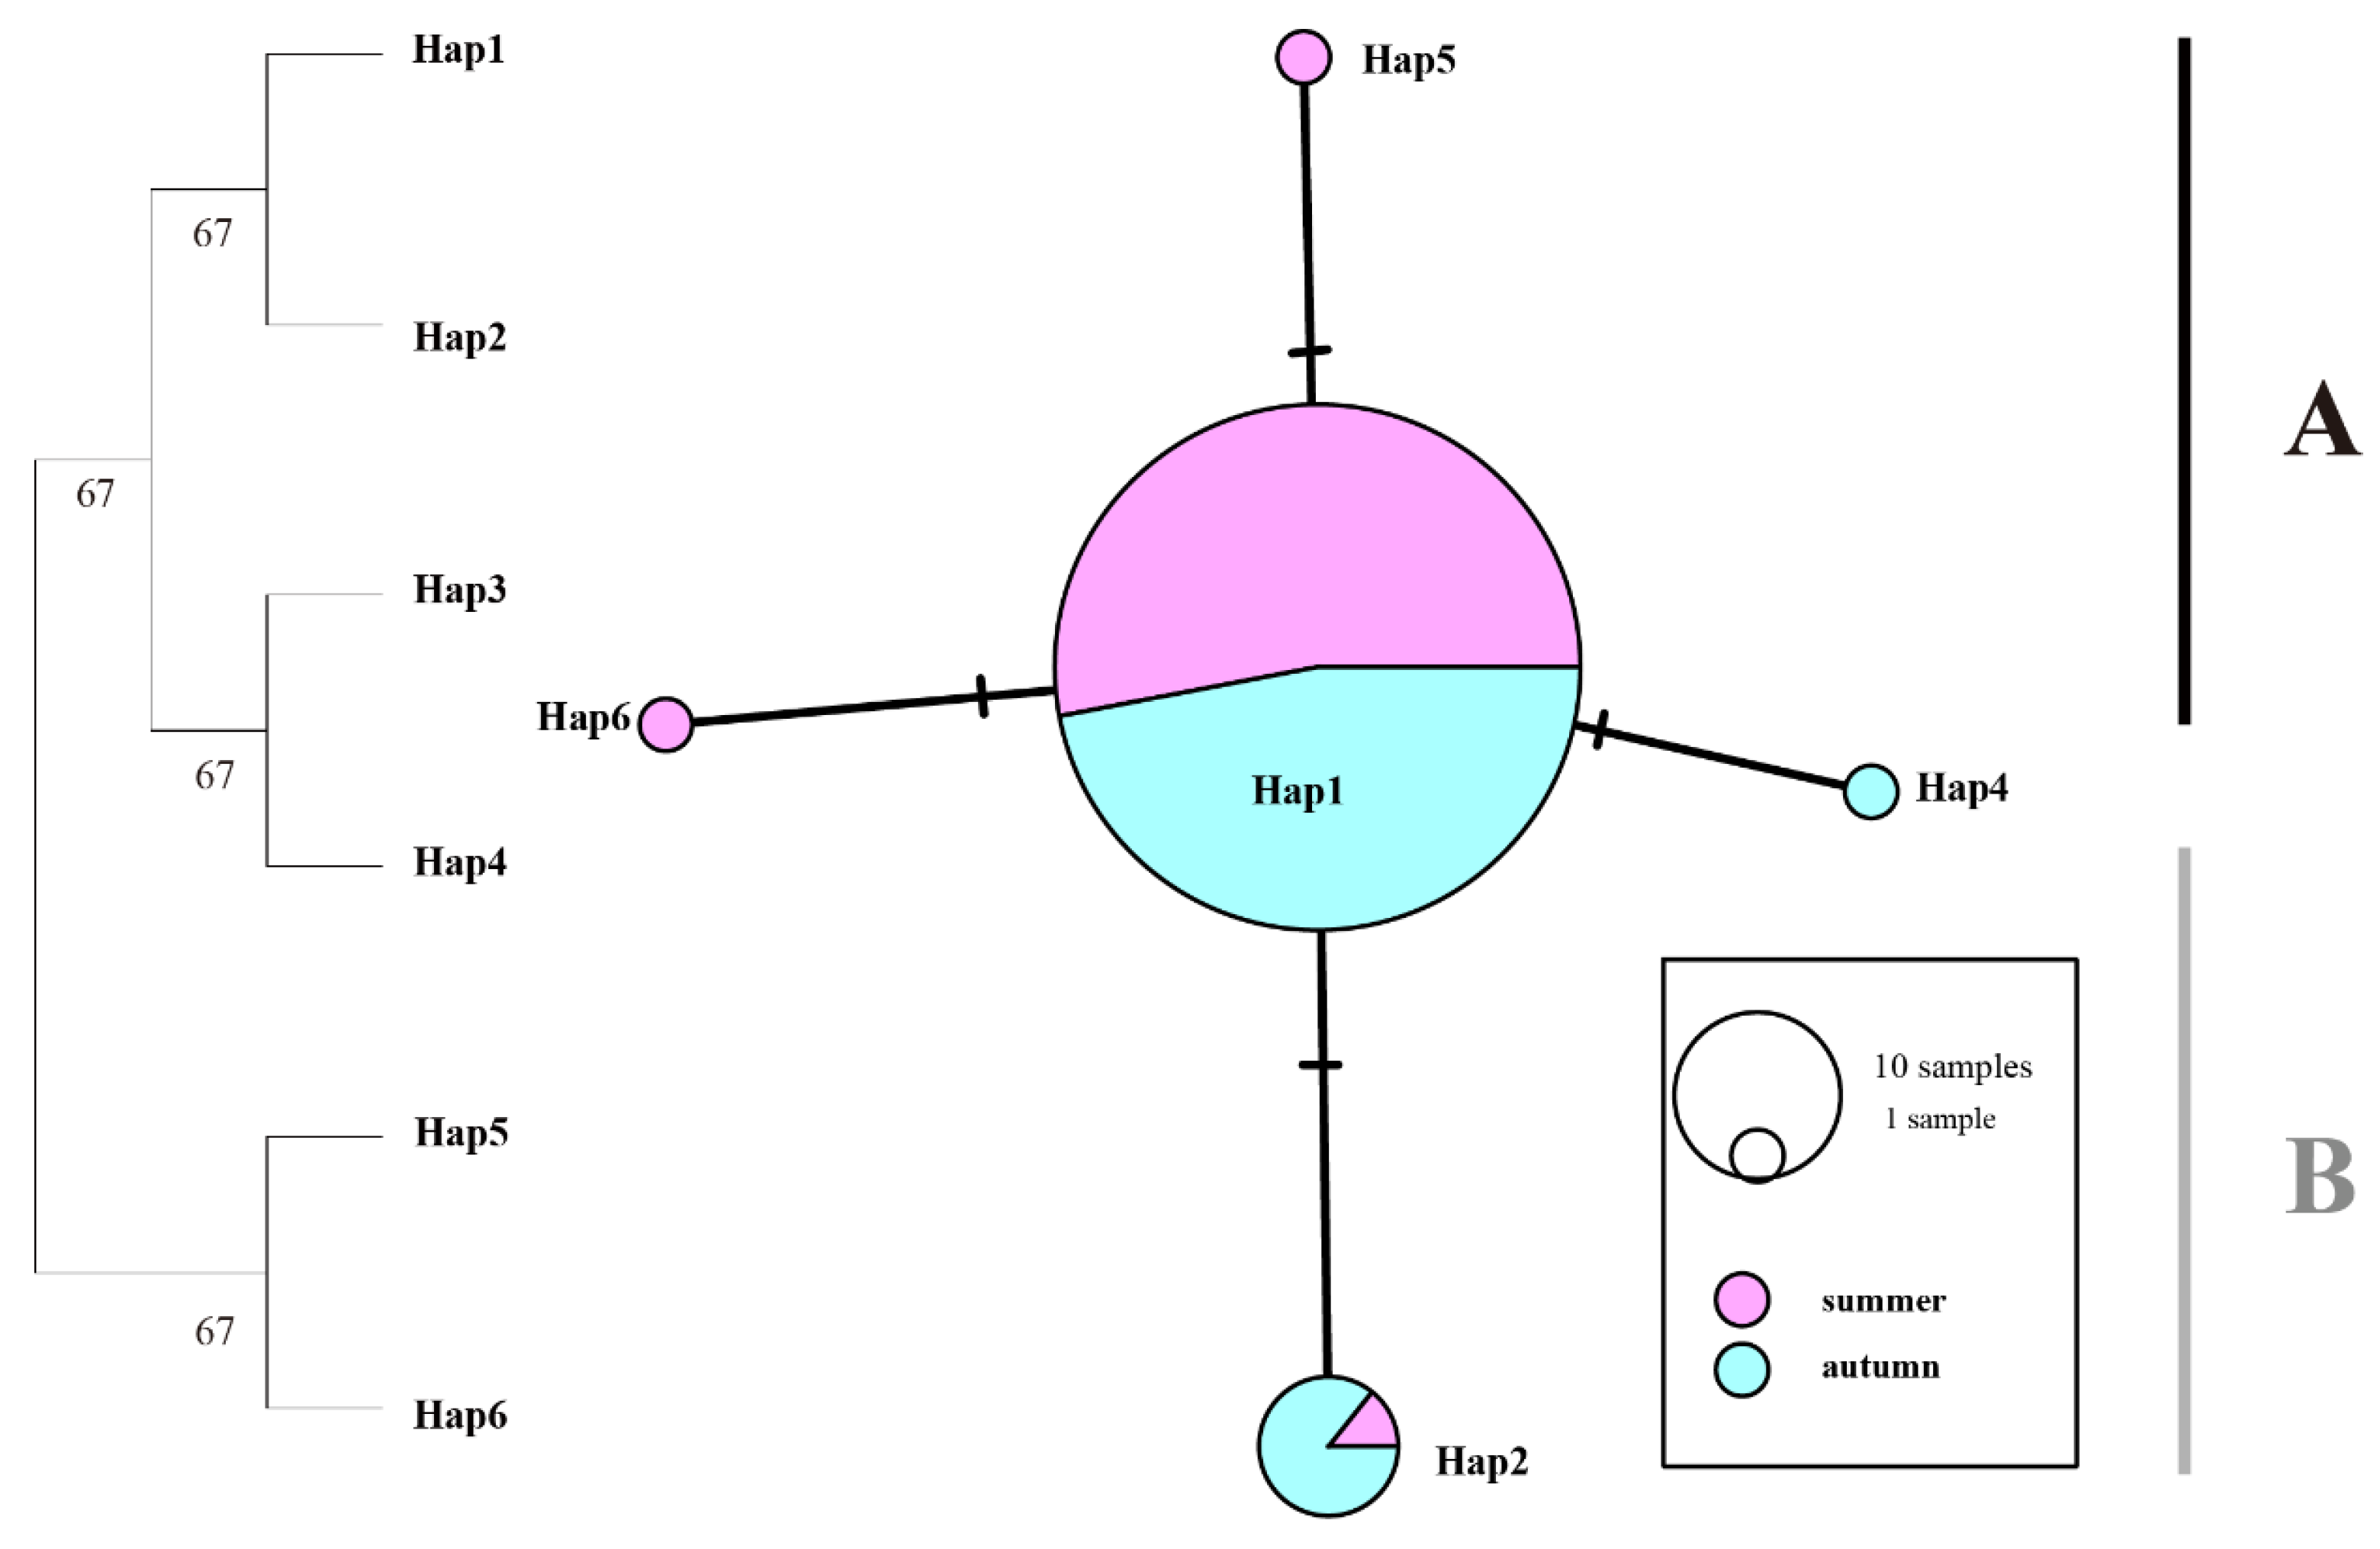
Figure 2). The 16S gene exhibited the lowest haplotype diversity, with Hap1 and Hap2 being the most frequently shared haplotypes (
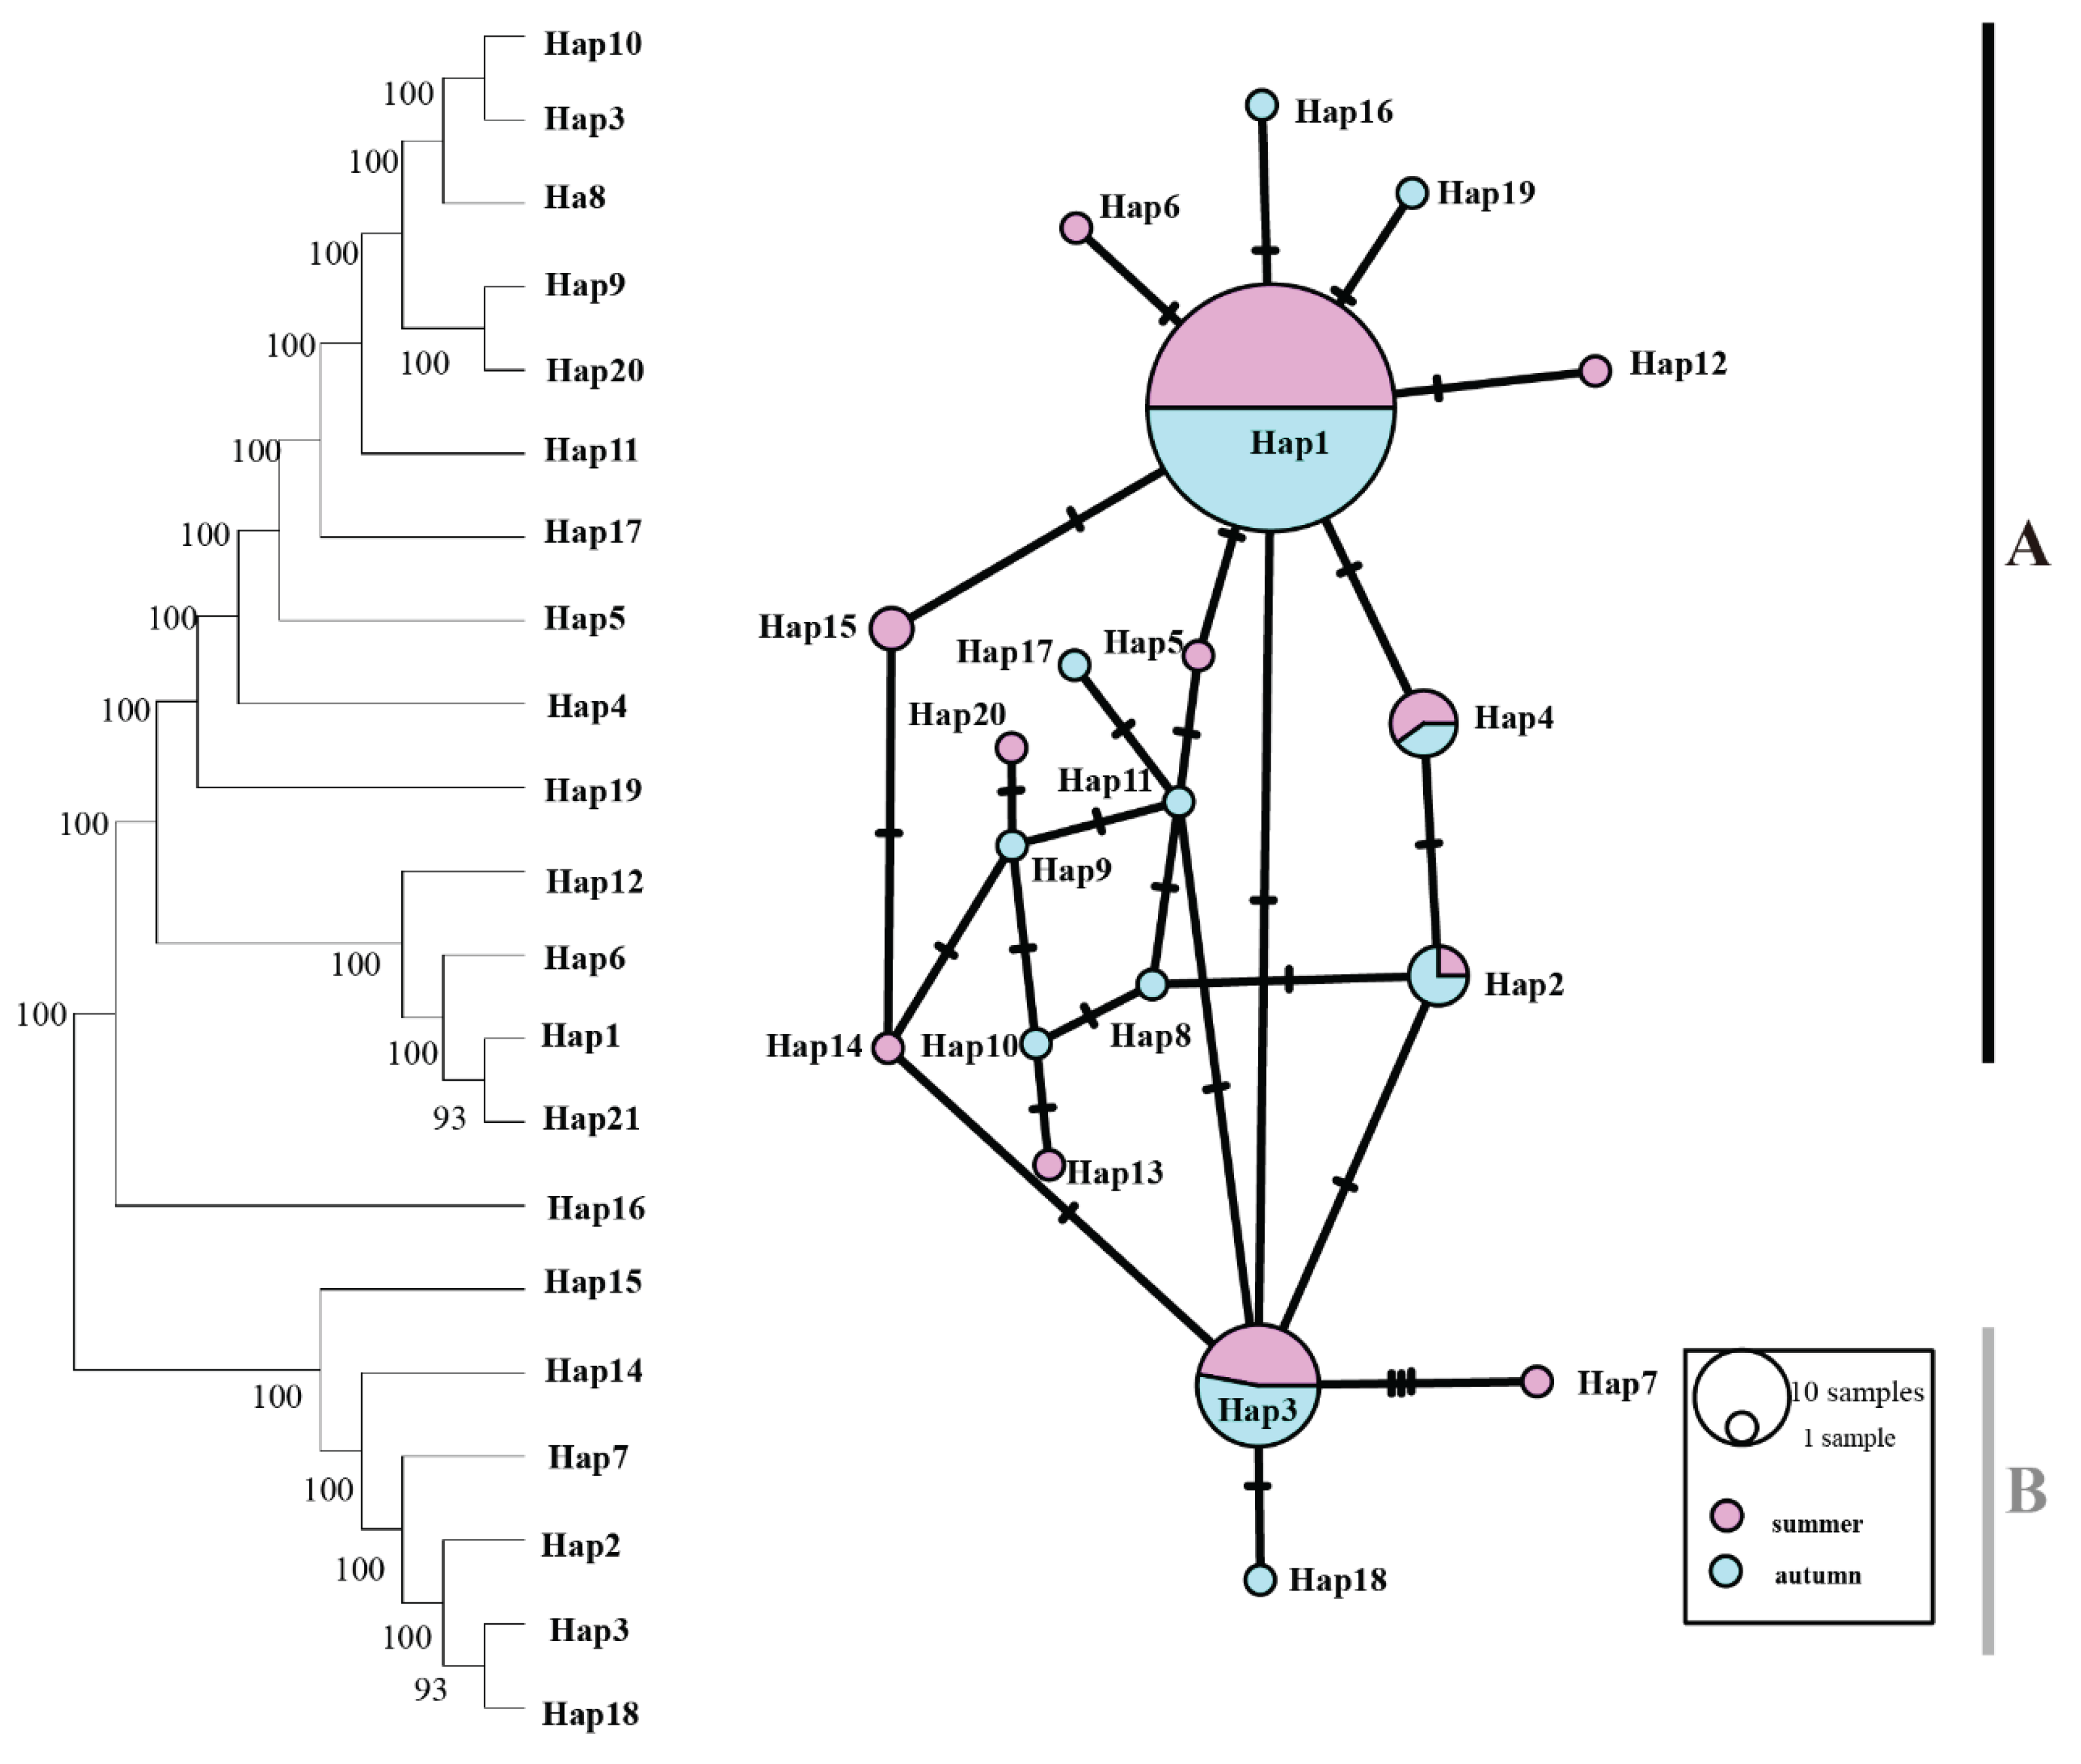
Figure 3). For the ODH gene, there were five shared haplotypes, including Hap1, Hap2, Hap3, Hap4, with a higher distribution of haplotypes and the presence of deletion haplotypes (
Figure 4). Compared to mitochondrial genes, nuclear genes demonstrated fewer mutational steps between the two lineages.
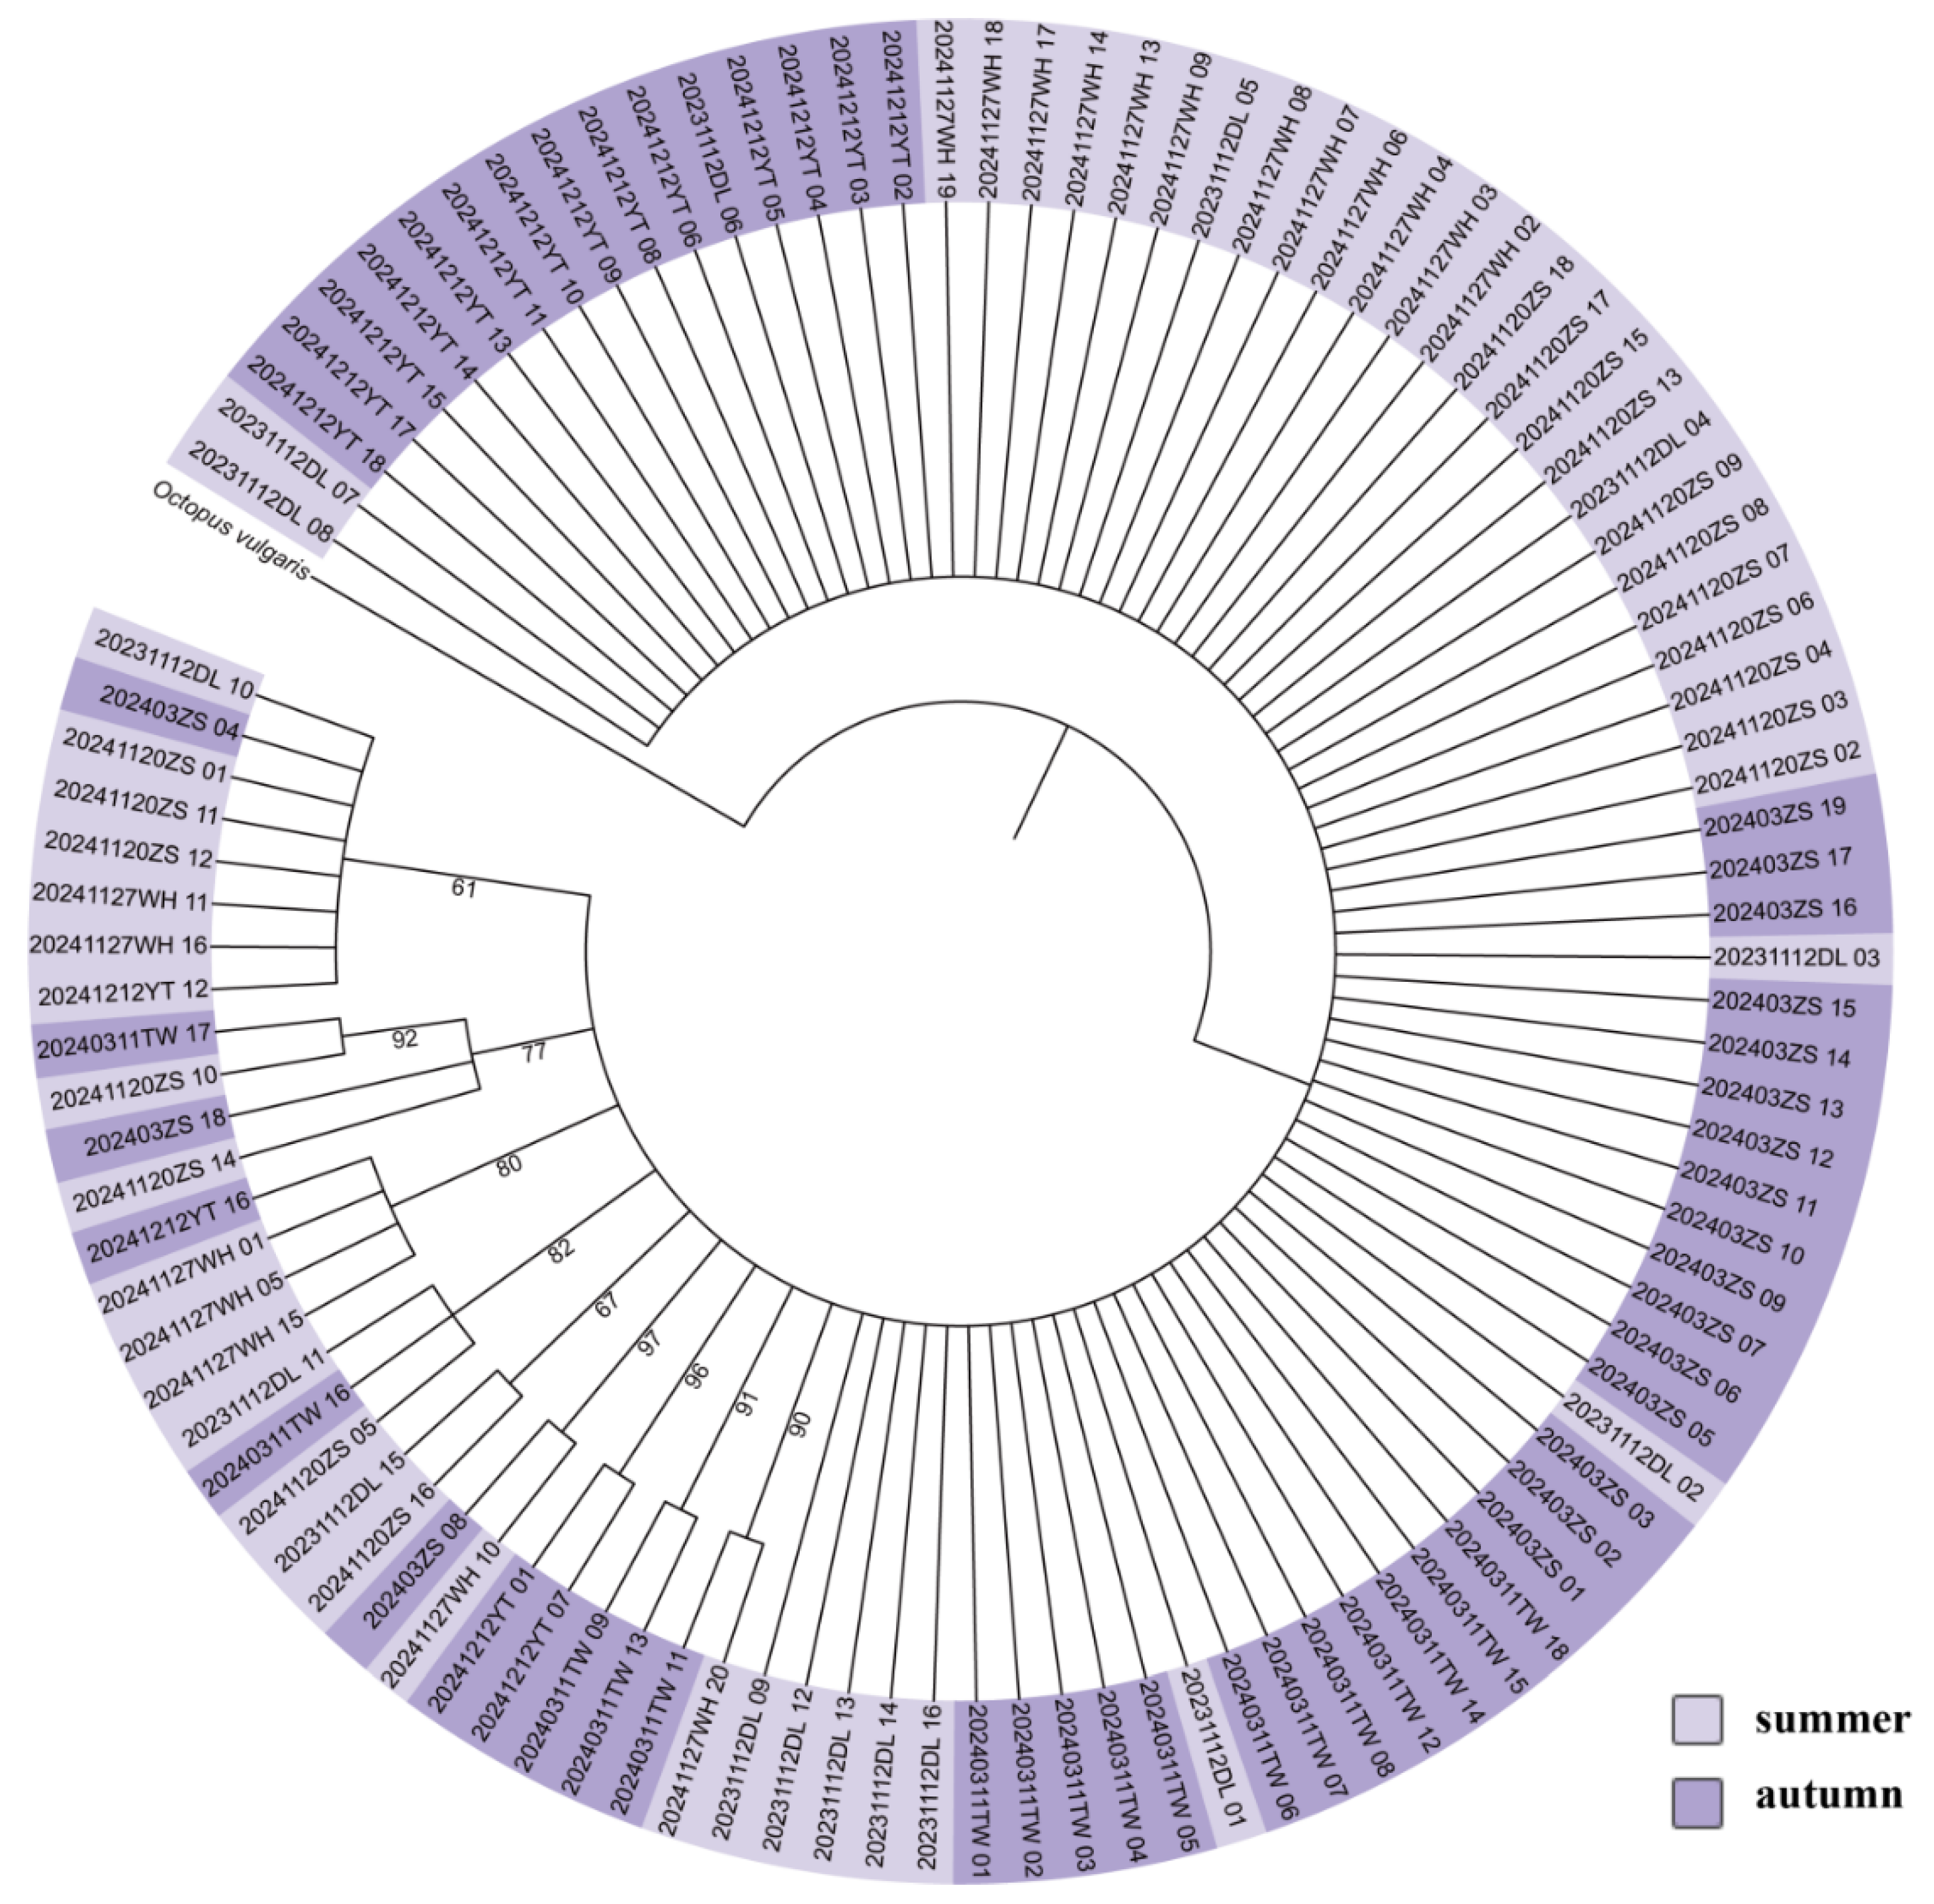
Both the trees and haplotype networks of the three genes informed no distinct branches (
Figure 2,
Figure 3 and
Figure 4). The results of the combined phylogenetic analysis of multiple genes based on the ML and BI methods were in agreement with the single-gene results (
Figure 5).
AMOVA results derived from the three genes demonstrated consistent patterns, indicating a lack of genetic differentiation among
T. pacificus populations (
p ≥0.1), and mitochondrial genes exhibited a higher proportion of variation compared to nuclear genes (
Table 4). The Fst analyses of all the genes indicated that there is almost no differentiation between autumn and summer cohorts, and the mutation mainly exists within the population (0<Fst<0.05) (
Table 5).
3.2. Statolith Morphological Analysis
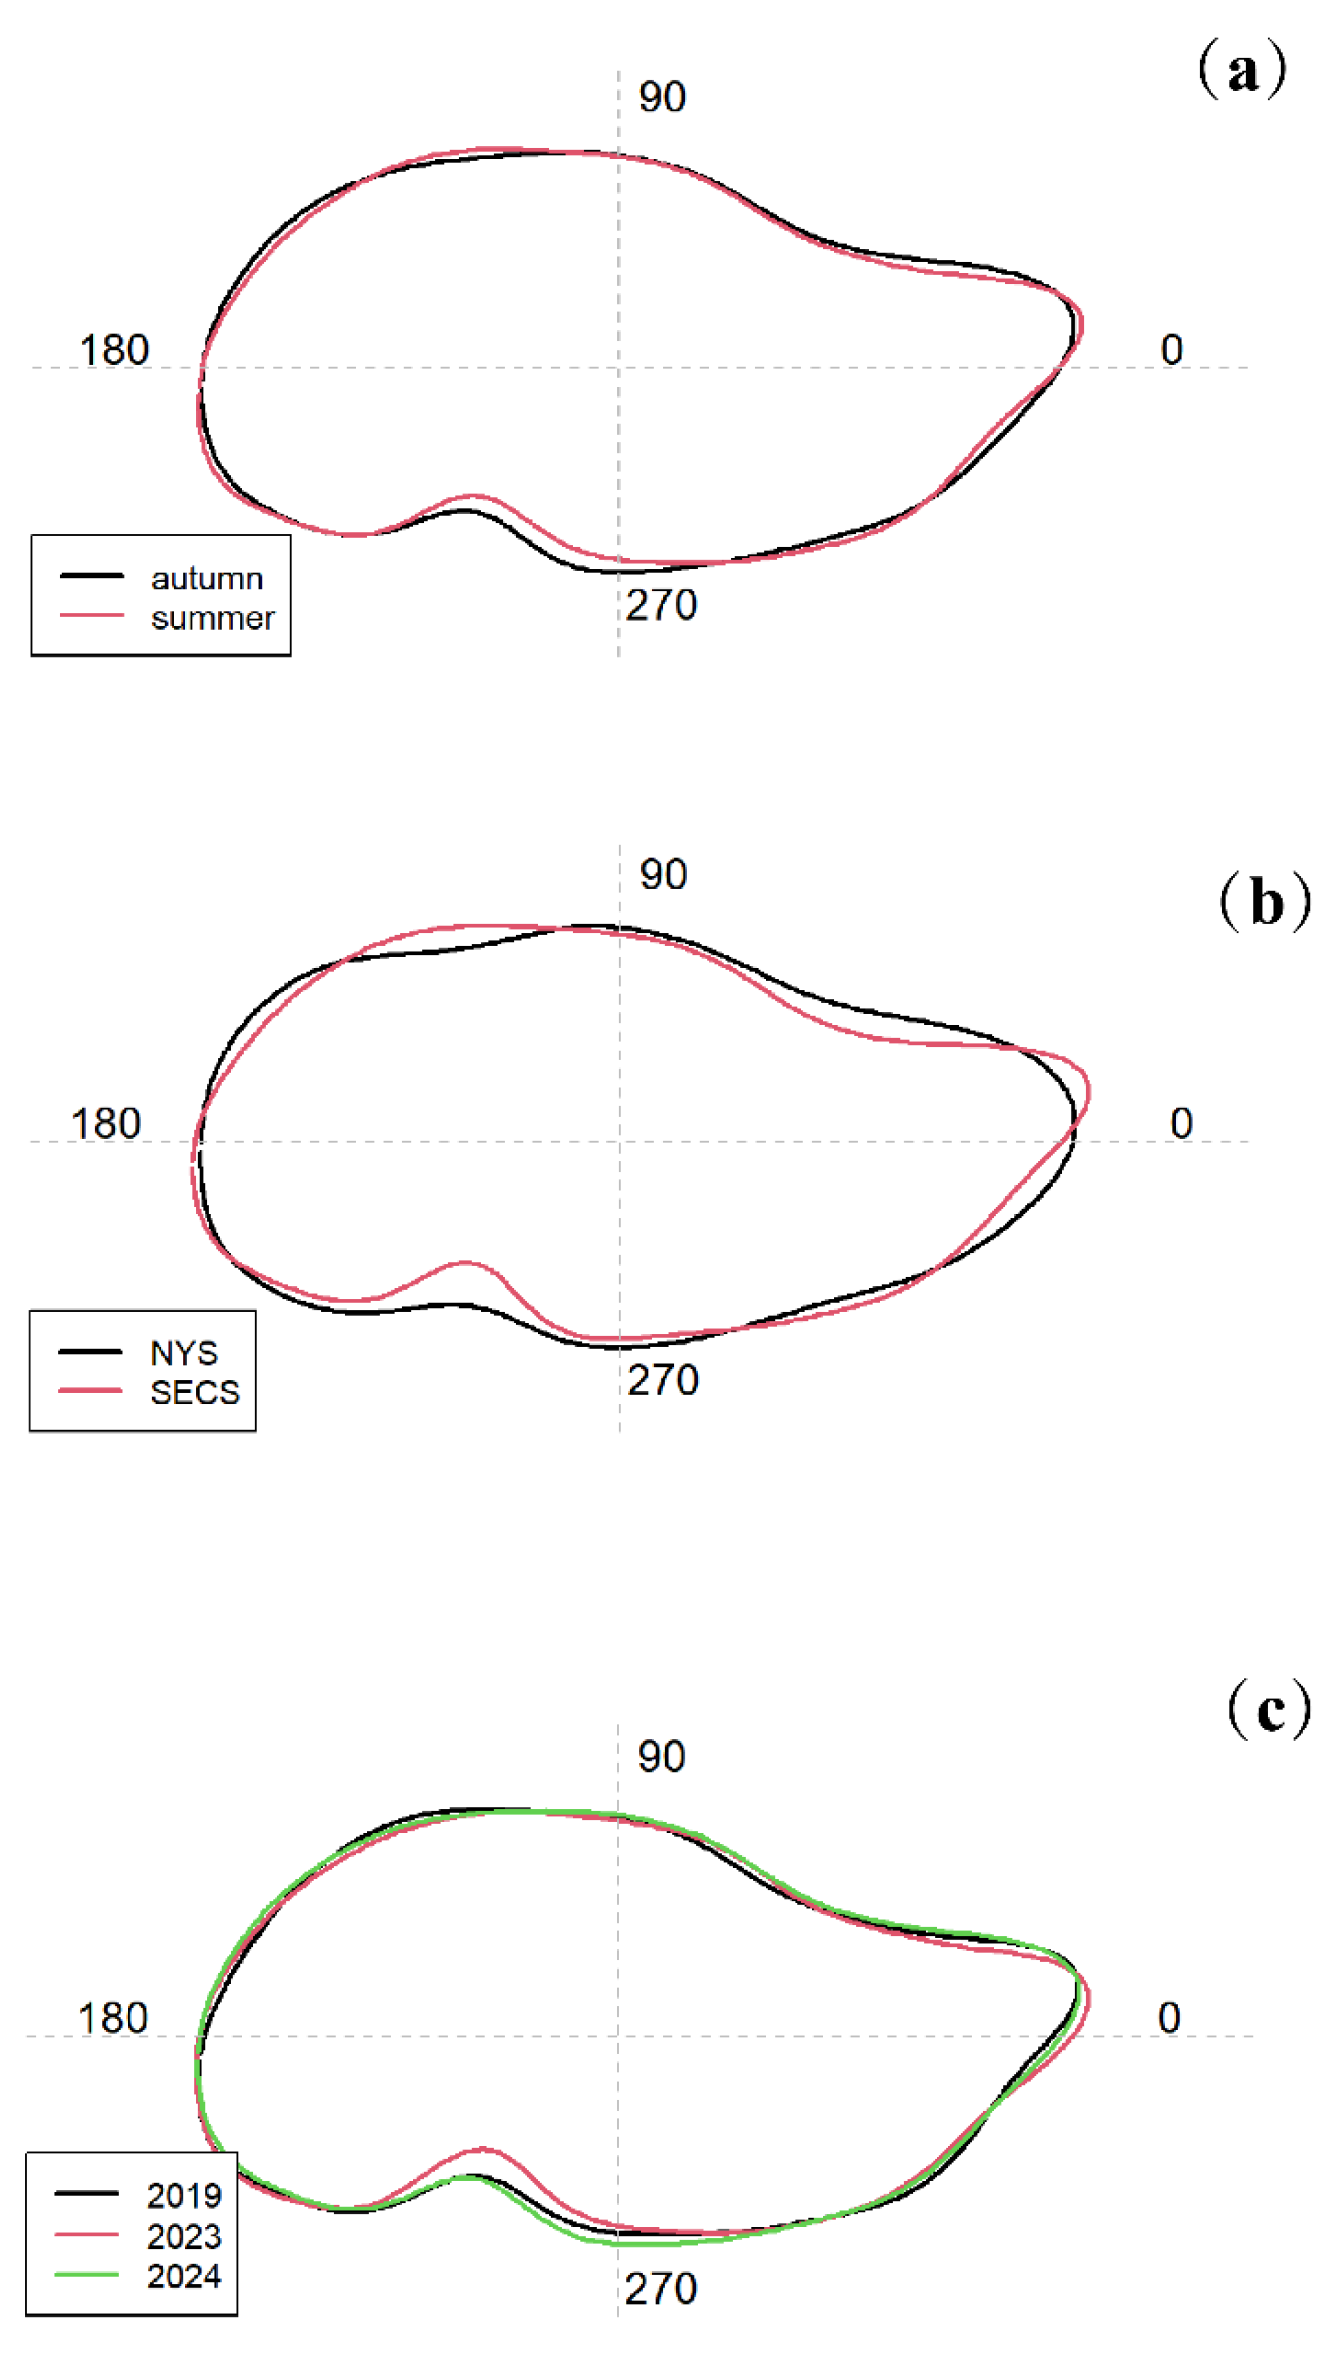
There are significant differences in the statolith morphology coefficients between summer and autumn cohorts (
p<0.01). The major morphology difference appeared in posterior indentation (
Figure 6). Random forest revealed a high discrimination success rate between cohorts (
Table 6).
Significant spatial difference in statolith morphology was only detected between NYS and SECS in autumn cohort (
p<0.01). The statolith difference appeared in overall outlines. Additionally, the average statolith outlines revealed significant differences in the rostrum and posterior indentation regions among years (
Figure 6). The statolith difference appeared in overall outlines. There are significant differences in the statolith morphology between cohorts (
p<0.01) (
Table 7).
4. Discussion
The study combines statolith with genetic analysis in
T. pacificus and provides a comprehensive insight into the population structure in the China Seas. The result of statolith microstructure first reveals the cohort composition of
T. pacificus commercially explored in China. The winter cohort, a major component, was not detected in the commercially collected specimen. The result is inconsistent with Rosa et al. [
33], only under unfavourable spawning area distribution pattern, the winter cohort would be transported more successfully into the Yellow Sea and occupy certain proportion. In contrast, despite lacking specific proportion, summer cohort contributes a more important part in China compared to Korea and Japan [
34]. Such condition should be emphasized in future management since summer cohort is a small-sized group that is more vulnerable to fishing pressure and local extinction [
35].
The results indicated that
T. pacificus has low haplotype and nucleotide diversity, with no significant genetic differentiation among different populations. This is similar to the conclusions drawn by Zhang et al. [
7] in recent years. However, there’s a big difference with results of Kim et al. [
36], who identified 49 haplotypes in all with high nucleotide diversity. This may be due to the severe decline in
T. pacificus population caused by overfishing in recent years, which has reduced genetic diversity along with the population size [
21]. In addition, this study identified only six haplotypes of the 16S gene in the Pacific umbrella squid. This is because the 16S gene in cephalopods, including the Pacific umbrella squid, may have maintained a high level of conservation over long-term evolution, resulting in fewer variable sites within the population and, consequently, lower haplotype diversity [
37].
The present study reveals relatively low genetic diversity in
T. pacificus across Chinese coastal waters, with no significant genetic differentiation detected among NECS, NYS, and SECS populations. This pattern may be closely tied to the species’ extensive migratory behavior and the geographical distribution of its spawning grounds [
38]. Pacific flying squid undertake long-distance migrations, moving between spawning, feeding, and nursery grounds throughout their life cycle. These migrations facilitate substantial gene flow among spatially separated populations, thereby preventing genetic divergence and maintaining genetic homogeneity across a broad geographical range [
39]. The spawning grounds of
T. pacificus in the Northwest Pacific Ocean serve as critical hubs for genetic exchange. The aggregation of individuals from various regions during the spawning season enhances the opportunity for genetic recombination and mixing. Subsequent larval dispersal by ocean currents further contributes to the widespread distribution of genetic material, reinforcing the genetic connectivity among different coastal populations. Similar patterns have been observed in other Ommastrephidae species.
Ommastrephes bartramii demonstrated that despite potential geographical segregation of spawning areas, high levels of gene flow occur among different populations, maintaining genetic homogeneity across the species’ range. In contrast, species with more limited dispersal capabilities or isolated spawning grounds tend to exhibit greater genetic differentiation among populations [
40].
Compared to genetic markers, significant differentiation was detected in the statolith shape, highlighting the fact that ecologically separated groups can be identified in this
T. pacificus. The statolith shape difference further emphasizes the ecological difference between summer and autumn cohorts. The high discrimination success rate between cohorts provides an effective tool for evaluating cohort composition and support effective management. Similar with fish otoliths, upon environment-induced overall outline change and genetically locally induced changes in prominent parts [
41]. Since none significant genetic structure in
T. pacificus, the observed statolith difference could be mainly resulted by environmental factors. Consistently, the major difference locates in posterior indentation, a prominent part. Because of strong swimming ability of
T. pacificus, it is difficult to track its experienced environmental factor [
9]. However, compared to significant seasonal difference, spatial difference was only observed between NYS and SECS of autumn cohort. Thus, the morphology difference could be mainly resulted by environmental conditions during early life stage [
42]. In addition, the position of oceanic fronts played an important role in restricting paralarvae distribution along the inshore edge of the Tsushima Warm Current (TWC) [
36]. Therefore, the inter annual distribution and difference result in the detected morphology difference among years.
5. Conclusions
The study combines statolith with genetic analysis in T. pacificus and provides a comprehensive insight into the population structure in the China Seas. The result of statolith microstructure first reveals the cohort composition of T. pacificus commercially explored in China. This study revealed there is almost no significant genetic differentiation among summer and autumn cohorts based on the mitochondrial genes (COI and 16S) and nuclear gene (ODH) sequences. The overall shapes of statoliths in summer and autumn cohorts are quite different, along with high classification success, could be used as a classification marker on the basis of no significant differences in genetics, providing an important reference basis for the subsequent classification and a theoretical basis for the rational development and utilization of fishery resources of T. pacificus.
Supplementary Materials
Table S1.: The primers of mitochondrial (mt) and nuclear (nu) genes. Figure. S1: Age of statolith diagram.
Author Contributions
X.Z., C.Z., Sonthaya Phuynoi,J.L. and X.L. conceptualized and designed the research framework. C.Z. was responsible for sample collection. X.L. conducted the experimental procedures and drafted the initial manuscript. X.Z.,J.L and C.Z. provided critical revisions to the paper. All authors reviewed the final manuscript and approved its submission for publication.
Funding
This work was supported by the National Natural Science Foundation of China (No.32170536).
Institutional Review Board Statement
All experiments were approved by the Institutional Animal Care and Use Committee of Ocean University of China.
Informed Consent Statement
Not applicable.
Data Availability Statement
The data that support the findings of this study are available on request from the corresponding author. The data are not publicly available due to privacy or ethical restrictions.
Acknowledgments
The authors thank Mr. Junding Wang, Mr.Yanyu Chen and Mr. Jingrui Qu for their great assistance in sample collection.
Conflicts of Interest
The authors declare no conflicts of interest.
References
- Caddy, J.F. P.G. Rodhouse, Cephalopod and groundfish landings: evidence for ecological change in global fisheries? Rev. Fish Biol. Fish. 1998, 8(4), 431–444. [Google Scholar] [CrossRef]
- FAO. The state of world fisheries and aquaculture 2020. In The State of World Fisheries and Aquaculture (SOFIA); FAO: Rome, Italy, 2020; p. 244. [Google Scholar]
- Hohenegger, J. Species as the basic units in evolution and biodiversity: recognition of species in the recent and geological past as exemplified by larger foraminifera. Gondwana Res. 2014, 25(2), 707–728. [Google Scholar] [CrossRef]
- Zheng, X.D.; Lv, Y.H.; Lu, C.C. Species diversity of cephalopods in the China seas. J. Ocean Univ. China. 2023, 53(9), 1–18. [Google Scholar]
- Guo, J.Z. Latitudinal difference in the condition factor of two loliginidae squid (beka squid and indian squid) in China seas. Diversity 2023, 15(7), 812. [Google Scholar] [CrossRef]
- Komai, T. Todarepsin, a new cathepsin D from hepatopancreas of Japanese common squid (Todarodes pacificus). Comparative Biochemistry and Physiology Part B: Biochem. Mol. Biol. 2004, 137(3), 373–382. [Google Scholar] [CrossRef]
- Zhang, Q. Genetic variation and genetic structure analysis of todarodes pacificus based on mitochondrial DNA markers. J. Shanghai Ocean Univ. 2021, 30(4), 763–769. [Google Scholar]
- Xu, M. Seasonal Analysis of Spatial Distribution Patterns and Characteristics of Sepiella maindroni and Sepia kobiensis in the East China Sea Region. Animals 2024, 14(18). [Google Scholar] [CrossRef]
- Ching, T.-Y. Variations in life-history traits and statolith shape for sepioteuthis spp. in the waters off southwestern japan. Rev. Fish Biol. Fish. 2021, 87(2), 173–185. [Google Scholar] [CrossRef]
- Raj, N. Population genetic structure of randall’s threadfin bream nemipterus randalli in indian waters based on mitochondrial and nuclear gene sequences. Sci. Rep. 2024, 14(1), 7556. [Google Scholar] [CrossRef]
- Xu, R.; Bo, Q.K.; Zheng, X.D. A divergent lineage among octopus minor (sasaki, 1920) populations in the northwest pacific supported by DNA barcoding. Mar. Biol. Res. 2018, 14(4), 335–344. [Google Scholar] [CrossRef]
- Wang, X.R. Population genetic structure and phylogenetic relationships reveal cryptic biodiversity in the uroteuthis (photololigo) duvaucelii (cephalopoda: loliginidae) species complex. Hydrobiologia 2025, 852(11), 2957–2970. [Google Scholar] [CrossRef]
- Graybeal, A. Evaluating the phylogenetic utility of genes: a search for genes informative about deep divergences among vertebrates. Systematic Biology 1994, 43(2), 174–193. [Google Scholar] [CrossRef]
- Arkhipkin, A. Statoliths as ‘black boxes’ (life recorders) in squid. Mar. Freshw. Res. 2005, 56(5), 573–583. [Google Scholar] [CrossRef]
- Takagi, K.; Kitahara, T. Bias in age estimation of japanese common squid due to grinding degree of statoliths. Nippon Suisan Gakk. 2002, 68(3), 351–355. [Google Scholar] [CrossRef]
- Winnepenninckx, B. T. Backeljau, and R. De Wachter, Extraction of high molecular weight DNA from molluscs. Trends Genet. 1993, 9(12), 407. [Google Scholar]
- Swindell, S.R.; Plasterer, T.N.; Seqman, *!!! REPLACE !!!*. Sequence Data Analysis Guidebook; Springer New York: Totowa, NJ, 1997; pp. 75–89. [Google Scholar]
- Tamura, K.; Stecher, G.; Kumar, S. MEGA11: molecular evolutionary genetics analysis version 11. Mol. Biol. Evol. 2021, 38(7), 3022–3027. [Google Scholar] [CrossRef]
- Rozas, J. DnaSP 6: DNA sequence polymorphism analysis of large data sets. Mol. Biol. Evol. 2017, 34(12), 3299–3302. [Google Scholar] [CrossRef] [PubMed]
- Leigh, J.W.; Bryant, D. popart: full-feature software for haplotype network construction. Methods Ecol. Evol. 2015, 6(9), 1110–1116. [Google Scholar] [CrossRef]
- Lv, H.Y.; Wang, J.T.; Zhang, C. Stock assessment of the winter-born group of todarodes pacificus based on sea surface temperature at spawning grounds. J. Shanghai Ocean Univ. 2022, 31(3), 650–657. [Google Scholar]
- Tajima, F. Statistical method for testing the neutral mutation hypothesis by DNA polymorphism. Genetics 1989, 123(3), 585–595. [Google Scholar] [CrossRef] [PubMed]
- Fu, Y.X. Statistical tests of neutrality of mutations against population growth, hitchhiking and background selection. Genetics 1997, 147(2), 915–925. [Google Scholar] [CrossRef]
- Excoffier, L.; Lischer, H.E. Arlequin suite ver 3.5: a new series of programs to perform population genetics analyses under linux and windows. Mol. Ecol.Resour 2010, 10(3), 564–7. [Google Scholar] [CrossRef]
- Zhang, D. PhyloSuite: an integrated and scalable desktop platform for streamlined molecular sequence data management and evolutionary phylogenetics studies. Mol. Ecol. Resour. 2020, 20(1), 348–355. [Google Scholar] [CrossRef]
- Kalyaanamoorthy, S. ModelFinder: fast model selection for accurate phylogenetic estimates. Gondwana Res. 2017, 14(6), 587–589. [Google Scholar] [CrossRef]
- Nguyen, L.T. IQ-TREE: a fast and effective stochastic algorithm for estimating maximum-likelihood phylogenies. Mol.r Biol. Evol. 2015, 32(1), 268–74. [Google Scholar] [CrossRef] [PubMed]
- Ronquist, F. MrBayes 3.2: efficient bayesian phylogenetic inference and model choice across a large model space. Syst. Biol. 2012, 61(3), 539–42. [Google Scholar] [CrossRef]
- Han, P.W. Review on cephalopoda migration characteristics based on the microchemistry technology of hard tissues. J. Guangdong Ocean Univ. 2021, 41(4), 142–152. [Google Scholar]
- Markaida, U.; Quiñónez-Velázquez, C.; Sosa-Nishizaki, O. Age, growth and maturation of jumbo squid dosidicus gigas (cephalopoda: ommastrephidae) from the gulf of california, mexico. Fish. Res. 2004, 66(1), 31–47. [Google Scholar] [CrossRef]
- Libungan, L.A.; Palsson, S. ShapeR: an R package to study otolith shape variation among fish populations. PLoS ONE 2015, 10(3), e0121102. [Google Scholar] [CrossRef]
- Breiman, L.; Last, M.; Rice, J. Random forests: finding quasars. In Statistical Challenges in Astronomy; Springer: New York, NY, 2003; pp. 243–254. [Google Scholar]
- Rosa, A.L.; Yamamoto, J.; Sakurai, Y. Effects of environmental variability on the spawning areas, catch, and recruitment of the japanese common squid, todarodes pacificus (cephalopoda: ommastrephidae), from the 1970s to the 2000s. ICES J. Mar. Sci. 2011, 68(6), 1114–1121. [Google Scholar] [CrossRef]
- Yu, W. Climate-related variations in autumn cohort of japanese common squid todarodes pacificus. J. Ocean Univ. China. 2023, 22(2), 490–500. [Google Scholar] [CrossRef]
- Yu, W. Response of winter cohort abundance of japanese common squid todarodes pacificus to the ENSO events. Acta Oceanol. Sin. 2018, 37(6), 61–71. [Google Scholar] [CrossRef]
- Kim, J. Morphological and genetic stock identification of todarodes pacificus in korean waters. J. Korean Soc. Oceanogr. Sea. 2013, 18(3), 131–141. [Google Scholar] [CrossRef]
- Martinez-Porchas, M. How conserved are the conserved 16S-rRNA regions? PeerJ 2017, 5, e3036. [Google Scholar] [CrossRef] [PubMed]
- Arai, N. Strontium:calcium ratios in statoliths of japanese common squid todarodes pacificus (cephalopoda: ommastrephidae) as indicators of migratory behavior. Mar. Ecol. Prog. Ser. 2003, 251, 169–179. [Google Scholar] [CrossRef]
- Kidokoro, H. Impact of a climate regime shift on the migration of japanese common squid (todarodes pacificus) in the sea of Japan. ICES J. Mar. Sci. 2010, 67(7), 1314–1322. [Google Scholar] [CrossRef]
- Bower, J.R.; Ichii, T. The red flying squid (ommastrephes bartramii): a review of recent research and the fishery in Japan. Fish. Res. 2005, 76(1), 39–55. [Google Scholar] [CrossRef]
- Dommergues, J.L.; Neige, P.; Boletzky, S.V. Exploration of morphospace using procrustes analysis in statoliths of cuttlefish and squid (cephalopoda: decabrachia) - evolutionary aspects of form disparity. Veliger. 2000, 43(3), 265–276. [Google Scholar]
- Yamaguchi, T. Quantitative relationship of Sr:Ca of statoliths of the japanese flying squid (todarodes pacificus) with empirical water temperatures. J. Mar. Biol. Assoc. U.K. 2025, 105, e14. [Google Scholar] [CrossRef]
- Palumbi, S.M., A.; Romano, S.; McMillan, W.O.; Stice, L.; Grabowski, G., The Simple Fool’s Guide to PCR. Dept. Zool. Spec. Publ. 1991.
- Wang, X.R.; Zhang, C.; Zheng, X.D. Integrated Genetic and Statolith Shape Analysis Reveals the Population Structure of Loliolus (Nipponololigo) uyii (Cephalopoda: Loliginidae) in the Coastal Waters of China. Diversity 2024, 16, 674. [Google Scholar] [CrossRef]
Figure 1.
The sampling map for T. pacificus from different locations. The green rectangles represent the northern part of the Yellow Sea, the yellow triangles represent the eastern part of the East China Sea, and the red circles represent the southern part of the East China Sea.
Figure 1.
The sampling map for T. pacificus from different locations. The green rectangles represent the northern part of the Yellow Sea, the yellow triangles represent the eastern part of the East China Sea, and the red circles represent the southern part of the East China Sea.
Figure 2.
Maximum likelihood (ML) phylogenetic tree and haplotype network of T. pacificus based on COI haplotypes. Branch numbers are bootstraps (left) and posterior probability (right). Black dots represent hypothetical missing intermediates.
Figure 2.
Maximum likelihood (ML) phylogenetic tree and haplotype network of T. pacificus based on COI haplotypes. Branch numbers are bootstraps (left) and posterior probability (right). Black dots represent hypothetical missing intermediates.
Figure 3.
Maximum likelihood (ML) phylogenetic tree and haplotype network of T. pacificus based on 16S haplotypes. Branch numbers are bootstraps (left) and posterior probability (right). Black dots represent hypothetical missing intermediates.
Figure 3.
Maximum likelihood (ML) phylogenetic tree and haplotype network of T. pacificus based on 16S haplotypes. Branch numbers are bootstraps (left) and posterior probability (right). Black dots represent hypothetical missing intermediates.
Figure 4.
Maximum likelihood (ML) phylogenetic tree and haplotype network of T. pacificus based on ODH haplotypes. Branch numbers are bootstraps (left) and posterior probability (right). Black dots represent hypothetical missing intermediates.
Figure 4.
Maximum likelihood (ML) phylogenetic tree and haplotype network of T. pacificus based on ODH haplotypes. Branch numbers are bootstraps (left) and posterior probability (right). Black dots represent hypothetical missing intermediates.
Figure 5.
Phylogenetic trees constructed using the concatenation of mitochondrial and nuclear genes. The numbers in each node represent bootstraps of maximum likelihood (ML) and posterior probabilities of Bayesian inference (BI) analyses, respectively. Lavender represents the summer population and purple represents the autumn population.
Figure 6.
Reconstructed statolith outlines for different cohorts (a), different regions in autumn (b) and different years in summer (c).
Figure 6.
Reconstructed statolith outlines for different cohorts (a), different regions in autumn (b) and different years in summer (c).
Table 1.
Statolith and genetic samples data for T. pacificus in the China Seas.
Table 1.
Statolith and genetic samples data for T. pacificus in the China Seas.
| |
Region |
Number of analyzed individuals |
Cohort composition(Summer:Autumn)
|
Sampling time |
Mantle length range/mm |
| |
|
48 |
48:0 |
2019.11 |
162~204 |
| |
NYS |
26 |
26:0 |
2023.11 |
235~305 |
| |
|
68 |
68:0 |
2024.11 |
160~320 |
| Statolith samples |
|
51 |
0:51 |
2024.12
|
150~317 |
| |
NECS |
24 |
0:24 |
2024.3 |
205~280 |
| |
|
49 |
49:0 |
2024.11 |
215~296 |
| |
|
|
|
|
|
| |
SECS |
60 |
0:60 |
2024.3 |
165~283 |
| |
NYS |
20
20 |
20:0
20:0 |
2023.11
2024.11 |
235~305
160~320 |
| |
|
20 |
0:22 |
2024.12 |
150~317 |
| |
|
|
|
|
|
| Genetic samples |
NECS |
20 |
0:20 |
2024.3 |
216~296 |
| |
|
20 |
20:0 |
2024.11 |
215~296 |
| |
|
|
|
|
|
| |
SECS |
20 |
0:20 |
2024.3 |
165~284 |
Table 2.
Molecular characterization based on mitochondrial and nuclear gene sequences.
Table 2.
Molecular characterization based on mitochondrial and nuclear gene sequences.
| Mt/Nu. |
Gene |
Length/bp |
T/% |
C/% |
A/% |
G/% |
A+T/% |
G+C/% |
S |
Proportion
of Variable
Sites/%
|
| Mt |
COI |
439 |
43.20 |
20.86 |
21.49 |
15.36 |
63.79 |
36.22 |
15 |
3.36 |
| Mt |
16S |
458 |
26.58 |
0.00 |
48.42 |
25.00 |
75.00 |
25.00 |
4 |
0.88 |
| Nu |
ODH |
517 |
28.13 |
31.30 |
26.63 |
13.93 |
54.76 |
45.23 |
106 |
20.58 |
Table 3.
The genetic diversity indices for different seasons of Todarodes pacificus.
Table 3.
The genetic diversity indices for different seasons of Todarodes pacificus.
| Group |
|
COI |
|
|
|
16s |
|
|
|
ODH |
|
|
| |
N |
Hap |
Hd |
π |
N |
Hap |
Hd |
π |
N |
Hap |
Hd |
π |
| summer |
59 |
9 |
0.4610 |
0.0014 |
55 |
3 |
0.230 |
0.0005 |
57 |
12 |
0.6020 |
0.0020 |
| autumn |
58 |
11 |
0.4740 |
0.0013 |
55 |
4 |
0.109 |
0.0002 |
56 |
13 |
0.6070 |
0.0059 |
| Total |
117 |
18 |
0.4650 |
0.0013 |
110 |
6 |
0.171 |
0.0004 |
113 |
21 |
0.6010 |
0.0053 |
Table 4.
AMOVA analysis of T. pacificus populations based on mitochondrial and nuclear gene sequences.
Table 4.
AMOVA analysis of T. pacificus populations based on mitochondrial and nuclear gene sequences.
| Gene |
Source of
Variation
|
df |
Sum of squares |
Variance
Component
|
Percentage of
Variation (%)
|
F Statistic |
| |
Among populations |
2 |
0.463 |
-0.00280 Va |
-0.85 |
FST : -0.00853 (P-value = 0.83187+-0.01114) |
| COI |
Within populations |
114 |
37.811 |
0.33167 Vb |
100.85 |
|
| |
Total |
116 |
38.274 |
0.32887 |
100 |
|
| |
|
|
|
|
|
|
| |
Among populations |
2 |
0.203 |
-0.00066 Va |
-0.54 |
FST : -0.00537
(P-value = 0.57478+-0.01351) |
| 16S |
Within populations |
107 |
13.251 |
0.12385 Vb |
100.54 |
|
| |
Total |
109 |
13.455 |
0.12385 Vb |
100 |
|
| |
|
|
|
|
|
|
| |
Among populations |
2 |
1.133 |
0.00080 Va |
0.15 |
|
| ODH |
Within populations |
111 |
59.815 |
0.53887 Vb |
99.85 |
FST : 0.00148
(P-value = 0.37634+-0.01613) |
| |
Total |
113 |
60.947 |
0.53967 |
100 |
|
Table 5.
Fst between populations of T. pacificus based on COI, 16S, ODH genes for different seasons.
Table 5.
Fst between populations of T. pacificus based on COI, 16S, ODH genes for different seasons.
| |
Groups |
autumn |
summer |
| |
autumn |
0.00000 |
|
| COI |
summer |
0.00291 |
0.00000 |
| |
|
|
|
| |
autumn |
0.00000 |
|
| 16S |
summer |
0.03191 |
0.00000 |
| |
|
|
|
| |
autumn |
0.00000 |
|
| ODH |
summer |
0.00075 |
0.00000 |
Table 6.
Out-of-Bag (OOB) estimation matrix of the random forest among the three seasons in BBG.
Table 6.
Out-of-Bag (OOB) estimation matrix of the random forest among the three seasons in BBG.
| Season |
autumn |
summer |
Classification Success Rate (%) |
| autumn |
119 |
21 |
85.00 |
| summer |
10 |
182 |
94.79 |
Table 7.
Results of Variance analysis on T. pacificus in different seasons based on the statolith shape coefficient.
Table 7.
Results of Variance analysis on T. pacificus in different seasons based on the statolith shape coefficient.
| Groups |
p |
Sw/Sl |
Ssa |
| autumn |
|
0.5710 |
1763.0060 |
| summer |
|
0.5483 |
1706.8217 |
| summer VS autumn |
1.351e-10 * |
5.342e-06 * |
0.09057 |
|
Disclaimer/Publisher’s Note: The statements, opinions and data contained in all publications are solely those of the individual author(s) and contributor(s) and not of MDPI and/or the editor(s). MDPI and/or the editor(s) disclaim responsibility for any injury to people or property resulting from any ideas, methods, instructions or products referred to in the content. |
© 2025 by the authors. Licensee MDPI, Basel, Switzerland. This article is an open access article distributed under the terms and conditions of the Creative Commons Attribution (CC BY) license (http://creativecommons.org/licenses/by/4.0/).