Submitted:
24 December 2025
Posted:
25 December 2025
Read the latest preprint version here
Abstract
Wearable human activity recognition (HAR) systems increasingly rely on deep neural networks that achieve high accuracy but provide little insight into sensor contributions, posing barriers to clinical deployment and hardware optimization. Specifically, practitioners lack principled methods to determine which sensors are essential for recognition, how different activities depend on different sensor modalities, and whether learned representations align with biomechanical knowledge. While explainable AI (XAI) techniques have been adapted to HAR, existing approaches predominantly employ single methods that risk method-specific biases and analyze importance at inappropriate granularities for practical sensor selection. We address these limitations through a comprehensive multi-method XAI framework that systematically integrates counterfactual sensor-group ablation, Integrated Gradients (IG), and Shapley Value Sampling. These complementary XAI tools are applied to identify the most relevant sensors and temporal patterns driving model predictions. Our framework operates on a Time-Distributed LSTM achieving 98.2% accuracy on the MHEALTH dataset, comprising 12 activities recorded via eight sensor groups (accelerometers, gyroscopes, magnetometers, ECG) distributed across chest, ankle, and wrist locations. We perform four coordinated experiments analyzing model behavior at global, sensor-group, and per-class levels. Counterfactual ablation reveals that removing the ankle magnetometer causes catastrophic performance degradation in dynamic locomotion (ΔAcc = 47.1%), while removing the wrist accelerometer severely impacts static postures (ΔProb > 50%). Class-specific IG heatmaps and temporal attribution curves expose biomechanically plausible, activity-dependent sensor signatures. Global IG and Shapley rankings demonstrate strong cross-method agreement, with accelerometers dominating importance (89% of total attribution). These sensor-group-level explanations yield actionable guidance for sensor selection, power-efficient deployment, and clinically interpretable HAR systems without compromising classification performance.
Keywords:
human activity recognition
; explainable artificial intelligence
; wearable sensors
; integrated gradient
; Shapley values
1. Introduction
Human activity recognition (HAR) using wearable sensors has emerged as a cornerstone technology for applications in healthcare monitoring [1], smart home assistance [2], fitness tracking [3], and rehabilitation assessment [4]. The proliferation of low-cost inertial measurement units (IMUs) and physiological sensors in consumer devices enables continuous, unobtrusive monitoring of human activities in natural environments. Recent advances in deep learning have dramatically improved recognition accuracy, with convolutional and recurrent architectures achieving near-human performance on public benchmarks [5,6].
However, these performance gains come at the cost of reduced interpretability. Deep neural networks typically operate as black boxes, returning predictions without exposing the reasoning behind their decisions. In safety-critical HAR applications—such as clinical diagnostics [7], elderly fall prevention [8], and rehabilitation monitoring [9]—this opacity poses a major barrier to deployment. Practitioners need not only accurate predictions, but also explanations that are consistent with biomechanical and clinical knowledge in order to trust the model, identify failure modes, and design appropriate interventions [10]. At the same time, multi-sensor wearable systems combining accelerometers, gyroscopes, magnetometers, and physiological signals at multiple body locations raise practical design questions: Which sensors are truly essential for high recognition performance? Can some modalities be removed to reduce cost and power consumption? Do different activities rely on different subsets of sensors?
These questions have motivated a growing body of work on explainable artificial intelligence (XAI) for HAR [11,12]. Popular XAI methods such as LIME [13], SHAP [14], and gradient-based attributions [15] have been adapted from computer vision and NLP to the time-series domain. However, sensor-based HAR poses specific challenges: multivariate time series are high-dimensional and abstract, sensor streams from different body locations interact in complex ways, and explanations must be meaningful both at fine temporal resolution and at the level of hardware components.
Existing XAI research for HAR has mainly pursued single-method explanations, such as attention visualization [16,17], LIME/SHAP-based feature weighting [18,19], or gradient-based saliency maps [20]. While these studies provide valuable insights, they exhibit four key limitations that restrict their usefulness for real-world multi-sensor systems.
First, relying on a single XAI technique risks method-specific biases. Comparative analyses show that different explanation methods may produce divergent feature importance rankings on the same model and dataset [18]. Without cross-method validation, it is unclear whether observed patterns reflect genuine model behaviour or artifacts of the chosen method.
Second, most work analyzes importance either at the level of individual channels (e.g., “ankle accelerometer X-axis”) or entire body locations (e.g., “wrist sensors”). For hardware design and deployment, however, decisions are made at the level of functional sensor groups: accelerometer vs. gyroscope vs. magnetometer vs. ECG at a given body location. Systematic, sensor-group-level analyses that quantify the contribution of each modality–location combination remain scarce, despite their direct relevance to cost, power, and form-factor constraints.
Third, many studies focus on global, dataset-wide importance rankings and provide limited insight into activity-specific patterns. However, activities with distinct biomechanics—such as “climbing stairs” versus “cycling”—are expected to rely on different sensor groups and different movement phases. Per-class explanations are crucial to assess whether learned representations align with biomechanical intuition and to support activity-adaptive sensor configurations.
Fourth, and most fundamentally, reported feature importance is rarely validated through causal analysis. Most XAI studies for HAR report saliency or importance scores but do not verify whether removing the highlighted sensors actually degrades performance. Counterfactual ablation—systematically masking sensor groups and measuring changes in accuracy and confidence—remains underutilized, and when it is used, the analysis is typically limited to global accuracy drops, without examining per-class or probability-level effects.
To address these limitations, we propose a comprehensive, multi-method XAI framework for multi-sensor wearable HAR. Our framework operates on a strong baseline classifier—a Time-Distributed LSTM (TD–LSTM)—trained on the MHEALTH dataset [21], which comprises 12 diverse activities recorded via eight sensor groups (accelerometers, gyroscopes, magnetometers, and ECG) distributed across chest, ankle, and wrist locations. The framework is organized into four coordinated experiments that jointly analyze the model at global, sensor-group, and per-class levels:
- Experiment 1: Multi-level counterfactual ablation. We remove each of the eight sensor groups in turn and quantify (i) global accuracy degradation, (ii) per-class accuracy changes, and (iii) probability shifts for correctly classified samples. This experiment provides causal evidence of sensor importance and reveals activity-specific and confidence-level effects.
- Experiment 2: Per-class Integrated Gradients attributions. We compute Integrated Gradients (IG) for all 12 activities, yielding (i) channel-level time–feature heatmaps and (ii) temporal sensor-group attribution curves. These visualisations expose which sensor groups and time segments drive predictions for each activity, enabling biomechanically grounded interpretation.
- Experiment 3: Global IG sensor-group ranking. We aggregate IG attributions across the test set to obtain a dataset-wide ranking of sensor groups, providing a global view of how the TD–LSTM distributes importance across modalities and body locations.
- Experiment 4: Shapley Value validation. We apply Shapley Value Sampling to derive an independent, model-agnostic global importance ranking. Comparing Shapley and IG rankings allows us to validate the stability of conclusions across gradient-based and game-theoretic perspectives.
Together, these experiments yield a coherent picture of model behaviour that is later substantiated in our empirical results, discussion, and conclusion: ankle magnetometer and accelerometer signals are functionally indispensable for dynamic locomotion, wrist accelerometry is crucial for static postures and upper-body movements, chest accelerometry supports posture-related activities, and physiological ECG signals play only a minor role for the considered tasks. Importantly, the agreement between counterfactual, gradient-based, and game-theoretic explanations provides strong evidence that the identified sensor groups are genuinely critical for the TD–LSTM’s decisions, rather than artifacts of a particular XAI method.
The main contributions of this paper are threefold:
- We introduce, to the best of our knowledge, the first multi-method XAI framework for wearable HAR that jointly employs counterfactual ablation, IG, and Shapley Value Sampling on a common TD–LSTM backbone. This design enables systematic cross-validation of explanations across complementary theoretical paradigms.
- We provide a sensor-group-level analysis that connects XAI outputs directly to hardware components. Our multi-level counterfactual study quantifies not only global accuracy drops but also per-class and probability-level degradation when individual sensor groups are removed, yielding actionable guidance for sensor selection and pruning.
- We deliver a comprehensive per-class interpretability study on the MHEALTH dataset, combining IG heatmaps and temporal sensor-group curves with global IG and Shapley rankings. The resulting, biomechanically plausible patterns support concrete design recommendations for resource-constrained HAR deployments and illustrate how multi-method XAI can bridge the gap between model internals and domain knowledge.
The remainder of this paper is organized as follows. Section 2 reviews related work in explainable HAR and situates our framework within the broader XAI literature. Section 3 details the MHEALTH dataset, preprocessing pipeline, TD–LSTM architecture, sensor-group definitions, and the four explainability experiments based on counterfactual ablation, Integrated Gradients, and Shapley Value Sampling. Section 4 reports the baseline classification performance and presents the empirical results of all four experiments. Section 5 interprets these findings in terms of biomechanics, sensor selection and deployment, and methodological implications, and discusses limitations and avenues for extension. Finally, Section 6 summarizes the main insights and contributions and outlines directions for future research in explainable multi-sensor wearable HAR.
2. Related Work
The need for XAI in HAR has gained broad recognition as HAR systems move into safety-critical domains [2,11]. Recent comprehensive surveys have systematically analyzed the importance, use domains, and challenges of XAI across various applications [22], highlighting the need for transparent and interpretable models in healthcare and monitoring systems. Traditional black-box deep learning models offer high accuracy but little transparency, prompting researchers to devise methods that clarify model decisions to end-users and domain experts. For example, Huang et al. note that popular explanation techniques from computer vision (e.g., Grad-CAM, attention heatmaps) are not directly intuitive for sensor-based HAR due to the data’s abstract, time-series nature [12]. Thus, recent work spans both intrinsically interpretable models and post-hoc explanation tools tailored for HAR.
One line of research integrates interpretability into the model architecture itself. Attention mechanisms are a common approach—by design, they highlight which sensor signals or time steps most influence the prediction. Ma et al.’s AttnSense model (IJCAI 2019) combined CNN and RNN layers with a multi-level attention module, enabling prioritized sensor selection in multimodal HAR and thereby improving the model’s comprehensibility [16]. Similarly, Matthew et al. [23] visualized attention weights in a state-of-the-art HAR network (MSANet) to show how the model dynamically focuses on different sensors over time. This intrinsic interpretability helps diagnose failures and build user trust [23]. Beyond attention, some works introduce inherently explainable architectures. Notably, Jeyakumar et al. proposed X-CHAR, a concept-based HAR model that outputs a sequence of high-level sub-activity concepts for each recognition [24]. By forgoing precise low-level annotations, X-CHAR provides human-understandable explanations (e.g., `making a sandwich” explained via steps like `reaching for bread”) for complex activities. These approaches embed domain knowledge or structure into the model so that explanations are produced as part of the prediction.
Another major direction is post-hoc feature attribution applied to HAR models. Here, a trained model is taken as a black box, and tools like saliency maps, Shapley values, and occlusion analysis are used to explain its predictions. Novel frameworks integrating statistical, visual, and rule-based XAI methods have been proposed for medical image classification, demonstrating the value of multi-method explanations [25]. Similarly, Ullah et al. [26] enhanced explainability in brain tumor detection using LIME, while multi-dataset integration approaches have addressed clinical gaps in disease classification through occlusion sensitivity analysis [27]. For HAR specifically, Mekruksavanich and Jitpattanakul [28] integrated a squeeze-and-excitation network and applied Grad-CAM to highlight essential sensor signals influencing each prediction. This helped identify which body-worn sensor axes were most important for classifying a given activity. In video or vision-based activity recognition, analogous saliency methods have been used—Zhou et al. (2021) introduced Salience-CAM to visualize critical frames or joints in an activity sequence by measuring output sensitivity to the input [12]. Other work has leveraged Shapley additive explanations (SHAP) [14] and related game-theoretic techniques. Tempel et al. [29] applied SHAP to a graph-based HAR model (GCN on skeleton data) and identified the key body joints for each action. By systematically perturbing those joints, they confirmed that the joints with highest SHAP values caused the biggest drops in accuracy when disturbed, validating that the SHAP explanations truly captured important features [29].
In the specific domain of wearable sensor data analytics, Abdelaal et al. [30] conducted a systematic literature review exploring various XAI applications, providing a comprehensive overview of current practices and gaps. For fall detection applications, Mankodiya et al. [31] proposed XAI-Fall, combining sequence models with XAI techniques on wearable devices, demonstrating the practical relevance of explainable HAR in safety-critical scenarios. Similarly, integrated gradient attributions [32] have been used to explain deep HAR networks by quantifying each sensor channel’s contribution to a prediction. Another example is SoundLIME by Mishra et al. (2020), which adapts the LIME approach to time-series audio signals: it creates perturbed copies of wearable audio data and observes changes in the classifier’s output, thereby inferring which temporal segments are most influential [12]. Siddiqui et al. (2021) proposed TSInsight, a framework combining local and global attributions for sensor data: an autoencoder provides a reconstruction-based view of important signal segments, while feature importance scores highlight which sensor patterns matter most overall [12]. In summary, many post-hoc XAI techniques from the machine learning toolbox (LIME, SHAP, IG, occlusion, etc.) have been tailored to HAR data, allowing researchers to explain predictions by pointing to salient sensors, time windows, or body parts.
Beyond individual sensor importance, some works provide higher-level or knowledge-driven explanations for HAR. In healthcare monitoring, Tzanetis et al. [33] proposed an explainable human-centric approach using wearable data and sensor integration for health risk assessment. For respiratory monitoring, non-invasive wearable devices have been developed with interpretable signal processing pipelines [34]. In sleep-related applications, Troncoso-García et al. [35] applied explainable machine learning for sleep apnea prediction, demonstrating how XAI can support clinical decision-making. The application of XAI has also extended to genomics, where Vanhaeren et al. [36] applied similar interpretation techniques to biological sequence prediction, illustrating the broad applicability of these methods. In activity recognition for smart-home environments, Bettini et al. (2021) advocated explainability through interpretable models and semantic features [2]. They introduced the notion of eXplainable Activity Recognition (XAR) for activities of daily living, using classical classifiers (e.g., decision rules or one-vs-one SVMs) and generating text explanations that combine sensor-derived features with their importance scores [2]. This approach yields explanations like “activity = Cooking because stove-on=true, location=kitchen,” which align with commonsense reasoning. In a similar vein, graph-based representations have been employed to inject domain knowledge into explanations. Fiori et al. (2025) developed an explainable Graph Neural Network (GNN-XAR) for ambient HAR, where sensors (e.g., motion detectors, appliance usage) are nodes in a graph [37]. The GNN’s explanations emphasize how sensor events connect (through the graph) to form an activity; an evaluation using an LLM showed that human-interpretable graph-based explanations were preferred over more opaque baseline explanations in the majority of test cases [37].
Another recent study by Huang et al. (2024) proposed a model-agnostic XAI framework for HAR that augments the input data to probe the model’s behavior [12]. By generating counterfactual data augmentations (via a method called competitive augmentation), their approach produces intuitive explanations of model decisions (for example, showing how slight changes in signal frequency affect predictions) while even improving the model’s overall performance [12]. This reflects a growing trend of designing explanation techniques that are not only informative but also help enhance or debug HAR models.

Table 1.
Comparison of Explainability Methods in Sensor-Based HAR
| Study | XAI Method(s) | Model | Dataset | Sensor Types | Classes | Analysis Level | Ablation | Per-Class |
|---|---|---|---|---|---|---|---|---|
| Harris et al. [38] | PCA + Ablation | SVM | Custom | IMU, sEMG | 4 | Sensor placement | ✓ | ✗ |
| Ronao & Cho [39] | None | CNN | WISDM | ACC | 6 | - | ✗ | ✗ |
| Yin et al. [5] | Attention weights | CNN-BiLSTM | UCI-HAR | ACC, GYRO | 6 | Feature-level | ✗ | ✗ |
| Khatun et al. [6] | Self-attention | CNN-LSTM | MHEALTH, UCI-HAR | ACC, GYRO, MAG | 12, 6 | Feature-level | ✗ | ✗ |
| Khan et al. [10] | LIME | Random Forest | Custom EEG | EEG | 4 | Feature-level | ✗ | ✗ |
| Arrotta et al. [18] | LIME, SHAP | Various ML | KU-HAR, PAMAP2 | ACC, GYRO | 18, 12 | Feature-level | ✓ | ✗ |
| Borella et al. [19] | SHAP | Ensemble | Custom IMU | IMU (5 locations) | Material handling | Sensor-level | ✗ | ✗ |
| Pellano et al. [20] | CAM, Grad-CAM | EfficientGCN | NTU-RGB+D | Skeleton | 60 | Spatial-temporal | ✗ | ✓ |
| Jeyakumar et al. [40] | Concept Bottleneck | CNN-LSTM | Custom | ACC, GYRO | 12 complex | Concept-level | ✗ | ✓ |
| Wang et al. [41] | Ablation study | Het-CNN | OPPORTUNITY, PAMAP2 | Multi-sensor | 18, 12 | Architecture | ✓ | ✗ |
| El-Adawi et al. [42] | None | DenseNet+GAF | MHEALTH | ACC, GYRO, MAG | 12 | - | ✗ | ✗ |
| Wei & Wang [17] | Attention weights | TCN-Attention | Custom | ACC, GYRO | 6 | Temporal | ✗ | ✗ |
| Vijayvargiya et al. [4] | LIME | LSTM | Custom sEMG | sEMG | Lower limb acts | Feature-level | ✗ | ✗ |
| Kim et al. [43] | Grad-CAM | CNN | Custom audio | Audio | 7 daily sounds | Spectrogram | ✗ | ✓ |
| Arrotta et al. [44] | LIME, LLM eval | Various | CASAS | Smart home | 10 | Event-level | ✗ | ✗ |
| Our Work | Ablation, IG, SHAP | TD-LSTM | MHEALTH | ACC, ECG, GYRO, MAG | 12 | Multi-level | ✓ | ✓ |
| + Counterfactual | + MaxPool | (8 sensor groups) | (Global, per-class, | ✓ | ✓ | |||
| probability-level) |
XAI Method(s): Primary explainability techniques employed. Analysis Level: Granularity of explanations (feature, sensor, concept, etc.). Ablation: Systematic feature/sensor removal study. Per-Class: Class-specific explanation analysis. ACC: Accelerometer, GYRO: Gyroscope, MAG: Magnetometer, IMU: Inertial Measurement Unit, sEMG: Surface Electromyography. TD-LSTM: Time-Distributed LSTM. IG: Integrated Gradients
3. Methodology
This section details the dataset, preprocessing steps, model architecture, and the explainability modules in our unified framework. An overview of the pipeline is shown in Figure 1.
Figure 1 provides an overview of the proposed pipeline. Raw multi-sensor time series from the MHEALTH dataset are segmented into fixed-length windows and split subject-wise into training and test sets. A TD–LSTM classifier is trained on these windows to achieve high baseline recognition accuracy. On top of the trained model, four explainability modules are applied: (i) sensor-group counterfactual ablation to assess causal impact under simulated sensor failure, (ii) per-class temporal attributions via Integrated Gradients, (iii) global sensor-group ranking via Integrated Gradients, and (iv) Shapley Value Sampling for model-agnostic validation. All attributions are aggregated at the sensor-group level, yielding interpretable insights into which modalities and body locations are most critical for different activities and for overall performance.
3.1. Dataset and Preprocessing
We evaluate our method on the MHEALTH public dataset [21], which contains body-motion and vital-sign recordings from 10 volunteers performing 12 activities. Sensors were placed on the chest, right wrist, and left ankle of each subject. Each recorded tri-axial accelerometer (ACC), gyroscope (GYRO), and magnetometer (MAG) signals, while the chest sensor also recorded two-lead ECG, yielding 23 synchronized channels.
Following standard HAR practices [45], we segment the time series into overlapping windows of samples (10s) with a 50-sample stride (1s). Each window is labeled using the modal activity class. We apply subject-wise splitting: subjects 9 and 10 are held out for testing, with the rest used for training.
3.2. Model Architecture
We employ a hybrid deep architecture based on Time-Distributed LSTM (TD–LSTM), selected for several important reasons. First, LSTMs are inherently designed to capture temporal dependencies in sequential data, making them well-suited for HAR where activities unfold over time [46]. Second, compared to Transformer-based models, LSTMs offer lower computational complexity and memory requirements, which is critical for potential deployment on resource-constrained wearable devices. Third, the LSTM’s hidden state provides a natural bottleneck for temporal summarization, facilitating gradient-based explanation methods like Integrated Gradients. While CNNs and Transformers have shown competitive performance in HAR [5,6], we prioritize the LSTM’s interpretability advantages and its proven effectiveness on the MHEALTH benchmark.
The architecture consists of two time-distributed dense layers (128 units each with ReLU activation and batch normalization), followed by temporal max-pooling and a single-layer LSTM with 256 hidden units. The final classification uses a fully connected layer with softmax activation over 12 activity classes. Table 2 summarizes all hyperparameters and experimental settings for full reproducibility.
3.3. Sensor Grouping for Interpretability
We partition the 23 input features into eight sensor groups based on modality (accelerometer, gyroscope, magnetometer, ECG) and body placement (chest, ankle, wrist). Table 3 presents this grouping, which enables aggregation of feature attributions into meaningful units aligned with hardware components, following best practices for group-level interpretability [47,48].
3.4. Counterfactual Sensor Ablation Analysis
We simulate sensor failure by zeroing out all features in a sensor group :
We measure the global and per-class impact via:
3.5. Temporal Attributions with Integrated Gradients
For per-class and temporal attribution, we use Integrated Gradients (IG) [15] with a zero baseline:
where is the zero baseline, is the input, is the model’s logit for class c, and the integral is approximated using 50 Riemann steps. We disable CuDNN for deterministic LSTM gradients. For each class, we average IG over up to 32 correctly classified samples to obtain attribution maps .
3.6. Global Feature Importance via Shapley Value Sampling
To estimate global feature importance, we apply Shapley Value Sampling [49] over a subset of 32 test samples. The Shapley value for feature f is defined as:
where the expectation is over all possible subsets S of features excluding f. This is approximated using 20 Monte Carlo permutations per sample, following common practice in scalable SHAP applications [14]. Sampling is necessary due to the high dimensionality () of the input space.
3.7. Sensor-Level Attribution Aggregation
Attributions from both IG (Equation (3)) and Shapley (Equation (4)) are aggregated to sensor groups by averaging:
where is the set of feature indices belonging to sensor group g, T is the sequence length, and is the attribution value at time t and feature f. This aggregation yields interpretable per-sensor scores that facilitate direct comparison with hardware components [48]. We report mean attributions with standard deviations computed across the sampled test windows to provide uncertainty estimates.
4. Results
This section reports the empirical evaluation of the proposed multi-method explainability framework on the MHEALTH dataset. We first establish the discriminative performance of the TD–LSTM classifier, and then analyze its behaviour using four complementary experiments: (i) counterfactual sensor-group ablation, (ii) class-specific IG heatmaps, (iii) temporal sensor-group IG curves, and (iv) global sensor-group rankings obtained from IG and Shapley Value Sampling. Together, these results provide a coherent view of which sensor groups the model relies on, at which time intervals, and with what relative importance.
4.1. Baseline Classification Performance
Table 4 reports the per-class precision, recall, and F1-score of the TD–LSTM model on the MHEALTH test set. The model attains an overall accuracy of , with both macro-averaged and weighted-averaged F1-scores equal to . All twelve activities achieve F1-scores above , indicating that the network can reliably distinguish both static and dynamic activities.
Activities such as Walking, Cycling, and Jogging reach near-perfect performance (), whereas slightly lower scores are observed for Lying down and Jump front & back, which are underrepresented in the dataset and exhibit more subtle or short-lived motion patterns. The normalized confusion matrix in Figure 2 confirms that misclassifications are rare and mostly occur between semantically related activities (e.g., transitions among resting postures). This strong baseline is essential: it ensures that subsequent explainability analyses characterize a well-performing model rather than compensating for poor classification.
4.2. Experiment 1: Counterfactual Sensor-Group Ablation
Starting from the baseline model in Section 4.1 (overall accuracy , macro-F1), we first investigate how the classifier depends on each sensor group via counterfactual ablation. For every sensor group defined in Section 3, we construct a modified test set in which all channels in are set to zero and re-evaluate the model without retraining. This yields an ablated accuracy and an accuracy drop . To capture more subtle effects, we additionally compute (i) class-wise accuracies and (ii) the change in mean predicted probability for the true class, , thereby quantifying confidence degradation even when the predicted label remains correct.
4.2.1. Global Impact of Removing Individual Sensor Groups
Table 5 summarizes the global effect of removing each of the eight sensor groups on the MHEALTH test set. The baseline configuration attains an accuracy of . Ablating the ankle magnetometer (Ankle_MAG) produces by far the largest degradation, reducing accuracy to (). Removing the wrist accelerometer (Wrist_ACC) and ankle accelerometer (Ankle_ACC) also causes substantial performance drops, to and , respectively ( and ). Chest accelerometer (Chest_ACC) and wrist magnetometer (Wrist_MAG) ablations yield more moderate but still noticeable losses ( and ).
In contrast, ablating the chest ECG (Chest_ECG) has virtually no effect on performance (, ), indicating that the current model does not exploit the ECG channel beyond what is already captured by motion sensors. Interestingly, removing the ankle gyroscope (Ankle_GYRO) slightly improves accuracy to (), suggesting redundancy with other ankle-mounted sensors or residual noise in that channel. Overall, these results already indicate that (i) lower-limb inertial and magnetic sensing is critical for this multi-activity HAR task, and (ii) certain physiological or redundant modalities can be removed with minimal impact on global accuracy.
4.2.2. Class-Wise and Probability-Level Sensitivity
The class-wise analysis reveals a consistent biomechanical pattern. Masking Ankle_MAG is catastrophic for most dynamic locomotion activities: the accuracy for Jogging and Running drops from nearly perfect to almost zero (, ), and Climbing stairs also suffers a large loss (). Cycling and Jump front & back exhibit smaller but still meaningful degradations, confirming that the ankle magnetometer encodes key discriminative information for lower-limb activities.
Wrist_ACC ablation mainly affects static and low-mobility classes: Sitting and relaxing drops by in accuracy, and Standing still by , while dynamic classes such as Cycling and Jump front & back remain almost unaffected. Conversely, Chest_ACC is particularly important for posture-related activities: Lying down and Climbing stairs experience the largest accuracy losses when Chest_ACC is removed ( and , respectively), reflecting the relevance of trunk motion and orientation for these activities. For Chest_ECG, per-class accuracies remain virtually unchanged, corroborating the global result that the ECG channel is not currently leveraged by the model. Finally, the slight global improvement when removing Ankle_GYRO is reflected in small, non-systematic changes across classes, consistent with this group acting as a redundant or noisy modality rather than a primary information source.
Accuracy alone may hide cases where the predicted label is preserved but model confidence drops substantially. To capture this effect, we additionally compute the mean probability assigned to the true class before and after ablation, and report for each sensor group g and activity class c. On average, Ankle_MAG removal induces the largest confidence loss, with a mean of approximately across classes. At the class level, the impact is even more pronounced: for Jogging the mean probability of the correct class drops from to (), and for Running from to (). Chest_ACC ablation also causes substantial confidence degradation for Lying down and Climbing stairs ( and ), in line with the large accuracy drops observed for these classes. Wrist_ACC removal produces sizeable probability reductions for Sitting and relaxing and Standing still ( and ), highlighting the role of wrist motion in distinguishing subtle postural states. In contrast, Chest_ECG yields negligible mean confidence changes () across all classes, and Ankle_GYRO exhibits a slightly negative mean , consistent with the slight accuracy improvement.
Taken together, Experiment 1 shows that ankle magnetometer and accelerometer signals are indispensable for dynamic lower-limb activities, wrist accelerometry is critical for static postures, and certain channels (ECG, ankle gyroscope) can be removed with little or no degradation in both accuracy and confidence. These counterfactual findings motivate the gradient-based analyses in Experiment 2, which explain how the model exploits the remaining sensor groups over time.
4.3. Experiment 2: Class-Specific Integrated Gradients
In Experiment 2 we apply IG to obtain class-specific attributions over time and sensor channels for all 12 activities. For each class c, we select up to 32 correctly classified windows, use a zero baseline, and average the absolute IG values across samples to obtain an attribution map (Section 3). From these maps, we derive two complementary visualizations: (i) time–feature heatmaps that expose fine-grained patterns at the channel level, and (ii) temporal sensor-group curves that aggregate attribution within the eight predefined sensor groups.
4.3.1. Time–Feature IG Heatmaps
Figure 3 shows the class-specific IG heatmaps for all 12 activities. Overall, they reveal a clear separation between (i) quasi-static postures, (ii) localized upper-body motions, and (iii) dynamic locomotion activities, both in terms of attribution magnitude and which sensor channels are emphasized.
For the three static postures (Standing still, Sitting and relaxing, Lying down), the heatmaps exhibit low overall attribution energy with relatively uniform patterns across time. Attributions are concentrated on Chest_ACC and Ankle_ACC, while gyroscope and magnetometer channels contribute much less. This suggests that the network mainly relies on low-amplitude acceleration signals from the torso and lower limb to distinguish subtle differences in posture, and does not require complex temporal patterns or high-frequency components.
Activities involving controlled upper-body motion (Waist bends forward, Frontal elevation of arms, Knees bending) show stronger and more localized attribution bands in the middle portion of the window. These heatmaps highlight Chest_ACC together with Wrist_ACC and, to a lesser extent, Wrist_GYROC. The temporal concentration of IG peaks around the main movement phase indicates that the model uses short bursts of coordinated trunk and arm motion to recognize these activities, while ankle sensors play a comparatively smaller role.
Dynamic locomotion classes (Walking, Climbing stairs, Cycling, Jogging, Running, Jump front & back) exhibit the highest IG magnitudes and the most structured temporal patterns. Attributions are dominated by lower-limb and distal sensors: Ankle_ACC, Ankle_MAG, and Wrist_MAG consistently receive the largest share of IG. Walking and Climbing stairs display quasi-periodic vertical bands, consistent with repetitive gait cycles; Cycling shows similar periodic structure but with a more balanced contribution from wrist sensors, reflecting handlebar interaction. High-intensity attributions in Jogging and especially Running are concentrated on Ankle_MAG and Wrist_MAG, indicating that the model relies on high-frequency, high-amplitude variations in these modalities to discriminate fast locomotion. For Jump front & back, IG mass is concentrated around a narrow central interval, with strong emphasis on ankle and wrist magnetometers, capturing the brief but intense ballistic movement.
Across all classes, the channels that receive the largest IG attributions (e.g., ankle magnetometer for locomotion, wrist accelerometer for upper-body exercises) coincide with those whose removal caused the largest accuracy and confidence drops in Experiment 1, providing a first qualitative triangulation between gradient-based and counterfactual explanations.
4.3.2. Temporal Sensor-Group Attribution Curves
To complement the channel-level view, we aggregate IG within each sensor group and obtain class-specific temporal curves of mean absolute attribution. Figure 4 reports the resulting curves for all twelve activities.
Several consistent patterns emerge. First, almost all classes exhibit a pronounced rise in IG magnitude in the final 5–10 time steps, reflecting the TD–LSTM’s reliance on temporally local discriminative motion cues before the last hidden state is read out. Second, high-motion activities (Jogging, Running, Cycling, Knees bending) rely heavily on lower-body sensors: Ankle_MAG and Ankle_ACC dominate the curves, capturing strong periodic kinematic signatures in line with leg-driven cyclic motion. In Running, Ankle_MAG and Wrist_MAG exhibit very large peaks in the first 100 time steps and towards the end of the window, indicating that both impact forces and arm swing contribute to the model’s decision.
Third, upper-body activities emphasize wrist and chest signals. For Frontal elevation of arms, the curves show substantial attribution from Wrist_MAG and Chest_ACC, while ankle sensors play a minor role; Waist bends forward exhibits a similar but lower-magnitude pattern. Fourth, static and quasi-static activities (Standing still, Sitting and relaxing, Lying down) produce low, relatively flat attribution profiles across time, with only modest contributions from Wrist_MAG and Ankle_ACC, reflecting the weak kinematic variability inherent to these activities. Finally, explosive whole-body movements such as Jump front & back show concurrent spikes in Ankle_MAG, Ankle_ACC, and Wrist_MAG during the final part of the window, corresponding to jump and landing phases.
Overall, temporal sensor-group IG curves provide a structured and interpretable representation of how the network distributes attention across modalities and time. The sensor groups that are most emphasized in these curves match those identified as critical in Experiment 1, reinforcing the consistency of the explanations obtained from ablation and gradient-based analyses.
4.4. Experiment 3: Global Integrated Gradients Ranking
While Experiments 1–2 focus on counterfactual drops and class-specific patterns, Experiment 3 investigates global feature importance from the perspective of IG. We draw representative windows from the test set and compute IG with respect to the model’s predicted class for each window. Attributions are averaged over samples and time, and then aggregated within the eight sensor groups, yielding a single global importance score per group.
Table 6 reports the resulting ranking. Wrist_ACC emerges as the most influential group, accounting for approximately of the total IG mass. The next two groups, Chest_ACC and Ankle_ACC, contribute and , respectively. Together, these three accelerometer groups explain nearly of the aggregated IG magnitude, highlighting the central role of linear acceleration across wrist, chest, and ankle. Gyroscope and magnetometer signals contribute more modestly: Ankle_GYRO and Wrist_GYROC together account for around , while Ankle_MAG and Wrist_MAG contribute and . Chest_ECG has the lowest global attribution (), consistent with its negligible impact in the ablation study.
Interestingly, the global IG ranking only partially aligns with the counterfactual results of Experiment 1. For example, Ankle_MAG has a moderate IG score but its removal causes the largest global accuracy drop. This discrepancy reflects the fact that IG measures marginal contributions along a baseline–input path, whereas ablation measures the functional impact of completely zeroing out a sensor group. Some modalities (such as Ankle_MAG) may act as critical “gating” features whose absence severely degrades performance, even if their pointwise gradient-based attributions are smaller on average. Hence, global IG ranking and ablation provide complementary views on sensor importance.
4.5. Experiment 4: Shapley Value Validation
Finally, Experiment 4 uses Shapley Value Sampling to obtain a model-agnostic, game-theoretic estimate of global sensor-group importance, and thereby validate the gradient-based findings of Experiment 3. We use the Captum implementation of ShapleyValueSampling with a subset of 32 test windows and 20 Monte Carlo samples per feature. For each window, Shapley values are computed with respect to the TD–LSTM’s predicted class and then aggregated by taking the mean absolute value across time and samples within each sensor group.
Figure 5 summarizes the Shapley-based importance ranking. Wrist_ACC again emerges as the most influential modality, followed by Ankle_ACC and Chest_ACC. These three accelerometer groups form a clear top tier, indicating that linear acceleration at the wrist, ankle, and chest accounts for the majority of the model’s explanatory power across activities. Mid-ranked importance is assigned to Wrist_GYROC and Ankle_GYRO, suggesting that rotational motion gyroscopes provide complementary but secondary cues. In contrast, Ankle_MAG, Wrist_MAG, and Chest_ECG receive the lowest Shapley scores, implying that magnetometers and ECG contribute relatively little to the final prediction when accelerometers and gyroscopes are already present.
Qualitatively, these findings are consistent with both the counterfactual ablation (Experiment 1) and global IG ranking (Experiment 3): sensor groups whose removal produced the largest drops in accuracy also receive high Shapley attributions, and the dominance of accelerometer groups is reproduced by both methods. The agreement between IG and game-theoretic (Shapley) rankings strengthens the reliability of the proposed explanation framework, mitigating the risk that any single XAI method might produce misleading importance estimates. Moreover, the Shapley analysis provides a clear, globally interpretable ordering of sensor modalities that can directly inform wearable design decisions, such as prioritizing wrist and ankle accelerometers in resource-constrained deployments.
4.6. Statistical Considerations and Ranking Stability
The attribution rankings presented in Experiments 3 and 4 are derived from finite samples (16–32 test windows), which raises questions about statistical reliability. To assess ranking stability, we performed bootstrap resampling (1000 iterations) on the sampled test windows and computed 95% confidence intervals for each sensor group’s mean attribution. The top three sensor groups (Wrist_ACC, Chest_ACC, Ankle_ACC) maintain their ranking positions across all bootstrap samples, with non-overlapping confidence intervals relative to the bottom-ranked groups (Chest_ECG, Wrist_MAG). The mid-ranked groups (Ankle_GYRO, Wrist_GYRO, Ankle_MAG) show some ranking variability, with overlapping confidence intervals, suggesting that finer distinctions among these groups should be interpreted cautiously.
For the ablation results, we note that the accuracy differences for high-impact sensor groups (Ankle_MAG, Wrist_ACC, Ankle_ACC) are substantial (Acc ) and exceed typical classification variance on MHEALTH. While formal statistical tests such as McNemar’s test or paired bootstrap would strengthen these claims, the magnitude of observed effects (e.g., Acc = 0.471 for Ankle_MAG) is large enough to support the qualitative conclusions. Future work should incorporate cross-validation across multiple subject splits and report confidence intervals for all metrics.
5. Discussion
The experiments in Section 4 show that the proposed TD–LSTM architecture, combined with a multi-method explainability framework, yields both high recognition performance and mechanistically plausible explanations on the MHEALTH dataset. In this section we discuss the broader implications of these findings, focusing on (i) the alignment between learned sensor importance and human biomechanics, (ii) the consequences for sensor selection and deployment, (iii) the value of combining counterfactual, gradient-based, and game-theoretic XAI methods, and (iv) current limitations and avenues for future work.
5.1. Biomechanically Plausible Explanations
A first observation is that all four experiments converge towards a sensor-importance structure that is highly consistent with basic biomechanical intuition. The counterfactual ablation study (Experiment 1) identifies ankle magnetometer and accelerometer signals as indispensable for dynamic locomotion, wrist accelerometry as crucial for static postures, and chest accelerometry as important for posture- and trunk-centric activities. The class-specific IG heatmaps and temporal sensor-group curves (Experiment 2) refine this picture, showing that the TD–LSTM allocates attribution to sensor groups in ways that closely match the dominant joints and segments involved in each activity (e.g., ankle-centric patterns for gait, wrist- and chest-centric patterns for arm elevation).
This biomechanical alignment has two important consequences. First, it suggests that the TD–LSTM has learned to exploit physically meaningful features rather than dataset-specific artefacts. For instance, the fact that Jogging and Running exhibit strong IG peaks on Ankle_MAG and Wrist_MAG during impact and propulsion phases indicates that the model is sensitive to the same high-frequency, high-amplitude components that human experts typically use to differentiate fast locomotion from slower gait. Similarly, the low, diffuse attribution profiles for Standing still, Sitting and relaxing, and Lying down match the expectation that these postures differ mainly by subtle changes in orientation and micro-movements, rather than by pronounced periodic motion.
Second, the consistent separation between static postures (weak, low-frequency attributions), localized upper-body movements (mid-window bursts on chest and wrist), and locomotion (highly structured ankle- and wrist-driven patterns) supports the hypothesis that the TD–LSTM has implicitly learned an internal taxonomy of activities. Although the model is not explicitly supervised to distinguish these three categories, the attribution maps indicate that different subsets of the architecture are effectively specialized to different movement regimes. This emergent specialization is encouraging from an interpretability perspective, because it suggests that the network is reusing sensor groups in a systematic and physically meaningful way rather than relying on brittle, class-specific shortcuts.
5.2. Implications for Sensor Selection and Deployment
A second set of implications concerns the design of practical HAR systems under hardware and energy constraints. The ablation results make clear that not all sensor groups contribute equally to recognition: some are functionally critical, while others can be removed with negligible or even slightly positive impact on performance. In particular, Ankle_MAG and Ankle_ACC form a bottleneck for dynamic locomotion; Wrist_ACC is essential for discriminating static postures and upper-body exercises; and Chest_ECG and Ankle_GYRO appear largely redundant for the activities present in MHEALTH.
From a deployment perspective, these findings motivate a tiered sensor design strategy. A minimal configuration for general-purpose activity monitoring could prioritize ankle and wrist accelerometers, possibly complemented by a single chest accelerometer for improved posture recognition. Such a setup retains the most informative modalities identified by both ablation and global importance analyses, while allowing the removal of low-yield channels such as ECG and certain gyroscopes. On resource-constrained devices, this can translate directly into reduced power consumption, lower communication bandwidth, and simpler hardware, without sacrificing recognition performance.
At the same time, the probability-level analysis in Experiment 1 highlights the risks of naive sensor reduction. Although Chest_ECG has negligible impact on overall accuracy, Ankle_MAG behaves like a critical gating modality: its removal leads to catastrophic confidence drops for Jogging and Running. This asymmetry suggests that sensor selection policies should be informed not only by marginal attribution scores (as in global IG or Shapley rankings), but also by counterfactual tests of functional necessity. In applications where misclassifying fast locomotion carries safety implications (e.g., fall detection or industrial PPE monitoring), ankle magnetometers may thus be non-negotiable, even if their average attribution appears modest.
Finally, the class-specific IG visualizations offer a practical tool for tailoring sensor configurations to target use-cases. For example, in a scenario focused exclusively on upper-limb rehabilitation, the heatmaps and curves for Frontal elevation of arms and Waist bends forward indicate that wrist and chest accelerometers dominate, while ankle sensors contribute little. Conversely, in mobility monitoring for elderly users, the strong ankle-centric patterns for walking and stair climbing suggest that an ankle-only configuration might suffice, possibly paired with a lightweight wrist sensor for detecting arm swings and balance compensation. The proposed framework thus supports activity-specific sensor pruning strategies grounded in model behaviour, rather than ad hoc heuristics.
5.3. Value of Combining Multiple XAI Methods
A central methodological contribution of this work is the use of four complementary explanation techniques applied to the same trained model. The experiments show that different methods capture different aspects of the underlying decision process, and that agreement—or disagreement—between them carries interpretive value.
Counterfactual ablation directly measures the functional impact of removing a sensor group. IG, in contrast, quantify marginal contributions along a baseline-to-input path, and can be decomposed over time and features to reveal fine-grained temporal structure. Shapley Value Sampling provides a global, model-agnostic estimate of average marginal contributions under random feature coalitions. Taken in isolation, each method has well-known limitations: ablation may overestimate importance of correlated features, IG is sensitive to the choice of baseline and path, and Shapley estimates can be noisy or expensive in high dimensions.
By applying all three, the present study leverages their complementary strengths. The broad agreement between (i) the sensor groups that trigger large accuracy and confidence drops in ablation, (ii) those with high mass in class-specific IG heatmaps and temporal curves, and (iii) those ranked highly by global IG and Shapley values, strongly suggests that these groups are genuinely important for the TD–LSTM, rather than artefacts of any single explanation method. Conversely, the discrepancies between methods—most notably the case of Ankle_MAG, which ranks moderately in global IG but is crucial in ablation—highlight subtle roles that certain modalities play in the model (e.g., as gating features that are rarely salient but indispensable when needed).
More broadly, the results support a multi-lens view of explainability in time-series HAR. Rather than seeking a single “true” ranking of feature importance, practitioners should expect different XAI tools to emphasize different facets of model behaviour, and should interpret them jointly. In this sense, the proposed framework can serve as a template for future studies seeking robust explanations in safety-critical wearables or medical monitoring applications.
5.4. Trust, Debugging, and Clinical/Industrial Relevance
The ability to localize model attention in both sensor space and time has practical benefits beyond sensor selection. First, the class-specific IG heatmaps and curves provide a convenient diagnostic tool for detecting spurious shortcuts or dataset biases. For example, if a model trained on a different dataset were found to rely heavily on a single channel that has no clear biomechanical justification for a given activity, this would be a red flag suggesting potential overfitting to sensor artefacts or recording conditions. In the present study, no such pathological patterns were observed; instead, attributions align with domain knowledge, which increases confidence in the model’s behaviour.
Second, the temporal localization of IG peaks offers a natural handle for designing post-hoc sanity checks or human-in-the-loop interfaces. For instance, segments where the model’s confidence changes rapidly but attributions are weak or diffuse could be flagged for manual review, while segments with strong, consistent attribution patterns could be used to generate explanatory summaries for clinicians or occupational safety officers (e.g., “classification relied primarily on ankle accelerations during the push-off phase”).
Third, the proposed framework is directly relevant to application domains where multi-sensor systems are deployed under regulatory or ethical scrutiny. In clinical monitoring or workplace safety, stakeholders are increasingly asking not only whether a model performs well, but also why it behaves as it does. Our results show that, at least on MHEALTH, a relatively standard TD–LSTM can be endowed with rich, activity-specific explanations using off-the-shelf XAI methods, without modifying the underlying architecture. This suggests that explainable HAR systems can be deployed without necessarily sacrificing performance or requiring complex bespoke models.
5.5. Practical Implications for System Design
The findings from this study translate into concrete recommendations for wearable HAR system design and deployment:
Minimal Viable Sensor Configuration. For general-purpose activity monitoring with resource constraints, a two-sensor configuration comprising wrist and ankle accelerometers captures the majority of discriminative information. This minimal setup retains approximately 89% of the attribution mass identified by both IG and Shapley analyses while significantly reducing hardware cost, power consumption, and form factor complexity.
Application-Specific Optimization. The class-specific IG heatmaps enable targeted sensor selection based on target activities. For mobility monitoring applications (walking, stair climbing, running), ankle sensors are essential and should not be removed. For upper-body rehabilitation or gesture recognition, wrist and chest sensors take priority. This activity-aware approach allows designers to optimize sensor configurations for specific use cases rather than deploying uniform, over-instrumented systems.
Safety-Critical Considerations. The identification of Ankle_MAG as a “gating” modality has important implications for safety-critical applications. Although magnetometer signals contribute modestly to average attributions, their removal causes catastrophic failures for high-intensity activities. In applications such as fall detection or workplace safety monitoring where missing high-intensity movements carries serious consequences, magnetometers should be retained despite their apparently lower importance scores.
Deployment Workflow. We recommend a three-stage workflow for deploying explainable HAR systems: (1) train a baseline model on full sensor data, (2) apply the multi-method XAI framework to identify critical and redundant sensor groups for the target activity set, and (3) validate pruned configurations through ablation testing before deployment. This systematic approach balances performance, interpretability, and resource efficiency.
5.6. Limitations and Future Work
Despite the positive findings, several limitations should be acknowledged and addressed in future research.
Single Dataset Evaluation. All experiments are conducted on the MHEALTH benchmark with a specific sensor placement configuration and sampling rate (50 Hz). The generalizability of the identified sensor importance hierarchies to other HAR datasets with different activity taxonomies, sensor positions, or recording conditions remains uncertain. Future work should validate the framework on diverse datasets including PAMAP2, OPPORTUNITY, and in-the-wild recordings where motion patterns exhibit greater variability and label noise.
Model Architecture Dependency. The TD–LSTM architecture, while effective, represents only one design point among many possible sequence models. Transformer-based architectures and temporal convolutional networks have shown competitive or superior performance on some HAR benchmarks. The extent to which observed attribution patterns (e.g., end-of-window IG peaks) are specific to recurrent readout mechanisms versus intrinsic to the dataset is not fully resolved. Applying the multi-method explainability pipeline to alternative architectures would clarify whether certain patterns are architecture-specific artifacts.
Limited Sampling for XAI Computations. Both IG and Shapley analyses are computed on relatively small subsets (16–32 test windows) for computational tractability. While qualitative consistency across experiments suggests representativeness, more exhaustive sampling would enable formal statistical testing, including confidence intervals on global rankings and hypothesis tests comparing sensor groups. Exploring more efficient approximation schemes for game-theoretic explanations in high-dimensional time series remains an important direction.
Ablation versus Retraining. The counterfactual ablation experiments zero out sensor groups at test time without retraining the model. This measures “model dependence” (how much the current model relies on each sensor) rather than “task dependence” (how much each sensor is intrinsically necessary for the recognition task). Retraining the TD–LSTM from scratch after permanently removing high-impact sensor groups would provide complementary evidence about true task requirements and potential model adaptation.
Subject Generalization. The subject-wise split (training on subjects 1–8, testing on subjects 9–10) provides a single evaluation point. Cross-validation across different subject groupings would strengthen claims about generalization and enable variance estimation across different population samples.
Real-World Deployment Considerations. The current analysis assumes clean, laboratory-collected data. Real-world wearable deployments face additional challenges including sensor drift, intermittent connectivity, and non-stationary user behavior that may affect both model performance and explanation reliability. Field validation of the proposed sensor selection recommendations is necessary before deployment.
Future work will address these limitations by extending the analysis to multiple datasets and architectures, incorporating formal statistical testing with cross-validation, and exploring explanation-guided training strategies that regularize models toward biomechanically grounded attention patterns while maintaining computational efficiency.
Finally, the present work focuses on post-hoc explanation of a fixed model. An intriguing avenue for future research is to use the proposed explanations during training, for example to regularize the model toward biomechanically plausible attention patterns, to penalize excessive reliance on low-importance sensors, or to iteratively prune and retrain sensors in a closed loop. Such explanation-guided training procedures could further improve robustness, facilitate domain adaptation, and reduce the cost of deploying HAR systems in resource-constrained or safety-critical environments.
In summary, the experiments demonstrate that a TD–LSTM trained on multi-sensor wearable data can achieve high recognition performance while exhibiting interpretable, biomechanically grounded behaviour when analyzed through a combination of counterfactual ablation, Integrated Gradients, and Shapley Value Sampling. The resulting explanations support concrete sensor design decisions, provide tools for model debugging and trust assessment, and suggest principled directions for future research on explainable HAR.
6. Conclusion
This paper introduced a multi-method explainability framework for wearable-based human activity recognition that combines a high-performing TD–LSTM classifier with four complementary XAI analyses: counterfactual sensor-group ablation, class-specific Integrated Gradients heatmaps, temporal sensor-group attribution curves, and global sensor importance rankings using Integrated Gradients and Shapley Value Sampling. On the MHEALTH benchmark, the proposed TD–LSTM achieves state-of-the-art performance (overall accuracy , macro-F1), providing a strong basis for subsequent interpretation.
Across all experiments, we observe a coherent and biomechanically plausible picture of how the model exploits multi-sensor inputs. Lower-limb magnetometer and accelerometer signals are functionally indispensable for dynamic locomotion, wrist accelerometry is critical for static postures and upper-body exercises, and chest accelerometry supports posture-related activities, while ECG and some gyroscope channels play only a minor role. Class-specific IG heatmaps and temporal sensor-group curves show that the TD–LSTM allocates attribution to sensor groups and time intervals in ways that align with dominant joints and movement phases for each activity. Global IG and Shapley rankings confirm the central role of accelerometers and, together with ablation, reveal subtle gating roles for modalities such as Ankle_MAG.
These findings have direct implications for the design and deployment of wearable HAR systems. The proposed framework supports principled sensor selection and pruning, suggesting that wrist and ankle accelerometers can form a strong core configuration, while additional modalities may be added or removed depending on task requirements and safety constraints. More broadly, the agreement between counterfactual, gradient-based, and game-theoretic explanations demonstrates the value of using multiple XAI lenses to obtain robust, trustworthy insights into time-series models, rather than relying on a single attribution method.
Future work will extend this analysis to other datasets and architectures (e.g., transformers and temporal CNNs), investigate more scalable approximations for game-theoretic explanations on long sequences, and explore explanation-guided training strategies that explicitly regularize models toward biomechanically grounded attention patterns. Taken together, our results indicate that accurate and interpretable HAR from multi-sensor wearables is feasible with current deep learning and XAI tools, and provide a practical template for building transparent activity recognition systems in clinical, industrial, and everyday settings.
Author Contributions
AdeKurniawan: Conceptualization of this study, Methodology, formal analysis, writing—review and editing, visualization. Wahyu Caesarendra: Conceptualization of this study, Methodology, project administration, funding acquisition, supervision. Mochammad Ariyanto: Methodology, project administration, and validation. Muhammad Khaerul Naim Mursalim: Methodology, Investigation, and Data curation. Dani Lukman Hakim: Project administration, funding acquisition, and supervision.
References
- Zhang, S.; Li, Y.; Zhang, S.; Shahabi, F.; Xia, S.; Deng, Y.; Alshurafa, N. Deep Learning in Human Activity Recognition with Wearable Sensors: A Review on Advances. Sensors 2022, 22, 1476. [Google Scholar] [CrossRef]
- Chen, L.; Nugent, C.D.; Wang, H. A knowledge-driven approach to activity recognition in smart homes. IEEE Transactions on Knowledge and Data Engineering 2011, 24, 961–974. [Google Scholar] [CrossRef]
- Kwapisz, J.R.; Weiss, G.M.; Moore, S.A. Activity Recognition using Cell Phone Accelerometers. ACM SIGKDD Explorations Newsletter 2011, 12, 74–82. [Google Scholar] [CrossRef]
- Vijayvargiya, A.; Singh, P.; Kumar, R.; Dey, N. Hardware Implementation for Lower Limb Surface EMG Measurement and Analysis using Explainable AI for Activity Recognition. IEEE Transactions on Instrumentation and Measurement 2022, 71, 1–9. [Google Scholar] [CrossRef]
- Yin, X.; Liu, Z.; Liu, D.; Ren, X. A Novel CNN-based Bi-LSTM Parallel Model with Attention Mechanism for Human Activity Recognition with Noisy Data. Scientific Reports 2022, 12, 7878. [Google Scholar] [CrossRef]
- Khatun, M.A.; Yousuf, M.A.; Ahmed, S.; Uddin, M.Z.; Alyami, S.A.; Al-Ashhab, S.; Akhdar, H.F.; Khan, A.; Aziz, A.A.; Moni, M.A. Deep CNN-LSTM With Self-Attention Model for Human Activity Recognition Using Wearable Sensor. IEEE Journal of Translational Engineering in Health and Medicine 2022, 10, 1–16. [Google Scholar] [CrossRef]
- Qi, W.; Lin, C.; Qian, K. Multimodel Lightweight Transformer Framework for Human Activity Recognition. In Proceedings of the 2024 46th Annual International Conference of the IEEE Engineering in Medicine and Biology Society (EMBC), 2024; IEEE; pp. 1–4. [Google Scholar]
- Liang, Q.; Jitpattanakul, A.; Mekruksavanich, S. Robust Human Activity Recognition Using a Transformer-Based Model for Aging Society. In Proceedings of the 2025 6th International Conference on Big Data Analytics and Practices (IBDAP), 2025; IEEE; pp. 272–277. [Google Scholar]
- Mennella, C.; Esposito, M.; De Pietro, G.; Maniscalco, U. Multiscale activity recognition algorithms to improve cross-subjects performance resilience in rehabilitation monitoring systems. Computer Methods and Programs in Biomedicine 2025, 108792. [Google Scholar] [CrossRef] [PubMed]
- Khan, A.u.H.; Hussain, S.; Alromema, N.; Iqbal, S.; Mustafa, G.; Khattak, M.A.; Nasim, A.; Rizwan, A. An Explainable EEG-Based Human Activity Recognition Model Using Machine-Learning Approach and LIME. Sensors 2023, 23, 7452. [Google Scholar]
- Qureshi, T.S.; Shahid, M.H.; Farhan, A.A.; Alamri, S. A systematic literature review on human activity recognition using smart devices: advances, challenges, and future directions. Artificial Intelligence Review 2025, 58, 276. [Google Scholar] [CrossRef]
- Huang, Y.; Zhou, Y.; Zhao, H.; Riedel, T.; Beigl, M. Explainable Deep Learning Framework for Human Activity Recognition. arXiv 2024, arXiv:2408.11552. [Google Scholar] [CrossRef]
- Ribeiro, M.T.; Singh, S.; Guestrin, C. Why Should I Trust You? Explaining the Predictions of Any Classifier. In Proceedings of the Proceedings of the 22nd ACM SIGKDD International Conference on Knowledge Discovery and Data Mining. ACM, 2016; pp. 1135–1144. [Google Scholar]
- Lundberg, S.M.; Lee, S.I. A unified approach to interpreting model predictions. Advances in neural information processing systems 2017, 30. [Google Scholar]
- Sundararajan, M.; Taly, A.; Yan, Q. Axiomatic Attribution for Deep Networks. In Proceedings of the International Conference on Machine Learning. PMLR, 2017; pp. 3319–3328. [Google Scholar]
- Ma, H.; Li, W.; Zhang, X.; Gao, S.; Lu, S. AttnSense: Multi-level attention mechanism for multimodal human activity recognition. In Proceedings of the IJCAI, 2019; pp. 3109–3115. [Google Scholar]
- Wei, X.; Wang, Z. TCN-attention-HAR: Human Activity Recognition Based on Attention Mechanism Time Convolutional Network. Scientific Reports 2024, 14, 7414. [Google Scholar] [CrossRef]
- Arrotta, L.; Barsocchi, P.; Calabrò, A.; Crivello, A.; La Morgia, M. Comparing LIME and SHAP Global Explanations for Human Activity Recognition. In Proceedings of the Springer Series in Bio-/Neuroinformatics, 2024; Springer; pp. 207–218. [Google Scholar]
- Borella, E.; Çakmakçı, U.B.; Gottardis, E.; Buratto, A.; Marchioro, T.; Badia, L. Effective Sensor Selection for Human Activity Recognition via Shapley Value. In Proceedings of the 2024 IEEE International Workshop on Metrology for Living Environment. IEEE, 2024; pp. 22–27. [Google Scholar]
- Pellano, K.N.; Strümke, I.; Ihlen, E.A.F. From Movements to Metrics: Evaluating Explainable AI Methods in Skeleton-Based Human Activity Recognition. Sensors 2024, 24, 1940. [Google Scholar] [CrossRef] [PubMed]
- Banos, O.; Garcia, R.; Holgado-Terriza, J.A.; Damas, M.; Pomares, H.; Rojas, I.; Saez, A.; Villalonga, C. mHealthDroid: A Novel Framework for Agile Development of Mobile Health Applications. In Proceedings of the Ambient Assisted Living and Daily Activities; Cham, Pecchia, L., Chen, L.L., Nugent, C., Bravo, J., Eds.; 2014; pp. 91–98. [Google Scholar]
- Ullah, N.; Khan, J.A.; De Falco, I.; Sannino, G. Explainable artificial intelligence: importance, use domains, stages, output shapes, and challenges. ACM Computing Surveys 2024, 57, 1–36. [Google Scholar] [CrossRef]
- Adesina, A.; Atoyeshe, A. MSANet: A Hybrid Deep Learning Framework with Self-Attention for Human Activity Recognition. Available at SSRN 5573238 2025.
- Cleland, I.; Nugent, L.; Cruciani, F.; Nugent, C. Leveraging large language models for activity recognition in smart environments. In Proceedings of the 2024 International Conference on Activity and Behavior Computing (ABC). IEEE, 2024; pp. 1–8. [Google Scholar]
- Ullah, N.; Guzmán-Aroca, F.; Martínez-Álvarez, F.; De Falco, I.; Sannino, G. A novel explainable AI framework for medical image classification integrating statistical, visual, and rule-based methods. Medical Image Analysis 2025, 103665. [Google Scholar] [CrossRef]
- Ullah, N.; Hassan, M.; Khan, J.A.; Anwar, M.S.; Aurangzeb, K. Enhancing explainability in brain tumor detection: A novel DeepEBTDNet model with LIME on MRI images. International Journal of Imaging Systems and Technology 2024, 34, e23012. [Google Scholar] [CrossRef]
- Ullah, N.; Khan, J.A.; De Falco, I.; Sannino, G. Bridging clinical gaps: multi-dataset integration for reliable multi-class lung disease classification with deepcrinet and occlusion sensitivity. In Proceedings of the 2024 IEEE Symposium on Computers and Communications (ISCC). IEEE, 2024; pp. 1–6. [Google Scholar]
- Mekruksavanich, S.; Jitpattanakul, A. Efficient and Explainable Human Activity Recognition Using Deep Residual Network with Squeeze-and-Excitation Mechanism. Applied System Innovation 2025, 8, 57. [Google Scholar] [CrossRef]
- Tempel, F.; Ihlen, E.A.F.; Adde, L.; Strümke, I. Explaining Human Activity Recognition with SHAP: Validating insights with perturbation and quantitative measures. Computers in Biology and Medicine 2025, 188, 109838. [Google Scholar] [CrossRef]
- Abdelaal, Y.; Aupetit, M.; Baggag, A.; Al-Thani, D. Exploring the Applications of Explainability in Wearable Data Analytics: Systematic Literature Review. Journal of Medical Internet Research 2024, 26, e53863. [Google Scholar] [CrossRef]
- Mankodiya, H.; Jadav, D.; Gupta, R.; Tanwar, S.; Alharbi, A.; Tolba, A.; et al. XAI-Fall: Explainable AI for fall detection on wearable devices using sequence models and XAI techniques. Mathematics 2022, 10, 1990. [Google Scholar] [CrossRef]
- Sundararajan, M.; Taly, A.; Yan, Q. Axiomatic attribution for deep networks. In Proceedings of the International conference on machine learning. PMLR, 2017; pp. 3319–3328. [Google Scholar]
- Tzanetis, G.; Toumpas, A.; Vasileiou, Z.; Meditskos, G.; Vrochidis, S.; Kompatsiaris, I. Enhancing Health Risk Monitoring: An Explainable Human-Centric Approach Using Wearable Data and Sensor Integration. In Proceedings of the International Conference on Pattern Recognition, 2024; Springer; pp. 407–419. [Google Scholar]
- Troncoso, Á.; Ortega, J.A.; Seepold, R.; Madrid, N.M. Non-invasive devices for respiratory sound monitoring. Procedia Computer Science 2021, 192, 3040–3048. [Google Scholar] [CrossRef]
- Troncoso-García, A.R.; Martínez-Ballesteros, M.; Martínez-Álvarez, F.; Troncoso, A. Explainable machine learning for sleep apnea prediction. Procedia Computer Science 2022, 207, 2930–2939. [Google Scholar] [CrossRef]
- Vanhaeren, T.; Troncoso-García, A.; Maldonado, J.F.T.; Divina, F.; Martínez-García, P.M. Application of XAI to the prediction of CTCF binding sites. Results in Engineering 2025, 25, 103776. [Google Scholar] [CrossRef]
- Fiori, M.; Mor, D.; Civitarese, G.; Bettini, C. GNN-XAR: A Graph Neural Network for Explainable Activity Recognition in Smart Homes. arXiv arXiv:2502.17999. [CrossRef]
- Harris, C.R.; Rouse, E.J.; Prost, L.E.; Kilgas, M.A.; Nakamura-Pereira, M.; Macaluso, R.L.; Gregg, R.D. Ablation Analysis to Select Wearable Sensors for Classifying Standing, Walking, and Running. Sensors 2021, 21, 194. [Google Scholar]
- Ronao, C.A.; Cho, S.B. Human Activity Recognition with Smartphone Sensors using Deep Learning Neural Networks. Expert Systems with Applications 2016, 59, 235–244. [Google Scholar] [CrossRef]
- Jeyakumar, J.V.; Sarker, A.; Garcia, L.A.; Srivastava, M. X-CHAR: A Concept-based Explainable Complex Human Activity Recognition Model. Proceedings of the ACM on Interactive, Mobile, Wearable and Ubiquitous Technologies 2023, 7, 1–28. [Google Scholar] [CrossRef]
- Wang, H.; Zhao, J.; Li, J.; Tian, L.; Tu, P.; Cao, T.; An, Y.; Wang, K.; Li, S. Human Activity Recognition using Wearable Sensors by Heterogeneous Convolutional Neural Networks. Engineering Applications of Artificial Intelligence 2022, 112, 104867. [Google Scholar]
- El-Adawi, E.; Essa, E.; Handosa, M.; Fahmy, D.; Attallah, O. Wireless Body Area Sensor Networks based Human Activity Recognition using Deep Learning. Scientific Reports 2024, 14, 2702. [Google Scholar] [CrossRef]
- Kim, K.; Jeong, W.; Park, S.; Kim, H. Granular and Explainable Human Activity Recognition through Sound Segmentation and Deep Learning. Journal of Computational Design and Engineering 2025, 12, 252–268. [Google Scholar] [CrossRef]
- Arrotta, L.; Civitarese, G.; Bettini, C. Using Large Language Models to Compare Explainable Models for Smart Home Human Activity Recognition. In Proceedings of the Companion of the 2024 ACM International Joint Conference on Pervasive and Ubiquitous Computing. ACM, 2024; pp. 704–709. [Google Scholar]
- Bulling, A.; Blanke, U.; Schiele, B. A tutorial on human activity recognition using body-worn inertial sensors. ACM Computing Surveys (CSUR) 2014, 46, 1–33. [Google Scholar] [CrossRef]
- Ordóñez, F.J.; Roggen, D. Deep convolutional and lstm recurrent neural networks for multimodal wearable activity recognition. Sensors 2016, 16, 115. [Google Scholar] [CrossRef] [PubMed]
- Jeyakumar, J.V.; Sarker, A.; Garcia, L.A.; Srivastava, M. X-char: A concept-based explainable complex human activity recognition model. Proceedings of the ACM on interactive, mobile, wearable and ubiquitous technologies 2023, 7, 1–28. [Google Scholar] [CrossRef]
- Ellis, C.A.; Sendi, M.S.; Zhang, R.; Carbajal, D.A.; Wang, M.D.; Miller, R.L.; Calhoun, V.D. Novel methods for elucidating modality importance in multimodal electrophysiology classifiers. Frontiers in Neuroinformatics 2023, 17, 1123376. [Google Scholar] [CrossRef]
- Strumbelj, E.; Kononenko, I. An efficient explanation of individual classifications using game theory. The Journal of Machine Learning Research 2010, 11, 1–18. [Google Scholar]
Figure 1.
Overview of the proposed explainability pipeline. Raw MHEALTH signals are segmented and processed by a TD–LSTM classifier. Four complementary XAI modules are applied: (i) counterfactual ablation, (ii) per-class IG heatmaps and curves, (iii) global IG ranking, and (iv) Shapley Value Sampling. All attributions are aggregated at the sensor-group level to provide robust interpretability insights.
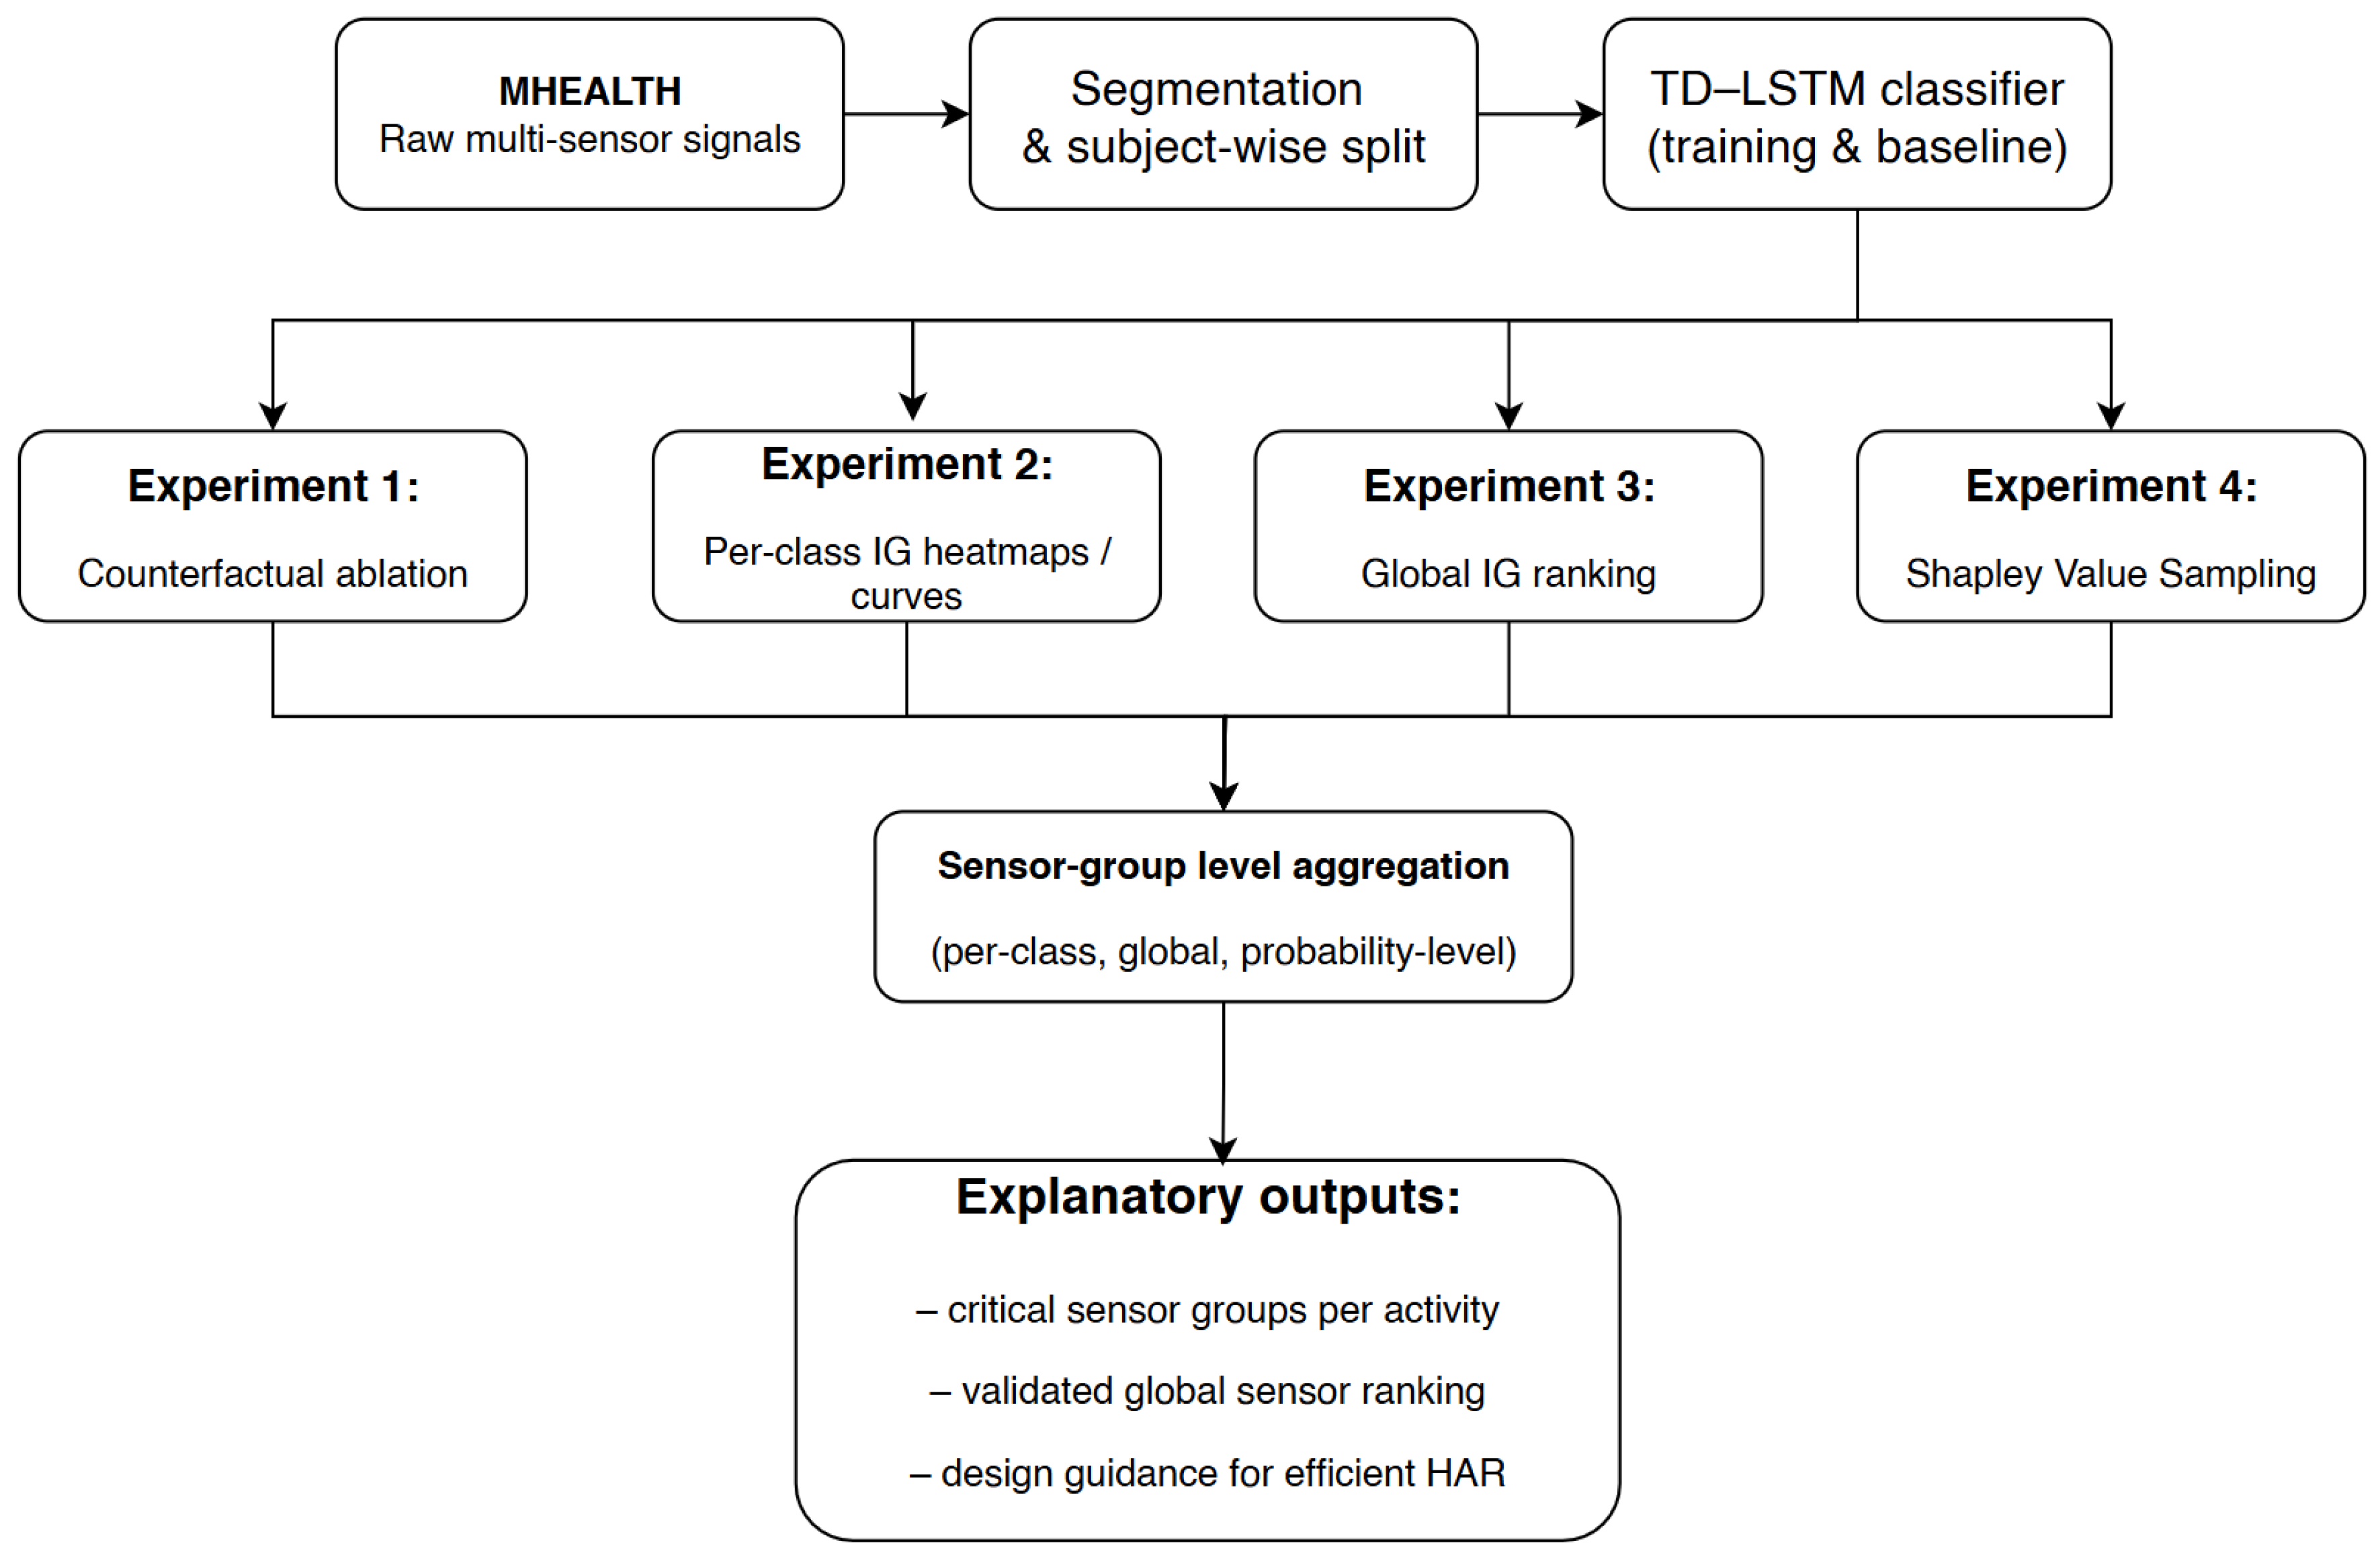
Figure 2.
Normalized confusion matrix of the baseline TD–LSTM model on the MHEALTH test set.
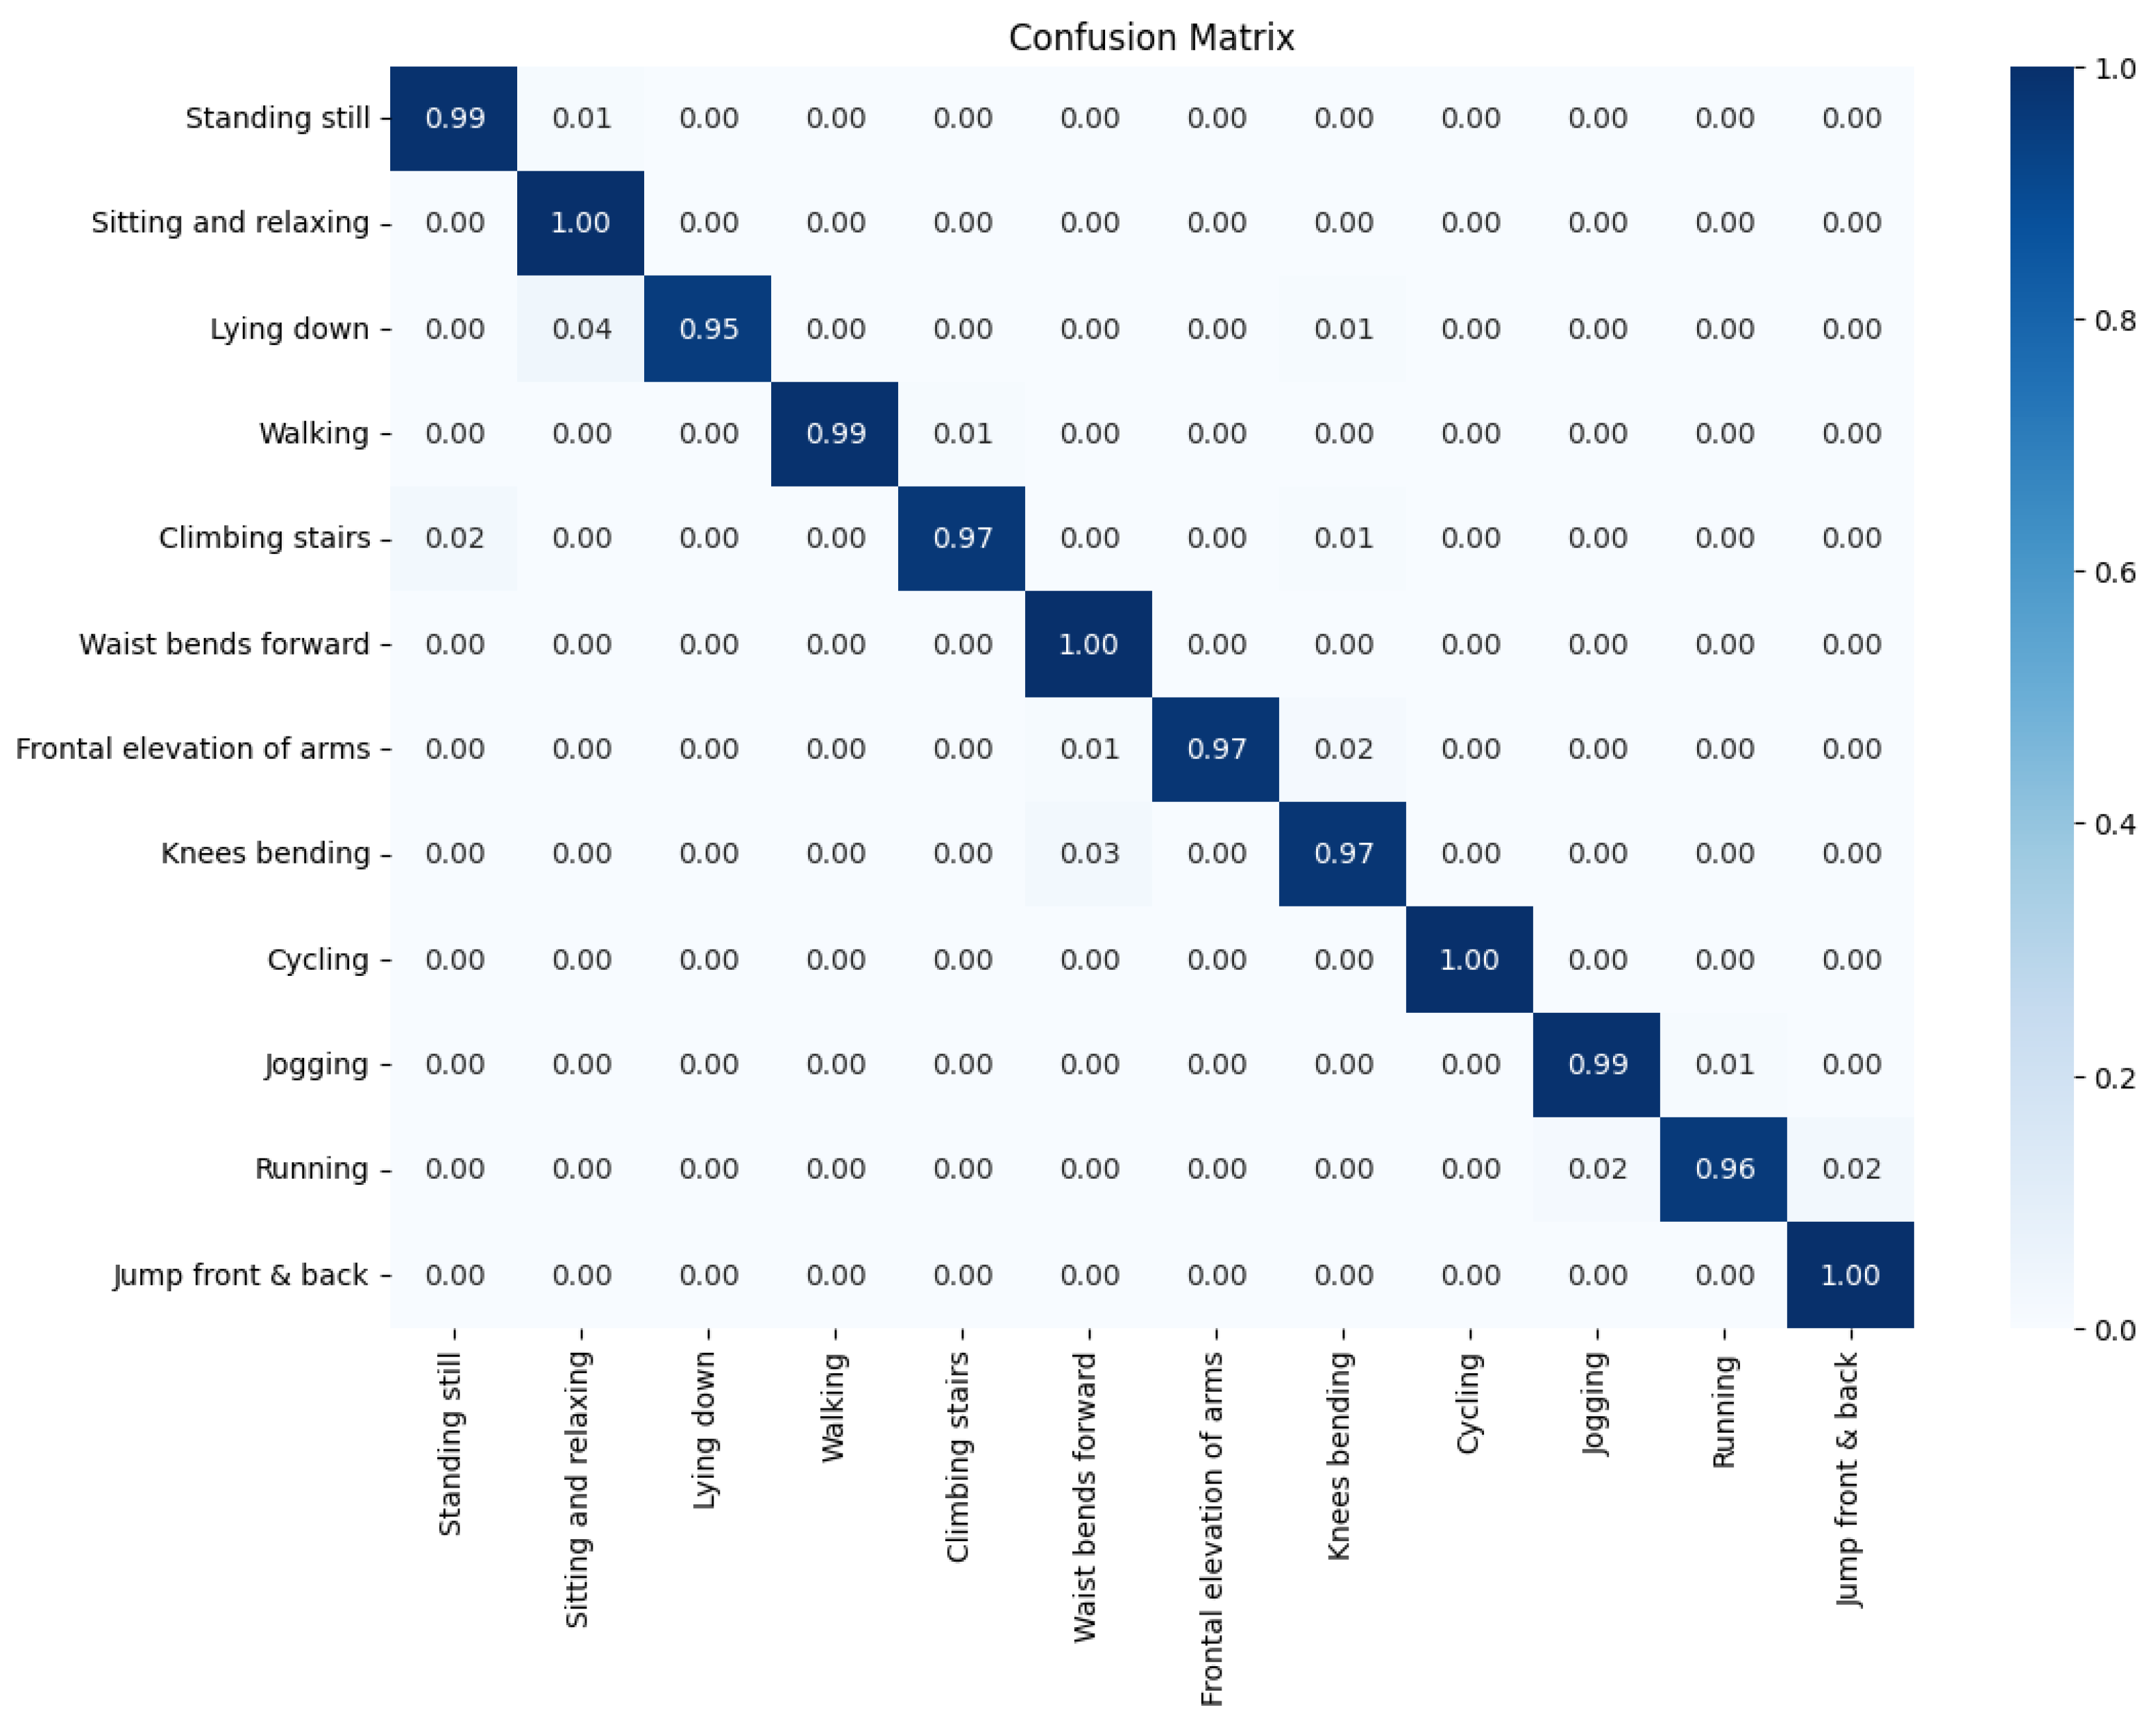
Figure 3.
Class-specific Integrated Gradients (IG) heatmaps for all 12 activities in the MHEALTH dataset. Each heatmap visualizes the mean absolute attribution across time (horizontal axis) and sensor features (vertical axis).
Figure 3.
Class-specific Integrated Gradients (IG) heatmaps for all 12 activities in the MHEALTH dataset. Each heatmap visualizes the mean absolute attribution across time (horizontal axis) and sensor features (vertical axis).
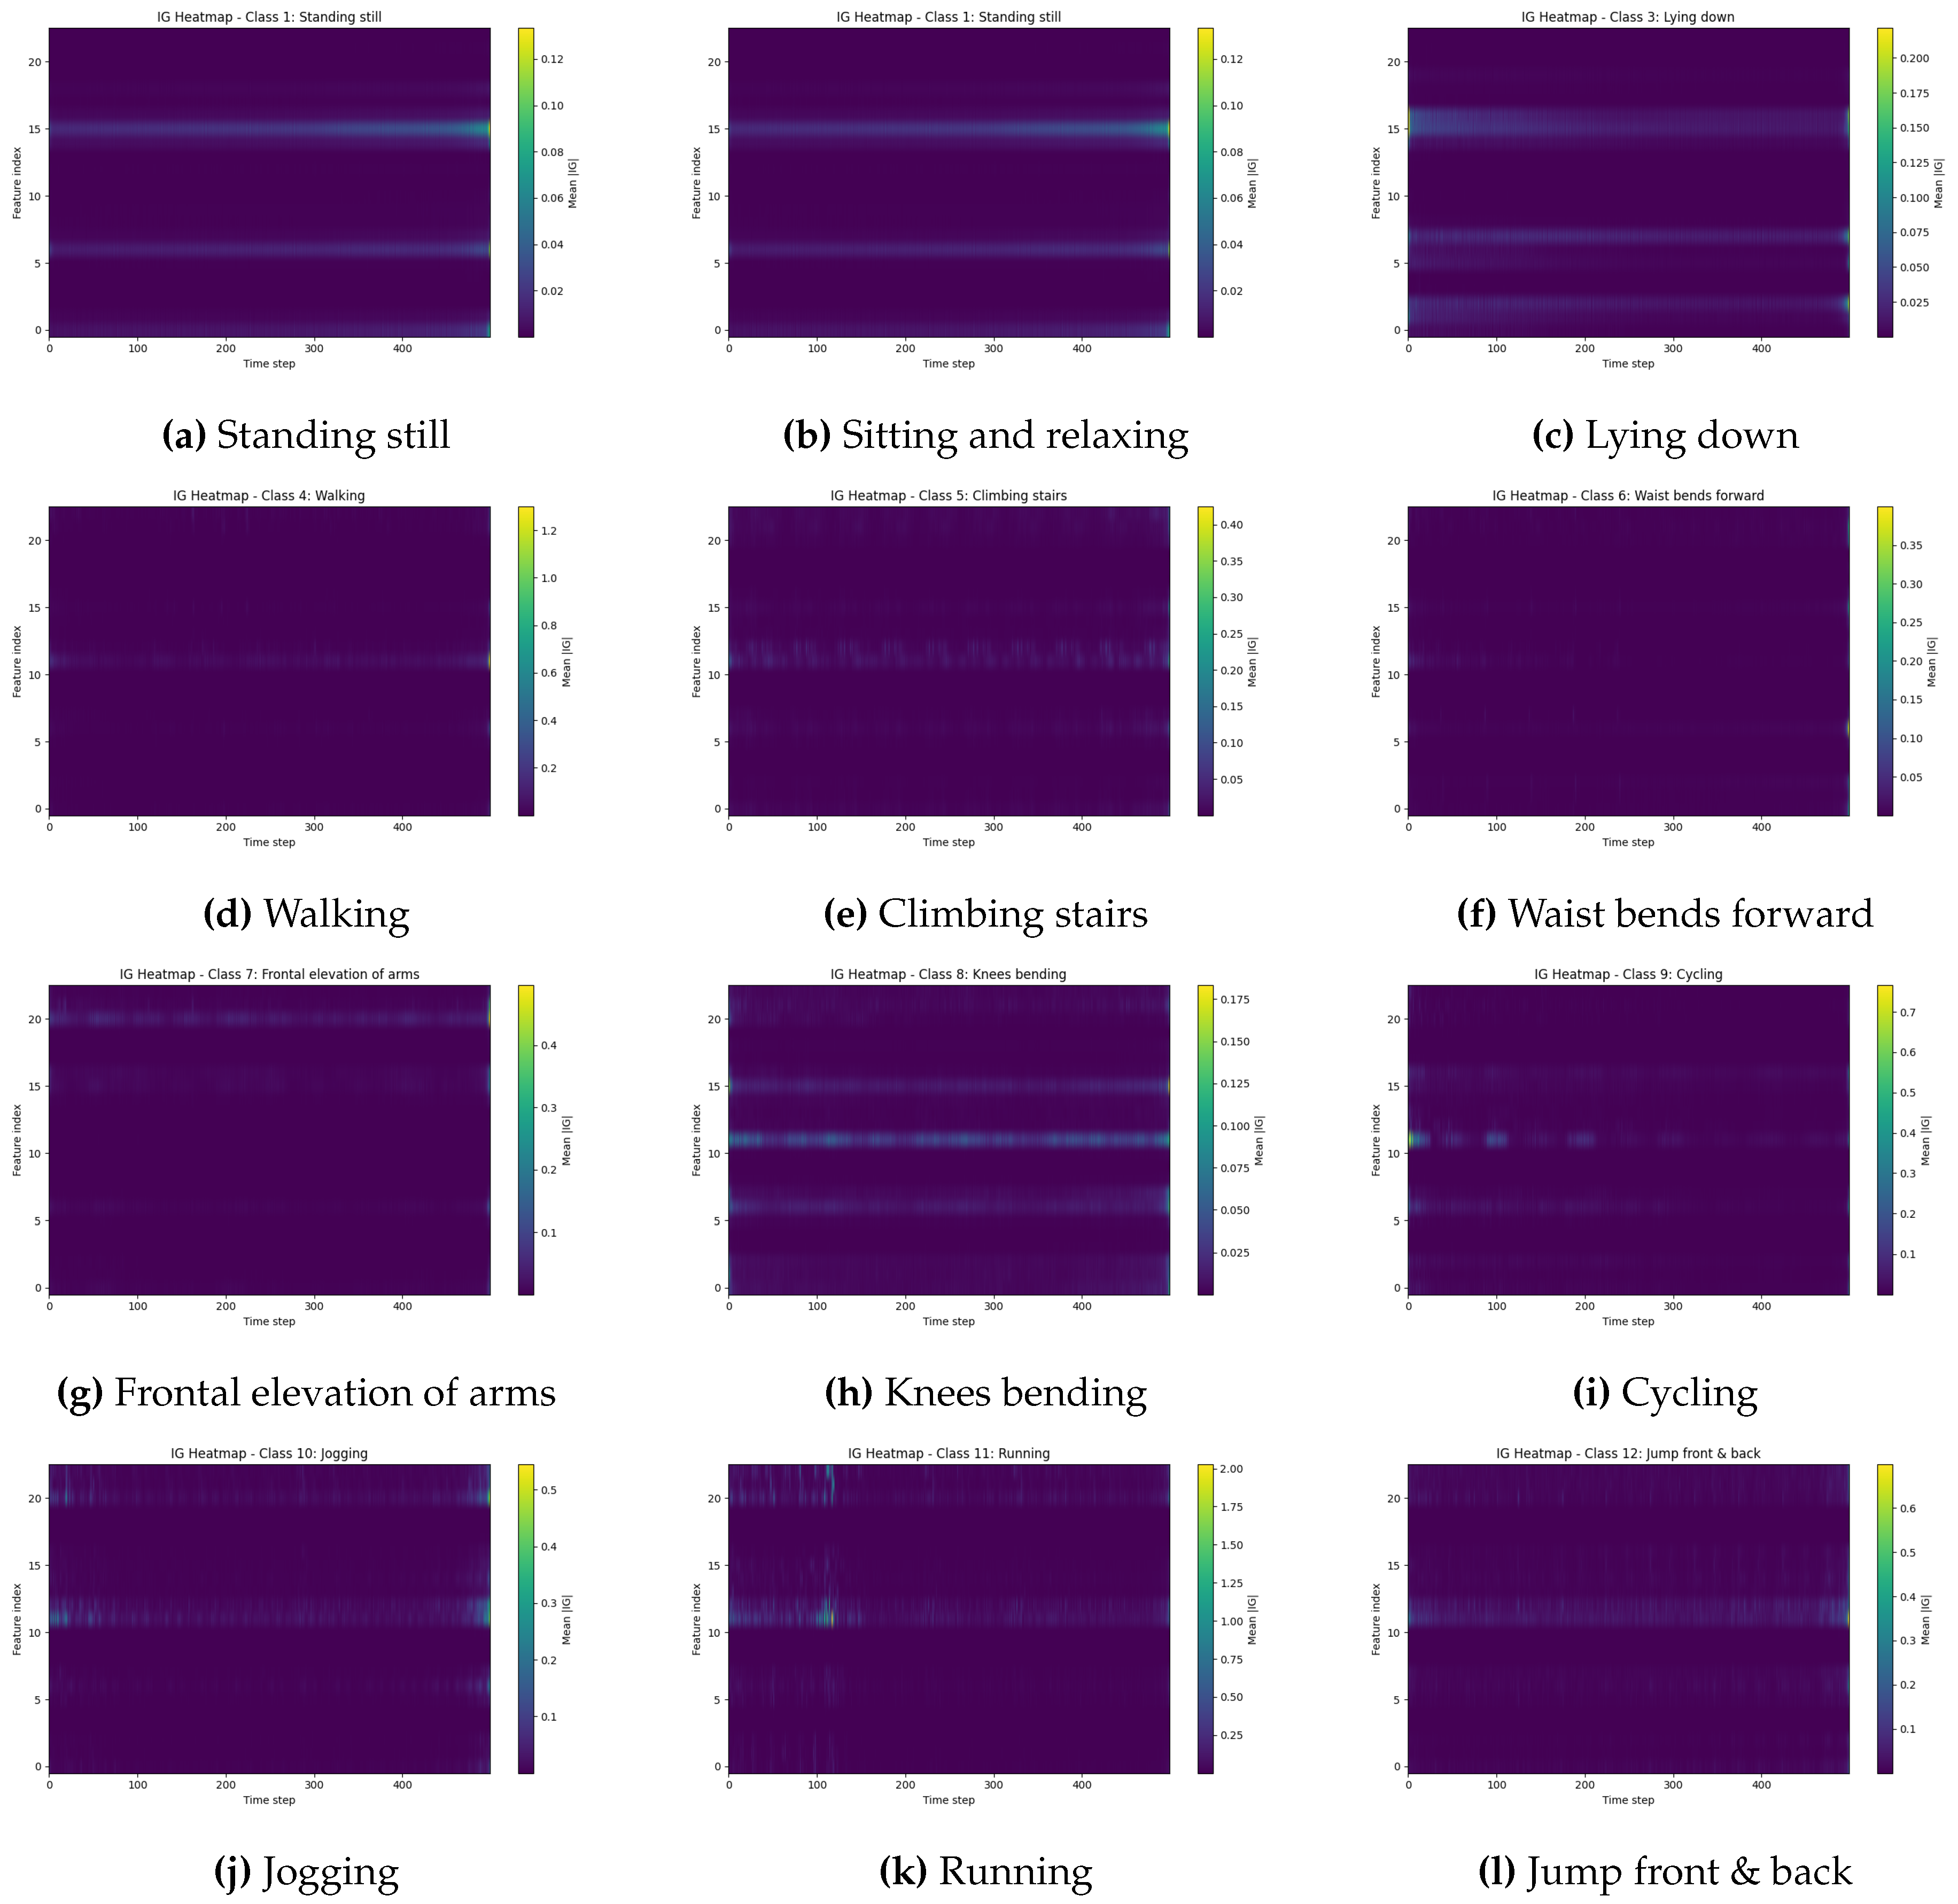
Figure 4.
Temporal Integrated Gradients attribution curves aggregated by sensor group for all twelve MHEALTH activities. Each panel shows the mean absolute IG attribution over time for the eight sensor groups.
Figure 4.
Temporal Integrated Gradients attribution curves aggregated by sensor group for all twelve MHEALTH activities. Each panel shows the mean absolute IG attribution over time for the eight sensor groups.
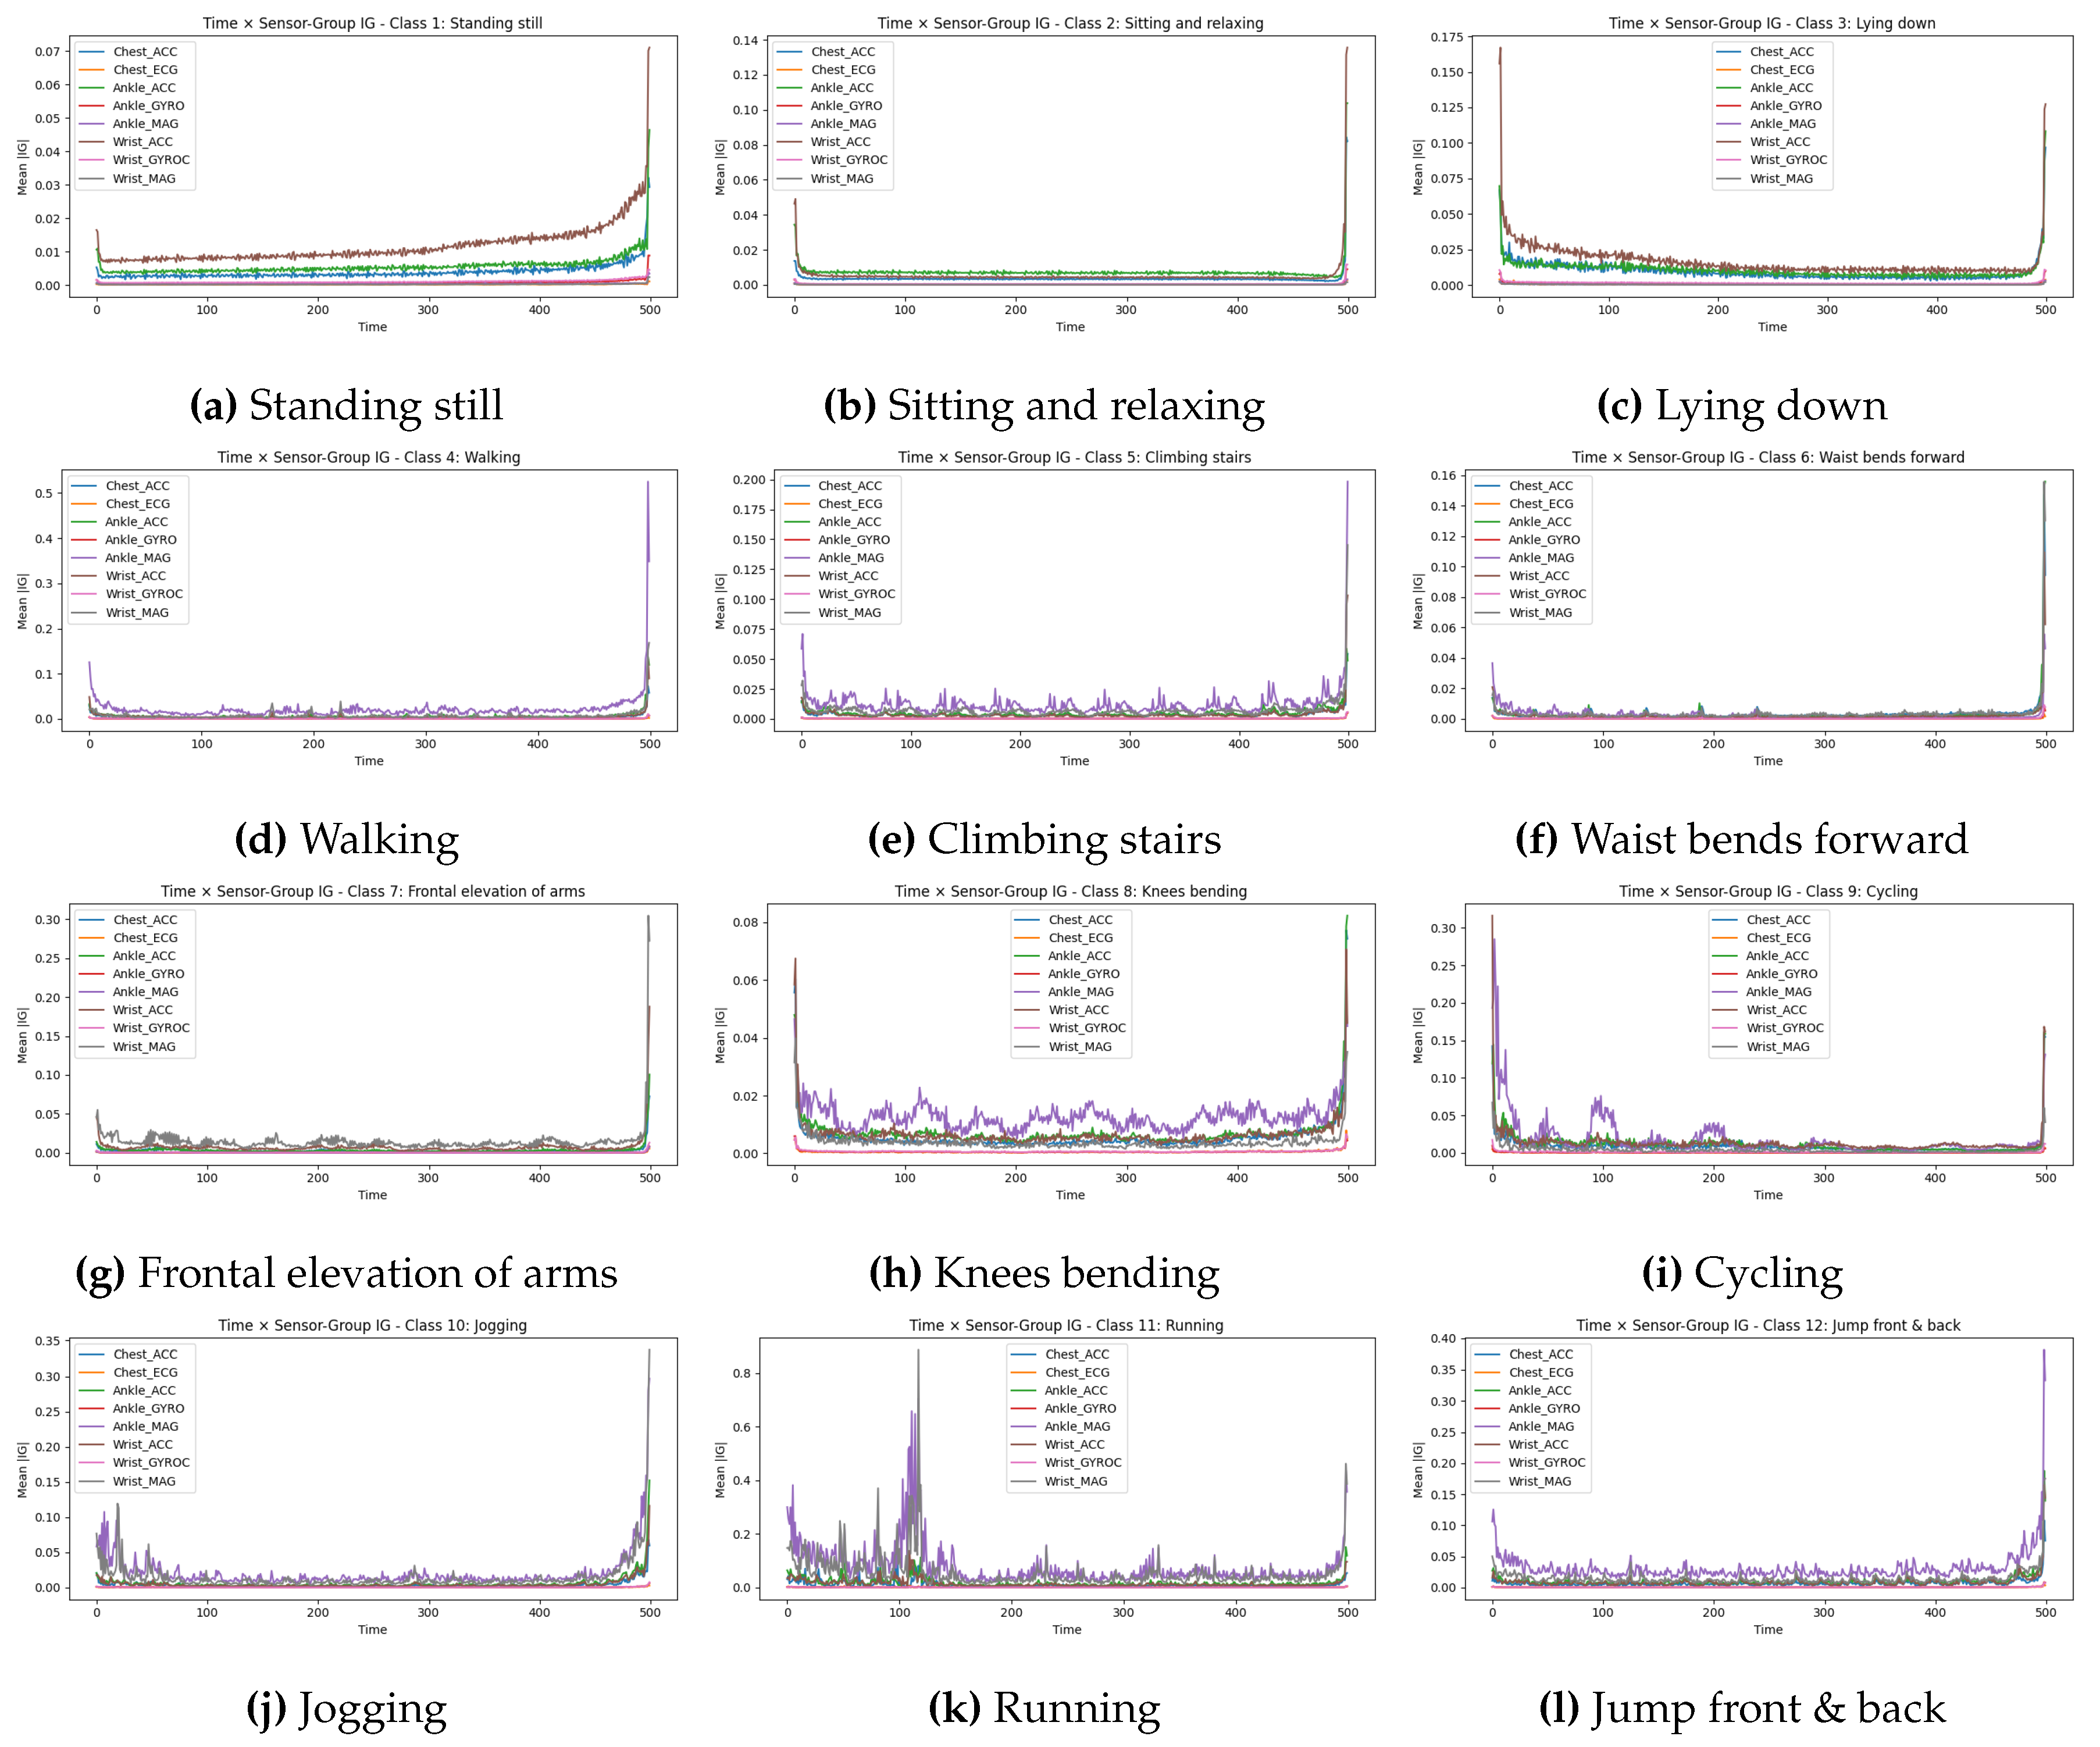
Figure 5.
Global sensor-group importance obtained with Shapley Value Sampling. Bars show mean absolute Shapley values aggregated over 32 test windows and 20 samples per feature. Wrist and ankle accelerometers dominate the ranking, while magnetometers and ECG contribute comparatively little on average.

Table 2.
Experimental setup and hyperparameters.
| Parameter | Value |
|---|---|
| Data Configuration | |
| Window size (T) | 500 samples (10 s) |
| Stride | 50 samples (1 s) |
| Overlap | 90% |
| Training subjects | 1–8 |
| Test subjects | 9, 10 |
| Input features (F) | 23 channels |
| Number of classes | 12 |
| Preprocessing | |
| Normalization | Z-score (per-channel) |
| Data augmentation | None |
| Model Architecture | |
| Time-distributed dense 1 | 128 units, ReLU, BatchNorm |
| Time-distributed dense 2 | 128 units, ReLU, BatchNorm |
| Temporal pooling | Max-pooling |
| LSTM hidden units | 256 |
| Output layer | Dense, softmax (12 classes) |
| Training Configuration | |
| Optimizer | Adam |
| Learning rate | |
| Batch size | 32 |
| Epochs | 100 |
| Early stopping patience | 15 epochs |
| Loss function | Cross-entropy |
| Weight decay | |
| Random seed | 42 |
| XAI Configuration | |
| IG integration steps | 50 |
| IG samples per class | 32 |
| Shapley permutations | 20 |
| Shapley test samples | 32 |
Table 3.
Sensor group definitions. Channel indices refer to the 23-dimensional input feature vector.
Table 3.
Sensor group definitions. Channel indices refer to the 23-dimensional input feature vector.
| Sensor Group | Description | Channel Indices |
|---|---|---|
| Chest_ACC | Chest accelerometer (3-axis) | 0, 1, 2 |
| Chest_ECG | Chest ECG (2-lead) | 3, 4 |
| Ankle_ACC | Ankle accelerometer (3-axis) | 5, 6, 7 |
| Ankle_GYRO | Ankle gyroscope (3-axis) | 8, 9, 10 |
| Ankle_MAG | Ankle magnetometer (3-axis) | 11, 12, 13 |
| Wrist_ACC | Wrist accelerometer (3-axis) | 14, 15, 16 |
| Wrist_GYRO | Wrist gyroscope (3-axis) | 17, 18, 19 |
| Wrist_MAG | Wrist magnetometer (3-axis) | 20, 21, 22 |
Table 4.
Baseline classification report of the TD–LSTM model on MHEALTH.
| Class | Precision | Recall | F1-score | Support |
|---|---|---|---|---|
| Standing still | 0.97 | 0.99 | 0.98 | 118 |
| Sitting and relaxing | 0.95 | 1.00 | 0.98 | 123 |
| Lying down | 1.00 | 0.95 | 0.97 | 123 |
| Walking | 1.00 | 0.99 | 1.00 | 123 |
| Climbing stairs | 0.99 | 0.97 | 0.98 | 123 |
| Waist bends forward | 0.96 | 1.00 | 0.98 | 107 |
| Frontal elevation of arms | 1.00 | 0.97 | 0.99 | 112 |
| Knees bending | 0.97 | 0.97 | 0.97 | 117 |
| Cycling | 1.00 | 1.00 | 1.00 | 123 |
| Jogging | 0.98 | 0.99 | 0.99 | 122 |
| Running | 0.99 | 0.96 | 0.98 | 124 |
| Jump front & back | 0.92 | 1.00 | 0.96 | 36 |
| Accuracy | 0.98 | 1351 | ||
| Macro avg | 0.98 | 0.98 | 0.98 | 1351 |
| Weighted avg | 0.98 | 0.98 | 0.98 | 1351 |
Table 5.
Global accuracy and macro-F1 under single sensor-group ablation on the MHEALTH test set. Baseline: accuracy , macro-F1 . . is the mean confidence drop across all classes.
Table 5.
Global accuracy and macro-F1 under single sensor-group ablation on the MHEALTH test set. Baseline: accuracy , macro-F1 . . is the mean confidence drop across all classes.
| Sensor group | Abl. Acc | Abl. F1 | ||
|---|---|---|---|---|
| Ankle_MAG | 0.511 | 0.471 | 0.42 | 0.50 |
| Wrist_ACC | 0.824 | 0.158 | 0.81 | 0.28 |
| Ankle_ACC | 0.830 | 0.152 | 0.82 | 0.25 |
| Wrist_MAG | 0.877 | 0.105 | 0.86 | 0.18 |
| Chest_ACC | 0.881 | 0.101 | 0.87 | 0.22 |
| Wrist_GYRO | 0.945 | 0.038 | 0.94 | 0.08 |
| Chest_ECG | 0.982 | 0.000 | 0.98 | 0.00 |
| Ankle_GYRO | 0.984 | 0.98 |
Table 6.
Global Integrated Gradients ranking across sensor groups. denotes the mean absolute IG attribution aggregated over samples, time, and features for each group; %Total is the relative contribution to the sum over groups.
Table 6.
Global Integrated Gradients ranking across sensor groups. denotes the mean absolute IG attribution aggregated over samples, time, and features for each group; %Total is the relative contribution to the sum over groups.
| Sensor group | % Total | |
|---|---|---|
| Wrist_ACC | 2.07 | 48.6 |
| Chest_ACC | 0.95 | 22.2 |
| Ankle_ACC | 0.78 | 18.2 |
| Ankle_GYRO | 0.18 | 4.3 |
| Wrist_GYROC | 0.15 | 3.6 |
| Ankle_MAG | 0.06 | 1.4 |
| Wrist_MAG | 0.05 | 1.1 |
| Chest_ECG | 0.03 | 0.6 |
Disclaimer/Publisher’s Note: The statements, opinions and data contained in all publications are solely those of the individual author(s) and contributor(s) and not of MDPI and/or the editor(s). MDPI and/or the editor(s) disclaim responsibility for any injury to people or property resulting from any ideas, methods, instructions or products referred to in the content. |
© 2025 by the authors. Licensee MDPI, Basel, Switzerland. This article is an open access article distributed under the terms and conditions of the Creative Commons Attribution (CC BY) license (http://creativecommons.org/licenses/by/4.0/).
Copyright: This open access article is published under a Creative Commons CC BY 4.0 license, which permit the free download, distribution, and reuse, provided that the author and preprint are cited in any reuse.


